Using Water Stable Isotopes for Identifying Groundwater Recharge Sources of the Unconfined Alluvial Zagreb Aquifer (Croatia)


1
Faculty of Mining, Geology and Petroleum Engineering, University of Zagreb, 10 000 Zagreb, Croatia
2
Ruđer Bošković Institute, 10 000 Zagreb, Croatia
*
Author to whom correspondence should be addressed.
Water 2019, 11(10), 2177; https://doi.org/10.3390/w11102177
Submission received: 11 September 2019
/
Revised: 16 October 2019
/
Accepted: 17 October 2019
/
Published: 19 October 2019
(This article belongs to the Special Issue Groundwater-Surface Water Interactions)
Abstract
:The main purpose of this study was to understand the interactions between precipitation, surface water, and groundwater in the Zagreb aquifer system using water stable isotopes. The Zagreb aquifer is of the unconfined type and strongly hydraulically connected to the Sava River. As the groundwater is the main source of drinking water for one million inhabitants, it is essential to investigate each detail of the recharge processes of the aquifer to ensure adequate protection of the groundwater. Measuring the content of water stable isotopes in surface waters and groundwater enabled the creation of two- and three-component mixing models based on the isotopic mass balance for the purpose of the quantification of each recharge component. The mixing models gave ambiguous results. Observation wells equally distant from the Sava River did not have the same recharge component ratio. This indicated that there were more factors (in addition to the distance from the river) that were affecting groundwater recharge, and the properties of the unsaturated zone and surface cover data were therefore also taken into consideration. The thickness of the unsaturated zone and the characteristics of different soil types were identified as important factors in the recharge of the Zagreb aquifer. The areas with high thickness of the unsaturated zone and well-permeable soil had a very similar recharge component ratio to the areas with small thickness of the unsaturated zone but low-permeable soil.
1. Introduction
Groundwater presents one of the most important water resources in the world. Water demand is continuously growing worldwide, and it is especially pronounced in arid regions [1]. Global groundwater extraction has reached about 1500 km3 per year [2], which is higher than natural groundwater recharge [3]. Furthermore, a lot of alluvial aquifers have problems with groundwater depletion, which has become a global issue [4,5]. Recently, the problem has become more frequent in moderate climate areas, especially in the unconfined alluvial aquifers dependent on surface waters as a result of climate changes [6,7,8]. All these problems point to the necessity of detailed research of groundwater recharge mechanisms, which will enable sustainable management of groundwater resources, i.e., ensure sufficient quantities of potable water.
Groundwater–surface water interaction is generally investigated at the river scale and classified as connected or disconnected systems [9]. In connected systems, groundwater can discharge through the streambed to contribute to streamflow, and surface water can lose water, i.e., recharge the aquifer. Disconnected systems depend on the unsaturated zone beneath the surface water and can be completely disconnected (changes in the water table do not affect the infiltration rate from the river) and in a “transitional” state (changes in the water table possibly affect infiltration rate). However, a lot of alluvial aquifers that are connected with rivers have very dynamic relationships, where hydrologic conditions can generate very fast changes in groundwater flow direction and velocities. From that perspective, the isotopic composition of the different compounds can help to identify and quantify hydrological relationships. If hydrological conditions want to be evaluated on a local scale, where changes in the water isotopic composition can be very small, relevant hydrological relationships can sometimes be very difficult to define. In such aquifers, the characteristics of the unsaturated zone and soil type can have a significant impact on the isotope composition.
The Zagreb aquifer is a very important source of potable water for the Republic of Croatia, and it is designated as a part of the country’s strategic water reserves. Although different isotopic research has been conducted, related to both groundwater quality and quantity [10,11,12,13], a distinct quantification of recharge of the Zagreb aquifer for both precipitation and infiltration from the Sava River has not been done before.
The main goal of this research was to evaluate groundwater–surface water interaction in the area of the Zagreb aquifer and to quantify the role of precipitation and the Sava River on the recharge of the aquifer. For this purpose, water stable isotopes (δ18O and δ2H) from surface water, groundwater, and precipitation were used. Stable isotopes of hydrogen (1H and 2H) and oxygen (16O and 18O) are conservative and can be used as tracers in different types of hydrological research [14,15,16,17,18,19,20]. Two- and three-component mixing models were used to quantify different recharge sources together with soil characteristics and hydrogeological properties of the saturated and unsaturated zones.
2. Study Area
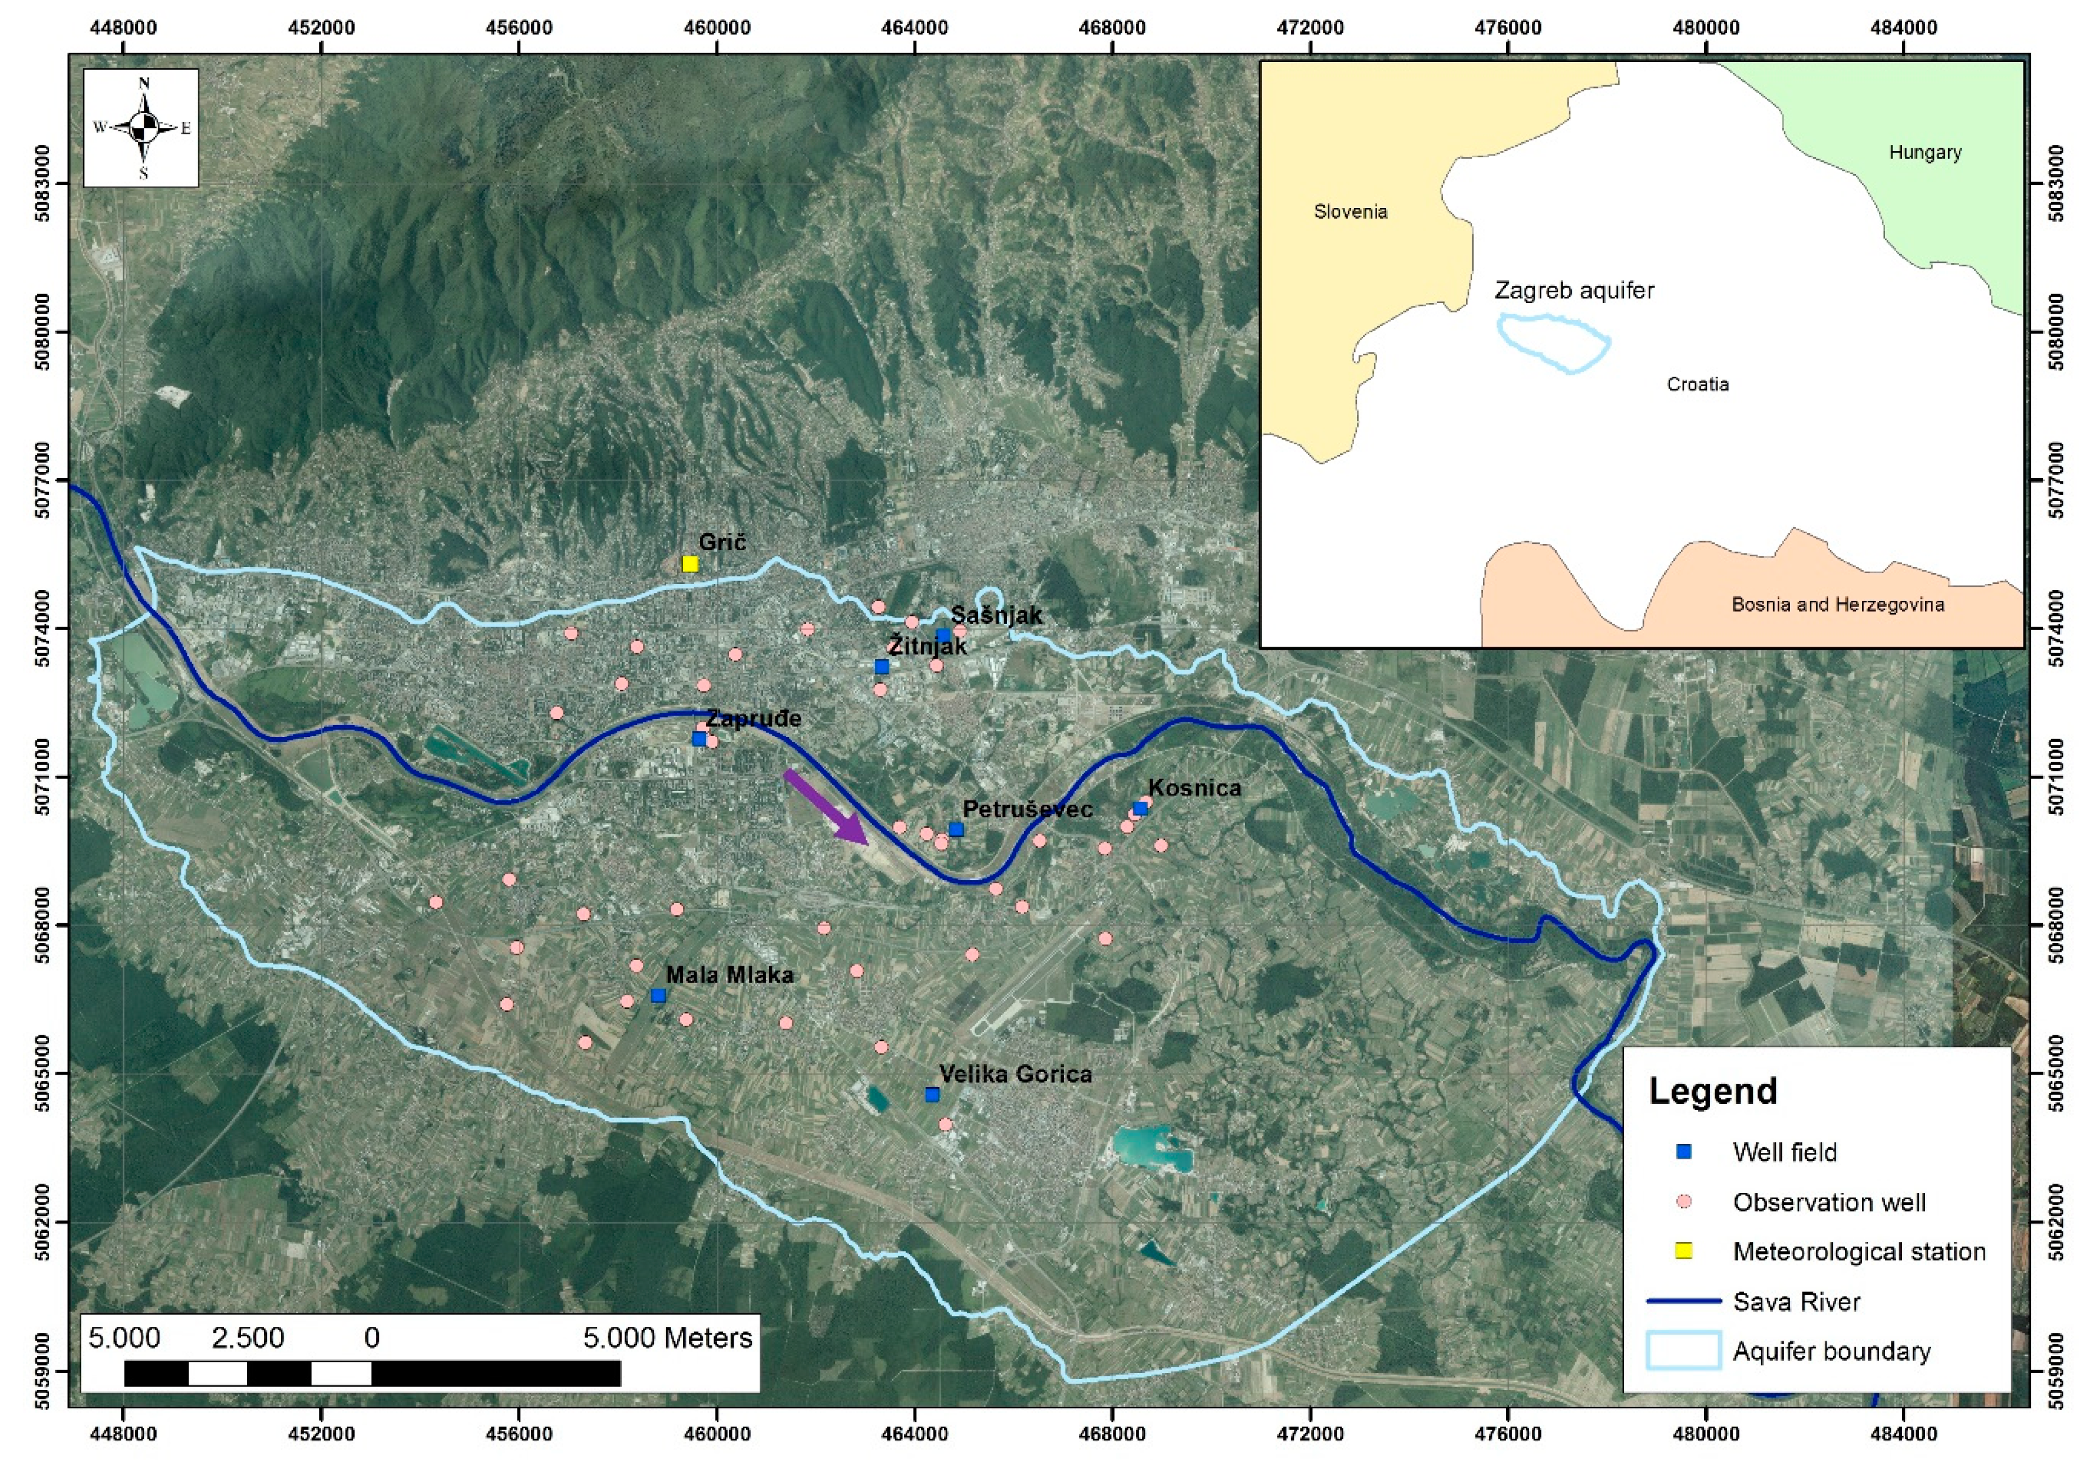
The Zagreb aquifer covers approximately 300 km2 and is located in the northwestern part of the Republic of Croatia (Figure 1). It presents the only source of potable water for approximately one million inhabitants of the City of Zagreb and part of the Zagreb County. The municipal water supply relies on the groundwater from the aquifer, which is abstracted at six currently operating well fields. During longer dry periods, smaller well fields located within the urban part of the City of Zagreb, which are usually not used by the water supply system, are put into operation. Total annual abstraction at Zagreb well fields in some years exceeds the annual groundwater recharge [21].
The Zagreb aquifer is an unconfined aquifer, which consists of two aquifer layers that are hydraulically connected. It consists of Quaternary sediments, which were deposited during the Middle and Upper Pleistocene and the Holocene. Holocene deposits belong to alluvial deposits, while Pleistocene deposits are lacustrine–marshy [22,23,24]. The main stratigraphic units have been identified according to microfloral and microfaunal analysis [25,26]. The boundary between Pleistocene and Holocene deposits has also been determined according to changes in the petrographic origin of the clasts in gravels and sands and changes in the sedimentary environment. It has been reported that, in the beginning of the Holocene, the Sava River started to flow and transport material from the Alps, which was dominantly carbonate, unlike Pleistocene deposits, which are mostly siliciclastic [22]. In general, Lower Pleistocene deposits are mainly composed of silty clays and clayey silts, with sporadic interbeds and lenses of gravelly sands. Lower and middle part of Middle Pleistocene deposits are made of sands, while clays and silts appear in the upper part. In Late Pleistocene deposits, frequent lateral changes in sands, gravels, silts, and clays can be found. Holocene deposits are mostly composed of sands and gravels [23].
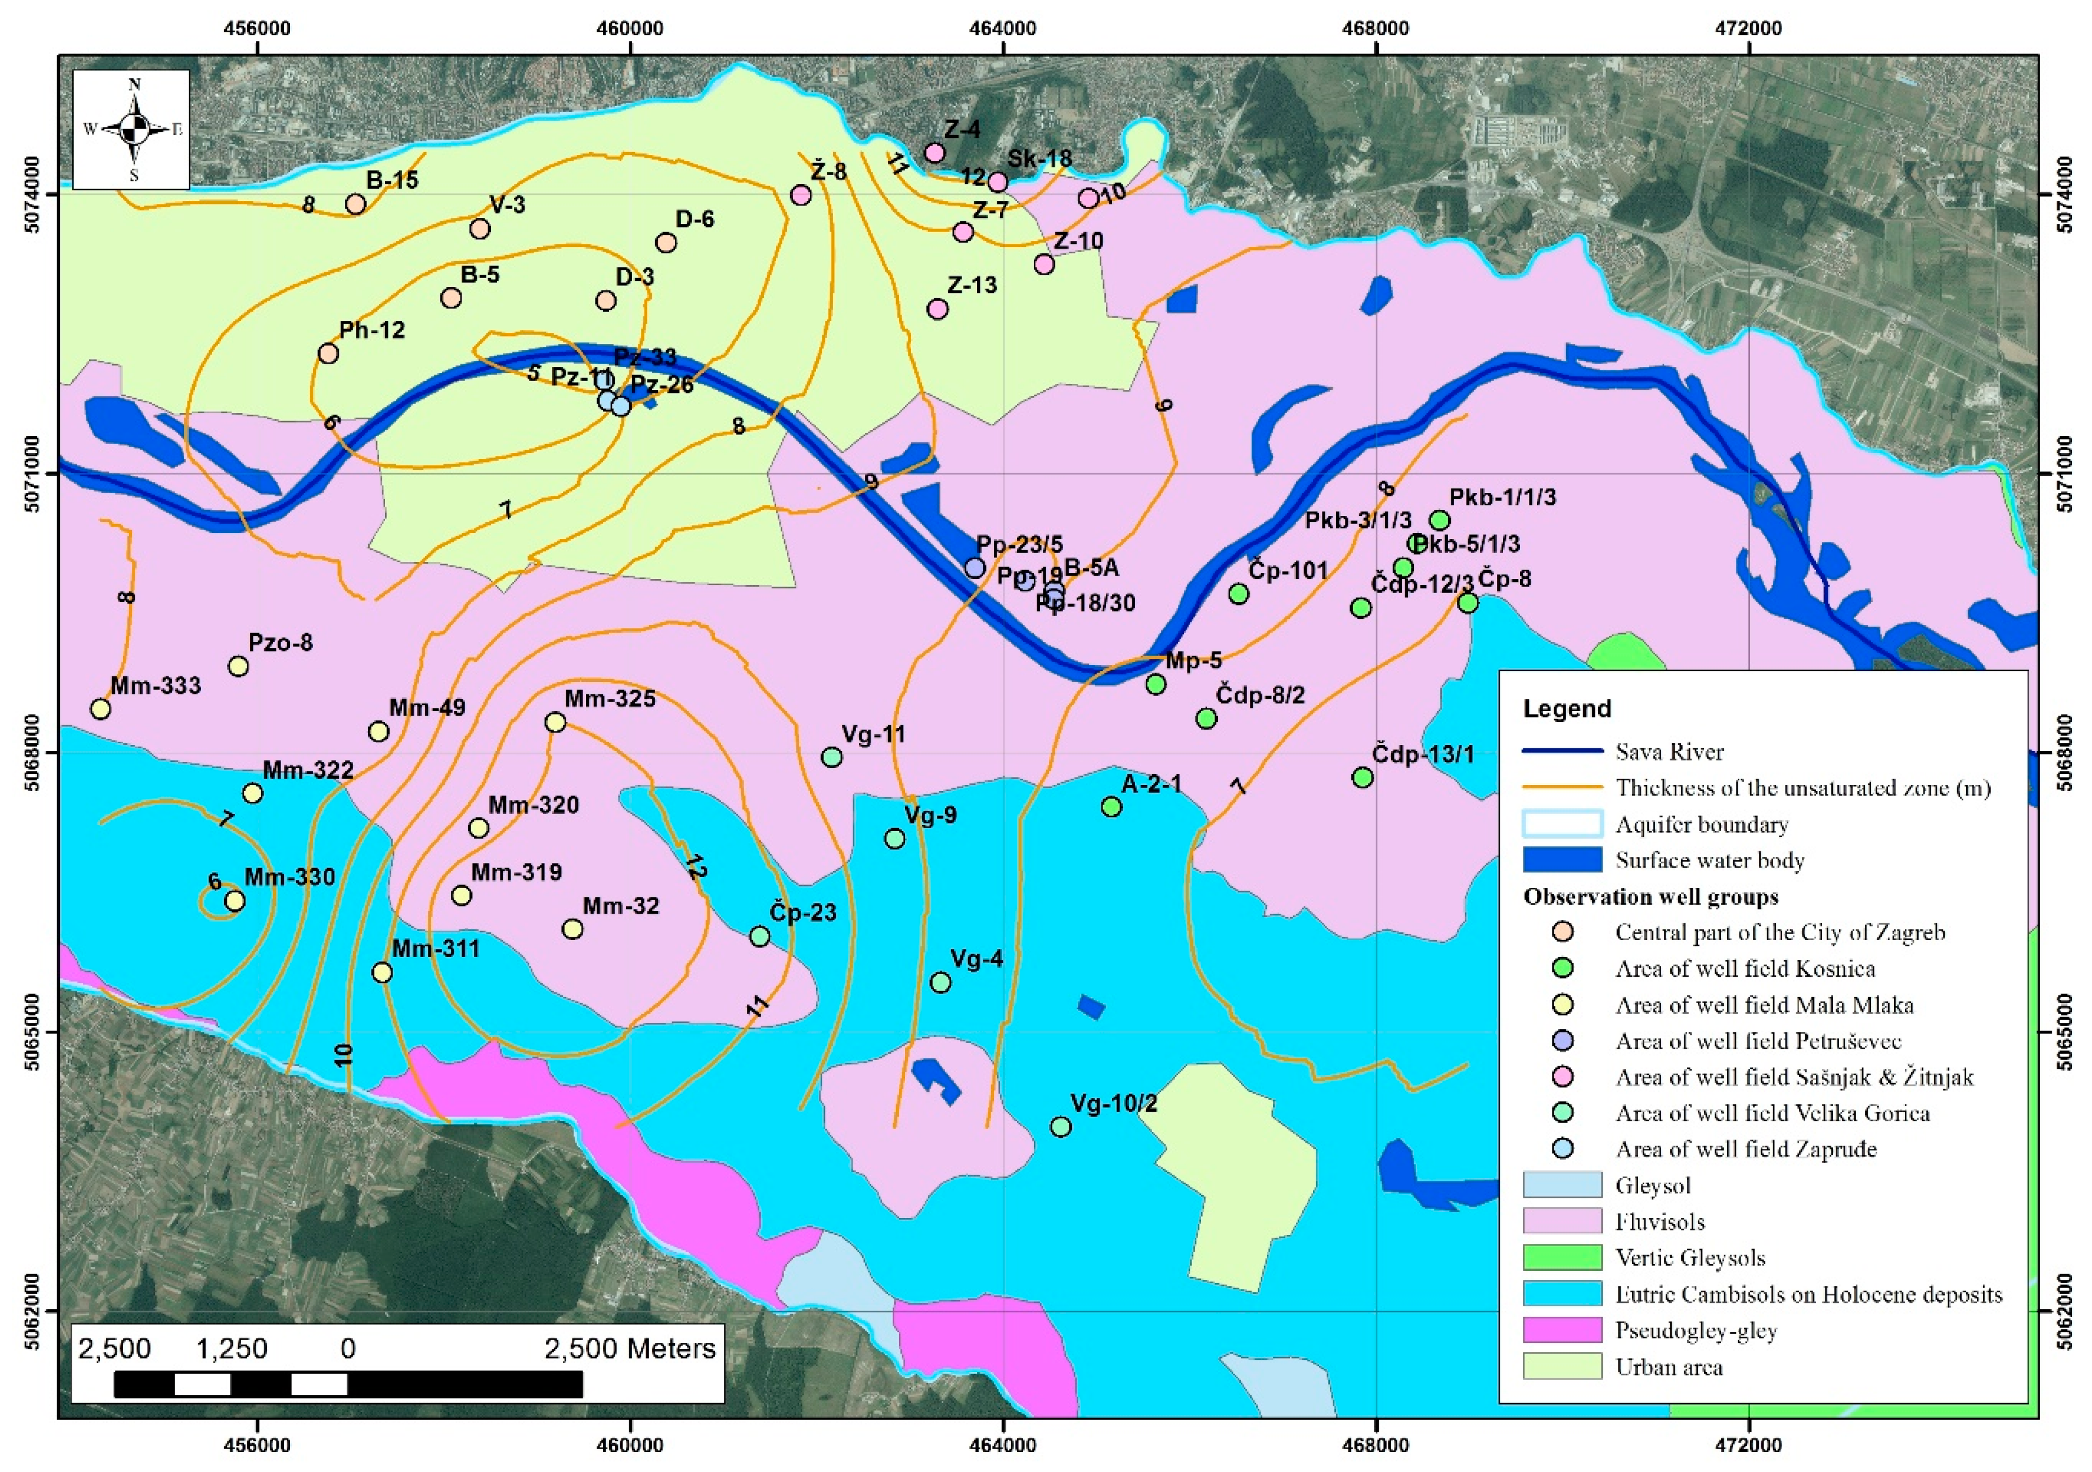
Hydrogeologically, these deposits can be grouped into three units: unsaturated zone, shallow alluvial aquifer layer, and deeper lacustrine–marshy aquifer layer. The thickness of the unsaturated zone varies spatially and in time due to the hydrological conditions. It varies from 5 to 13 m during dry periods and low groundwater levels (Figure 2). In the area of the Zagreb aquifer, especially in the area where monitoring of groundwater quality is established (mostly according to the inflow areas of well fields), two main types of soils have developed: Fluvisols and Eutric Cambisols on Holocene deposits. Apart from these types of soils, Pseudogley on plateau, Pseudogley–gley, Gleyic Fluvisols, Gleysol, Pseudogley, and Vertic Gleysols can also be found in small areas [27,28]. Hydraulic properties of the Fluvisols are generally permeable, with the exception of dry periods [29]. On the other hand, the Eutric Cambisols developed on Holocene deposits seem to be of low permeability, where percolation to the aquifer is very low [30]. Hydraulic conductivity values of the unsaturated zone vary between 1.26 m/day and 1015 m/day [11]. It must be emphasized that, in some parts of the Zagreb aquifer, the unsaturated zone is damaged by human influence (setting foundations for buildings, for example), especially on the left bank of the Sava River, where urban areas prevail.
The shallow aquifer layer is in direct contact with the Sava River, with general groundwater flow direction from W/NW to E/SE. The Sava River presents the main source of recharge, and its influence on changes in groundwater levels is more pronounced in the vicinity of the river itself [31]. It has been shown that the Sava River drains the aquifer in some areas during low and medium water levels, while surface water infiltrates into the aquifer during high water levels. Furthermore, it has been found that a no-flow boundary prevails in the north of the Zagreb aquifer. Inflow boundaries were determined in the south and west and outflow boundary in the east. Those boundaries were determined based on the exploration of equipotential maps in different hydrological conditions, i.e., high, medium, and low water levels [32]. The thickness of the shallow aquifer varies from 5 to 40 m [33], while hydraulic conductivities can go up to 3000 m/day [11].
The deeper aquifer layer is characterized by frequent vertical and lateral alterations of gravel, sand, and clays [11], while its thickness goes up to 60 m in the eastern part [33]. Although shallow and deeper aquifer layers are hydraulically connected, geochemical stratification along the depth has been recognized. It has been shown that CaMg–HCO3 hydrogeochemical facies prevail in the shallow aquifer, while higher concentrations of sodium can be found in the deeper aquifer, which results from longer retention in the underground, resulting in CaMgNa–HCO3 hydrogeochemical facies [12,34].
Problems with groundwater quantity and quality have been observed. Groundwater levels are declining 1–2 m per decade, while permanent groundwater reserves have decreased by about 4% in the period from 1976 to 2006 throughout the aquifer [21]. It has been shown that the main reasons for groundwater decrease are related to deepening of the Sava riverbed, excessive pumping, and upstream construction of dykes along the Sava River [32]. Human influence on the recharge component of the Zagreb aquifer is evident. Probably the most important one is related to the extensive riverbed erosion as a consequence of the upstream Sava River regulation and gravel extraction from the river. Furthermore, due to occasional flooding, embankments were built along the Sava River, which stopped the potential infiltration to groundwater in some areas. Climate change also probably resulted in prolonged periods of drought. However, the extent of the impact of climate change on groundwater resources is not known and should be investigated in detail in future research in this area. Regarding quality, five main groups of contaminants have been identified, mostly related to agricultural activity, industrial development, leakage from sewage system, and septic tanks. They are nitrates, pesticides, potentially toxic metals, chlorinated aliphatics, and pharmaceuticals [11]. Most of the recent research has been related to nitrate origin and trends. Although elevated concentrations have been observed, results have shown that nitrate trends are decreasing in most parts of the aquifer, while nitrate origin is mainly organic [13,35,36,37].
3. Data and Methods
Water stable isotopes from groundwater (δ18O and δ2H) were measured in the area of well field Zapruđe and Petruševec [10,11]; in the area of future well field Kosnica within the International Atomic Energy Agency (IAEA)’s technical cooperation (TC) project CRO7001 [38]; in the inflow areas of well field Sašnjak–Žitnjak, Mala Mlaka, and Velika Gorica; and in the urban part of the City of Zagreb [13] (Figure 1). Water stable isotopes from the Sava River were measured in the area of well field Petruševec [39] and in the area of well field Kosnica within IAEA TC project CRO7001 [38]. Stable isotope data of water from precipitation were used from Global Network of Isotopes in Precipitation (GNIP) [40,41] for meteorological station Grič, located in the urban part of the City of Zagreb. All δ18O and δ2H values are expressed in ‰ notation relative to VSMOW (Vienna Standard Mean Ocean Water), while deuterium excess (d-excess) has been defined according to Dansgaard [42] with a global mean slope of 8.
The mixing of groundwater and surface water is not uniform in all parts of the aquifer; it is spatially and temporary variable depending on the strength of the impact of each individual recharge source in different hydrological conditions. Their quantitative relationship can be derived from two- or three-end member mass balance equations [16,19,38,43,44,45,46], where the sum of end member contributions are usually expressed as fractions (f) equal to 1. The two-component model is based on the assumption of the presence of only two recharge sources: precipitation and the Sava River. Quantification of the Sava River and precipitation to the Zagreb aquifer recharge was estimated based on the two mass balance equations written as follows:
where fsw and fp are the Sava River and precipitation fractions, respectively; δ18Os is the isotopic composition of oxygen in the observation well; and δ18Osw and δ18Op are the isotopic compositions of oxygen in the surface water and precipitation, respectively.
fsw + fp = 1
fsw × δ18Osw + fp × δ18Op = δ18Os
The three-component mixing model was used for testing and quantifying the change in the isotopic composition of the groundwater that takes place within the aquifer but not as a consequence of infiltration of the precipitation or the Sava River. It is often the case that a third end member contributes to mixing. Here, the third mixing component is groundwater itself (horizontal inflow of groundwater from neighboring parts of the aquifer in relation to the observation well), and the three mass balance equations are written as follows:
where fsw, fp, and fgw are the Sava River, precipitation, and groundwater fractions, respectively; δ18Os is the isotopic composition of oxygen in the observation well; and δ18Osw, δ18Op, and δ18Ogw are the isotopic compositions of oxygen in the surface water, precipitation, and groundwater, respectively.
fsw + fp + fgw = 1
fsw × δ18Osw + fp × δ18Op + fgw × δ18Ogw = δ18Os
fsw × δ18O2sw + fp × δ18O2p + fgw × δ18O2gw = δ18O2s
The average values of δ18O, δ2H, number of analysis (n), and calculated d-excess from the observation wells included in the analysis, together with their affiliation to location area, soil type, and defined groundwater levels in low and high waters, are shown in Table 1. In sum, there are 45 observation wells, which are mostly spatially located in the inflow areas of different well fields (well field Kosnica, Mala Mlaka, Petruševec, Sašnjak and Žitnjak, and Zapruđe), while the rest are located in the central part of the City of Zagreb (CPCZ) (Figure 2). Furthermore, there are 28 observation wells on the right bank of the Sava River, while there are 17 observation wells on the left bank. The groundwater from the observation wells were sampled at different time periods, 4–12 times during 2010, 2011, 2015, and 2016 (sampling was done in accordance with the national monitoring plan). The average values of δ2H in the observation wells varied from −64.32‰ to −60.40‰, while average values of δ18O varied from −9.46‰ to −8.92‰. The d-excess varied from 9.32‰ to 13.12‰. Isotopic composition of the Sava River resulted in δ2H values from −69.88‰ to −55.61‰, with the average value of −62.84‰, while δ18O values varied from −10.33‰ to −8.54‰, with the average value of −9.47‰. Long-term average for δ18O and δ2H for the meteorological station Zagreb–Grič, based on the data from GNIP, was −8.28‰ and −60.0‰, respectively. In order to provide more detailed interpretation, groundwater stable isotope data was spatially grouped at the level of inflow areas related to different well fields but also based on the areas that belong to different types of soil. In the two- and three-component mixing models, long-term average of δ18O for precipitation (−8.28‰; n = 89) from Zagreb–Grič meteorological station was used, while the average value of δ18O from all available analysis was used for the Sava River (−9.47‰; n = 56). In the three-component mixing models, the average value of δ18O from all observation wells was used (−9.16‰).
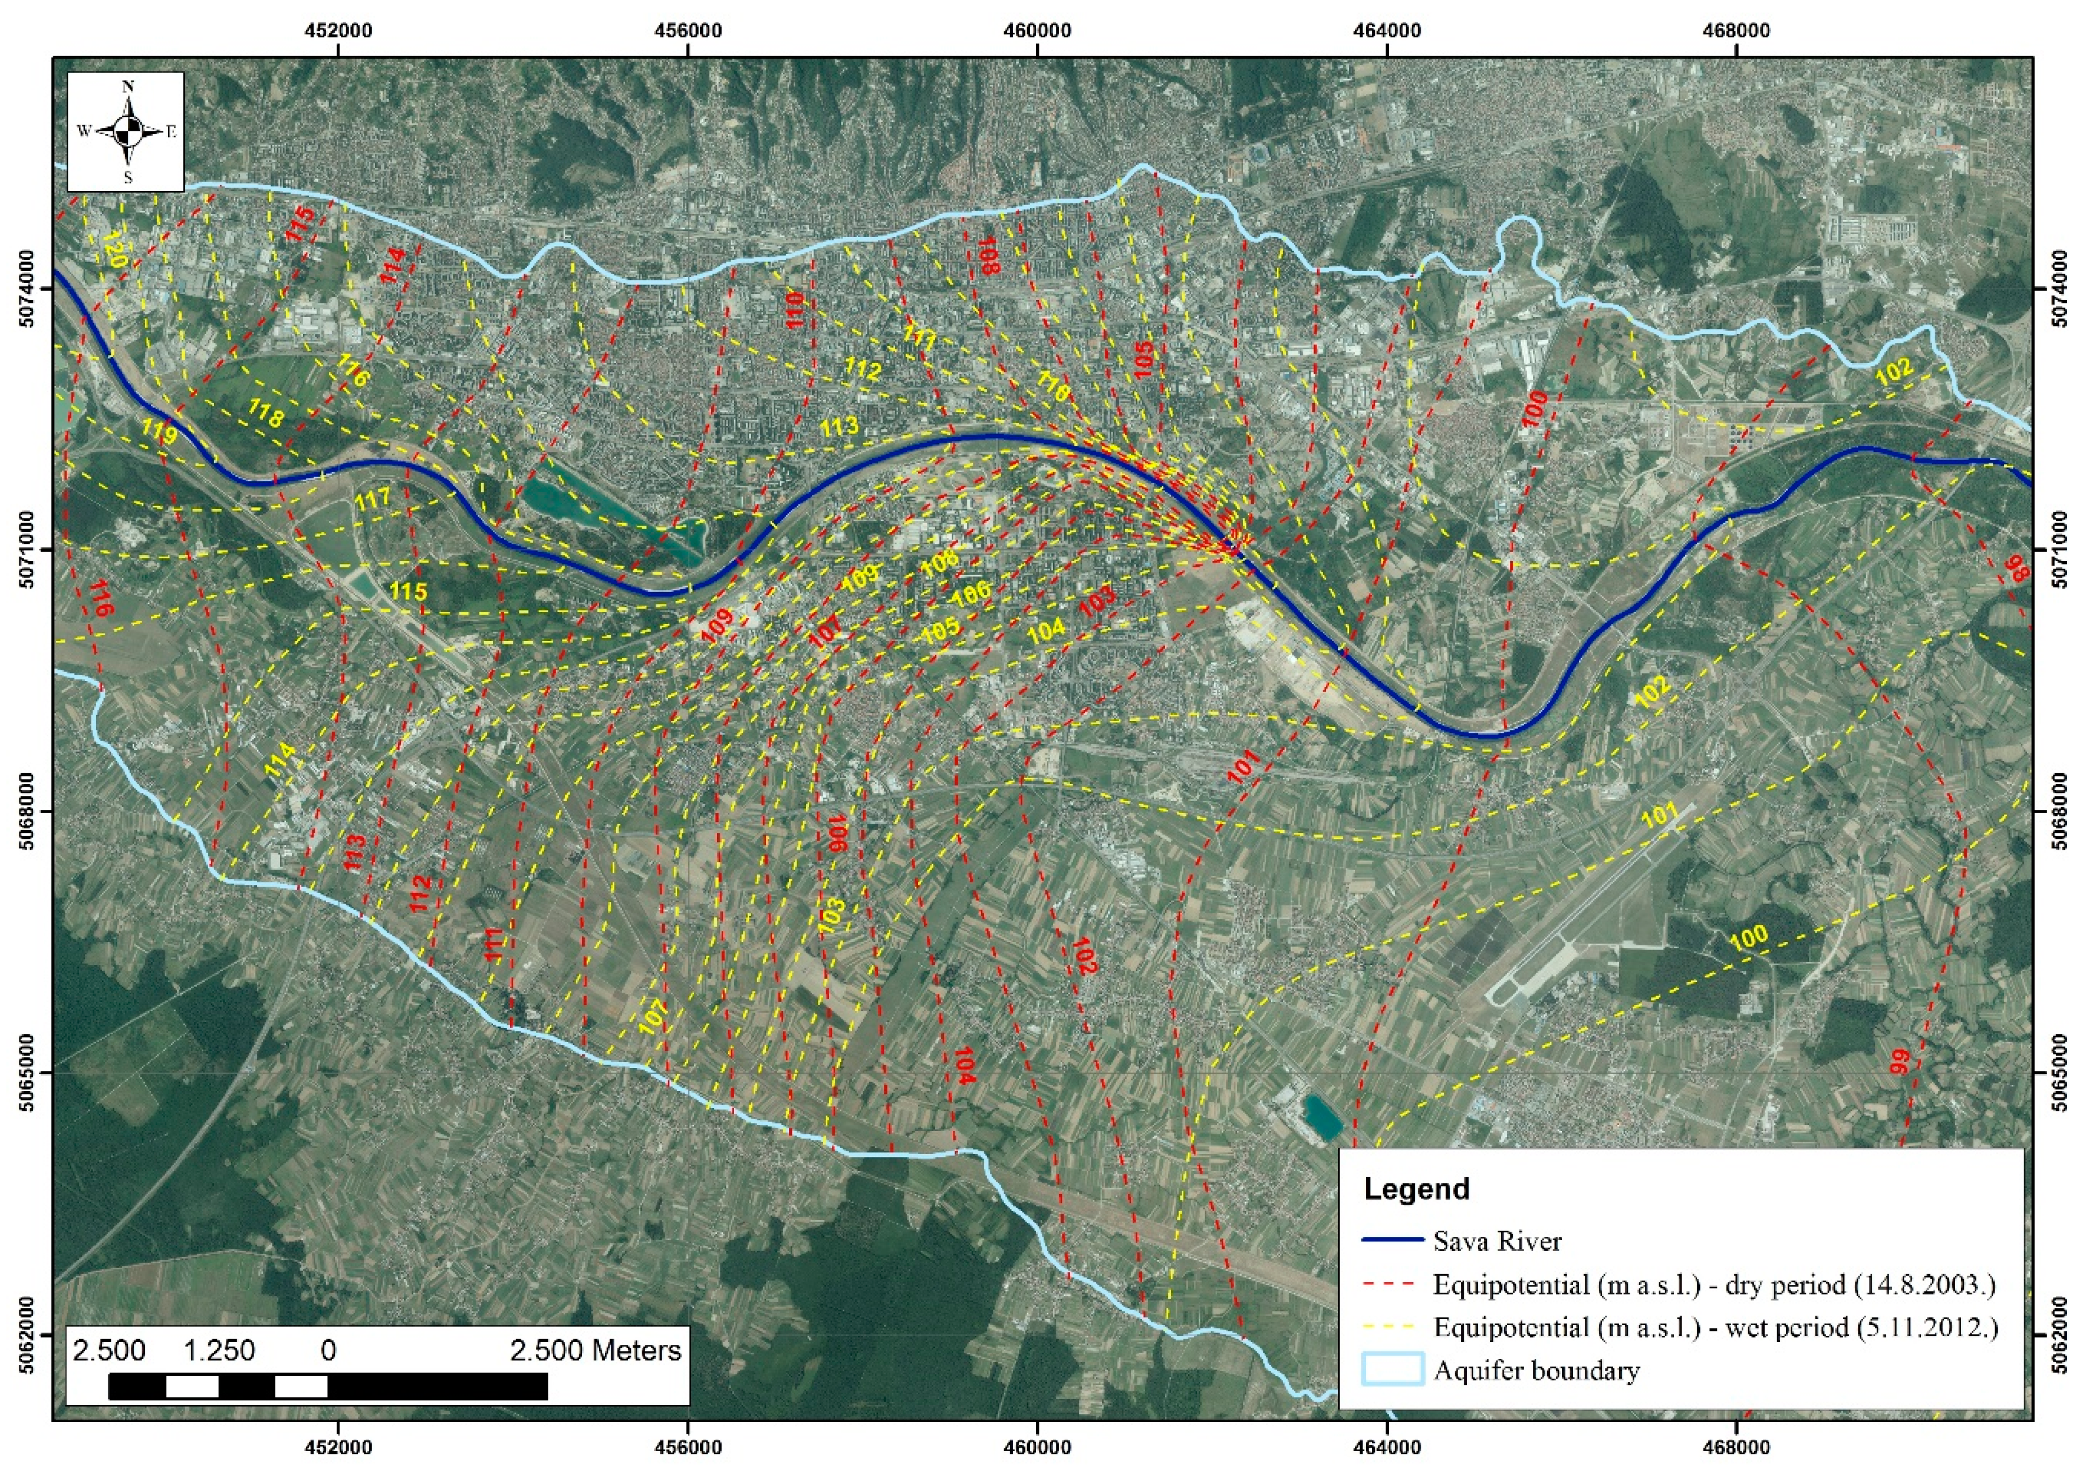
In addition to the isotopic data, different hydrogeological and pedological data were used. The Zagreb aquifer is of the unconfined type, and it is essential to determine the fluctuation of the groundwater table in order to determine the thickness of the unsaturated zone. Analysis of the minimum and maximum groundwater levels were done for the period from 2000 to 2014. The groundwater levels are measured continuously on one-third of the observation wells, but because the only purpose of many observation wells is water quality monitoring, they are not continually monitored. For these objects, maximum and minimum groundwater level data were taken from the water table contour maps created for wet and dry periods (Figure 3) [47]. In Table 1, groundwater levels for low and high waters characteristic for the area of each investigated observation well are shown. The difference between maximum and minimum groundwater levels varied from 0.8 to 5.09 m. Due to a large difference in the fluctuation of the groundwater level at certain points, only minimum groundwater levels, i.e., the maximum thickness of the unsaturated zone, were observed (Figure 2).
All investigated observation wells are also grouped according to their affiliation to different soil types; 8 observation wells are located in the Eutric Cambisol, 21 in the Fluvisols, and 16 in the urban part of the City of Zagreb (Table 1). Soil hydraulic properties were estimated based on the data from the research that was done in the soil profile in the area of the future well field Kosnica [29], which is located in the Fluvisols, and a soil profile that is located in the area of well field Velika Gorica [30], which is located in the Eutric Cambisols on Holocene deposits. Granulometric composition of soil profiles from these types of soils is given in Table 2. The soil profile in the Fluvisol has much more sand, while higher percentages of silt and clay in the Eutric Cambisols developed on Holocene deposits suggest much lower permeability. It has been shown that the Fluvisols are generally permeable, except in dry periods when water content is very low [29], while very low water content can be found in the Eutric Cambisols, which results in very small unsaturated hydraulic conductivities [30]. These results suggest that the possible influence of precipitation on the recharge of the Zagreb aquifer could be diminished in areas where the Eutric Cambisol prevails.
All maps were made in ArcMap 10.1 for Desktop, while georeferenced orthophoto image was obtained from geoportal of the Croatian Geodetic Administration. All maps are presented in the official coordinate system of the Republic of Croatia (HTRS96/TM).
4. Results and Discussion
The local meteoric water line (LMWL) for Zagreb is given in Figure 4, together with the LMWL for Ljubljana (because the Sava River is formed by the Sava Dolinka and the Sava Bohinjka headwaters in northwest Slovenia) as well as the average values of the observation wells and the Sava River. The water isotopic composition of the Sava River and groundwater from the Zagreb aquifer is more similar to the precipitation in the area of the City of Ljubljana than the precipitation in the area of the City of Zagreb, which is in agreement with previous results [10,11,12,13,38].
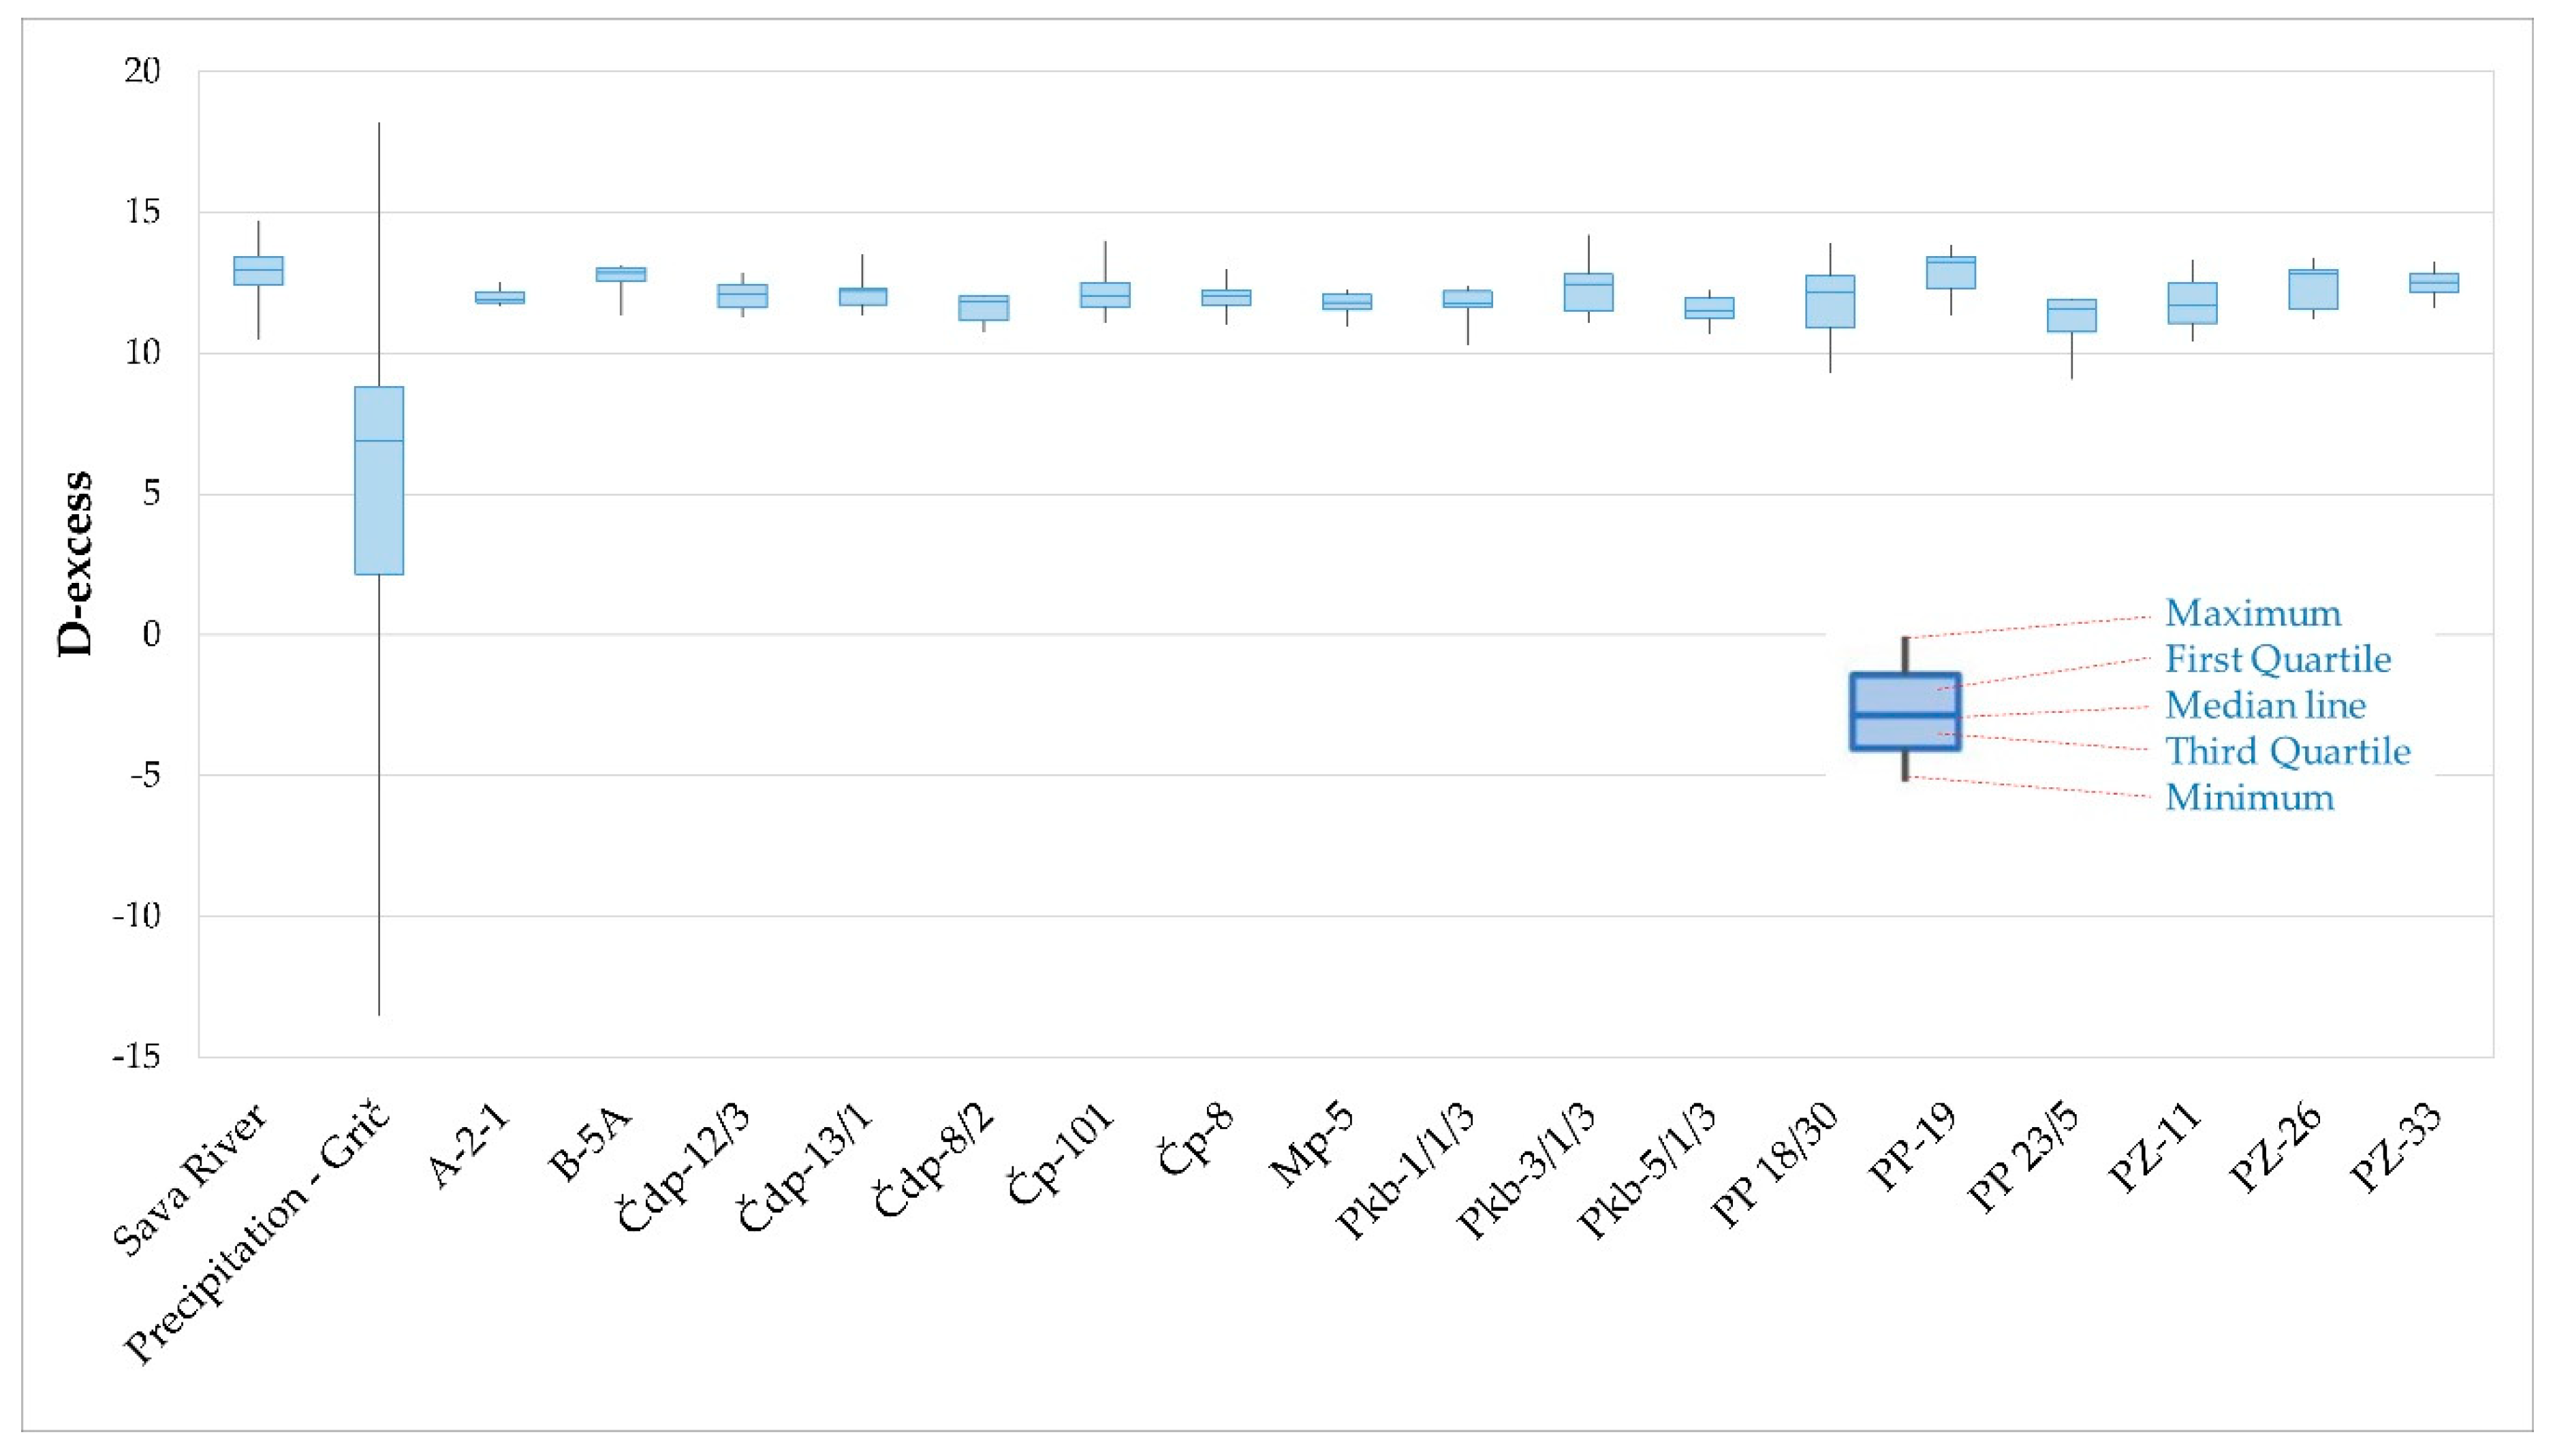
The d-excess values for groundwater were analyzed only for observation wells with at least 12 data measurements. The chosen objects are spatially representative for the entire aquifer and statistically more reliable. The d-excess values in groundwater samples varied from 9.07‰ to 14.21‰, while they varied from 10.49‰ to 14.69‰ in samples of the Sava River. Deuterium excess values in samples of the local precipitation varied a wide range from −13.38‰ to 18.18‰ (Figure 5). Groundwater and river water had similar isotopic signature as opposed to local precipitation.
The results from both mixing models, given in Table 3, show that the Sava River presents the most important source of recharge for the Zagreb aquifer. When observation wells were evaluated separately, in the two-component mixing model, contribution of the Sava River to aquifer recharge varied from 53.36% to 99.16%, with an average of 73.90%. Recharge from precipitation varied from 0.84% to 46.64%, with an average of 26.10%, and it was lower than the Sava River recharge for all observation wells.
The three-component mixing model, when the fraction of groundwater was introduced, resulted in no significant difference with regard to the two-component mixing model (Table 3). The fraction of precipitation in aquifer recharge varied from −0.87% to 45.71%, with an average of 24.82%. Recharge of the Zagreb aquifer from the surface water of the Sava River varied from 50.73% to 94.32%, with an average of 70.28%. Changes in the groundwater isotopic composition were negligible, with fractions between 3.55% and 6.55% and the average value of 4.90%, suggesting that only a small amount of water comes from neighboring groundwater bodies. It is possible that a certain amount of water comes from the adjacent aquifer in the west but also from the S, SW boundary when low waters are occurring, which can be seen in the equipotential map (Figure 3). The difference between the average values of fractions in two- and three-component mass balance models regarding recharge from the Sava River was 3.62%, while it was 1.28% regarding recharge from precipitation. Both models gave very similar results. For further analysis, results from the two-component mixing model were used. It has to be emphasized that, in this case, the three-component mixing model resulted in one negative value for recharge from precipitation (Čp-23, Table 3). Uncertainty of the results is generally related to the limited number of available data measured during different time periods within several projects.
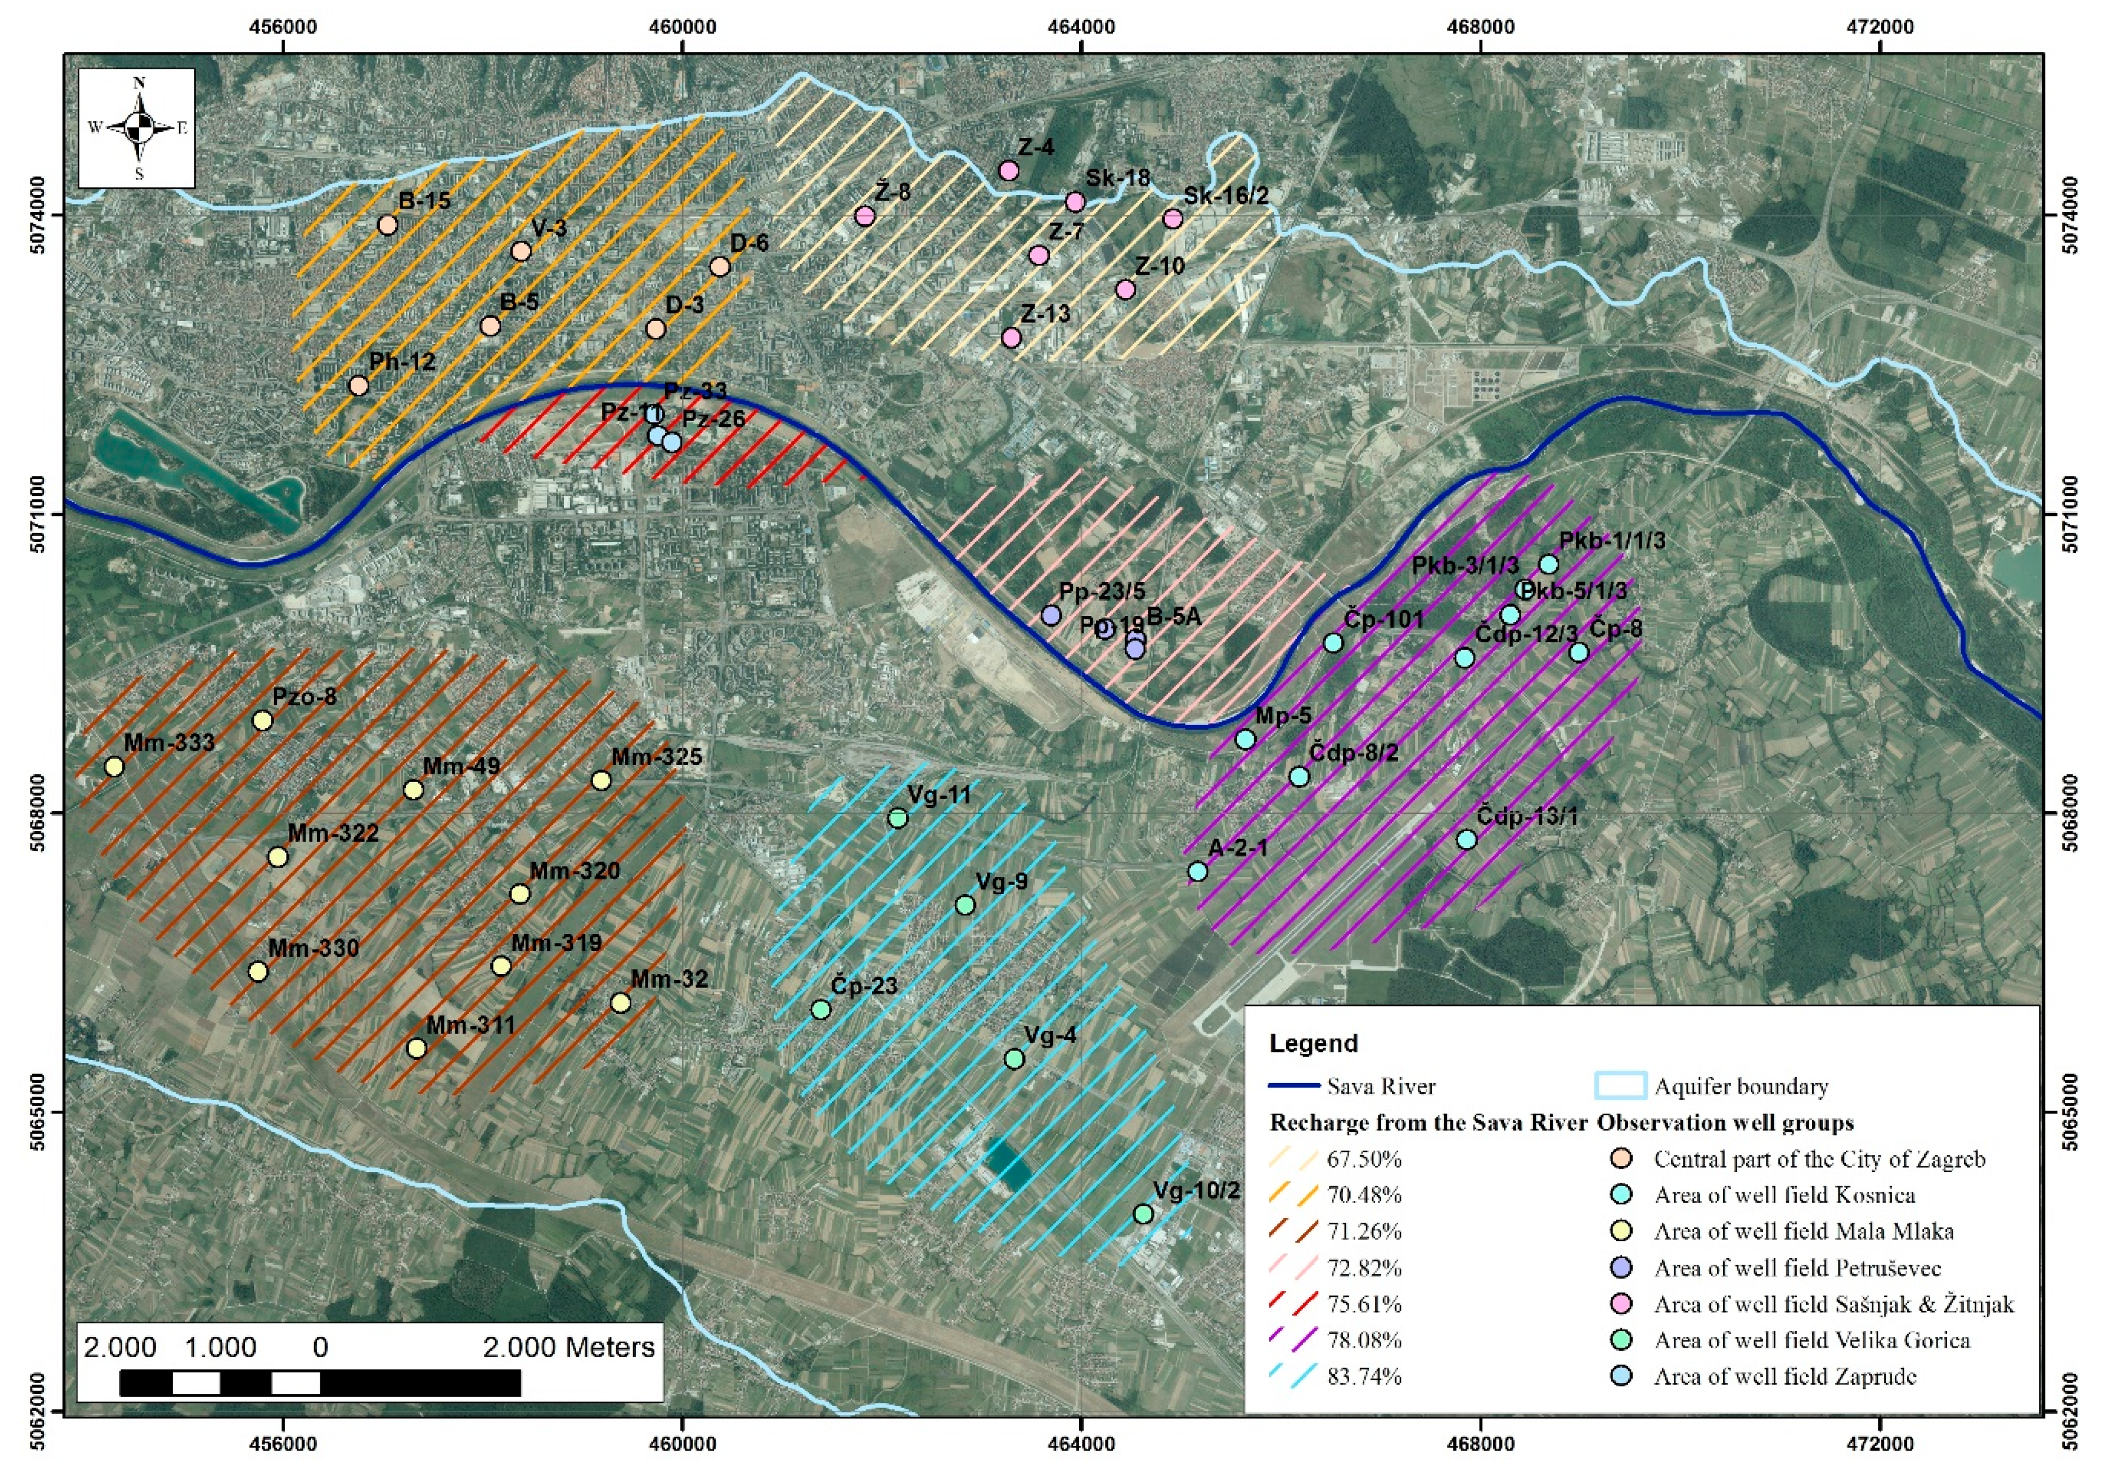
Although the results from the mixing models were as expected, i.e., the dominance of the Sava River as the main source of recharge was confirmed and consistent with previous research [10,11,12,13,38], some anomalies were identified. A few observation wells that are located far away from the Sava River have a higher river water fraction than those that are located near the Sava River. In order to explore this issue in more detail, data from the observation wells were mainly grouped according to the inflow areas of different well fields (Table 4). In most cases, the largest fractions in aquifer recharge were river water and seen in the inflow areas of well fields that are located near the Sava River (well fields Kosnica, Zapruđe, and Petruševec). In the urban part of the City of Zagreb, observation wells have very similar river water fraction values, while in the inflow areas of well fields Sašnjak and Žitnjak, the Sava River’s influence is less pronounced, which can be expected due to their slightly longer distances from the Sava River. However, some results from the observation wells located in the inflow areas of well fields Velika Gorica and Mala Mlaka suggested that the Sava River’s influence is the highest in the southern part of the Zagreb aquifer, near its edges (Figure 6).
In order to clarify this issue, data of soil property and thickness of the unsaturated zone were analyzed. In the urban part of the City of Zagreb, the unsaturated zone, especially the upper part (first few meters of depth), is mainly disintegrated by human influence. Almost all observation wells located on the left bank of the Sava River are placed in the urban area.
Of all the 45 observation wells, 21 are located in the Fluvisols, eight of them in the Eutric Cambisols, and 16 in the urban area (Figure 2, Table 5). Most of them are located on the right bank of the Sava River. Although the observation wells located in the Fluvisols are closer to the Sava River, they show about 6% lower influence of the Sava River on the recharge of the Zagreb aquifer, which is probably the result of a more permeable soil type (Table 5). In the Eutric Cambisols, a higher fraction of finer particles, i.e., silts and clays, can be found, which reduces the amount of infiltration through the unsaturated zone into the Zagreb aquifer.
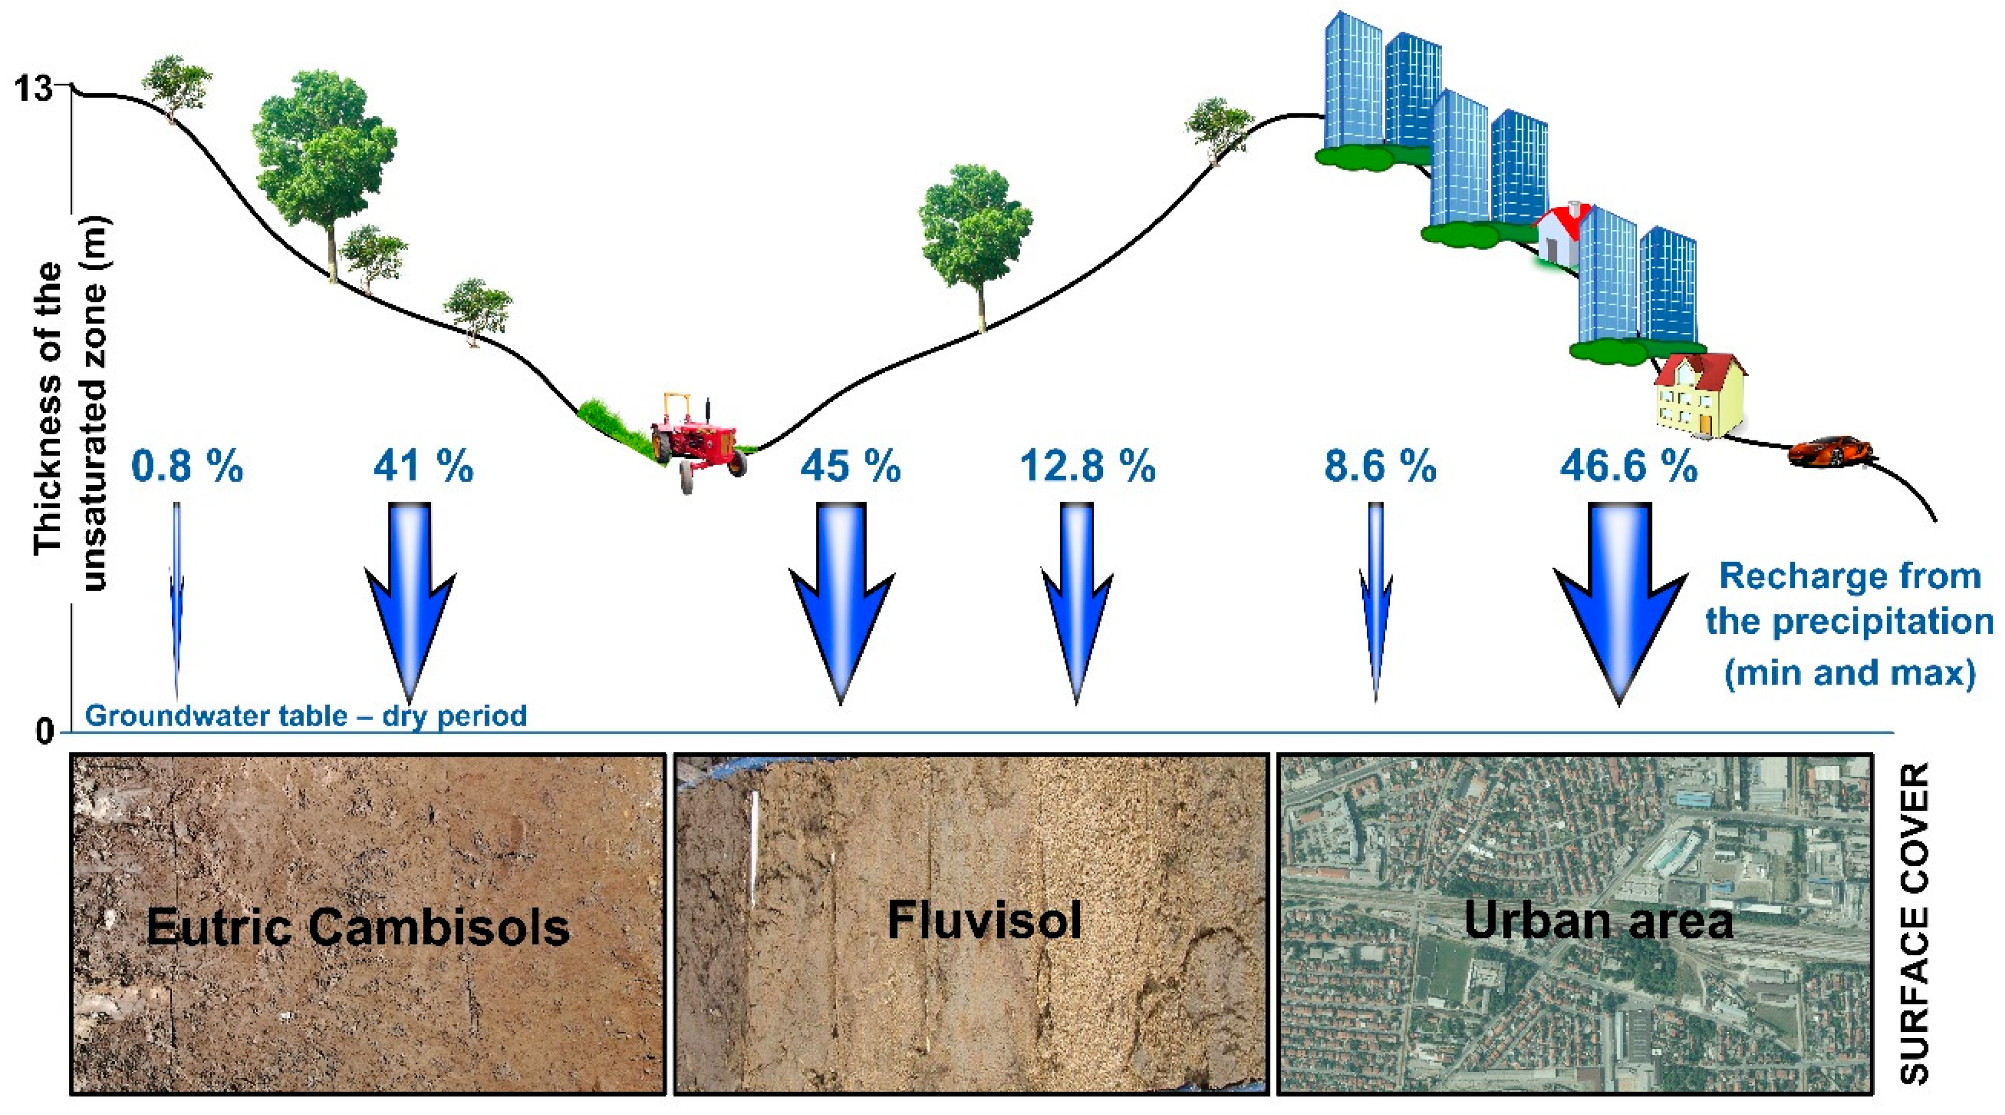
The thickness ranges in different types of soil were very similar. The thickness of the unsaturated zone varied from 5.7 to 11.5 m within the Eutric Cambisols soil type, from 6.1 to 12.9 m within the Fluvisols, and from 5 to 13 m within the urban part of the Zagreb aquifer. However, the minimum and maximum values of the precipitation fractions in the Zagreb aquifer recharge, calculated based on the data from the observation wells in different types of surface cover (Table 3), showed the importance of observing the characteristics of an unsaturated zone and its role in the estimation of groundwater recharge. Figure 7 illustrates how the soil type and thickness of the unsaturated zone affect the recharge of the aquifer from precipitation. The Eutric Cambisols soil type is less permeable than the Fluvisol and, combined with the large thickness, it results in extremely low infiltration of precipitation. Similarly, in spite of the greater permeability of the Fluvisols, large thickness of the unsaturated zone significantly reduces infiltration from the surface. However, detailed inspection of soil permeability should be done in future research. In the urban area, the soil and the unsaturated zone are mostly disturbed, making it difficult to interpret the results. The occurrence of low and high values of recharge from precipitation confirms emphasized heterogeneity caused by human activity in that area.
5. Conclusions
The main aim of this study was to determine and quantify the main recharge components of the unconfined alluvial aquifer, which is strongly hydraulically connected with the river, using water stable isotopes. The final outcomes can be summarized as follows:
- Two- and three-component mixing models based on the isotopic mass balance are efficient tools for the quantification of groundwater recharge fractions. In the research area, these models showed that the Sava River, although spatially varying, is the dominating source of groundwater recharge.
- The thickness of the unsaturated zone and soil permeability has large influence on the aquifer recharge. Evaluation of soil permeability can be crucial in quantification of the shallow alluvial aquifer recharge and data interpretation.
- Water stable isotope composition of groundwater, precipitation, and the Sava River water confirmed strong connection between the alluvial part of the Zagreb aquifer and the Sava River.
- The Sava River presents the main recharge factor of the Zagreb aquifer. In general, more than 70% of the Zagreb aquifer recharge is related to the Sava River.
- Future research in the area of the Zagreb aquifer should be focused on detailed inspection of soil permeability in order to define the difference in percolation through different types of soil.
- The water management of the Zagreb aquifer should be focused on groundwater level stabilization by regulation of the Sava River.
- The identified pattern of groundwater–surface water interaction in the study area will enable the development of better monitoring networks as well as determination of aquifer areas that need better protection.
Author Contributions
J.P. participated in the evaluation of the water isotope and unsaturated zone analyses and contributed to writing of the article. Z.K. carried out data analysis and data interpretation and took the lead in writing the article. Z.N. contributed in writing the article and data interpretation. J.B. contributed in data processing of water isotope composition and related interpretation.
Funding
This research received no external funding.
Acknowledgments
The authors would like to thank the International Atomic Energy Agency for providing technical support within the IAEA TC project CRO7001 (Isotope Investigation of the Groundwater–Surface Water Interaction at the Well Field Kosnica in the Area of the City of Zagreb). The publication process was supported by the Development Fund of the Faculty of Mining, Geology, and Petroleum Engineering at the University of Zagreb.
Conflicts of Interest
The authors declare no conflict of interest. The funders had no role in the design of the study; in the collection, analyses, or interpretation of data; in the writing of the manuscript; or in the decision to publish the results.
References
- Chen, Y.N.; Li, Z.; Fan, Y.T.; Wang, H.J.; Deng, H.J. Progress and prospects of climate change impacts on hydrology in the arid region of northwest China. Environ. Res. 2015, 139, 11–19. [Google Scholar] [CrossRef] [PubMed]
- Döll, P.; Hoffmann-Dobrev, H.; Portmann, F.T.; Siebert, S.; Eicker, A.; Rodell, M.; Strassberg, G.; Scanlon, B. Impact of water withdrawals from groundwater and surface water on continental water storage variations. J. Geodyn. 2012, 59, 143–156. [Google Scholar] [CrossRef]
- Joshi, S.K.; Rai, S.P.; Sinha, R.; Gupta, S.; Densmore, A.L.; Rawat, Y.S.; Shekhar, S. Tracing groundwater recharge sources in the northwestern Indian alluvial aquifer using water isotopes (δ18O, δ2H and 3H). J. Hydrol. 2018, 559, 835–847. [Google Scholar] [CrossRef]
- Wada, Y.; van Beek, L.P.H.; Bierkens, M.F.P. Non-sustainable groundwater sustaining irrigation: A global assessment. Water Resour. Res. 2012, 48, 6. [Google Scholar] [CrossRef]
- Gleeson, T.; Befus, K.M.; Jasechko, S.; Luijendijk, E.; Cardenas, M.B. The global volume and distribution of modern groundwater. Nat. Geosci. 2015, 9, 161–167. [Google Scholar] [CrossRef]
- Kumar, C.P. Climate Change and Its Impact on Groundwater Resources. Int. J. Eng. Sci. 2012, 1, 43–60. [Google Scholar]
- Gampe, D.; Nikulin, G.; Ludwig, R. Using an ensemble of regional climate models to assess climate change impacts on water scarcity in European river basins. Sci. Total Environ. 2016, 573, 1503–1518. [Google Scholar] [CrossRef]
- Vrzel, J.; Ludwig, R.; Gampe, D.; Ogrinc, N. Hydrological system behaviour of an alluvial aquifer under climate change. Sci. Total Environ. 2019, 649, 1179–1188. [Google Scholar] [CrossRef]
- Brunner, P.; Cook, P.G.; Simmons, C.T. Disconnected surface water and groundwater: From theory to practice. Ground Water 2010, 1–8. [Google Scholar] [CrossRef]
- Parlov, J.; Nakić, Z.; Posavec, K.; Bačani, A. Origin and dynamics of aquifer recharge in Zagreb area. In Proceedings of the Fifth International Scientific Conference on Water, Climate and Environment 2012, Balwois, Ohrid, Macedonia, 28 May–2 June 2012; ISBN 978-608-4510-10-9. [Google Scholar]
- Nakić, Z.; Ružičić, S.; Posavec, K.; Mileusnić, M.; Parlov, J.; Bačani, A.; Durn, G. Conceptual model for groundwater status and risk assessment—Case study of the Zagreb aquifer system. Geol. Croat. 2013, 66, 55–76. [Google Scholar] [CrossRef]
- Marković, T.; Brkić, Ž.; Larva, O. Using hydrochemical data and modelling to enhance the knowledge of groundwater flow and quality in an alluvial aquifer of Zagreb, Croatia. Sci. Total Environ. 2013, 458–460, 508–516. [Google Scholar] [CrossRef]
- Kovač, Z.; Nakić, Z.; Barešić, J.; Parlov, J. Nitrate Origin in the Zagreb Aquifer System. Geofluids 2018, 15. [Google Scholar] [CrossRef]
- Deshpande, R.D.; Gupta, S.K. Oxygen and hydrogen isotopes in hydrological cycle: New data from IWIN national pro-gramme. Proc. Indian Natl. Sci. Acad. 2012, 78, 321–331. [Google Scholar]
- Achyuthan, H.; Deshpande, R.D.; Rao, M.S.; Kumar, B.; Nallathambi, T.; Shashikumar, K.; Ramesh, R.; Ramachandran, P.; Maurya, A.S.; Gupta, S.K. Spatio-temporal mixing inferred from water isotopes and salinity of surface waters in the Bay of Bengal. Mar. Chem. 2013, 149, 51–62. [Google Scholar] [CrossRef]
- Shahul Hameed, A.S.; Resmi, T.R.; Suraj, S.; Unnikrishnan Warrier, C.; Sudheesh, M.; Deshpande, R.D. Isotopic characterization and mass balance reveals groundwater recharge pattern in Chaliyar river basin, Kerala, India. J. Hydrol. Reg. Stud. 2015, 4, 48–58. [Google Scholar] [CrossRef] [Green Version]
- Fan, Y.; Chen, Y.; He, Q.; Li, W.; Wang, Y. Isotopic Characterization of River Waters and Water Source Identification in an Inland River, Central Asia. Water 2016, 8, 286. [Google Scholar] [CrossRef]
- González-Trinidad, T.; Pacheco-Guerrero, A.; Júnez-Ferreira, H.; Bautista-Capetillo, C.; Hernández-Antonio, A. Identifying Groundwater Recharge Sites through Environmental Stable Isotopes in an Alluvial Aquifer. Water 2017, 9, 569. [Google Scholar] [CrossRef]
- Vrzel, J.; Kip Solomon, D.; Blažeka, Ž.; Ogrinc, N. The study of the interactions between groundwater and Sava River water in the Ljubljansko polje aquifer system (Slovenia). J. Hydrol. 2018, 556, 384–396. [Google Scholar] [CrossRef]
- Ala-aho, P.; Soulsby, C.; Pokrovsky, O.S.; Kirpotin, S.N.; Karlsson, J.; Serikova, S.; Vorobyev, S.N.; Manasypov, R.M.; Loiko, S.; Tetzlaff, D. Using stable isotopes to assess surface water source dynamics and hydrological connectivity in a high-latitude wetland and permafrost influenced landscape. J. Hydrol. 2018, 556, 279–293. [Google Scholar] [CrossRef]
- Bačani, A.; Posavec, K.; Parlov, J. Groundwater quantity in the Zagreb aquifer. In XXXVIII IAH Congress Groundwater Quality Sustainability; Zuber, A., Kania, J., Kmiecik, E., Eds.; University of Silesia: Krakow, Poland, 2010; pp. 87–92. [Google Scholar]
- Velić, J.; Saftić, B. Subsurface Spreading and Facies Characteristics of Middle Peistocene Deposits between Zaprešić and Samobor. Geološki Vjesn. 1991, 44, 69–82. [Google Scholar]
- Velić, J.; Durn, G. Alternating Lacustrine-Marsh Sedimentation and Subaerial Exposure Phases during Quaternary: Prečko, Zagreb, Croatia. Geol. Croat. 1993, 46, 71–90. [Google Scholar] [CrossRef]
- Velić, J.; Saftić, B.; Malvić, T. Lithologic composition and stratigraphy of Quaternary sediments in the area of the “Jakuševec” Waste Depository (Zagreb, Northern Croatia). Geol. Croat. 1999, 52, 119–130. [Google Scholar] [CrossRef]
- Sokač, A. Pleistocene ostracode fauna of the Pannonian Basin in Croatia. Paleontol. Jugosl. 1978, 20, 1–51. [Google Scholar]
- Hernitz, Z.; Kovačević, S.; Velić, J.; Urli, M. An example of complex geological and geophysical explorations of Quaternary deposits in the soroundings of Prevlaka. Geološki Vjesn. 1981, 33, 11–34. (In Croatian) [Google Scholar]
- Bogunović, M.; Vidaček, Ž.; Husnjak, S.; Sraka, M.; Petošić, D. Inventory of Soils in Croatia. Agric. Conspec. Sci. 1998, 63, 105–112. [Google Scholar]
- Sollitto, D.; Romić, M.; Castrignano, A.; Romić, D.; Bakić, H. Assessing heavy metal contamination in soils of the Zagreb region (Northwest Croatia) using multivariate geostatistics. Catena 2010, 80, 182–194. [Google Scholar] [CrossRef]
- Ružičić, S.; Kovač, Z.; Nakić, Z.; Kireta, D. Fluvisol permeability estimation using soil water content variability. Geofizika 2017, 34, 141–155. [Google Scholar] [CrossRef]
- Ružičić, S.; Kovač, Z.; Tumara, D. Physical and chemical properties in relation to soil permeability in the area of the Velika Gorica well field. Min.-Geol.-Pet. Eng. Bull. 2018, 33, 73–81. [Google Scholar] [CrossRef]
- Posavec, K.; Vukojević, P.; Ratkaj, M.; Bedeniković, T. Cross-correlation modelling of surface water-groundwater interaction using the Excel spreadsheet application. Min.-Geol.-Pet. Eng. Bull. 2017, 32, 25–32. [Google Scholar] [CrossRef]
- Posavec, K. Identification and prediction of minimum ground water levels of Zagreb alluvial aquifer using recession curve models. Ph.D. Thesis, University of Zagreb, Zagreb, Croatia, 2006; p. 89. unpublished. (In Croatian). [Google Scholar]
- Nakić, Z.; Posavec, K.; Parlov, J.; Bačani, A. Development of the conceptual model of the Zagreb aquifer system. In The Geology in Digital Age, Proceedings of the 17th Meeting of the Association of European Geological Societies (MAEGS 17), Belgrade, Serbia, 17–18 September 2011; The Serbian Geological Society: Belgrade, Serbia, 2011. [Google Scholar]
- Vlahović, T.; Bačani, A.; Posavec, K. Hydrogeochemical stratification of the unconfined Samobor aquifer (Zagreb, Croatia). Environ. Geol. 2009, 57, 1707–1722. [Google Scholar] [CrossRef]
- Kovač, Z.; Cvetković, M.; Parlov, J. Gaussian simulation of nitrate concentration distribution in the Zagreb aquifer. J. Maps 2017, 13, 727–732. [Google Scholar] [CrossRef] [Green Version]
- Kovač, Z.; Nakić, Z.; Pavlić, K. Influence of groundwater quality indicators on nitrate concentrations in the Zagreb aquifer system. Geol. Croat. 2017, 70, 93–103. [Google Scholar] [CrossRef]
- Kovač, Z.; Nakić, Z.; Špoljarić, D.; Stanek, D.; Bačani, A. Estimation of nitrate trends in the groundwater of the Zagreb aquifer. Geosciences 2018, 8, 5. [Google Scholar] [CrossRef]
- Parlov, J.; Kovač, Z.; Barešić, J. The study of the interactions between Sava River and Zagreb aquifer system (Croatia) using water stable isotopes. In Proceedings of the 16th International Symposium on Water-Rock Interaction and the 13th International Symposium on Applied Isotope Geochemistry, Tomsk, Russia, 21–26 July 2019. [Google Scholar]
- Horvatinčić, N.; Barešić, J.; Krajcar Bronić, I.; Obelić, B.; Kármán, K.; Fórisz, I. Study of the bank filtered groundwater system of the Sava River at Zagreb (Croatia) using isotope analyses. Cent. Eur. Geol. 2011, 54, 121–127. [Google Scholar] [CrossRef] [Green Version]
- IAEA/WMO. Global Network of Isotopes in Precipitation. The GNIP Database. 2019. Available online: http://www.iaea.org/water (accessed on 21 May 2019).
- Vreča, P.; Krajcar Bronić, I.; Horvatinčić, N.; Barešić, J. Isotopic characteristics of precipitation in Slovenia and Croatia: Comparison of continental and maritime stations. J. Hydrol. 2006, 330, 457–469. [Google Scholar] [CrossRef]
- Dansgaard, W. Stable isotopes in precipitation. Tellus 1964, 16, 436–468. [Google Scholar] [CrossRef]
- Clark, I.D.; Fritz, P. Tracing the hydrological cycle. In Environmental Isotopes in Hydrogeology; CRC Press: Boca Raton, FL, USA, 1997; pp. 35–60. [Google Scholar]
- Peng, T.R.; Wang, C.H.; Lai, T.C.; Ho, F.S.K. Using hydrogen, oxygen, and tritium isotopes to identify the hydrological factors contributing to landslides in a mountainous area, central Taiwan. Environ. Geol. 2007, 52, 1617–1629. [Google Scholar] [CrossRef]
- Peng, T.R.; Wang, C.H.; Hsu, S.M.; Wang, G.S.; Su, T.W.; Lee, J.F. Identification of groundwater sources of a local-scale creep slope: Using environmental stable isotopes as tracers. J. Hydrol. 2010, 381, 151–157. [Google Scholar] [CrossRef]
- Clark, I. Groundwater Geochemistry and Isotopes; CRC Press, Taylor & Francis Group: Boca Raton, FL, USA, 2015; p. 421. [Google Scholar]
- Kovač, Z. Nitrate origin in groundwater of the Zagreb alluvial aquifer. Ph.D. Thesis, University of Zagreb, Zagreb, Croatia, 2017; p. 255. (In Croatian). [Google Scholar]
Figure 1.
The location of the Zagreb aquifer system.

Figure 2.
Maximum thickness of the unsaturated zone and soil types of the Zagreb aquifer.

Figure 3.
The water table contour map of the Zagreb aquifer during dry and wet periods (equipotentials in meters above sea level (m a.s.l.)) [47].
Figure 3.
The water table contour map of the Zagreb aquifer during dry and wet periods (equipotentials in meters above sea level (m a.s.l.)) [47].

Figure 4.
Comparison of the water isotopic composition of precipitation from Zagreb and Ljubljana with average values of observation wells from the Zagreb aquifer and the Sava River.
Figure 4.
Comparison of the water isotopic composition of precipitation from Zagreb and Ljubljana with average values of observation wells from the Zagreb aquifer and the Sava River.

Figure 5.
Average deuterium excess (d-excess) values in samples of the Sava River, precipitation, and groundwater.
Figure 5.
Average deuterium excess (d-excess) values in samples of the Sava River, precipitation, and groundwater.

Figure 6.
Spatial recharge fractions of the Zagreb aquifer from the Sava River.

Figure 7.
The conceptual illustration of groundwater recharge of the Zagreb aquifer system through the unsaturated zone with different thickness and surface covers in two-component mixing model.
Figure 7.
The conceptual illustration of groundwater recharge of the Zagreb aquifer system through the unsaturated zone with different thickness and surface covers in two-component mixing model.


Table 1.
Hydrogeological, pedological, and water stable isotope data (average values of δ18O, δ2H, and d-excess) used in the analysis (minimum and maximum water levels registered between 2000 and 2014).
Table 1.
Hydrogeological, pedological, and water stable isotope data (average values of δ18O, δ2H, and d-excess) used in the analysis (minimum and maximum water levels registered between 2000 and 2014).
| Observation Well | Inflow Area According to Figure 2 | Soil Type | Minimum Water Level (m a.s.l.) | Maximum Water Level (m a.s.l.) | δ2H (‰) | δ18O (‰) | d-Excess (‰) | n |
|---|---|---|---|---|---|---|---|---|
| D-6 | CPCZ | Urban | 106.6 | 107.9 | −62.3 | −9.1 | 10.2 | 4 |
| D-3 | CPCZ | Urban | 108.0 | 109.2 | −62.6 | −9.1 | 10.1 | 4 |
| Ph-12 | CPCZ | Urban | 110.4 | 112.8 | −62.6 | −9.1 | 10.3 | 4 |
| B-5 | CPCZ | Urban | 109.5 | 111.8 | −63.2 | −9.1 | 9.7 | 4 |
| V-3 | CPCZ | Urban | 109.2 | 110.3 | −62.7 | −9.2 | 10.6 | 4 |
| B-15 | CPCZ | Urban | 110.4 | 111.2 | −63.3 | −9.2 | 10.4 | 4 |
| Čp-8 | Kosnica | Fluvisols | 98.6 | 103.5 | −60.7 | −9.1 | 12.0 | 12 |
| Pkb-1/1/3 | Kosnica | Fluvisols | 99.0 | 102.1 | −61.2 | −9.1 | 11.8 | 12 |
| Čdp-13/1 | Kosnica | Fluvisols | 98.9 | 103.2 | −61.0 | −9.2 | 12.3 | 12 |
| Čdp-12/3 | Kosnica | Fluvisols | 98.8 | 103.9 | −61.3 | −9.2 | 12.2 | 12 |
| Pkb-3/1/3 | Kosnica | Fluvisols | 99.1 | 102.0 | −61.4 | −9.2 | 12.2 | 12 |
| Pkb-5/1/3 | Kosnica | Fluvisols | 98.6 | 101.9 | −62.3 | −9.2 | 11.6 | 12 |
| Mp-5 | Kosnica | Fluvisols | 100.0 | 103.1 | −62.0 | −9.2 | 11.9 | 12 |
| Čp-101 | Kosnica | Fluvisols | 99.6 | 103.1 | −61.9 | −9.3 | 12.2 | 12 |
| A-2-1 | Kosnica | Fluvisols | 99.9 | 101.5 | −62.3 | −9.3 | 12.1 | 12 |
| Čdp-8/2 | Kosnica | Fluvisols | 99.3 | 104.1 | −62.6 | −9.3 | 11.8 | 12 |
| Mm-49 | Mala Mlaka | Fluvisols | 106.4 | 108.1 | −60.0 | −8.9 | 10.5 | 4 |
| Mm-325 | Mala Mlaka | Fluvisols | 102.0 | 104.9 | −60.5 | −9.0 | 11.2 | 4 |
| Mm-311 | Mala Mlaka | Eutric Cambisols | 101.5 | 105.0 | −61.0 | −9.0 | 11.1 | 4 |
| Pzo-8 | Mala Mlaka | Fluvisols | 109.0 | 111.0 | −62.1 | −9.1 | 10.5 | 4 |
| Mm-333 | Mala Mlaka | Fluvisols | 109.0 | 111.0 | −61.9 | −9.1 | 10.7 | 4 |
| Mm-320 | Mala Mlaka | Fluvisols | 102.5 | 105.4 | −62.2 | −9.1 | 10.9 | 4 |
| Mm-322 | Mala Mlaka | Eutric Cambisols | 107.9 | 109.5 | −62.2 | −9.2 | 11.3 | 4 |
| Mm-330 | Mala Mlaka | Eutric Cambisols | 108.8 | 111.0 | −63.1 | −9.3 | 10.1 | 4 |
| Mm-319 | Mala Mlaka | Fluvisols | 101.1 | 104.6 | −63.1 | −9.3 | 11.4 | 4 |
| Mm-32 | Mala Mlaka | Fluvisols | 100.4 | 103.8 | −63.7 | −9.3 | 11.1 | 4 |
| Pp-18/30 | Petruševec | Fluvisols | 100.8 | 103.9 | −61.0 | −9.1 | 11.7 | 12 |
| Pp-19 | Petruševec | Fluvisols | 100.5 | 103.8 | −60.7 | −9.2 | 12.9 | 12 |
| B-5A | Petruševec | Fluvisols | 99.8 | 103.8 | −61.0 | −9.2 | 12.8 | 11 |
| Pp-23/5 | Petruševec | Fluvisols | 100.9 | 104.7 | −61.2 | −9.1 | 11.3 | 12 |
| Ž-8 | Sašnjak and Žitnjak | Urban | 104.5 | 107.6 | −62.0 | −8.9 | 9.3 | 4 |
| Z-7 | Sašnjak and Žitnjak | Urban | 101.7 | 104.1 | −62.1 | −9.0 | 9.6 | 4 |
| Z-4 | Sašnjak and Žitnjak | Urban | 101.1 | 104.6 | −62.0 | −9.0 | 9.8 | 4 |
| Sk-18 | Sašnjak and Žitnjak | Urban | 100.4 | 104.1 | −61.8 | −9.0 | 10.2 | 4 |
| Sk-16/2 | Sašnjak and Žitnjak | Urban | 99.9 | 103.6 | −62.0 | −9.1 | 10.8 | 4 |
| Z-10 | Sašnjak and Žitnjak | Urban | 99.9 | 103.5 | −61.9 | −9.3 | 12.1 | 4 |
| Z-13 | Sašnjak and Žitnjak | Urban | 101.0 | 103.4 | −61.8 | −9.4 | 13.1 | 4 |
| Vg-4 | Velika Gorica | Eutric Cambisols | 99.5 | 102.3 | −62.1 | −9.0 | 9.7 | 4 |
| Vg-11 | Velika Gorica | Fluvisols | 101.0 | 104.1 | −62.5 | −9.3 | 11.5 | 4 |
| Vg-10/2 | Velika Gorica | Eutric Cambisols | 99.6 | 102.2 | −64.3 | −9.3 | 10.3 | 4 |
| Vg-9 | Velika Gorica | Eutric Cambisols | 100.4 | 103.2 | −63.5 | −9.4 | 11.4 | 4 |
| Čp-23 | Velika Gorica | Eutric Cambisols | 99.4 | 102.0 | −64.1 | −9.5 | 11.6 | 4 |
| Pz-11 | Zapruđe | Urban | 106.4 | 110.2 | −62.2 | −9.3 | 11.8 | 12 |
| Pz-26 | Zapruđe | Urban | 105.5 | 109.8 | −61.0 | −9.2 | 12.3 | 12 |
| Pz-33 | Zapruđe | Urban | 106.9 | 110.8 | −60.4 | −9.1 | 12.6 | 12 |
Table 2.
Granulometric composition of the most common types of soils in the area of the Zagreb aquifer (modified according to [29,30]).
| Type of the Soil | Soil Horizon | Depth (m) | Sand (%) | Silt (%) | Clay (%) |
|---|---|---|---|---|---|
| Fluvisols | A | 0–0.19 | 24.56 | 65.27 | 10.17 |
| AC-C | 0.19–0.68 | 13.79 | 76.69 | 9.52 | |
| 2C/Cl | 0.68–1.1 | 56.33 | 38.23 | 5.44 | |
| 3Cl | 1.1–1.4 | 43.29 | 47.43 | 9.28 | |
| 4Cl/Cr | 1.4.–1.9 | 37.21 | 50.50 | 12.29 | |
| 5Cr | 1.9–2.1 | 55.62 | 38.45 | 5.93 | |
| Eutric Cambisols | A | 0–0.2 | 2.42 | 87.43 | 10.15 |
| Bw | 0.2–0.4 | 1.8 | 89.54 | 8.65 | |
| 0.4–0.6 | 1.46 | 87.59 | 10.95 | ||
| 0.6–0.8 | 2.72 | 84.97 | 12.32 | ||
| C | 0.8–1 | 4.77 | 82.00 | 13.23 | |
| 1–1.2 | 3.84 | 89.78 | 6.37 |
Table 3.
Results of two- and three-component mixing models.
| Observation Well | Two-Component Mixing Model | Three-Component Mixing Model | |||
|---|---|---|---|---|---|
| Recharge from Precipitation (%) | Recharge from the Sava River (%) | Recharge from Precipitation (%) | Recharge from the Sava River (%) | Recharge from Groundwater (%) | |
| D-6 | 34.03 | 65.97 | 32.89 | 62.73 | 4.38 |
| D-3 | 33.19 | 66.81 | 32.04 | 63.53 | 4.43 |
| Ph-12 | 30.88 | 69.12 | 29.69 | 65.72 | 4.59 |
| B-5 | 30.04 | 69.96 | 28.83 | 66.52 | 4.65 |
| V-3 | 26.68 | 73.32 | 25.42 | 69.72 | 4.86 |
| B-15 | 22.27 | 77.73 | 20.93 | 73.92 | 5.15 |
| Čp-8 | 31.93 | 68.07 | 30.76 | 64.72 | 4.52 |
| Pkb-1/1/3 | 29.72 | 70.28 | 28.50 | 66.83 | 4.67 |
| Čdp-13/1 | 26.47 | 73.53 | 25.20 | 69.92 | 4.88 |
| Čdp-12/3 | 23.74 | 76.26 | 22.42 | 72.52 | 5.06 |
| Pkb-3/1/3 | 22.13 | 77.87 | 20.79 | 74.05 | 5.16 |
| Pkb-5/1/3 | 19.96 | 80.04 | 18.58 | 76.12 | 5.30 |
| Mp-5 | 19.12 | 80.88 | 17.72 | 76.92 | 5.36 |
| Čp-101 | 16.95 | 83.05 | 15.51 | 78.98 | 5.51 |
| A-2-1 | 14.29 | 85.71 | 12.80 | 81.52 | 5.68 |
| Čdp-8/2 | 14.92 | 85.08 | 13.45 | 80.92 | 5.63 |
| Mm-49 | 45.38 | 54.62 | 44.43 | 51.94 | 3.63 |
| Mm-325 | 42.65 | 57.35 | 41.65 | 54.53 | 3.82 |
| Mm-311 | 38.66 | 61.34 | 37.59 | 58.33 | 4.08 |
| Pzo-8 | 33.82 | 66.18 | 32.67 | 62.93 | 4.40 |
| Mm-333 | 33.61 | 66.39 | 32.46 | 63.13 | 4.41 |
| Mm-320 | 28.15 | 71.85 | 26.91 | 68.32 | 4.77 |
| Mm-322 | 24.37 | 75.63 | 23.06 | 71.92 | 5.02 |
| Mm-330 | 17.44 | 82.56 | 16.01 | 78.52 | 5.47 |
| Mm-319 | 12.82 | 87.18 | 11.31 | 82.92 | 5.77 |
| Mm-32 | 10.50 | 89.50 | 8.96 | 85.12 | 5.92 |
| Pp-18/30 | 31.93 | 68.07 | 30.76 | 64.72 | 4.52 |
| Pp-19 | 22.66 | 77.34 | 21.32 | 73.55 | 5.13 |
| B-5A | 20.10 | 79.90 | 18.72 | 75.98 | 5.30 |
| Pp-23/5 | 34.03 | 65.97 | 32.89 | 62.73 | 4.38 |
| Ž-8 | 46.64 | 53.36 | 45.71 | 50.73 | 3.56 |
| Z-7 | 42.44 | 57.56 | 41.44 | 54.73 | 3.83 |
| Z-4 | 41.18 | 58.82 | 40.16 | 55.93 | 3.91 |
| Sk-18 | 39.08 | 60.92 | 38.02 | 57.93 | 4.05 |
| Sk-16/2 | 31.09 | 68.91 | 29.90 | 65.51 | 4.57 |
| Z-10 | 18.49 | 81.51 | 17.08 | 77.52 | 5.40 |
| Z-13 | 8.61 | 91.39 | 7.04 | 86.91 | 6.05 |
| Vg-4 | 41.60 | 58.40 | 40.58 | 55.53 | 3.88 |
| Vg-11 | 18.07 | 81.93 | 16.65 | 77.92 | 5.43 |
| Vg-10/2 | 11.55 | 88.45 | 10.03 | 84.12 | 5.85 |
| Vg-9 | 9.24 | 90.76 | 7.68 | 86.32 | 6.00 |
| Čp-23 | 0.84 | 99.16 | -0.87 | 94.32 | 6.55 |
| Pz-11 | 18.07 | 81.93 | 16.65 | 77.92 | 5.43 |
| Pz-26 | 25.70 | 74.30 | 24.42 | 70.66 | 4.92 |
| Pz-33 | 29.41 | 70.59 | 28.19 | 67.12 | 4.69 |
Table 4.
Recharge fractions in the spatially different areas of the Zagreb aquifer.
| Grouped Observation Wells | Recharge from the Precipitation (%) | Recharge from the Sava River (%) |
|---|---|---|
| Central part of the City of Zagreb | 29.52 | 70.48 |
| Area of well field Kosnica | 21.92 | 78.08 |
| Area of well field Mala Mlaka | 28.74 | 71.26 |
| Area of well field Petruševec | 27.18 | 72.82 |
| Area of well fields Sašnjak and Žitnjak | 32.50 | 67.50 |
| Area of well field Velika Gorica | 16.26 | 83.74 |
| Area of well field Zapruđe | 24.39 | 75.61 |
Table 5.
Average recharge in different soil types in the area of the Zagreb aquifer.
| Soil Type | Number of Observation Wells | Recharge from the Precipitation (%) | Recharge from the Sava River (%) |
|---|---|---|---|
| Fluvisols | 21 | 25.65 | 74.35 |
| Eutric Cambisols | 8 | 19.75 | 80.25 |
| Urban area | 16 | 29.86 | 70.14 |
© 2019 by the authors. Licensee MDPI, Basel, Switzerland. This article is an open access article distributed under the terms and conditions of the Creative Commons Attribution (CC BY) license (http://creativecommons.org/licenses/by/4.0/).
Share and Cite
MDPI and ACS Style
Parlov, J.; Kovač, Z.; Nakić, Z.; Barešić, J. Using Water Stable Isotopes for Identifying Groundwater Recharge Sources of the Unconfined Alluvial Zagreb Aquifer (Croatia). Water 2019, 11, 2177. https://doi.org/10.3390/w11102177
AMA Style
Parlov J, Kovač Z, Nakić Z, Barešić J. Using Water Stable Isotopes for Identifying Groundwater Recharge Sources of the Unconfined Alluvial Zagreb Aquifer (Croatia). Water. 2019; 11(10):2177. https://doi.org/10.3390/w11102177
Chicago/Turabian StyleParlov, Jelena, Zoran Kovač, Zoran Nakić, and Jadranka Barešić. 2019. "Using Water Stable Isotopes for Identifying Groundwater Recharge Sources of the Unconfined Alluvial Zagreb Aquifer (Croatia)" Water 11, no. 10: 2177. https://doi.org/10.3390/w11102177
Note that from the first issue of 2016, this journal uses article numbers instead of page numbers. See further details here.