Article

Sorption Properties of the Bottom Sediment of a Lake Restored by Phosphorus Inactivation Method 15 Years after the Termination of Lake Restoration Procedures

1
Department of Water Protection Engineering, University of Warmia and Mazury in Olsztyn, Prawocheńskiego St. 1, 10-720 Olsztyn, Poland
2
Laboratory of Hydroacoustics, Inland Fisheries Institute, Oczapowskiego St. 10, 10-719 Olsztyn, Poland
*
Author to whom correspondence should be addressed.
Water 2019, 11(10), 2175; https://doi.org/10.3390/w11102175
Submission received: 3 September 2019 / Revised: 16 October 2019 / Accepted: 17 October 2019 / Published: 19 October 2019
(This article belongs to the Special Issue Lake and River Restoration: Method, Evaluation and Management)

Abstract

:
Artificial mixing and phosphorus inactivation methods using aluminum compounds are among the most popular lake restoration methods. Długie Lake (Olsztyńskie Lakeland, Poland) was restored using these two methods. Primarily, P precipitation and inactivation methods significantly increased the sorption properties of Długie Lake bottom sediment. Fifteen years after the termination of the restoration procedure, the alum-modified “active” sediment layer still has higher P adsorption abilities, which can limit P internal loading. Relatively low amounts of phosphates in the near-bottom water of Długie Lake, even in anoxia, as well as the fact that the assessed maximum sediment P sorption capacity is still higher than NH4Cl–P (labile P) and BD–P (Fe-bound P) sum (“native exchangeable P”), confirm that hypothesis. Among the tested P adsorption models for the sediment, the double Langmuir model showed the best fit to the experimental data (the highest R2 values). This may indicate that phosphorus adsorption by the tested sediments most likely occurs through phosphate binding at two types of active sorption sites. P adsorption by the studied lake sediment during experiments was significantly connected to aluminum content in sediment. The research into the adsorption properties of sediment can be used as a tool for the evaluation of lake restoration effects.

1. Introduction

Currently, one of the biggest environmental problems is the constantly deteriorating surface water quality, resulting from the industrial revolution and a qualitative leap in improving the hygienic conditions of households and the growing human population [1,2]. Water bodies located in the direct vicinity of human settlements have very often been the victims of avalanche degradation resulting from the discharge of untreated municipal or industrial sewage. There have been many cases in the world of urban lakes transforming into hypertrophic and even saprotrophic water bodies [3,4,5,6,7].
In the case of the observed continuous deterioration of water quality in water bodies, the first absolutely necessary actions are to cut off the point sources of nutrients, the treatment of stormwater entering into lake, and the implementation of proper practices in land use (e.g., changes in cropland management practices and the promotion of particular crop types). Particularly, agriculture is a serious nutrient source for lakes and rivers, and in the case of water bodies with huge, agricultural catchments, it is very difficult to maintain good water quality. However, if these actions will be carried out, it is possible to observe a positive influence on lake water quality [8,9,10,11].
It should be emphasized that protective measures in the catchment should be performed before any other technical action directly in the lake bowl. Results should be monitored, and in the case, that such protective measures are not sufficient in the fight against negative eutrophication symptoms, technical solutions should be taken into consideration. This allows us to decrease the costs of the whole technical action [8,9,11]. In many cases, the only chance to stop or to reverse the eutrophication process in degraded lakes is to apply appropriate technical methods in the lake bowl [5,6,7,12,13]. These techniques are defined by Pan et al. [14] and Mackay et al. [15] as geoengineering. The main goal of geoengineering is to manipulate biogeochemical processes in order to obtain the improvement of a lake’s ecological structure and function.
The phenomenon of internal nutrient loading in lakes is a serious barrier that can have a negative impact on the effects of restoration measures [16]. One of the popular methods used for the limitation of internal phosphorus loading is phosphorus inactivation [5,6,12,17].
The principle of this method is the addition of the factor eliminating phosphorus from the lake water and increasing the sediment P sorption capacity. Salts of iron, aluminum, calcium, zirconium or lanthanum are the coagulants used for this purpose. Also, a wide spectrum of solid materials (e.g., naturally occurring minerals or soils, synthetically produced materials, modified clays and soils or industrial by-products) can be used as P adsorbents [18,19]. These compounds can be dosed into lake water, or directly to the water-sediment interface [5,6,12,20,21,22,23,24,25,26]. In the case of degraded lakes in which there is thermal stratification, the anoxia occurring in hypolimnetic water promotes the intensification of the internal loading phenomenon. In such cases, aluminum salts are the most economically attractive option for lake treatment. Aluminum-phosphate complexes are insensitive to changes in redox potential in the anoxic bottom zone, while the main factor destroying aluminum-phosphate complexes is pH change [12,17]. Because of the fact that a phenomenon of sedimentation and the creation of a new layer of bottom sediment continuously occurs, the “active” sediment layer (a product of treatment) is covered with new sediment. Cooke et al. [17], Lewandowski et al. [23] and Rydin [24] maintain that phosphorus bound during inactivation remains permanently buried in the sediment. However, Reitzel et al. [27] and van Hullebush et al. [28] pay attention to the fact that, in shallow lakes, the sediment resuspension together with an increase in pH can dissolute aluminum-phosphate complexes and destroy the “active” layer. However, in stratified lakes the “active” layer should theoretically bind phosphorus under stable pH conditions until the sorption active sites are exhausted.
One of the most important questions in every lake restoration case are: how long its positive effects will persist and what factors can steer that persistence.
Thus, the aims of this study were as follows:
  • To determine the sorption characteristics of Długie Lake sediment;
  • To determine whether implemented lake restoration methods influenced P adsorption by sediment;
  • To determine whether the “active” layer of sediment (enriched with aluminum) produced during restoration (completed in 2003 year) still has a higher sorption capacity in relation to phosphorus.

2. Material and Methods

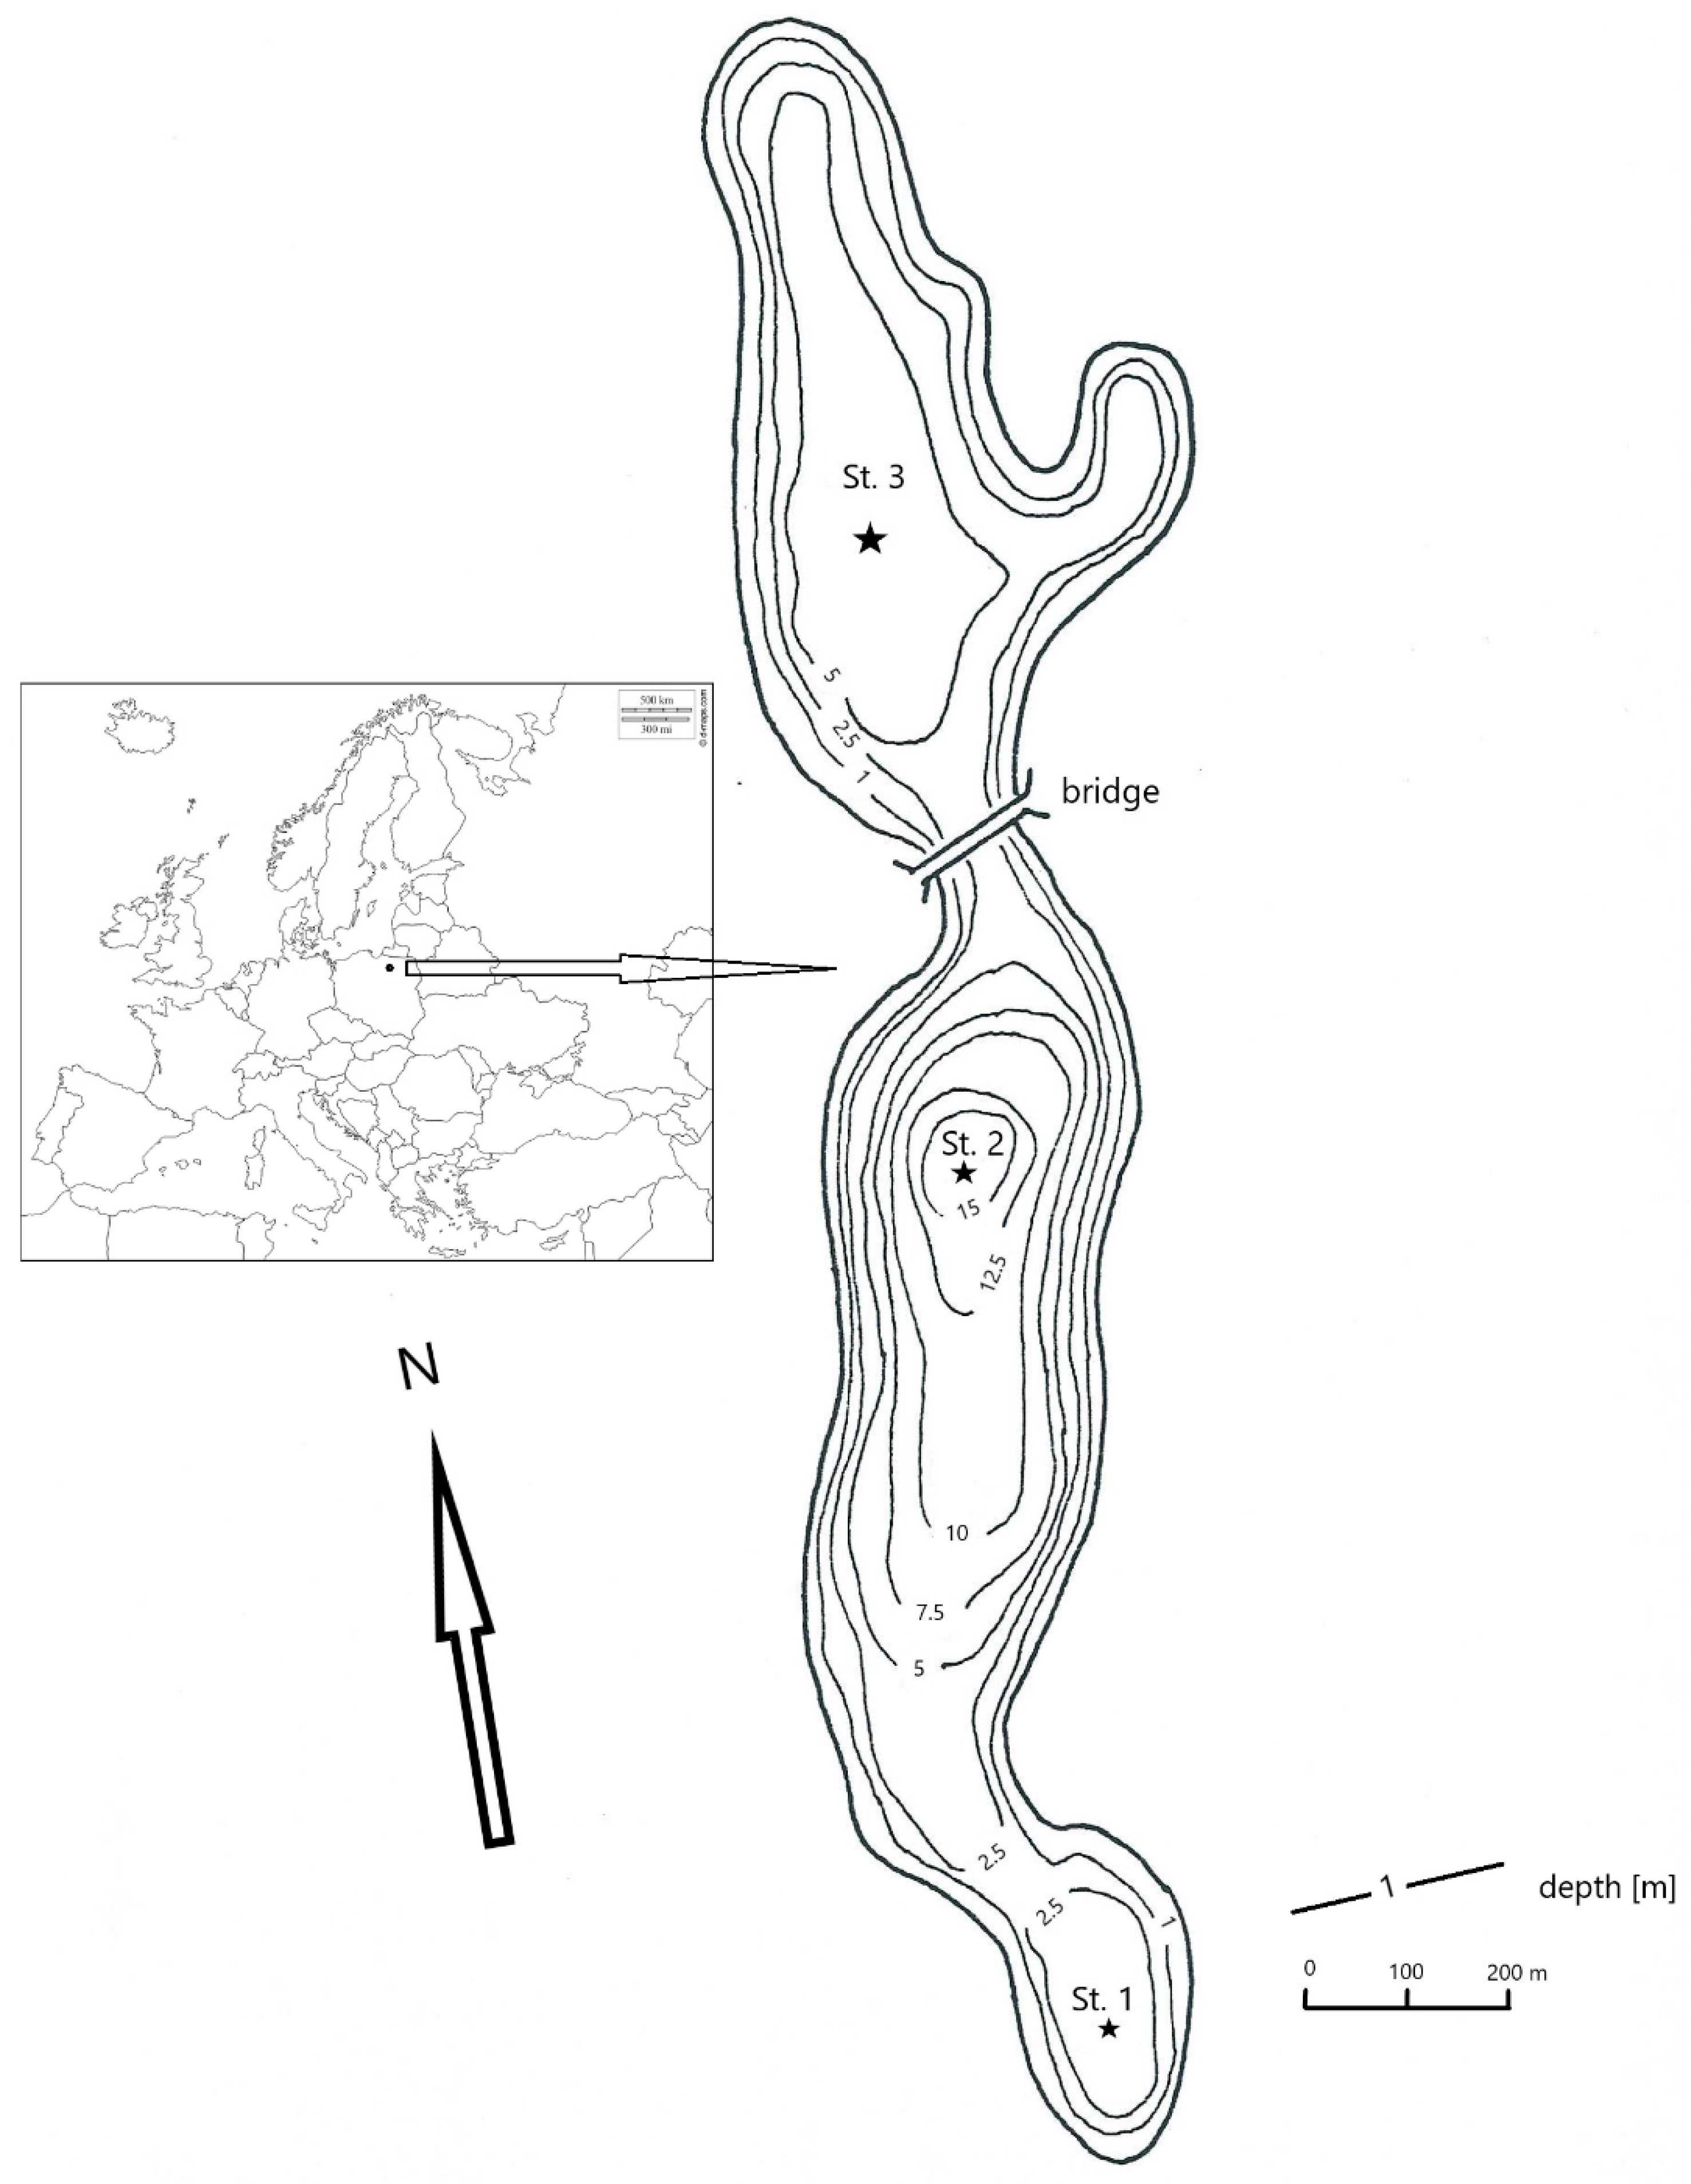
2.1. Lake Description

The object of the study was Długie Lake (area 0.268 km2, max. depth 17.3 m), located in the western part of Olsztyn city (Olsztyńskie Lakeland, Poland). It is a seepage type of lake, without natural inflows and outflows. Długie Lake has been massively polluted by raw sewage input, which occurred in the second half of 20th century for twenty years (1956–1976). As the result of that pollution, the lake was transformed into a saprotrophic lake type [5,6,29]. The sewage inflow cut off (in 1976) did not result in the improvement of lake water quality, because of the internal loading phenomenon taking place in the lake. Then, it was obvious that the implementation of restoration techniques was the only way to obtain better water quality. Two technical restoration methods were successfully applied on Długie Lake: an artificial mixing method with the complete destratification of lake water (1987–1989 and 1991–2000 periods) and phosphorus inactivation method using an aluminum coagulant–polyaluminum chloride PAX 18 (2001–2003 period). The total pure aluminum dose per m2 was equal 20.25 g m−2 [6]. The second restoration technique was supported with biomanipulation (the introduction of predatory fish species such as pike-perch (Sander lucioperca L.) and pike (Esox lucius L.)), which was implemented in cooperation with fishing users of the lake (Polish Angling Association).

2.2. Sampling

Dissolved oxygen content in the near-bottom water was measured using the probe ProOdo YSI Inc. (Yellow Springs, OH, USA).
The undisturbed bottom sediment cores were taken using Kajak’s bottom sampler at November 2018 at three stations, localized at the deepest points of three separated lake parts (St. 1: the shallowest southern basin of the lake; St. 2: the deepest middle part of the lake; and St. 3: the northern basin of the lake) (Figure 1). At every station three cores were taken. Sediment cores (20 cm long) were immediately divided into four layers (0–5 cm, 5–10 cm, 10–15 cm and 15–20 cm). Lake water for further laboratory experiments was taken into 5 dm3 tanks.

2.3. Water Analyses

After transportation to the laboratory sediment samples were subjected to centrifugation (3000 rpm, t = 20 min., MPW-351 centrifuge, MPW Med Instruments, Warsaw, Poland) for interstitial water separation. Water phosphorus forms (mineral, total and organic), nitrogen forms (ammonia, total and organic), iron and manganese were measured (Nanocolor spectrophotometer by Macherey-Nagel (GmbH&Co. KG, Düren, Germany), Spectroquant Prove 100 by Merck (KGaA, Darmstadt, Germany), and IL 550 TOC-TN analyzer by HACH Inc. (Loveland, CO, USA)). Lake water used for experiments was also analyzed (mineral P and total phosphorus (TP) by molybdenum blue method using Nanocolor spectrophotometer by Macherey-Nagel (GmbH&Co. KG, Düren, Germany); pH and conductivity by HQ 40 d multi probe by HACH Inc. (Loveland, CO, USA)).

2.4. Sorption Laboratory Experiment

Two grams of fresh sediment aliquots (in triplicates) were placed in the 50 cm3 Falcon type centrifuge tubes and phosphate solutions (25 cm3) were added (P concentrations of 0.00; 0.15; 0.30; 0.60; 1.20; 2.40 mg dm−3). Two drops of chloroform were added to inhibit bacteria activity [30,31,32]. The centrifuge tubes were shaken in an orbital shaker at 250 rpm (Innova 40 incubator by New Brunswick Scientific Co. Inc., Edison, NJ, USA) at the constant temperature of 20 °C. After 24 h of equilibration, the solutions were centrifuged at 4000 rpm for 10 min (Rotina 420, Andreas Hettich GmbH&Co. KG, Tuttlingen, Germany) and the supernatants were decanted and filtered through a 0.45 um pore filter into clean and dried glass beakers and analyzed for phosphate P. The P adsorbed on sediment samples was calculated using the difference between the initial and equilibrium concentration.

2.5. Estimation of Sorption Parameters

Obtained results were fitted to the Langmuir sorption model,
S =   S m a x ×   k × C 1 + k   C
and double Langmuir model,
S = S 1 × k 1 × C 1 + k 1 × C +   S 2 ×   k 2 × C 1 +   k 2 × C
where:
  • C—phosphorus concentration after the 24-h equilibration procedure (mg dm−3);
  • S—total phosphorus adsorbed by sediment (solid phase), (mg kg−1 dw);
S = S 0 + S
  • S0—native sorbed phosphorus
  • the phosphorus pool, which was desorbed at an initial concentration of 0 mg P dm−3 (mg kg−1 dw);
  • S’— phosphorus amount adsorbed during experiment, (mg kg−1 dw);
  • Smax—maximum sorption capacity of sediment in the Langmuir equation (mg kg−1 dw);
  • k—constant related to bonding energy in the Langmuir equation (dm3 mg−1).
  • S1—maximum sorption capacity of sediment in the double Langmuir equation (type I active sites) (mg kg−1 dw);
  • S2—maximum sorption capacity of sediment in the double Langmuir equation (type II active sites) (mg kg−1 dw);
  • Smax2—the total sorption capacity of sediment in the double Langmuir equation (the sum of S1 and S2 maximum sorption capacities) (mg kg−1 dw)
S m a x 2 = S 1 + S 2
k1, k2—constants related to the bonding energy in the double Langmuir equation (dm3 mg−1).
These equations coefficients (k, Smax, S1, k1, S2, k2, Smax2) were estimated using a non-linear estimation method [33,34,35,36] via the Statistica software package 13.0 (Tibco Software Inc., Palo Alto, CA, USA) [37].
The coefficient of determination R2 was assumed to be the measure of the curve fitting at the determined parameters to the experimental data.
The Freundlich model coefficients also were assessed using the non-linear estimation method [33,34,35,36,37]:
S = K f × C 1 n
where:
  • S, C—as in the Equation (1);
  • Kf—Freundlich sorption constant (dm3 kg−1);
  • 1/n—a constant which characterizes the heterogeneity of the adsorption process.
EPC0 parameter was assessed using the Freundlich equation with correction for desorbed phosphorus (−S0) at the initial experimental concentration (0 mg P dm−3) [38]:
S = ( K f × C 1 n ) S 0
The Gibbs free energy change was calculated using formula [39]:
Δ G a d s = R T ln K d
where:
  • Kd—division coefficient (dm3 kg−1);
  • R—gas constant (J mol−1 K−1);
  • T—temperature (K).

2.6. Sediment Analyses

In non-centrifuged sediment samples the water content and solid matter were measured after drying at 105 °C (Barnstead Thermolyne 62700 Furnace, Barnstead International, Dubuque, IA, USA) until a constant weight was reached.
The sediment chemical composition included organic matter as a loss of ignition at 550 °C after carbonate regeneration (using CO2 saturated deionized water), and carbonates (as CO2) after ignition at 1000 °C (Barnstead Thermolyne 62700 Furnace, Barnstead International, Dubuque, IA, USA). The sediment samples were mineralized with a mixture of H2SO4, HClO4 and HNO3 (1 + 2 + 3). After mineralization, the sample was filtered through ash-free filter No 390. The remains on the filter were treated as silica and mineralized at 900 °C. In the filtrate the consecutive parameters were measured spectrophotometrically (Spectroquant Prove 100 by Merck KGaA, Darmstadt, Germany): iron, aluminum, manganese, calcium, magnesium. Total nitrogen (TN) was analyzed by Kjeldahl method (using a BÜCHI K-425 unit, B-24 distillation unit, BÜCHI Labortechnik AG, Flawil, Switzerland).
Sediment phosphorus fractions were analyzed according to scheme proposed by [30]. Mineral P content in the extracts was analyzed with the molybdenum blue method (Nanocolor spectrophotometer by Macherey—Nagel, GmbH&Co. KG, Düren, Germany)

3. Statistical Analysis

The results were subjected to statistical analysis using the Statistica 13.0 Software package [37]. The multiple regression analysis [40] was performed in order to identify chemical factors (independent variables—bottom sediment chemical components: Si, organic matter, Fe, Al, Mn, Ca, Mg, Mn), which are significantly connected to the estimated sorption parameters (dependent variables: Smax, k, S1, k1, S2, k2, Smax2, 1/n, Kf, EPC0, S0). That analysis allowed to obtain the linear models type:
Y =   B 0 ± B 1     X 1   ±   B 2     X 2   ±   ±   B i     X i +   E i j
where:
  • Y—dependent variable (in the present research, the particular sorption characteristic in the Freundlich, Langmuir or double Langmuir model);
  • B0—constant (intercept);
  • B1Bi—regression coefficients;
  • X1Xi—independent variables (bottom sediment chemical components: Si, organic matter, Fe, Al, Mn, Ca, Mg, Mn);
  • Eij—residual component;
  • R—multiple correlation coefficient;
  • R2—multiple determination coefficient.
All results were subjected to log transformation in order to approximate of the data to the normal distribution.

4. Results

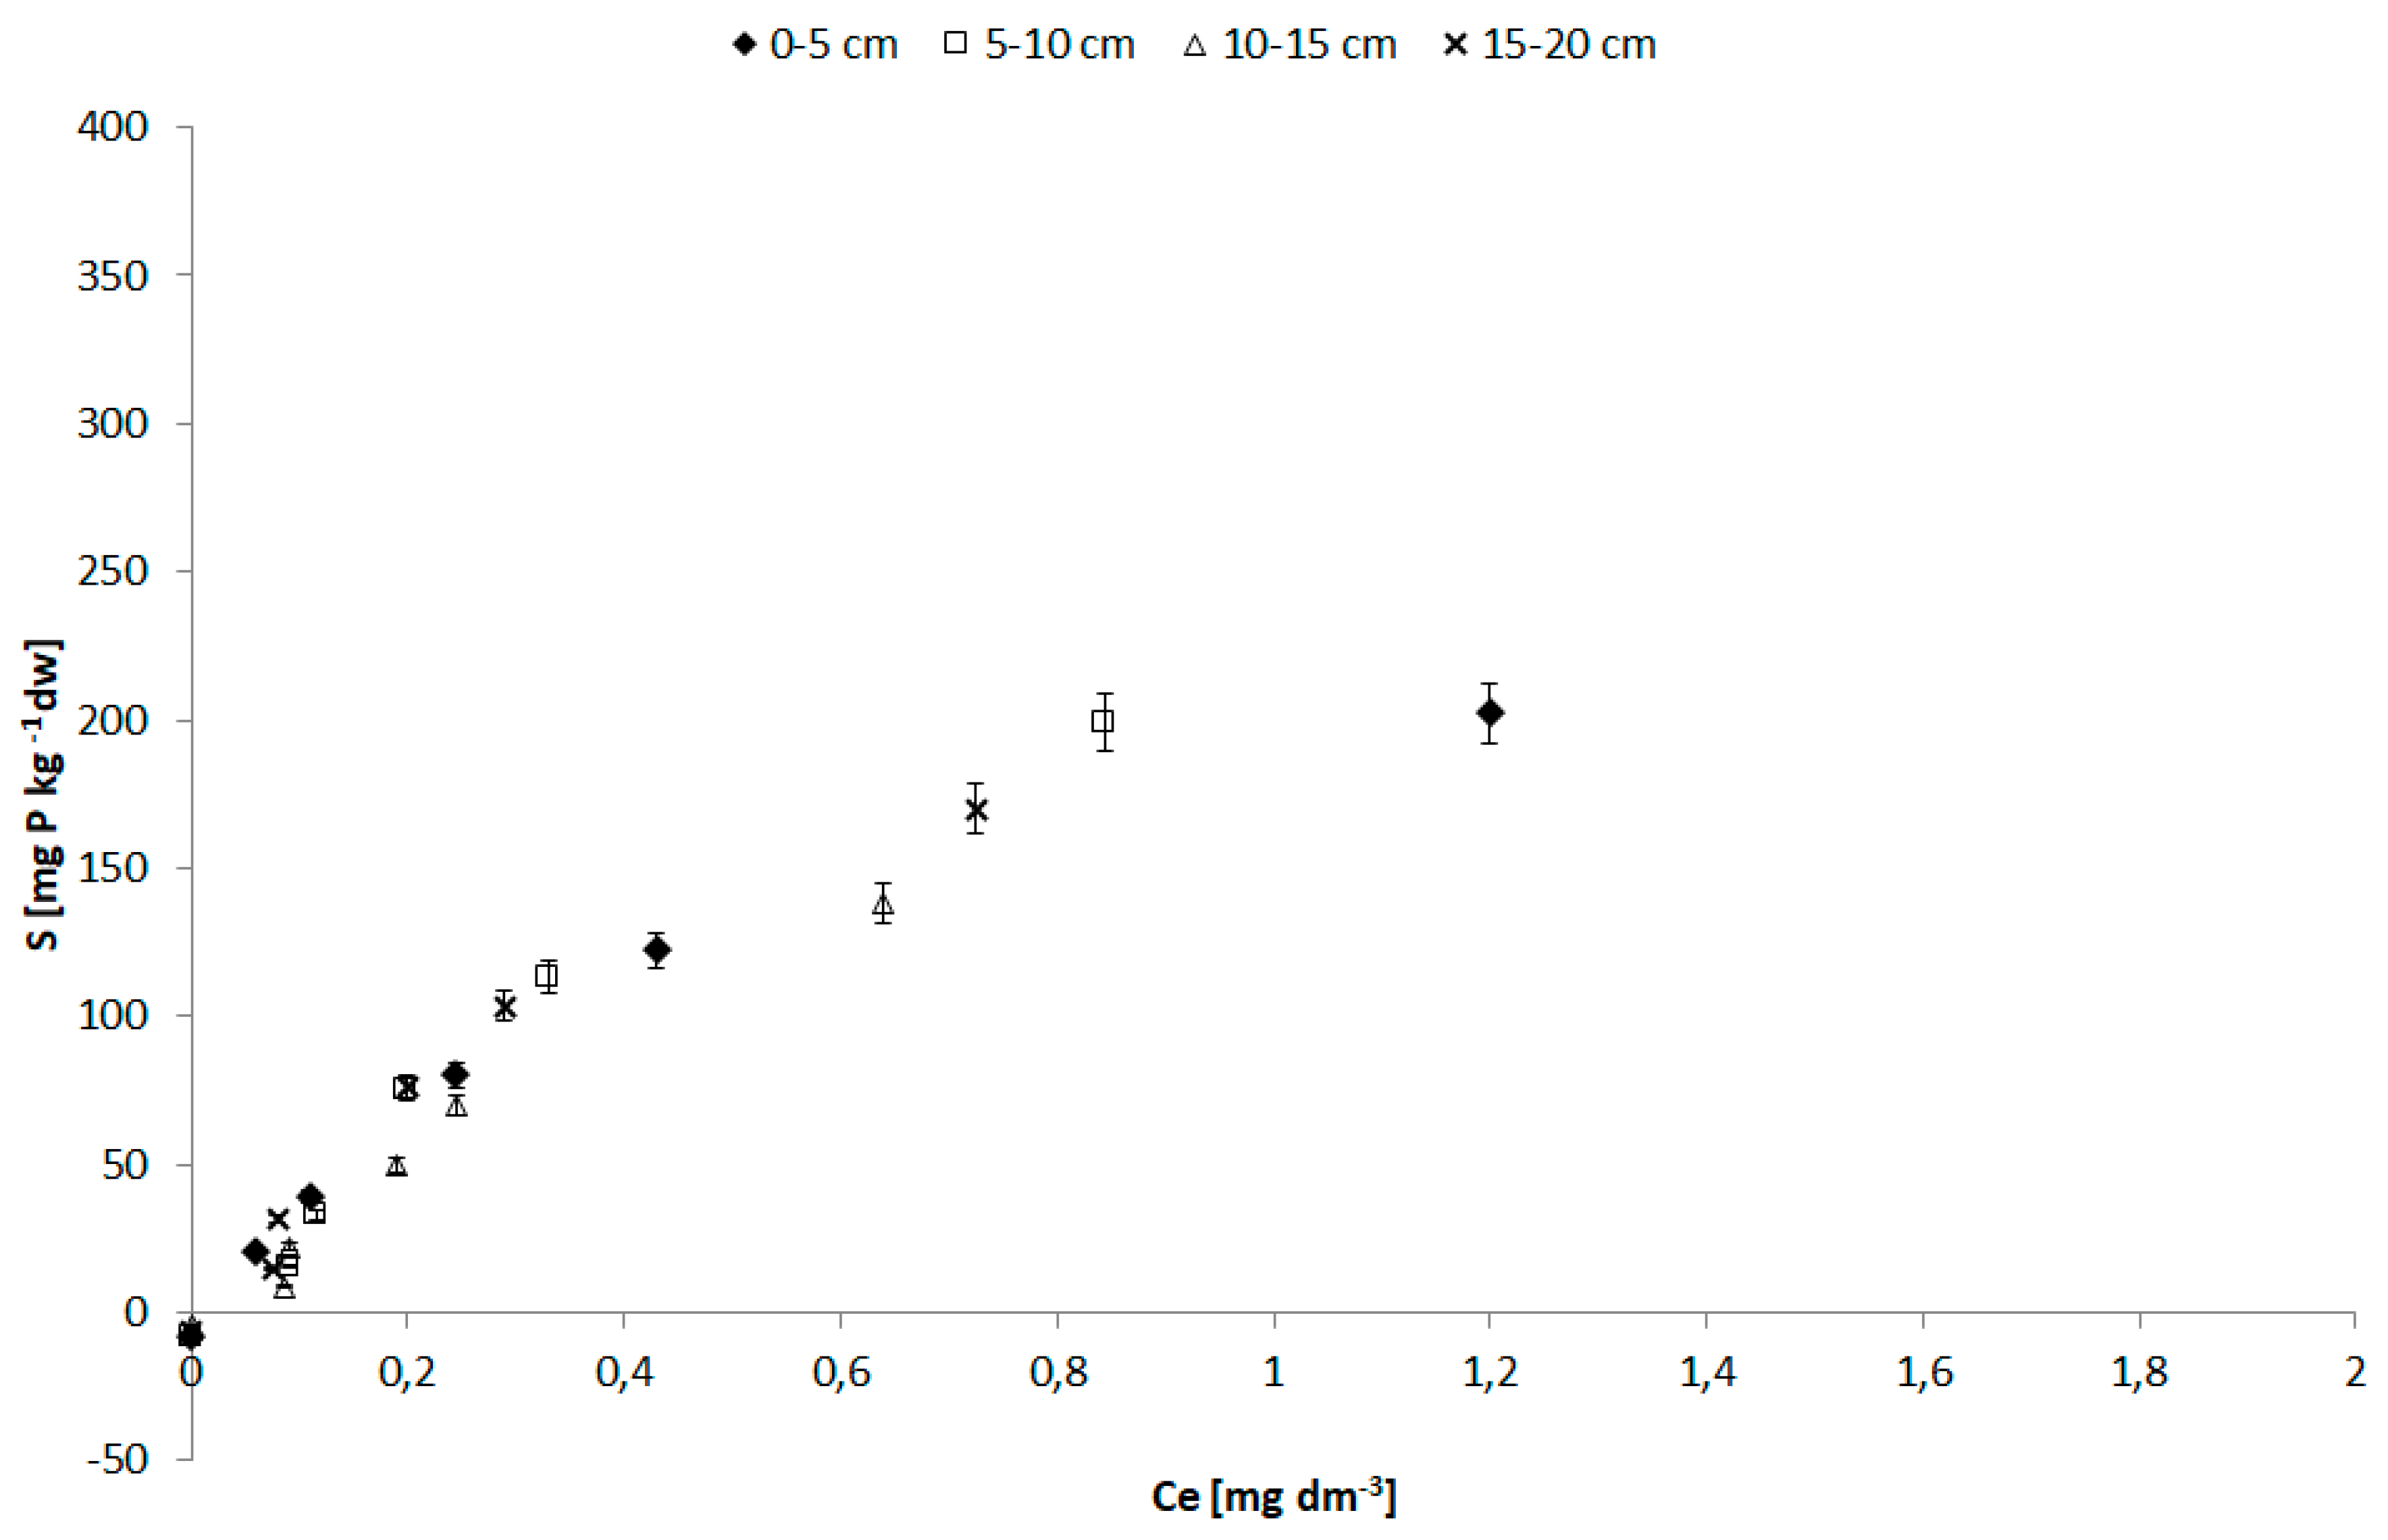
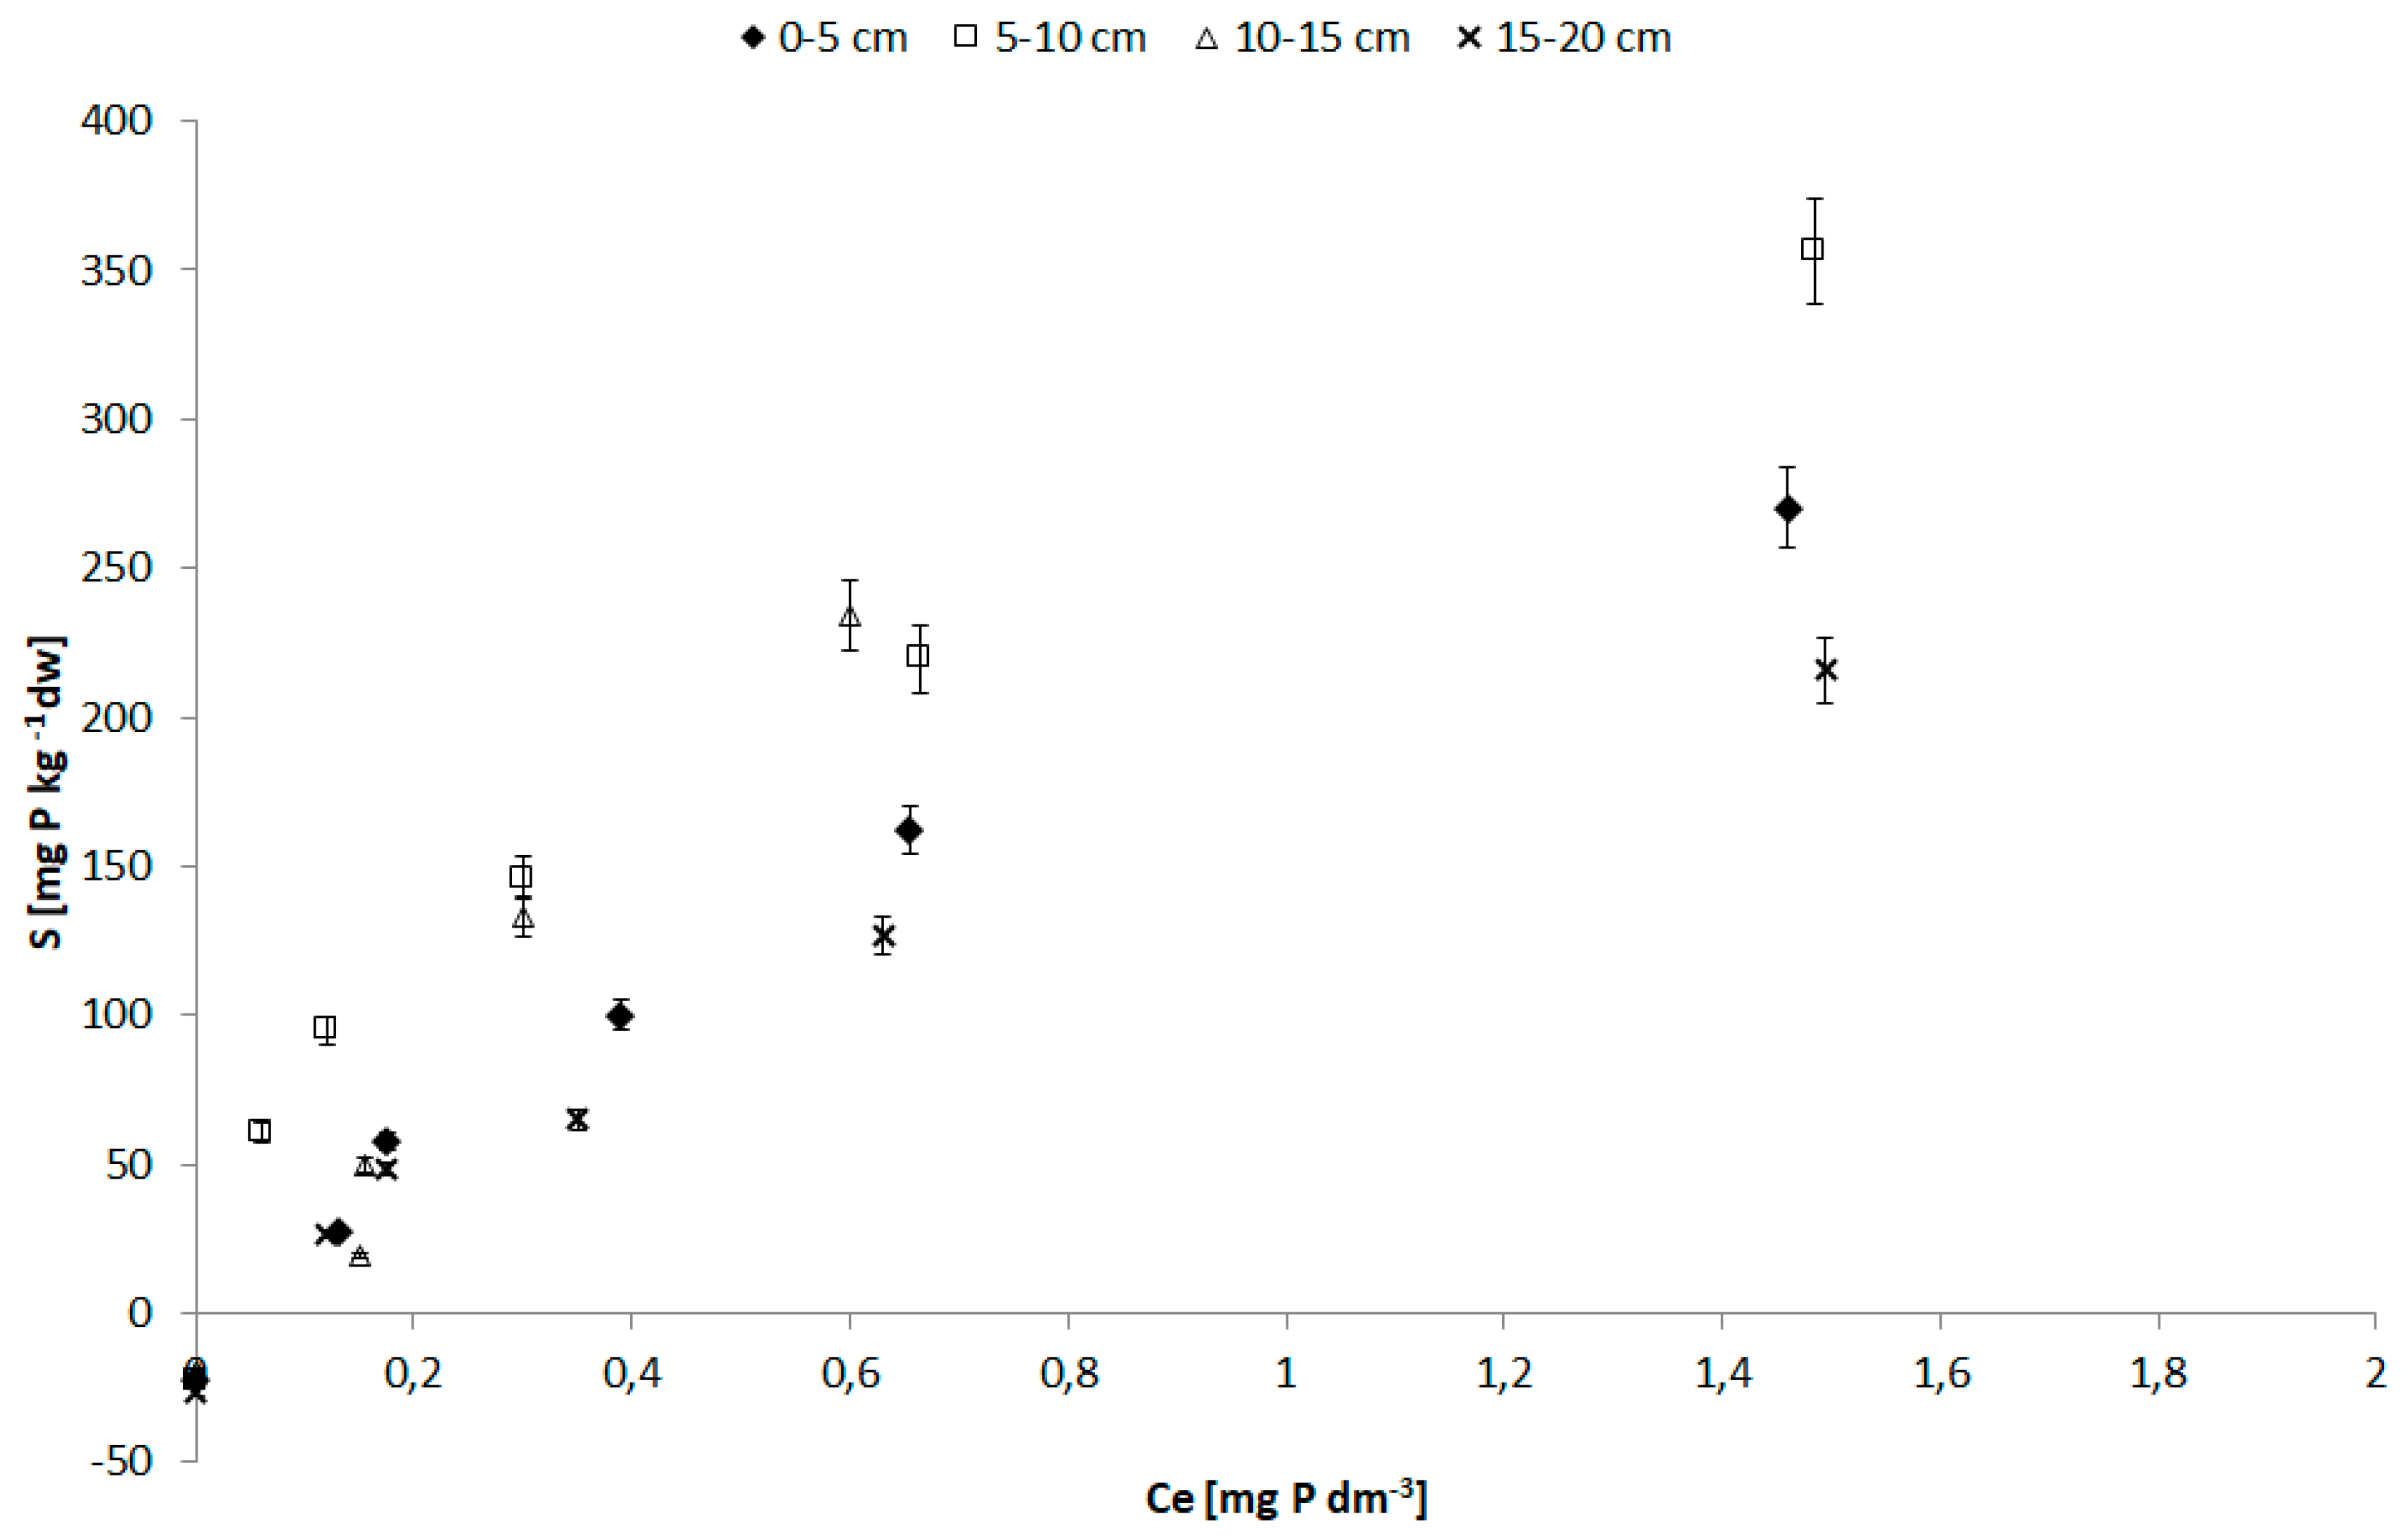
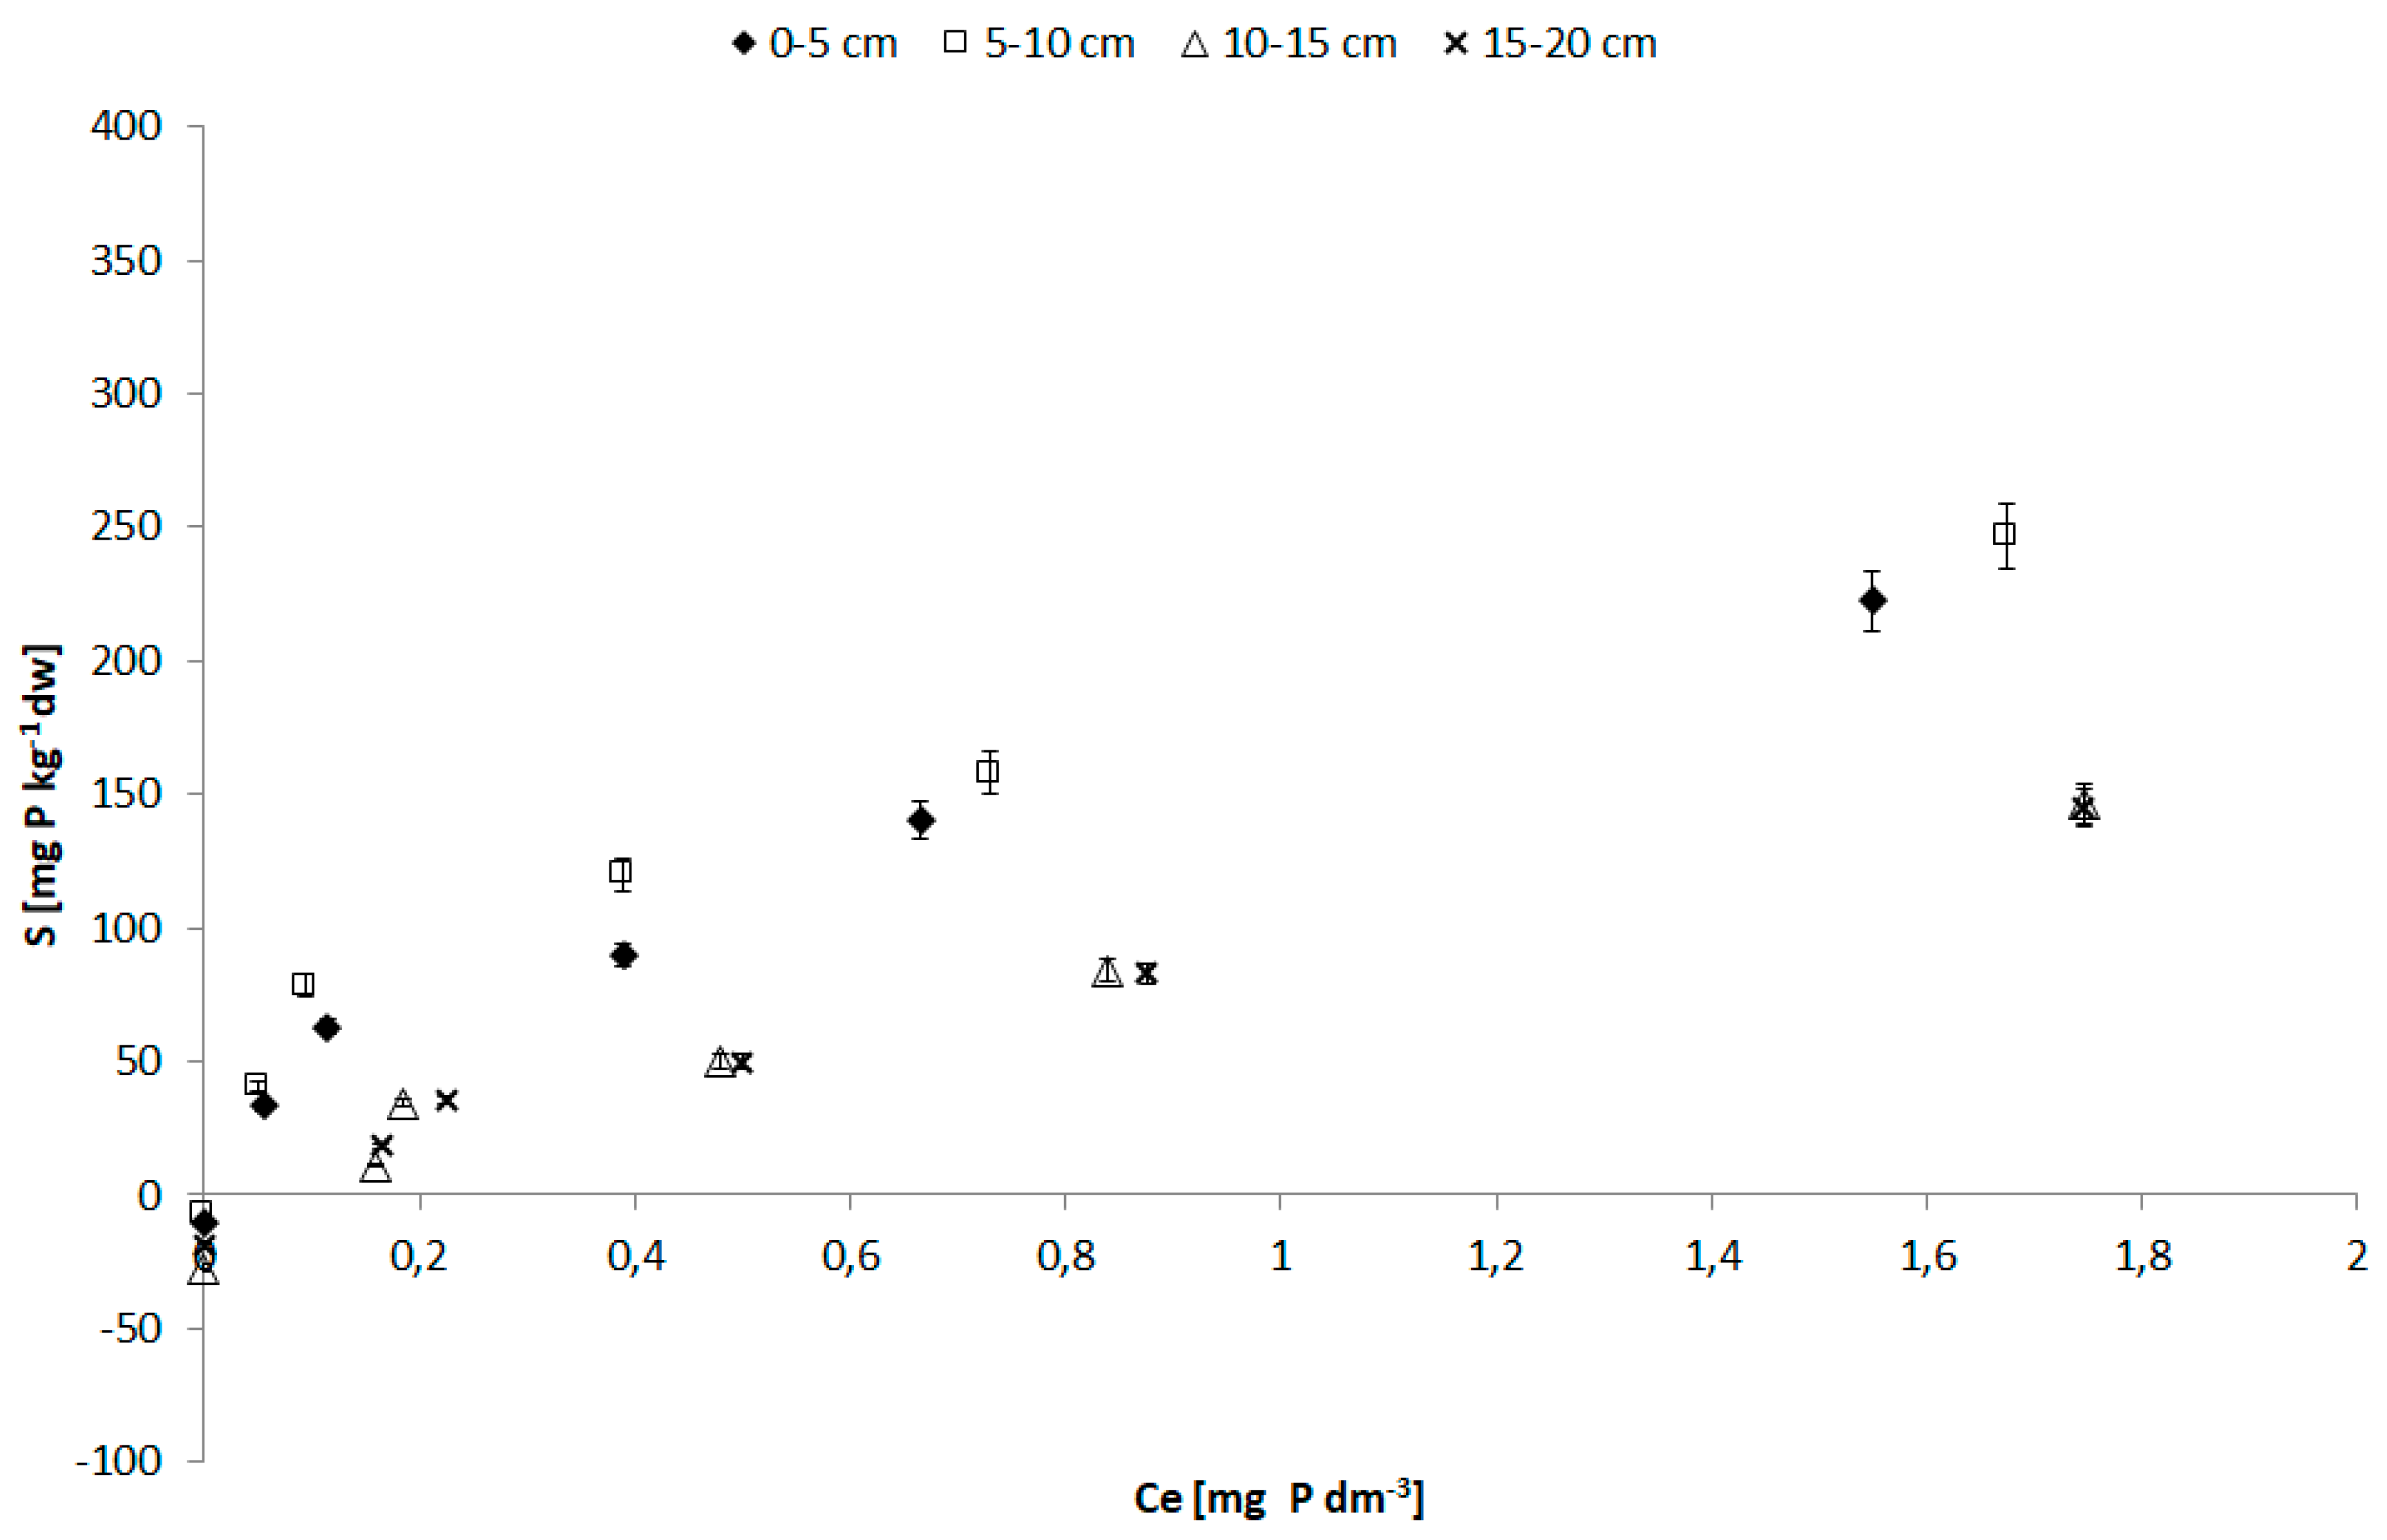
4.1. Sorption Parameters
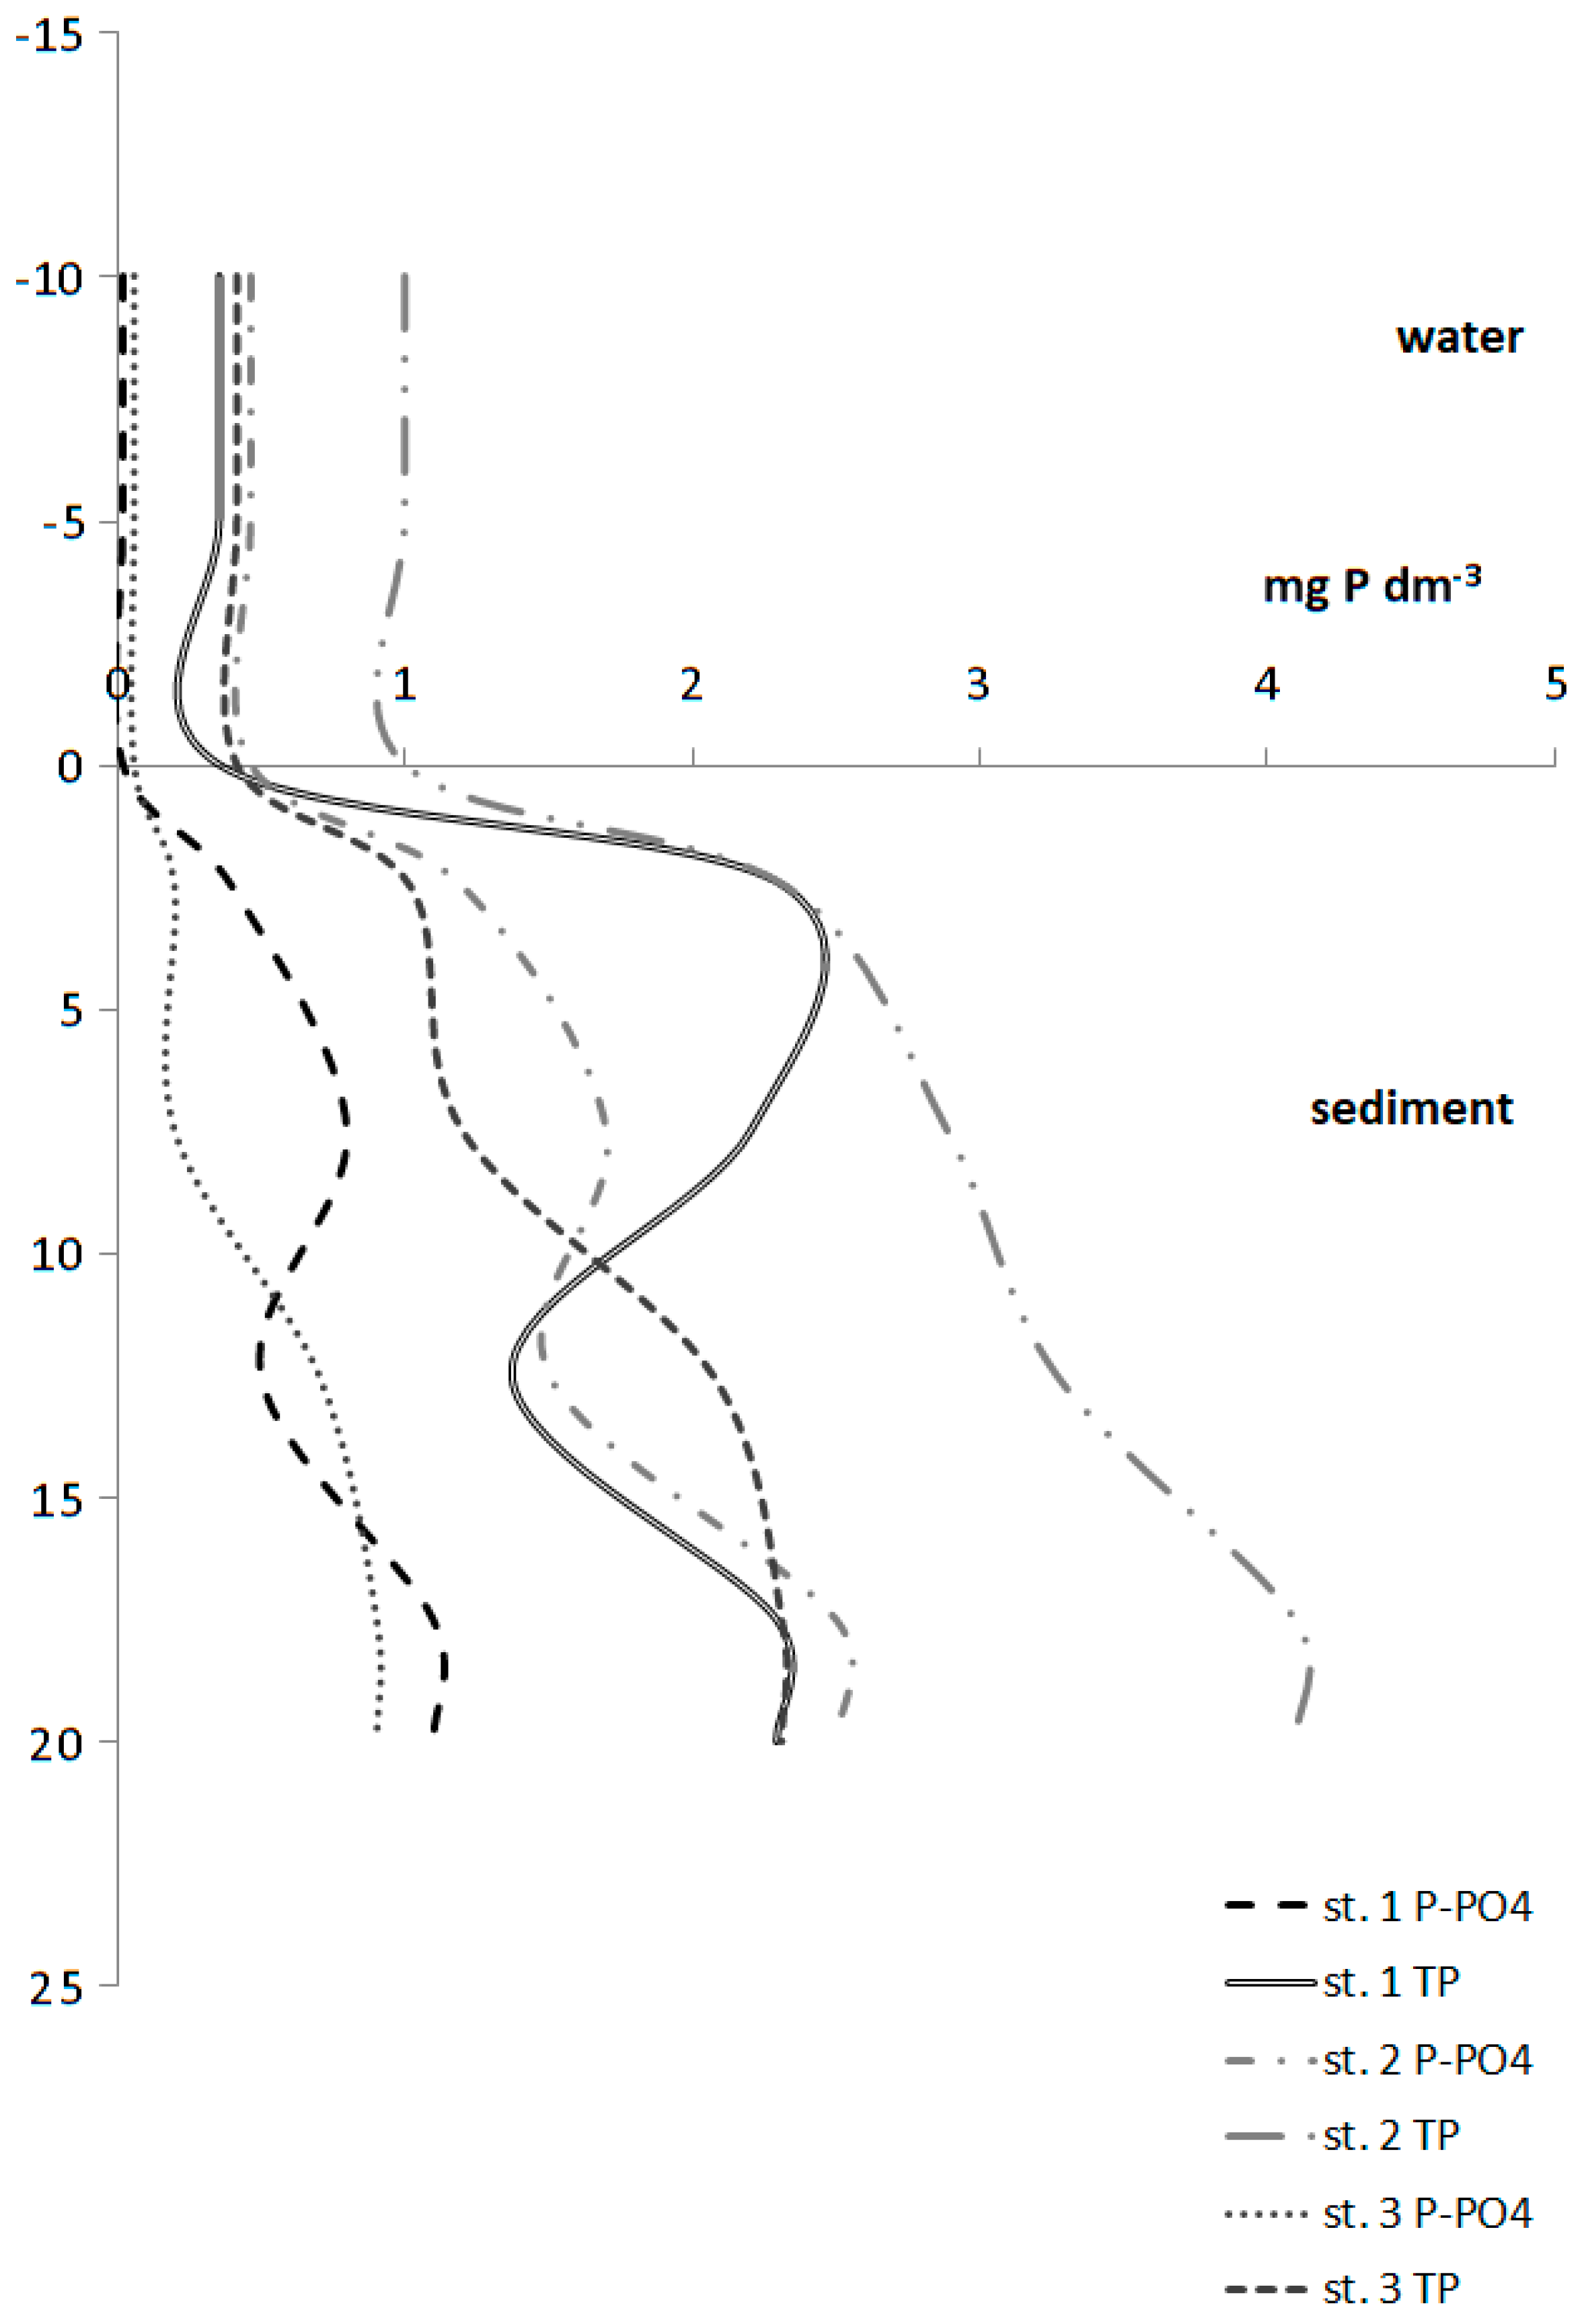
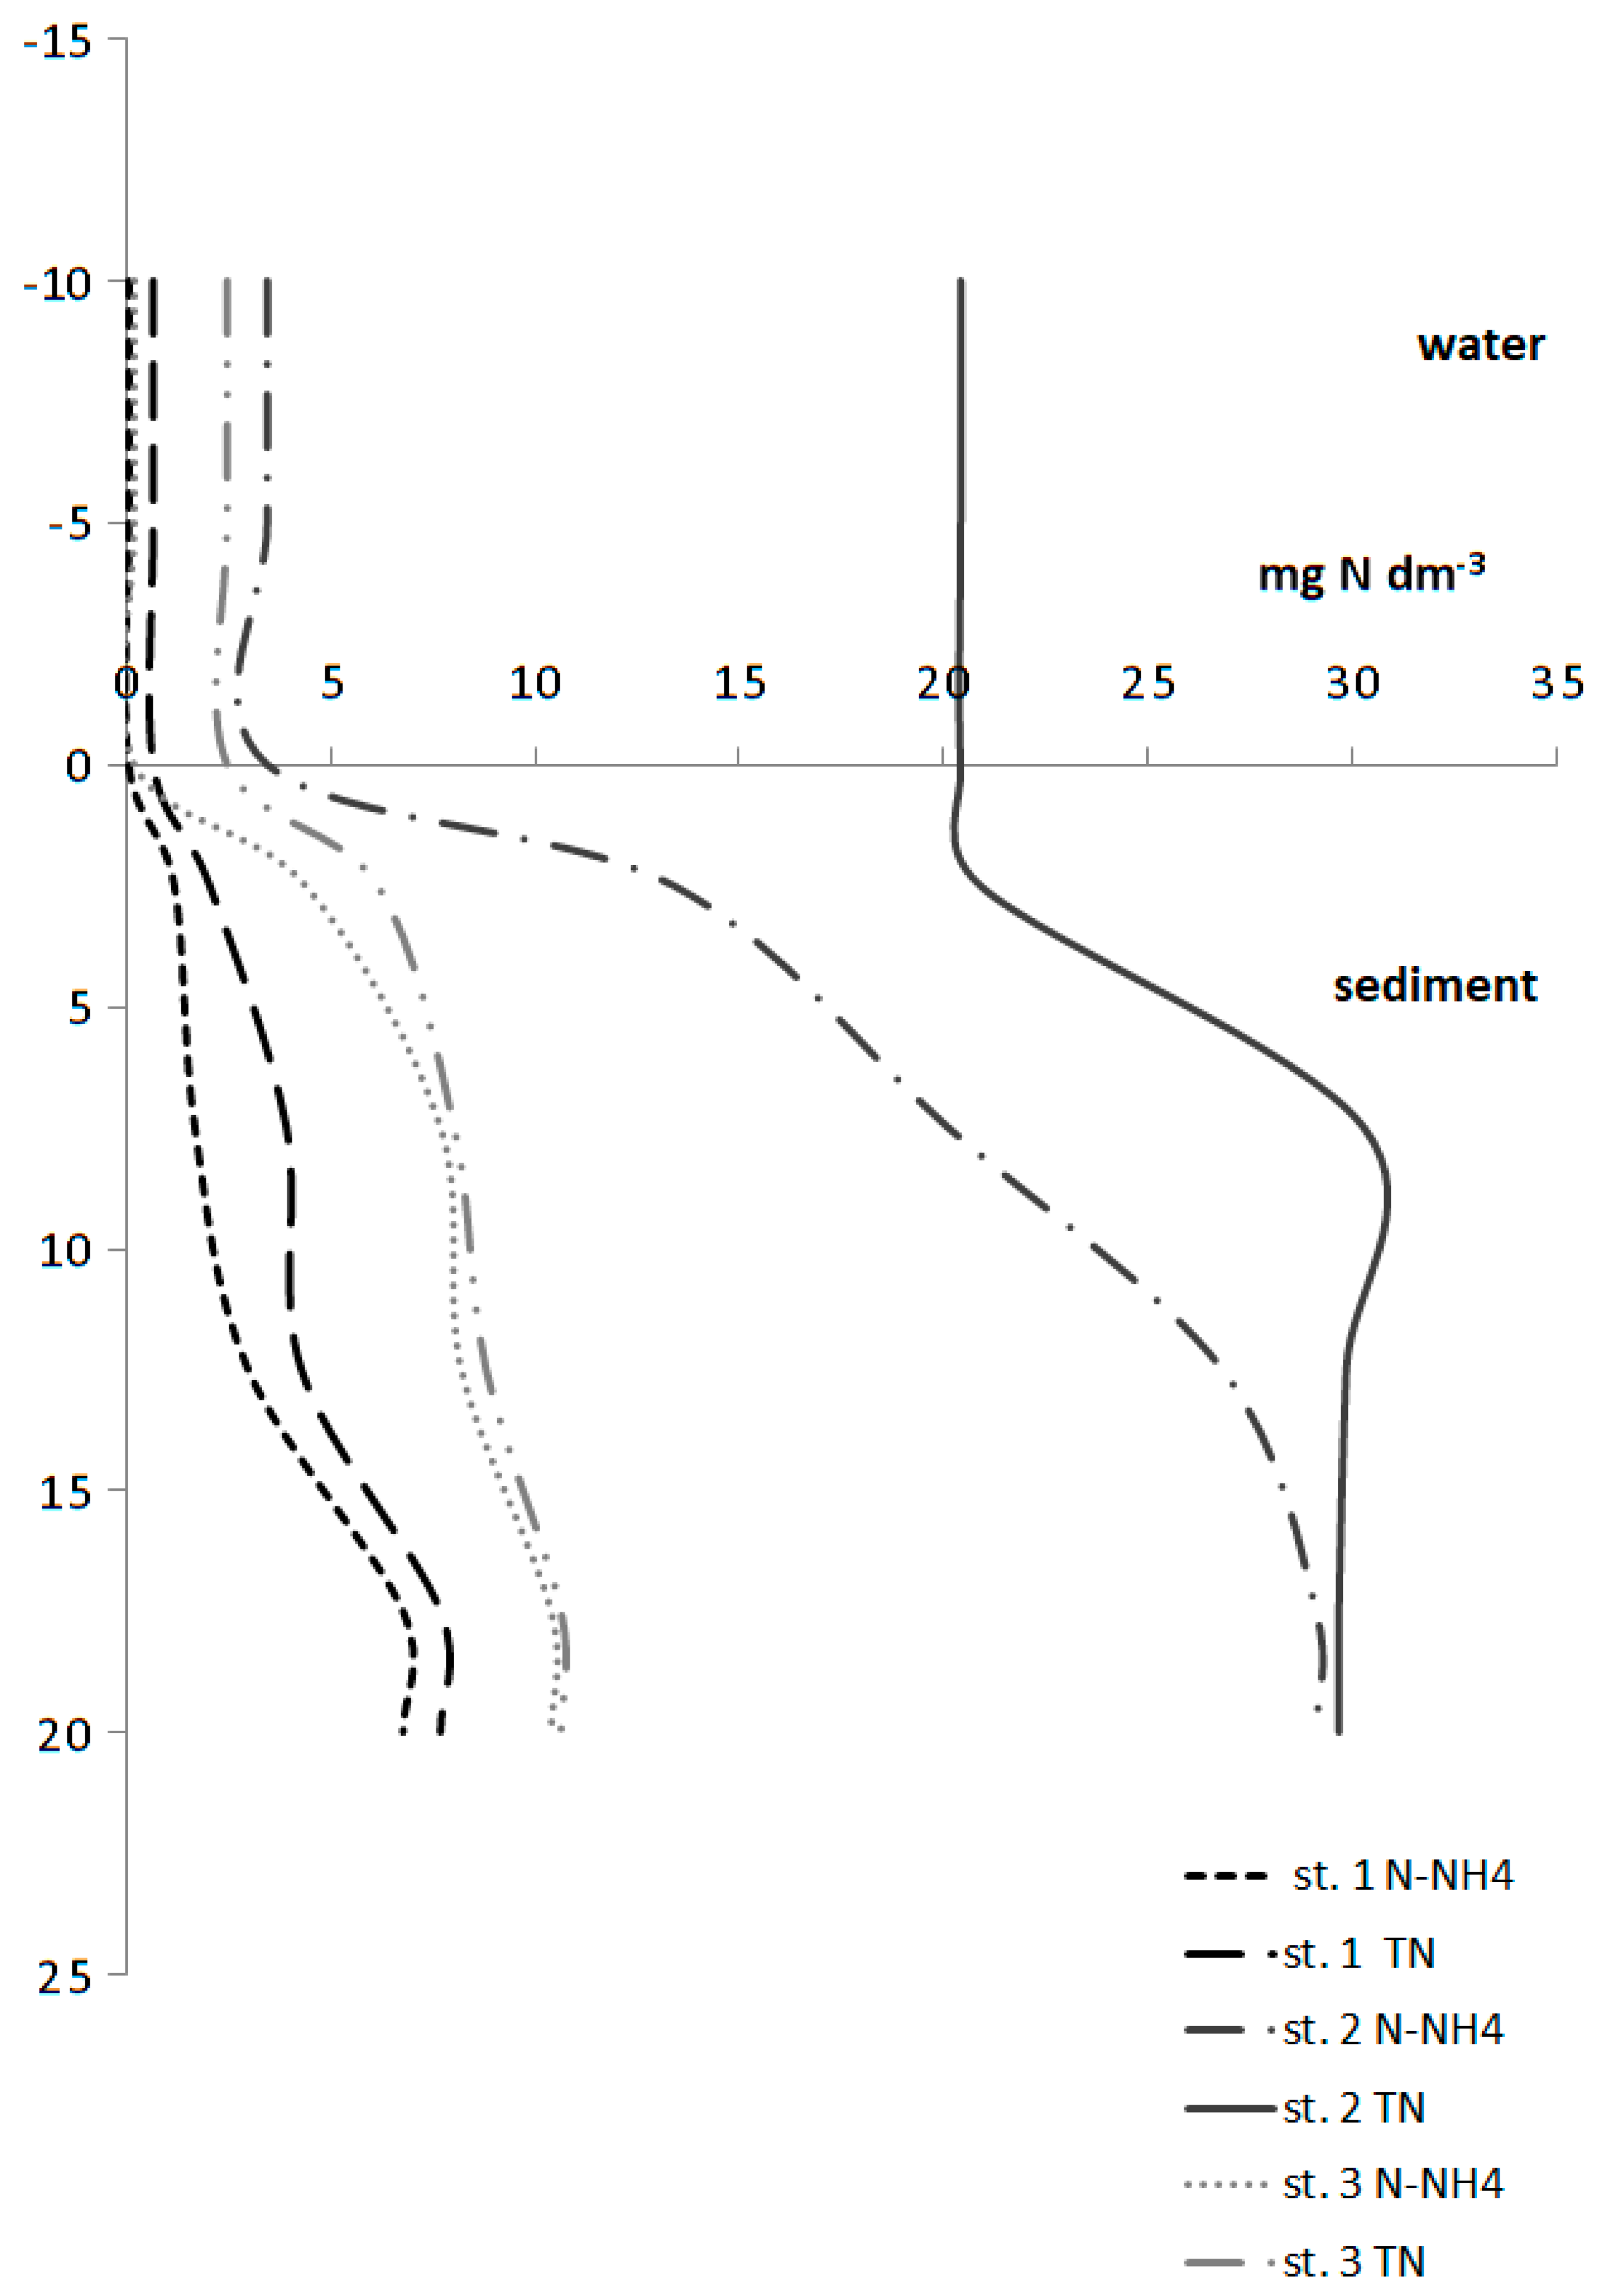
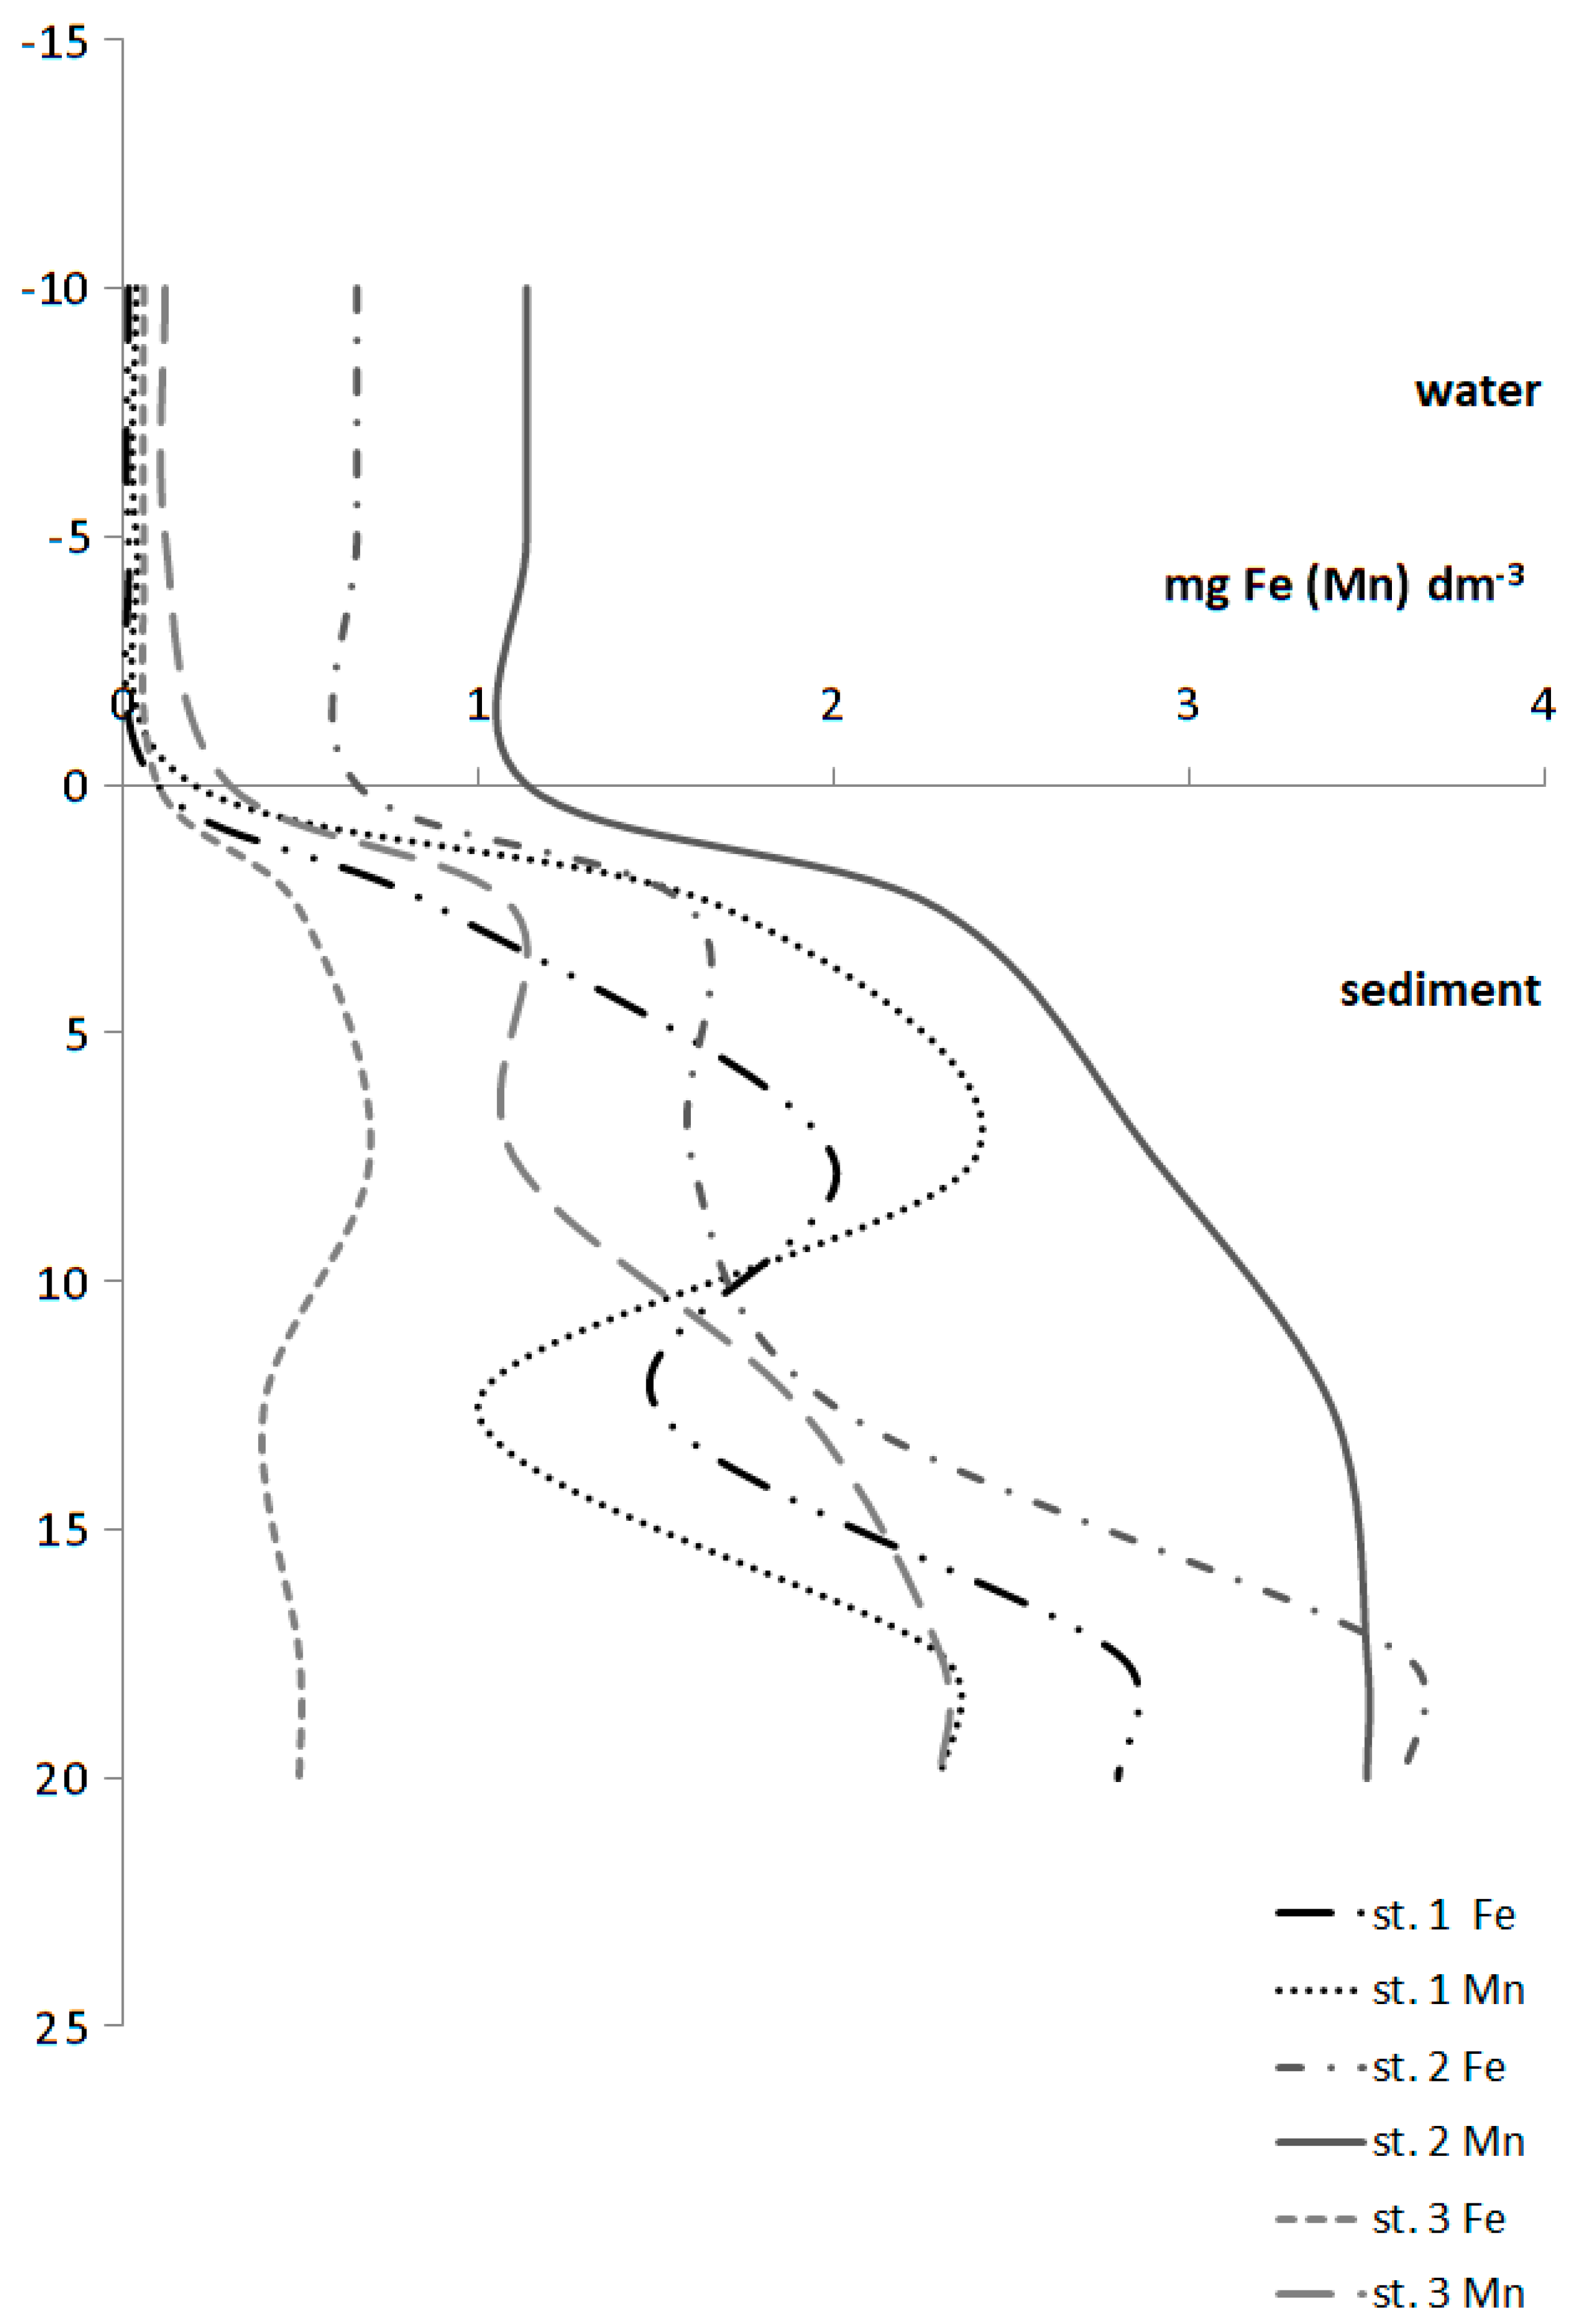
The relationship between the equilibrium concentration (Ce) and the amount of adsorbed phosphates is shown in Figure 2, Figure 3 and Figure 4. The amount of adsorbed phosphorus (S) increased with increasing concentrations of equilibrium phosphorus (Ce). The surface layer of the sediment usually showed a greater sorption capacity than the deeper layers. The largest amount of phosphates was adsorbed by sediments from the layer of 5–10 cm at Station 2—356.39 mg P kg−1 dw, while the weakest sorption capacity with respect to phosphorus was shown by sediment taken at St. 1—202.47 mg P kg−1 dw (sediment layer 0–5 cm).
The obtained real adsorption results fitted well to all tested adsorption models. The values of the determination coefficient R2 were in the range from 0.93 (Freundlich model for sediment layers, 10–15 cm and 15–20 cm; and double Langmuir model for sediment layer, 10–15 cm at St. 1) to 1.00 (double Langmuir model for sediment layer, 0–5 cm, St. 1). The double Langmuir model usually showed the best fit to experimental data, in that R2 values usually were higher for that model than for two other models (Table 1 and Table 2).
The values of the maximum P sorption capacity (Smax) obtained from the Langmuir model were varied. The highest value of Smax (524.2 mg P kg−1 dw) was noted for the sediment layer 15–20 cm (St. 2) (Table 1). The sediment taken at St. 3 had the lowest Smax (between 241.7 and 279.0 mg P kg−1 dw) (Table 1). Also, k coefficient values (the constant from Langmuir equation referring to the binding energy, expressed in dm3 mg−1) were varied, but generally the highest values were observed for the surficial sediment layers (0–5 cm) at all three research stations. The highest k value was calculated for sediment taken at St. 3 (3.74 dm3 mg−1 - sediment layer 0–5 cm), whilst the lowest −0.62 dm3 mg−1—at St. 1 (sediment layer 10–15 cm) (Table 2).
The values of the correction factor from the Freundlich equation (1/n), which characterize the heterogeneity of the adsorption process ranged from 0.4276 (St. 3, sediment layer, 0–5 cm) to 0.8476 (St. 1, sediment layer, 10–15 cm) (Table 2). The minimum value of the partition coefficient from the Freundlich equation (Kf) was assessed for bottom sediment taken at St. 3 (sediment layer 15–20 cm) and it amounted to 116.0 dm3 kg−1, whilst the maximum Kf value was calculated for the surficial sediment layer, (0–5 cm) taken at the deepest St. 2 (309.7 dm3 kg−1) (Table 2).
The assessed P equilibrium concentration (EPC0) ranged from 0.001 mg P dm−3 (St. 3, sediment layer, 0–5 cm) to 0.059 mg P dm−3 (at the same station, sediment layer, 10–15 cm).
“Native sorbed phosphorus” (S0) values were the highest for sediment layer 10–15 cm taken at St. 3—27.36 mg kg−1 dw—and the lowest for sediment taken at St. 1 (sediment layer 10–15 cm)—4.62 mg kg−1 dw.
Assessed mean Gibbs’ free energy change values were negative and ranged from −11.23 kJ mol−1 (St. 3, sediment layer, 15–20 cm) to −15.17 kJ mol−1 (St. 2, sediment layer, 0–5 cm). They often increased with sediment depth (Table 2).
The conductivity, pH, and phosphate concentration of the lake water used for experiments were 260 µS cm−1, 7.71, and 0.007 mg P–PO4 dm−3, respectively. These values were taken into consideration during the experiment’s final results calculation.
The multiple regression analysis [40] was performed in order to identify sediment chemical components (especially Al content, as a factor used for lake restoration), which are significantly connected to estimated sorption parameters. The results are shown in Table 3. The sorption characteristics were dependent on OM, Fe, Mn, Si and Mg. The sorption capacities from Langmuir models (Smax, S2 and Smax2) were significantly dependent on Al content in sediment. Also, the constants 1/n, k2 and EPC0 parameter were significantly connected to Al content in sediment (Table 3).

4.2. Water

During the research, dissolved oxygen was present in the near-bottom water at two shallow stations (9.5 mg O2 dm−3 at St. 1 and 9.6 mg O2 dm−3 at St. 3), whilst anoxia was noted at the deepest part of Długie Lake (St. 2).
The phosphorus form concentration in the water medium of the water—sediment interface was different at particular research stations. At two shallow stations (St. 1 and St. 3), the noted concentration of TP, min P and org P was lower than at the deepest St. 2. The minimum TP value was observed at St. 3 (1.02 mg P dm−3, surficial layer 0–5 cm) whilst the maximum TP amount (4.1 mg P dm−3) was noted at the deepest layer of analyzed water (15–20 cm) (Figure 2). The organic P form dominated quantitatively in the near-bottom water at all three research stations and in interstitial water at two shallow stations (St. 1 and 3). The mineral P form share was generally higher in the interstitial water at St. 2. It is worth noting that the clear decrease of P concentration (both P forms—mineral and organic) occurred in the layer of 10–15 cm at the St. 1 and 2, whilst concentration rose with the sediment depth at St. 3 (Figure 5).
Nitrogen compound concentrations were varied at the research stations. At the deepest St. 2, the nitrogen concentration in near-bottom water was the highest (20.43 mg N dm−3), and it was much lower at the two shallow stations (0.68 mg N dm−3 and 2.50 mg N dm−3 at St. 1 and 3, respectively). In the near-bottom water, the organic form of N quantitatively dominated, whilst the share of mineral N (ammonia) rose with the sediment depth in the interstitial water at all research stations. The TN concentration observed in the interstitial water was the highest at the deepest Station 2 (max 30.3 mg N dm−3, layer 5–10 cm), and the lowest TN amount occurred at St. 1 (min 2.06 mg N dm−3, layer 0–5 cm) (Figure 6).
Fe and Mn amounts observed in the water–sediment interface ranged from 0.02 mg Fe dm−3 and 0.04 mg Mn dm−3 (near-bottom water at St. 1) to 3.60 mg Fe dm−3 and 3.50 mg Mn dm−3 (interstitial water at St. 2, layer 15–20 cm) (Figure 7).

4.3. Sediment Chemical Composition

The sediment of Długie Lake was highly hydrated: the percentage of dry weight was mainly below the level of 10% dw (except for the two deeper sediment layers at St. 1, at 15.59% dw and 11.24% dw) (Table 4). This can be classified as the mixed silica–organic type (St. 1) and organic–silica type (St. 2). The share of organic matter exceeded 50% dw at St. 3 only (except the deepest sediment layer 15–20 cm), and in general, the sediment can be classified as organic type. The rest of the analyzed components occurred in low amounts, not exceeding several percentage of dw (Table 4). The aluminum content, particularly considered as a factor used for phosphorus inactivation, was the highest in the deeper sediment layers (10–15 cm at St. 1 and 2 and 5–10 cm at St. 3), whilst the maximum Al content was noted in sediment taken at St. 3 (18.95 ± 1.72 mg Al g−1 dw in the layer 5–10 cm) and St. 2 (18.90 ± 1.33 mg Al g−1 dw in the layer 10–15 cm) (Table 4).

4.4. Phosphorus Fractions

The total phosphorus content in the bottom sediment of Długie Lake was high and ranged from 3.786 ± 0.210 mg P g−1 dw (St. 1, sediment layer 0–5 cm) to 6.505 ± 0.220 mg P g−1 dw (St. 2, sediment layer 10–15 cm). The largest pool of sediment P was stored as a NaOH–nrP fraction (phosphorus bound to organic matter). The maximum amount of this P fraction was noted for sediment on St. 2 (2.338 ± 0.043 mg P g−1 dw, 35.9% TP, sediment layer 10–15 cm), whilst the lowest of NaOH–nrP amount occurred at St. 1 (0.862 ± 0.012 mg P g−1 dw, 22.7%TP, sediment layer 15–20 cm). The NaOH–rP fraction (P bound mainly to Al) was the second P fraction in terms of quantity. Its maximum amount was noted at St. 2 (2.298 ± 0.073 mg P g−1 dw, 35.3%TP, sediment layer 10–15 cm) and the lowest was in the surficial sediment layer (0–5 cm) at the St. 3 (0.612 ± 0.007 mg P g−1 dw). The HCl–P and res–P fractions included from 11.5%TP to 28.3%TP and from 10.6%TP to 26.3%TP, respectively. The most mobile P fractions (NH4Cl–P and BD–P) occurred in the smallest amounts among the all P fractions, occupying ca. 1%TP and 2.4–3.6% TP, respectively.

5. Discussion

Artificial mixing was the first method of restoration, which was implemented on Długie Lake [5,6,29]. The direct impact of this method on the bottom zone was the improvement oxic conditions in the near-bottom water of aerated parts of Długie Lake (St. 2 and 3). Oxygen presence in that water stratum favored P binding by the sediment (the TP in water decreased and an increase of sediment TP was also observed, especially in the first period of aeration) [29]. Long-term artificial mixing caused the depletion of iron and manganese in the lake water, and this phenomenon was the limit for further P removal from Długie Lake water. In the present study, this stage of Długie Lake restoration was represented in the deepest layer of analyzed sediment cores (15–20 cm). The observed values of the sorption capacity of this sediment layer were mainly the lowest (Figure 2, Figure 3 and Figure 4), and this was caused probably by diagenetic processes, which limit the direct P adsorption abilities [41].
The restoration of Długie Lake by the phosphorus inactivation method with the use of polyaluminum chloride PAX 18 caused an increase in the aluminum content in bottom sediment at all sites studied. Before P inactivation, Al amounts in sediment did not exceed ca. 12–14 mg Al g−1 dw [42]. Maximum amounts of this element were detected in the sediment layer 10–15 cm (14.57 ± 0.89 mg Al g−1 dw and 18.90 ± 1.33 mg Al g−1 dw at St. 1 and 2, respectively) and 5–10 cm (18.95 ± 1.72 mg Al g−1 dw at St. 3) (Table 4). This fact is in accordance with observations by other authors [17,23]. Sediments from these layers also had the highest NaOH–rP fraction contents (phosphorus bound to aluminum oxides and hydroxides: 1.028 ± 0.008, 2.298 ± 0.073 and 0.735 ± 0.003 mg P g−1 dw, at St. 1, 2 and 3, respectively (Table 5), which is undoubtedly the result of the restoration activities.
Oxic conditions in the lake in the bottom zone were varied: two shallow parts were well oxygenated, while the deepest lake part was anoxic for most of the year. In spite of that fact, the mineral phosphorus concentration noted in 2018 (15 years after the termination of the lake restoration procedure) amounted to 0.46 mg P dm−3 (Figure 5), and organic phosphorus was the dominant P form at all research stations. Before starting the restoration procedures on Długie Lake in 1987, the maximum phosphate concentration in the near-bottom water exceeded 2.80 mg P dm−3, and in 1999 (the year without artificial mixing), this was 1.2 mg P dm−3 [29].
The research by [43] showed that the phosphorus inactivation implemented on Długie Lake did not have a direct impact on the nitrogen compound content in the lake. Total nitrogen amounts were lower compared to the period before restoration, but this was a result of primary production limitation due to the phosphorus level decreasing. The nitrogen compound amounts observed during the present research in the near-bottom and interstitial water, as well as iron and manganese contents, were regulated by the oxygen level in the near-bottom water.
The experimentally obtained P adsorption results showed that the sediment taken at St. 2 had the highest sorption capacity. The largest amount of phosphates was adsorbed by sediments from the surface layer (5–10 cm) at Station 2, at 356.39 mg P kg−1 dw, while the weakest sediment sorptive abilities with respect to phosphorus were shown by sediment taken at St. 1, at 202.47 mg P kg−1 dw (Figure 2, Figure 3 and Figure 4). These values are within the range recorded for the sediments of other Olsztyn lakes [44] or around the world [45,46,47,48,49,50]. The pH level during experiments was favorable for P adsorption processes onto sediment. The research conducted by [44] on five urban lakes, located in Olsztyn showed that alkaline pH (9.0) decreased the abilities of P adsorption in sediment, in which organic matter is a main component binding P. Assessed mean Gibbs’ free energy change values were negative and ranged from −11.23 kJ mol−1 (St. 3, sediment layer 15–20 cm) to −15.17 kJ mol−1 (St. 2, sediment layer 0–5 cm). They often increased with sediment depth (Table 1). Assessed ΔGads values were similar in range to values observed in [46,48]. The negative ΔGads values noted during experiments confirm that P sorption was a spontaneous reaction [46] and the order of magnitude of ΔGads was typical for physical adsorption processes.
The best match of real phosphorus adsorption data to the adsorption model was obtained for the double Langmuir model, as was indicated by the highest values of the determination coefficient R2 (Table 1 and Table 2). This may indicate that phosphorus sorption by the tested sediments most likely occurs through phosphate binding at two types of active sorption sites. A similar phenomenon was also observed by [33] with regards to phosphate adsorption on chitosan and modified chitosan. Holford et al. [51] and Limousin et al. [52] claim that the double Langmuir model was the best model in characterizing phosphate adsorption on soils. Natural bottom sediment can be treated as a multi-component system, with different active sorption centers, and that fact seems to cause a better fit of observed adsorption results to the double Langmuir equation.
The phosphorus sorption characteristics were dependent on OM, Fe, Mn, Si and Mg, which is in accordance with numerous research works [38,44,45,53,54,55] (Table 3). The multiple regression analysis revealed that the sorption capacity from Langmuir models (Smax, S2 and Smax2) was significantly dependent on Al content in sediment (Table 3). Thus, it seems to be possible, that the modification of sediment sorption capacity using an aluminum coagulant created additional active sorption sites, as well as the second type sites described in the double Langmuir equation. The constants 1/n, k2 and EPC0 parameter were significantly connected to Al content in sediment as well (Table 3). The EPC0 parameter informs us about the concentration at which there is an equilibrium between processes of phosphate sorption and release by bottom sediments [26,38,53,56]. Pan et al. [49,50] described the dual nature of particles (suspended solids or bottom sediment), which can be sink or source of P, depending on relationship between EPC0 and P concentration in the water. The negative dependence between EPC0 and aluminum content seems to confirm that the restoration technique used in Długie Lake significantly influenced the increase of P sorption properties.
Taking into consideration the fact that the theoretical sorption capacity assessed using Langmuir models is higher than real S0 values observed during the experiment (“native sorbed phosphorus”), as well as a sum of highly mobile phosphorus fractions (NH4Cl–P + BD–P), which represents sediment “native exchangeable P” [57], the sediment of Długie Lake theoretically should bind P, because the % of sediment saturation by P (%DSP) for Smax (Langmuir model) ranged between ca 25% DSP (St. 1, layer 10–15 cm) and 72% DSP (St. 3, layer 10–15 cm). For the double Langmuir model, the % DSP with regards to Smax2 was much lower (between ca. 8% DSP at St. 3, sediment layer 5–10 cm, and 53% DSP at St. 1 for the deepest sediment layer).
Lewandowski et al. [23] also observed a higher sorption capacity for sediment layers modified by aluminum sulphate, which was used for the restoration of the Süsser See Lake in Germany. These authors as well as Cooke et al. [17] and Rydin [24] maintain that phosphorus bound during inactivation remains permanently buried in the sediment. Reitzel et al. [27] mention that the Al flocs created during restoration undergo an aging process, which can decrease the sorption capacity, compared to freshly formed flocs. However, present research can confirm the thesis that the “active” Al-modified sediment layer of Długie Lake theoretically should still bind phosphorus under stable pH conditions until the sorption active sites are exhausted.

6. Conclusions

The present research revealed the following:
  • The double Langmuir model matched the P adsorption experimental data of Długie Lake sediment best (the highest R2 values). This fact may indicate that phosphorus adsorption in the tested sediments most likely occurs through phosphate binding at two types of active sorption sites.
  • Phosphate adsorption by the investigated lake sediment during experiments was significantly connected to aluminum content in sediment, as was indicated by the multiple regression equations obtained for the following adsorption parameters: Smax, Smax2, S2, k2, 1/n and EPC0. A modification of sediment sorption capacity using aluminum coagulant probably increased the number of additional active sorption sites, as well as the second type of sites described by the double Langmuir equation.
  • The fact that the theoretical sorption capacity assessed using Langmuir models is higher than S0, as well as a sum of highly mobile phosphorus fractions (NH4Cl–P + BD–P), confirm that the both kinds of sediment of Długie Lake (the “active” layer and layers created after ending restoration procedures) still should bind P.
  • The relatively low amounts of phosphates, noted in the near-bottom water of Długie Lake, even in anoxia, confirm that the aluminum-modified sediment layer still can control internal P loading in the lake.

Author Contributions

Conceptualization, R.A.; Investigation, R.A., J.G. and M.Ł.; Methodology, K.P. and R.T.; Software, J.T.; Supervision, J.G.; Writing—review and editing, R.A.

Funding

This study was funded with the funds of the statutory subject Problem Group No 38 UPB, titled “Inland water ecosystems, and the protection and restoration of lakes”’. Subject No 0806.0802 “Improvement of the water reservoirs protection and restoration methods”. Project financially co-supported by Minister of Science and Higher Education in the range of the program entitled “Regional Initiative of Excellence” for the years 2019–2022, Project No. 010/RID/2018/19, amount of funding 12,000,000 PLN.” The funders had no role in the design of the study; in the collection, analyses, or interpretation of data; in the writing of the manuscript, or in the decision to publish the results.

Acknowledgments

The authors wish to thank Tomasz Jóźwiak for helpful discussions concerning the adsorption processes. They also wish to thank two anonymous Reviewers whose critical and very valuable comments have helped to improve the manuscript.

Conflicts of Interest

The authors declare no conflict of interest.

References

  1. Zetland, D. The End of Abundance. Economic Solutions to Water Scarcity; digital edition 1.2; Aguanomics Press: Mission Viejo, CA, USA; Amsterdam, The Netherlands, 2011. [Google Scholar]
  2. Zetland, D. Living with Water Scarcity; digital edition; Aguanomic Press: Mission Viejo, CA, USA; Amsterdam, The Netherlands; Vancouver, BC, Canada, 2014. [Google Scholar]
  3. Ahtiainen, M.; Sandman, O.; Tynni, R. Sysmäjärvi—A lake polluted by mining wastewater. Hydrobiologia 1983, 103, 303–308. [Google Scholar] [CrossRef]
  4. Auer, M.T.; Johnson, N.A.; Penn, M.R.; Effler, S.W. Measurement and verification of rates of sediment phosphorus release for a hypereutrophic urban lake. Hydrobiologia 1993, 253, 301–309. [Google Scholar] [CrossRef]
  5. Grochowska, J.; Augustyniak, R.; Łopata, M. How durable is the improvement of environmental conditions in a lake after the termination of restoration treatments. Ecol. Eng. 2017, 104, 23–29. [Google Scholar] [CrossRef]
  6. Grochowska, J.; Augustyniak, R.; Łopata, M.; Parszuto, K.; Tandyrak, R.; Płachta, A. From saprotrophic to clear water status: The restoration path of a degraded urban lake. Waterair Soil Pollut. 2019, 230, 94. [Google Scholar] [CrossRef]
  7. Hamilton, D.; Collier, K.; Quinn, J.; Howard-Williams, C. (Eds.) Lake Restoration Handbook, A New Zealand Perspective; Springer International Publishing: Berlin, Germany, 2018; 599p. [Google Scholar]
  8. Xu, H.; Brown, D.G.; Moore, M.R.; Currie, W.S. Optimizing spatial land management to balance water quality and economic returns in a Lake Erie watershed. Ecol. Econ. 2018, 145, 104–114. [Google Scholar] [CrossRef]
  9. Xu, H.; Liu, Z.; Wang, L.; Wan, H.; Jing, C.; Jiang, J.; Wu, J.; Qi, J. Trade-offs and spatial dependency of rice production and environmental consequences at community level in Southeastern China. Environ. Res. Lett. 2018, 13, 024021. [Google Scholar] [CrossRef] [Green Version]
  10. Baker, D.B.; Confesor, R.; Ewing, D.E.; Johnson, L.T.; Kramer, J.W.; Merryfield, B.J. Phosphorus loading to Lake Erie from the Maumee, Sandusky and Cuyahoga rivers: The importance of bioavailability. J. Great Lakes Res. 2014, 40, 502–517. [Google Scholar] [CrossRef]
  11. Khare, Y.; Naja, G.M.; Stainback, G.A.; Martinez, C.J.; Paudel, R.; Van Lent, T. A phased assessment of restoration alternatives to achieve phosphorus water quality targets for Lake Okeechobee, Florida, USA. Water 2019, 11, 327. [Google Scholar] [CrossRef]
  12. Klapper, H. Technologies for lake restoration. J. Limnol. 2003, 62 (Suppl. 1), 73–90. [Google Scholar] [CrossRef]
  13. Özkundakci, D.; Hamilton, D.P.; Gibbs, M.M. Hypolimnetic phosphorus and nitrogen dynamics in a small, eutrophic lake with a seasonally anoxic hypolimnion. Hydrobiology 2010. [Google Scholar] [CrossRef]
  14. Pan, G.; Miao, X.; Bi, L.; Zhang, H.; Wang, L.; Wang, L.; Wang, Z.; Chen, J.; Ali, J.; Pan, M.; et al. Modified Local Soil (MLS) technology for harmful algal bloom control, sediment remediation, and ecological restoration. Water 2019, 11, 1123. [Google Scholar] [CrossRef]
  15. Mackay, E.B.; Maberly, S.C.; Pan, G.; Reitzel, K.; Bruere, A.; Corker, N.; Douglas, G.; Egemose, S.; Hamilton, D.; Hatton-Ellis, T.; et al. Geoengineering in lakes: Welcome attraction or fatal distraction? Inland Waters 2014, 4, 349–356. [Google Scholar] [CrossRef]
  16. Søndergaard, M. Nutrient Dynamics in Lakes—With Emphasis on Phosphorus, Sediment and Lake Restoration. Ph.D. Thesis, National Environmental Research Institute, University of Aarhus, Aarhus, Denmark, 2007; 276p. [Google Scholar]
  17. Cooke, G.D.; Welch, E.B.; Peterson, S.A.; Nichols, S.A. Restoration and Management of Lakes and Reservoirs; CRC Press, Taylor & Francis Group, LLC: Boca Raton, FL, USA, 2005. [Google Scholar]
  18. Douglas, G.B.; Hamilton, D.P.; Robb, M.S.; Pan, G.; Spears, B.M.; Lurling, M. Guiding principles for the development and application of solid-phase phosphorus adsorbents for freshwater ecosystems. Aquat. Ecol. 2016, 50, 385–405. [Google Scholar] [CrossRef] [Green Version]
  19. Pan, G.; Yang, B.; Wang, D.; Chen, H.; Tian, B.; Zhang, M.; Yuan, X.; Chen, J. In-lake algal bloom removal and submerged vegetation restoration using modified local soils. Ecol. Eng. 2011, 37, 302–308. [Google Scholar] [CrossRef]
  20. Bryl, Ł.; Wiśniewski, R. Efekty inaktywacji fosforu w osadach dennych Jeziora Wolsztyńskiego (The effects of phosphorus inactivation in the bottom sediment of Wolsztyńskie Lake). In Ochrona i Rekultywacja Jezior (Lakes Protection and Restoration); Ryszard, W., Ed.; Polskie Zrzeszenie Inżynierów i Techników Sanitarnych (Polish Association of Civil Engineers and Technicians): Toruń, Poland, 2015; pp. 71–83. (In Polish) [Google Scholar]
  21. Kajak, Z. Eutrofizacja Jezior (Lakes’ Eutrophication); PWN Warszawa: Warszawa, Poland, 1979. (In Polish) [Google Scholar]
  22. Kajak, Z. Hydrobiologia-Limnologia (Hydrobiology-Limnology); PWN Warszawa: Warszawa, Poland, 2001. (In Polish) [Google Scholar]
  23. Lewandowski, J.; Schauser, I.; Hupfer, M. Long term effect of phosphorus precipitations with alum in hypereutrophic Lake Süsser See (Germany). Water Res. 2003, 37, 3194–3204. [Google Scholar] [CrossRef]
  24. Rydin, E. Potentially mobile phosphorus in Lake Erken sediment. Water Res. 2000, 34, 2037–2042. [Google Scholar] [CrossRef]
  25. Wiśniewski, R. Inaktywacja fosforanów w osadach dennych jako metoda redukcji symptomów eutrofizacji (Phosphate inactivation in the bottom sediment as a method of eutrophication symptoms reduction). Bibl. Monit. Środ. Łódź 1995, 5, 189–201. (In Polish) [Google Scholar]
  26. Wiśniewski, R. Zróżnicowanie stanu i stopnia degradacji jezior. Wartość diagnostyczna badań osadów (The differentiation of lakes status and degradation. The diagnostic value of sediment research). In Ochrona i Rekultywacja Jezior (Lakes’ Protection and Restoration); Wiśniewski, R., Piotrowiak, J., Eds.; Polskie Zrzeszenie Inżynierów i Techników Sanitarnych (Polish Association of Civil Engineers and Technicians): Toruń, Poland, 2007. (In Polish) [Google Scholar]
  27. Reitzel, K.; Jensen, H.S.; Egemose, S. pH dependent dissolution of sediment aluminum in six Danish lakes treated with aluminum. Water Res. 2013, 47, 1409–1420. [Google Scholar] [CrossRef]
  28. Van Hullebush, E.; Auvray, F.; Deluchat, V.; Chazal, P.; Baudu, M. Phosphorus fractionation and short-term mobility in the surface sediment of a polymictic shallow lake treated with a low dose of alum (Courtille Lake, France). Water Air Soil Pollut. 2003, 146, 75–91. [Google Scholar] [CrossRef]
  29. Brzozowska, R.; Gawrońska, H. Influence of a multi-year artificial aeration of a lake using destratification method on the sediment-water phosphorus exchange. Arch. Environ. Prot. 2005, 31, 71–88. [Google Scholar]
  30. Hongthanat, N.; Kovar, J.L.; Thompson, M.L. Sorption indices to estimate risk of soil phosphorus loss in the Rathbun Lake Watershed, Iowa. Soil Sci. 2011, 176, 237–244. [Google Scholar] [CrossRef]
  31. Hongthanat, N.; Kovar, J.L.; Thompson, M.L.; Russell, J.R.; Isenhart, T.M. Phosphorus source—Sink relationships of stream sediments in the Rathbun Lake watershed in southern Iowa, USA. Environ. Monit. Assess. 2016, 188, 453–467. [Google Scholar] [CrossRef] [PubMed]
  32. Zhou, A.M.; Tang, H.X.; Wang, D.S. Phosphorus adsorption on natural sediments: Modeling and effects of pH and sediment composition. Water Res. 2005, 39, 1245–1254. [Google Scholar] [CrossRef] [PubMed]
  33. Filipkowska, U. Wykorzystanie Właściwości Adsorpcyjnych Materiałów Odpadowych do Usuwania Barwników z Roztworów Wodnych (The Use of Adsorption Abilities of Waste Materials for Dye Removal from Aqueous Solutions); Wyd. Nauk. Komitetu Inżynierii Środowiska PAN: Lublin, Poland, 2011. [Google Scholar]
  34. Filipkowska, U.; Jóźwiak, T.; Szymczyk, P. Application of cross-linked chitosan for phosphate removal from aqueous solutions. Prog. Chem. Appl. Chitin Its Deriv. 2014, XIX, 5–14. [Google Scholar] [CrossRef]
  35. Jóźwiak, T.; Filipkowska, U.; Szymczyk, P.; Kuczajowska-Zadrożna, M.; Mielcarek, A. The use of cross-linked chitosan beads for nutrients (nitrate and orthophosphate) removal from a mixture of P–PO4, N–NO2 and N–NO3. Int. J. Biol. Macromol. 2017, 104, 1280–1293. [Google Scholar] [CrossRef]
  36. Szymczyk, P.; Filipkowska, U.; Jóźwiak, T.; Kuczajowska-Zadrożna, M. Phosphate removal from aqueous solutions by chitin and chitosan in flakes. Prog. Chem. Appl. Chitin Derivatives 2016, XXI. [Google Scholar] [CrossRef]
  37. Tibco Software Inc. Statistica Software Package 13.0.; Tibco Software Inc.: Palo Alto, CA USA, 2018. [Google Scholar]
  38. Łukawska–Matuszewska, K.; Voght, R.D.; Xie, R. Phosphorus pools and internal loading in a eutrophic lake with gradients in sediment geochemistry created by land use in the watershed. Hydrobiologia 2013, 713, 183–197. [Google Scholar] [CrossRef] [Green Version]
  39. Fizykochemiczne Metody Analizy w Chemii Środowiska. Cz. 2 (Physical and Chemical Analytical Methods in the Environmental Chemistry; Kosobucki, P.; Buszewski, B. (Eds.) Part. 2; Wyd. Nauk. UMK: Toruń, Poland, 2016. (In Polish) [Google Scholar]
  40. Zar, J.H. Biostatistical Analysis; Prentice Hall: Upper Saddle River, NJ, USA, 1984. [Google Scholar]
  41. Böstrom, B.; Andersen, J.M.; Fleisher, S.; Jannson, M. Exchange of phosphorus across the water-sediment interface. Hydrobiologia 1988, 170, 229–244. [Google Scholar] [CrossRef]
  42. Brzozowska, R. Wpływ wieloletniego sztucznego napowietrzania na przykładzie Jeziora Długiego na wymianę związków biogennych między osadami a wodą (The Influence of Multi-Year Artificial Aeration, on the Example of Długie Lake on the Nutrient Exchange between Sediment and Water. Ph.D. Thesis, UWM in Olsztyn, Olsztyn, Poland, 2003. (In Polish). [Google Scholar]
  43. Grochowska, J.; Brzozowska, R. Influence of different recultivation methods on durability of nitrogen compounds changes in the waters of an urban lake. Water Environ. J. 2015. [Google Scholar] [CrossRef]
  44. Augustyniak, R. Wpływ Czynników Fizyczno-Chemicznych i Mikrobiologicznych na Zasilanie Wewnętrzne Fosforem wód Wybranych Jezior Miejskich (The Influence of Physical, Chemical and Microbiological Factors on the Phosphorus Internal Loading to the Water of Selected Urban Lakes); Polish Academy of Sciences, Environmental Engineering Committee Publishing House: Lublin, Poland, 2018; 242p. (In Polish) [Google Scholar]
  45. Cyr, H.; Mc Cabe, S.K.; Nürnberg, G.K. Phosphorus sorption experiments and the potential for internal phosphorus loading in littoral areas of a stratified lake. Water Res. 2009, 43, 1654–1666. [Google Scholar] [CrossRef]
  46. Huang, L.; Fu, L.; Jin, C.; Gielen, G.; Lin, X.; Wang, H.; Zhang, Y. Effect of temperature on phosphorus sorption to sediments from shallow eutrophic lakes. Ecol. Eng. 2011, 37, 1515–1522. [Google Scholar] [CrossRef]
  47. Huang, W.; Wang, K.; Du, H.; Wang, T.; Wang, S.; Yangmao, Z.; Jiang, X. Characteristic of phosphorus sorption at the sediment–water interface in Dongting lake, a Yangtzee-connected lake. Hydrol. Res. 2016, 47 (Suppl. 1), 225–237. [Google Scholar] [CrossRef]
  48. Huang, W.; Chen, X.; Wang, K.; Jiang, X. Seasonal characteristics of phosphorus sorption by sediment from plain lakes with different trophic statuses. R. Soc. Open Sci. 2018, 5, 172237. [Google Scholar] [CrossRef] [PubMed]
  49. Pan, G.; Krom, M.D.; Herut, B. Adsorption-desorption of phosphate on airborne dust and riverborne particulates in east Mediterranean seawater. Environ. Sci. Technol. 2002, 36, 3519–3524. [Google Scholar] [CrossRef] [PubMed]
  50. Pan, G.; Krom, M.; Zhang, M.; Zhang, X.; Wang, L.; Dai, L.; Sheng, Y.; Mortimer, R.J.G. Impact of suspended inorganic particles on phosphorus cycling in the Yellow River (China). Environ. Sci. Tech. 2013, 47, 9685–9692. [Google Scholar] [CrossRef]
  51. Holford, I.C.R.; Wedderburn, R.W.M.; Mattingly, G.E.G. A Langmuir two-surface equation as a model for phosphate adsorption by soils. J. Soil Sci. 1974, 25, 242–255. [Google Scholar] [CrossRef]
  52. Limousin, G.; Gaudet, J.-P.; Charlet, L.; Szenknect, S.; Barthes, V.; Krimissa, M. Sorption isotherms: A review on physical bases, modeling and measurement. Appl. Geochem. 2007, 22, 249–275. [Google Scholar] [CrossRef]
  53. Froelich, P.N. Kinetic control of dissolved phosphate in natural rivers and estuaries: A primer on the phosphate buffer mechanism. Limnol. Oceanogr. 1988, 33, 649–668. [Google Scholar] [CrossRef]
  54. Bartoszek, L.; Koszelnik, P. Assessment of phosphorus retention in the bottom sediments of the Solina-Myczkowce complex of reservoirs. Rocz. Ochr. Środowiska 2016, 18, 213–230. [Google Scholar]
  55. Orihel, D.M.; Baulch, H.M.; Casson, N.J.; North, R.L.; Parsons, C.T.; Seckar, D.C.M.; Venkiteswaran, J.J. Internal phosphorus loading in Canadian fresh waters: A critical review and data analysis. Can. J. Fish. Aquat. Sci. 2017, 74, 2005–2029. [Google Scholar] [CrossRef]
  56. House, W.A.; Denison, F.H. Factors influencing the measurement of equilibrium phosphate concentrations in river sediments. Water Res. 2002, 34, 1187–1200. [Google Scholar] [CrossRef]
  57. James, W.F. Internal phosphorus loading contributions from deposited and resuspended sediment to the Lake of the Woods. Lake Reserv. Manag. 2017, 33, 347–359. [Google Scholar] [CrossRef]
Figure 1. Location of research stations on Długie Lake (source: Inland Fisheries Institute in Olsztyn, d-maps.com).
Water 11 02175 g001
Figure 2. The P adsorption isotherms for sediment taken at St. 1.
Water 11 02175 g002
Figure 3. The P adsorption isotherms for sediment taken at St. 2.
Water 11 02175 g003
Figure 4. The P adsorption isotherms for sediment taken at St. 3.
Water 11 02175 g004
Figure 5. The total phosphorus (TP) and mineral P profiles in the water–sediment interface of Długie Lake.
Water 11 02175 g005
Figure 6. The total nitrogen (TN) and ammonia profiles in the water-sediment interface of Długie Lake.
Water 11 02175 g006
Figure 7. The Fe and Mn profiles in the water-sediment interface of Długie Lake.
Water 11 02175 g007
Table 1. The assessed values of Langmuir sorption model characteristics for profundal bottom sediment of Długie Lake.
StationSediment LayerLangmuir ModelDouble Langmuir Model
Smax
(mg kg−1)
k
(dm3 mg−1)
R2S1
(mg kg−1)
k1
(dm3 mg−1)
S2
(mg kg−1)
k2
(dm3mg−1)
Smax2
(mg kg−1)
R2
St. 10–5 cm320.01.600.99319.911.533.1111.32323.01.00
5–10 cm470.50.940.96229.350.93241.110.94470.50.96
10–15 cm497.70.620.93218.301.02927.690.101146.00.93
15–20 cm325.41.610.95163.361.62161.971.61325.30.95
St. 20–5 cm375.91.050.98534.30.24106.613.47640.90.99
5–10 cm458.82.390.94109.832.431178.180.2021288.00.99
10–15 cm508.30.910.991212.890.08224.11.921437.00.99
15–20 cm524.20.710.9716.412.65601.740.501618.140.98
St. 30–5 cm269.23.740.93470.30.35765.8627.7535.90.99
5–10 cm279.02.440.9598.6616.042066.90.0472165.60.99
10–15 cm241.71.270.941155.60.06754.712.2061210.30.97
15–20 cm254.20.940.9538.220.811303.90.0611342.10.98
Table 2. The assessed values of the Freundlich sorption model characteristics, “native sorbed phosphorus” values and Gibbs free energy for profundal bottom sediment of Długie Lake.
StationSediment LayerFreundlich Model
1/nKf
(dm3 kg−1)
R2EPC0
(mg dm−3)
S0
(mg kg−1)
ΔGads
St. 10–5 cm0.5875192.90.980.0048.02−13.72
5–10 cm0.7545239.40.950.0128.32−13.48
10–15 cm0.8476210.20.930.0114.62−12.92
15–20 cm0.6840222.20.930.0066.36−13.78
St. 20–5 cm0.4771309.70.990.00422.96−15.17
5–10 cm0.6429231.90.980.02722.63−13.32
10–15 cm0.6090183.50.980.02016.81−12.98
15–20 cm0.7045212.00.970.03319.31−12.93
St. 30–5 cm0.4276199.70.980.0017.21−14.49
5–10 cm0.4712187.80.980.00210.53−14.06
10–15 cm0.5432126.90.970.05927.36−11.23
15–20 cm0.5898116.00.970.04618.92−11.40
Table 3. Multiple regression analysis of P sorption parameters depending on bottom sediment chemical composition (n = 12, p ≤ 0.1, raw data was log transformed).
Fitted Model EquationRR2
Smax = 1.969 Fesed + 1.644 Alsed + Eij0.8850.782
k—non significant
S0 = 5.289 − 3.622 Sised +2.792 Fesed − 4.471 Mnsed + Eij0.9670.935
1/n = 0.389 Alsed + Eij0.9520.907
Kf = 1.514 + 1.063 Fesed − 1.145 Mgsed + Eij0.6700.450
EPC0 = −0.463 − 0.327 Mnsed + 0.166 Mgsed + 0.14 OMsed − 0.095 Alsed + Eij0.9240.854
S1—non significant
k1—non significant
S2 = 13.253 Alsed + Eij0.6950.480
k2 = −14.566 Alsed + Eij0.8750.767
Smax2 = −42.279 + 7.371 Alsed + 6.985 OMsed + 8.523 Sised + Eij0.9650.931
(Fesed: iron content in sediment, Alsed: aluminum content in sediment, Mnsed: manganese content in sediment, OMsed: organic matter content in sediment, Mgsed: magnesium content in sediment, Si: silica content in sediment; all in mg g−1 dw).
Table 4. The mean (±SD) values of main components of Długie Lake sediment (in mg g−1 d.w.).
StationSediment LayerOMSiICFeAlCaMgMnTN% dw
St. 10–5 cm326.26 ± 12.51220.61 ± 3.949.25 ± 0.6122.58 ± 2.4612.75 ± 0.8518.40 ± 2.095.94 ± 0.510.36 ± 0.0416.16 ± 0.657.58
5–10 cm311.40 ± 12.33227.22 ± 3.9910.08 ± 0.7226.56 ± 2.5413.08 ± 0.8121.70 ± 2.155.18 ± 0.630.31 ± 0.0315.45 ± 0.469.86
10–15 cm305.43 ± 12.26228.72 ± 4.2310.19 ± 0.8221.04 ± 2.0214.57 ± 0.8918.39 ± 2.186.10 ± 0.920.29 ± 0.0315.09 ± 0.5615.59
15–20 cm296.49 ± 12.18229.08 ± 4.2410.72 ± 0.8821.82 ± 2.0812.87 ± 0.8122.28 ± 2.035.10 ± 0.990.26 ± 0.0314.63 ± 0.7211.24
St. 20–5 cm498.06 ± 23.77137.25 ± 10.279.65 ± 0.5918.91 ± 1.2615.39 ± 1.5317.40 ± 1.214.05 ± 1.020.28 ± 0.0727.71 ± 0.723.10
5–10 cm463.74 ± 22.58145.60 ± 10.839.82 ± 0.6319.97 ± 1.2817.33 ± 1.2516.00 ± 1.155.44 ± 0.990.27 ± 0.0426.29 ± 0.814.33
10–15 cm455.18 ± 23.24146.07 ± 11.0310.38 ± 0.7820.58 ± 1.3318.90 ± 1.3316.49 ± 1.186.94 ± 0.920.41 ± 0.0426.97 ± 0.685.35
15–20 cm442.68 ± 22.86161.84 ± 11.268.97 ± 0.6221.96 ± 1.4416.16 ± 1.2814.49 ± 1.038.15 ± 1.200.39 ± 0.0525.99 ± 0.246.02
St. 30–5 cm511.92 ± 13.57135.29 ± 7.838.81 ± 0.2515.27 ± 1.6315.77 ± 1.6216.11 ± 1.285.43 ± 0.510.49 ± 0.1229.91 ± 1.053.48
5–10 cm511.20 ± 13.78133.61 ± 7.968.86 ± 0.2714.21 ± 1.2818.95 ± 1.7219.09 ± 1.364.30 ± 0.230.28 ± 0.0929.36 ± 0.994.61
10–15 cm502.98 ± 12.98135.94 ± 8.039.24 ± 0.1816.47 ± 1.3316.79 ± 1.2717.16 ± 1.325.34 ± 0.330.26 ± 0.0629.08 ± 0.815.87
15–20 cm482.78 ± 12.23150.41 ± 8.239.31 ± 0.2117.94 ± 1.8115.32 ± 1.2716.78 ± 1.225.00 ± 0.560.23 ± 0.0927.46 ± 0.906.38
Table 5. The mean (±SD) values of phosphorus fractions and total phosphorus in Długie Lake sediment (in mg g−1 d.w.).
StationSediment LayerNH4Cl–PBD–PNaOH–rPNaOH–nrPHCl–Pres–PTP
St. 10–5 cm0.035 ± 0.0060.136 ± 0.0180.957 ± 0.0061.263 ± 0.0180.767 ± 0.0180.628 ± 0.0223.786 ± 0.210
5–10 cm0.025 ± 0.0050.108 ± 0.0160.893 ± 0.0061.300 ± 0.0120.879 ± 0.0120.789 ± 0.0194.129 ± 0.280
10–15 cm0.024 ± 0.0050.104 ± 0.0161.028 ± 0.0081.371 ± 0.0111.006 ± 0.0140.788 ± 0.0134.186 ± 0.160
15–20 cm0.034 ± 0.0070.138 ± 0.0180.924 ± 0.0070.862 ± 0.0121.074 ± 0.0140.764 ± 0.0153.796 ± 0.120
St. 20–5 cm0.040 ± 0.0030.162 ± 0.0151.598 ± 0.0621.948 ± 0.0220.626 ± 0.0150.778 ± 0.0225.151 ± 0.340
5–10 cm0.045 ± 0.0050.206 ± 0.0162.100 ± 0.0882.018 ± 0.0250.882 ± 0.0130.787 ± 0.0306.237 ± 0.320
10–15 cm0.042 ± 0.0040.215 ± 0.0182.298 ± 0.0732.338 ± 0.0430.921 ± 0.0200.692 ± 0.0186.307 ± 0.220
15–20 cm0.040 ± 0.0030.164 ± 0.0130.839 ± 0.0432.274 ± 0.0320.836 ± 0.0111.033 ± 0.0155.187 ± 0.280
St. 30–5 cm0.048 ± 0.0040.137 ± 0.0020.612 ± 0.0071.860 ± 0.0120.602 ± 0.0121.164 ± 0.0094.423 ± 0.130
5–10 cm0.051 ± 0.0030.132 ± 0.0030.735 ± 0.0032.150 ± 0.0140.552 ± 0.0091.028 ± 0.0114.572 ± 0.132
10–15 cm0.045 ± 0.0030.130 ± 0.0030.659 ± 0.0062.219 ± 0.0100.539 ± 0.0081.099 ± 0.0094.768 ± 0.180
15–20 cm0.046 ± 0.0040.131 ± 0.0020.650 ± 0.0032.113 ± 0.0110.602 ± 0.0110.939 ± 0.0084.481 ± 0.160

