Local Factors Determining Spatially Heterogeneous Channel Migration in a Low-Energy Stream


1
Sweco Nederland, De Holle Bilt 22, 3732 HM De Bilt, The Netherlands
2
Faculty of Spatial Sciences, University of Groningen, P.O. Box 800, 9700 AV Groningen, The Netherlands
3
Centre for Landscape Studies, University of Groningen, P.O. Box 716, 9700 AS Groningen, The Netherlands
*
Author to whom correspondence should be addressed.
Water 2019, 11(10), 2149; https://doi.org/10.3390/w11102149
Submission received: 5 September 2019
/
Revised: 19 September 2019
/
Accepted: 13 October 2019
/
Published: 16 October 2019
(This article belongs to the Section Hydrology)
Abstract
:Since the 1990s, nature and water management policies have attempted to re-create natural rivers systems by mimicking curvy meandering planforms, based on the assumption that meandering is the natural channel-forming process. However, in low-energy river systems, the extent to which meandering plays a natural role is often minimal. This study aims to quantify contemporary lateral migration in the low-energy irregular sinuous lowland river system of the Drentsche Aa, The Netherlands, and to determine the factors influencing lateral channel migration in a heterogeneous valley fill. Although the river is classified as laterally immobile based on an empirical stability diagram, field observations prove that erosion and deposition are currently occurring. By analyzing historical and present-day maps, it was shown that lateral migration was highly spatially variable for the period 1924–2005. Sinuosity and valley gradient are not correlated to lateral migration rates, suggesting they are not a measure of lateral migration in the case study area, which is in line with the literature. Based on geomorphological and soil map analyses, it was shown that lateral migration rates are significantly higher in valley fills of aeolian sands than in clastic alluvial deposits, which on their turn are significantly higher than in peaty environments. Therefore, local conditions appear to be dominant over other factors such as stream power and bed grain size. These findings are important for river rehabilitation of low-energy rivers, because it shows that local valley fill conditions can greatly influence active lateral migration in the river.
1. Introduction
In many Western European countries, naturally flowing rivers have been channelized in the 20th century to suit agricultural practices [1,2,3,4]. However, this has caused several unforeseen problems, such as hydrological flashy responses resulting in increased flooding downstream and desiccation of naturally wet ecosystems [3,5,6]. Therefore, since the 1990s, nature and water management policies have been in place, attempting to re-create natural rivers systems [7,8,9]. There are many examples of rehabilitation programs that include re-meandering projects, often in small streams (e.g., [6,9,10]). Re-meandering of these previously channelized streams is generally based on the assumption that meandering is a natural channel-forming process and therefore, the channel planform characteristics of the historical situation before channelization is mimicked [4]. However, despite the sinuous planform, the extent to which meandering processes play a natural role is often minimal in systems characterized by a low valley slope and relatively low energy levels [10,11]. Although such low-energy streams should be regarded as “non-dynamic”, they often show lateral migration to some degree [12]. However, in general, meandering processes in low-energy rivers have largely been overlooked thus far. Therefore, there is a need for describing factors that contribute to lateral migration in low-energy rivers.
Processes and forms of individual river channels are influenced by a complex set of factors, such as flow energy (valley gradient, bankfull discharge, frequency of high discharge events), sediment load, sediment size, floodplain heterogeneity, and bank cohesion (composition and vegetation) (e.g., [9,10,13,14,15,16,17,18,19,20,21]). Human interventions in hydrological systems also influence laterally moving behavior [22]. Although it is commonly perceived that in temperate lowland rivers, sinuosity tends to increase if the valley slope is steeper, and there are some examples of rivers where sinuosity and valley slope are positively correlated (e.g., [23]), specific relations between valley slope and sinuosity cannot be generalized for rivers with mean annual discharge of more than 10 m3/s [10]. In addition, it is also often perceived that in cases with a higher sinuosity, a higher lateral migration can be expected [24]. Sinuosity of a stream is often not a stable value, but is temporally and spatially variable. For example, vegetation influences, extreme weather conditions, clustering of meander cut-offs, or human influences can have an impact on the sinuosity [10].
Rivers can be classified based on river channel processes or on their resulting planform [19]. Nanson and Croke [12] created a genetic classification, in which they distinguished river systems into high-energy non-cohesive floodplains, medium-energy non-cohesive floodplains, and low-energy cohesive floodplains. According to this classification, banks in meandering systems are laterally active in a floodplain environment composed of gravels, sands, and silts, whereas in irregular sinuous systems, the channels are stable in sedimentary systems of abundant silts and clays with organic sediments. The latter show no lateral migration, as the discharge power is below a certain threshold to erode bank material. This thus implies that when no erosional processes are taking place, a channel cannot be defined as a meandering stream since no migration will take place. Nanson and Knighton [25] proposed a single-channel river classification based on planform, where laterally active regularly sinuous channels show meandering and braided planforms and laterally inactive channels consist of what they termed ’straight’ and ‘irregular sinuous’ planforms. Gurnell et al. [24] make a distinction in rivers based on sinuosity P, in which they define ‘straight’ (P < 1.05), ‘sinuous’ (1.05 < P < 1.5), and ‘meandering’ (P > 1.5) planforms.
Since meandering is defined by the level lateral activity or the planform, or both, in this paper, the focus is on the lateral migration of the river channel rather than on the definition of whether a river is ‘meandering’ or not.
To classify the extent of lateral activity in single-thread rivers, Van den Berg [17] developed an empirical stability diagram based on data from a large number of rivers. The diagram was subsequently refined by Bledsoe and Watson [26], Makaske et al. [27], and Kleinhans and Van den Berg [10]. Classes include highly braided rivers, moderately braided and meandering rivers with scrolls and chutes, meandering rivers with scrolls, and laterally immobile rivers without bars. The discrimination borders between classes should be interpreted as lower limits rather than hard thresholds [10,28]. Following the empirical diagram, the lateral stability can mainly be described by three variables: The median bed grain size, the valley slope, and the bankfull or mean annual discharge [10].
Although the separation between actively meandering and laterally inactive irregular sinuous rivers has been studied extensively, it remains unclear what factors influence lateral migration in low-energy rivers, as the empirical stability diagram has not been validated for these cases. Low-energy rivers in this case are defined by a mean annual discharge of less than 10 m3/s [10] or by a specific stream power of less than 10 W/m2 [12,24]. In general, there has been great interest in relatively highly lateral instable systems, where rivers with relatively stable planforms due to strong resistance to erosion and/or low specific stream power have received considerably less attention [29].
Eaton et al. [30] demonstrate that predicting channel patterns is a three-variable problem, based not only on slope and (dimensionless) discharge, but also on bank strength. Erosive banks and fresh bars are observed even in small streams. The erosivity or bank cohesion may depend on different factors, such as soil type, sediment deposition structure, and riparian vegetation [31]. In cases where banks are stable, there are still some very slow rates of lateral migration [12]. Generally speaking, banks consisting of loose material, like (aeolian) sand, are more erodible than banks consisting of more cohesive materials like silt, clay, or peat [9,32]. Bank stability also depends on the amount of organic matter and the amount of plant roots which consolidate bank material [32,33]. However, the composition of valley fills and its resistance also act as a factor in determining lateral migration in low-energy rivers, but is relatively under-exposed thus far [9]. In addition, research has focused on lateral activity in either alluvial or, to a lesser extent, in peatland environments (e.g., [34]), but not in valley systems with heterogeneous valley fills. Although it is acknowledged that the erosional resistance of spatially heterogeneous floodplains affects planform evolution of meandering rivers, the relative importance of this effect is limited [19]. Special attention needs to be paid to floodplain heterogeneity, as it may cause local variation in lateral channel migration [29,35,36,37].
Therefore, there is a need for case studies that describe which factors contribute to lateral migration in low-energy rivers in heterogeneous valley fills. This is important for river management, since it may determine the way river rehabilitation projects should be designed. Therefore, this paper aims to (1) quantify historical and contemporary lateral migration in a low-energy irregular sinuous river and (2) assess the factors that influence lateral channel migration in a heterogeneous valley fill. The river is positioned in the context of the stability diagram of Kleinhans and Van den Berg [10] and in the river planform classification system as proposed by Gurnell et al. [24]. The paper then focuses on the spatial variability of lateral migration rates and relates this to local conditions of valley and channel slope, sinuosity, and valley fill composition. The research involves a detailed case study of the Drentsche Aa mixed alluvial and peatland lowland river situated in the Northern Netherlands. The outcomes are compared to the presumed naturalness of the river, and findings are discussed in the light of river rehabilitation projects.
2. Regional Setting
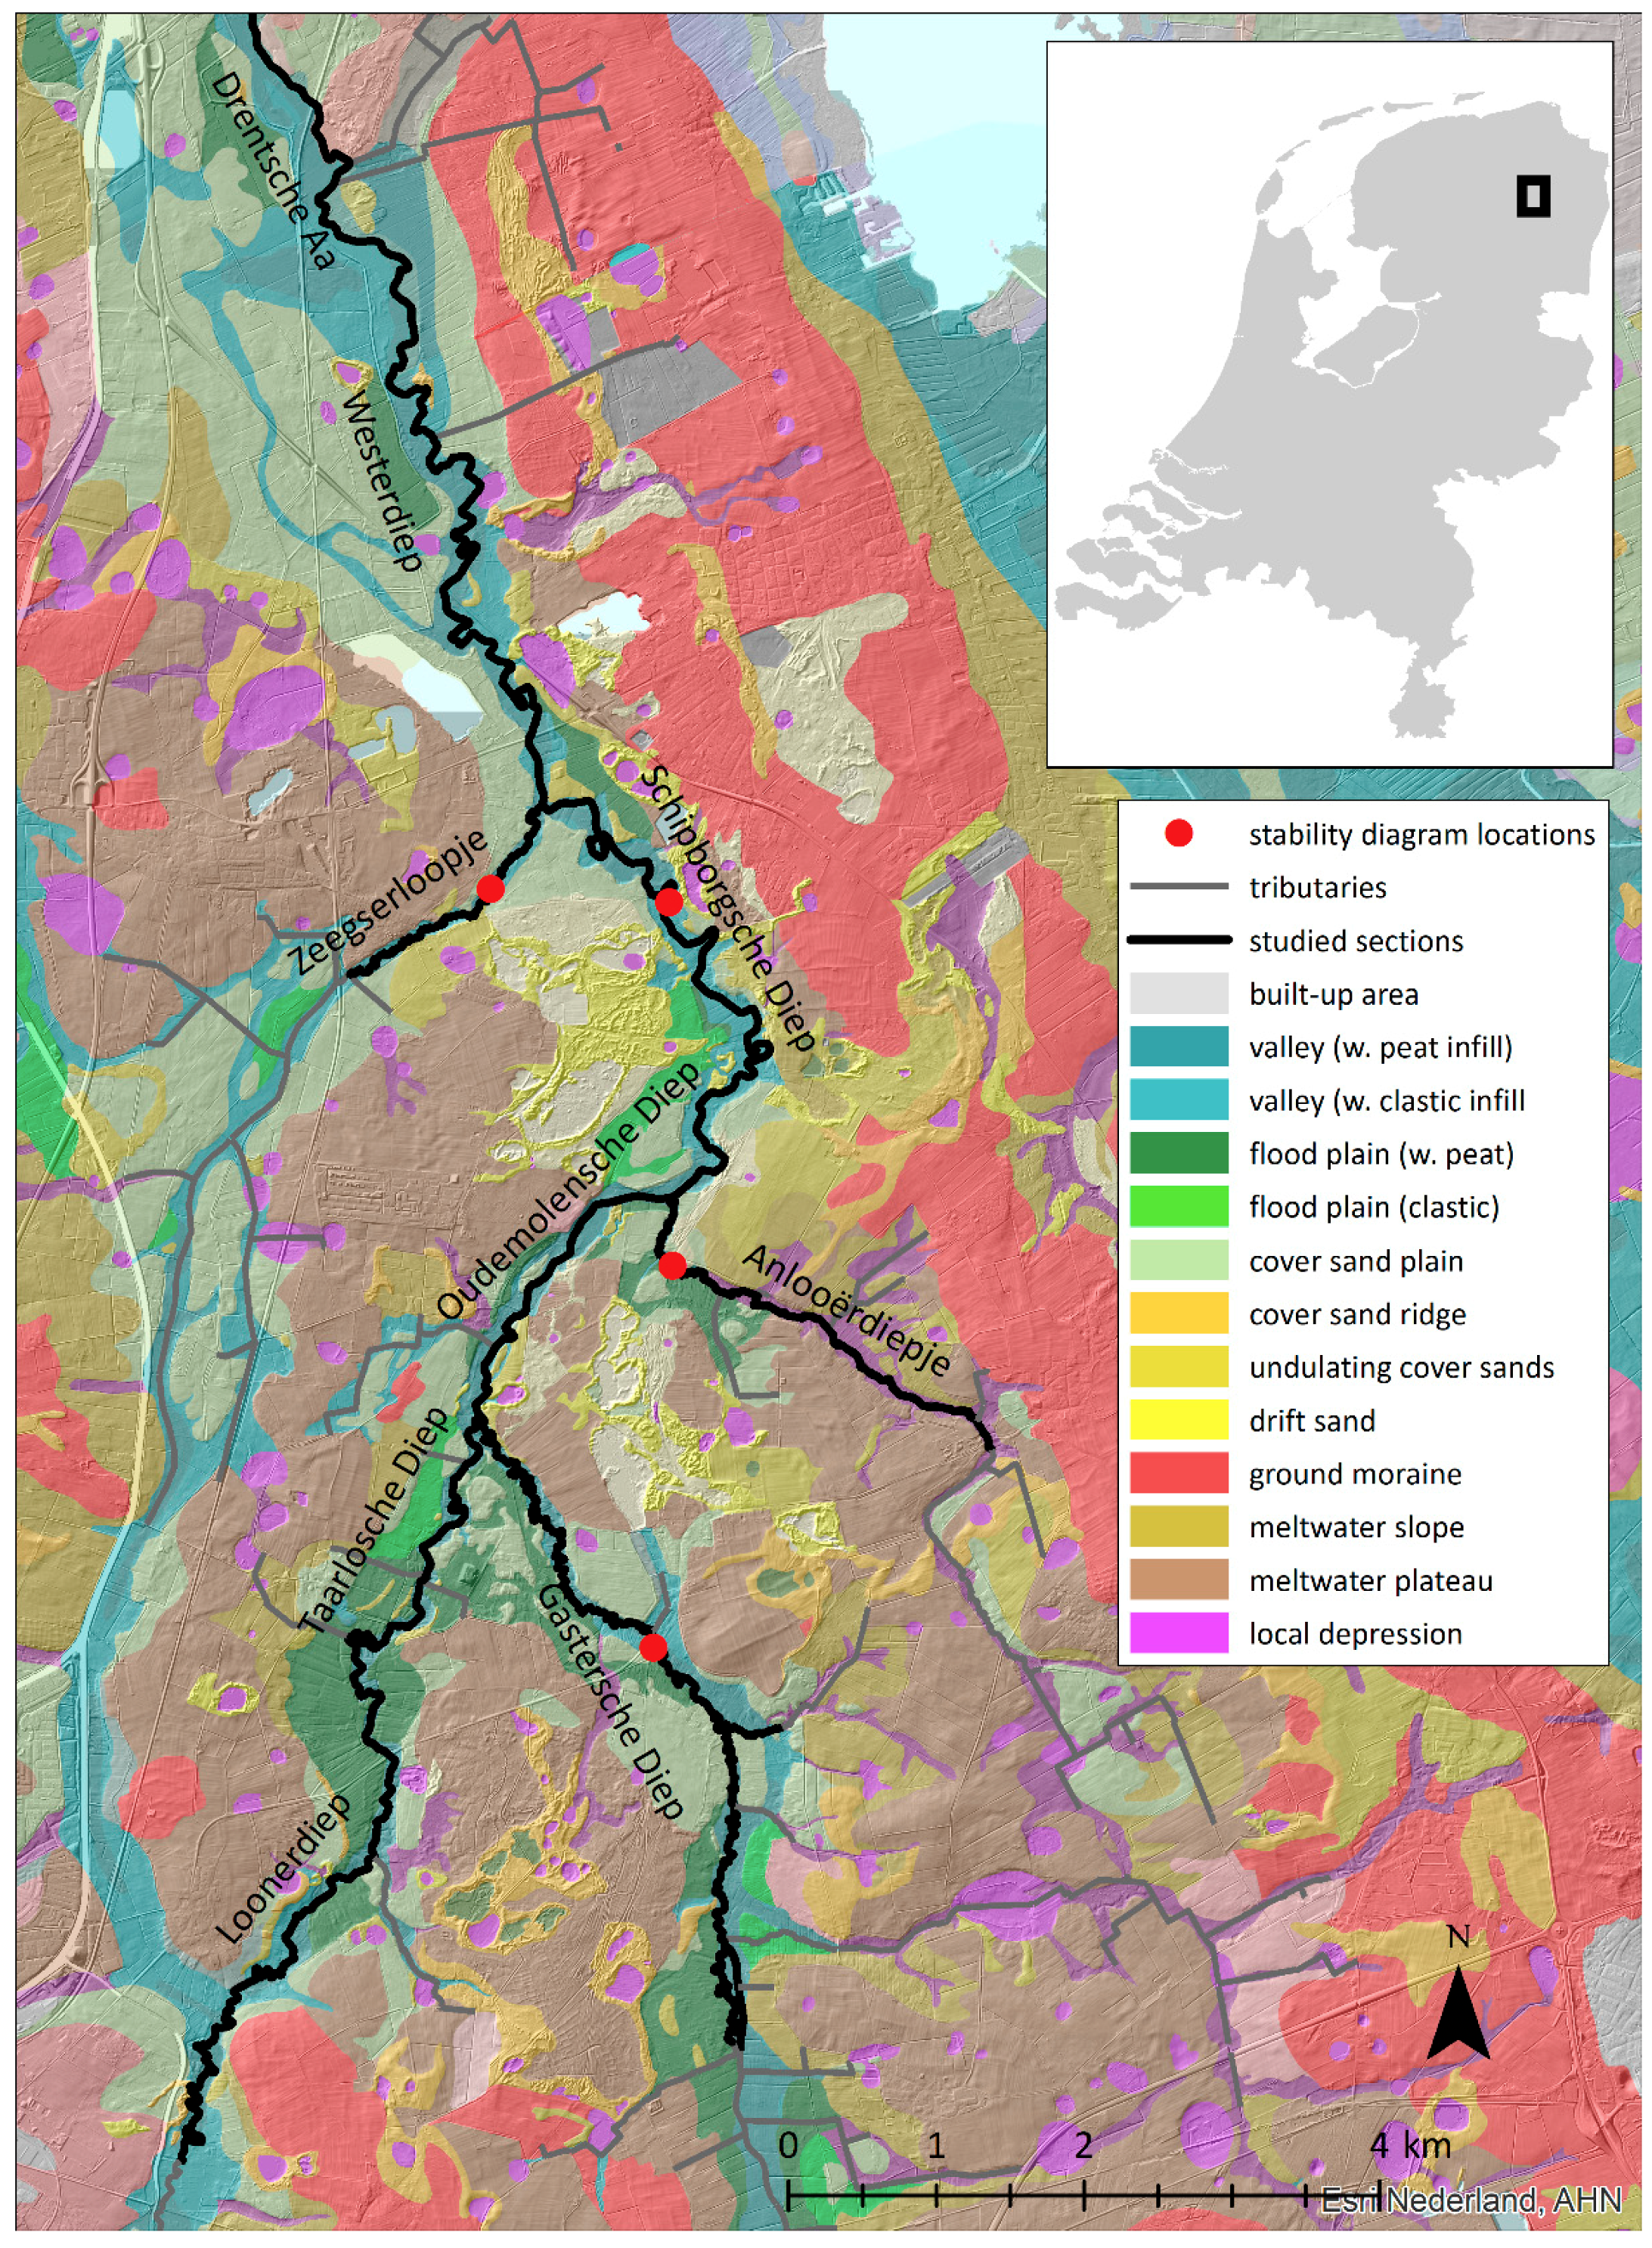
The Drentsche Aa (Figure 1) is a semi-natural, lowland river system in the north of the province of Drenthe in the Netherlands. Due to its high natural, cultural, and geo-heritage values, the area was designated as one of the 20 Dutch National Landscapes [5,38] and is part of the UNESCO Global Geopark De Hondsrug. The total catchment size is around 300 km2 with a length of around 16 km. The area can be characterized as a relatively flat area, ranging from 22 m AMSL near the source area in the south to 0.6 m AMSL at the catchment outlet in the north [5,11,39,40].
The shallow subsurface consists of subglacially deposited till of Saalian origin, in which periglacial snow meltwater runoff has eroded shallow valleys with a NNW–SSE orientation [41,42,43]. The area was covered with undulating aeolian cover sands and periglacial fluvial deposits of Weichselian origin about 0.5–2 m in thickness, which form the Pleistocene basis of the stream valleys [42,44]. During the late Weichselian and Holocene, peat formation and local alluvial deposits filled the valleys [42,45]. Since the 1600s, the peat has been subsiding due to surface drainage by people. The current-day peat thickness is usually limited to about 0.5–2 m in thickness, but can locally reach a thickness of around 7 m [45]. In some areas, aeolian dunes of late Pleistocene age are embedded or partly covered by Holocene deposits. This means that in some locations, the bottom of the streambed is situated in the Pleistocene aeolian or fluvial deposits, and in others, the stream is flowing through a peaty environment. The composition of the backswamps in the floodplain is variable and mainly consists of peat with local alluvial material due to the nature of obliquely aggrading streams during the Holocene [11]. Natural levees are present along the active river channel, although they may have been slightly raised in places due to local small-scale manual deepening of the channel as drainage improvement by farmers in the past. Abandoned channels or oxbow lakes are almost entirely absent [11,42,46]. The higher areas mainly consist of infiltration areas, whereas in the valleys, groundwater seepage reaches the surface [40]. Figure 1 shows the geomorphological map [41] and the current-day river network of the study area.
The moderate climate has an annual average rainfall of about 750 mm, evenly distributed over the year [5,47], which has been slowly increasing due to climate change [48]. Typical channel widths are 2–3 m in upstream sections to around 10–15 m near the catchment outlet. The current-day mean annual river runoff near Schipborg is around 1.8 m3/s, which has a typical stream power of around 0.5 W/m. The bankfull discharge is 6.8 m3/s or 1.6 W/m2 [5,11], which classifies the stream as a low-energy river. Typical bankfull discharge levels are lower in the tributaries, with around 1.5 m3/s in the Gastersche Diep and 2.9 m3/s in the Loonerdiep (Figure 1). The stream is free-flowing and is not influenced by sea level rise or tidal fluctuations. The stream consists of a number of tributaries or reaches (locally called ‘diep’; Figure 1). The stream and its valley can be described as ‘unconfined single thread’ according to the Gurnell et al. [24] classification scheme.
Agriculture is the main land use in the area (50%), of which around half is pasture. Another 35% consists of natural areas, both as grasslands on the valley floors, as well as pine and deciduous forests (20%) in the higher, drier areas. During the last century, European and national agricultural policies focusing on food security transformed farming practices and countryside management in large parts of the Netherlands. However, the catchment of the Drentsche Aa was relatively untouched by the large-scale land consolidations [5]. Some short upstream tributaries were channelized in the 1960s and 1970s, which has some influence on the hydrological conditions in these channels, but they are still generally considered as ‘semi-natural’ in a Western European context [5]. The majority of the stream network still has its sinuous planform [42,49]. The studied part of the network system is approximately 16 km in length and elevation difference from upstream to downstream is about 7 m.
In 1944, Kuenen [46] investigated lateral migration in the Drentsche Aa by conducting a field survey and analyzing map data spanning a 20-year period. He concluded that the Drentsche Aa river is morphologically largely inactive and only shows activity on small stretches of the channel during short periods of time. Candel et al. [11] have shown that lateral migration and the resulting planform appear to be inherited by the Pleistocene subsurface morphology and composition during the build-up of the valley fill during the Holocene. Due to oblique aggradation, lateral activity in sandy environments appears to be stronger than in peaty conditions, suggesting that local conditions are dominant in lateral migration. Their research was based on six lithological cross sections of the valley fill in the study area, showing the long-term processes in a limited number of places. This paper has a more contemporary focus and uses data from a multitude of locations along the river channel.
3. Approach and Methods
The approach of this study was to first position the stream in the context of the empirical stability diagram by Kleinhans and Van den Berg [10] and the river classification by Gurnell et al. [24] using field measurements and observations. Based on fieldwork and historical map analysis, lateral migration rates were quantified and then statistically related to local factors such as valley slope, sinuosity, and valley fill composition by using geomorphological and soil maps.
3.1. Positioning the Stream in the Stability Diagram
The empirical stability diagram [10] was originally designed to be used for streams with bankfull discharge or mean annual discharge of more than 10 m3/s. As scale differences do occur, it was expected that in low-energy streams with smaller discharges, local conditions would have a more dominant influence on the lateral migration [10,28]. As the Drentsche Aa stream is typified by low bankfull discharge values, the stability diagram was used here as a frame of reference rather than a classification parameter, similar to Makaske et al. [28]. The stability diagram was drawn by plotting the potential specific stream power (ωpv; in W/m2) against the median bed grain size (D50), where the potential stream power was defined by Equation (1):
in which ρ = water density (kg/m3), g = gravitational acceleration (m/s2), Q = bankfull discharge (m3/s), Sv = valley slope, and Wr = reference width, defined as Wr = α√Q, with α = 4.7 × for D50 < 2 mm.
To be able to position the stream in the stability diagram, data were gathered at four locations: In the Gastersche Diep, Anlooërdiepje, Zeegserloopje, and the Schipborgsche Diep (Figure 1). At each location, sediment samples of the top 5 cm of the channel bed were taken with a pulse auger. Organic material on the channel bed was almost absent. The median bed grain size was determined by drying, sieving, and weighing the bed sediment samples. Grain size distribution diagrams were constructed to determine median channel bed grain size at each cross-sectional location.
Bankfull discharge at the sites was calculated based on the Manning’s equation (Equation (2)) for uniform, open channel flow at bankfull discharge [50]:
where is the average flow velocity (m/s), n is the Manning’s roughness coefficient, Rh is the hydraulic radius (flow surface divided by the wetted perimeter), and S0 is the channel slope.
At each location, the channel slope (i.e., slope of water surface following the water course trajectory) was measured using a Trimble Spectra LL500 laser level in 10 m intervals over a distance of around 50 m up- and downstream of each site. At each site, three local channel cross-sectional profiles were measured and averaged to determine Rh. The roughness coefficient n was estimated from field observations in comparison with examples from literature [50,51]. By multiplying with the cross-sectional flow surface at bankfull discharge, Qbf was calculated. In addition, Qbf data, based on calibrated stage–discharge relations, were provided by the regional waterboard (Waterschap Hunze en Aa’s). The valley slope was extracted from LIDAR data from 2009 (AHN2 [52]) by determining the difference in channel bank heights over a distance of approximately 500 m along the locations where the cross-sectional profiles were taken. This distance included a multitude of channel bends upstream and downstream of the sampled locations.
3.2. Erosion Scars and Sediment Deposition—Field Assessment
During a field survey, a visual inspection of the riverbanks from the water was conducted to obtain qualitative data on the current state of erosional and sedimentary processes in the river system. The banks of sections West and North, interpreted as the main tributaries of the water system (Loonerdiep, Taarlosche Diep, Oudemolensche Diep, Schipborgsche Diep, Westerdiep, and Drentsche Aa; Figure 1 and Figure 2) were surveyed from a kayak. The field observations were carried out during two days in April 2015, directly after the hydrological winter half year. During this period, bankfull discharges occur most frequently, leaving fresh signs of morphological activity. Banks were still scarcely vegetated, which made observations of active erosion and sedimentation easier. Stream bends were photographed and described in terms of visual signs of the presence or absence of recent erosion scars and fresh bars. The bends were categorized into three categories: Erosive (clear erosional scars and/or sedimentary features), non-erosive (minor or no erosional scars or no clear sedimentary features), or inconclusive.
3.3. Historical Map Study
A historical map study was conducted to analyze the lateral bank migration over time. A wide variety of maps dating from 1830 through 2009 were available for (parts of) the tributaries (Table 1). The maps differed in quality and spatial scales. After close visual examination, only AHN 2009 (LIDAR altitude map [52]) with a spatial resolution of 0.5 m and the 1924 maps ([53]; scale 1:1000) were considered to be suitable for the spatial scale of this study. The other maps proved to be too inaccurate or of an insufficient spatial scale for this purpose. The spatial and temporal coverage of aerial photographs in the area was insufficient for reliable usage for the purpose of this study.
The 1924 maps were high quality maps, as they were specifically aimed to map the course of the river. The original purpose of these maps was for planning the channelization of the river [53], which was never carried out. The detailed scale level was considered to provide a unique opportunity to reconstruct the lateral channel migration over the period 1924–2009. The 1924 maps consisted of 13 adjacent sheets covering all tributaries (sections North, West and East) under investigation, except for the Zeegserloopje and the Anlooërdiepje (Figure 1).
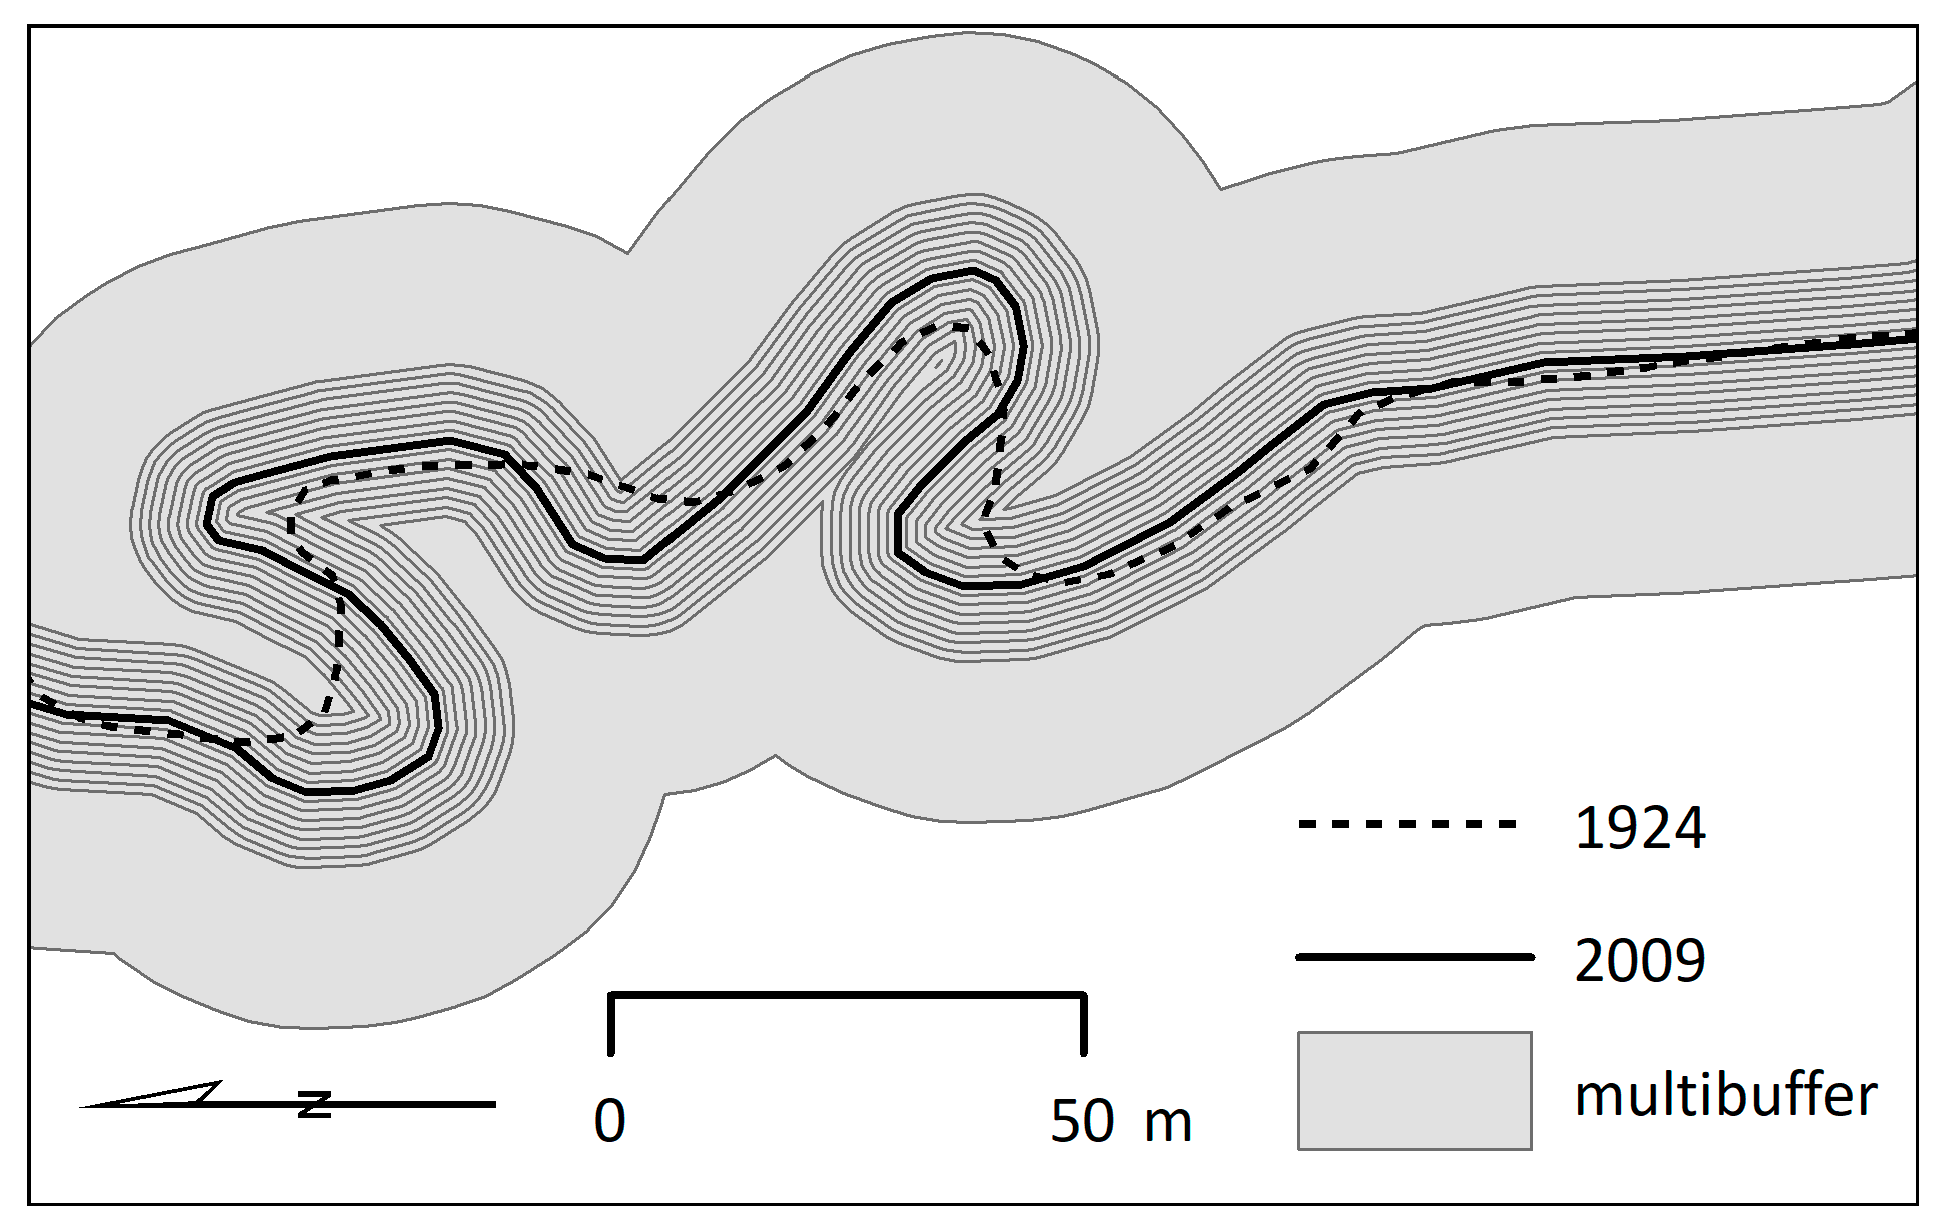
The 1924 maps were scanned and georeferenced in a GIS. The channel banks from both the 1924 and 2009 maps were manually digitized. Multibuffer polygons with 1 m distance intervals were drawn around both the left and right 2009 bank positions (Figure 3). By overlaying these with the 1924 banks, the local lateral channel migration was calculated. A 1 m interval was chosen, as it was assumed that the combination of the quality of the original data and the digitizing errors did not justify a higher resolution.
To determine to what extent historical migration rates are reflected in current erosion and sedimentation activity, the historical map study results were compared to the results of the field survey. By using a chi-square analysis, the statistical significance of differences between average lateral migration rates for currently stable and active rivers bends was tested.
3.4. Using LOESS and CUSUM for Spatial Variation in Lateral Migration
To assess the regional variability of lateral migration along the river channel, locally estimated scatterplot smoothing (LOESS) for visual analysis [54] and the distribution-free cumulative sum (CUSUM) test were used to assess the change along the river course. The CUSUM test is a rank-based test to indicate stepwise change in successive measurements [55,56]. The test is usually employed for monitoring change detection through time (e.g., [5]). We used longitudinal distance along the river to monitor stepwise change of lateral migration. The test statistic is the maximum cumulative sum of the signs of the difference from the median and start at the most downstream point of the stream, working in an upstream direction. A normal distribution is not required, but the test does assume independency of the measurements. As the valley fill in the study area is heterogeneous at a short spatial scale [11,42,45], it is assumed that the data are not auto-correlated (or interdependent), and therefore the test could be used.
3.5. Sinuosity and Slope
To rule out the general relationship of the positive correlation between sinuosity and valley slope and to position the stream in the classification system of Gurnell et al. [24], average slope, sinuosity, and lateral migration for each of the 20 1000-m subsections were determined. This distance was assumed the minimal scale level to assess valley slope in the case study area. The lateral migration was calculated by averaging the lateral migration of all individual bends per subsection based on the 1924–2009 historical map analysis (see Section 3.3). As the variables were not normally distributed, the non-parametric Pearson’s correlation was used to analyze the correlation between valley slope, sinuosity, and lateral migration per subsection.
3.6. Geomorphological and Soil Map Analysis
Following the theory and findings by Wolvert and Maas [9], Kleinhans and Van den Berg [10], Makaske et al. [28], and Candel et al. [11], it was expected that lateral migration of stream sections in the Drentsche Aa river is mainly determined by local factors and is larger in sandy environments than in peaty sediments. To test this, differences in lateral migration rates from the historical map analysis (Section 3.3) were compared to the valley fill, as reflected in the geomorphological map (scale 1:50,000; [57]) and the soil map (scale 1:50,000; [58,59]). The maps were created by different institutions, using different datasets. The maps are not independent, but since the geomorphological map places map units in the context of the landform processes and the soil map in the context of pedogenesis, we used both maps for our analysis. The variability at valley system scale is well-covered in the maps, which identifies deeper and shallower peat covers, as well as the sandy valley sides. Small-scale variability, i.e., former streambeds and overbank deposits, are not covered in the maps. All individual bends were classified based on geomorphological and soil mapping units in a GIS. As the lateral migration is regarded as not normally distributed, the statistical differences in lateral migration between map units were evaluated using the non-parametric Kruskal–Wallis median test.
4. Analysis and Results
4.1. River Classification
The average valley slope is 0.00052 m/m, which is well below the 0.0050 m/m threshold defined by Gurnell et al. [24], typical for very stable sinuous, meandering, and anabranching rivers. The bed material consists of fine to medium sizes of sand (D50 is 245 µm; Table 2). With its average sinuosity P of 1.5, the river planform is on the boundary of the ‘sinuous’ or ‘meandering’ Gurnell et al. [24] planforms. The river is classified as ‘large single-thread sinuous/meandering rivers with insufficient power to rework more than a part of the valley fill’ (types 17 and 18; see Table 7.3 in [24]). According to this scheme, the channels are expected to be laterally unstable and (sometimes) subject to lateral migration. In conditions with a relatively high sinuosity, typical floodplain landforms such as oxbows, ridges, and swales should be present. These do hardly occur in the study area, however, and from a landforms’ perspective, the study area would better fit the description of laterally stable ‘single-thread straight, sinuous, or meandering rivers’ with levees and (organic) backswamps (types 20 and 21). It is noted that in the study area, typical channel slopes are 0.0004 m/m, which is substantially lower than the typical slope conditions threshold of 0.02 m/m that are identified by Gurnell et al [24]. Moreover, the classification types 17 and 18 are typical for bankfull unit stream power values between 10 and 60 W/m2, whereas in the study area, this is typically around 1.6 Wm2, which better fits the 20 and 21 classes. Although the classification scheme was designed as an indicative framework, the river studied in this paper cannot be consistently identified as part of a single class. Gurnell et al. [24] do not further quantify typical lateral migration rates in the different classes.
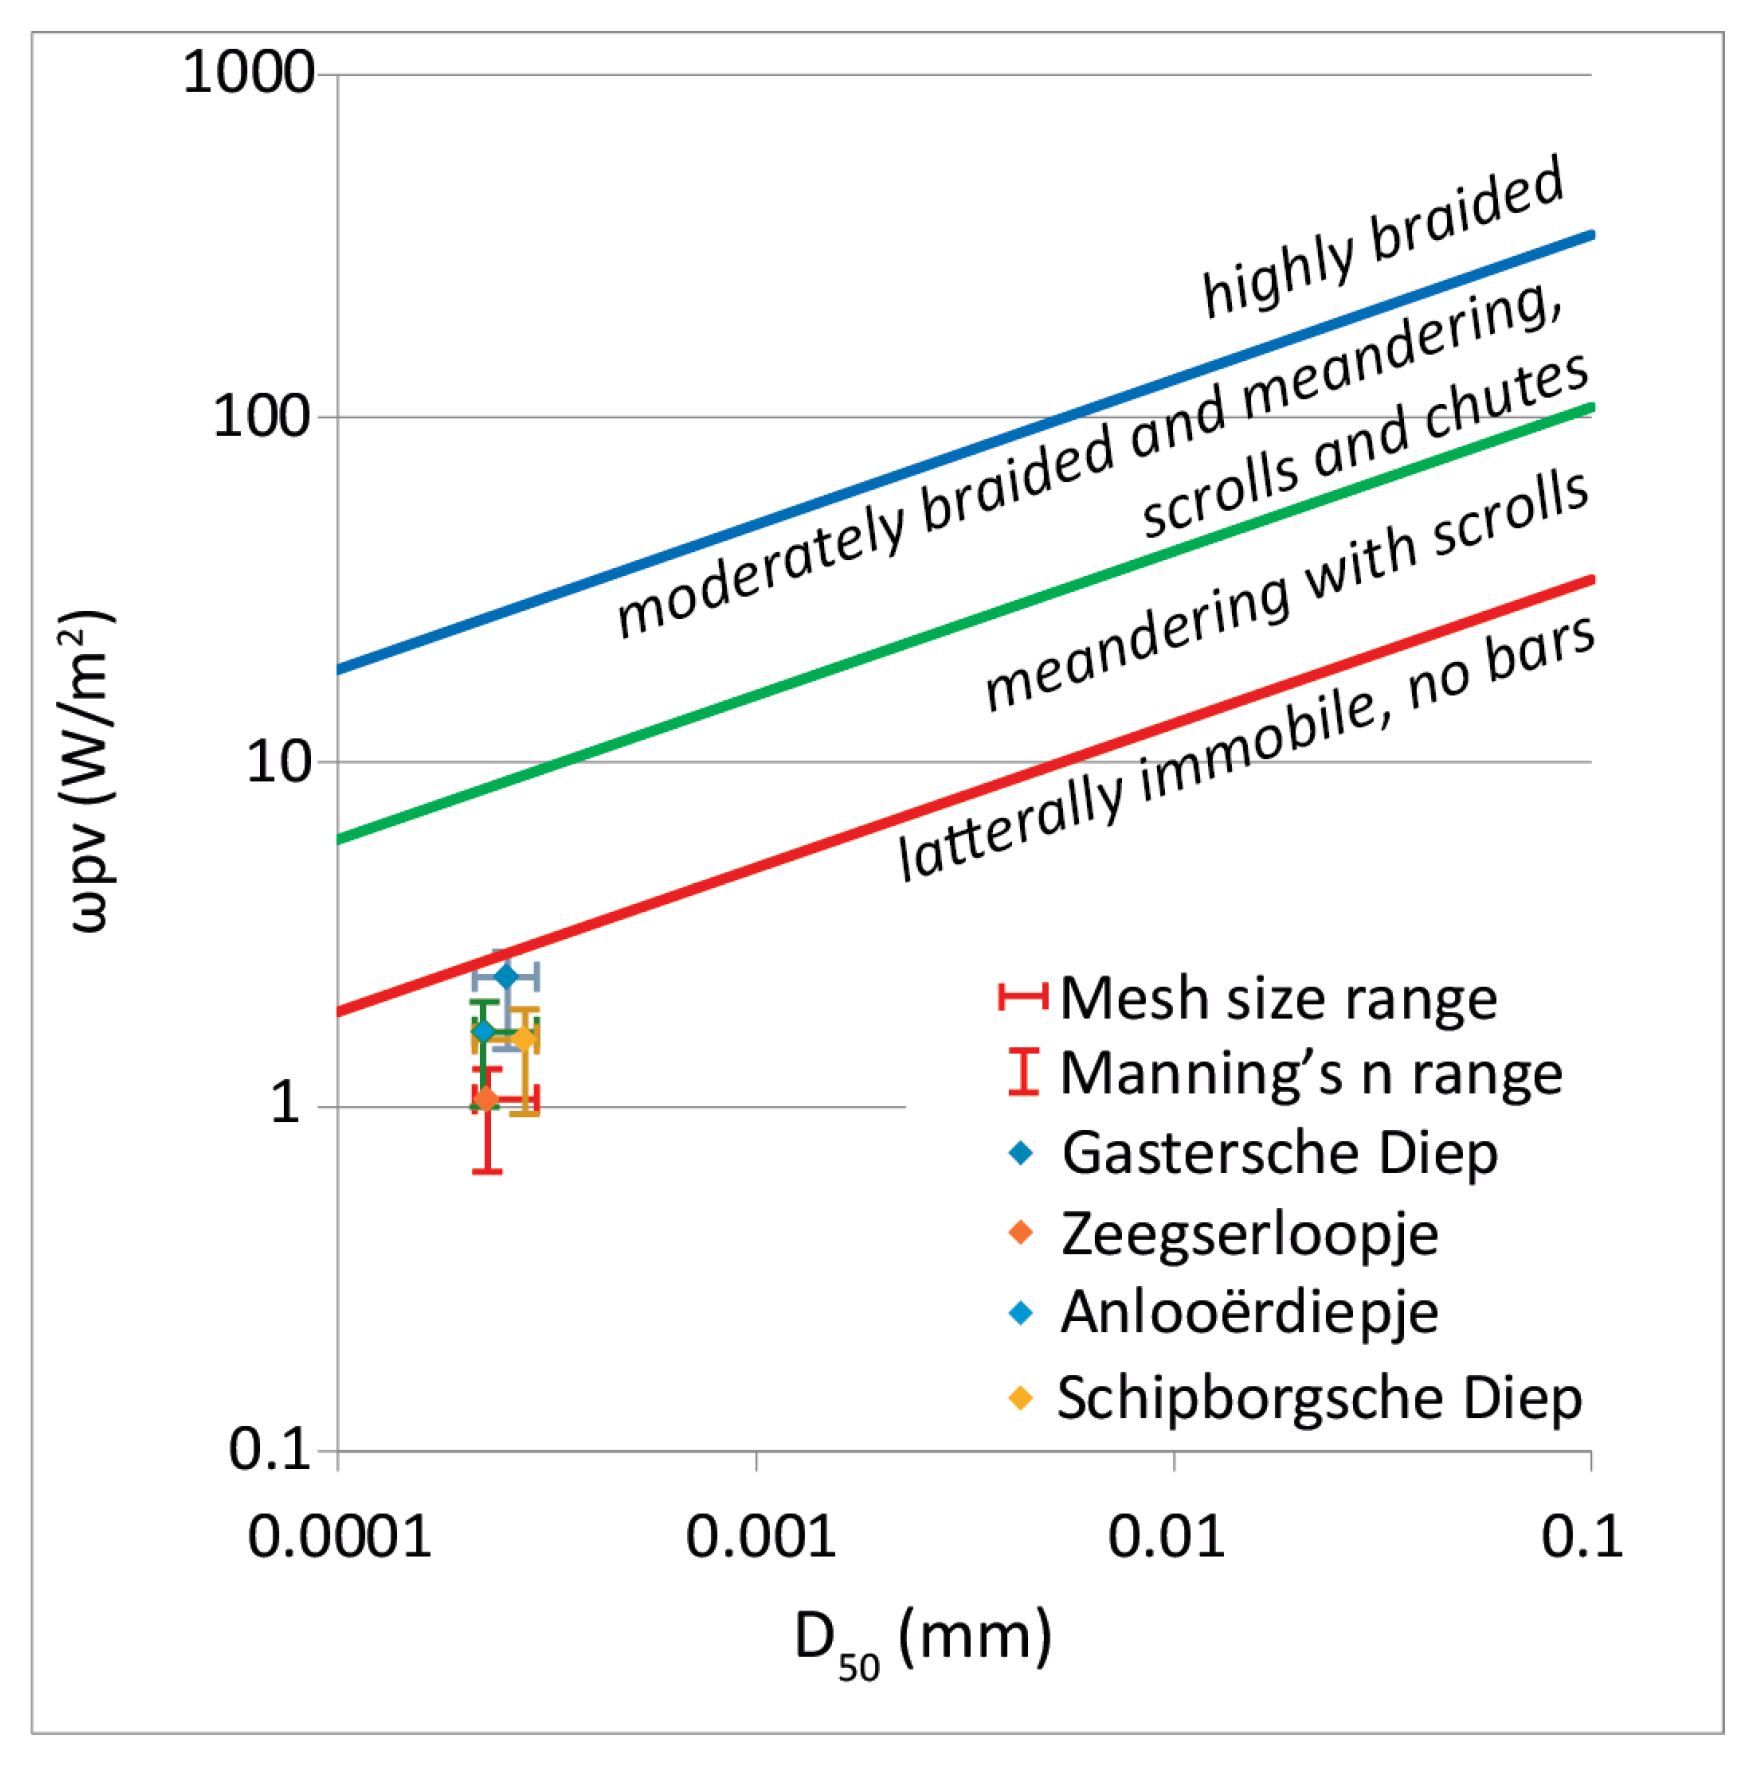
The variables for the empirical stability diagram are shown in Table 2. At all sites, the natural stream was clean and straight and Manning’s n was therefore set at 0.03. To assess the error ranges, the theoretically possible Manning’s n values ranging from 0.02 (bankfull clean straight channel) to 0.08 (dense weeds as high as flow level) were also included. All sites are in the lowest field of the stability diagram below the laterally active/inactive border (Figure 4). As a result, the stream classified as ‘laterally immobile’. Using the Gurnell et al. [24] classification scheme, the stream would be classified as ‘non to limited lateral migration’. Neither in the stability diagram nor the Gurnell et al. classification are typical maximum lateral migration rates provided. Based on the interpretation by Kleinhans and Van den Berg [10], any occurring lateral migration cannot solely be explained by specific stream power or streambed grain size, as shown in the diagram.
4.2. Field Analysis of Current Lateral Migration
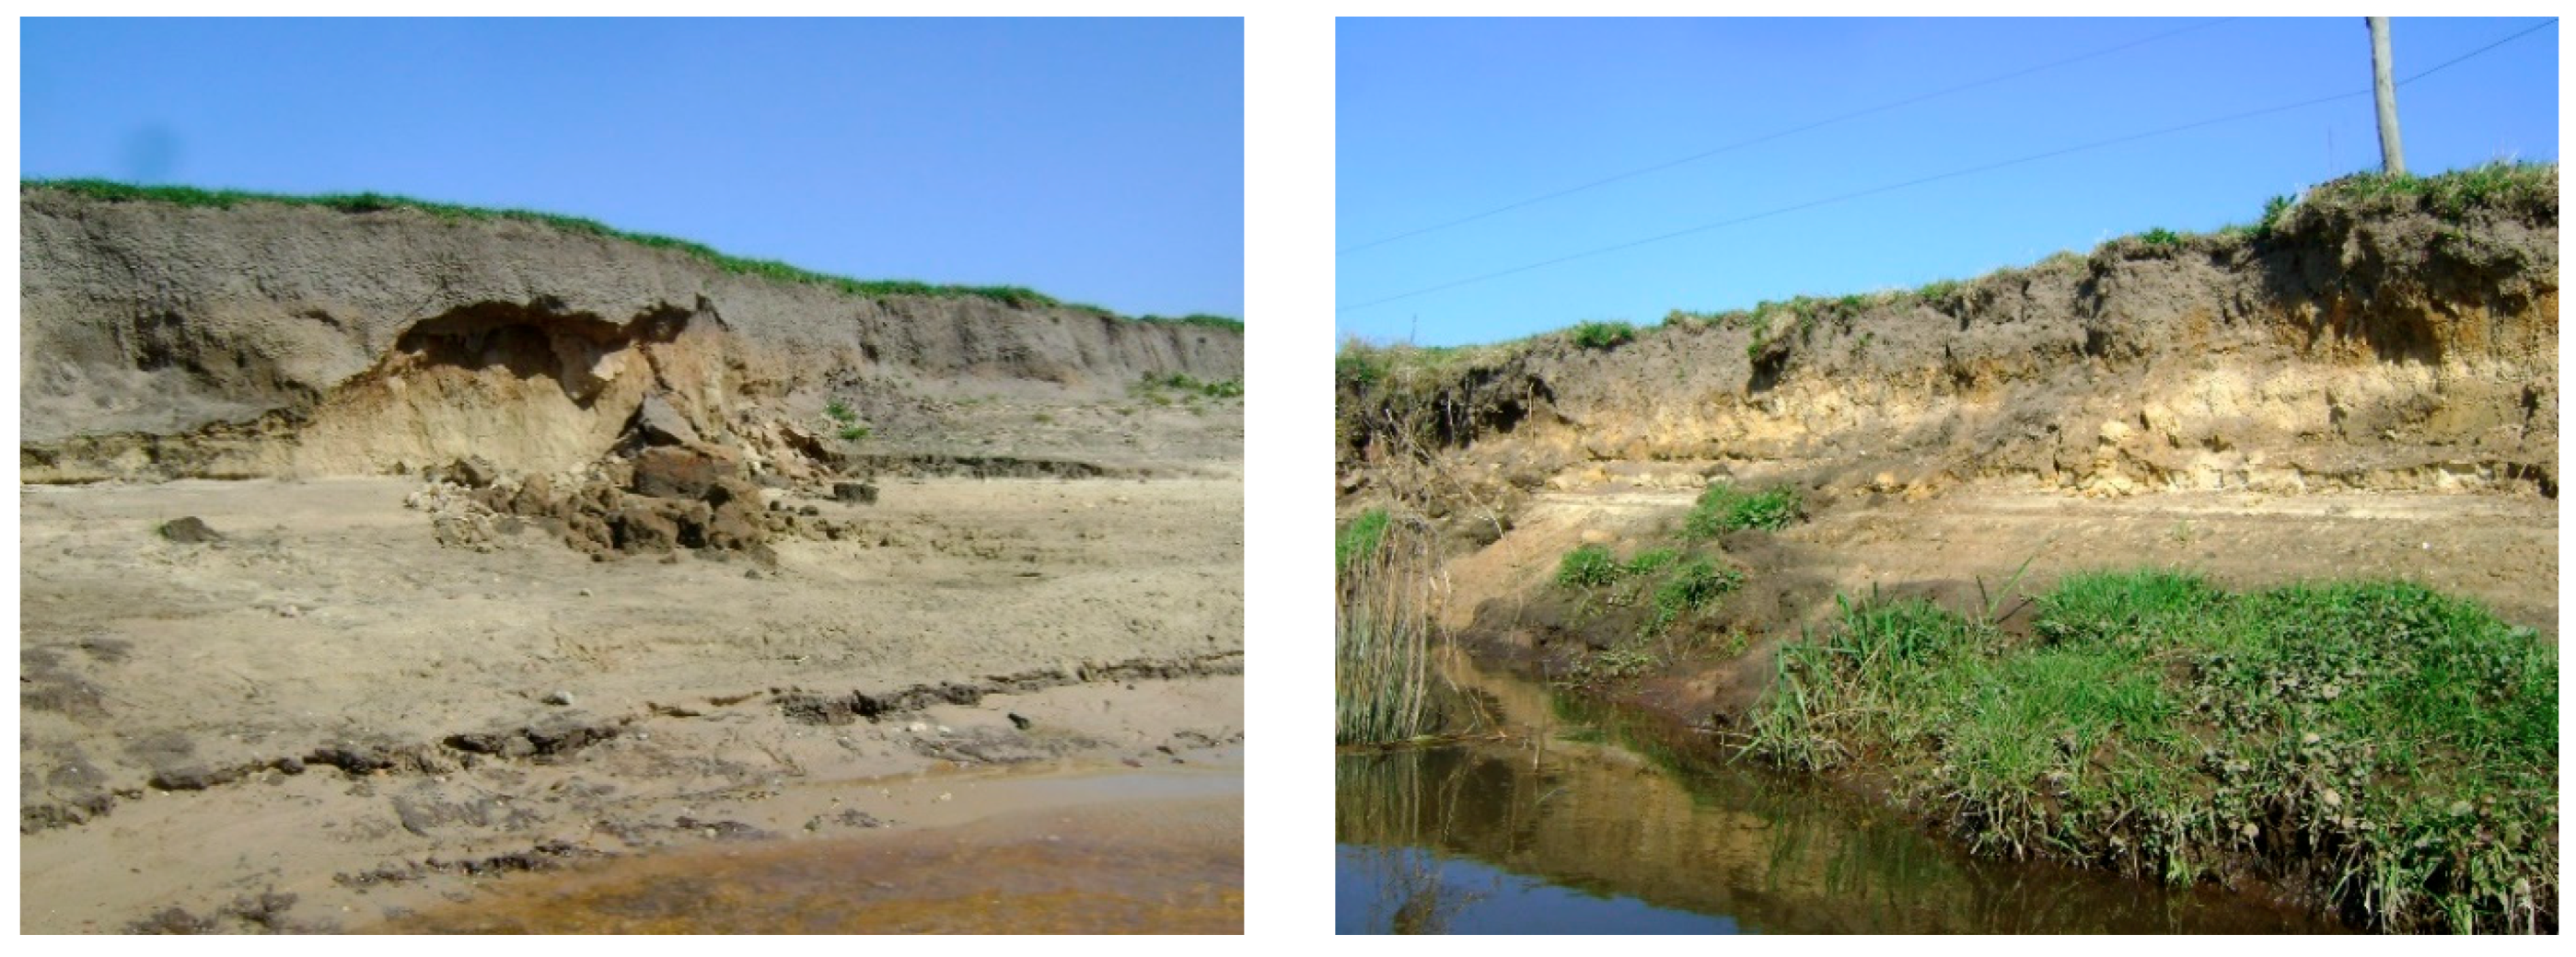
During the field survey, in total, 143 channel bends were recognized and documented in sections North and West (Figure 2). Along almost the entire length of the river, visual signs of erosion and sedimentation were found (Figure 5 and Figure 6). Erosion was indicated by clear and steep cut banks. Many cut banks also showed undermining: In many cases, the topsoil (±30 cm) was held together by plant roots, while beneath this layer, the banks were being incised, causing the banks to overhang the channel and sometimes show signs of collapse. Sedimentation was present as unvegetated, freshly deposited point bars in the inner bends. The point bars indicate sediment transport and storage in the system, and thus active morphological processes. In addition, the water was fairly turbid, a sign of the transport of suspended load. The field classification led to 85 bends being categorized as erosive, 42 as non-erosive, and 16 as inconclusive. This means that the majority of the documented river bends showed signs of present activity, indicating that the river is more active than suggested by the classification in the stability diagram.
4.3. Lateral Migration Based on Historical Map Data Analysis
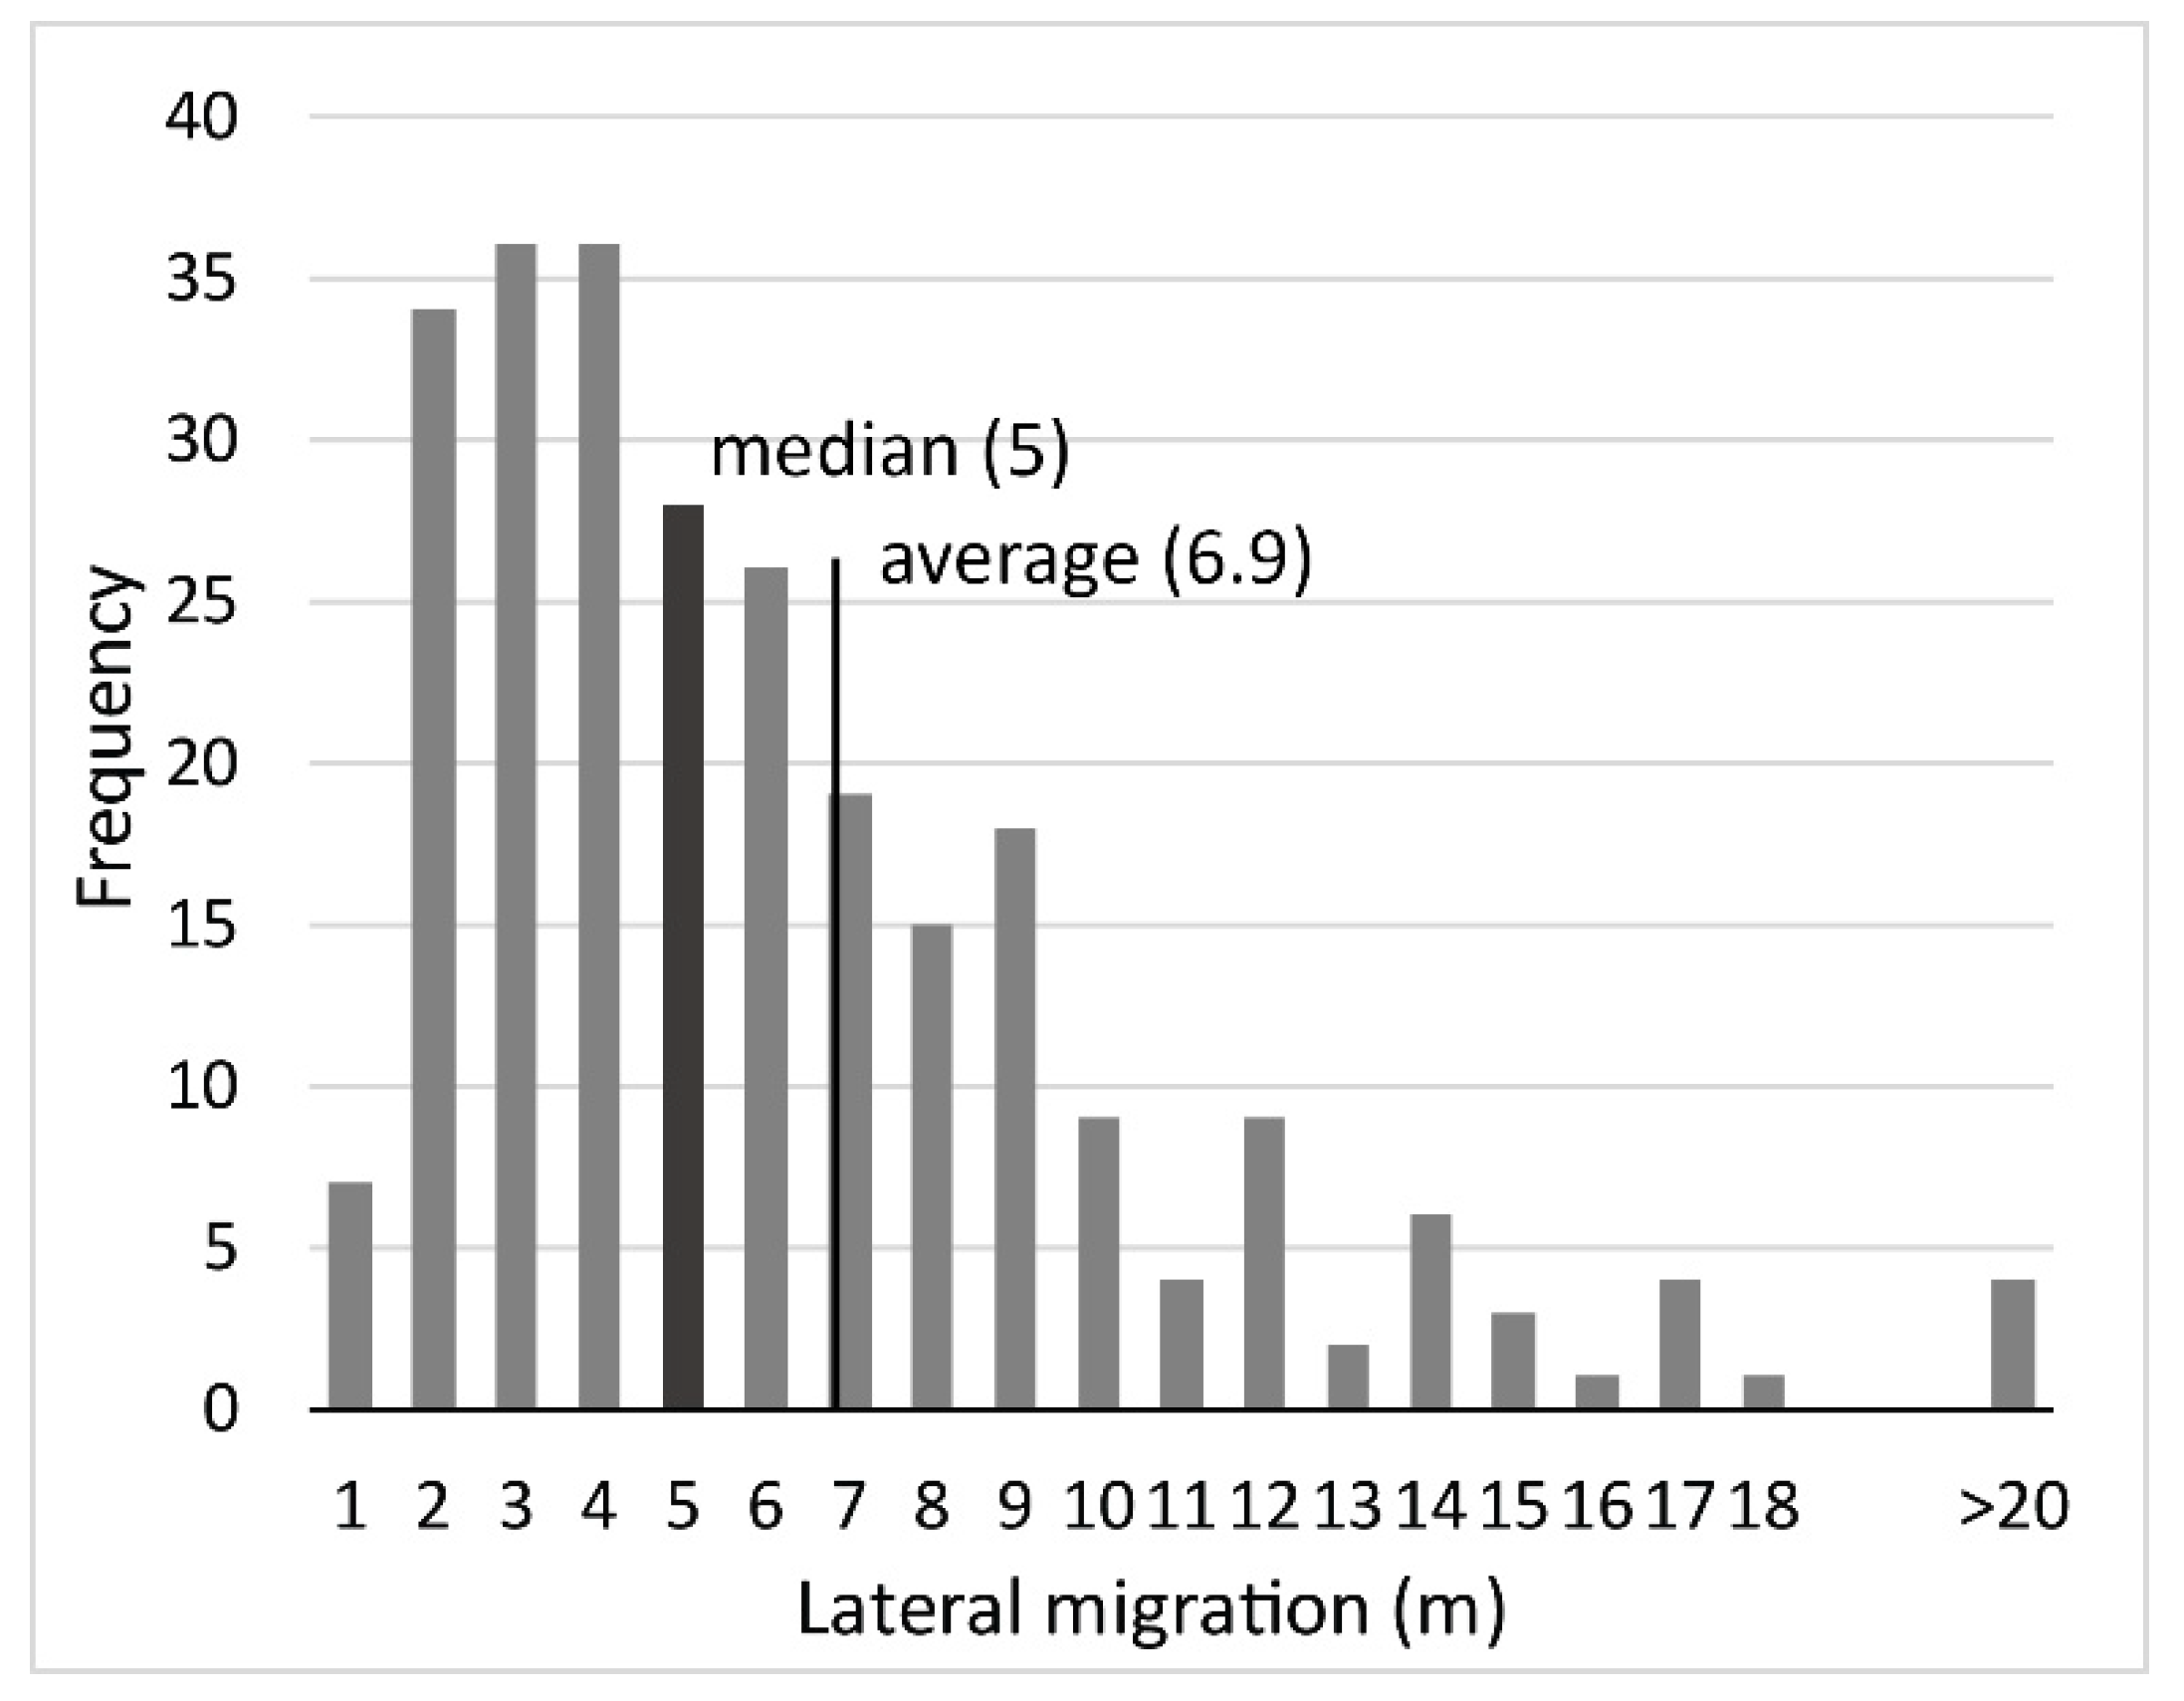
Figure 7 shows the descriptive statistics and frequency distribution of the lateral channel migration per bend over the period 1924–2009 based on the historical map analysis. On the basis of 262 individual stream bends, it was shown that the lateral migration over the 85-year period averaged at 6.9 m (±4.4; 1σ), which equals an annual migration rate of around 0.08 m/y (±0.05 m/y). Migration distances showed a large variation ranging from 1 to 28 m (0.01–0.33 m/y). This is relatively low for catchments of this size as compared to overviews by Hooke [60] and Lawler et al. [61]. Only one natural channel cut-off occurred in the period 1924–2009, which was already noted by Kuenen [46]. Other cut-offs from earlier times are known but very rare. They seem to be the result of local channelization by farmers to improve local drainage for the benefit of the surrounding grasslands (Koopman, pers. comm.), which is confirmed by the relative lack of abandoned channels or oxbow lakes.
Both the field survey and the historical map analysis show that erosional and sedimentary processes were active during the last 85 years in the river system. A chi-square statistical analysis (Table 3) shows that currently active erosional cut banks, as observed in the field, show significantly higher lateral migration rates for the period 1924–2009 than inactive cut banks (observed in the field as vegetated) over the same period. This means that bends observed as ‘erosive’ in the field correspond with bends with high migration rates according to the historical maps analysis. The field survey therefore confirms that historically active bends are mostly still active today.
4.4. Spatial Variation in Lateral Migration Rates
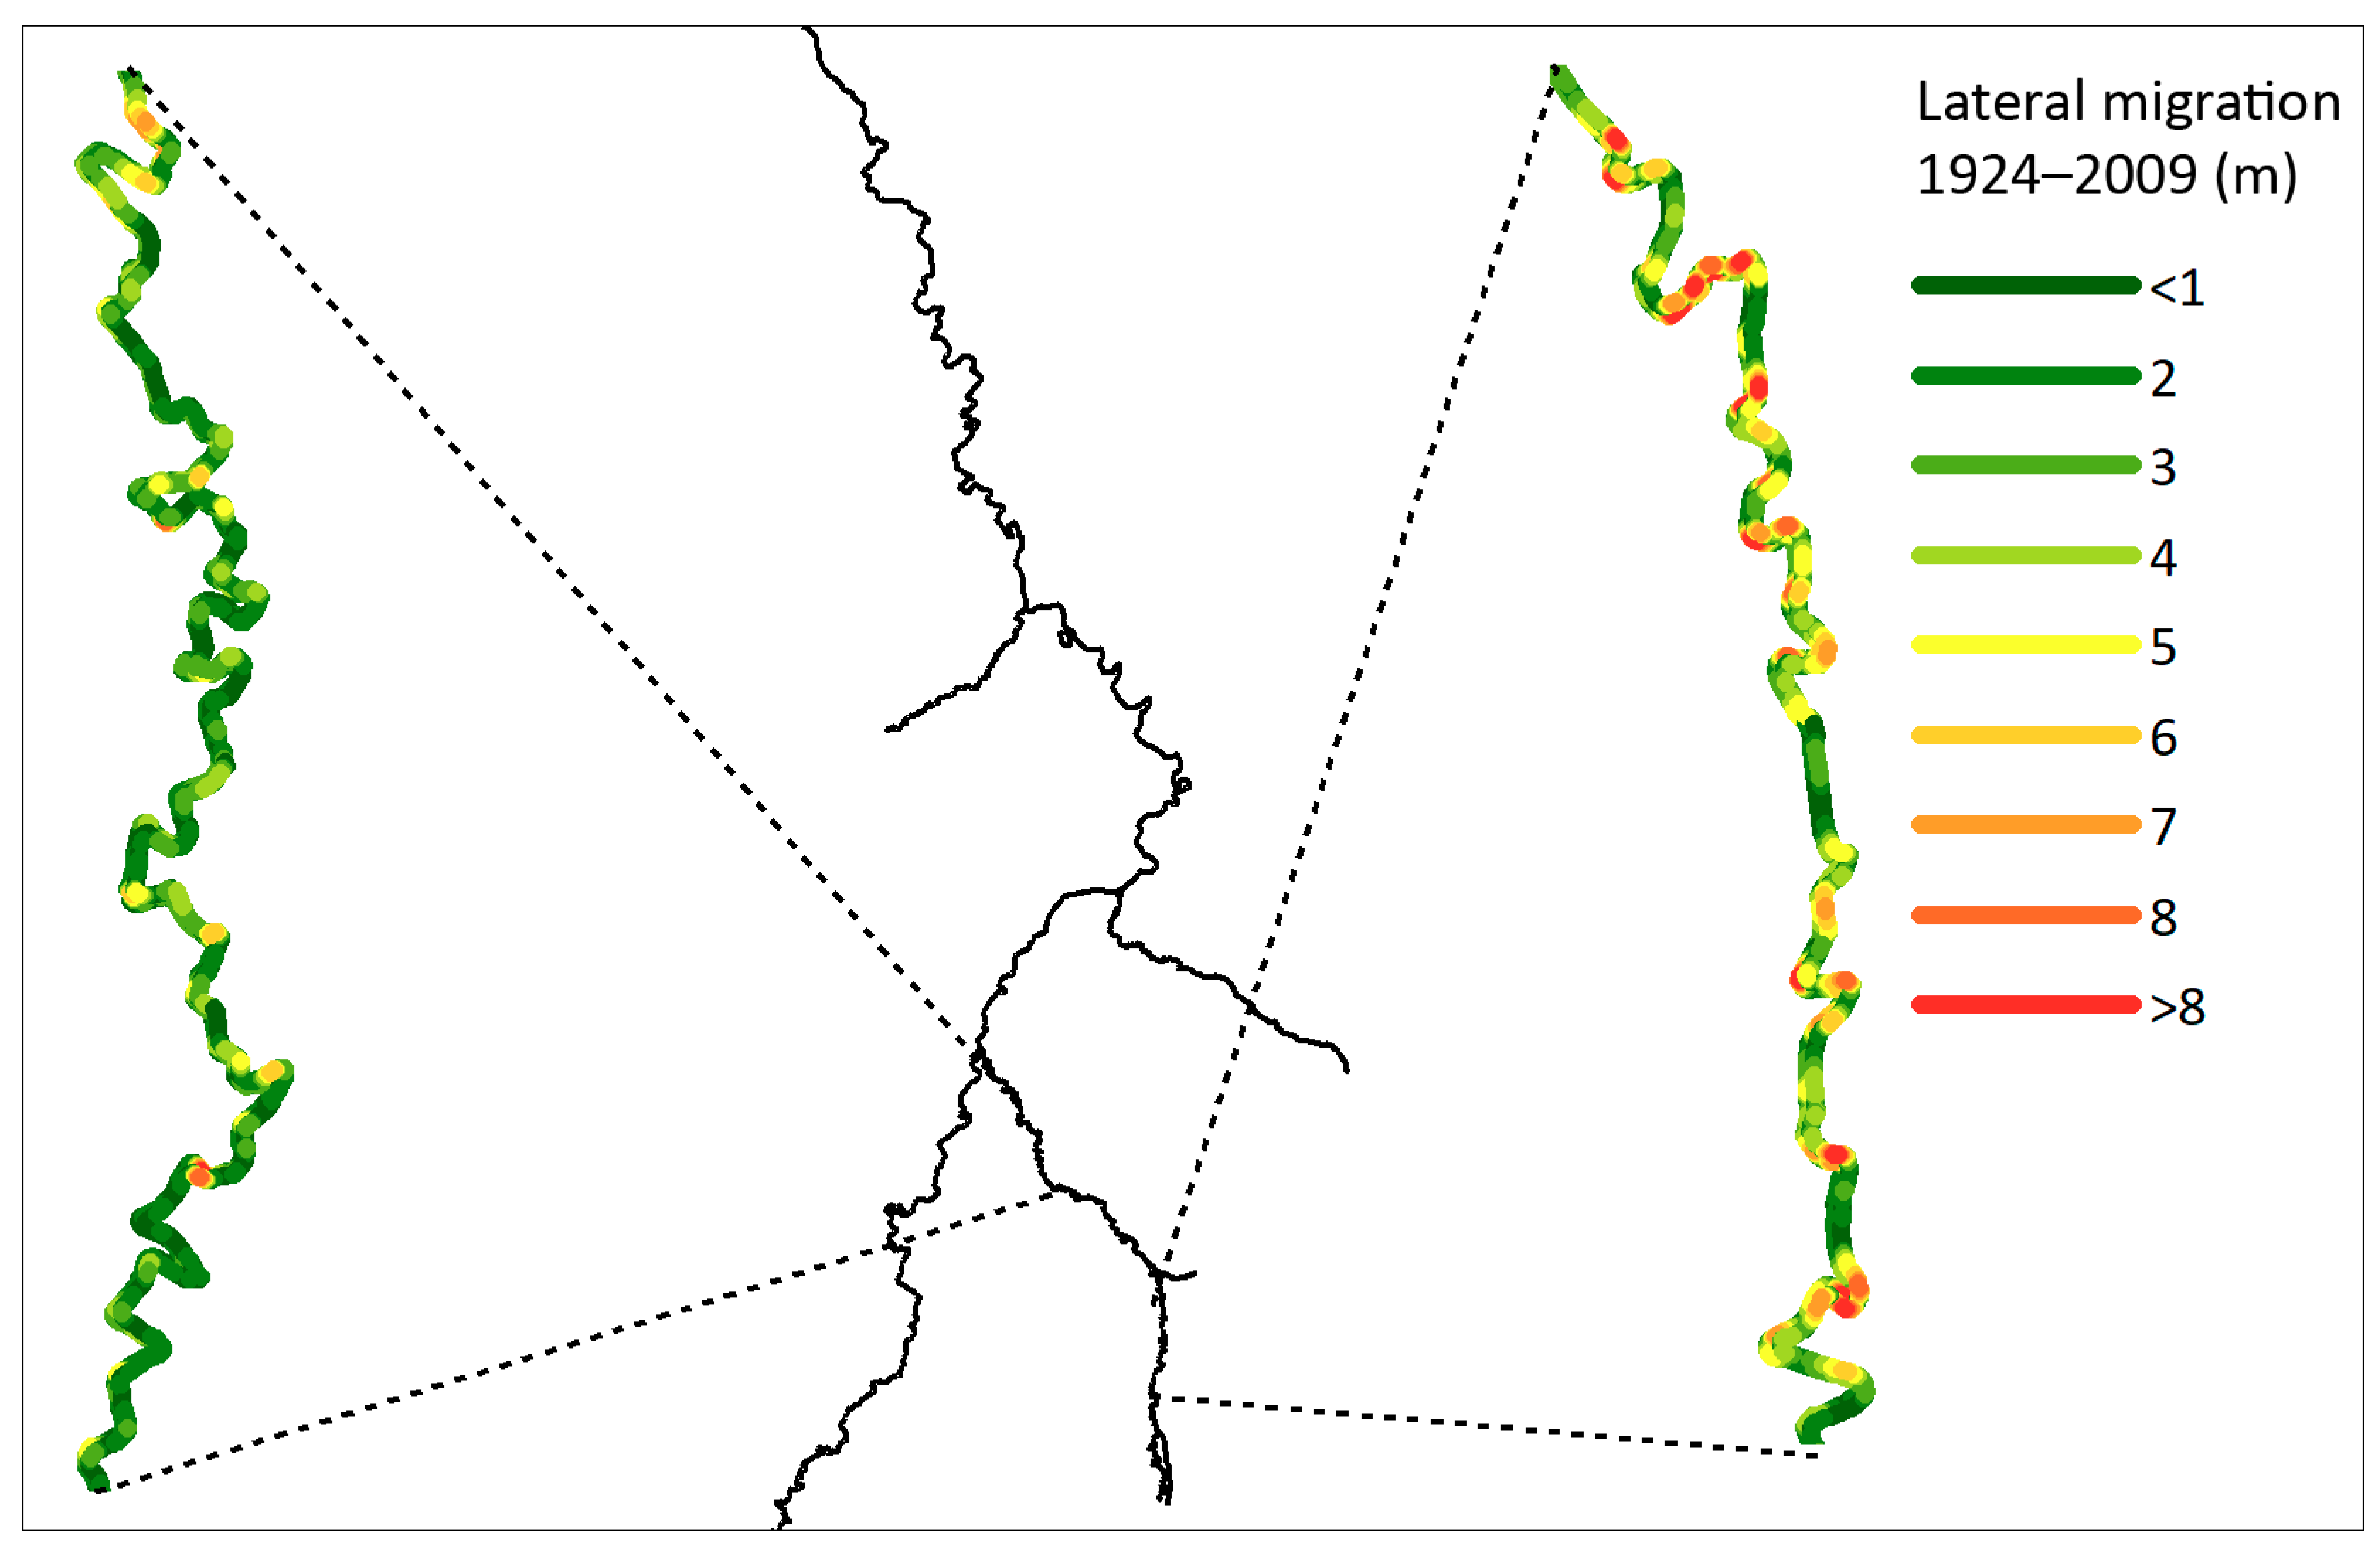
In order to get an idea of the spatial variability in lateral migration, the migration rates along the entire stream were mapped based on the historical map analysis. Figure 8 shows a visual representation of the variable lateral migration for section East—channel subsections where higher or lower migration rates appear to be heterogeneously distributed. The upstream part of the Gastersche Diep shows areas with relatively high migration rates, while the downstream part is much more stable over the 85-year period.
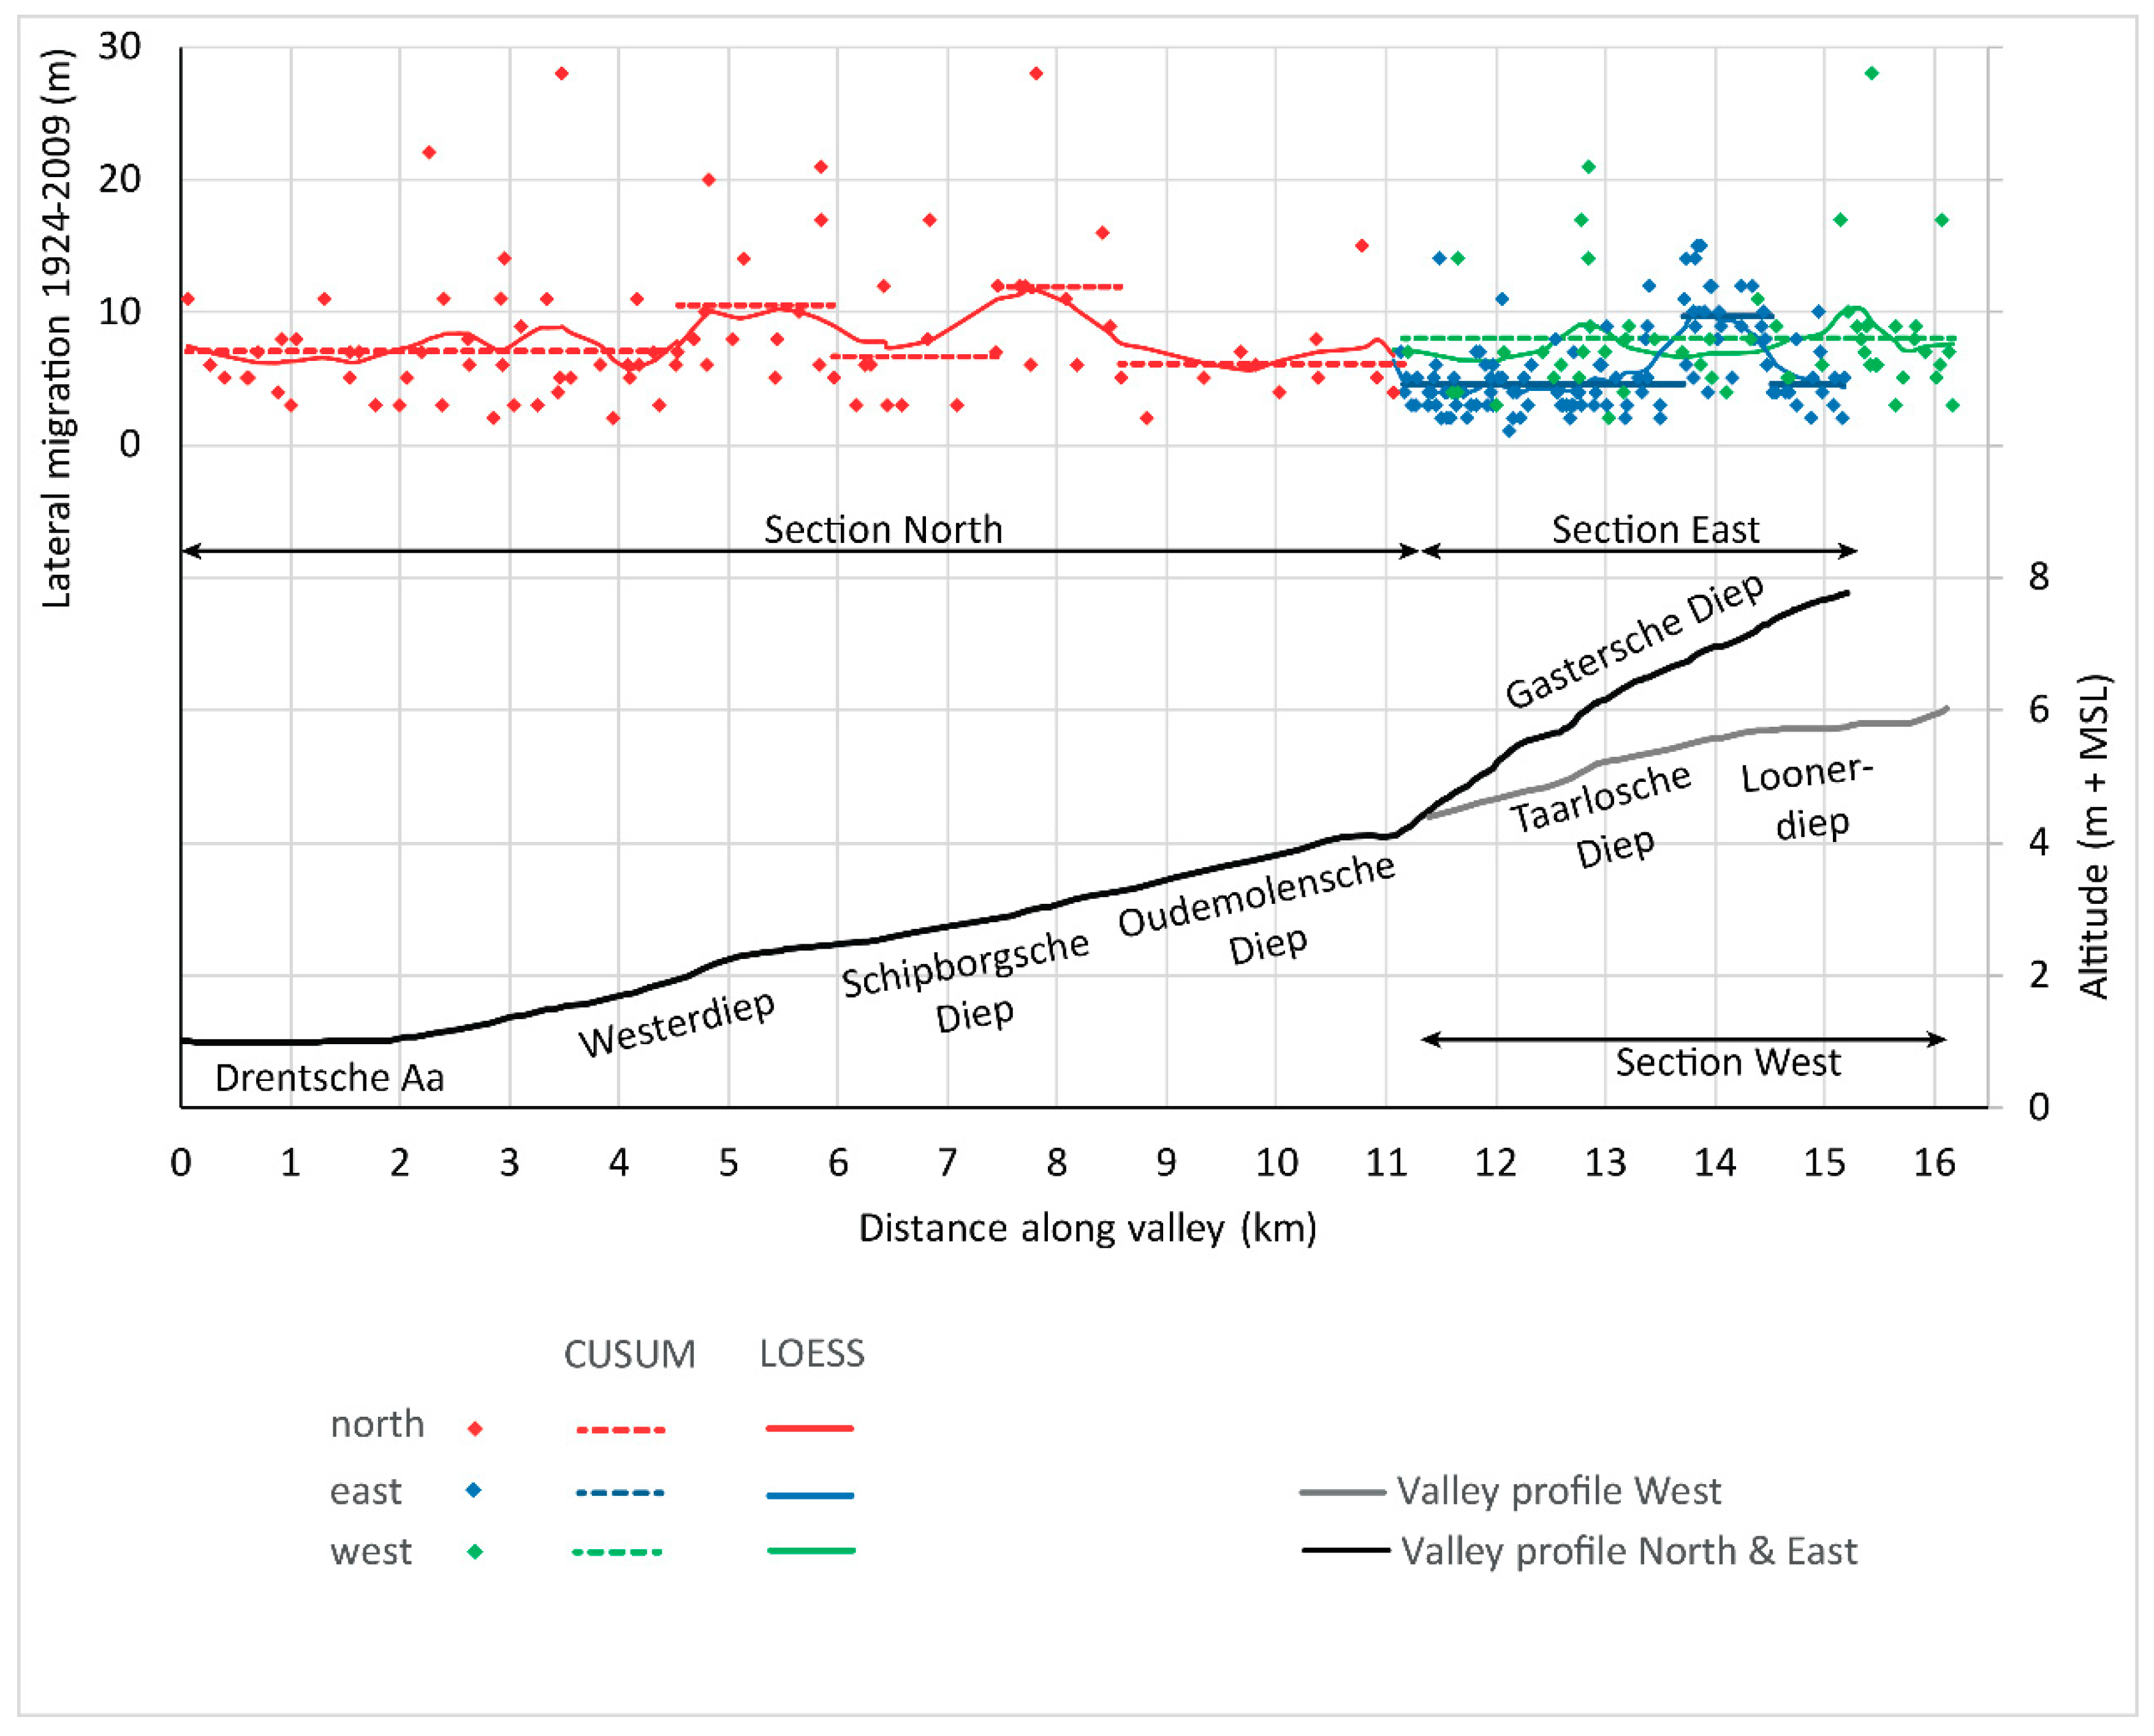
Figure 9 shows the spatial variation in lateral migration along the stream valley profile using locally estimated scatterplot smoothing (LOESS). It shows that the average lateral migration is around 7 m between 1924 and 2009 but is spatially strongly variable. At around 5.5 and 8 km, distance points in the northern section, and around 14 km in the eastern section, lateral migration appears to be locally higher. This is confirmed by the CUSUM analysis results, which show stepwise changes in lateral migration at around the same locations (Table 4). However, only the stepwise change at around 8580 m was significant, with confidence of p < 0.05. Other steps were identified by the CUSUM analyses but with much lower confidence. We can therefore conclude that at individual bend scale, lateral migration is highly variable. At section scale levels, some variability is observed, but this is relatively limited. This may indicate that local factors dominate lateral migration rates.
4.5. Valley Slope and Channel Sinuosity
To further assess the impact of local factors on lateral migration, Table 5 shows channel sinuosity, valley slope, and lateral migration 1924–2009 for the subsections of the river network and the Pearson’s non-parametric correlation results. The average valley slope is 0.00052 m/m and varies between 0 and 0.00125 m/m, indicating that valley slopes are generally low show but do show substantial spatial variation. Sinuosity varies between 1.1 and 2.1 with an average of 1.5. This means, that the planform of the river as a whole is at the intersection between sinuous (1.05 < P < 1.5) and meandering (P > 1.5) classes, according to the Gurnell et al. [24] classification system. However, the planform of the different subsections can be classified as distinctively different on both sides of the classification boundary, with values ranging from P = 1.06 to P = 2.12, indicating that the river shows a highly spatially varying nature of sinuosity in its planform. Average migration rates per subsection vary between 1.0 and 7.9 m in the 85-year period. Pearson correlation coefficients (Table 5) indicate that there are no significant correlations between valley slope, sinuosity, and lateral migration rates.
4.6. Geomorphological and Soil Map Analysis
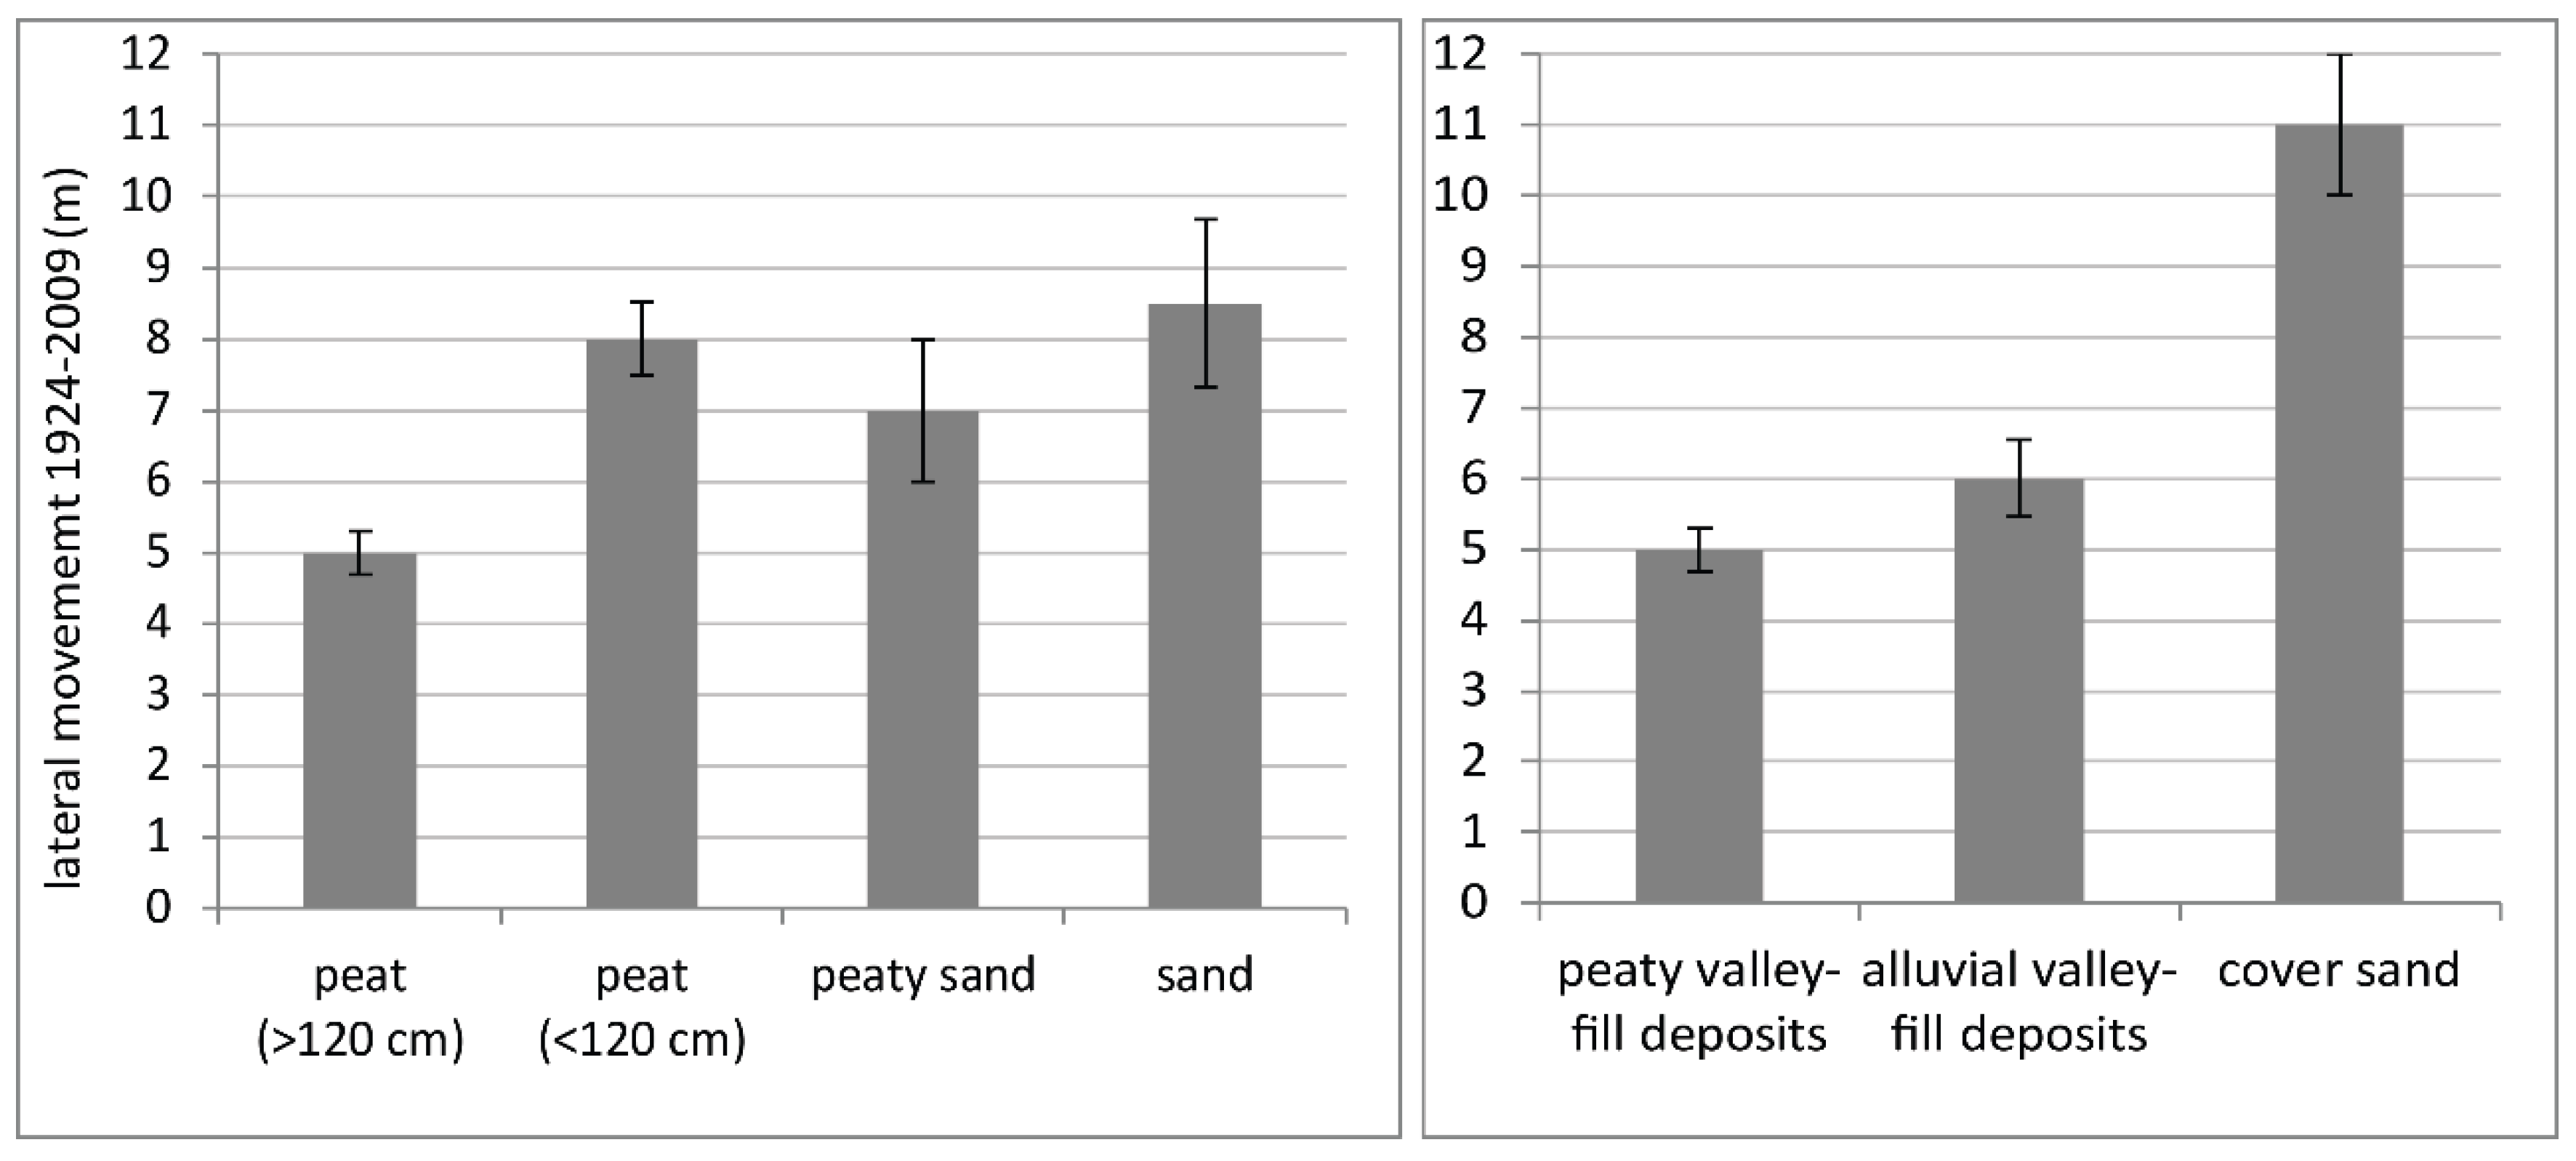
When classifying the individual stream bends based on geomorphological and soil mapping units, both maps show a significant difference in median lateral migration (Table 6 and Table 7 and Figure 10). For the bends located in the geomorphological map unit ‘cover sand’, which represent late Weichselian aeolian deposits, lateral migration rates are significantly higher (p < 0.01) than both the Holocene alluvial and peaty valley fill deposits. Within the Holocene geomorphological map units, river bends in alluvial valley fill sediments show significantly higher (p < 0.05) migration rates than the peaty valley fill deposits.
Applying the same methodology using the soil map provides similar results, in which the migration rates between the soil units are statistically different (p < 0.01). Between groups, river bends in sandy soil units show significantly higher (p < 0.01) migration rates with respect to the deeper peat soils (>120 cm). The difference is not significant between bends in sandy soils compared to soil types with shallow peat layers (as indicated as less than 120 cm in thickness on the soil map). Lateral migration rates in deep peat soils are significantly lower (p < 0.01) than rates in shallow peat soils. So, using both the geomorphological and soil map units, units with clastic deposits (mostly aeolian cover sand) showed significantly higher lateral migration rates.
5. Conclusions, Discussion, and Recommendations
The planform of the Drentsche Aa river is spatially variable and, based on its sinuosity, it can be classified on both sides of the (irregular) sinuous and meandering boundary using the Gurnell et al. [24] river planform classification system. With relatively low bankfull discharge levels (Qbf = 6.8 m3/s; ωpv =1.6 W/m2), the stream is regarded as a low-energy river. By plotting four river sites in the Kleinhans and Van den Berg [10] empirical stability diagram, the river is positioned in the lowest field. Although the empirical stability diagram was not designed for rivers with such low bankfull discharges, the diagram was applied here as a frame of reference rather than a hard classification method, as placing the river in the diagram may also help to validate the diagram for low-energy rivers. According to the position in the diagram and using the Gurnell et al. [24] classification, the Drentsche Aa river should be nearly immobile.
However, field observations reveal that the Drentsche Aa shows active signs of erosion and sedimentation processes, indicated by bare vertical cut-banks and fresh point bars in the channel. Moreover, the historical map analysis also shows proof of lateral migration, with average migration rates of 0.08 m/y over the last 85 years. Locations with observed active erosion in the field correspond to statistically significant higher lateral migration rates than locations where no or little active erosion has been observed, according to the historical map analysis. Our interpretation, therefore, is that historical lateral migration rates for the period 1924–2009 are representative for current-day conditions. This means that, although the river is classified as a low-energy stream, this does not mean it is a non-dynamic river. This confirms that the stability diagram is not applicable for this low-energy stream, since the diagram classifies the stream as ‘lateral immobile’. Energy levels (e.g., bankfull discharge and stream slope) and sediment bedload grain size alone, therefore, do not explain the lateral migration in the Drentsche Aa, or at least not in the way as they are related to each other in the current stability diagram.
We observe that lateral migration rates are spatially heterogeneous. Average local migration rates vary between 0 and 0.33 m/y. Some river sections show higher lateral migration rates than others based on CUSUM and LOESS analyses. The degree of lateral migration cannot be explained by valley slope, as the correlation between slope and lateral migration is very weak and statistically insignificant. Moreover, a higher sinuosity does not mean that the river is more actively migrating, since the correlation between lateral migration and sinuosity is also insignificant. This corresponds with the findings by, e.g., Kleinhans and Van den Berg [10] and Gurnell et al. [24]. The spatially heterogeneous nature of lateral migration therefore indicates that lateral activity is controlled by other local scale conditions.
We show that lateral migration of the low-energy river is best explained by valley fill deposits at landscape scale, as indicated by both geomorphological and soil maps. Lateral migration of river bends in peaty valley fill deposits were significantly lower than bends in aeolian sand deposits. Similarly, bends in peaty soil map units showed statistically significant lower lateral migration rates than sandy soil units. This indicates that sandy valley fills and valley sides show less resistance to erosion than organic-rich sediments, and are hence the most important factor in controlling lateral migration in the case study area. This corresponds with findings by several authors that bank composition and texture (e.g., [9,24,37,60]) and organic matter content (e.g., [32,62]) influence lateral migration rates. These observations add contemporary evidence to the oblique aggradation model based on several cross-sections in the same study area by Candel et al. [11]. The stream tends to be more laterally active in sandy deposits, resulting in the stream adhering to the sandy valley sides or aeolian dunes embedded in the peat valley fill. We show that this process has also been active over the last 85 years.
As soil and geomorphological maps on a 1:50,000 scale were used, the influence of valley-scale heterogeneity on lateral migration was captured. Bank composition variability at the local scale is not covered in this analysis. Banks composed of deposits formed in local conditions, such as former stream beds or overbank deposits, are not represented in the maps. Detailed field data on composition and organic matter contents could provide more information. However, the process of lateral migration is self-destructive, meaning that former banks were eroded during the migration process and its composition cannot be established. Field campaigns are not useful for studying the lateral migration rates over the last 85 years, but if historical archived soil borings are available, they may prove useful to capture the plot-scale variability. Detailed determination of bank composition in combination with field measurements of lateral migration would improve the knowledge at the local scale.
In addition, in the case of typical Dutch low-energy river valleys, a more thorough understanding of direct and indirect human influences is necessary. We need to assess the extent to which human action in the past has influenced hydrological discharge levels at the catchment scale and channel cross sections at the local scale in order to quantify possible effects on lateral migration rates. In that way, it is possible to determine whether current-day migration rates can be regarded as natural reference levels, or whether they are to be seen (as part of) a human artefact. This would require an interdisciplinary approach, combining knowledge from geomorphological, historical hydrological, and cultural historical disciplines.
We can conclude that the heterogenic composition of the valley fill deposits is more dominant in determining lateral migration in the low-energy river than factors such as valley slope, specific energy, and bedload grain size. This explains the heterogenic character of migration rates along the river, as was already observed but not explained in this catchment by Kuenen [46].
Extending these findings to low-energy lowland rivers in general, river rehabilitation plans should not only be based on the planform of the last situation before channelization, but also study earlier planforms and the composition of the valley fill to assess historical morphological processes that may reflect natural conditions for the specific water course. Dominant local conditions may have implications for how rehabilitation projects should be designed, as well as for the way the streams should be managed after the reconstruction of the channel. This will eventually lead to rehabilitation designs that truly reflect a more natural state of the river.
Author Contributions
E.W.M. acquired funding for the project and designed the experimental setup. E.W.M. and F.M. jointly conceptualized the research. F.M. carried out the field and lab measurements and GIS analysis, and E.W.M. performed the CUSUM, LOESS, and statistical analyses. The figures were drawn by F.M. and E.W.M. F.M. prepared the initial report, and E.W.M. and F.M. jointly wrote the manuscript.
Funding
This research was partly funded by the province of Drenthe, Assen, The Netherlands, grant number 201500045.
Acknowledgments
We would like to thank Enno Bregman, Bart Makaske, Jasper Candel, and Viktor Venhorst for valuable discussions. We are thankful to Harry Jager of the Water Board Hunze en Aa’s for providing data. The authors would also like to thank the anonymous reviewers for their constructive feedback.
Conflicts of Interest
The authors declare no conflicts of interest.
References
- Iversen, T.M.; Kronvang, B.; Madsen, B.L.; Markmann, P.; Nielsen, M.B. Re-establishment of Danish streams: Restoration and maintenance measures. Aquat. Conserv. Mar. Freshwat. Ecosyst. 1993, 3, 73–92. [Google Scholar] [CrossRef]
- Vivash, R.; Ottosen, O.; Janes, M.; Sørensen, H.V. Restoration of the rivers Brede, Cole and Skerne: A joint Danish and British EU-LIFE demonstration project, II—the river restoration works and other related practical aspects. Aquat. Conserv. Mar. Freshwat. Ecosyst. 1998, 8, 197–208. [Google Scholar] [CrossRef]
- Lorenz, A.W.; Jähnig, S.C.; Hering, D. Re-meandering German lowland streams: Qualitative and quantitative effects of restoration measures on hydromorphology and macroinvertebrates. Environ. Manag. 2009, 44, 745–754. [Google Scholar] [CrossRef] [PubMed]
- Eekhout, J.P.C.; Hoitink, A.J.F.; De Brouwer, J.H.F.; Verdonschot, P.F.M. Morphological assessment of reconstructed lowland streams in the Netherlands. Adv. Water Resour. 2015, 81, 161–171. [Google Scholar] [CrossRef]
- Meijles, E.W.; Williams, A. Observation of regional hydrological response during time periods of shifting policy. Appl. Geogr. 2012, 34, 456–470. [Google Scholar] [CrossRef]
- Makaske, B.; Maas, G.J. Handboek Geomorfologisch Beekherstel: Leidraad Voor een Stapsgewijze en Integrale Ontwerpaanpak; Stichting Toegepast Onderzoek Waterbeheer: Amersfoort, The Netherlands, 2015. [Google Scholar]
- Brookes, A.; Shields, F.D., Jr. River Channel Restoration: Guiding Principles for Sustainable Projects; John Wiley & Sons: Chichester, UK, 1996. [Google Scholar]
- Wolfert, H.P. Geomorphological Change and River Rehabilitation: Case Studies on Lowland Fluvial Ystems in the Netherlands; University Utrecht: Utrecht, The Netherlands, 2001. [Google Scholar]
- Wolfert, H.P.; Maas, G.J. Downstream changes of meandering styles in the lower reaches of the River Vecht, the Netherlands. Neth. J. Geosci. 2007, 86, 257–271. [Google Scholar] [CrossRef] [Green Version]
- Kleinhans, M.G.; Van den Berg, J.H. River channel and bar patterns explained and predicted by an empirical and a physics-based method. Earth Surf. Process. Landf. 2011, 36, 721–738. [Google Scholar] [CrossRef]
- Candel, J.H.J.; Makaske, B.; Storms, J.E.A.; Wallinga, J. Oblique aggradation: A novel explanation for sinuosity of low-energy streams in peat-filled valley systems. Earth Surf. Process. Landf. 2017, 42, 2679–2696. [Google Scholar] [CrossRef]
- Nanson, G.C.; Croke, J.C. A genetic classification of floodplains. Geomorphology 1992, 4, 459–486. [Google Scholar] [CrossRef] [Green Version]
- Leopold, L.B.; Miller, J.P. Ephemeral Streams: Hydraulic Factors and Their Relation to the Drainage Net; United States Geological Survey: Washington, DC, USA, 1956. [Google Scholar]
- Leopold, L.B.; Wolman, M.G. River Channel Patterns: Braided, Meandering, and Straight; United States Geological Survey: Washington, DC, USA, 1957. [Google Scholar]
- Leopold, L.B.; Wolman, M.G.; Miller, J.P. Fluvial Processes in Geomorphology; W.H. Freeman and Company: San Francisco, CA, USA, 1964. [Google Scholar]
- Richards, K.S. Rivers: Form and Process in Alluvial Channels; Methuen: London, UK, 1982. [Google Scholar]
- Van den Berg, J.H. Prediction of alluvial channel pattern of perennial rivers. Geomorphology 1995, 12, 259–279. [Google Scholar] [CrossRef]
- Knighton, A.D. Downstream variation in stream power. Geomorphology 1999, 29, 293–306. [Google Scholar] [CrossRef]
- Güneralp, İ.; Rhoads, B.L. Influence of floodplain erosional heterogeneity on planform complexity of meandering rivers. Geophys. Res. Lett. 2011, 38, 1–6. [Google Scholar] [CrossRef]
- Dragićević, S.; Pripužić, M.; Živković, N.; Novković, I.; Kostadinov, S.; Langović, M.; Milojković, B.; Čvorović, Z. Spatial and temporal variability of bank erosion during the period 1930–2016: Case Study—Kolubara River Basin (Serbia). Water 2017, 9, 748. [Google Scholar] [CrossRef]
- Parsapour-Moghaddam, P.; Rennie, C. Influence of meander confinement on hydro-morphodynamics of a cohesive meandering channel. Water 2018, 10, 354. [Google Scholar] [CrossRef]
- Gregory, K.J. The human role in changing river channels. Geomorphology 2006, 79, 172–191. [Google Scholar] [CrossRef]
- Ackers, P.; Charlton, F.G. Meander geometry arising from varying flows. J. Hydrol. 1970, 11, 230–252. [Google Scholar] [CrossRef]
- Gurnell, A.M.; Bussettini, M.; Camenen, B.; González del Tánago, M.; Grabowski, R.; Hendriks, D.; Henshaw, A.; Latapie, A.; Rinaldi, M.; Surian, N. A hierarchical multi-scale framework and indicators of hydromorphological processes and forms. Proj. Rep. REFORM D. 2014, 237. [Google Scholar]
- Nanson, G.C.; Knighton, A.D. Anabranching rivers: Their cause, character and classification. Earth Surf. Process. Landf. 1996, 21, 217–239. [Google Scholar] [CrossRef]
- Bledsoe, B.P.; Watson, C.C. Logistic analysis of channel pattern thresholds: Meandering, braiding, and incising. Geomorphology 2001, 38, 281–300. [Google Scholar] [CrossRef]
- Makaske, B.; Smith, D.G.; Berendsen, H.J.; De Boer, A.G.; Van Nielen-Kiezebrink, M.F.; Locking, T. Hydraulic and sedimentary processes causing anastomosing morphology of the upper Columbia River, British Columbia, Canada. Geomorphology 2009, 111, 194–205. [Google Scholar] [CrossRef]
- Makaske, B.; Van der Deijl, E.; Kleinhans, M.G. Het natuurlijke patroon van beken: Slingerend of meanderend? Landsch. Tijdschr. Landsch. Milieukd. 2016, 4, 185–193. [Google Scholar]
- Dépret, T.; Gautier, E.; Hooke, J.; Grancher, D.; Virmoux, C.; Brunstein, D. Causes of planform stability of a low-energy meandering gravel-bed river (Cher River, France). Geomorphology 2017, 285, 58–81. [Google Scholar] [CrossRef]
- Eaton, B.C.; Millar, R.G.; Davidson, S. Channel patterns: Braided, anabranching, and single-thread. Geomorphology 2010, 120, 353–364. [Google Scholar] [CrossRef]
- Güneralp, İ.; Abad, J.D.; Zolezzi, G.; Hooke, J. Advances and challenges in meandering channels research. Geomorphology 2012, 163, 1–9. [Google Scholar] [CrossRef]
- Wynn, T.; Mostaghimi, S. The effects of vegetation and soil type on streambank erosion, Southwestern Virginia, USA. J. Am. Water Resour. Assoc. 2006, 42, 69–82. [Google Scholar] [CrossRef]
- Gradziński, R.; Baryła, J.; Doktor, M.; Gmur, D.; Gradziński, M.; Kędzior, A.; Paszkowski, M.; Soja, R.; Zieliński, T.; Żurek, S. Vegetation-controlled modern anastomosing system of the upper Narew River (NE Poland) and its sediments. Sediment. Geol. 2003, 157, 253–276. [Google Scholar] [CrossRef]
- Appels, W.M.; Hoitink, A.; Hoekman, D.H. Planform geometry of peat meanders. In Proceedings of the RCEM River, Coastal and Estuarine Morphodynamics, Enschede, The Netherlands, 17–21 September 2007; pp. 271–277. [Google Scholar]
- Fisk, H.N. Geological Investigation of the Alluvial Valley of the Lower Mississippi River; Louisiana State University: Baton Rouge, LA, USA, 1944. [Google Scholar]
- ASCE Task Committee. River width adjustment. I: Processes and mechanisms. J. Hydraul. Eng. 1998, 124, 881–902. [Google Scholar] [CrossRef]
- Eekhout, J.P.C.; Hoitink, A.J.F.; Makaske, B. Historical analysis indicates seepage control on initiation of meandering. Earth Surf. Process. Landf. 2013, 38, 888–897. [Google Scholar] [CrossRef]
- Meijles, E.W.; Van Hoven, B. Using the rural atelier as an educational method in landscape studies. J. Geogr. High. Educ. 2010, 34, 541–560. [Google Scholar] [CrossRef]
- Querner, E.P. Water management measures analysed for Dutch basins to reduce flooding. J. Water Land Devel. 2007, 11, 45–58. [Google Scholar] [CrossRef]
- Roelsma, J.; Van der Bolt, F.J.E.; Leenders, T.P.; Renaud, L.V. Systeemanalyse Voor Het Stroomgebied Van de Drentse Aa, Fase 1; Alterra: Wageningen, The Netherlands, 2006. [Google Scholar]
- Maas, G.J.; Van Delft, S.P.J.; Heidema, A.H. Toelichting Bij de Legenda Geomorfologische Kaart Van Nederland 1:50 000; Wageningen Environmental Research: Wageningen, The Netherlands, 2017. [Google Scholar]
- De Gans, W. The Drentsche Aa Valley System: A Study in Quaternary Geology; Vrije Universiteit Amsterdam: Amsterdam, The Netherlands, 1981. [Google Scholar]
- Bregman, E.; Maas, G.; Makaske, B.; Meijles, E.W. Vormgegeven door ijs, water en wind: De opbouw van het landschap. In Landschapsbiografie Van de Drentsche Aa; Spek, T., Elerie, J.N.H., Bakker, J.P., Noordhoff, I., Eds.; Koninklijke Van Gorcum: Assen, The Netherlands, 2015; pp. 18–53. [Google Scholar]
- Maas, G.; Makaske, B.; Meijles, E.W. De deken plooit zich: Het aardkundige landschap op de kaart. In Landschapsbiografie Van de Drentsche Aa; Spek, T., Elerie, J.N.H., Bakker, J.P., Noordhoff, I., Eds.; Koninklijke Van Gorcum: Assen, The Netherlands, 2015; pp. 82–105. [Google Scholar]
- Makaske, B.; Maas, G.; Grootjans, A.P.; Meijles, E.W.; Everts, H.; De Vries, N. Een veendek verschijnt en verdwijnt: Grondwaterstromen en veenvorming. In Landschapsbiografie Van de Drentsche Aa; Spek, T., Elerie, J.N.H., Bakker, J.P., Noordhoff, I., Eds.; Koninklijke Van Gorcum: Assen, The Netherlands, 2015; pp. 54–81. [Google Scholar]
- Kuenen, P.H. De Drentsche riviertjes en het meandervraagstuk. In Overdruk uit Gedenkboek P. Tesch; Verhandelingen Van Het Geologisch Mijnbouwkundig Genootschap Voor Nederland en Kolonieën.; Mouton: Gravenhage, The Netherlands, 1944; pp. 313–336. [Google Scholar]
- Faber, T. Regimes and Regime-Related Basin Properties of Some Dutch Small Rivers; Free University Amsterdam: Amsterdam, The Netherlands, 1972. [Google Scholar]
- Van Dorland, R.; Jansen, B. De Staat Van Het Klimaat 2006: Actueel Onderzoek en Beleid Nader Verklaard; Platform Communication on Climate Change: De Bilt/Wageningen, The Netherlands, 2006. [Google Scholar]
- Bakker, J.P.; Everts, H.; Grootjans, A.P.; De Vries, N.; De Vries, Y. Het grote experiment – vijftig jaar natuurbeheer. In Landschapsbiografie Van de Drentsche Aa; Spek, T., Elerie, J.N.H., Bakker, J.P., Noordhoff, I., Eds.; Koninklijke Van Gorcum: Assen, The Netherlands, 2015; pp. 418–461. [Google Scholar]
- Te Chow, V. Open Channel Hydraulics; McGraw-Hill Book Company, Inc.: New York, NY, USA, 1959. [Google Scholar]
- Williams, G.P. Bank-full discharge of rivers. Water Resour. Res. 1978, 14, 1141–1154. [Google Scholar] [CrossRef]
- Kwaliteitsdocument AHN2. Available online: http://www.ahn.nl/binaries/content/assets/hwh---ahn/common/wat+is+het+ahn/kwaliteitsdocument_ahn_versie_1_3.pdf (accessed on 1 December 2018).
- De Jonge, W.M. Plannen Tot Verbetering Van de Kleine Rivieren in Drenthe; Provincie Drenthe: Assen, The Netherlands, 1924. [Google Scholar]
- Burn, D.H.; Elnur, M.A.H. Detection of hydrologic trends and variability. J. Hydrol. 2002, 255, 107–122. [Google Scholar] [CrossRef]
- Chiew, F.H.S.; McMahon, T.A. Detection of trend or change in annual flow of Australian rivers. Int. J. Climatol. 1993, 13, 643–653. [Google Scholar] [CrossRef]
- Tao, H.; Gemmer, M.; Bai, Y.; Su, B.; Mao, W. Trends of streamflow in the Tarim River Basin during the past 50 years: Human impact or climate change? J. Hydrol. 2011, 400, 1–9. [Google Scholar] [CrossRef]
- Koomen, A.J.M.; Maas, G.J. Geomorfologische Kaart Nederland (GKN); Achtergronddocument Bij Het Landsdekkende Digitale Bestand; Alterra: Wageningen, The Netherlands, 2014. [Google Scholar]
- Stiboka. Bodemkaart van Nederland 1:50.000. Toelichting bij kaartblad 12 Oost Assen; Stiboka: Wageningen, The Netherlands, 1977. [Google Scholar]
- Kuijer, P.C. Bodemkaart Van Nederland 1:50.000: Toelichting Bij Kaartblad 12 West Assen; Stiboka: Wageningen, The Netherlands, 1991. [Google Scholar]
- Hooke, J.M. Magnitude and distribution of rates of river bank erosion. Earth surf. Process. 1980, 5, 143–157. [Google Scholar] [CrossRef]
- Lawler, D.M. The measurement of river bank erosion and lateral channel change: A review. Earth Surf. Process. Landf. 1993, 18, 777–821. [Google Scholar] [CrossRef]
- Nanson, R.A.; Nanson, G.C.; Huang, H.Q. The hydraulic geometry of narrow and deep channels; evidence for flow optimisation and controlled peatland growth. Geomorphology 2010, 117, 143–154. [Google Scholar] [CrossRef] [Green Version]
Figure 1.
Hillshade geomorphological map of the case study area [41], showing the tributaries with all associated names and studied sections of the stream network.
Figure 1.
Hillshade geomorphological map of the case study area [41], showing the tributaries with all associated names and studied sections of the stream network.

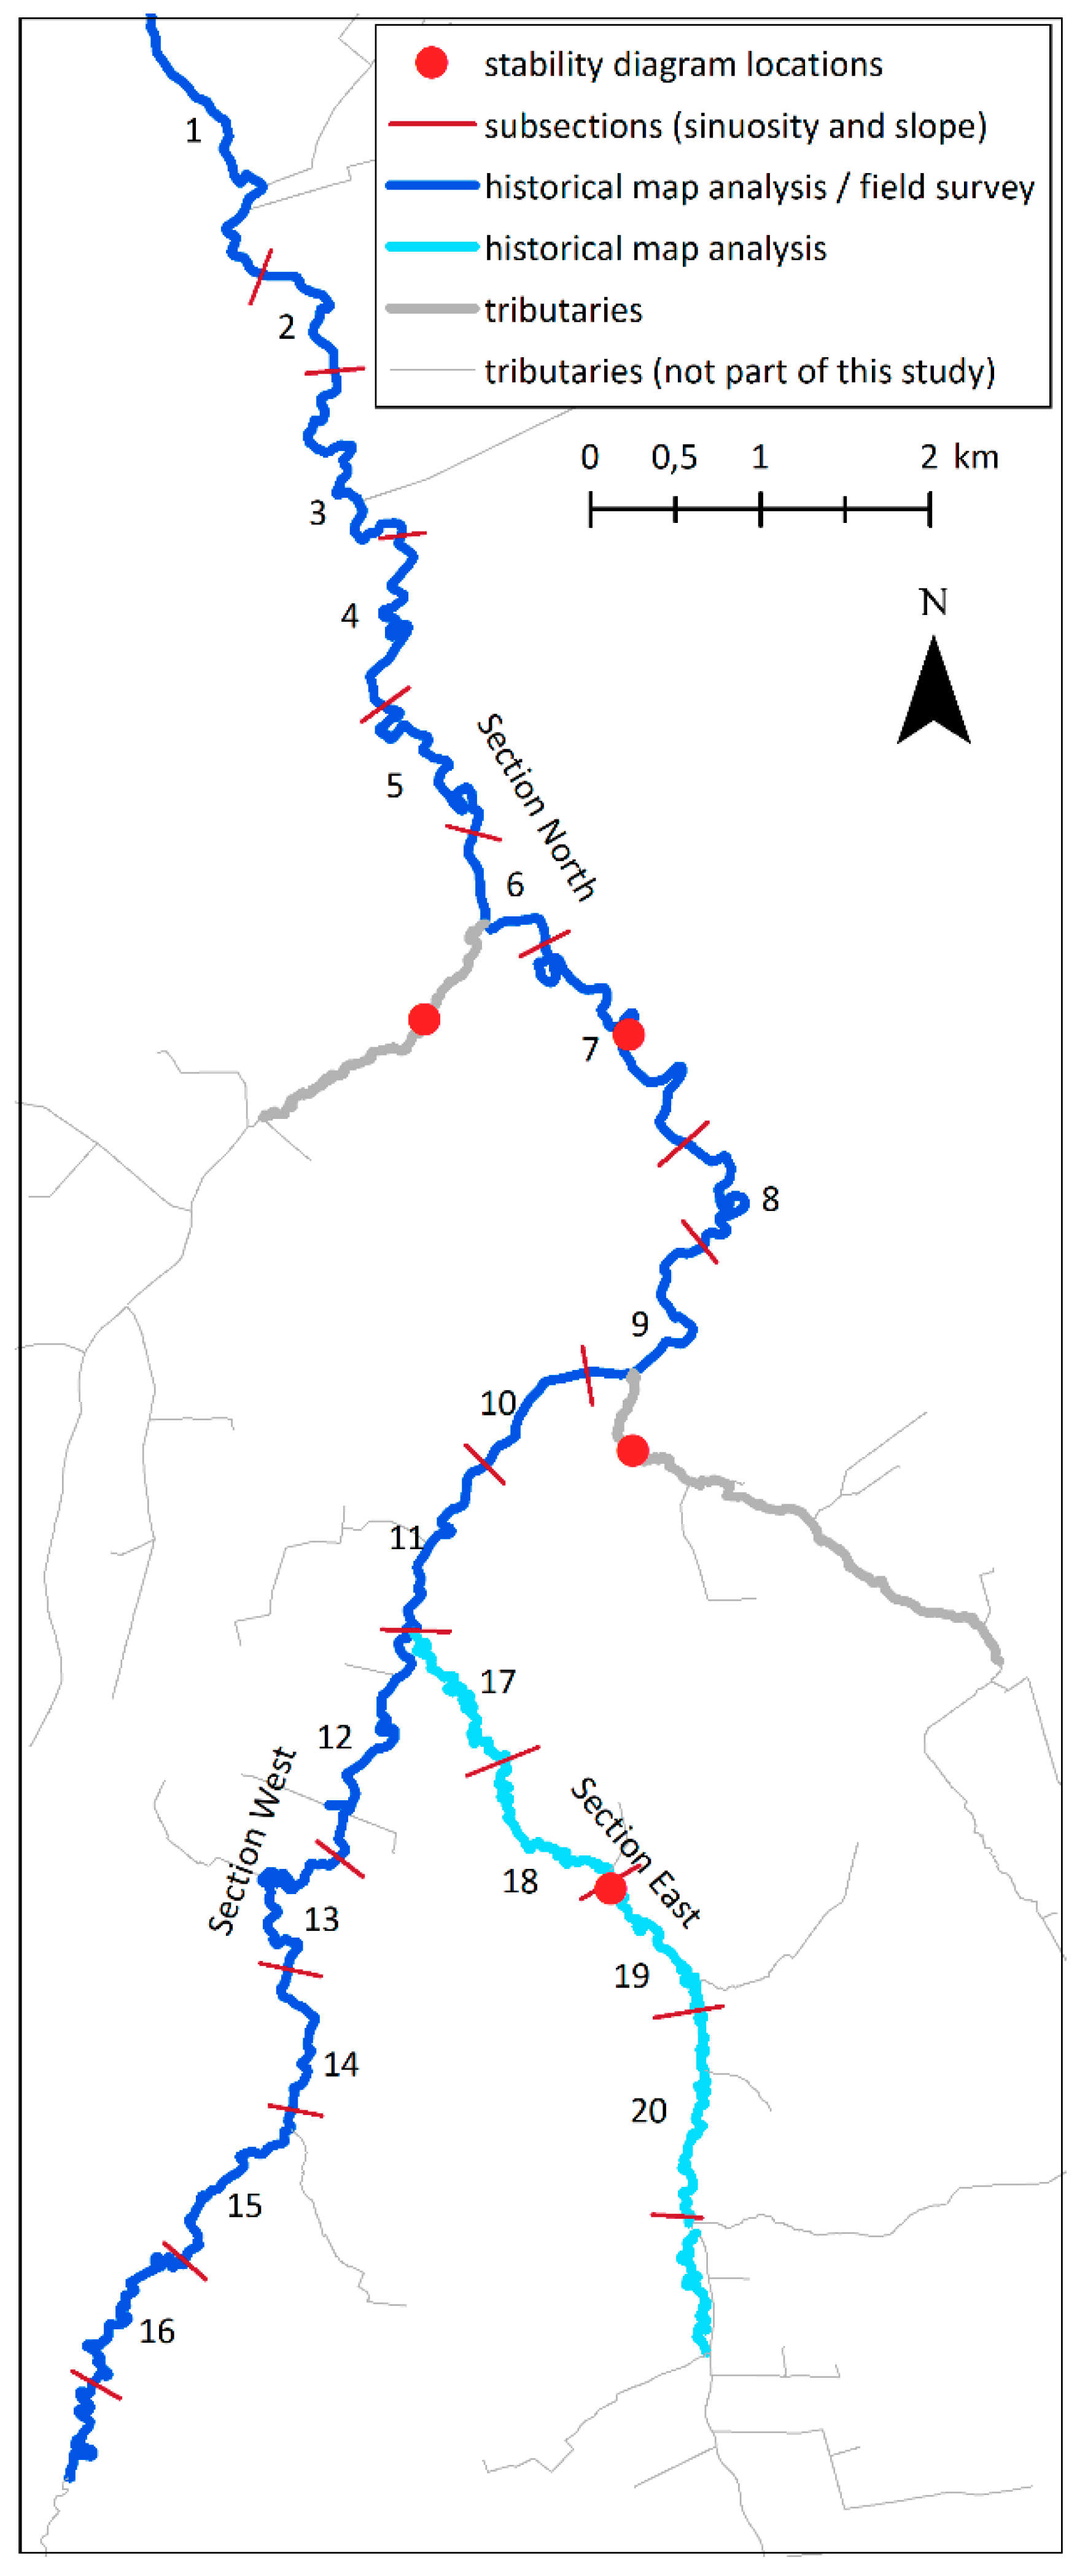
Figure 2.
Experimental set up in the study area.

Figure 3.
Multibuffer polygon analysis principle, in which the black line indicates the 2009 trajectory and the intermittent line represents the 1924 condition.
Figure 3.
Multibuffer polygon analysis principle, in which the black line indicates the 2009 trajectory and the intermittent line represents the 1924 condition.

Figure 4.
Positions of the Drentsche Aa river sites in the stability diagram [10]. Vertical error bars indicate the theoretical Manning’s n range, and horizontal error bars indicate the 212–300 µm grain size mesh range.
Figure 4.
Positions of the Drentsche Aa river sites in the stability diagram [10]. Vertical error bars indicate the theoretical Manning’s n range, and horizontal error bars indicate the 212–300 µm grain size mesh range.

Figure 5.
Examples of active bank erosion. Bend 124 (left) and bend 101 (right).

Figure 6.
Examples of fresh point bars in bends nrs. 13 (left) and 103 (right). Bends were subsequently numbered from upstream to downstream.
Figure 6.
Examples of fresh point bars in bends nrs. 13 (left) and 103 (right). Bends were subsequently numbered from upstream to downstream.

Figure 7.
Frequency distribution of lateral migration between 1924 and 2009 (n = 262).

Figure 8.
Lateral migration is locally heterogeneous, as illustrated by the Gastersche Diep (section East).
Figure 8.
Lateral migration is locally heterogeneous, as illustrated by the Gastersche Diep (section East).

Figure 9.
Lateral migration of individual bends along the stream valley profile. The curves indicate local regression smoothing (LOESS) and CUSUM analyses.
Figure 9.
Lateral migration of individual bends along the stream valley profile. The curves indicate local regression smoothing (LOESS) and CUSUM analyses.

Figure 10.
Median lateral migration with standard errors for soil (left) and geomorphological map units (right) for the period 1924–2009.
Figure 10.
Median lateral migration with standard errors for soil (left) and geomorphological map units (right) for the period 1924–2009.


Table 1.
Overview of the available historical maps, covering (parts) of the research area.
| Name | Year | Scale | Original Purpose |
|---|---|---|---|
| AHN 2009 | 2009 | Resolution 0.5 m | Altitude mapping (LIDAR) |
| Historical topography 1895 | ±1895 | 1:25,000 | Topography for military purposes |
| Historical topography 1935 | ±1935 | 1:25,000 | Topographic |
| De Jonge 1924 maps | ±1924 | 1:1000 | Preparation for channelization 1,2 |
| TMK | 1850 | 1:50,000 | Military topography |
| Administrative boundaries 3 | 1849 | ± 1:25,000 | Cadastral purposes 2 |
| Cadastre 1832 | ±1830 | ±1:1250–5000 | Cadastral purposes |
1 The channelization plan was never carried out. 2 Does not include Zeegserloopje and Anlooërdiepje. 3 Map of the village of Gasteren, which borders the river course. Only covers the trajectory of the Gastersche Diep.
Table 2.
Specific stream power and D50 results. Sampling locations are indicated in Figure 1 and Figure 2.
| Tributary | Channel Dimensions | D50 (µm) | ωpv (W/m2) | |||
|---|---|---|---|---|---|---|
| Width (m) | Slope (m/m) | n = 0.02 | n = 0.03 | n = 0.08 | ||
| Gastersche Diep | 6.7 | 0.00025 | 254 | 2.81 | 2.40 | 1.47 |
| Anlooërdiepje | 3.4 | 0.00076 | 223 | 2.01 | 1.64 | 1.01 |
| Schipborgsche Diep | 10.8 | 0.00022 | 279 | 1.93 | 1.57 | 0.96 |
| Zeegserloopje | 4.1 | 0.00042 | 228 | 1.30 | 1.06 | 0.65 |
Table 3.
Statistical analysis of recent and historical lateral migration.
| Field Observations | Lateral Migration 1924–2009 (m) | ||||
|---|---|---|---|---|---|
| n | Average | Median | st. dev. | st. err. | |
| Erosion | 85 | 14.2 | 8 | 9.6 | 1.0 |
| No erosion | 42 | 7.8 | 6 | 6.6 | 1.0 |
| Inconclusive | 16 | 11.6 | 7 | 9.5 | 2.4 |
| Total | 143 1 | 12.0 | 7 | 9.2 | 0.8 |
| Chi-square | 13.186 | ||||
| df | 1 | ||||
| p | 0.0003 | ||||
1 The field survey from the water was carried out in sections North and West. Therefore, descriptive statistics differ from the historical map analysis, which also covered section East (n = 262).
Table 4.
CUSUM analysis results.
| Profile Distance | Confidence Interval | Confidence Level | Lateral Migration 1924–2009 | ||
|---|---|---|---|---|---|
| from | to | from | to | ||
| (m) | (m) | (m) | (m) | (m) | |
| Section North | |||||
| 4540 | 1540 | 4800 | 83% | 7.1 | 10.6 |
| 5960 | 5820 | 6840 | 77% | 10.6 | 6.6 |
| 7440 | 6420 | 7660 | 81% | 6.6 | 11.9 |
| 8580 | 8420 | 10,380 | 96% | 11.9 | 6.2 |
| Section West | |||||
| <no changes> | |||||
| Section East | |||||
| 11,160 | 9680 | 13,020 | 82% | 6.2 | 4.5 |
| 13,720 | 13,380 | 13,740 | 100% | 4.5 | 9.7 |
| 14,520 | 14,440 | 14,640 | 100% | 9.7 | 4.6 |
Table 5.
Correlations between valley slope, sinuosity, and lateral migration.
| Sinuosity | Valley Slope | Lateral Migration (1924–2009) | |||
|---|---|---|---|---|---|
| Mean | st. dev. | std. err. | |||
| (−) | (m/m) | (m) | (m) | (m) | |
| Mean | 1.53 | 0.000521 | 7.5 | 4.23 | 1.37 |
| Median | 1.44 | 0.000453 | 7.5 | 4.39 | 1.31 |
| Min | 1.06 | 0.000000 | 4.4 | 1.00 | 0.37 |
| Max | 2.12 | 0.001252 | 12.8 | 7.91 | 3.23 |
| Spearman non-parametric correlation test statistics | n | rs | p | ||
| Valley slope–sinuosity | 20 | 0.129 | 0.587 | ||
| Valley slope–lateral migration | 20 | −0.166 | 0.486 | ||
| Sinuosity–lateral migration | 20 | 0.326 | 0.161 | ||
Table 6.
Descriptive statistics of channel migration based on the geomorphological map classification.
Table 6.
Descriptive statistics of channel migration based on the geomorphological map classification.
| Geomorphological Map | Total Lateral Migration 1924–2009 (m) | ||||||
|---|---|---|---|---|---|---|---|
| Code | Description | Mean | Median | st. dev. | se | n | |
| B3 | Peaty valley fill deposits | 6.1 | 5 | 3.84 | 0.31 | 155 | |
| B4 | Alluvial valley fill deposits | 7.7 | 6 | 5.22 | 0.54 | 92 | |
| D | Cover sand | 11.1 | 11 | 3.33 | 1.00 | 11 | |
| total | 6.9 | 6 | 4.50 | 0.28 | 258 | ||
| Kruskal–Wallis test statistics | Chi-square | df | p | ||||
| Between all units | 19.96 | 2 | <0.0001 | ||||
| B3–B4 | 6.12 | 1 | 0.0134 | ||||
| B3–D | 16.27 | 1 | 0.0001 | ||||
| B4–D | 9.04 | 1 | 0.0026 | ||||
Table 7.
Descriptive statistics of channel migration based on the soil map classification.
| Soil Map 1 | Total Lateral Migration 1924–2009 (m) | ||||||
|---|---|---|---|---|---|---|---|
| Code | Description | Mean | Median | st. dev. | se | n | |
| Vc | Peat more than 120 cm in thickness | 6.3 | 5 | 4.02 | 0.30 | 181 | |
| Vz | Peat, sand within 120 cm | 7.5 | 8 | 3.18 | 0.50 | 40 | |
| W | Peaty sand | 7.0 | 7 | 1.41 | 1.00 | 2 | |
| Z | Sand | 9.7 | 8.5 | 6.22 | 1.18 | 28 | |
| total | 6.9 | 6 | 4.48 | 0.28 | 262 | ||
| Kruskal–Wallis test statistics | Chi-square | df | p | ||||
| Between all units | 15.47 | 3 | 0.0015 | ||||
| Vc–Vz | 8.28 | 1 | 0.0040 | ||||
| Vc–W | 0.88 | 1 | 0.3473 | ||||
| Vc–Z | 8.79 | 1 | 0.0030 | ||||
| Vz–W | 0.03 | 1 | 0.8583 | ||||
| Vz–Z | 1.30 | 1 | 0.2546 | ||||
| W–Z | 0.17 | 1 | 0.6764 | ||||
1 The complex soil map unit “peat and alluvial valley fill deposits” was left out of this analysis due to high local variability within the mapping unit. This also explains the difference in sample counts.
© 2019 by the authors. Licensee MDPI, Basel, Switzerland. This article is an open access article distributed under the terms and conditions of the Creative Commons Attribution (CC BY) license (http://creativecommons.org/licenses/by/4.0/).
Share and Cite
MDPI and ACS Style
Menting, F.; Meijles, E.W. Local Factors Determining Spatially Heterogeneous Channel Migration in a Low-Energy Stream. Water 2019, 11, 2149. https://doi.org/10.3390/w11102149
AMA Style
Menting F, Meijles EW. Local Factors Determining Spatially Heterogeneous Channel Migration in a Low-Energy Stream. Water. 2019; 11(10):2149. https://doi.org/10.3390/w11102149
Chicago/Turabian StyleMenting, Foeke, and Erik W. Meijles. 2019. "Local Factors Determining Spatially Heterogeneous Channel Migration in a Low-Energy Stream" Water 11, no. 10: 2149. https://doi.org/10.3390/w11102149
Note that from the first issue of 2016, this journal uses article numbers instead of page numbers. See further details here.