Applying a Series and Parallel Model and a Bayesian Networks Model to Produce Disaster Chain Susceptibility Maps in the Changbai Mountain area, China


Abstract
:1. Introduction
2. Methodologies
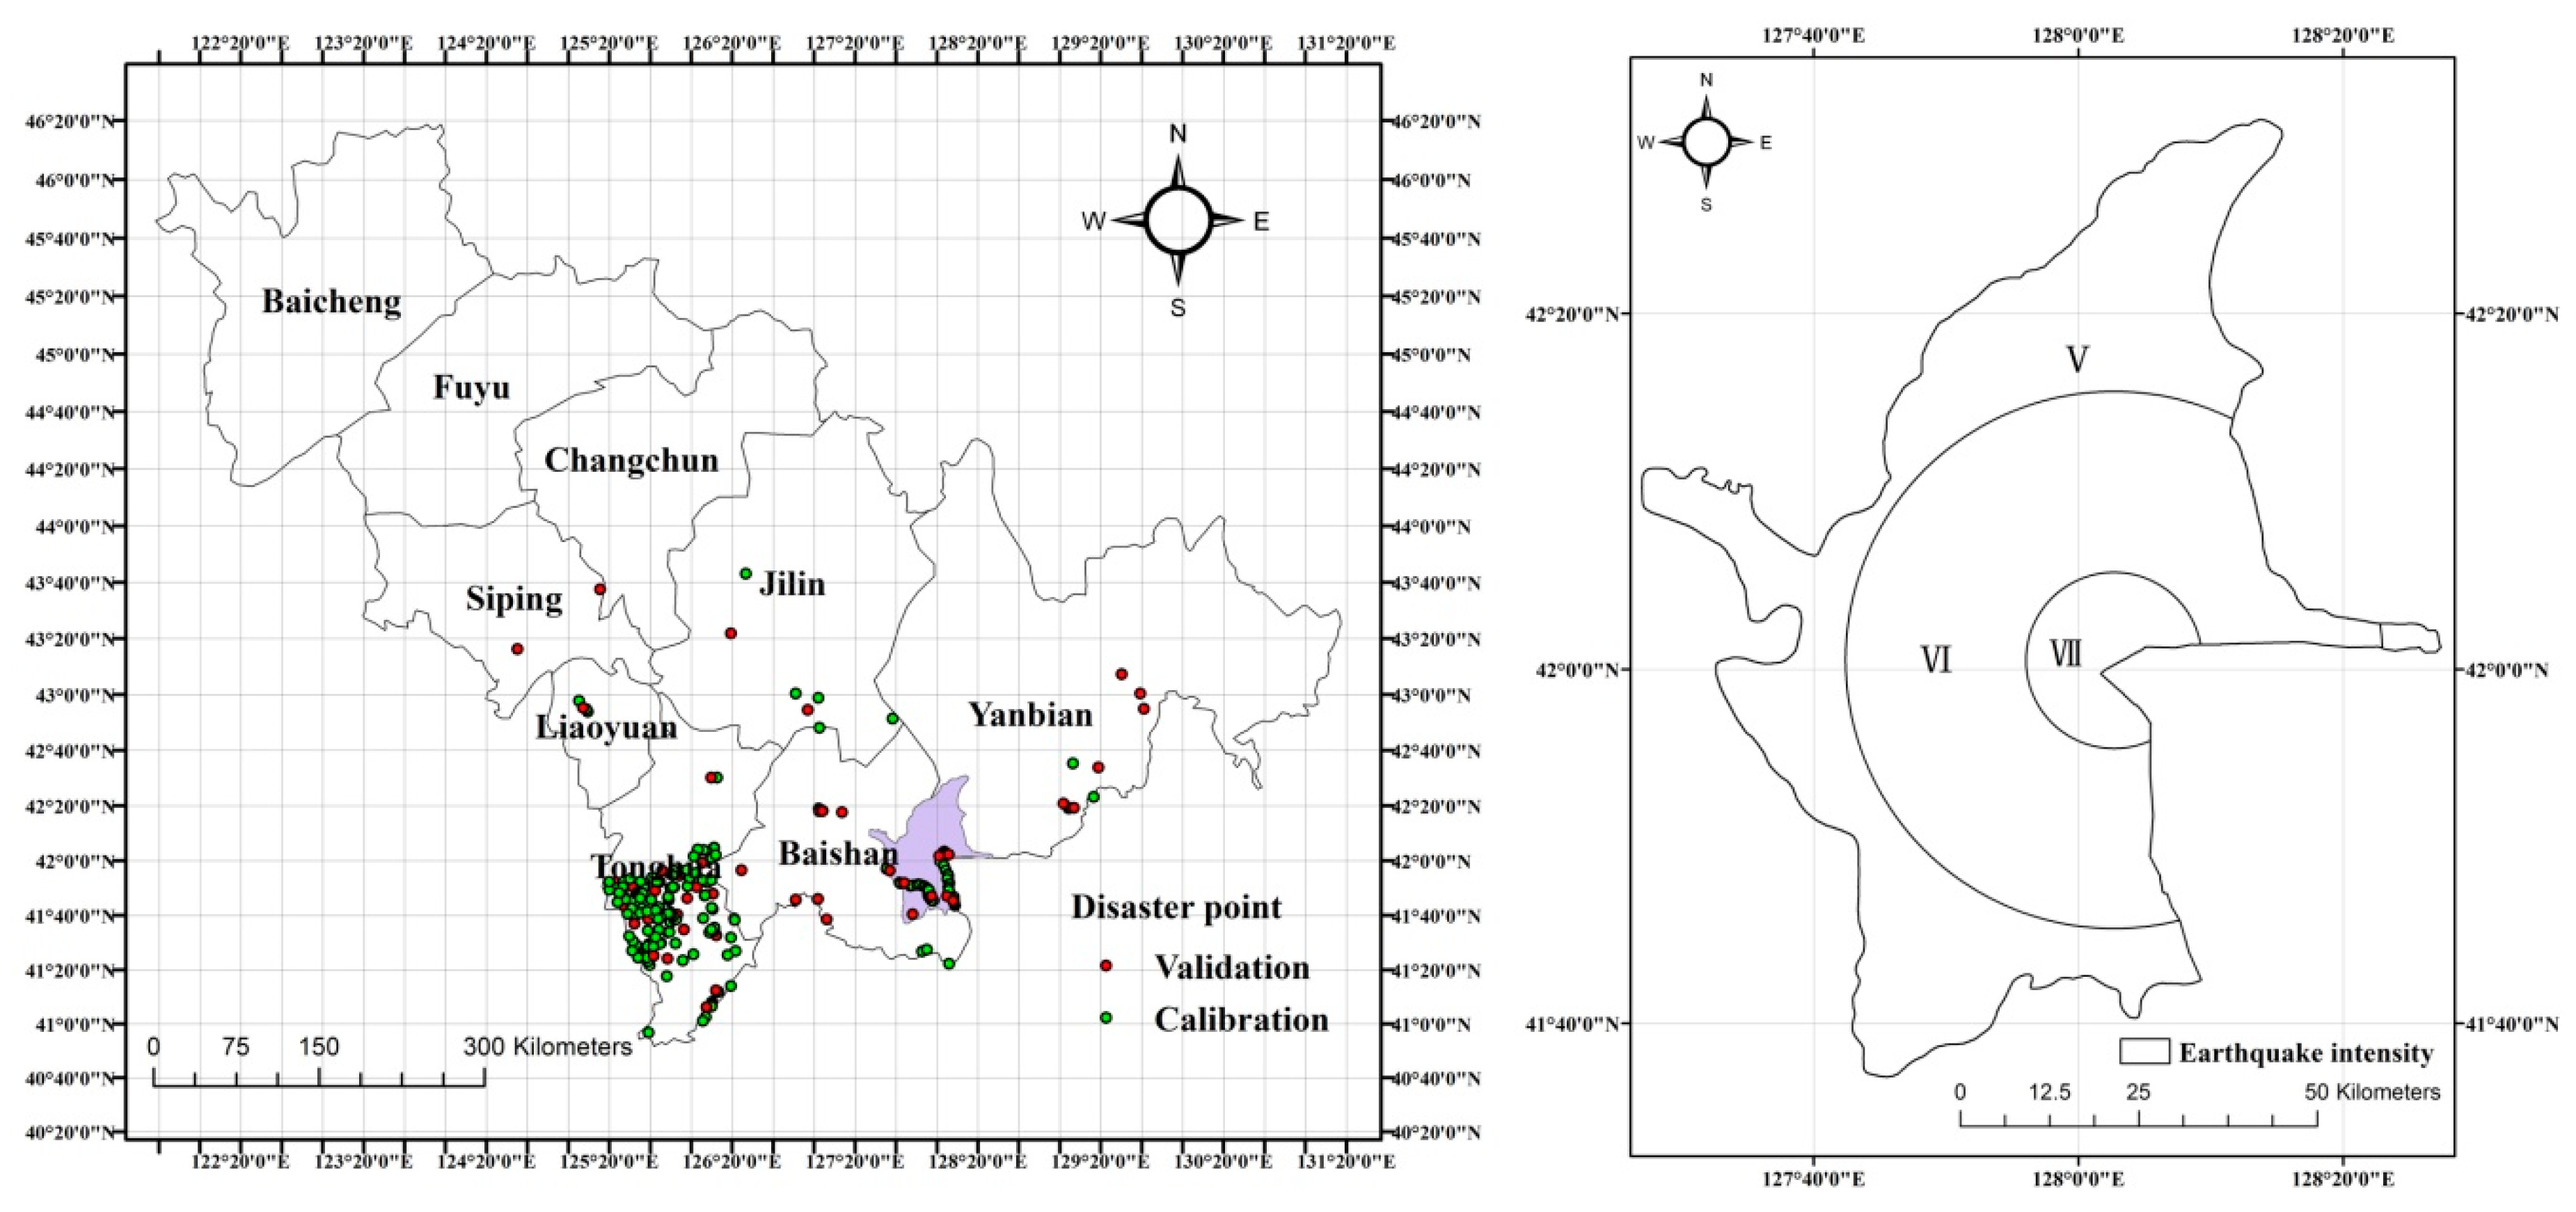
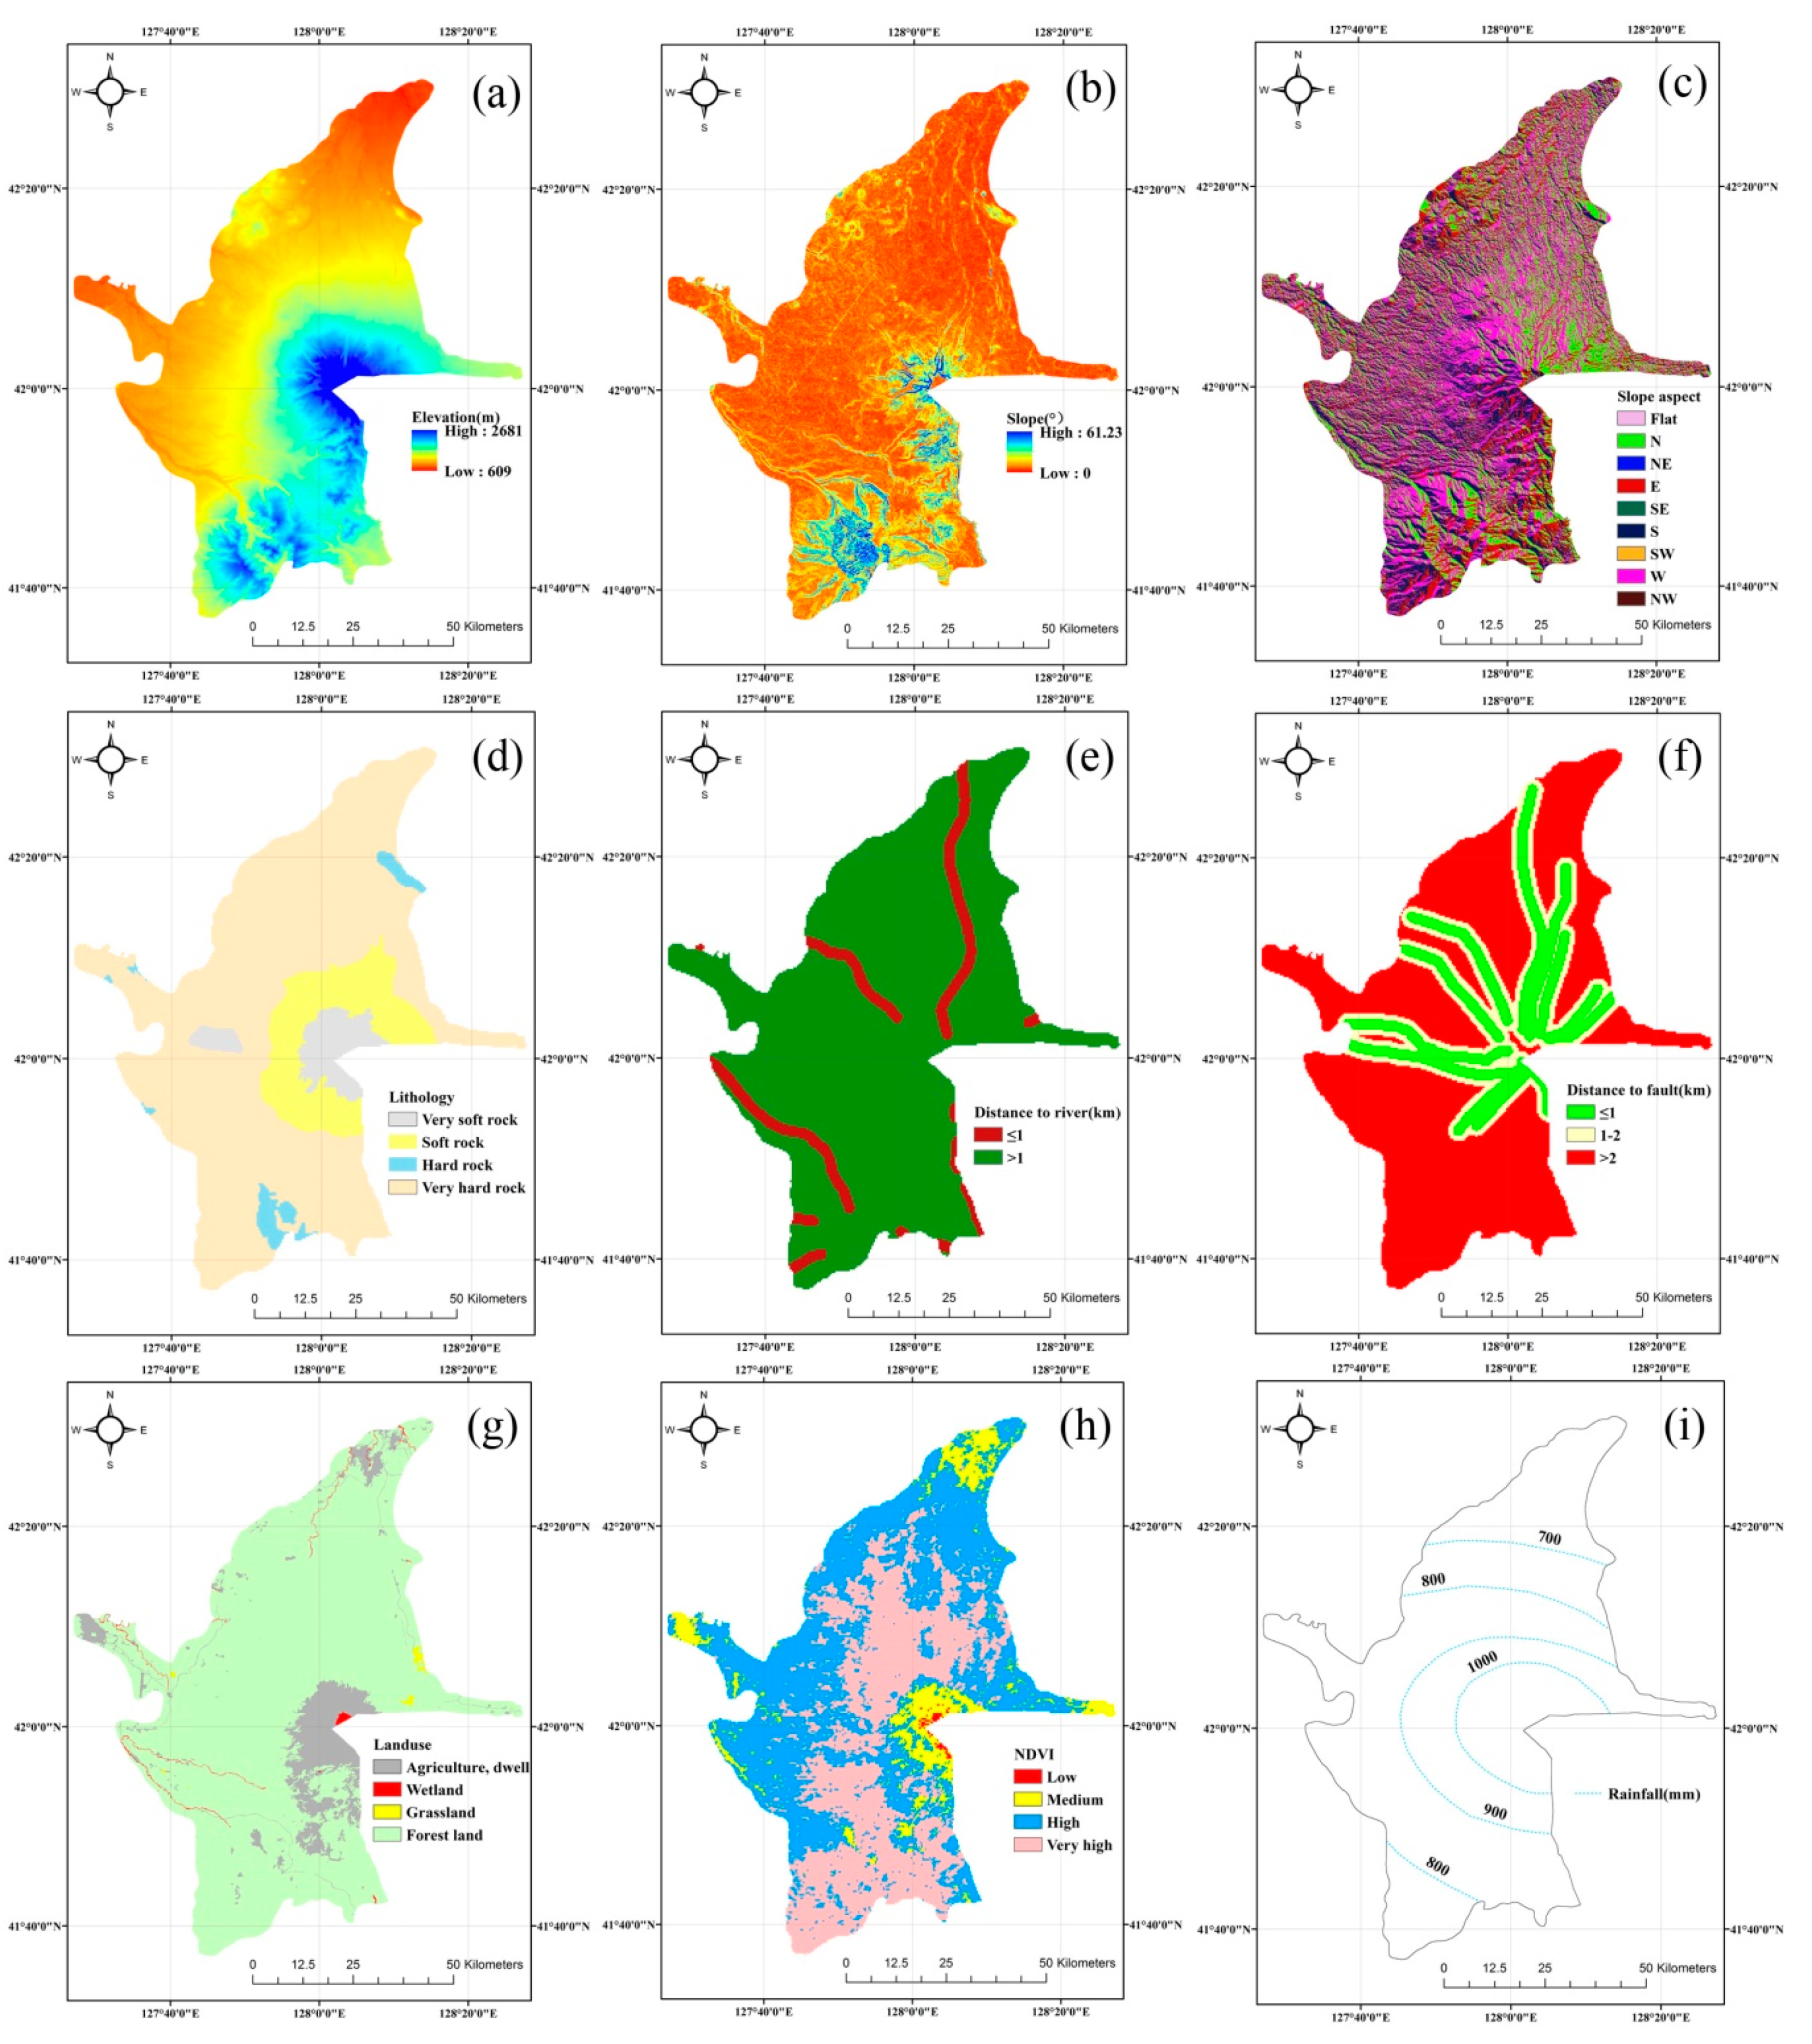
2.1. Study Area
2.2. Series and Parallel Model
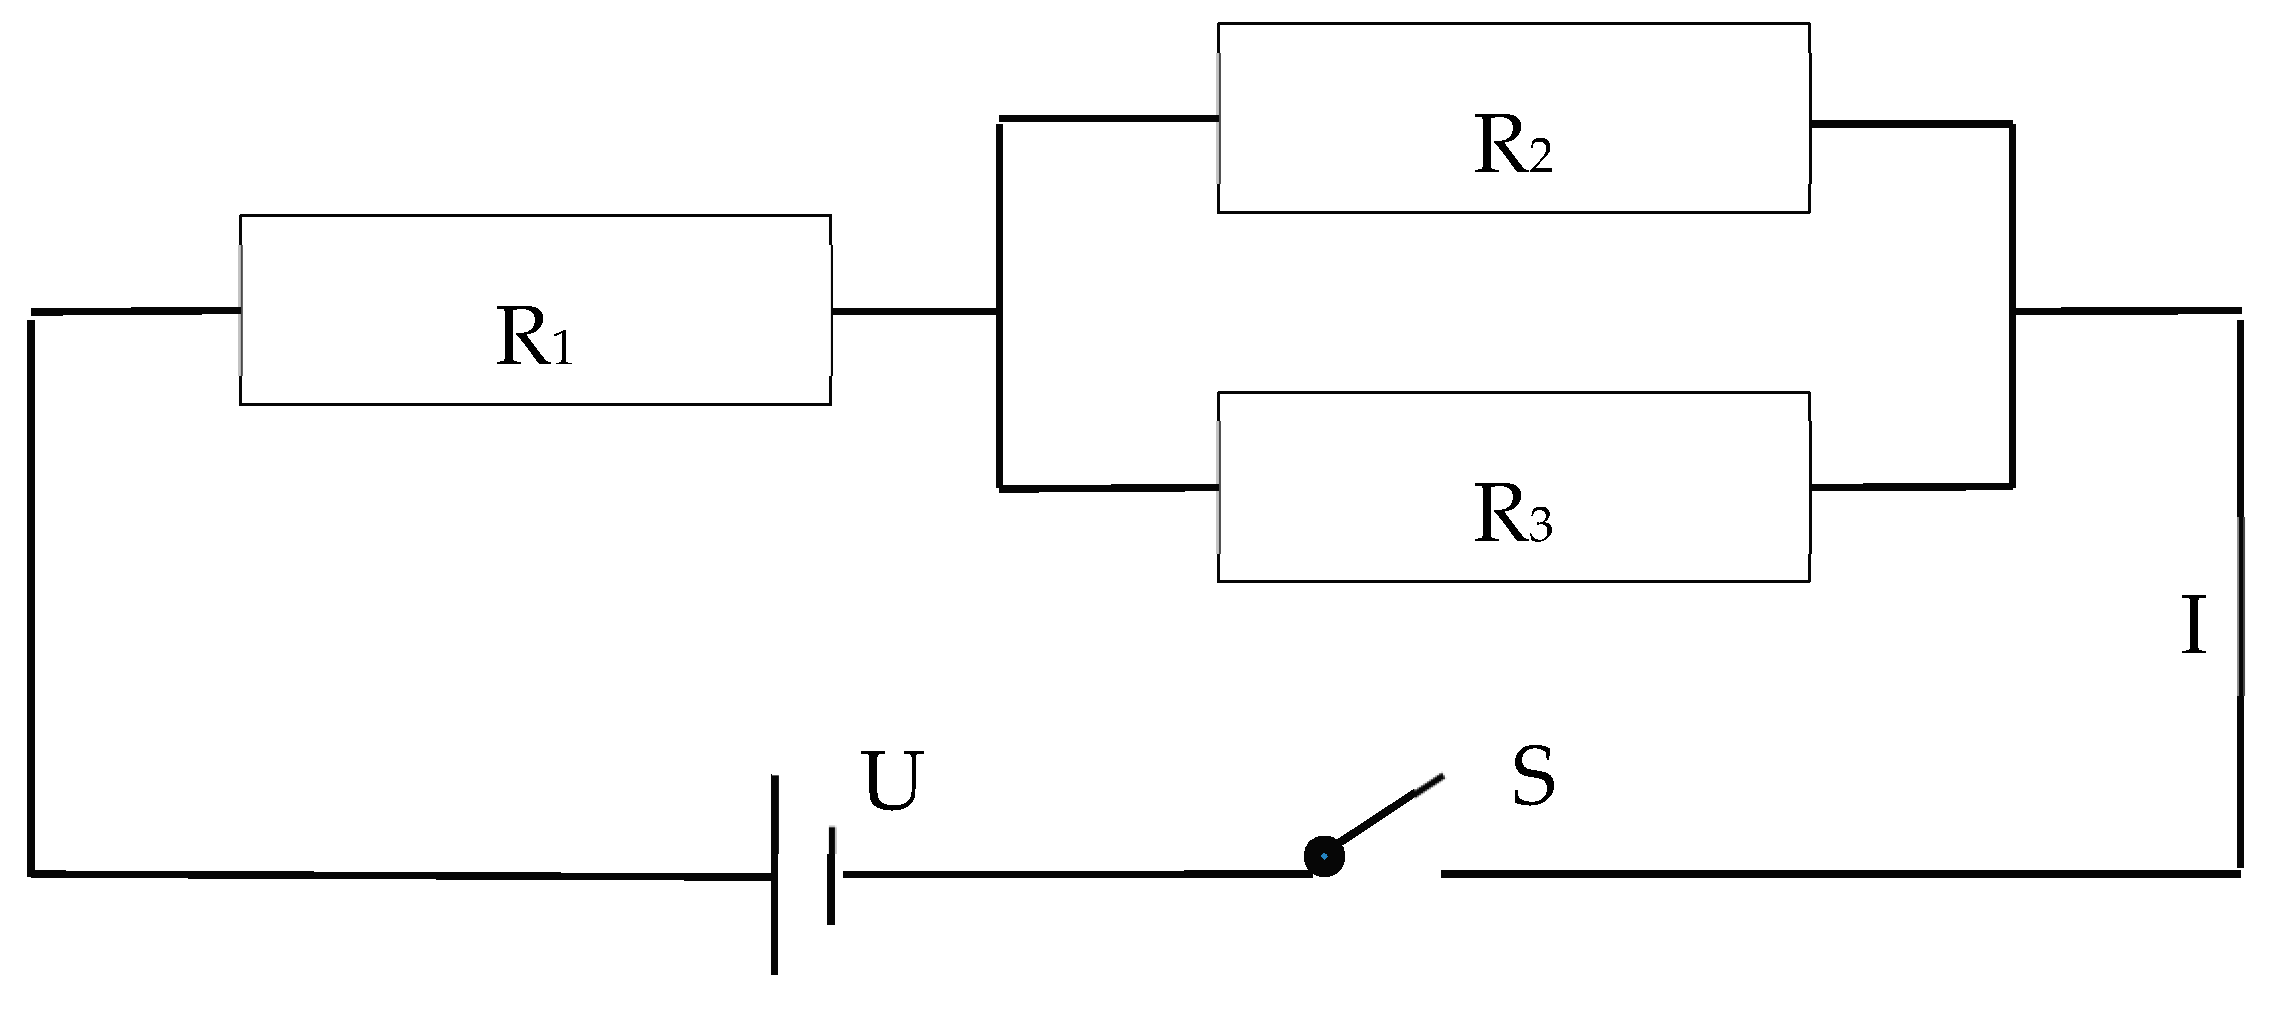
2.2.1. Circuit Principle
2.2.2. Analysis of Disaster Development Conditions
2.2.3. Evaluation of the Series and Parallel Model of Disaster Chain Susceptibility
2.3. Bayesian Networks Model
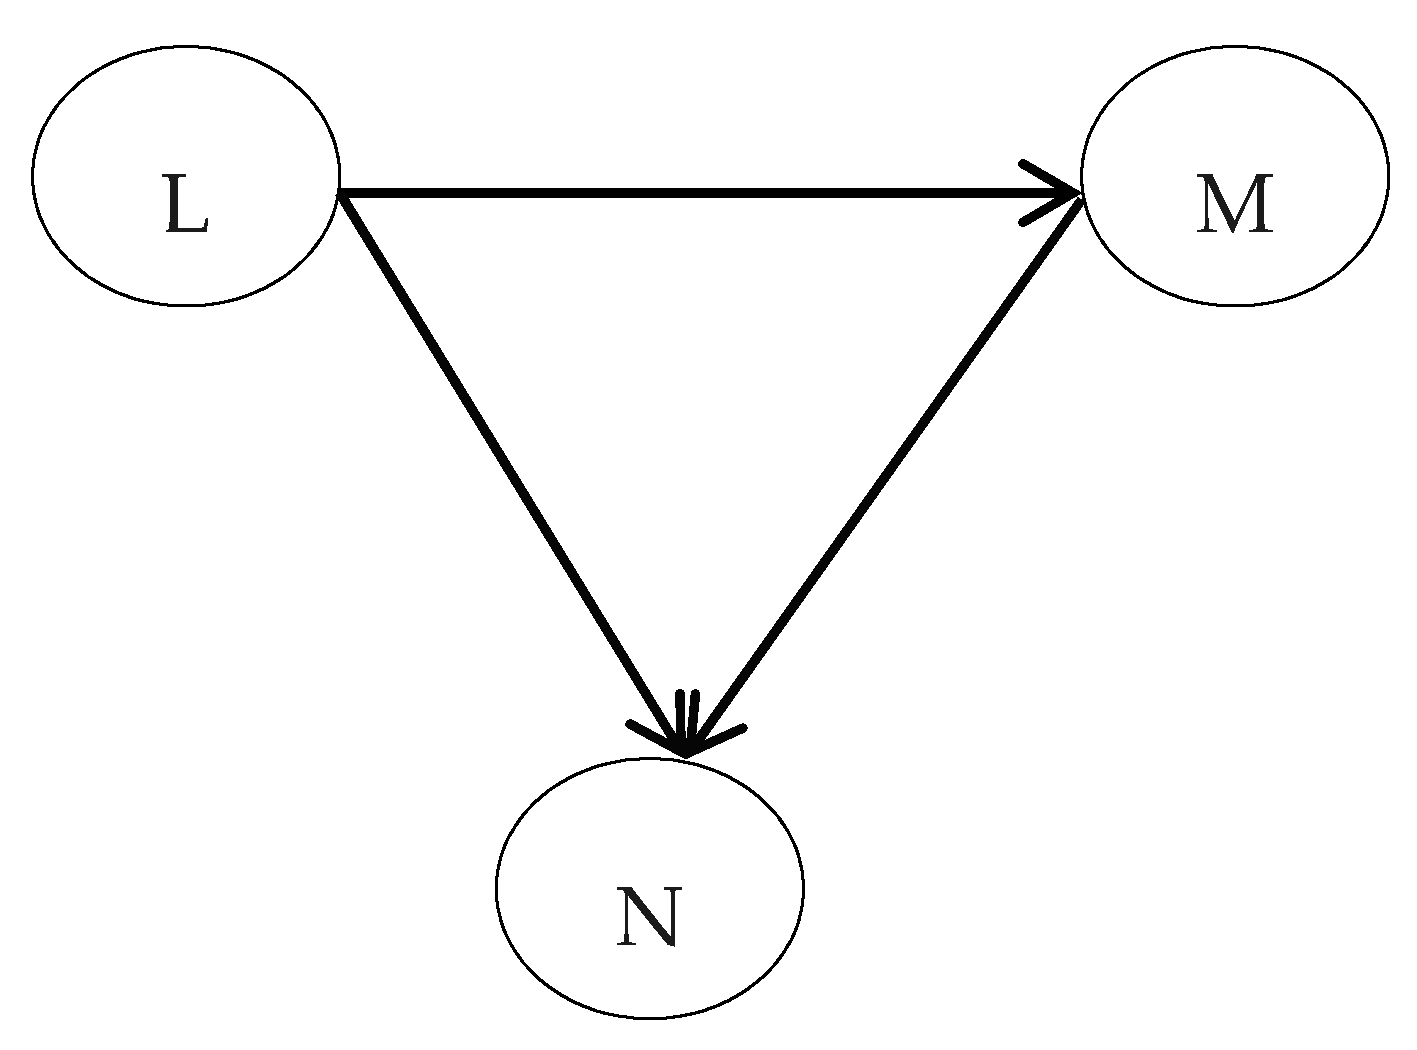
2.3.1. Bayesian Networks Principle
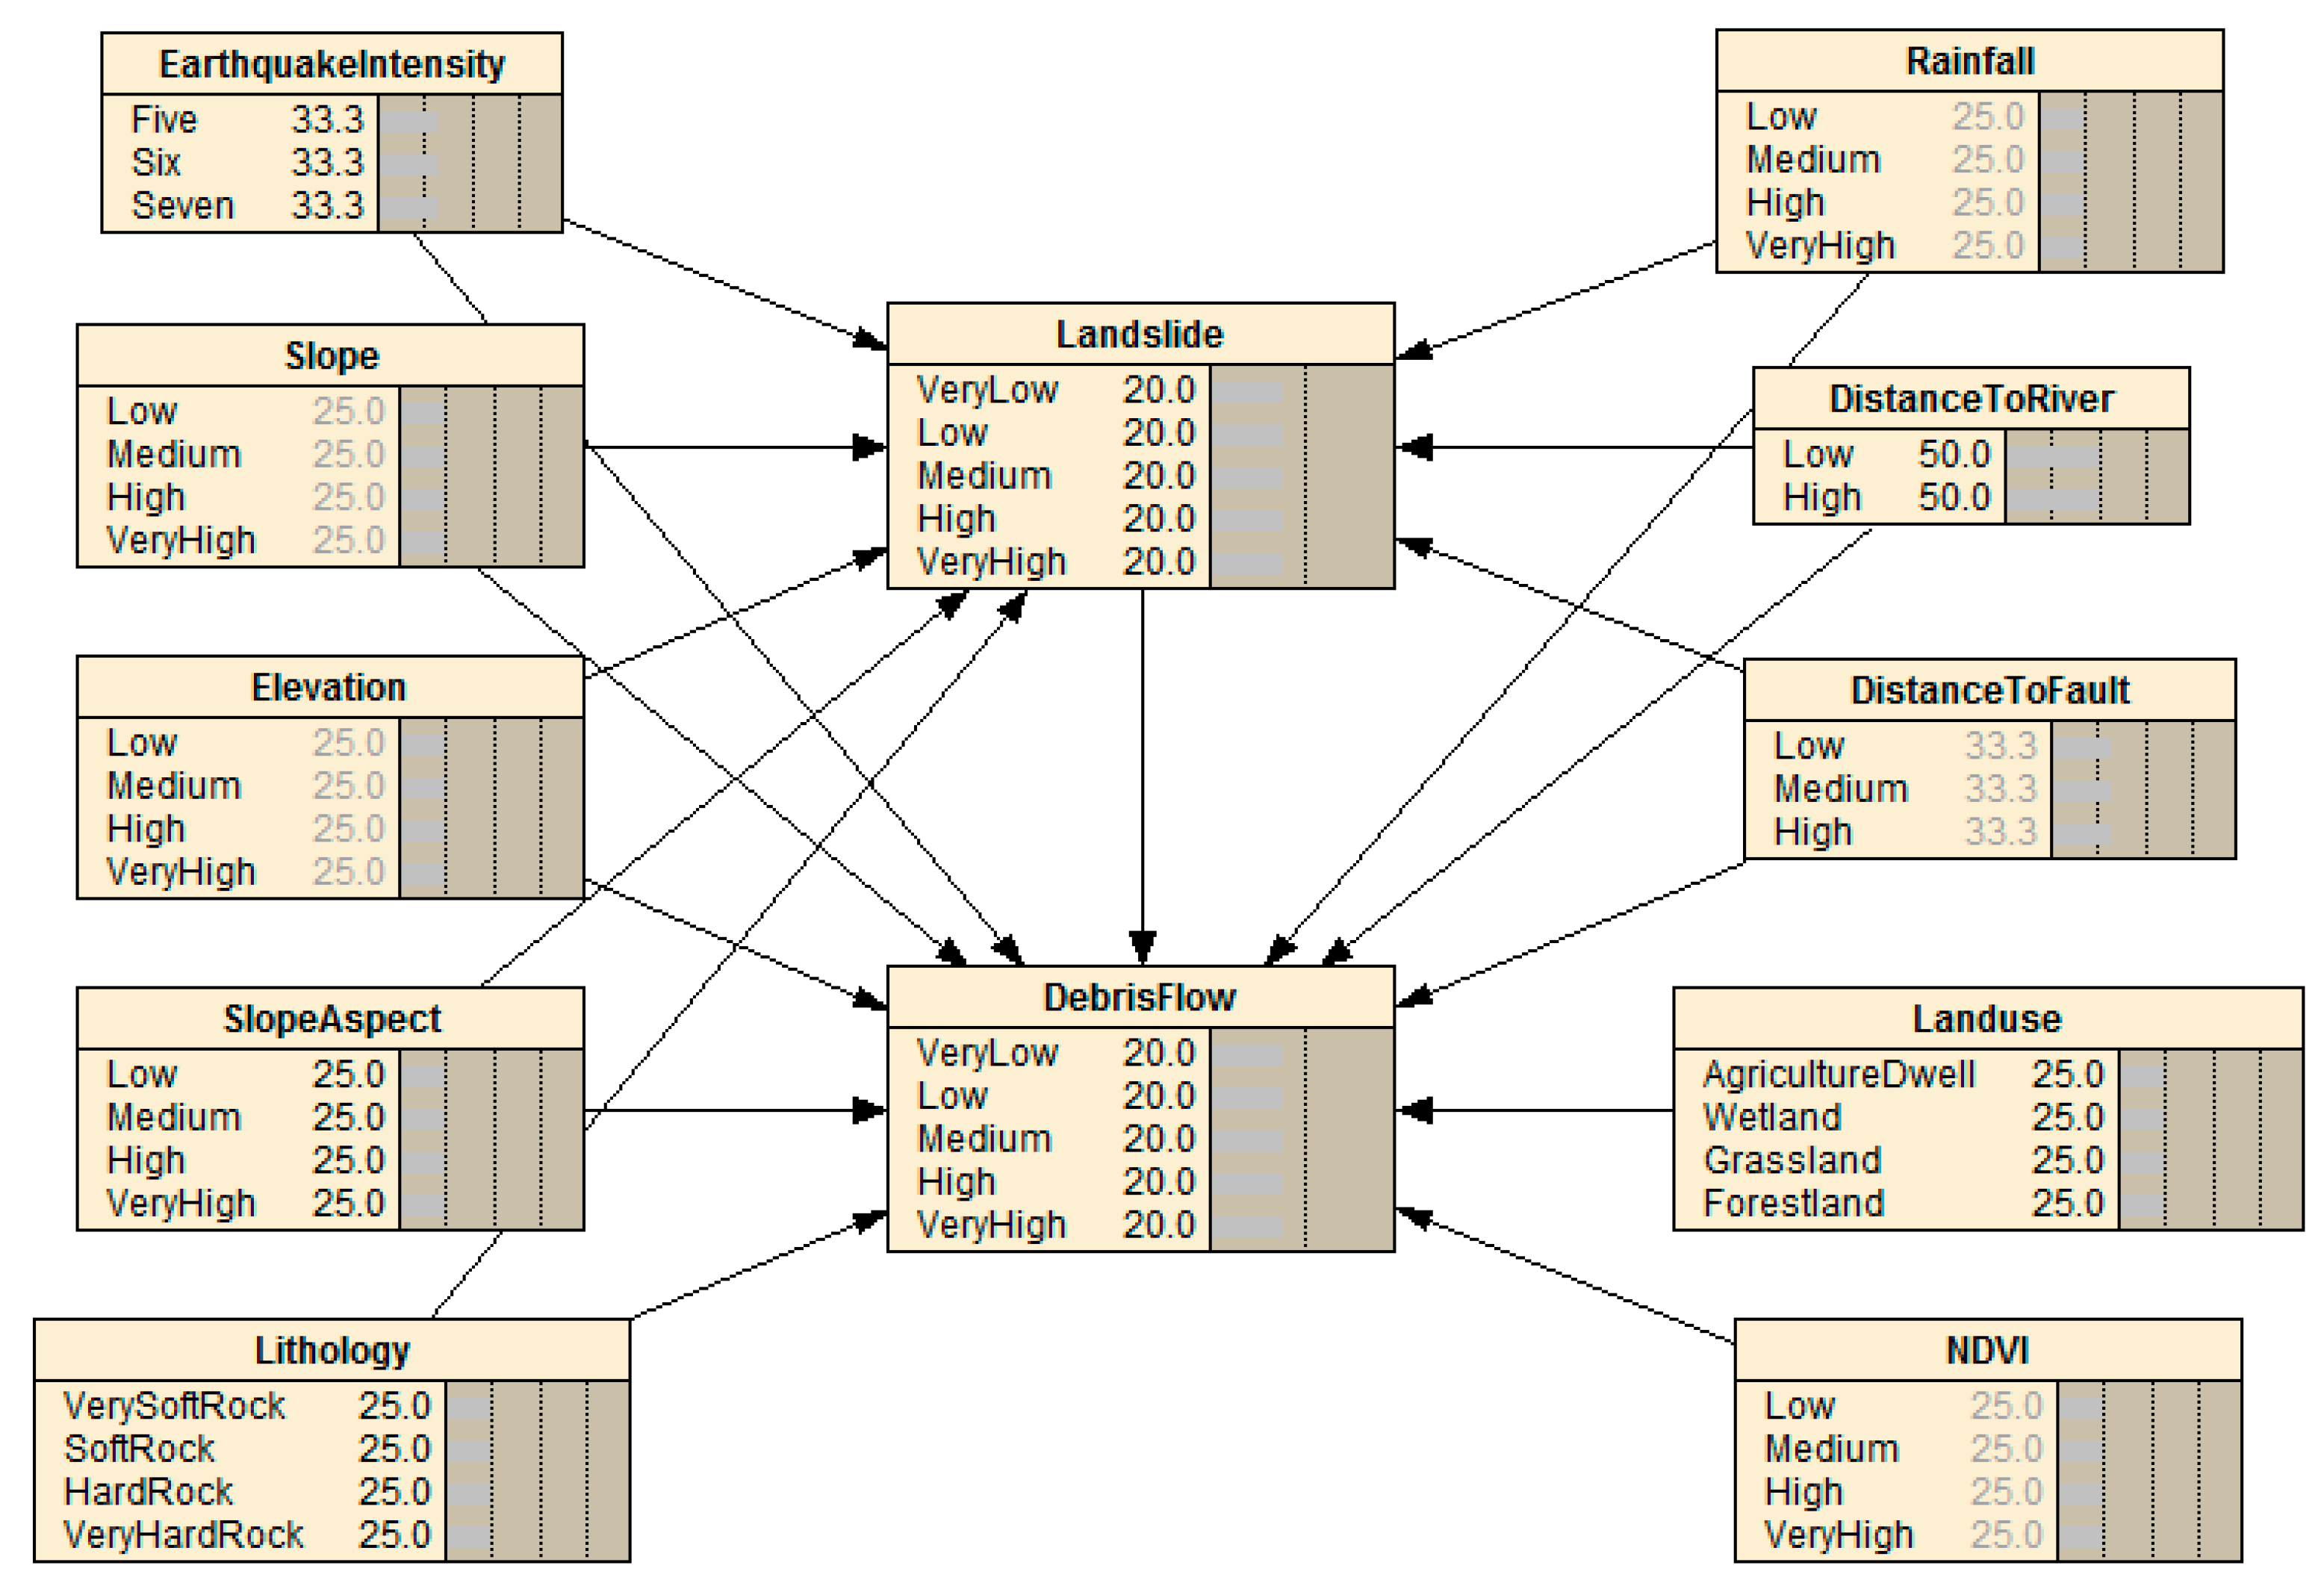
2.3.2. Bayesian Network Model Construction for the Earthquake Disaster Chain
3. Results
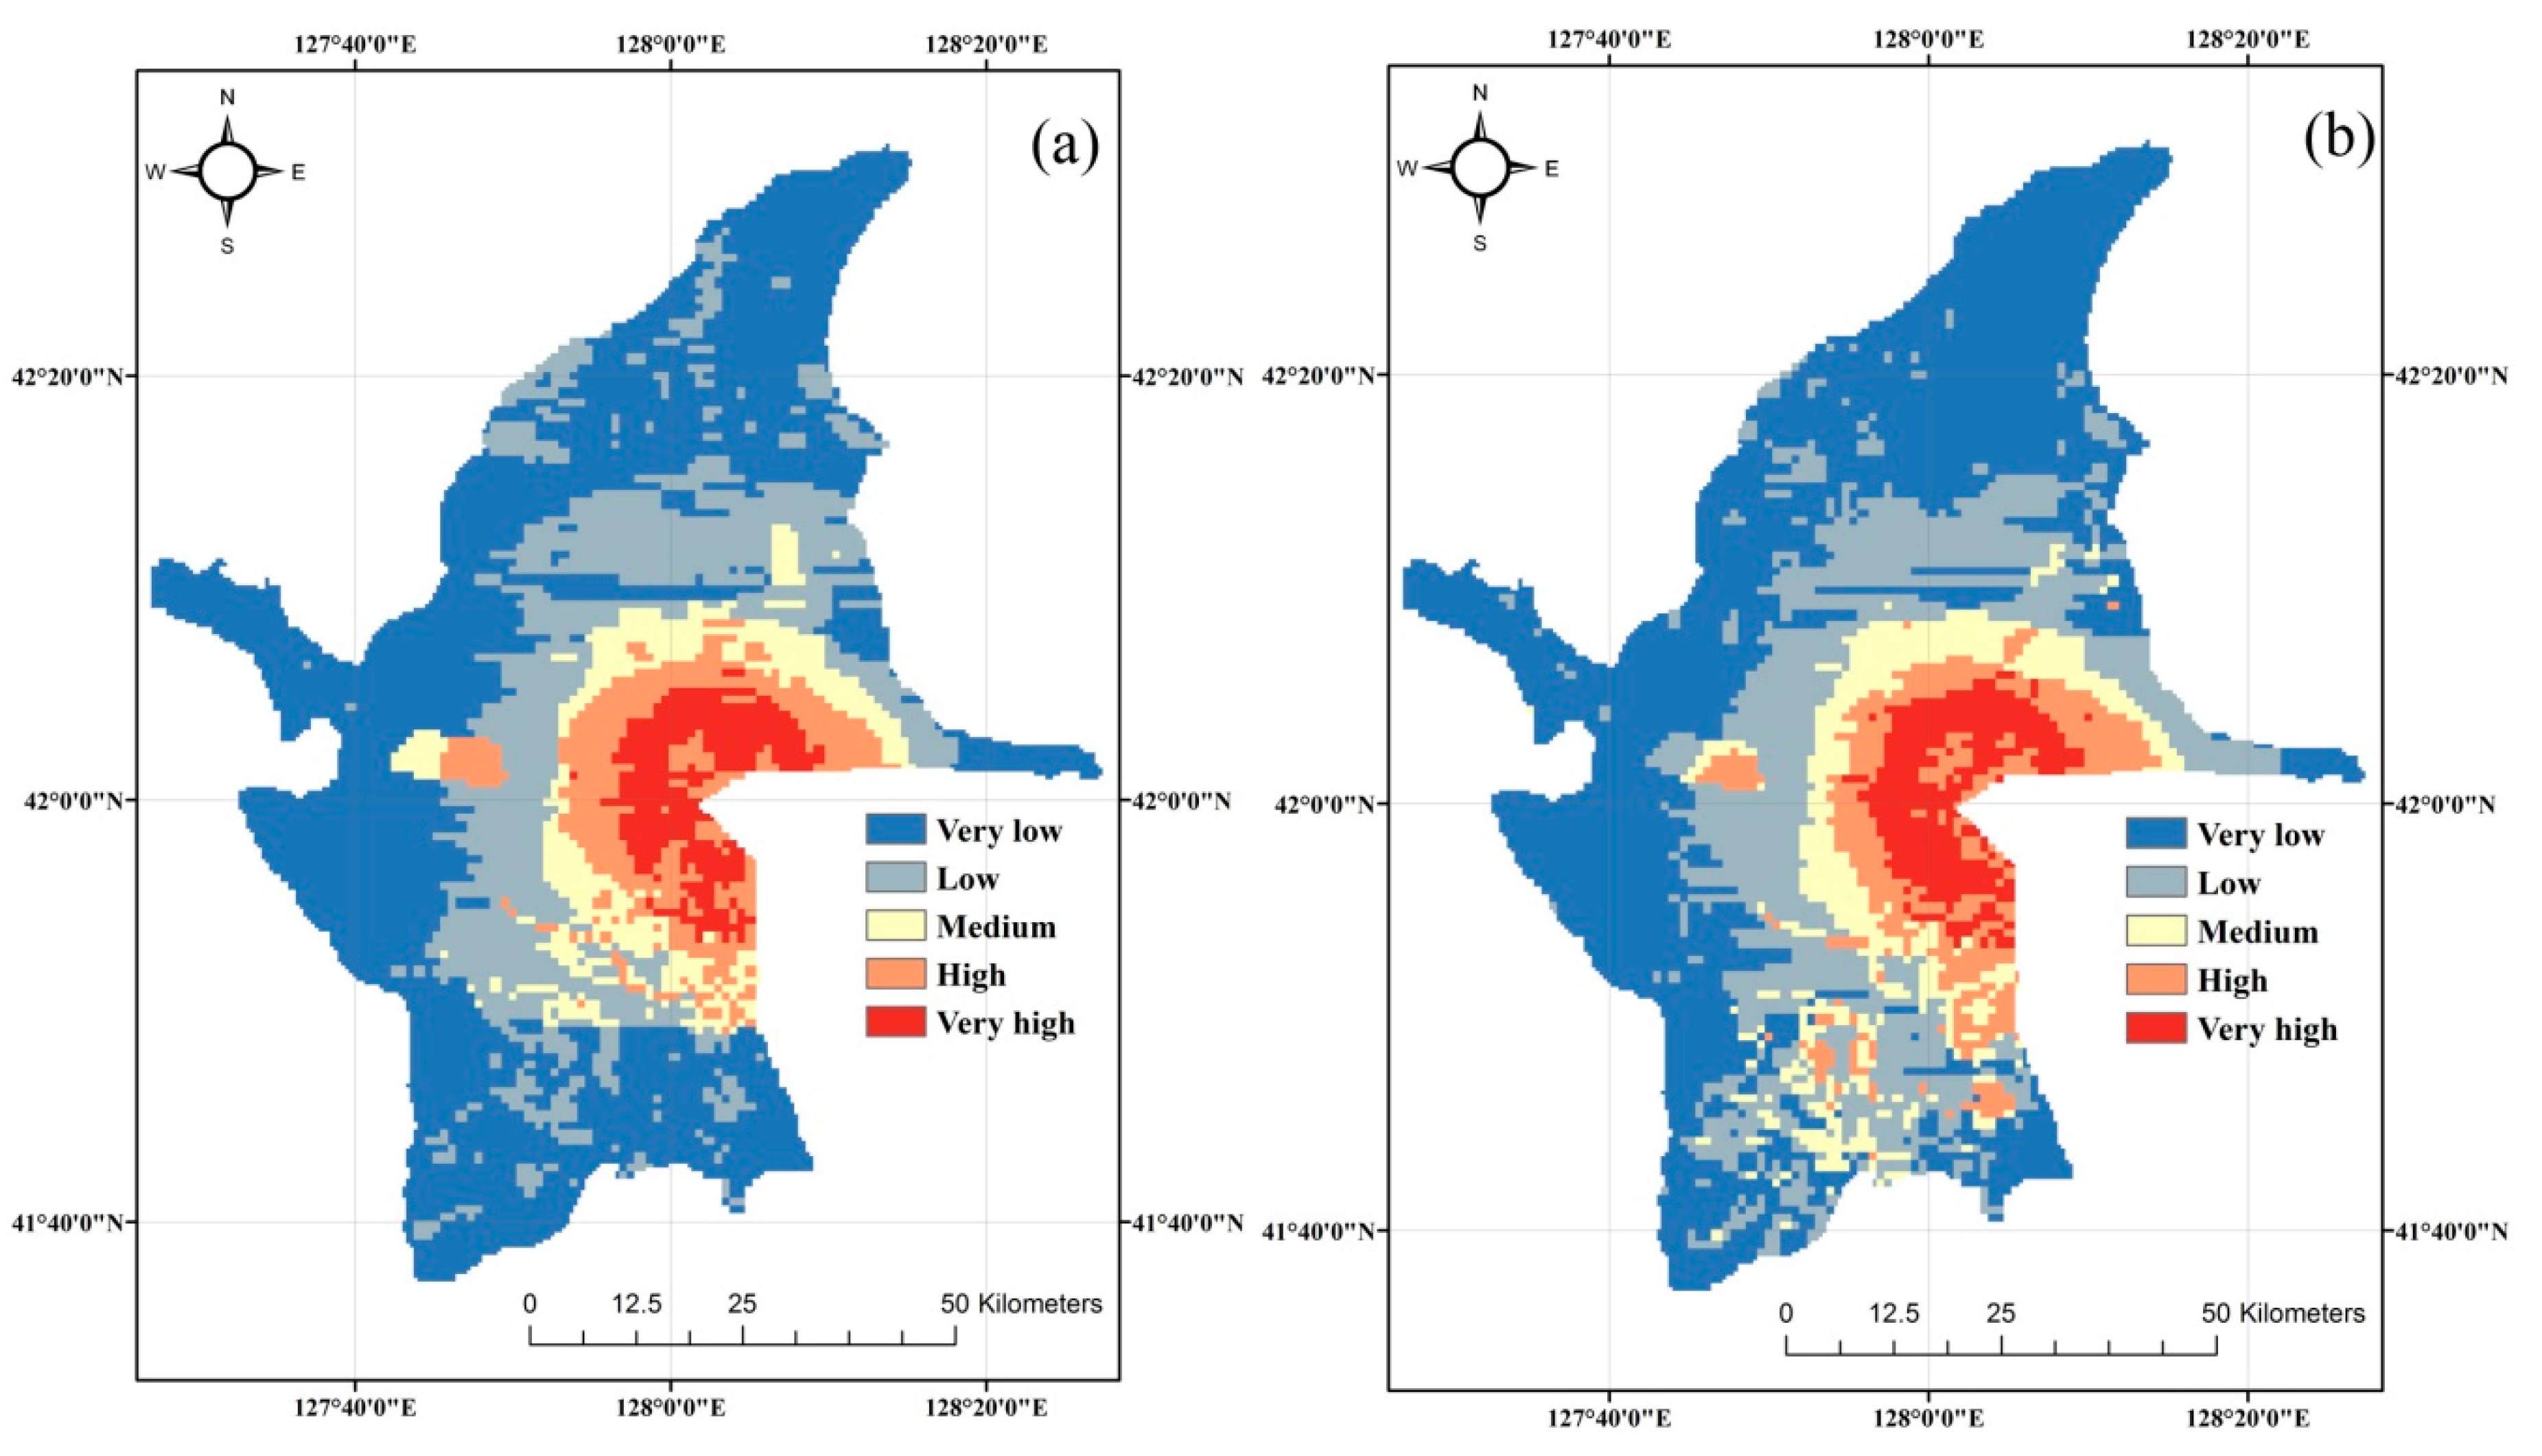
3.1. Disaster Chain Susceptibility Assessment from the Series and Parallel Model
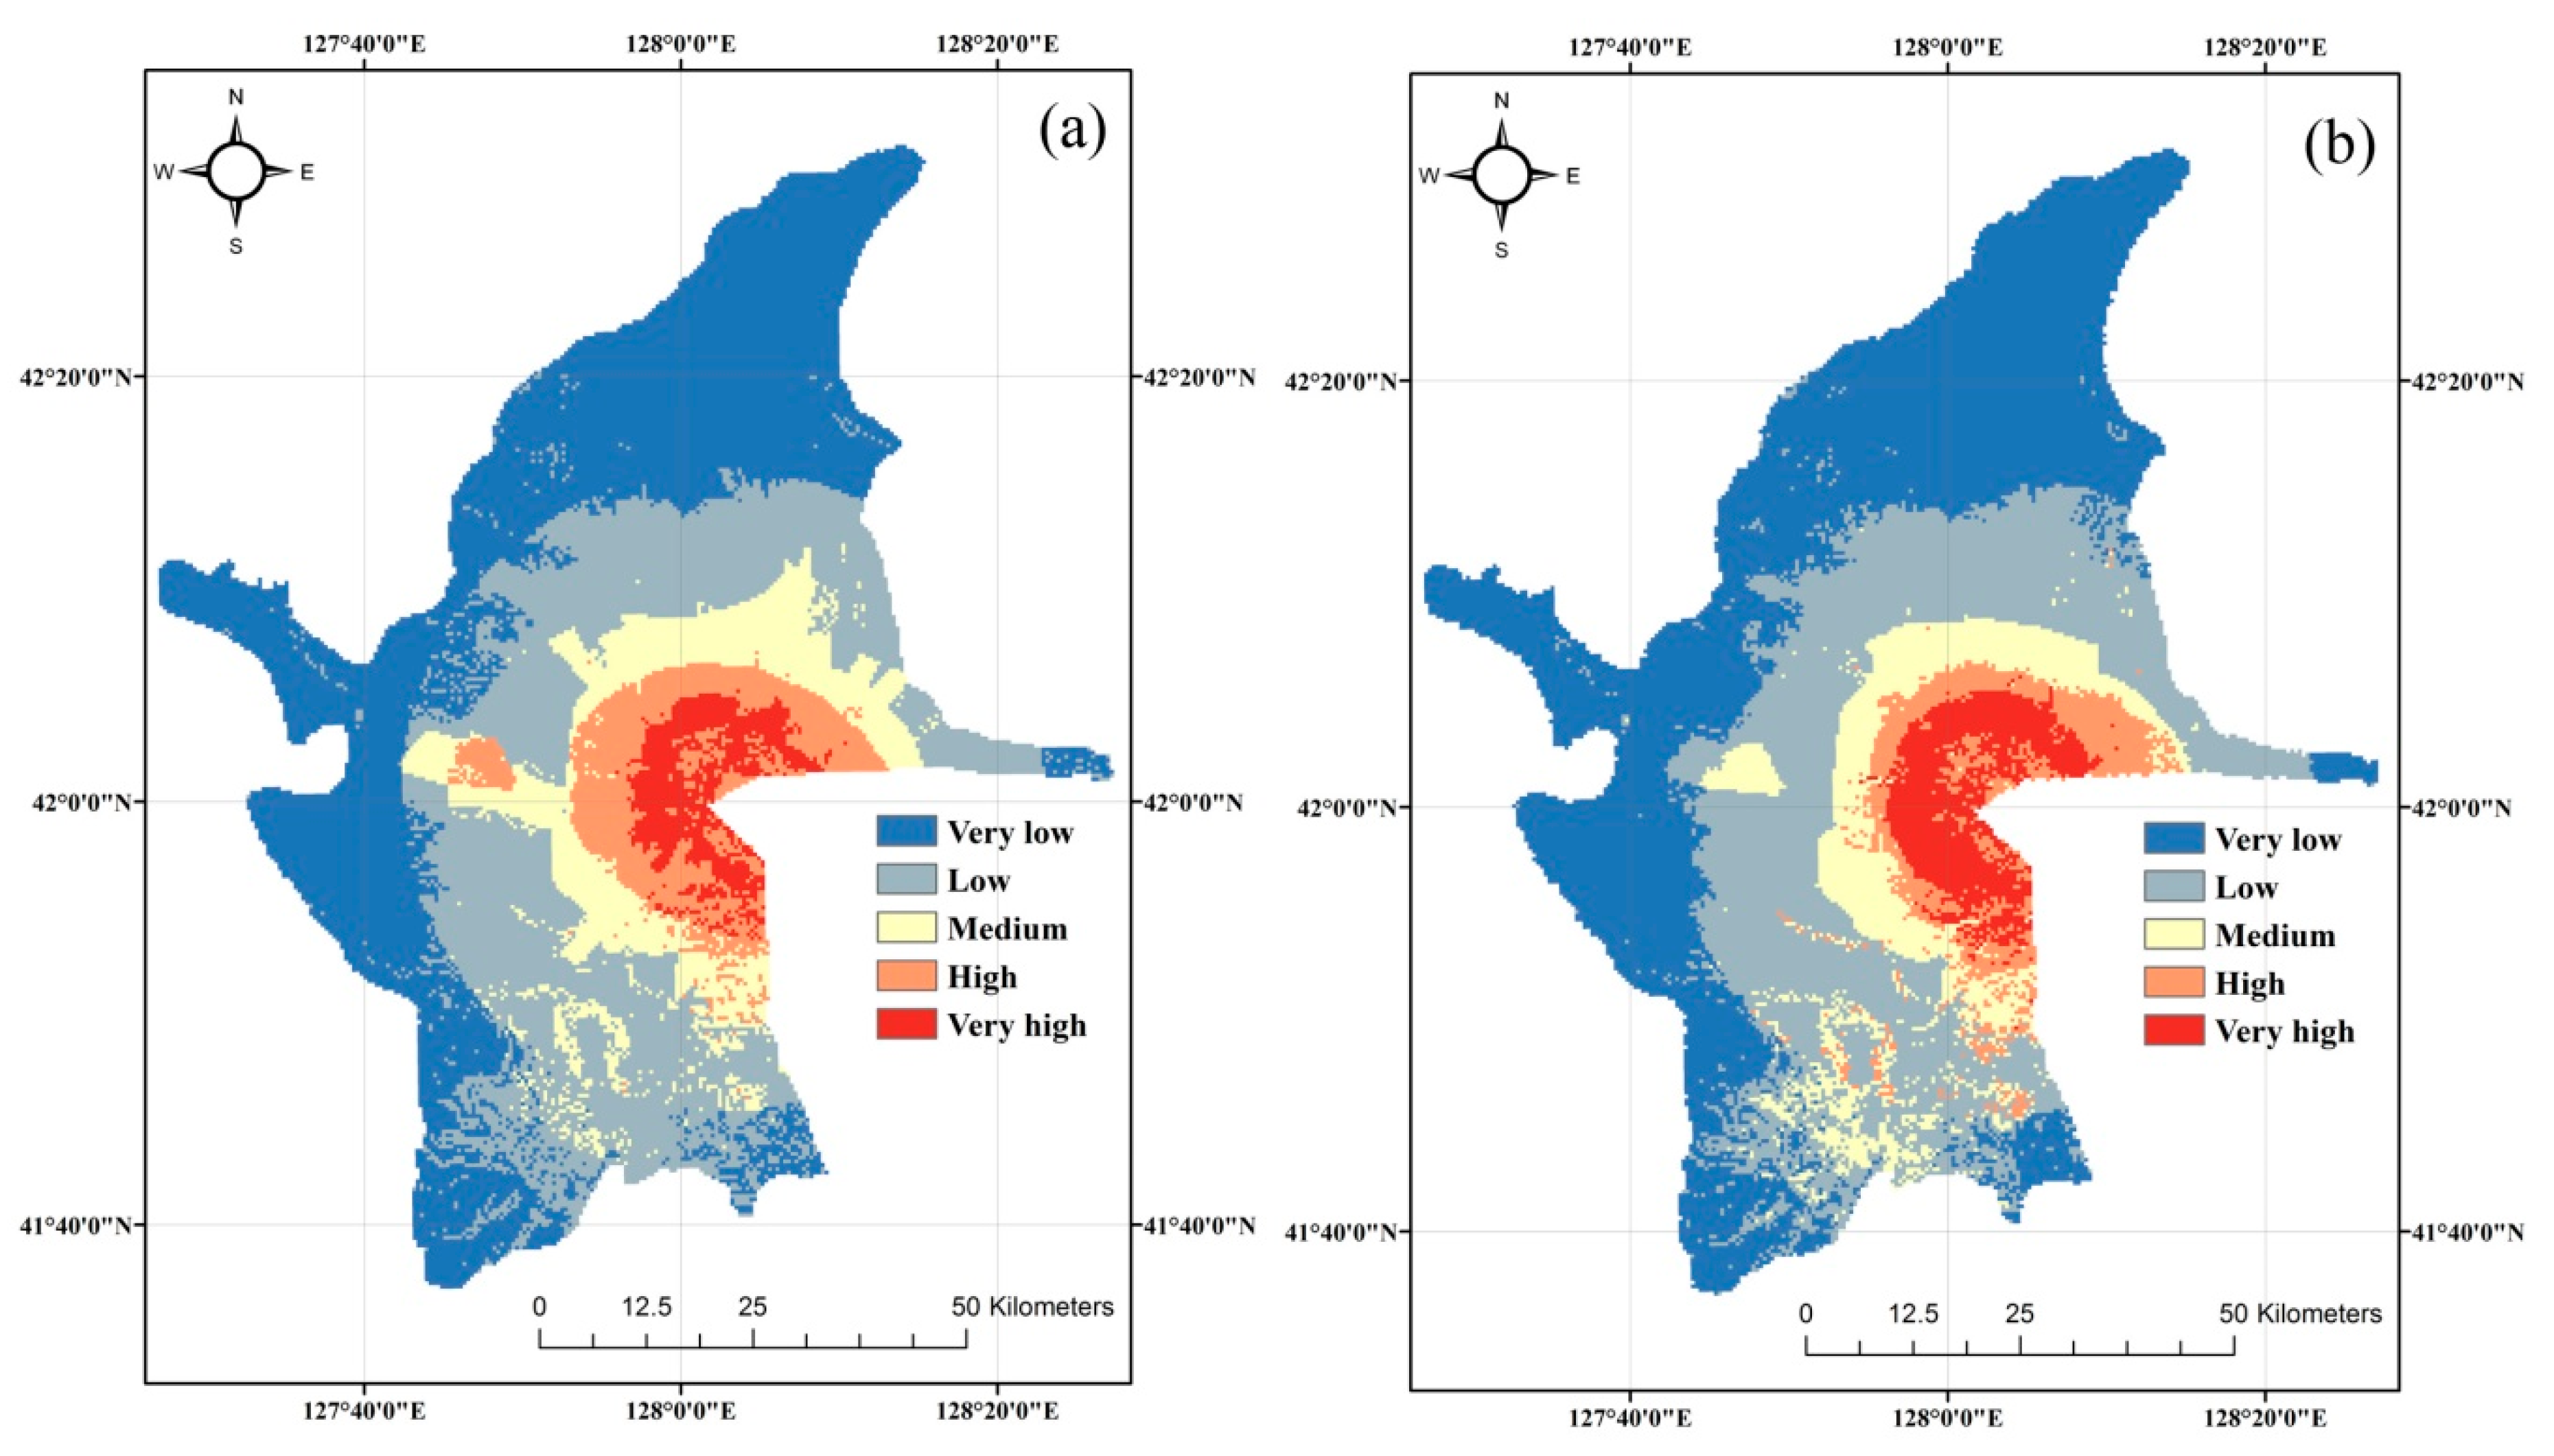
3.2. Disaster Chain Susceptibility Assessment of Bayesian Networks Model
3.3. Relative Analysis of the Susceptibility Evaluation Results
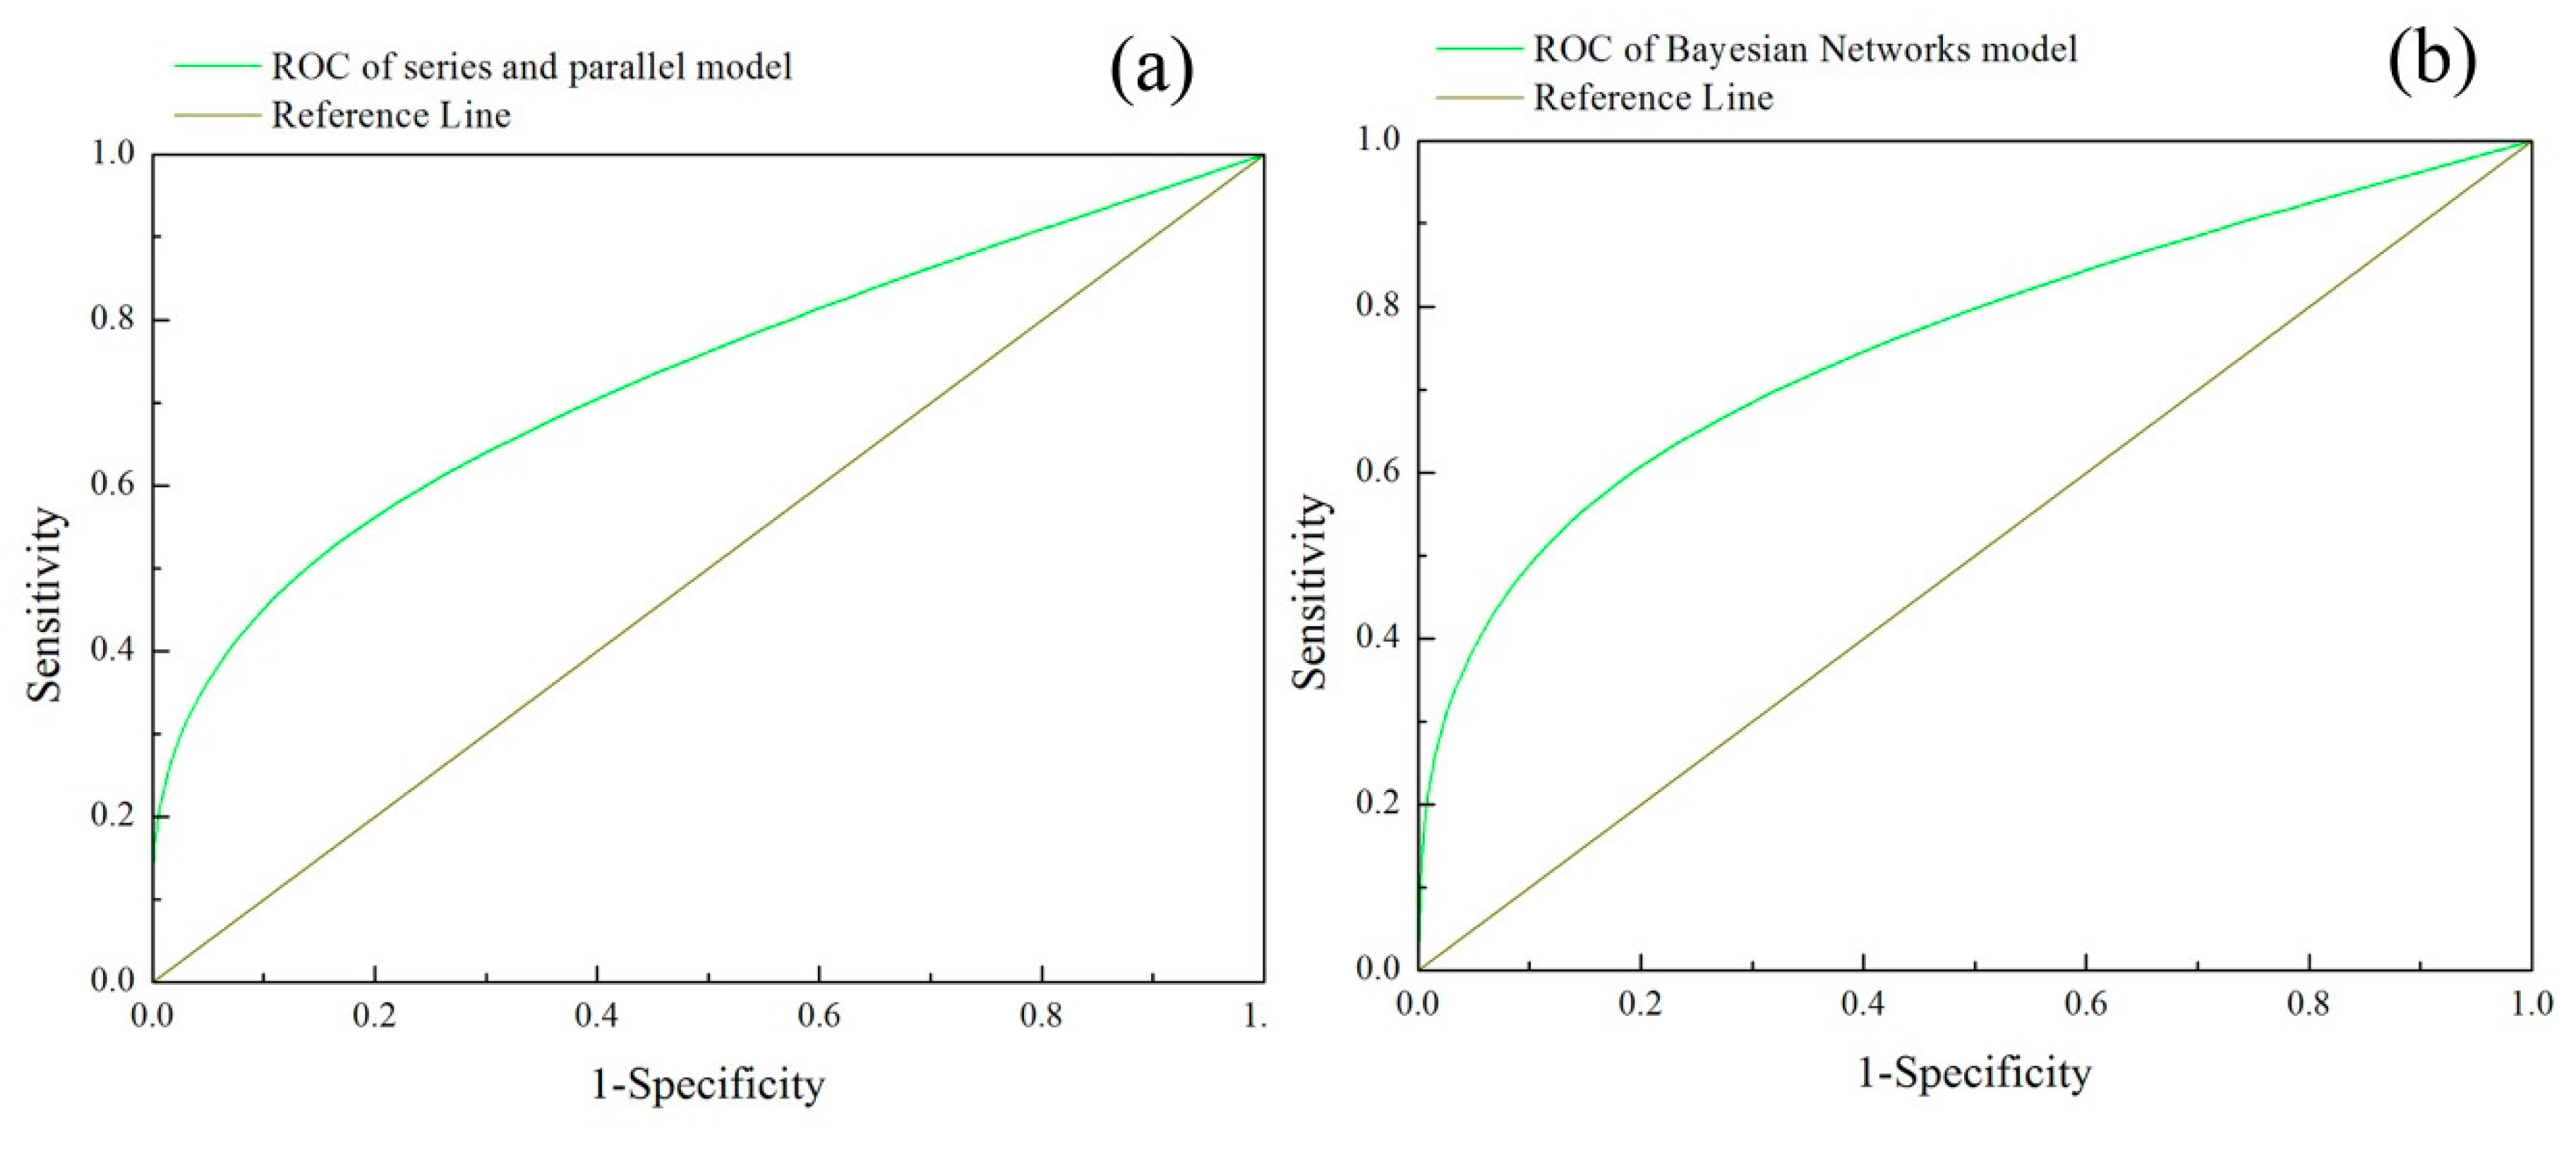
3.4. Verification of the Different Susceptibility Evaluation Models
4. Discussions
5. Conclusions
- (1)
- Visual analysis of the four disaster chain susceptibility maps showed that the susceptibility zones obtained from the series and parallel model and the Bayesian Networks model are broadly similar. Very high and high susceptibility are predominantly located within a 10 km radius of the Tianchi volcano, whereas the northern and southwestern sections of the study area were identified as low and very low susceptibility zones.
- (2)
- The basic linear correlation and cross-correlation methods were applied to compare the series and parallel model and the Bayesian Networks model, and the correlation coefficients, Cramer’s V and kappa index showed that the two models were similar and approximately compatible.
- (3)
- The verification results of the ROC curve for the two models were found to be 0.7727 and 0.8062 respectively, showing that two models have great potential for forecasting and early warning, and could be applied in emergency management for earthquake disaster chains in the future.
Supplementary Materials
Author Contributions
Funding
Acknowledgments
Conflicts of Interest
References
- Zhao, X.Y.; Hu, K.; Burns, S.F.; Hu, H.T. Classification and sudden departure mechanism of high-speed landslides caused by the 2008 Wenchuan earthquake. Environ. Earth Sci. 2019, 78, 125. [Google Scholar] [CrossRef]
- Qi, S.W.; Xu, Q.; Lan, H.X.; Zhang, B.; Liu, J.Y. Spatial distribution analysis of landsides triggered by 2008.5.12 Wenchuan Earthquake, China. Eng. Geol. 2010, 116, 95–108. [Google Scholar] [CrossRef]
- Serey, A.; Pinero-Feliciangeli, L.; Sepulveda, S.A.; Poblete, F.; Petley, D.N.; Murphy, W. Landslides induced by the 2010 Chile megathrust earthquake: A comprehensive inventory and correlations with geological and seismic factors. Landslides 2019, 16, 1153–1165. [Google Scholar] [CrossRef]
- Zhang, P.Z.; Restrepo, J.I.; Conte, J.P.; Ou, J.P. Nonlinear finite element modeling and response analysis of the collapsed Alto Rio building in the 2010 Chile Maule earthquake. Struct. Des. Tall Spec. Build. 2017, 26. [Google Scholar] [CrossRef]
- Goda, K.; Pomonis, A.; Chian, S.C.; Offord, M.; Saito, K.; Sammonds, P.; Fraser, S.; Raby, A.; Macabuag, J. Ground motion characteristics and shaking damage of the 11th March 2011 Mw9.0 Great East Japan earthquake. Bull. Earthq. Eng. 2013, 11, 147–170. [Google Scholar] [CrossRef]
- Lay, T. A review of the rupture characteristics of the 2011 Tohoku-oki Mw 9.1 earthquake. Tectonophysics 2018, 733, 4–36. [Google Scholar] [CrossRef]
- Shi, P.J. Theory and practice of disaster study. J. Nanjing Univ. (SI) 1991, 11, 37–42. [Google Scholar]
- Shi, P.J. Theory and practice of disaster study. J. Nat. Disasters 1996, 5, 8–19. [Google Scholar]
- Shi, P.J. Theory on disaster science and disaster dynamics. J. Nat. Disasters 2002, 11, 1–9. [Google Scholar]
- Guo, Z.J.; Qin, B.Y. Brief discussion on disaster physics. J. Catastrophol. 1987, 2, 25–33. [Google Scholar]
- Bai, Y.; Zhang, J.S.; Wang, J.A. A Comparative Study of Snow Disasters in Northern and Southern China—Taking Freezing and Snow Disaster in 2008 and Snowstorm Disaster in 2009 as Examples. J. Catastrophol. 2011, 26, 14–19. [Google Scholar]
- Chen, Y.; Hu, J.P.; Peng, F. Seismological challenges in earthquake hazard reductions: Reflections on the 2008 Wenchuan earthquake. Sci. Bull. 2018, 63, 1159–1166. [Google Scholar] [CrossRef]
- Reichenbach, P.; Rossi, M.; Malamud, B.D.; Mihir, M.; Guzzetti, F. A review of statistically-based landslide susceptibility models. Earth Sci. Rev. 2018, 180, 60–91. [Google Scholar] [CrossRef]
- Kargel, J.S.; Leonard, G.J.; Shugar, D.H.; Haritashya, U.K.; Bevington, A.; Fielding, E.J.; Fujita, K.; Geertsema, M.; Miles, E.S.; Steiner, J.; et al. Geomorphic and geologic controls of geohazards induced by Nepal’s 2015 Gorkha earthquake. Science 2016, 351, aac8353. [Google Scholar] [CrossRef]
- Regmi, A.D.; Dhital, M.R.; Zhang, J.Q.; Su, L.J.; Chen, X.Q. Landslide susceptibility assessment of the region affected by the 25 April 2015 Gorkha earthquake of Nepal. J Mt. Sci. 2016, 13, 1941–1957. [Google Scholar] [CrossRef]
- Dou, J.; Yunus, A.P.; Tien Bui, D.; Sahana, M.; Chen, C.W.; Zhu, Z.F.; Wang, W.D.; Pham, B.T. Evaluating GIS-Based Multiple Statistical Models and Data Mining for Earthquake and Rainfall-Induced Landslide Susceptibility Using the LiDAR DEM. Remote Sens. 2019, 11, 638. [Google Scholar] [CrossRef]
- Shrestha, S.; Kang, T.S. Assessment of seismically-induced landslide susceptibility after the 2015 Gorkha earthquake, Nepal. Bull. Eng. Geol. Environ. 2019, 78, 1829–1842. [Google Scholar] [CrossRef]
- Cao, J.; Zhang, Z.; Wang, C.Z.; Liu, J.F.; Zhang, L.L. Susceptibility assessment of landslides triggered by earthquakes in the Western Sichuan Plateau. Catena 2019, 175, 63–76. [Google Scholar] [CrossRef]
- Bathrellos, G.D.; Skilodimou, H.D.; Chousianitis, K.; Youssef, A.M.; Pradhan, B. Suitability estimation for urban development using multi-hazard assessment map. Sci. Total Environ. 2017, 575, 119–134. [Google Scholar] [CrossRef]
- Skilodimou, H.D.; Bathrellos, G.D.; Chousianitis, K.; Youssef, A.M.; Pradhan, B. Multi-hazard assessment modeling via multi-criteria analysis and GIS: A case study. Environ. Earth Sci. 2019, 78, 47. [Google Scholar] [CrossRef]
- Chousianitis, K.; Del Gaudio, V.; Sabatakakis, N.; Kavoura, K.; Drakatos, G.; Bathrellos, G.D.; Skilodimou, H.D. Assessment of Earthquake-Induced Landslide Hazard in Greece: From Arias Intensity to Spatial Distribution of Slope Resistance Demand. Bull. Seismol. Soc. Amer. 2016, 106, 174–188. [Google Scholar] [CrossRef]
- Tanyas, H.; Rossi, M.; Alvioli, M.; van Westen, C.J.; Marchesini, I. A global slope unit-based method for the near real-time prediction of earthquake-induced landslides. Geomorphology 2019, 327, 126–146. [Google Scholar] [CrossRef]
- Meena, S.R.; Ghorbanzadeh, O.; Blaschke, T. A Comparative Study of Statistics-Based Landslide Susceptibility Models: A Case Study of the Region Affected by the Gorkha Earthquake in Nepal. ISPRS Int. Geo-Inf. 2019, 8, 94. [Google Scholar] [CrossRef]
- Melo, R.; van Asch, T.; Zezere, J.L. Debris flow run-out simulation and analysis using a dynamic model. Nat. Hazards Earth Syst. Sci. 2018, 18, 555–570. [Google Scholar] [CrossRef] [Green Version]
- Oliveira, S.C.; Zezere, J.L.; Lajas, S.; Melo, R. Combination of statistical and physically based methods to assess shallow slide susceptibility at the basin scale. Nat. Hazards Earth Syst. Sci. 2018, 17, 1091–1109. [Google Scholar] [CrossRef]
- Luna, B.Q.; Blahut, J.; van Asch, T.; van Westen, C.; Kappes, M. ASCHFLOW—A dynamic landslide run-out model for medium scale hazard analysis. Geoenviron. Disasters 2016, 3, 29. [Google Scholar] [CrossRef]
- Huang, Y.; Zhao, L.Y.; Xiong, M.; Liu, C.; Lu, P. Critical slip surface and landslide volume of a soil slope under random earthquake ground motions. Environ. Earth Sci. 2018, 77, 787. [Google Scholar] [CrossRef]
- Salinas-Jasso, J.A.; Ramos-Zuniga, L.G.; Montalvo-Arrieta, J.C. Regional landslide hazard assessment from seismically induced displacements in Monterrey Metropolitan area, Northeastern Mexico. Bull. Eng. Geol. Environ. 2019, 78, 1127–1141. [Google Scholar] [CrossRef]
- Chen, X.L.; Liu, C.G.; Wang, M.M. A method for quick assessment of earthquake-triggered landslide hazards: A case study of the Mw6.1 2014 Ludian, China earthquake. Bull. Eng. Geol. Environ. 2019, 78, 2449–2458. [Google Scholar] [CrossRef]
- Zhang, H.T.; Feng, X.; Wang, Y.F.; Zhang, Z. Optimization of Cooler Networks with Different Cooling Types in Series and Parallel Configuration. Ind. Eng. Chem. Res. 2019, 58, 6017–6025. [Google Scholar] [CrossRef]
- Mao, S.J.; Chen, Y.; Li, C.M.; Li, W.H.; Popovic, J.; Ferreira, J.A. A Coupled-Inductor-Based LCC Resonant Converter with the Primary-Parallel-Secondary-Series Configuration to Achieve Output-Voltage Sharing for HV Generator Applications. IEEE Trans. Power Electron. 2019, 34, 6108–6122. [Google Scholar] [CrossRef]
- Cheng, C.W.; Zhou, Z.; Li, W.G.; Zhu, C.; Deng, Z.F.; Mi, C.C. A Multi-Load Wireless Power Transfer System with Series-Parallel-Series Compensation. IEEE Trans. Power Electron. 2019, 34, 7126–7130. [Google Scholar] [CrossRef]
- Tian, S.J.; Kong, J.M.; Fan, X.Y.; Han, P.F.; Sun, X.P. Series and parallel model of landslide hazard evaluation based on disaster conditions and application. J. Natural Disasters 2018, 27, 52–58. [Google Scholar]
- Dlamini, W.M. A Bayesian belief network analysis of factors influencing wildfire occurrence in Swaziland. Environ. Modell. Softw. 2010, 25, 199–208. [Google Scholar] [CrossRef]
- Sakai, C.; Iguchi, K.; Tachi, T.; Noguchi, Y.; Katsuno, S.; Teramachi, H. Factors Influencing Medicine Use Behavior in Adolescents in Japan Using a Bayesian Network Analysis. Front. Pharmacol. 2019, 10, 494. [Google Scholar] [CrossRef] [PubMed] [Green Version]
- Lee, D.; Berberidis, D.; Giannakis, G.B. Adaptive Bayesian Radio Tomography. IEEE Trans. Signal Process. 2019, 67, 1964–1977. [Google Scholar] [CrossRef]
- Vemulapalli, V.; Qu, J.Q.; Garren, J.M.; Rodrigues, L.O.; Kiebish, M.A.; Sarangarajan, R.; Narain, N.R.; Akmaev, V.R. Non-obvious correlations to disease management unraveled by Bayesian artificial intelligence analyses of CMS data. Artif. Intell. Med. 2016, 74, 1–8. [Google Scholar] [CrossRef] [Green Version]
- Trifonova, N.; Karnauskas, M.; Kelble, C. Predicting ecosystem components in the Gulf of Mexico and their responses to climate variability with a dynamic Bayesian network model. PLoS ONE 2019, 14, e0209257. [Google Scholar] [CrossRef]
- Fabbri, A.G.; Remondo, J.; Chung, C.J. Landslide Risk Assessment with Uncertainty of Hazard Class Membership. An Application of Favourability Modeling in the Deba Valley Area, Northern Spain. Eng. Geol. Soc. Territ. 2015, 2, 1759–1762. [Google Scholar] [CrossRef]
- Chang-Jo, F.C.; Andrea, G.F. Validation of Spatial Prediction Models for Landslide Hazard Mapping. Nat. Hazards 2003, 30, 451–472. [Google Scholar] [CrossRef]
- Pei, R.R.; Ni, Z.Q.; Meng, Z.B.; Zhang, B.L.; Geng, Y.Y. Cause Analysis of the Secondary Mountain Disaster Chain in Wenchuan Earthquake. Am. J. Civil Eng. 2017, 5, 414–417. [Google Scholar] [CrossRef]
- Wang, M.; Liu, M.; Yang, S.N.; Shi, P.J. Incorporating Triggering and Environmental Factors in the Analysis of Earthquake-Induced Landslide Hazards. Int. J. Disaster Risk Sci. 2014, 5, 125–135. [Google Scholar] [CrossRef] [Green Version]
- Hariklia, D.S.; George, D.B.; Efterpi, K.; Konstantinos, S.; Dimitrios, R. Physical and Anthropogenic Factors Related to Landslide Activity in the Northern Peloponnese, Greece. Land 2018, 7, 85. [Google Scholar] [CrossRef]
- Li, X.; Liu, X.L.; Li, J.G.; Wang, Q.L.; Liao, W.L.; Zhang, L.F. Factor analysis of earthquake-induced geological disasters of the M7.0 Lushan earthquake in China. Geod. Geodyn. 2013, 4, 22–29. [Google Scholar] [CrossRef]
- Wang, Y.; Fang, Z.C.; Hong, H.Y. Comparison of convolutional neural networks for landslide susceptibility mapping in Yanshan County, China. Sci. Total Environ. 2019, 666, 975–993. [Google Scholar] [CrossRef]
- Lupiano, V.; Rago, V.; Terranova, O.G.; Iovine, G. Landslide inventory and main geomorphological features affecting slope stability in the Picentino river basin (Campania, southern Italy). J. Maps 2019, 15, 131–141. [Google Scholar] [CrossRef] [Green Version]
- Tsangaratos, P.; Ilia, I.; Hong, H.Y.; Chen, W.; Xu, C. Applying Information Theory and GIS-based quantitative methods to produce landslide susceptibility maps in Nancheng County, China. Landslides 2017, 14, 1091–1111. [Google Scholar] [CrossRef]
- Akgun, A. A comparison of landslide susceptibility maps produced by logistic regression, multi-criteria decision, and likelihood ratio methods: A case study at İzmir, Turkey. Landslides 2012, 9, 93–106. [Google Scholar] [CrossRef]
- Ali, S.; Biermanns, P.; Haider, R.; Reicherter, K. Landslide susceptibility mapping by using a geographic information system (GIS) along the China-Pakistan Economic Corridor (Karakoram Highway), Pakistan. Nat. Hazards Earth Syst. Sci. 2019, 19, 999–1022. [Google Scholar] [CrossRef]
- Shrestha, S.; Kang, T.S.; Choi, J.C. Assessment of co-seismic landslide susceptibility using LR and ANCOVA in Barpak region, Nepal. J. Earth Syst. Sci. 2018, 127, 38. [Google Scholar] [CrossRef]
- Chen, J.J.; Cao, C.; Qin, S.W.; Peng, S.Y.; Ma, Q.; Liu, X.; Zhai, J.J. Debris flow susceptibility mapping using an improved information value model based on a combined weighting method for Jilin province, China. Fresenius Environ. Bull. 2018, 27, 9706–9716. [Google Scholar]
- Kang, S.; Lee, S.R. Debris flow susceptibility assessment based on an empirical approach in the central region of South Korea. Geomorphology 2018, 308, 1–12. [Google Scholar] [CrossRef]
- Cao, C.; Zheng, L.J.; Liu, Y.W.; Chen, D.H. An Approach to Assess Debris Flow Susceptibility. Fresenius Environ. Bull. 2018, 27, 7572–7578. [Google Scholar]
- Charniak, E. Bayesian networks without tears. AI Mag. 1991, 12, 50–63. [Google Scholar] [CrossRef]
- Masmoudi, K.; Abid, L.; Masmoudi, A. Credit risk modeling using Bayesian network with a latent variable. Expert Syst. Appl. 2019, 127, 157–166. [Google Scholar] [CrossRef]
- Ghribi, A.; Masmoudi, A. A Compound Poisson Model for Learning Discrete Bayesian Networks. Acta Math. Sci. 2013, 33, 1767–1784. [Google Scholar] [CrossRef]
- Castelletti, A.; Soncini-Sessa, R. Bayesian Networks and participatory modeling in water resource management. Environ. Modell. Softw. 2007, 22, 1075–1088. [Google Scholar] [CrossRef]
- Joseph, S.A.; Adams, B.J.; McCabe, B. Methodology for Bayesian Belief Network Development to Facilitate Compliance with Water Quality Regulations. J. Infrastruct. Syst. 2010, 16, 58–65. [Google Scholar] [CrossRef] [Green Version]
- Nadkarni, S.; Shenoy, P.P. A Bayesian network approach to making inferences in causal maps. Eur. J. Oper. Res. 2001, 128, 479–498. [Google Scholar] [CrossRef] [Green Version]
- Kabir, G.; Tesfamariam, S.; Francisque, A.; Sadiq, R. Evaluating risk of water mains failure using a Bayesian belief network model. Eur. J. Oper. Res. 2015, 240, 220–234. [Google Scholar] [CrossRef]
- Wang, C. The Research of Seismic Influence Filed and Intensity Attenuation. Master’s Thesis, Southwest JiaoTong University, Chengdu, China, 2014. [Google Scholar]
- Shen, W.H.; Zhong, Q.; Shi, B.P. Synthetic seismic intensity for historic earthquakes in the North China Plain: Implications for the regional seismic hazard. Nat. Hazards 2014, 74, 305–323. [Google Scholar] [CrossRef]
- Cui, X.; Miao, Q.J.; Wang, J.P. Model of the Seismic Intensity Attenuation for North China. North China Earthq. Sci. 2010, 28, 18–21. [Google Scholar] [CrossRef]
- Tang, Z.; McCabe, B. Developing Complete Conditional Probability Tables from Fractional Data for Bayesian Belief Networks. J. Comput. Civil. Eng. 2007, 21, 265–276. [Google Scholar] [CrossRef]
- Di Baldassarre, G.; Nohrstedt, D.; Mard, J.; Burchardt, S.; Albin, C. An Integrative Research Framework to Unravel the Interplay of Natural Hazards and Vulnerabilities. Earth Future 2018, 6, 305–310. [Google Scholar] [CrossRef]
- Qiu, J.N.; Liu, L.L.; Dong, L.L. Modeling method and application of emergent event chain based on Bayesian network. J. Syst. Eng. 2012, 27, 739–750. [Google Scholar]
- Hilvano, N.F.; Nelson, G.L.M.; Coladilla, J.O.; Rebancos, C.M. Household Disaster Resiliency on Typhoon Haiyan (Yolanda): The Case of Manicani Island, Guiuan, Eastern Samar, Philippines. Coast Eng. J. 2016, 58, 1640007. [Google Scholar] [CrossRef]
- Vakhshoori, V.; Pourghasemi, H.R. A novel hybrid bivariate statistical method entitled FROC for landslide susceptibility assessment. Environ. Earth Sci. 2018, 77, 686. [Google Scholar] [CrossRef]
- Fawcett, T. An introduction to ROC analysis. Pattern Recognit. Lett. 2006, 27, 861–874. [Google Scholar] [CrossRef]


| Earthquake-landslide | Earthquake-landslide-debris flow | |
|---|---|---|
| Correlation coefficients | 0.8267 | 0.9384 |
| Cramer’s V | 0.71 | 0.782 |
| Chi-square | 11941.334 | 14497.015 |
| Kappa index | 0.602 | 0.757 |
© 2019 by the authors. Licensee MDPI, Basel, Switzerland. This article is an open access article distributed under the terms and conditions of the Creative Commons Attribution (CC BY) license (http://creativecommons.org/licenses/by/4.0/).
Share and Cite
Han, L.; Zhang, J.; Zhang, Y.; Lang, Q. Applying a Series and Parallel Model and a Bayesian Networks Model to Produce Disaster Chain Susceptibility Maps in the Changbai Mountain area, China. Water 2019, 11, 2144. https://doi.org/10.3390/w11102144
Han L, Zhang J, Zhang Y, Lang Q. Applying a Series and Parallel Model and a Bayesian Networks Model to Produce Disaster Chain Susceptibility Maps in the Changbai Mountain area, China. Water. 2019; 11(10):2144. https://doi.org/10.3390/w11102144
Chicago/Turabian StyleHan, Lina, Jiquan Zhang, Yichen Zhang, and Qiuling Lang. 2019. "Applying a Series and Parallel Model and a Bayesian Networks Model to Produce Disaster Chain Susceptibility Maps in the Changbai Mountain area, China" Water 11, no. 10: 2144. https://doi.org/10.3390/w11102144