A Spatiotemporal Analysis of Nitrogen Pollution in a Coastal Region with Mangroves of the Southern Gulf of Mexico


1
Instituto de Ingeniería del Agua y del Medio Ambiente, Universitat Politècnica de València, Camino de Vera s/n, Valencia 46022, Spain
2
Departamento de Ingeniería Civil, Universidad Veracruzana, Lomas del Estadio s/n, Xalapa 91000, Mexico
*
Author to whom correspondence should be addressed.
Water 2019, 11(10), 2143; https://doi.org/10.3390/w11102143
Submission received: 12 September 2019
/
Revised: 11 October 2019
/
Accepted: 12 October 2019
/
Published: 15 October 2019
(This article belongs to the Section Water Quality and Contamination)
Abstract
:Nitrogen pollution is a growing problem in many rivers and estuaries of the Southern Gulf of Mexico. In Costa Esmeralda, a tourist destination in Veracruz, the increasing nitrogen pollution is causing severe environmental damage. However, very few studies addressed nitrogen pollution and its consequences for beaches and mangroves. In this study, a spatiotemporal evaluation of nitrogen concentrations was performed along two rivers discharging into Costa Esmeralda and the associated mangrove and coastal areas. The data used was obtained from the local government, which measured ammonium, nitrate and organic nitrogen concentrations between 2013 and 2016 with four annual measurements. Clustering analysis was used to detect the nitrogen concentration differences between riverine and coastal sites. Additionally, Mann-Kendall test was used to detect the trends throughout the study period. The Mann-Whitney W-test determined the difference in the median concentrations between the dry and the wet season. The results indicate that organic nitrogen concentrations are increasing in river mouths and coastal waters. Nitrogen pollution caused an intrusion of water hyacinths in touristic beaches and completely covered mangroves. The decomposition of these plants in saline waters was identified as the main potential source of increasing organic concentrations, driven by nitrogen pollution from wastewater, deforestation and fertilizers, and causing many environmental and socio-economic damage to the area. The results shed light on the prevailing water pollution problems in the Southern Gulf of Mexico.
1. Introduction
The Gulf of Mexico is a semi-enclosed coastal sea with moderately high productivity that supports great biological diversity. It provides many goods and services such as oil and gas production, fisheries, habitat for endangered species, tourism and support for state economies [1]. The Gulf of Mexico is a shared ecosystem in which environmental solutions are a common responsibility among governments, primarily the United States and Mexico [2]. In the Northern Gulf of Mexico, nitrogen (N) riverine discharges from the Mississippi and Atchafalaya rivers have caused high phytoplankton concentrations in coastal waters, hypoxia [3], acidification [4], toxic algal blooms [5], and have generated one of the largest marine hypoxic zones known as a dead zone [6]. Agricultural runoff has been identified as the main driver of eutrophication [7]. While nutrient pollution and its consequences in the Northern Gulf is a long-standing problem and has been largely addressed by scientists and the U.S. government, the Southern Gulf corresponding to the Mexican coast is still a growing ecological and human health issue with limited attention. The Southern Gulf of Mexico has a much higher poverty rate and increasing populations are degrading coastal ecosystems and the services they provide to society [8].
The Mexican state of Veracruz has a significant share of the Southern Gulf of Mexico’s coastal waters. The alteration of the coast in Veracruz started many years ago, and today human activity is still a growing pressure to the coast [9]. Veracruz estuaries have long been affected by nutrient over-enrichment, which has caused poor water quality [10]. Eutrophic conditions in coastal lagoons have prevailed for at least 30 years, with a significant anthropogenic impact all along the coast as they receive excess nutrients [11]. Over 10 years ago, scientists already determined that deforestation and agricultural runoff were significantly contributing to the degradation of coastal waters in Veracruz due to nutrient loads [10]. And yet, there is still an intensification of agriculture, urbanization and other economic activities along the coast [11]. The application of fertilizers to increase agricultural productivity has been encouraged by governmental policies, while farmers are not provided with appropriate training [12]. Consequently, natural water bodies are being increasingly impacted by diffuse nutrient pollution generated from such practices. Additionally, sewage discharges which most of the time lack a proper treatment process, also represent a significant input of nutrients to coastal waters [13]. As a consequence, harmful algal blooms are an issue of concern in the Mexican coast of the Gulf of Mexico [14], and the prevalence of cholera has been related to poor water quality [15].
Mexico is the fourth mangrove-richest country in the world [16], one of the most productive ecosystems on Earth that grow in coastal areas. Mangroves provide food and shelter for many marine species and birds, and act as natural barriers against hurricanes, tsunamis and sea level rise [17]. Moreover, mangroves are a large carbon stock known as blue carbon [18], and the deforestation of these ecosystems entails large greenhouse gas emissions [19]. Despite all of the above-mentioned, 35% of mangroves were lost worldwide between 1980 and 2000 [16] and still continue to decrease [20]. If the current deforestation rate does not change, all mangroves could be gone by next century [21]. The high primary production in mangroves is generally attributed to leaf degradation processes [22], which recycle nutrients within the ecosystem [23]. Mangroves play a significant role in N dynamics, which indicates that anthropogenic nutrient enrichment may cause extensive impact in the N cycling [24]. With urban development, mangroves receive more nutrients, which could lead to an accelerated change [25]. For instance, N enrichment alters biological processes such as nitrogen fixation or denitrification and modifies the competitive ability among species. As a consequence of anthropogenic N, mangroves may increase N2O fluxes to the atmosphere, also contributing to global warming [24]. The alteration of mangrove functioning as a consequence of N enrichment may reduce the goods and services they provide, such as coastal fisheries or the improvement of water quality [17]. In Mexico, tourism, agricultural and urban development along the coast cause serious mangrove degradation [26], affecting the resilience of coastal lagoons [27]. Additionally, high N concentrations in mangroves enables the growth of exotic species [25].
Water hyacinth (Eichhornia crassipes) is considered to be one of the most invasive aquatic species on Earth [28]. This floating plant prevails in tropical and subtropical areas where nutrient pollution exists due to agricultural runoff, deforestation or untreated wastewater discharges [28]. Nutrient availability and temperature regulates its growth [29,30]. As such, water hyacinth blooms in summer as a result of high temperatures and sustained by nutrient pollution. The presence of water hyacinth in the ecosystem may have both beneficial and detrimental effects. On one side, this plant is often used for phytoremediation, as it absorbs pollutants such as nutrients or heavy metals [31]. Nonetheless, when the extent of the invasion is too large, the threads to the ecosystem can be very significant. Decaying plants may reduce the available oxygen and unbalance the nutrient cycling [32]. This free-floating plant was introduced in Veracruz’s rivers many years ago. Due to the rapid urbanization of the coast over beaches and mangroves [33] and to the lack of wastewater treatment, nutrient pollution is a growing problem in many estuaries of Veracruz [11], which may lead to the unlimited growth of water hyacinths.
Despite the growing environmental damage in the Southern Gulf of Mexico, few studies [10,11,14] have addressed nitrogen pollution and its consequences. This study evaluates the spatial and temporal variations of ammonium, nitrate and organic nitrogen concentrations along two rivers and their coastal areas associated to mangroves where water hyacinth invasion is prevalent. The main objective was to determine whether nitrogen pollution or changes in N speciation may have occurred along the river and the coast and determine the possible sources and consequences for beaches and mangroves. The results can be extrapolated to other regions of the Southern Gulf of Mexico with similar characteristics.
2. Materials and Methods
2.1. Study Area
This research focused on two rivers of the state of Veracruz discharging into the Gulf of Mexico. The river mouths are located within Costa Esmeralda, a tourist destination with low and medium density tourism [34]. Most of the communities in the studied areas are marginalized, with a high percentage of the population living in poverty [35]. The inhabitants are mainly engaged in fishing, agriculture or tourism.
The coastal area is covered by wetlands, including mangroves. A large area of mangroves has been lost in the last decades, mainly due to agriculture and cattle ranching [36] or to disturbances from hurricanes [35]. Urban wastewater does not undergo any treatment before the discharge into natural systems and industrial waste, such as fruit juice companies, discharge their waste into the rivers [35]. In order to study the source of nitrogen to mangrove areas and to the coast through the Tecolutla and Nautla rivers, 6 and 4 monitoring sites were selected along each river respectively. An additional site was located in each river mouth. One coastal site was placed ~1 km from the Tecolutla river mouth and three sites ~1 km, ~4 km and ~7 km from the Nautla river mouth, respectively. The study area is presented in Figure 1 and the monitoring sites in Table 1, together with the distance to the coast and the mean salinity. The later was calculated with four measurements from 2016.
The data used was obtained from the local government which measures nitrogen concentrations in these monitoring sites. Ammonium and organic nitrogen were measured according to the Mexican standard NMX-AA-026-SCFI-2010 and nitrate based on NMX-AA-079-SCFI-2001. The data used for this study includes four annual measurements from 2013 to 2016. Each year, two measurements were made during the dry season and two during the wet season.
2.2. Data Analysis
The spatiotemporal analysis of water quality parameters allows the assessment of possible sources and consequences of water pollution [37]. Therefore, several spatial and temporal statistical analysis were performed.
2.2.1. Spatial Analysis
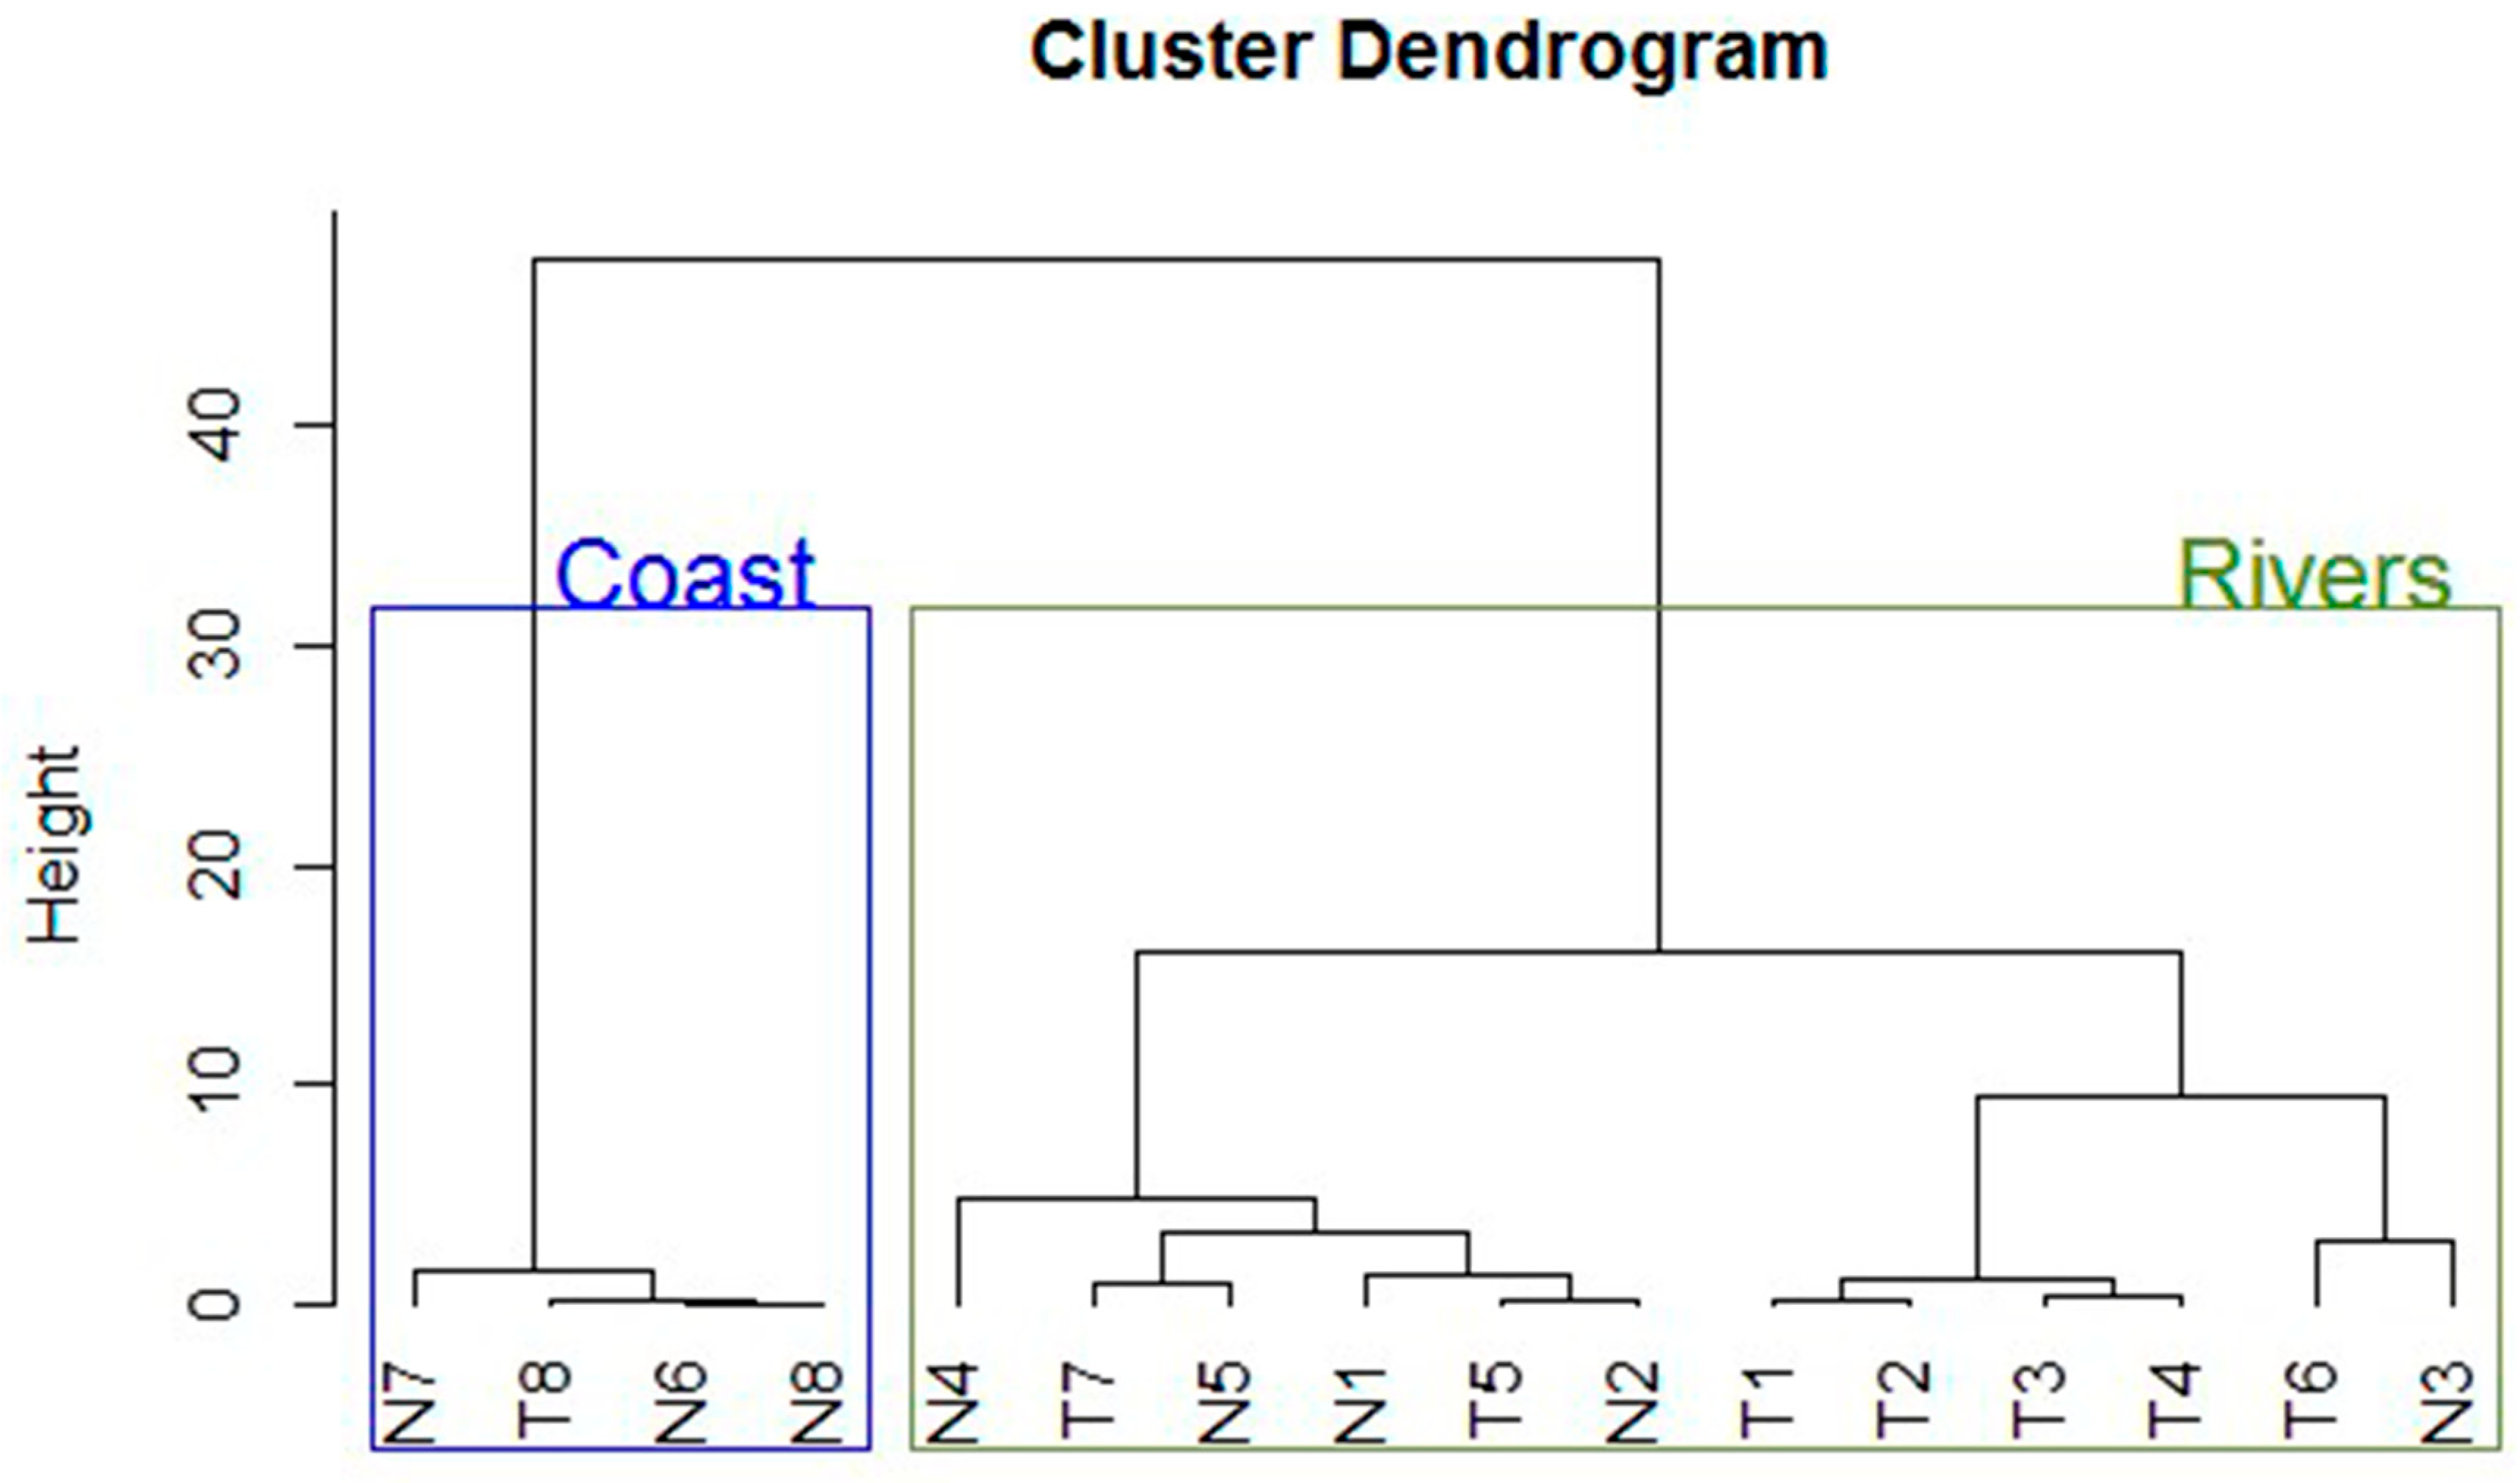
Firstly, spatial variations in nitrogen species concentrations were identified. As water quality data do not usually meet the requirements for the use of parametric statistics [38], non-parametric methods were selected. Cluster analysis (CA) is a non-parametric multivariate statistical method which groups objects in clusters based on similarities among objects of the same group and differences within the groups. The clusters obtained are consequently groups of observations with similar characteristics. In this study, CA was used to classify the monitoring sites (objects) into groups of different nitrogen concentration levels (clusters). Ward’s method was used as a clustering strategy as it has been defined as the most appropriate method to evaluate eutrophication [38,39]. The squared Euclidean distance was selected as the distance measure to increase the importance of large distances among the monitoring sites [40]. Three variables were used for classification: ammonium, nitrate and organic N concentrations. The outliers are not discarded as they carry information related to the ecosystem’s stress [38]. Using the median of each monitoring site was more robust due to the presence of outliers. Each variable was standardized prior to CA implementation. Two groups (clusters) were defined which correspond to coastal and riverine samples.
2.2.2. Temporal Analysis
The Mann-Kendall test was used to detect temporal trends in nitrogen species concentrations and to identify whether the observed trends were statistically significant. This test is a non-parametric monotonic trend analysis which identifies the increasing or decreasing patterns in time series data [41]. Non-parametric methods do not require assumptions on the normal distribution of the data and are not distorted by outliers or missing data [38]. The test was applied to ammonium, nitrate and organic N concentrations from 2013 to 2016. The Mann-Whitney (Wilcoxon) W-test was used to compare the medians of each nitrogen species in the dry and wet seasons. Additionally, for those sites with a statistically significant trend, the temporal variation for each season was analyzed.
3. Results
3.1. Spatial Variations
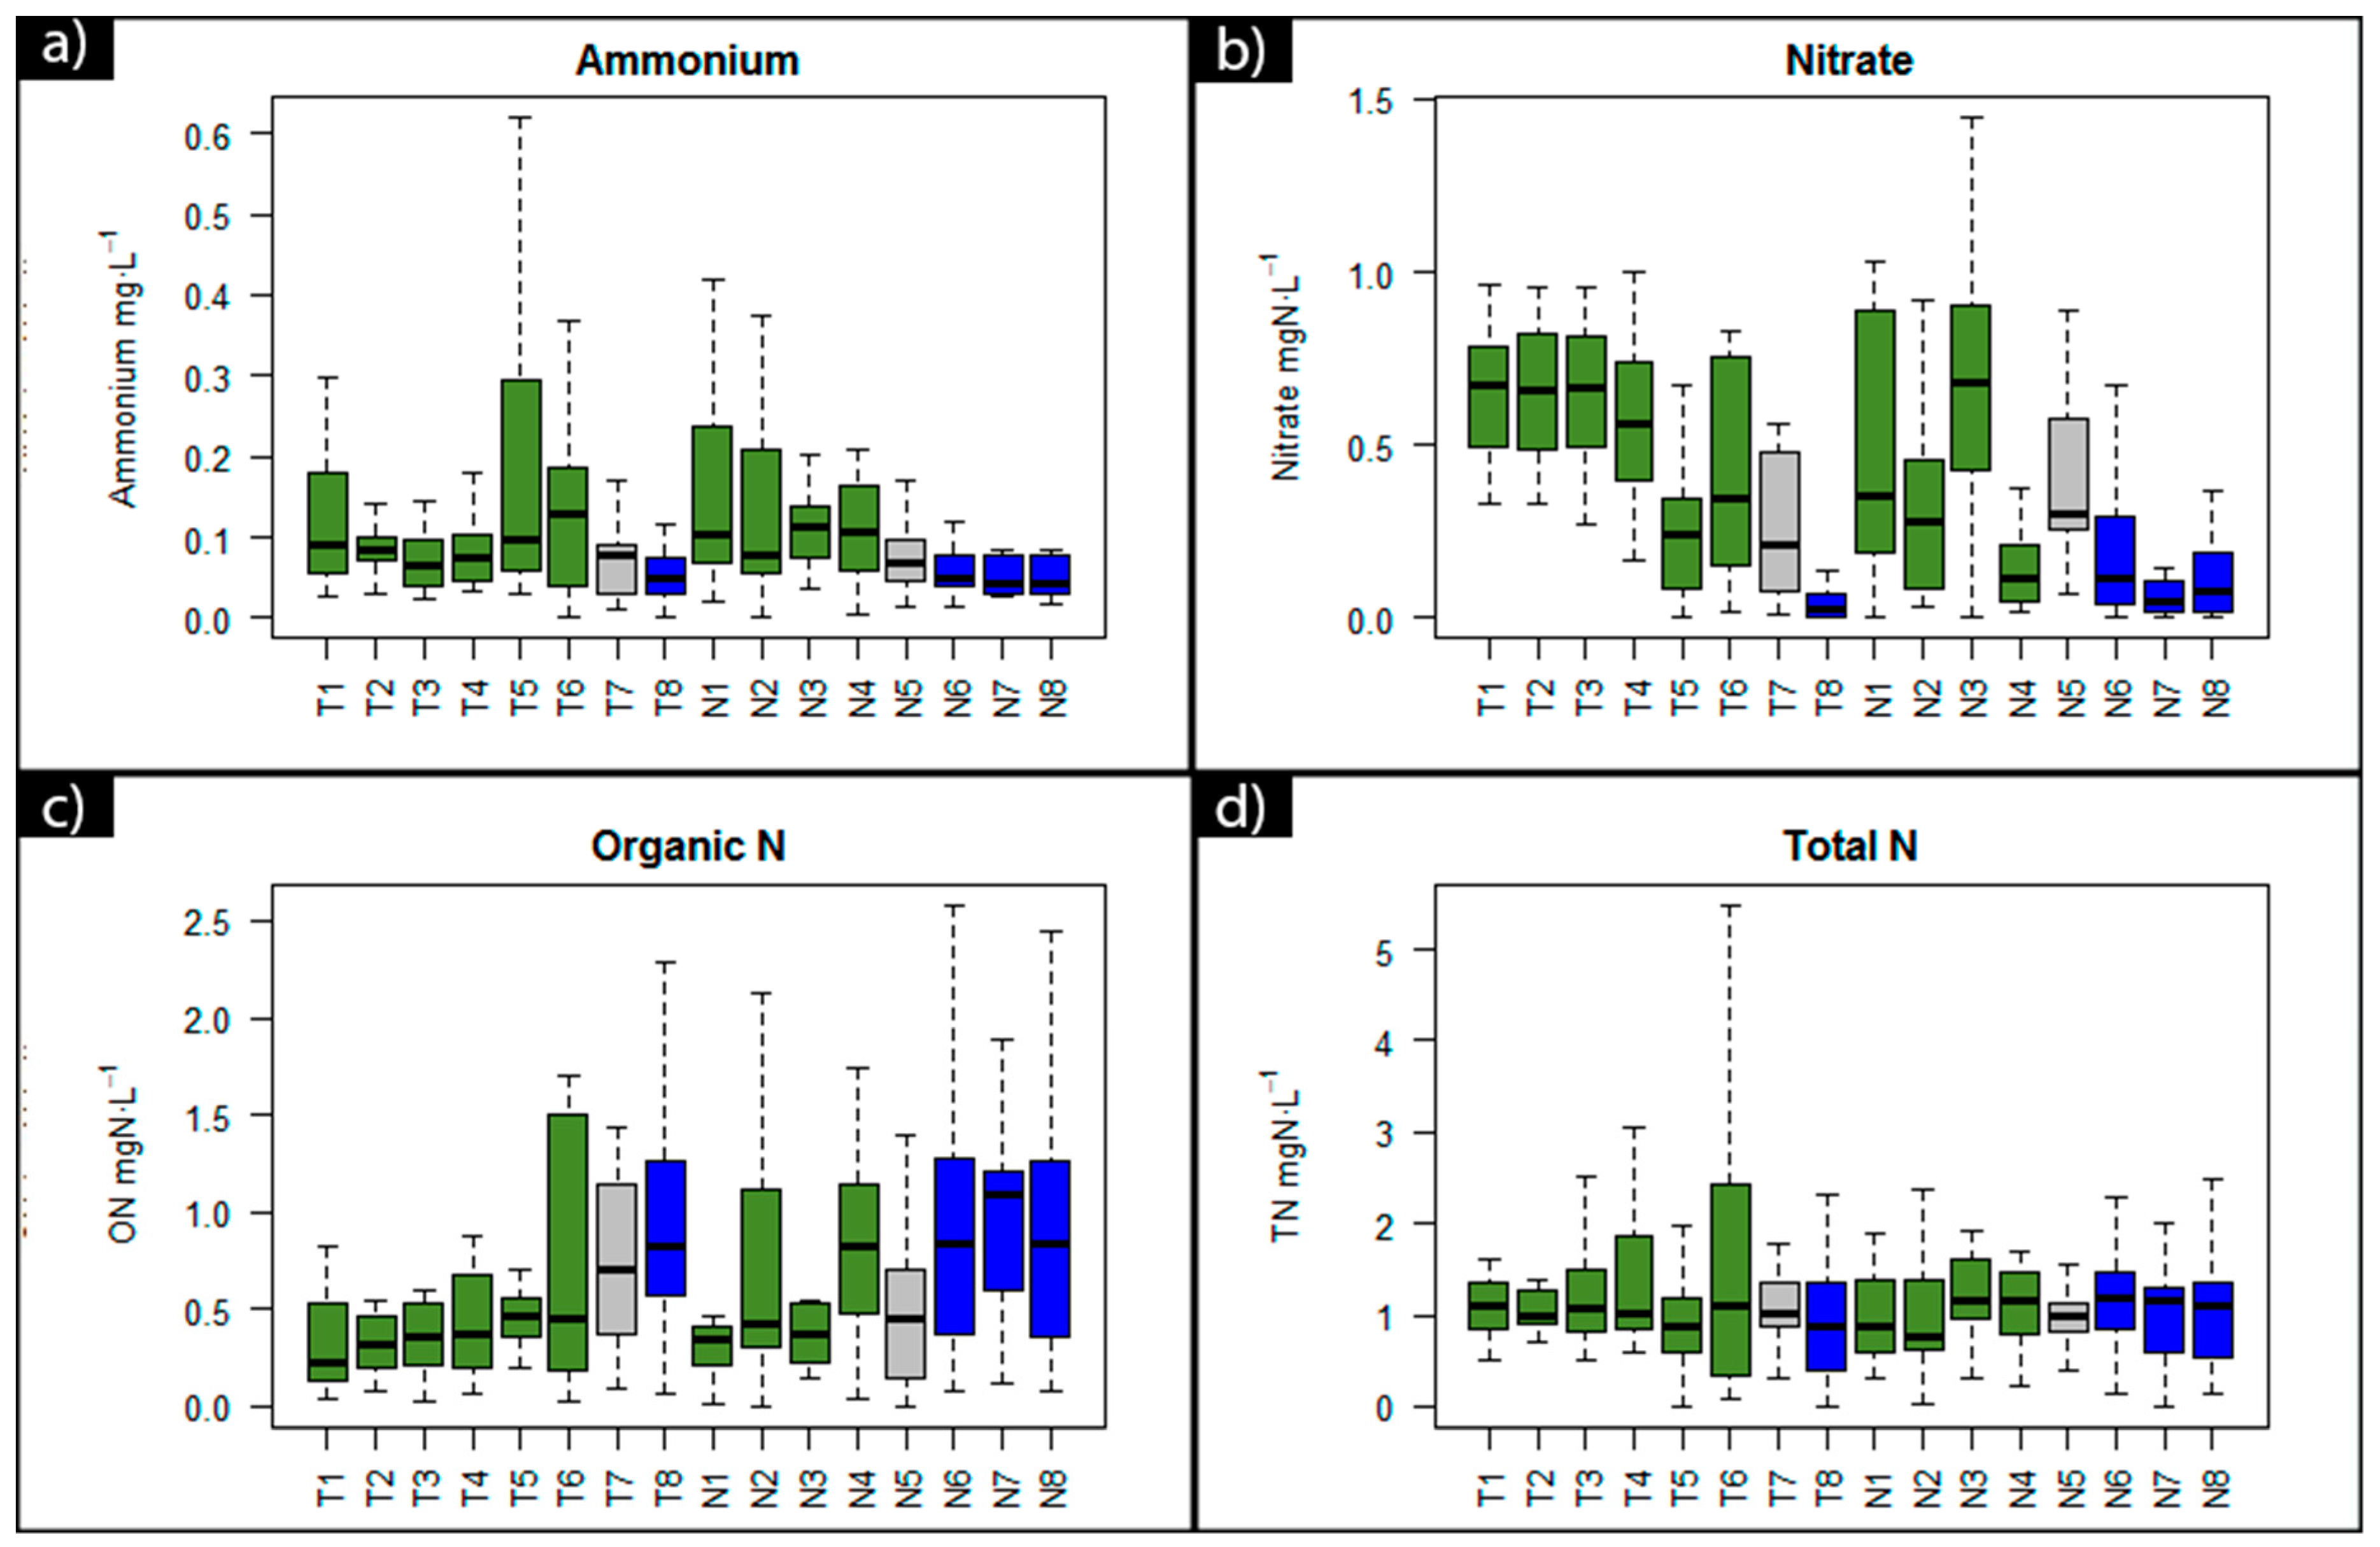
Ammonium, nitrate, organic N and total N concentrations in each monitoring site are presented in Figure 2. Both ammonium and nitrate concentrations were lower in coastal areas than in river sites due to the dilution of riverine nutrients with marine water. However, organic nitrogen was higher in coastal sites of both Tecolutla and Nautla watersheds. Total nitrogen did not present any difference between riverine and coastal sites.
3.2. Temporal Variations
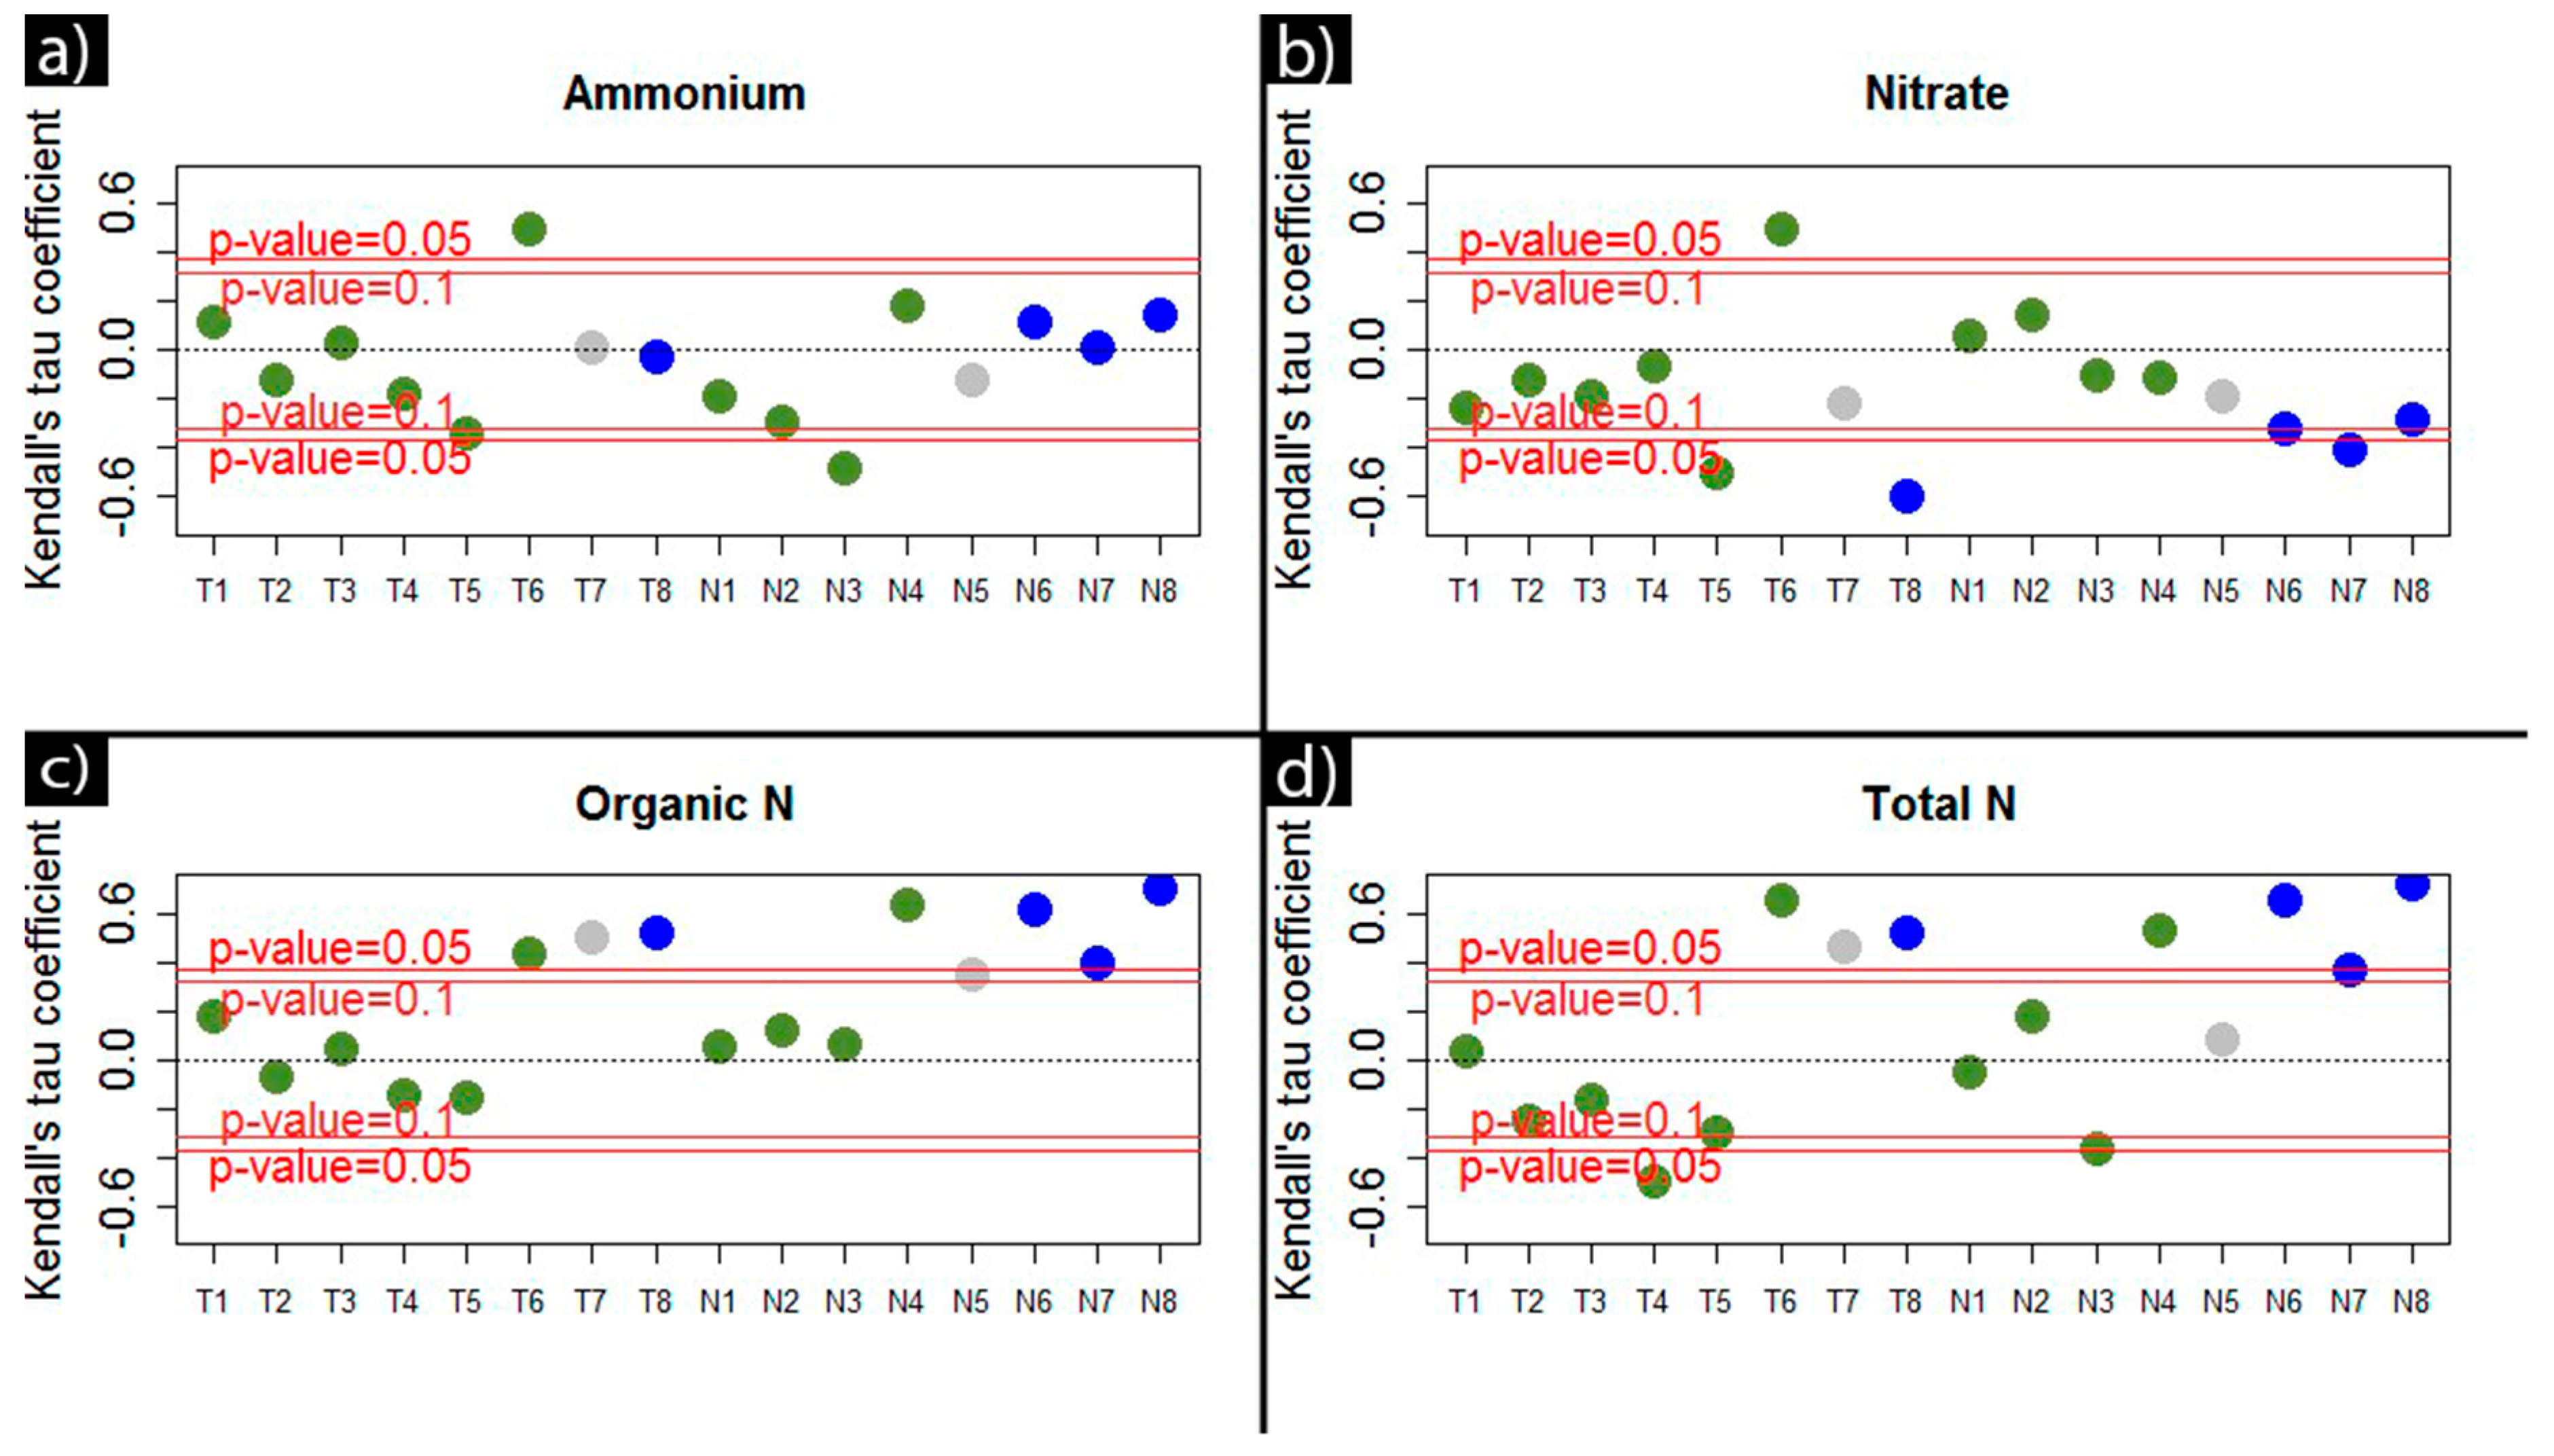
The Mann Kendall test was applied to each N compound in each monitoring site. Kendall tau’s coefficient is shown in Figure 5, and significant upward or downward trends are located above or below the red lines respectively. Ammonium had a significant upward tendency in T6 and a downward tendency in N3. T6 corresponds to a mangrove-covered area close to the Tecolutla river mouth. Nitrate also showcased an upward trend in T6, while it decreased in coastal sites. On the other hand, organic N had a general upward tendency in coastal waters and close to both Tecolutla and Nautla river mouths. The tendency observed for total nitrogen was similar to that of organic nitrogen.
Differences in ammonium, nitrate and organic nitrogen concentrations among the wet and dry seasons were analyzed with the Wilcoxon W-test. The results are presented in Table 2. Nitrate and organic nitrogen did not have a significant difference in any of the monitored sites. On the other side, ammonium had a significant difference between the dry and the wet season only in T3, N4 and N8 at a 0.05 significance level. The dry season presented higher concentrations in T3, while N4 and N8 had higher concentrations in the wet season.
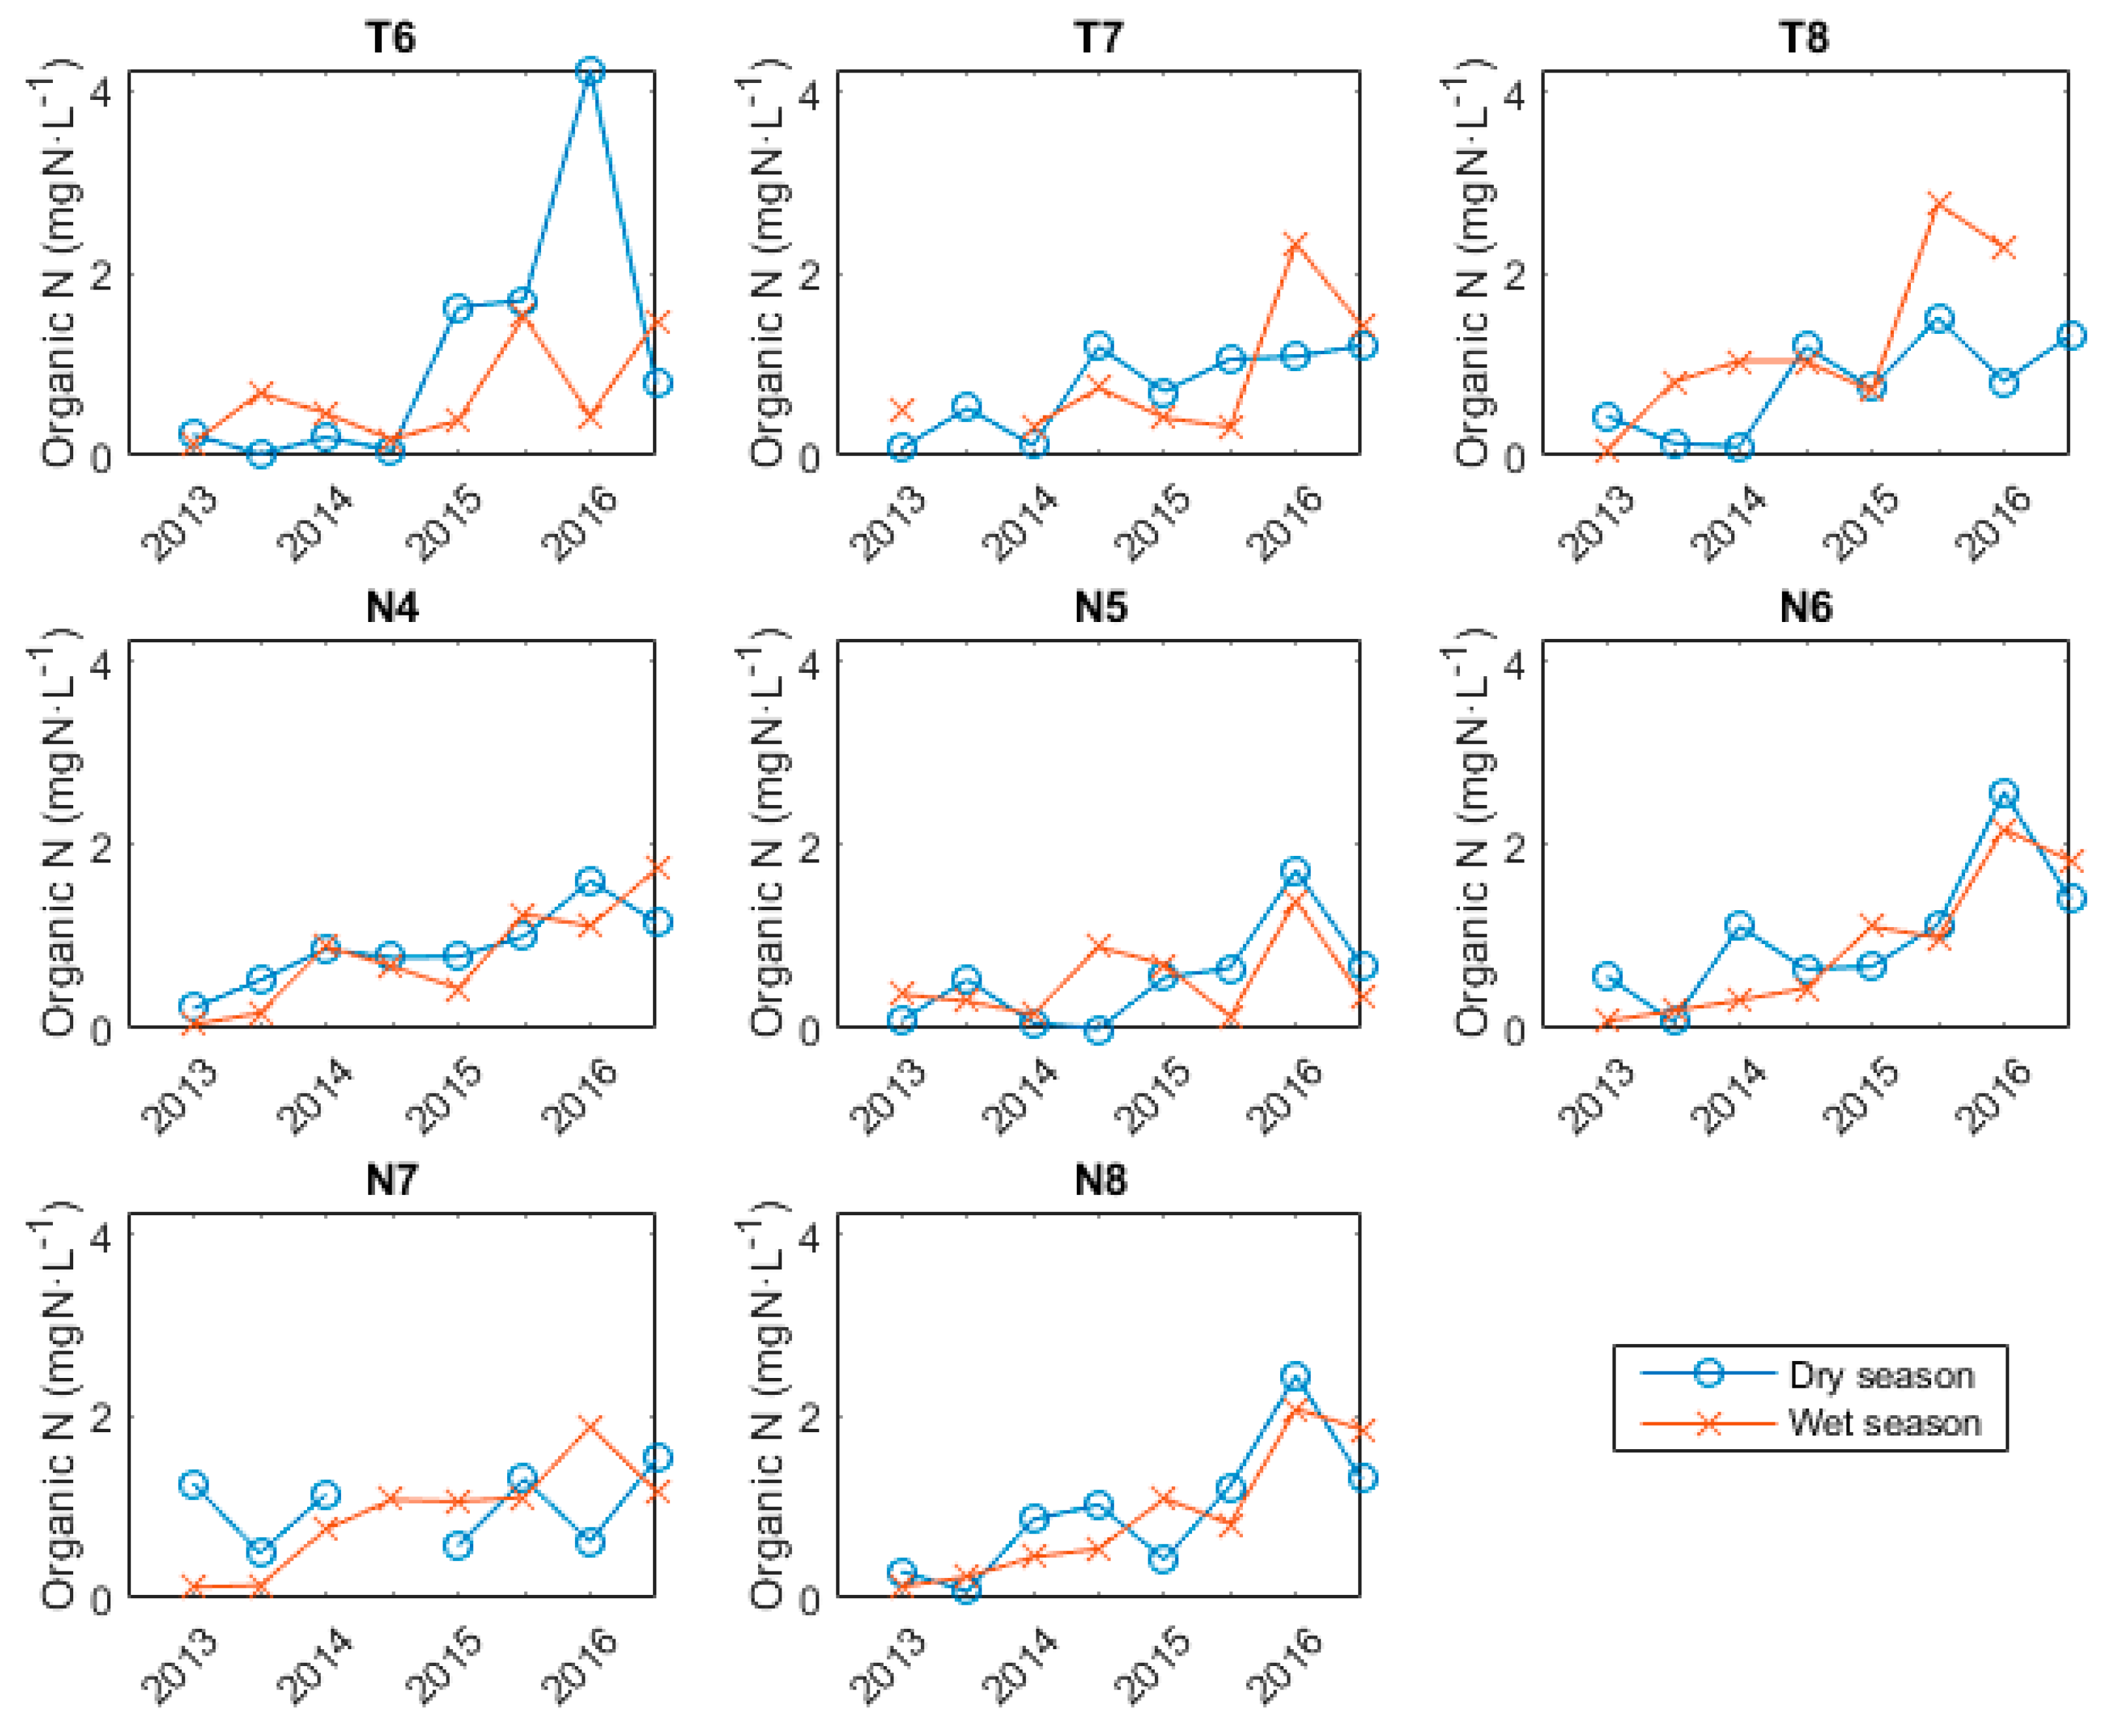
Additionally, the increases in organic nitrogen concentrations in coastal sites and the lower course of the Nautla and Tecolutla rivers were analyzed seasonally in Figure 6. T6 has an extreme value in the dry season which may be due to an unusual input of nitrogen, while N7 did not have an increasing trend in the dry season. Nonetheless, in most sites, an increasing trend appears in both the dry and the wet season.
4. Discussion
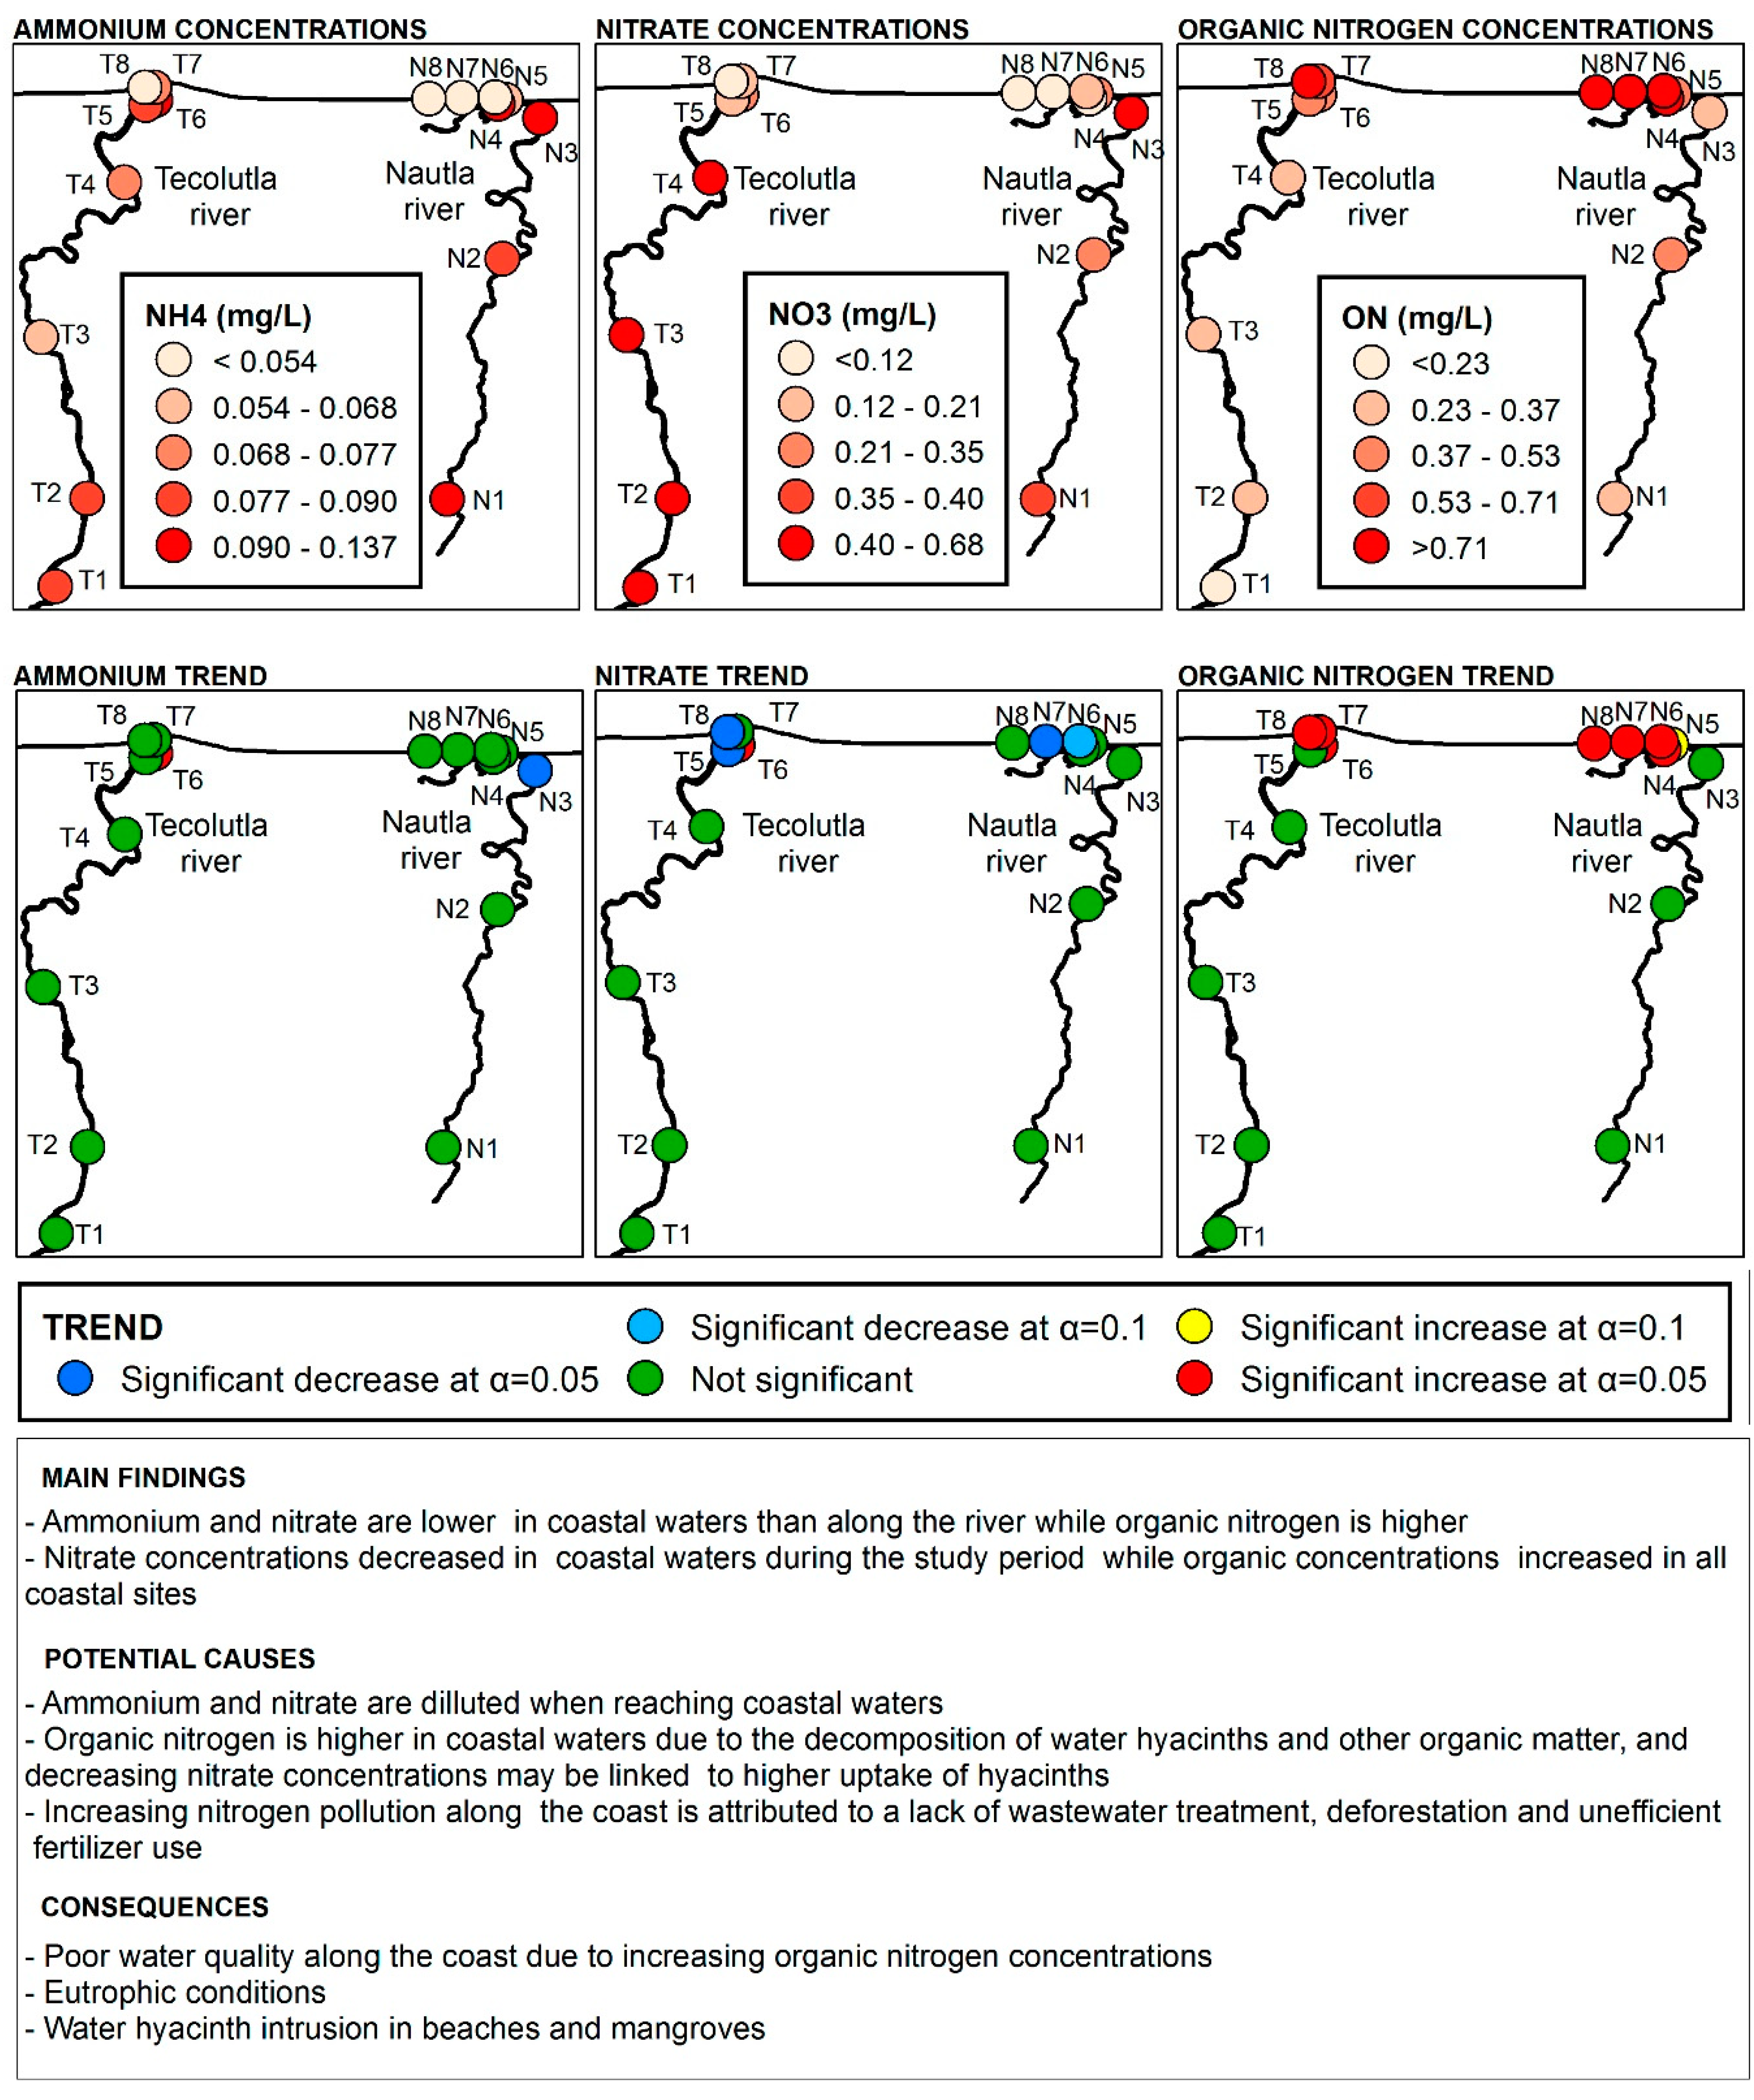
Our main findings together with the potential causes and consequences of nitrogen pollution are summarized in Figure 7.
The limit to consider poor conditions for inorganic nitrogen concentrations in Veracruz estuaries was established at 0.1 mg·L−1 by [10]. The study sites were all above the established limit which indicates poor water conditions in both the Tecolutla and Nautla estuaries. The spatial analysis showed that both ammonium and nitrate are diluted when reaching coastal areas, as indicated by the lower concentrations in coastal waters than in both rivers. However, organic nitrogen was higher in coastal sites than in riverine sites. On the other hand, the temporal analysis indicated a clear increase in organic nitrogen concentrations during the studied period in coastal waters and a decrease in nitrate concentrations. The lack of trends along both rivers indicates that the nitrogen source does not come from the upper course, but is rather localized in the river mouth and the surrounding coastal areas. Total nitrogen also showed an upward tendency which implies an external source of nitrogen to the system (Figure 5). Ammonium concentrations increased only in T6, which is located within a mangrove area. In this particular site, nitrate and organic nitrogen are also increasing. This may indicate the deterioration of mangroves, which are subject to pollution and deforestation. N3 is located within an urban area, which explains the high ammonium and nitrate concentrations which are derived from urban pollution. Nonetheless, a decreasing trend of ammonium concentrations in this site indicates that the pollution may have been reduced during the study period. The results of seasonal variations in nitrogen concentrations indicates that the pollution is similar throughout the year. In general, no differences were observed between the dry and the wet season (Table 2), which is in agreement with previous studies in Veracruz coastal systems [11]. The Nautla estuary has received a high amount of freshwater runoff all year round, and fluctuations in nutrient concentrations are rather linked to changes in organic matter decomposition [11].
The coastal resilience of Veracruz has been reduced by population growth and the increasing need for goods and services [9]. The urbanization of the coast and the lack of wastewater treatment [14] are driving the increase in N concentrations in river mouths and coastal waters (Figure 5). A study in the Nautla river indicated that the lower course of the river is most affected by water pollution, human settlements being the major source of N pollution [42]. Eutrophic conditions were detected in Casitas (Nautla estuary) [14] and eutrophication in Veracruz’s coastal waters have been pointed out by many studies [11,13,14]. Additionally, the deforestation and overexploitation of natural resources in Tecolutla are seen as a major problem causing ecosystems degradation [43]. In the whole coastal region known as Costa Esmeralda, beaches and mangroves have decreased while urban coverage has increased [33]. The fertilizers used in agriculture may also have a significant impact in N enrichment of coastal systems: An estimated 20−40% of N fertilizer is lost as ammonium in coastal systems through continental runoff [12]. Veracruz is one of the states in Mexico which uses more fertilizer per cultivated area [43].
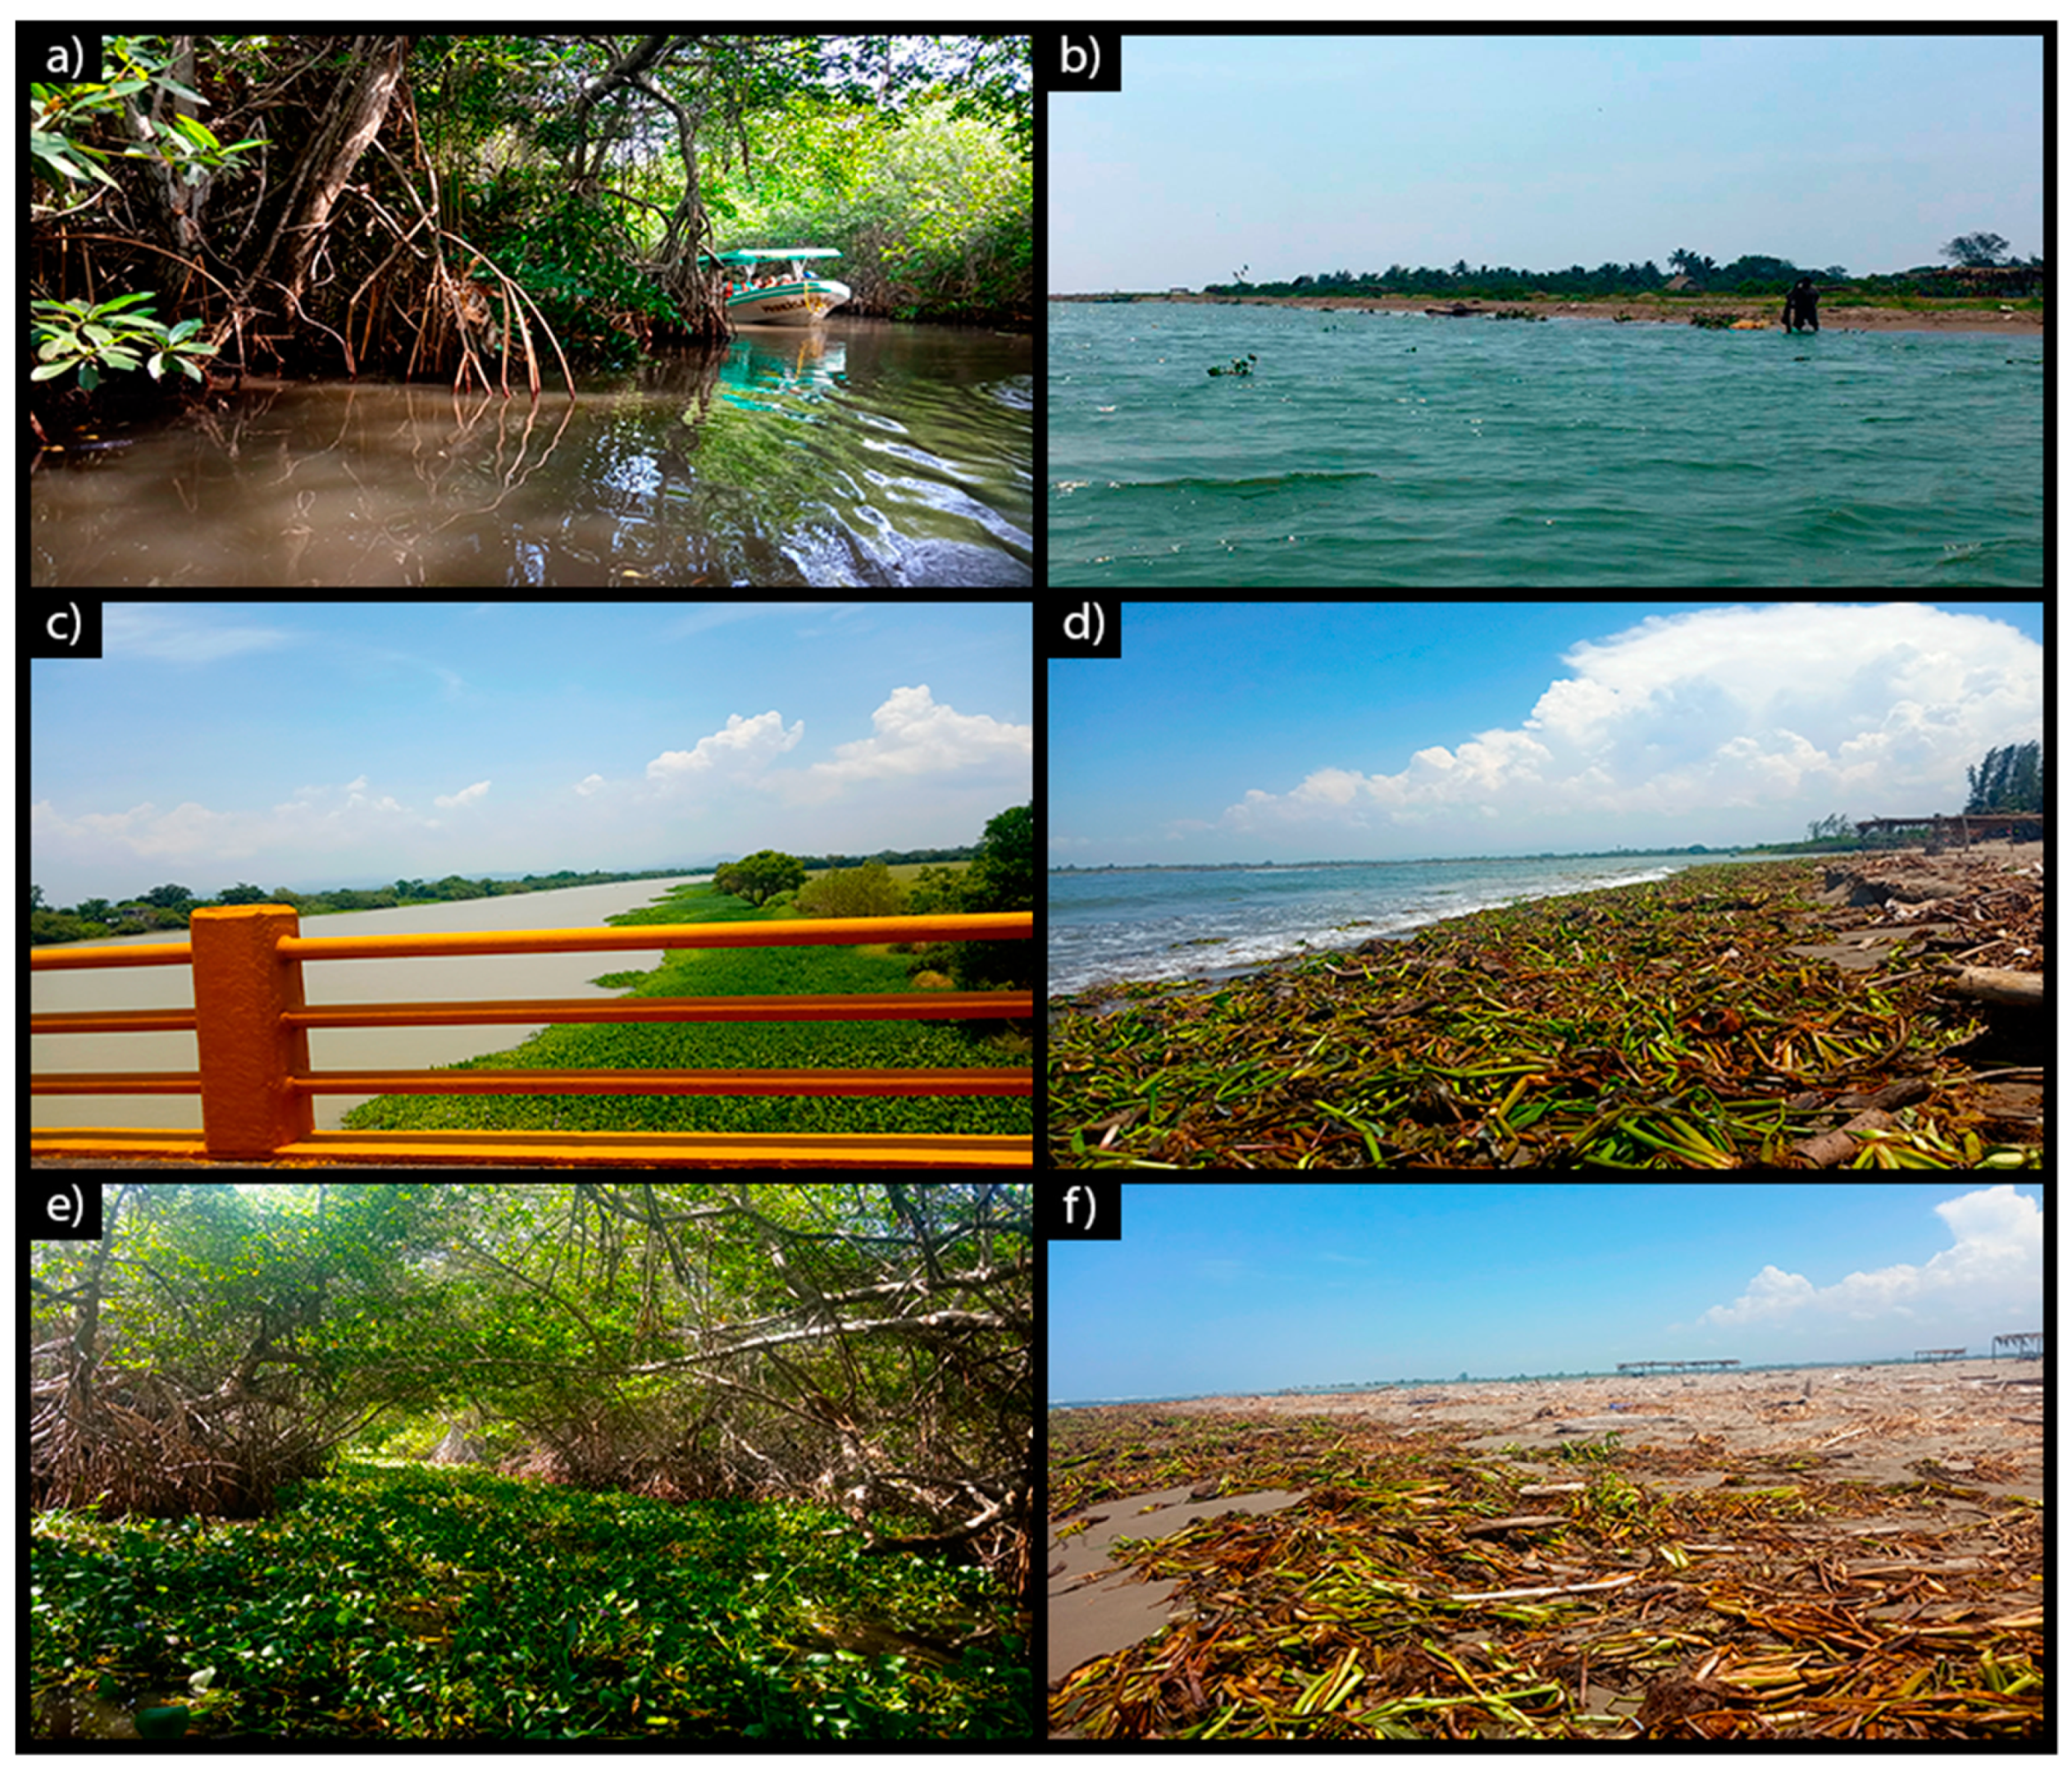
The water hyacinth invasion is a sign of the urgent need for nutrient pollution management in the area, which can be exacerbated by the increasing water temperatures due to climate change. Massive mats of water hyacinths were recently observed in the Nautla and Tecolutla rivers as can be observed in Figure 8. The extension of the invasion has reached a point in which ecological and socio-economic impacts may be critical. Water hyacinths absorb nutrients, leading to a reduction in ammonium or nitrate concentrations [28], as observed in the study area. Nitrogen pollution (as ammonium or as nitrate) can be absorbed by water hyacinths [32] which prevents the detection of increasing concentrations in the water column. Salinity limits the plant’s survival [28], which leads to the accumulation of dead hyacinths in the river mouths and the surrounding beaches (Figure 8d,f). As such, increasing organic nutrient concentrations in the water column (Figure 5) may be attributed to the decomposition of water hyacinths [28]. Increasing organic nitrogen trends were found in T6 to T8 and N4 to N8, which correspond with sites which have a salinity above 6 g·L−1. According to the latest studies, water hyacinths are only able to survive at salinities lower than 5 g·L−1 [44].
Mangroves have also been invaded by water hyacinths (Figure 8e), which may lead to the disruption of the ecosystem. The floating plants cover the whole water surface, which may prevent the oxygen from dissolving into the water body or disturb the primary production by blocking sunlight [28]. Oxygen levels can reach dangerous concentrations for fish under the matt of hyacinth, especially if a large amount of plants decompose at the same time, consuming most of the system’s oxygen [28]. The nutrient cycle is also affected by the absorption of inorganic forms and the release of organic compounds through plant decomposition. The detritus generated in mangrove areas is the basis of a food web which supports a large variety of species [23]. When the N cycle in mangroves is altered, the impact affects the whole ecosystem including zooplankton, macroinvertebrates or fish [45]. Water pollution and wetland degradation ultimately cause decreasing wildlife populations [43].
In addition to the damage caused to mangrove ecosystems, water hyacinths can also affect the economy of the coastal villages. On one hand, if the hyacinth invasion is large (as seen in the photos of Figure 8), fishermen could be affected by a reduced quantity of fish or by a shift in fish communities [28]. Mangroves provide shelter and food for fish and seafood, and fisherman develop most of their activity in the surrounding areas [36]. On the other hand, the study area is located within a touristic destination known as Costa Esmeralda, and sun tourism yields important economic revenues [34]. The tourism industry can be greatly affected by the incursion of decaying water hyacinths into the beaches. Many local businesses clean up the decomposing plants, but this practice becomes inefficient if the invasion is too large. Mangroves are also used as a tourist attraction and local people offer boat tours [36], which become unfeasible when these ecosystems are completely covered by the exotic floating plants.
Water hyacinths are very difficult to eradicate [28]. However, there are many management decisions that could be considered to reduce nitrogen pollution and improve water quality. Firstly, wastewater treatment plants should be implemented in the whole area, especially in touristic areas where peak tourism seasons can bring up to 79 tourists per hectare [34]. Moreover, the use of fertilizers has an urgent need for regulation in the Southern Gulf of Mexico. Nutrient management technics need to consider the right source, rate, time and place for fertilizer application [46]. The use of the optimum rate would result in less fertilizer applied for an equivalent yield, which implies reduced production costs. In fact, higher N fertilizer application rates do not imply a higher nutrient use efficiency [47]. Nutrient management plans provide a written guide to help farmers efficiently utilize fertilizers and simultaneously protect water resources [46]. Besides, the conversion of mangroves, forests and grasslands also may contribute significantly to nitrogen loading to coastal systems [48]. Mexico has exhibited one of the highest rates of deforestation in Latin America in recent years [15]. The potential practices for lowering N loadings involve both the implementation of conservation policies and a change in human behavior. Motivating behavioral change requires both available technology and understanding the incentives and disincentives [49].
Recovery projects need to take into consideration the engagement of the local population. Nautla inhabitants see mangroves as food supply, material for construction and tourist attraction. While they perceive wetland loss as a threat, they do not generally understand its causes [36]. The use of wetlands by local communities in Veracruz is also decreasing wildlife populations due to water pollution, hunting or deforestation [35]. In order to improve their socioeconomic conditions while preserving mangroves and beaches, new sustainable economic opportunities need to be generated. Medium density tourism in the area can be compatible with coastal ecosystems’ protection [34], but social involvement and environmental education are key to achieving a sustainable development [50]. At a large scale, mangrove conservation and restoration are a major priority in the Gulf of Mexico Large Marine Ecosystem (LME) [50]. Several international collaborations have already been started between the United States and Mexico [8]. Common strategies are required as problems originating in one country may impact the whole LME [8]. Joint efforts to preserve the Gulf of Mexico’s natural resources would allow a dramatic improvement in both ecosystems’ health and human development [51], as well as a great climate change mitigation effort through blue carbon storage [18,52], even with small mangroves [53].
5. Conclusions
The results indicate that organic nitrogen concentrations are increasing in coastal waters of Costa Esmeralda. The main potential cause is the decomposition of water hyacinths, an invasive aquatic species which grows disproportionately driven by nitrogen pollution from deforestation, untreated wastewater and fertilizers. Water hyacinths die when reaching saline coastal waters, leading to an incursion of touristic beaches and an increase in organic concentrations. Additionally, mangroves in the area are also affected by nitrogen pollution and by the invasion of water hyacinths. The nutrient enrichment of such important ecosystems may lead to the disruption of the whole food web, altering fish communities and wildlife, and causing many environmental and socio-economical problems. The results of this study could be extrapolated to other regions of the Southern Gulf of Mexico with similar characteristics. Recovery measures should include the establishment of sewage treatment plants, a management plan for the use of fertilizers and policies regulating the deforestation of coastal mangroves and other ecosystems. Additionally, the involvement of the local population is required for the achievement of a sustainable development which allows the maintenance of ecotourism activities while conserving natural resources.
Author Contributions
This paper was written by R.T.-B. as part of her PhD Thesis, co-directed by I.R. and R.R.-L. All co-authors participated in the conceptualization and reviewed the manuscript.
Funding
This research was funded by an Excellence Scholarship awarded by the Mexican Government through the Mexican Agency for International Development Cooperation (AMEXCID).
Acknowledgments
We thank the Mexican National Water Commission which provided field data.
Conflicts of Interest
The authors declare no conflicts of interest.
References
- Muñoz-Sevilla, N.P.; Le Bail, M. Latin American and Caribbean regional perspective on Ecosystem Based Management (EBM) of Large Marine Ecosystems goods and services. Environ. Dev. 2017, 22, 9–17. [Google Scholar] [CrossRef]
- Yañez-Arancibia, A.; Day, J.W.; Reyes, E. Understanding the Coastal Ecosystem-Based Management Approach in the Gulf of Mexico. J. Coast. Res. 2013, 63, 244–262. [Google Scholar] [CrossRef]
- Bianchi, T.S.; DiMarco, S.F.; Cowan, J.H., Jr.; Hetland, R.D.; Chapman, P.; Day, J.W.; Allison, M.A. The science of hypoxia in the Northern Gulf of Mexico: A review. Sci. Total Environ. 2010, 408, 1471–1484. [Google Scholar] [CrossRef] [PubMed]
- Laurent, A.; Fennel, K.; Cai, W.-J.; Huang, W.-J.; Barbero, L.; Wanninkhof, R. Eutrophication-induced acidification of coastal waters in the northern Gulf of Mexico: Insights into origin and processes from a coupled physical-biogeochemical model. Geophys. Res. Lett. 2017, 44, 946–956. [Google Scholar] [CrossRef]
- Bargu, S.; Baustian, M.M.; Rabalais, N.N.; Del Rio, R.; Von Korff, B.; Turner, R.E. Influence of the Mississippi River on Pseudo-nitzschia spp. Abundance and Toxicity in Louisiana Coastal Waters. Estuari. Coasts 2016, 39, 1345–1356. [Google Scholar] [CrossRef]
- He, S.; Xu, Y.J. Three Decadal Inputs of Nitrogen and Phosphorus from Four Major Coastal Rivers to the Summer Hypoxic Zone of the Northern Gulf of Mexico. Water Air Soil Pollut. 2015, 226, 311. [Google Scholar] [CrossRef]
- Alexander, R.B.; Smith, R.A.; Schwarz, G.E.; Boyer, E.W.; Nolan, J.V.; Brakebill, J.W. Differences in Phosphorus and Nitrogen Delivery to The Gulf of Mexico from the Mississippi River Basin. Environ. Sci. Technol. 2008, 42, 822–830. [Google Scholar] [CrossRef]
- Álvarez Torres, P.; Rabalais, N.N.; Piña Gutiérrez, J.M.; Padrón López, R.M. Research and community of practice of the Gulf of Mexico large marine ecosystem. Environ. Dev. 2017, 22, 166–174. [Google Scholar] [CrossRef]
- Martinez, M.L.; Silva, R.; Lithgow, D.; Mendoza, E.; Flores, P.; Martínez, R.; Cruz, C. Human Impact on Coastal Resilience along the Coast of Veracruz, Mexico. J. Coast. Res. 2017, 77, 143–153. [Google Scholar] [CrossRef] [Green Version]
- Macauley, J.M.; Harwell, L.C.; Alafita, H.V. The ecological condition of Veracruz, Mexico Estuaries. Environ. Monit. Assess. 2007, 133, 177–185. [Google Scholar] [CrossRef]
- Rivera-Guzmán, N.E.; Moreno-Casasola, P.; Ibarra-Obando, S.E.; Sosa, V.J.; Herrera-Silveira, J. Long term state of coastal lagoons in Veracruz, Mexico: Effects of land use changes in watersheds on seagrasses habitats. Ocean Coast. Manag. 2014, 87, 30–39. [Google Scholar] [CrossRef]
- Anguiano-Cuevas, J.R.; Olivos-Ortiz, A.; Cervantes, O.; Azuz-Adeath, I.; Ramírez-Álvarez, N.; Rivera-Rodríguez, M.C. Evaluation of trophic state in the Palo Verde estuary (Colima, México), action to regulating agricultural activities. Rev. Gest. Costeira Integr. 2015, 15, 507–522. [Google Scholar] [CrossRef]
- Okolodkov, Y.B.; Campos-Bautista, G.; Gárate-Lizárraga, I. Circadian rhythm of a red-tide dinoflagellate Peridinium quadridentatum in the port of Veracruz, Gulf of Mexico, its thecal morphology, nomenclature and geographical distribution. Mar. Pollut. Bull. 2016, 108, 289–296. [Google Scholar] [CrossRef] [PubMed]
- Ulloa, M.J.; Álvarez-Torres, P.; Horak-Romo, K.P.; Ortega-Izaguirre, R. Harmful algal blooms and eutrophication along the mexican coast of the Gulf of Mexico large marine ecosystem. Environ. Dev. 2017, 22, 120–128. [Google Scholar] [CrossRef]
- Mokondoko, P.; Manson, R.H.; Pérez-Maqueo, O. Assessing the service of water quality regulation by quantifying the effects of land use on water quality and public health in central Veracruz, Mexico. Ecosyst. Serv. 2016, 22, 161–173. [Google Scholar] [CrossRef]
- Giri, C.; Ochieng, E.; Tieszen, L.L.; Zhu, Z.; Singh, A.; Loveland, T.; Masek, J.; Duke, N. Status and distribution of mangrove forests of the world using earth observation satellite data. Glob. Ecol. Biogeogr. 2011, 20, 154–159. [Google Scholar] [CrossRef]
- Holguin, G.; Gonzalez-Zamorano, P.; de-Bashan, L.E.; Mendoza, R.; Amador, E.; Bashan, Y. Mangrove health in an arid environment encroached by urban development—A case study. Sci. Total Environ. 2006, 363, 260–274. [Google Scholar] [CrossRef]
- Thorhaug, A.L.; Poulos, H.M.; López-Portillo, J.; Barr, J.; Lara-Domínguez, A.L.; Ku, T.C.; Berlyn, G.P. Gulf of Mexico estuarine blue carbon stock, extent and flux: Mangroves, marshes, and seagrasses: A North American hotspot. Sci. Total Environ. 2019, 653, 1253–1261. [Google Scholar] [CrossRef]
- Kauffman, J.B.; Hernandez Trejo, H.; del Carmen Jesus Garcia, M.; Heider, C.; Contreras, W.M. Carbon stocks of mangroves and losses arising from their conversion to cattle pastures in the Pantanos de Centla, Mexico. Wetl. Ecol. Manag. 2016, 24, 203–216. [Google Scholar] [CrossRef]
- Feller, I.C.; Friess, D.A.; Krauss, K.W.; Lewis, R.R. The state of the world’s mangroves in the 21st century under climate change. Hydrobiologia 2017, 803, 1–12. [Google Scholar] [CrossRef]
- Duke, N.C.; Meynecke, J.-O.; Dittmann, S.; Ellison, A.M.; Anger, K.; Berger, U.; Cannicci, S.; Diele, K.; Ewel, K.C.; Field, C.D.; et al. A World Without Mangroves? Science 2007, 317, 41–42. [Google Scholar] [CrossRef] [PubMed] [Green Version]
- Torres, J.R.; Infante-Mata, D.; Sánchez, A.J.; Espinoza-Tenorio, A.; Barba, E. Degradación de hojarasca y aporte de nutrientes del manglar en la Laguna Mecoacán, Golfo de México. Rev. Biol. Trop. 2018, 66, 892–907. [Google Scholar] [CrossRef]
- Holguin, G.; Vazquez, P.; Bashan, Y. The role of sediment microorganisms in the productivity, conservation, and rehabilitation of mangrove ecosystems: An overview. Biol. Fertil. Soils 2001, 33, 265–278. [Google Scholar] [CrossRef]
- Reis, C.R.G.; Nardoto, G.B.; Oliveira, R.S. Global overview on nitrogen dynamics in mangroves and consequences of increasing nitrogen availability for these systems. Plant Soil 2017, 410, 1–19. [Google Scholar] [CrossRef]
- Geedicke, I.; Oldeland, J.; Leishman, M.R. Urban stormwater run-off promotes compression of saltmarshes by freshwater plants and mangrove forests. Sci. Total Environ. 2018, 637, 137–144. [Google Scholar] [CrossRef] [PubMed]
- Adame, M.F.; Najera, E.; Lovelock, C.E.; Brown, C.J. Avoided emissions and conservation of scrub mangroves: Potential for a Blue Carbon project in the Gulf of California, Mexico. Biol. Lett. 2018, 14. [Google Scholar] [CrossRef]
- López-Portillo, J.; Lara-Domínguez, A.L.; Vázquez, G.; Aké-Castillo, J.A. Water Quality and Mangrove-Derived Tannins in Four Coastal Lagoons from the Gulf of Mexico with Variable Hydrologic Dynamics. J. Coast. Res. 2017, 77, 28–38. [Google Scholar] [CrossRef]
- Villamagna, A.M.; Murphy, B.R. Ecological and socio-economic impacts of invasive water hyacinth (Eichhornia crassipes): A review. Freshw. Biol. 2010, 55, 282–298. [Google Scholar] [CrossRef]
- Oliveira-Junior, E.S.; Tang, Y.; van den Berg, S.J.P.; Cardoso, S.J.; Lamers, L.P.M.; Kosten, S. The impact of water hyacinth (Eichhornia crassipes) on greenhouse gas emission and nutrient mobilization depends on rooting and plant coverage. Aquat. Bot. 2018, 145, 1–9. [Google Scholar] [CrossRef]
- Ruiz Téllez, T.; Martín, E.; López, R.; Granado, G.L.; Albano Pérez, E.; Morán López, R.; Manuel, J.; Guzmán, S. The Water Hyacinth, Eichhornia crassipes: An invasive plant in the Guadiana River Basin (Spain). Aquat. Invasions 2008, 3, 42–53. [Google Scholar] [CrossRef]
- Tabla-Hernandez, J.; Rodriguez-Espinosa, P.F.; Mendoza-Pérez, J.A.; Sánchez-Ortíz, E.; Martinez-Tavera, E.; Hernandez-Ramirez, A.G.; Tabla-Hernandez, J.; Rodriguez-Espinosa, P.F.; Mendoza-Pérez, J.A.; Sánchez-Ortíz, E.; et al. Assessment of Potential Toxic Metals in a Ramsar Wetland, Central Mexico and Its Self-Depuration through Eichhornia crassipes. Water 2019, 11, 1248. [Google Scholar] [CrossRef]
- Fox, L.J.; Struik, P.C.; Appleton, B.L.; Rule, J.H. Nitrogen phytoremediation by water hyacinth (Eichhornia crassipes (Mart.) Solms). Water Air Soil Pollut. 2008, 194, 199–207. [Google Scholar] [CrossRef]
- Luisa Martínez, M.; Mendoza-González, G.; Silva-Casarín, R.; Mendoza-Baldwin, E. Land use changes and sea level rise may induce a “coastal squeeze” on the coasts of Veracruz, Mexico. Glob. Environ. Chang. 2014, 29, 180–188. [Google Scholar] [CrossRef]
- Pérez-Maqueo, O.; Martínez, M.L.; Cóscatl Nahuacatl, R. Is the protection of beach and dune vegetation compatible with tourism? Tour. Manag. 2017, 58, 175–183. [Google Scholar] [CrossRef]
- González-Marín, R.M.; Moreno-Casasola, P.; Castro-Luna, A.A.; Castillo, A. Regaining the traditional use of wildlife in wetlands on the coastal plain of Veracruz, Mexico: Ensuring food security in the face of global climate change. Reg. Environ. Chang. 2017, 17, 1343–1354. [Google Scholar] [CrossRef]
- Marín-Muñiz, J.L.; Hernández Alarcón, M.E.; Silva Rivera, E.; Moreno-Casasola, P. Perceptions about environmental services and loss of forested wetlands in Monte Gordo community, Veracruz. Madera y Bosques 2016, 22, 53–69. [Google Scholar]
- Ali, T.A.; Mortula, M.; Atabay, S.; Navadeh, E. A GIS-based spatiotemporal study of the variability of water quality in the Dubai creek, UAE. Water Qual. Res. J. Can. 2016, 51, 219–232. [Google Scholar] [CrossRef]
- Kitsiou, D.; Karydis, M. Coastal marine eutrophication assessment: A review on data analysis. Environ. Int. 2011, 37, 778–801. [Google Scholar] [CrossRef]
- Primpas, I.; Tsirtsis, G.; Karydis, M.; Kokkoris, G.D. Principal component analysis: Development of a multivariate index for assessing eutrophication according to the European water framework directive. Ecol. Indic. 2010, 10, 178–183. [Google Scholar] [CrossRef]
- Hajigholizadeh, M.; Melesse, A.M. Assortment and spatiotemporal analysis of surface water quality using cluster and discriminant analyses. Catena 2017, 151, 247–258. [Google Scholar] [CrossRef]
- Chaudhuri, S.; Dutta, D. Mann-Kendall trend of pollutants, temperature and humidity over an urban station of India with forecast verification using different ARIMA models. Environ. Monit. Assess. 2014, 186, 4719–4742. [Google Scholar] [CrossRef] [PubMed]
- Rodríguez-Romero, A.; Rico-Sánchez, A.; Mendoza-Martínez, E.; Gómez-Ruiz, A.; Sedeño-Díaz, J.; López-López, E.; Rodríguez-Romero, A.J.; Rico-Sánchez, A.E.; Mendoza-Martínez, E.; Gómez-Ruiz, A.; et al. Impact of Changes of Land Use on Water Quality, from Tropical Forest to Anthropogenic Occupation: A Multivariate Approach. Water 2018, 10, 1518. [Google Scholar] [CrossRef]
- SAGARPA. Uso de Fertilizantes Químicos en la Superficie Sembrada 2016. Available online: https://www.gob.mx/cms/uploads/attachment/file/220645/Boletines_superficie_sembrada.pdf (accessed on 9 March 2018).
- Guezo, N.C.; Fiogbe, E.D.; Azon, M.T.C.; Kouamelan, P.E.; Ouattara, A. Evaluation of sodium chloride (NaCl) effects on water hyacinth. EWASH TI J. 2017, 1, 34–40. [Google Scholar]
- Toft, J.D.; Simenstad, C.A.; Cordell, J.R.; Grimaldo, L.F. The effects of introduced water hyacinth on habitat structure, invertebrate assemblages, and fish diets. Estuaries 2003, 26, 746–758. [Google Scholar] [CrossRef]
- Ulrich-Schad, J.D.; García de Jalón, S.; Babin, N.; Pape, A.; Prokopy, L.S. Measuring and understanding agricultural producers’ adoption of nutrient best management practices. J. Soil Water Conserv. 2017, 72, 506–518. [Google Scholar] [CrossRef]
- Thorburn, P.J.; Biggs, J.S.; Palmer, J.; Meier, E.A.; Verburg, K.; Skocaj, D.M. Prioritizing Crop Management to Increase Nitrogen Use Efficiency in Australian Sugarcane Crops. Front. Plant Sci. 2017, 8, 1504. [Google Scholar] [CrossRef] [PubMed]
- Van Meter, K.J.; Basu, N.B.; Van Cappellen, P. Two centuries of nitrogen dynamics: Legacy sources and sinks in the Mississippi and Susquehanna River Basins. Glob. Biogeochem. Cycles 2017, 31, 2–23. [Google Scholar] [CrossRef] [Green Version]
- Robertson, G.P.; Vitousek, P.M. Nitrogen in Agriculture: Balancing the Cost of an Essential Resource. Annu. Rev. Environ. Resour. 2009, 34, 97–125. [Google Scholar] [CrossRef] [Green Version]
- Zaldívar-Jiménez, A.; Ladrón-de-Guevara-Porras, P.; Pérez-Ceballos, R.; Díaz-Mondragón, S.; Rosado-Solórzano, R. US-Mexico joint Gulf of Mexico large marine ecosystem based assessment and management: Experience in community involvement and mangrove wetland restoration in Términos lagoon, Mexico. Environ. Dev. 2017, 22, 206–213. [Google Scholar] [CrossRef]
- Hudson, A. Restoring and Protecting the world’s large marine ecosystems: An engine for job creation and sustainable economic development. Environ. Dev. 2017, 22, 150–155. [Google Scholar] [CrossRef]
- Vázquez-González, C.; Moreno-Casasola, P.; Hernández, M.E.; Campos, A.; Espejel, I.; Fermán-Almada, J.L. Mangrove and Freshwater Wetland Conservation through Carbon Offsets: A Cost-Benefit Analysis for Establishing Environmental Policies. Environ. Manag. 2017, 59, 274–290. [Google Scholar] [CrossRef] [PubMed]
- Adame, M.F.; Brown, C.J.; Bejarano, M.; Herrera-Silveira, J.A.; Ezcurra, P.; Kauffman, J.B.; Birdsey, R. The undervalued contribution of mangrove protection in Mexico to carbon emission targets. Conserv. Lett. 2018, 11, e12445. [Google Scholar] [CrossRef]
Figure 1.
Study area with monitoring sites.

Figure 2.
Boxplot of (a) ammonium, (b) nitrate, (c) organic nitrogen and (d) total nitrogen concentrations in all monitoring sites, with four annual measurements from 2013 to 2016. The outliers are not represented. Green is used for riverine sites, grey for estuaries and blue for coastal sites.
Figure 2.
Boxplot of (a) ammonium, (b) nitrate, (c) organic nitrogen and (d) total nitrogen concentrations in all monitoring sites, with four annual measurements from 2013 to 2016. The outliers are not represented. Green is used for riverine sites, grey for estuaries and blue for coastal sites.

Figure 3.
Cluster dendogram using the squared Euclidean distance and Ward’s method. Classification variables are ammonium, nitrate and organic nitrogen concentrations.
Figure 3.
Cluster dendogram using the squared Euclidean distance and Ward’s method. Classification variables are ammonium, nitrate and organic nitrogen concentrations.

Figure 4.
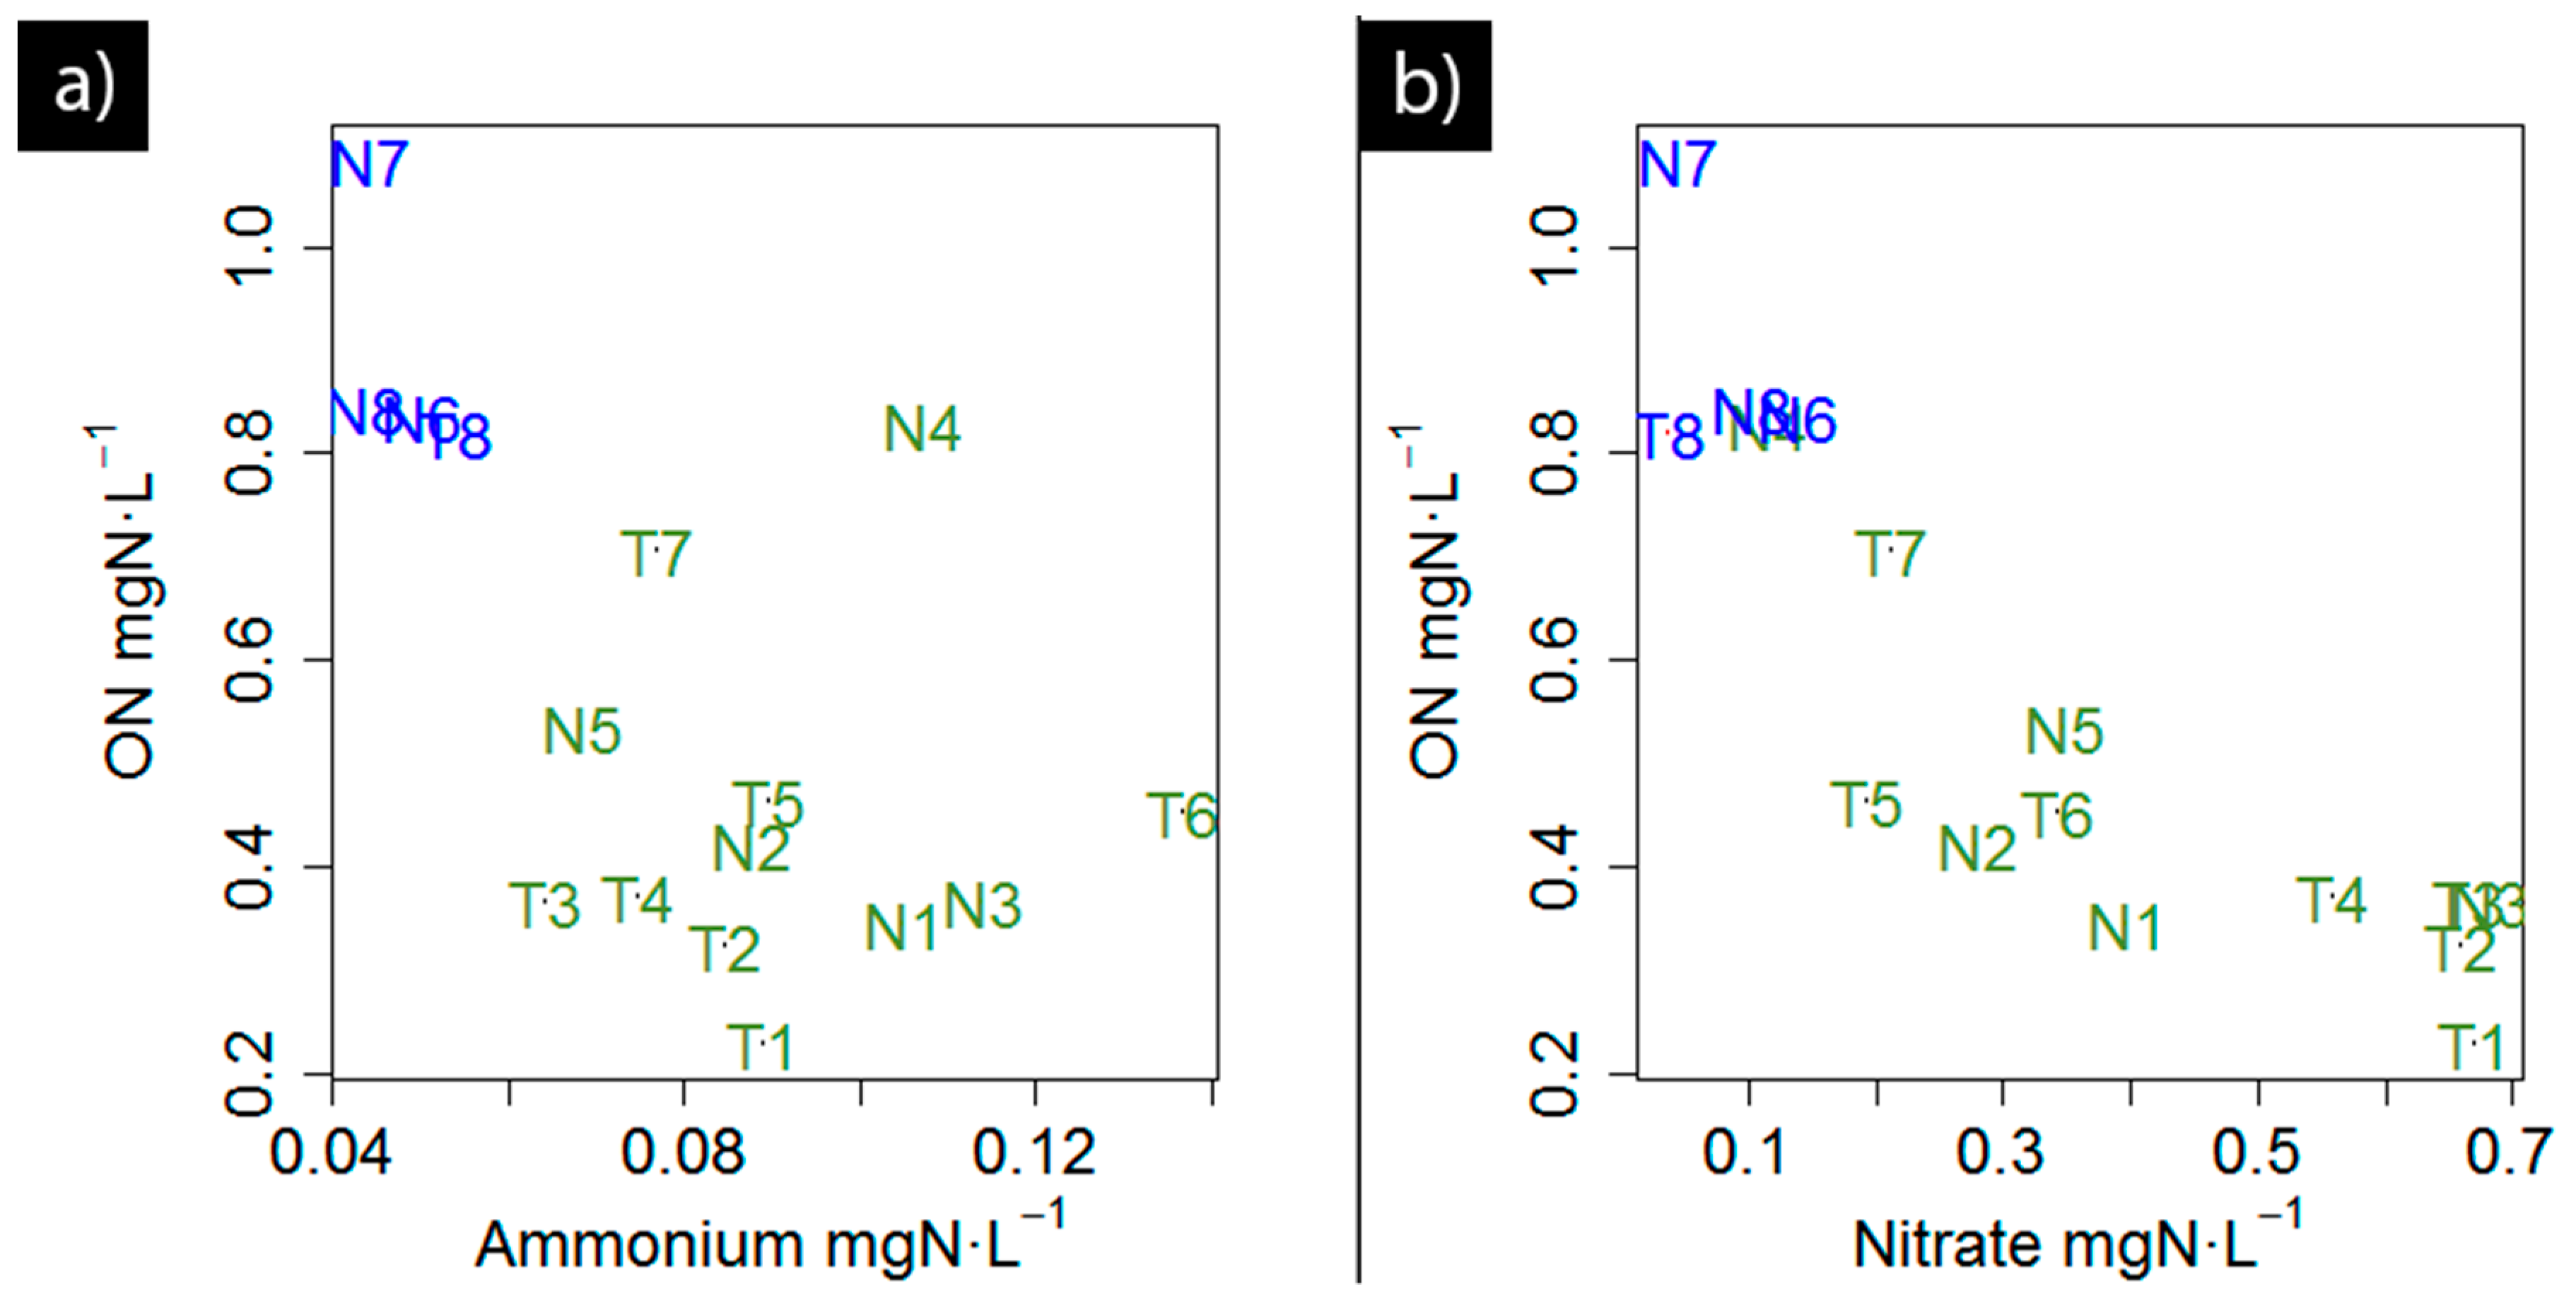
Scatterplot of (a) organic nitrogen versus ammonium and (b) organic nitrogen versus nitrate. The cluster “coast” is plotted in blue and the cluster “rivers” in green.
Figure 4.
Scatterplot of (a) organic nitrogen versus ammonium and (b) organic nitrogen versus nitrate. The cluster “coast” is plotted in blue and the cluster “rivers” in green.

Figure 5.
Kendall’s tau coefficient for (a) ammonium, (b) nitrate, (c) organic nitrogen and (d) total nitrogen in riverine (green), estuarine (grey) and coastal (blue) sites. Significant trend at a 90% and 95% confidence level are located above (increasing trend) or below (decreasing trend) the red lines.

Figure 6.
Organic nitrogen concentrations between 2013 and 2016 in the dry (blue) and wet (red) season; 2 values are shown per season.
Figure 6.
Organic nitrogen concentrations between 2013 and 2016 in the dry (blue) and wet (red) season; 2 values are shown per season.

Figure 7.
Summary of main findings and potential causes and consequences of nitrogen pollution. Nitrogen concentrations were calculated as the median of four annual measurements from 2013 to 2016. The temporal trends were evaluated with the Mann-Kendall test for the same study period.
Figure 7.
Summary of main findings and potential causes and consequences of nitrogen pollution. Nitrogen concentrations were calculated as the median of four annual measurements from 2013 to 2016. The temporal trends were evaluated with the Mann-Kendall test for the same study period.

Figure 8.
Photos of the Tecolutla and Nautla rivers at their lower course: (a) Mangrove in Tecolutla with touristic boat (14/07/2019) (b) Tecolutla river mouth with fisherman and some water hyacinths (14/07/2019) (c) Nautla bridge with water hyacinths in the riverside (14/07/2019) (d) Casitas estuary (Nautla) with dead hyacinths when they reach saline waters (16/07/2019 (e) Mangrove in Nautla river invaded by water hyacinth (16/07/2019) (f) Casitas beach at Nautla river mouth covered by decomposing water hyacinths (16/07/2019).


Table 1.
Codes and locations of the monitoring sites used in this study and provided by the local government. Mean salinity was calculated with 4 measurements during 2016 provided by the local government.
Table 1.
Codes and locations of the monitoring sites used in this study and provided by the local government. Mean salinity was calculated with 4 measurements during 2016 provided by the local government.
| Code | Name | Location | Distance to Sea | Mean Salinity (g·L−1) |
|---|---|---|---|---|
| T1 | Espinal bridge | Tecolutla river | 65 | 0.13 |
| T2 | Paso Valencia | Tecolutla river | 55 | 0.12 |
| T3 | Remolino bridge | Tecolutla river | 35 | 0.14 |
| T4 | Tecolutla bridge | Tecolutla river | 10 | 0.31 |
| T5 | Cruz de los esteros | Tecolutla river | 2 | 1.56 |
| T6 | Los Naranjos | Tecolutla river | 1 | 6.35 |
| T7 | Tecolutla estuary | Tecolutla esturay | 0.2 | 15.97 |
| T8 | Tecolutla beach | Coast | 0 | 36.61 |
| N1 | Martinez de la Torre | Nautla river | 55 | 0.12 |
| N2 | El Pital | Nautla river | 30 | 0.12 |
| N3 | Nautla bridge | Nautla river | 4 | 0.30 |
| N4 | Casitas bridge | Nautla river | 1 | 6.16 |
| N5 | Nautla estuary | Nautla estuary | 0.5 | 8.81 |
| N6 | Casitas beach | Coast | 0 | 31.29 |
| N7 | El Palmar | Coast | 0 | 37.01 |
| N8 | Monte Gordo | Coast | 0 | 37.31 |
Table 2.
Wilcoxon W test results testing the differences in ammonium (NH4+), nitrate (NO3−) and organic nitrogen (ON) between the dry and the wet season. p-values are shown only for significant differences (p-value < 0.05) and reported as n.s. (not significant) when p-value > 0.05.
Table 2.
Wilcoxon W test results testing the differences in ammonium (NH4+), nitrate (NO3−) and organic nitrogen (ON) between the dry and the wet season. p-values are shown only for significant differences (p-value < 0.05) and reported as n.s. (not significant) when p-value > 0.05.
| Site | NH4+ | NO3− | ON | |||
|---|---|---|---|---|---|---|
| W | p-Value | W | p-Value | W | p-Value | |
| T1 | 33 | n.s. | 40 | n.s. | 35 | n.s. |
| T2 | 35 | n.s. | 28 | n.s. | 37 | n.s. |
| T3 | 55 | 0.01 | 22 | n.s. | 36 | n.s. |
| T4 | 25 | n.s. | 17 | n.s. | 33 | n.s. |
| T5 | 26 | n.s. | 26 | n.s. | 32.5 | n.s. |
| T6 | 16 | n.s. | 28 | n.s. | 34 | n.s. |
| T7 | 33 | n.s. | 21 | n.s. | 36 | n.s. |
| T8 | 21 | n.s. | 42 | n.s. | 31 | n.s. |
| N1 | 40 | n.s. | 23.5 | n.s. | 39.5 | n.s. |
| N2 | 34 | n.s. | 24 | n.s. | 29 | n.s. |
| N3 | 43.5 | n.s. | 22 | n.s. | 45 | n.s. |
| N4 | 9 | 0.01 | 40 | n.s. | 35 | n.s. |
| N5 | 27 | n.s. | 35 | n.s. | 28 | n.s. |
| N6 | 17 | n.s. | 19 | n.s. | 38 | n.s. |
| N7 | 14 | n.s. | 32 | n.s. | 33 | n.s. |
| N8 | 11 | 0.03 | 16 | n.s. | 34 | n.s. |
© 2019 by the authors. Licensee MDPI, Basel, Switzerland. This article is an open access article distributed under the terms and conditions of the Creative Commons Attribution (CC BY) license (http://creativecommons.org/licenses/by/4.0/).
Share and Cite
MDPI and ACS Style
Temino-Boes, R.; Romero-López, R.; Romero, I. A Spatiotemporal Analysis of Nitrogen Pollution in a Coastal Region with Mangroves of the Southern Gulf of Mexico. Water 2019, 11, 2143. https://doi.org/10.3390/w11102143
AMA Style
Temino-Boes R, Romero-López R, Romero I. A Spatiotemporal Analysis of Nitrogen Pollution in a Coastal Region with Mangroves of the Southern Gulf of Mexico. Water. 2019; 11(10):2143. https://doi.org/10.3390/w11102143
Chicago/Turabian StyleTemino-Boes, Regina, Rabindranarth Romero-López, and Inmaculada Romero. 2019. "A Spatiotemporal Analysis of Nitrogen Pollution in a Coastal Region with Mangroves of the Southern Gulf of Mexico" Water 11, no. 10: 2143. https://doi.org/10.3390/w11102143
Note that from the first issue of 2016, this journal uses article numbers instead of page numbers. See further details here.