Article

Silica Storage, Fluxes, and Nutrient Stoichiometry in Different Benthic Primary Producer Communities in the Littoral Zone of a Deep Subalpine Lake (Lake Iseo, Italy)

1
Department of Chemistry, Life Sciences and Environmental Sustainability, University of Parma, Parco Area delle Scienze 11/A, 43124 Parma, Italy
2
Helmholtz Center for Environmental Research—UFZ, Theodor-Lieser-Straße 4, 06120 Halle, Germany
*
Author to whom correspondence should be addressed.
Water 2019, 11(10), 2140; https://doi.org/10.3390/w11102140
Submission received: 22 August 2019 / Revised: 24 September 2019 / Accepted: 10 October 2019 / Published: 15 October 2019
(This article belongs to the Special Issue The Role of Macrobiota in Aquatic Nutrient Cycling)

Abstract

:
Benthic vegetation at the land-water interface is recognized as a filter for silica fluxes, which represents an important but under-investigated subject. This paper aims to analyze stocks and fluxes of biogenic (BSi) and dissolved (DSi) silica in relation to nitrogen (N) and phosphorus (P) in the littoral zone of a deep lake. Specifically, we evaluated how different primary producers can influence BSi retention and DSi release. The study was performed from April to October in 2017, in three different benthic communities: submerged aquatic vegetation (SAV) and microphytobenthos (MPB), both occurring in soft bottom sediments, and epilithic macro- and microalgae (EA) on rocky substrates. The main result was that SAV and MPB were a DSi source and a N and P sink with the DSi efflux from SAV nearly three times as much as in MPB patches. These findings corroborate the hypothesis that SAV mediates the DSi transport from pore water to the water column. Conversely, EA communities were a DSi sink and a N and P source. Overall, these results highlight the fact that the littoral zone of lakes plays a key role in regulating aquatic Si cycling, which is likely to depend on the health status of SAV communities.

1. Introduction

Silicon (Si) is an essential element for the growth of many aquatic primary producers like siliceous algae, especially diatoms, a key component of phytoplankton and phytobenthos communities [1,2]. Despite its importance, Si biogeochemistry in aquatic environments is still poorly understood compared to N and P, limiting our capacity to explain the mechanisms regulating aquatic food web structure and functioning [3,4].
The global Si cycle consists of continental and oceanic sub-cycles, which are connected through the hydrographic network [4]. Within this network, the dissolved silica (DSi) delivered to coastal seas is thought to depend mainly on biologically mediated processes through the synthesis and decomposition of biogenic silica (BSi), on interactions with the geosphere and, finally, on hydrology and land use [3,5]. In this context, fluvial ecosystems connecting the continental and marine domains are not simply water conveyors, but rather comprise of a number of subsystems acting as filters and reactors, which strongly regulate Si transport [6]. These subsystems include lentic waters, especially wetlands and lakes, which may have a major effect on Si fluxes [4,7,8,9]. For example, a relevant reduction of land to sea transport of Si has been measured in dammed rivers, such as the Danube, where up to two-thirds of DSi loading was retained by the Iron-Gate dam [10,11].
Lake functioning depends on size and morphology, with a first distinction being between shallow and deep lakes. In shallow lakes, there is a prevalence of either microphytobenthos (MPB) or submerged aquatic vegetation (SAV), which control both primary productivity and biogeochemical cycles [12]. Large, deep lakes are dominated by phytoplankton communities, in which siliceous algae play a major role in primary productivity and control of nutrient cycling [13]. However, with regard to deep lakes, a distinction should be made between holomictic lakes and oligomictic and meromictic lakes. In the last two categories, water stratification can persist over decades, thus increasing Si retention in the deepest water mass, as was found for other elements [14,15]. The persistent stratification of the water mass can also impede “benthic-pelagic coupling”, i.e., avoidance of recycling of the DSi regenerated from sedimentary BSi and amorphous silica to the photic layer.
Studies on Si retention by lakes have been mainly concerned with mass balances, taking into account input-output differences over a consistent time scale [4]. This approach assumes that lakes are mixed reactors dominated by open waters, but neglects the role of other sub-system components, such as the littoral zone. This land-water interface is shallow, allowing light to penetrate to the bottom so that benthic primary producers develop [16,17,18]. Here, helophytes and macrophytes synthesize and accumulate BSi, thus controlling both stocks and fluxes of DSi [3,8]. Helophytes and macrophytes take up DSi from pore-water and transform it into BSi, which concentrates in plant tissue for up to 3% of the total dry weight [19]. Once fixed in plant biomass, BSi is gradually released back into the abiotic environment as DSi through grazing and biomass decay [5,8]. Fluxes and export of DSi can be enhanced by fungal and microbial activity, which stimulates BSi mineralisation and DSi release from detritus [20]. In the littoral zone, such Si filtering by primary producers is thought to affect the rate of DSi exchange across the water-sediment interface, with DSi being transported towards open water [3,21]. DSi retention also depends on seasonal factors, especially the seasonality of growth and decay of littoral primary producers [8,22]. In bare sediments, DSi fluxes are controlled by benthic diatoms and bioturbation driven by benthic fauna [23,24]. DSi is assimilated to BSi by diatoms in light conditions, with the benthic system acting as a net DSi trap. In dark conditions, on the other hand, photosynthesis does not occur; the diatom filter is inactive, so the DSi is released back to the water column from sediments [23]. Exchanges from sediment to the water column can be further accelerated by benthic fauna bioturbation [24].
The littoral zone, either with MPB or SAV and helophytes, is a biogeochemical hotspot, where a greater amount of primary productivity and nutrient recycling takes place, together with faster rates of mineralization, when compared to the contiguous pelagic and terrestrial areas [25,26,27]. The littoral zone, however, is heterogeneous and patchy. In fact, there is a mosaic of diverse conditions underlying multiple and differentiated ecological functions on account of the substrate structure, the physical and chemical conditions in the sediment and water column, disturbance regimes, and inputs of organic matter and nutrients, which change radically over time and space [17]. Whereas bare and soft sediments are largely colonized by benthic microalgae, macroalgal aggregates and phanerogam meadows, rocky shores, and hard-substrates host epilithic algae, depending on light penetration and nutrient availability. The magnitude of processes driving Si dynamics is thought, therefore, to vary in different microhabitats colonized by different primary producers.
As far as we know, there are very few lake studies regarding the direct measurements of BSi accumulation and DSi fluxes across the water-sediment interface, all focusing on bare sediments colonized by MPB [28,29], while further research on SAV and epilithic macro- and microalgae (EA) needs to be carried out. In littoral areas of lakes, a major focus on the magnitude of DSi exchange is not only necessary given its general importance in ecosystem functioning, but also because of its influence on N:P:Si stoichiometry, as Si shortage can shift phytoplankton composition towards communities dominated by noxious or harmful algae [30]. Unlike other phytoplankton taxa, diatoms and a few other microalgae, such as Crysophyceans, require proportionally more Si relative to N and P, with Si becoming a frequent factor in growth limitation [1,2]. Only a few studies have examined the stoichiometry of nutrient fluxes in salt and freshwater marshes [31,32], but no research has analysed DSi fluxes and BSi accumulation in the littoral zone of lakes in relation to N and P.
This study focuses on BSi and DSi storage and fluxes in the littoral zone of Lake Iseo, a deep sub-alpine lake located in the north of Italy [13]. The purpose of this research is twofold. First, we aim to analyze stocks, transformations, and fluxes of BSi and DSi during the growth phase of benthic vegetation in different habitats of the littoral zone colonized by diverse primary producer communities. Our second aim is to analyze and compare the stoichiometry of stocks and fluxes in order to understand how different benthic vegetation communities influence N:P:Si ratios. We postulate that the littoral zone of lakes is a natural filter, where DSi is assimilated as BSi by macroalgae and microphytobenthos from the water column, and by rhizophytes from pore-water. More specifically, our hypothesis is that such BSi and DSi transformations can significantly modify the relationships between the reactive forms of Si, N, and P, thus affecting their stoichiometry and, ultimately, the responses of primary producer communities. Consequently, the main objectives of this study were: (a) to estimate the extent of BSi accumulation in the biomass of the most representative primary producers at the local level; (b) to compare BSi accumulation in sediments colonized by different benthic vegetation; (c) to quantify DSi fluxes across the water sediment interface in relation to the dominant primary producers; and (d) to evaluate how heterogeneity affects Si dynamics and stoichiometry relative to reactive N and P.

2. Materials and Methods
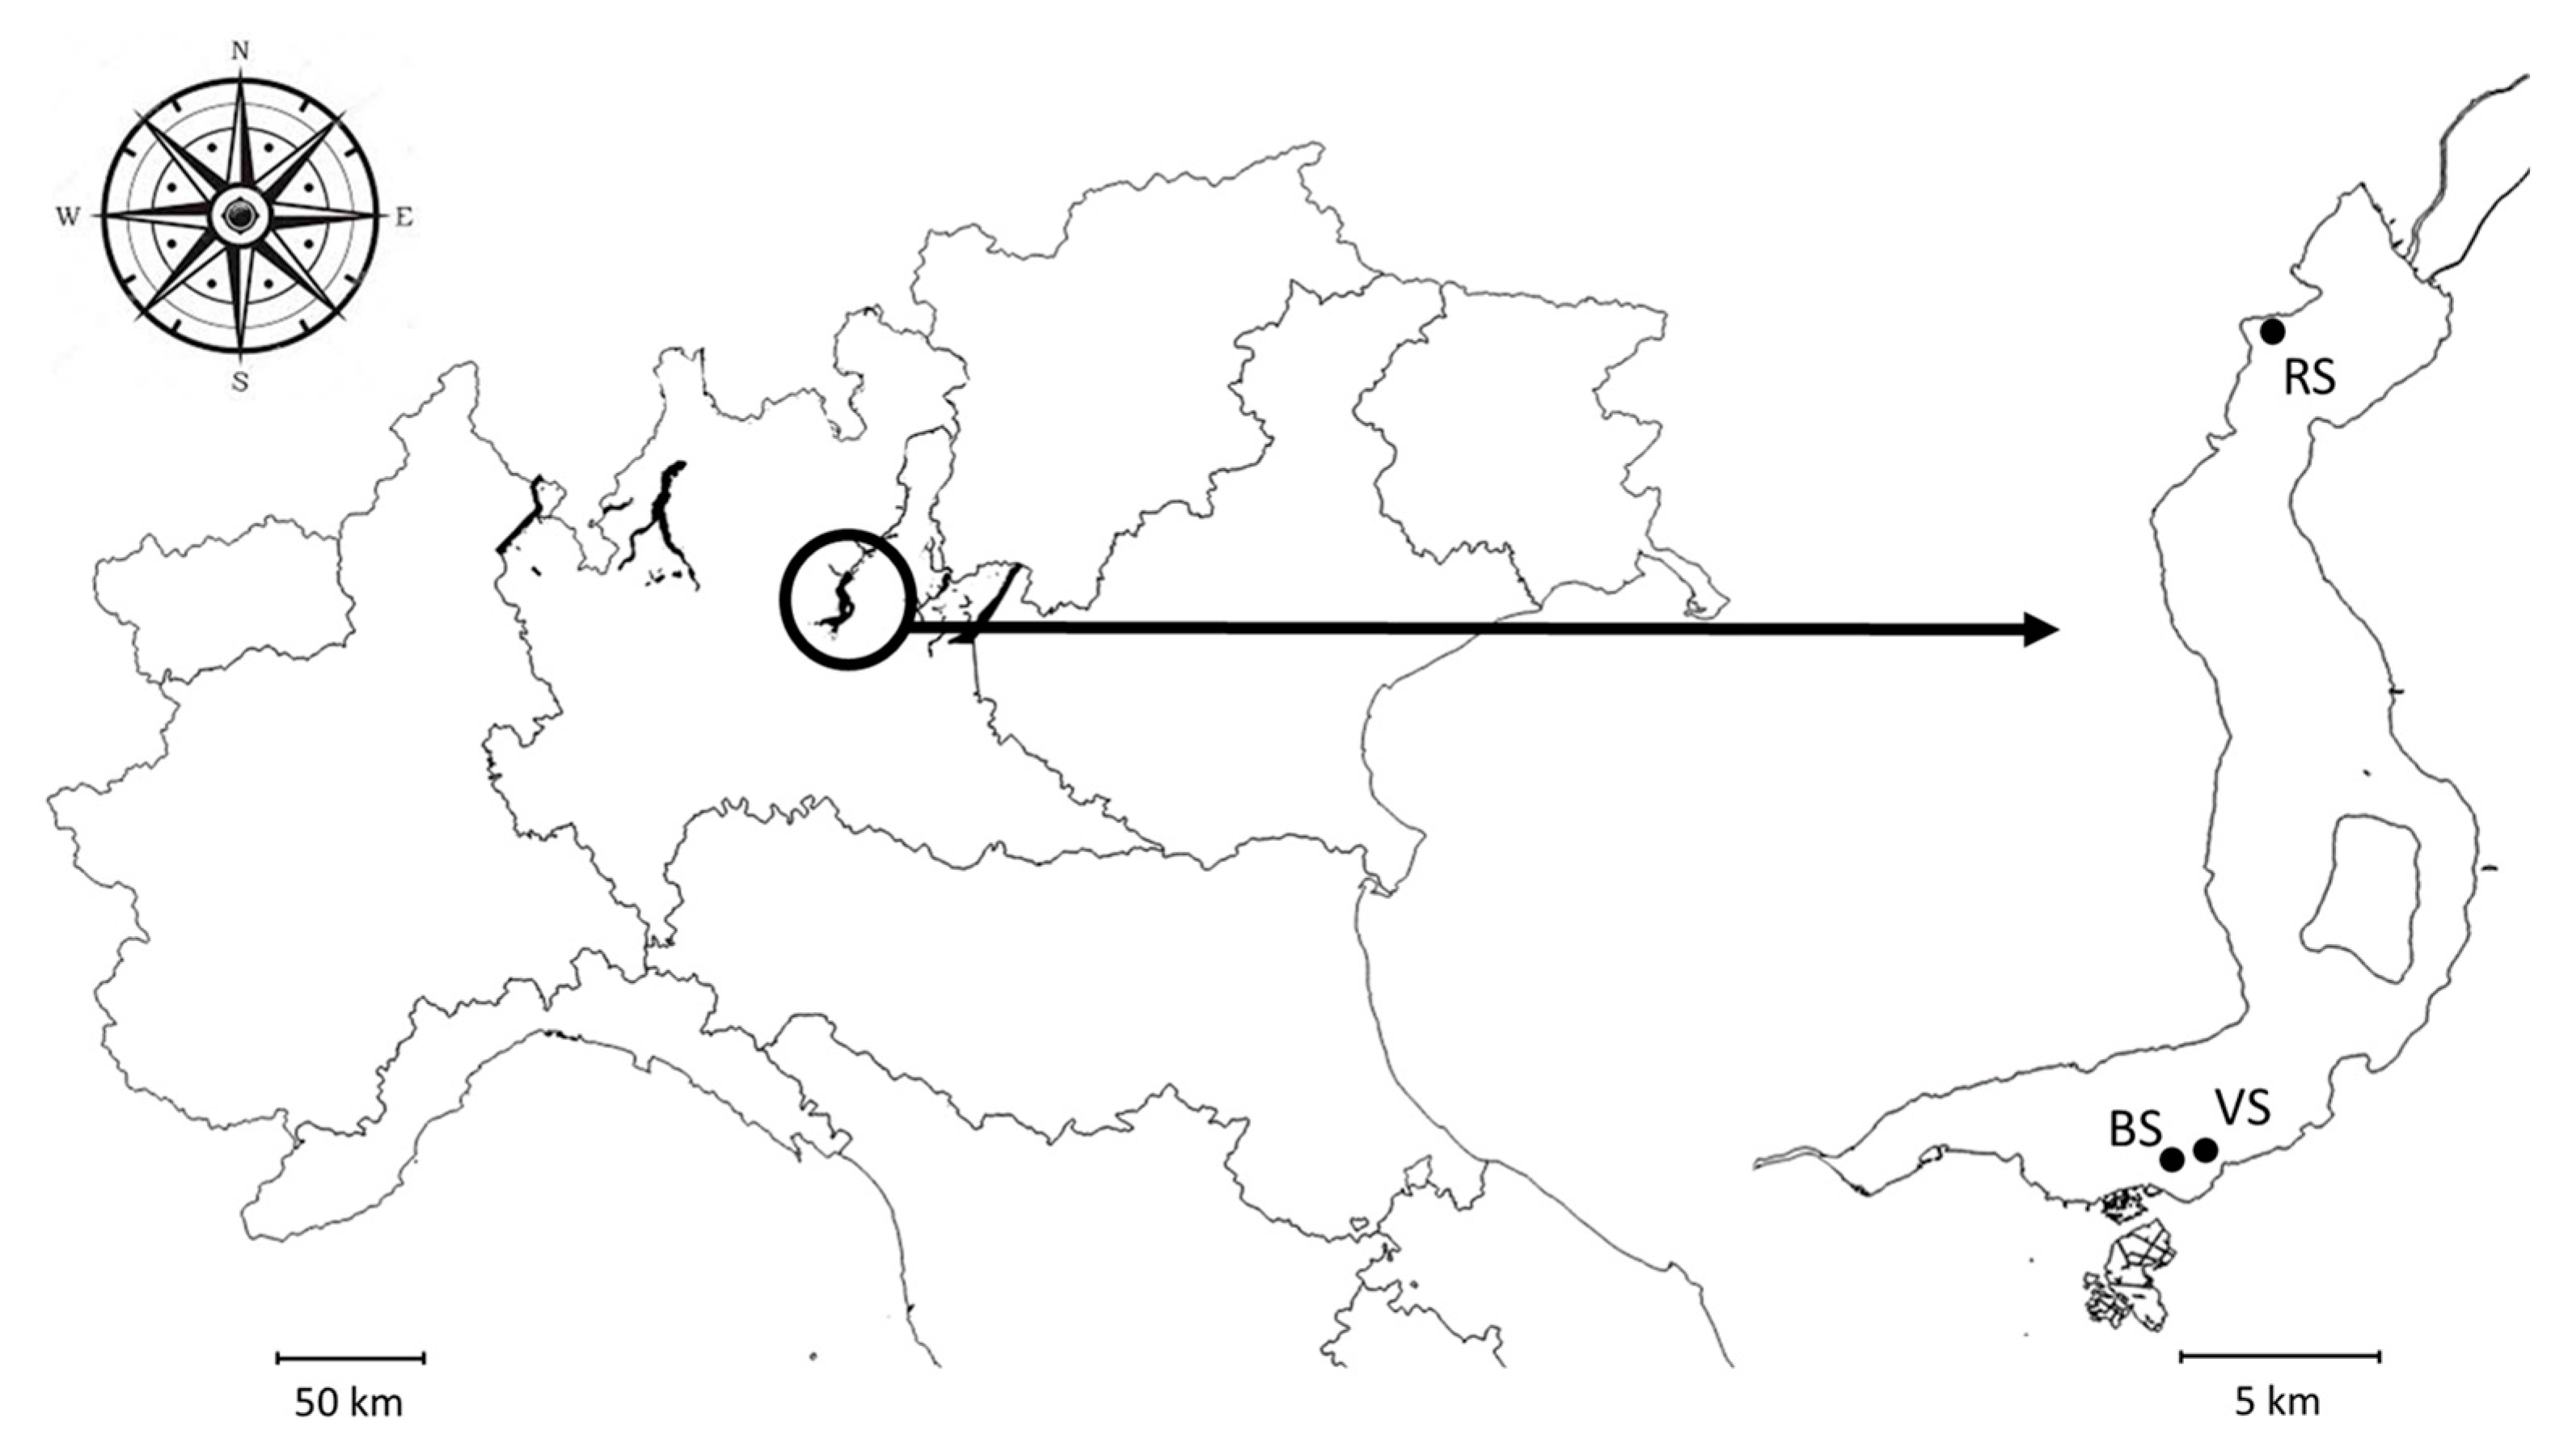
2.1. Study Area

The study was carried out in Lake Iseo, the fourth largest lake in the Alps for its surface and volume (60.9 km2, and 7.6 km3, respectively; Figure 1 and Table 1). The lake’s main inlets are the River Oglio and the Industrial Canal, which contribute ~49% and ~51% of the water inflow (4.1 × 10⁶ m3 d−1), respectively.
Agricultural use accounts for 22% of the watershed surface, mainly as pastures or rough grazing (21.4%). Population density is 109 ind km−2, while livestock units (1 LSU = 1 adult dairy cow) account for 17 LSU km−2. Cattle (18,241 LSU), poultry (8145 LSU) and sheep (2307 LSU) are the main farmed livestock [33]. Lake Iseo is meromictic; its trophic status is meso-eutrophic due to meromixis [34] and the influence of anthropic activities in the watershed. The water mass is currently completely anoxic, from 100 m depth to the bottom (258 m).
The west shore is steep and rocky, while the eastern side is steep in the northern part but becomes progressively flat towards the south. The surface area of the littoral zone is ~5 km2, i.e., 8.2% of the total lake surface area. The coastal morphology is a driver for different benthic primary producer communities. Specifically, in the north-west part of the lake, the benthic substrate is composed of rocks and pebbles (>90%), which are colonized by epilithic macro- and microalgae (site RS, Figure 1). The south-east flat coastal area is characterized by a soft bottom substrate, mostly covered by meadows of Vallisneria spiralis L. and, to a lesser extent, Najas marina L. (site VS, Figure 1). Here, large patches of bare and soft sediment are also colonized by microphytobenthos (site BS, Figure 1).

2.2. Monitoring Design and Sampling

We compared three sites (RS, VS and BS), each with a different community of benthic primary producers: epilithic diatoms and filamentous macroalgae on hard substrate (EA) at the RS site; submerged phanerogams (SAV; V. spiralis and N. marina) at the VS site; and microphytobenthos (MPB) at the BS site.
The following sampling period was chosen in order to capture the seasonal growth phase of each primary producer assemblage: 12 April, 27 June, and 28 August 2017 at RS; 30 May, 31 July, and 3 October 2017 at VS and BS. Sampling dates are collectively reported in tables, figures and text as Early (late spring–early summer), Mid (midsummer) and Late (late summer–early fall) phases of the life cycle of the main components of the benthic primary producer community.
At the RS site, six stones colonized by periphyton were collected on each sampling date. After harvesting, the stones were immediately transferred into six distinct small Plexiglas microcosms (inner diameter 10 cm, height 20 cm) with water collected from the site. At the VS site, six sediment cores were sampled with Plexiglas tubes (inner diameter 10 cm, height 40 cm) on each date, while at the BS site, six cores (inner diameter 8 cm, height 30 cm) were also collected on the same dates. Simultaneously, at both VS and BS, five additional sediment cores (inner diameter 4 cm, height 20 cm) were sampled to establish the chemical and physical characteristics of the surface sediment. During sampling, extra care was taken to not disturb the superficial sediment. All samples between −1 and −4 m were manually collected by scuba diving. To ensure the maintenance and incubation of stones and cores in the laboratory, approximately 100 L of water were taken from each site.
Once collected, both cores and microcosms were placed in thermal containers, submerged in water from the sampling site, and transported within 4 h to the laboratory at the University of Parma. Here, sediment cores and stones were housed in a thermostatic room, placed inside aerated incubation tanks (75 L) containing lake water from each site, and maintained at the same ambient temperature (±1 °C).
Water temperature and conductivity were determined in situ with a multiparametric probe (YSI 556). Three water samples were also collected from each site at ~50 cm above the sediment surface. Water samples were filtered (Whatman GF/F) and analyzed within 24 h to measure dissolved silica (DSi), ammonium (N-NH4+), nitrate and nitrite (N-NOx), and reactive phosphorus (SRP). Finally, total inorganic nitrogen (DIN) was calculated as DIN = N-NH4+ + N-NOx.

2.3. Benthic Fluxes and Benthic Metabolism

In the laboratory, cores and microcosms were immediately left to stabilize ≈12 h in lake water with the upper end open and completely submerged. During maintenance and incubation, the water inside the cores and microcosms was gently stirred, avoiding sediment resuspension, using magnetic stirrers suspended within each core, and driven with a magnet rotated at 40 rpm by an external motor. The day after sampling, the cores were first incubated in darkness and, subsequently, in light to measure water sediment fluxes. To begin the incubation, the water level in the tank was lowered below the core edges and a water sample was taken from each core to determine the initial chemical characteristics. In order to start the incubation process, the upper opening of the cores was closed with a floating Plexiglas lid. At the end of the incubation, the cores were opened and the water was sampled from each core to determine final chemical characteristics. Fluxes of oxygen and nutrients were paired for dark and light incubation –i.e., measured on the same cores. Following the dark incubation, the incubation tanks were re-filled with water from the site, the cores re-submerged and left uncapped for one hour to re-equilibrate prior to start light incubations. Light conditions were obtained with adjustable halogen lamps; light intensity (400–600 µE m−2 s−1) was set on the basis of the average daily radiation of the sampling day recorded with a PAR quanto-photo-radiometer (Delta OHM, model HD 9021, Padova, Italy). Incubation time for both dark and light conditions ranged between 2 and 5 h. Based on previous incubations, the time was set in relation to water temperature and the dominant primary producer community inside the cores in order to obtain an oxygen variation of <20% of the initial concentration.
Water samples were collected with plastic syringes. Subsamples were transferred into glass tubes (Labco Exetainer©, Lampeter, Wales, UK) to which Winkler reagents were added to determine dissolved O2. The remaining water was filtered through Whatman GF/F glass fiber filters: to determine DSi, N-NOx and N-NH4+ samples were stored in polyethylene vials, while to measure SRP, glass tubes were used. Analyses for O2 determination were performed immediately after collection; samples for determination of SRP and N-NOx were stored at 4 °C and analyzed within 24 h, while samples for DSi and N-NH4+ were frozen and subsequently analyzed. Fluxes of O2 and nutrients were quantified as the change over time of the concentration of each parameter using the Formula (1) ([35]):
F x = ( C f C 0 ) × V A × Δ t
where, Fx is the flux of the x chemical species (mg m−2 h−1), Cf is the final concentration of x (mg L−1), C0 is the initial concentration of x (mg L−1), V is the volume of the water column (L), ∆t is the incubation time (h) and A is the sediment surface area inside the core (m2).
As a result of the irregular shape of the stones, the surface area of each rock was carefully measured using the foil-wrapping technique [36]. In short, the surface of each rock was wrapped with close-fitting aluminum foil, trimming any excess, and then weighing the foil wrap. A regression equation based on the weight and area relationship of aluminum foil (n = 10) was used to convert rock foil wrapping weights to areas.
Net daily sediment–water fluxes were calculated as the sum of the light and dark rates multiplied by the average light and dark phase duration.

2.4. Primary Producer Biomass and Sediment Features

At the end of incubation, the biomass of the primary producers from each intact core and microcosm was quantified.
Filamentous algae and epilithic material were removed from each stone with tweezers and brushes. Filamentous algae were rinsed and cleaned to remove epiphyte slime, placed in pre-weighed aluminum dishes, and fresh weighed. Subsequently, the algae were oven-dried at 70 °C for two days. The dried samples were weighed immediately after being removed from the oven and cooled, then ground up and homogenized. The dried biomass was analyzed for BSi, N, and P content. Sediment deposited on rocks at the RS site was also collected by carefully scraping the stone surface with a spoon and then both fresh and dry weighed, with the dry sediment retained for OM, BSi, N and P analysis.
Cores with macrophytes (site VS) were extracted, flushed with tap water, and filtered through a 2-mm mesh sieve. The collected plants were further washed with deionized water and sorted by species. From each specimen, leaves and roots were separated, rinsed, and cleaned to remove debris, epiphytic algae and macro-invertebrates; then placed in pre-weighted aluminum dishes and fresh weighed. Subsequently, the material was oven-dried at 70 °C for two days. The dried samples were weighed after removal from the oven, cooled, and then ground up, homogenized, and analyzed for BSi, N, and P content.
In the laboratory, cores for sediment characterization were extracted and the upper 0–2 and 2–5 cm sediment horizons were retained for subsequent analysis. Microphytobenthos (MPB) biomass at the BS and VS site was determined as chlorophyll-a (Chl-a). Phaeopigments (Pha) were also determined as a proxy for degraded MPB biomass. The BSi, N and P fixed by MPB were then estimated, based on the conversion factor BSi:Chl-a = 14.3:1 g g−1 [37] and C:Chl-a = 30 g g−1, and converted to N assuming a molar C:N ratio of 9 and to P assuming a molar C:P ratio of 158 [38,39,40]. The remaining sediment slurry from VS and BS sites was analyzed for OM, BSi, N, and P content.

2.5. Analytical Methods

Dissolved oxygen was determined using the Winkler method [41]. N-NH4+ [42], N-NOx [41], SRP [43], and DSi [44] were determined with standard spectrophotometric methods (Perkin Elmer, Lambda 35). An analytical blank that underwent the same procedure as the samples, including filtration, was always analyzed to correct for sample contamination.
Chl-a and Pha were determined spectrophotometrically according to [45] from 1 cm3 sediment slurry extracted with 10 mL 90% water-acetone.
Organic matter was determined as loss on ignition at 550 °C with a standard procedure [46]. Total N content was determined using a CHN elemental analyser (CHNS-O EA 1108 Carlo Erba), while organic P was determined following [47].
The BSi content of primary producers was analyzed according to [48]. In short, 30 mg of dry plant tissue were digested with 30 mL 0.1 M Na2CO3 in polypropylene (PP) bottles. During the extraction, samples were constantly shaken for 4 h at 150 rpm in a shaking water bath at 85 °C. Before the analysis, each sample (1 mL of extraction solution) was neutralized with 9 mL of 0.021 M HCl and analyzed using the molybdate blue spectrophotometric method [44].
The total BSi content of sediments was analyzed following [49], by digesting 30 mg of dry sediment with 30 mL of 0.1 M Na2CO3 in PP bottles for 5 h at 85 °C. Subsamples were collected after 3, 4 and 5 h and analyzed using the molybdate blue spectrophotometric method [44]. Before the analysis, each sample (1 mL of extraction solution) was neutralized with 9 mL of HCl 0.021 M. To correct for the amount of Si resulting from mineral dissolution, the Si content of the subsamples was plotted against dissolution time. The y-axis intercept of the linear regression line represents the estimated BSi content. All BSi dissolved within the first 3 h.

2.6. Statistical Analyses

Flux data were analyzed with three-way generalized least square (GLS) models, which were run with condition (light and dark), site (RS, VS, BS), and sampling date (Early, Mid, Late) as the main fixed factors (interaction included). To deal with observed heteroscedasticity, we used the argument “weights” within the function gls, and the function varident to specify variance models. An a posteriori comparison of the means was performed using a post hoc Tukey test. Statistical analyses were run with the nmle [50] and emmeans [51] packages in R software v. 3.6.0 [52].
All results in text, figures and tables are presented as mean ± standard error.

3. Results

3.1. Water and Sediment Characteristics

The temperature of the littoral waters of Lake Iseo ranged from 15 °C in April to 28 °C in midsummer. The chemical characteristics of near-bottom waters differed between sites (Table 2). DSi concentrations were highest at the VS site and lowest at the RS site. While DSi concentrations were constant at the VS site, they increased throughout the season, reaching the same level as those at the BS site, and to a much lesser extent at the RS site. SRP concentrations were <5 µg P L−1 and no differences were found between sites. DIN concentrations and their seasonal trends were similar in the three sites, and were mainly driven by N-NOx which accounted for more than 80% of DIN on average. The DSi:DIN and DSi:SRP ratios conformed to the DSi concentration pattern, the ratios being VS>BS>RS. At both BS and RS, DSi:DIN and DSi:SRP increased throughout the season. At BS, values attained those measured at VS, while at RS, values remained nearly two times lower. On average, molar ratios DSi:DIN = 0.28, DSi:SRP = 132 and DIN:SRP = 37 evidenced that DSi concentrations in the water column were low compared to DIN. SRP was deficient with respect to both DIN and DSi, especially at RS.
The surface sediment was similar at the VS and BS sites—soft and homogenous—although OM, N, and P were slightly greater at VS than at BS (Table 3). The percent of OM and nutrient content was comparatively higher at station RS, where the sediment was probably enriched by the biomass growing on stones. Accordingly, the average sedimentary BSi concentration was higher at RS (1.00 ± 0.17%) compared to VS (0.79 ± 0.03%) and BS (0.46 ± 0.02%). Similar patterns were also found for total N (0.50 ± 0.08% at RS, 0.33 ± 0.01% at VS, and 0.21 ± 0.00% at BS), and organic P (ranging from 0.11% at RS to 0.01% at both VS and BS). The BSi:N:P stoichiometry highlighted how BSi, when compared to N and P, accumulated preferentially in sediments at VS and BS rather than at RS. While the variation in the BSi:N molar ratio exhibited a narrow range (from 0.72 to 1.38 at all sites), the N:P molar ratio was approximately 10 times lower at RS compared to VS and BS. BSi:P ratios were also higher at VS and BS than at RS, though to a lesser extent.
On the areal basis, the total quantity of OM, N, and P in the 0–2 cm sediment horizon was almost constant within each site, but with differences between sites, with VS > BS >> RS (Table S1). The BSi bulk decreased from early to late phases at both VS (33.4 to 23.8 mg Si m−2) and BS (25.9 to 20.2 mg Si m−2), whereas it increased at RS (0.5 to 0.8 mg Si m−2) (Table S1).

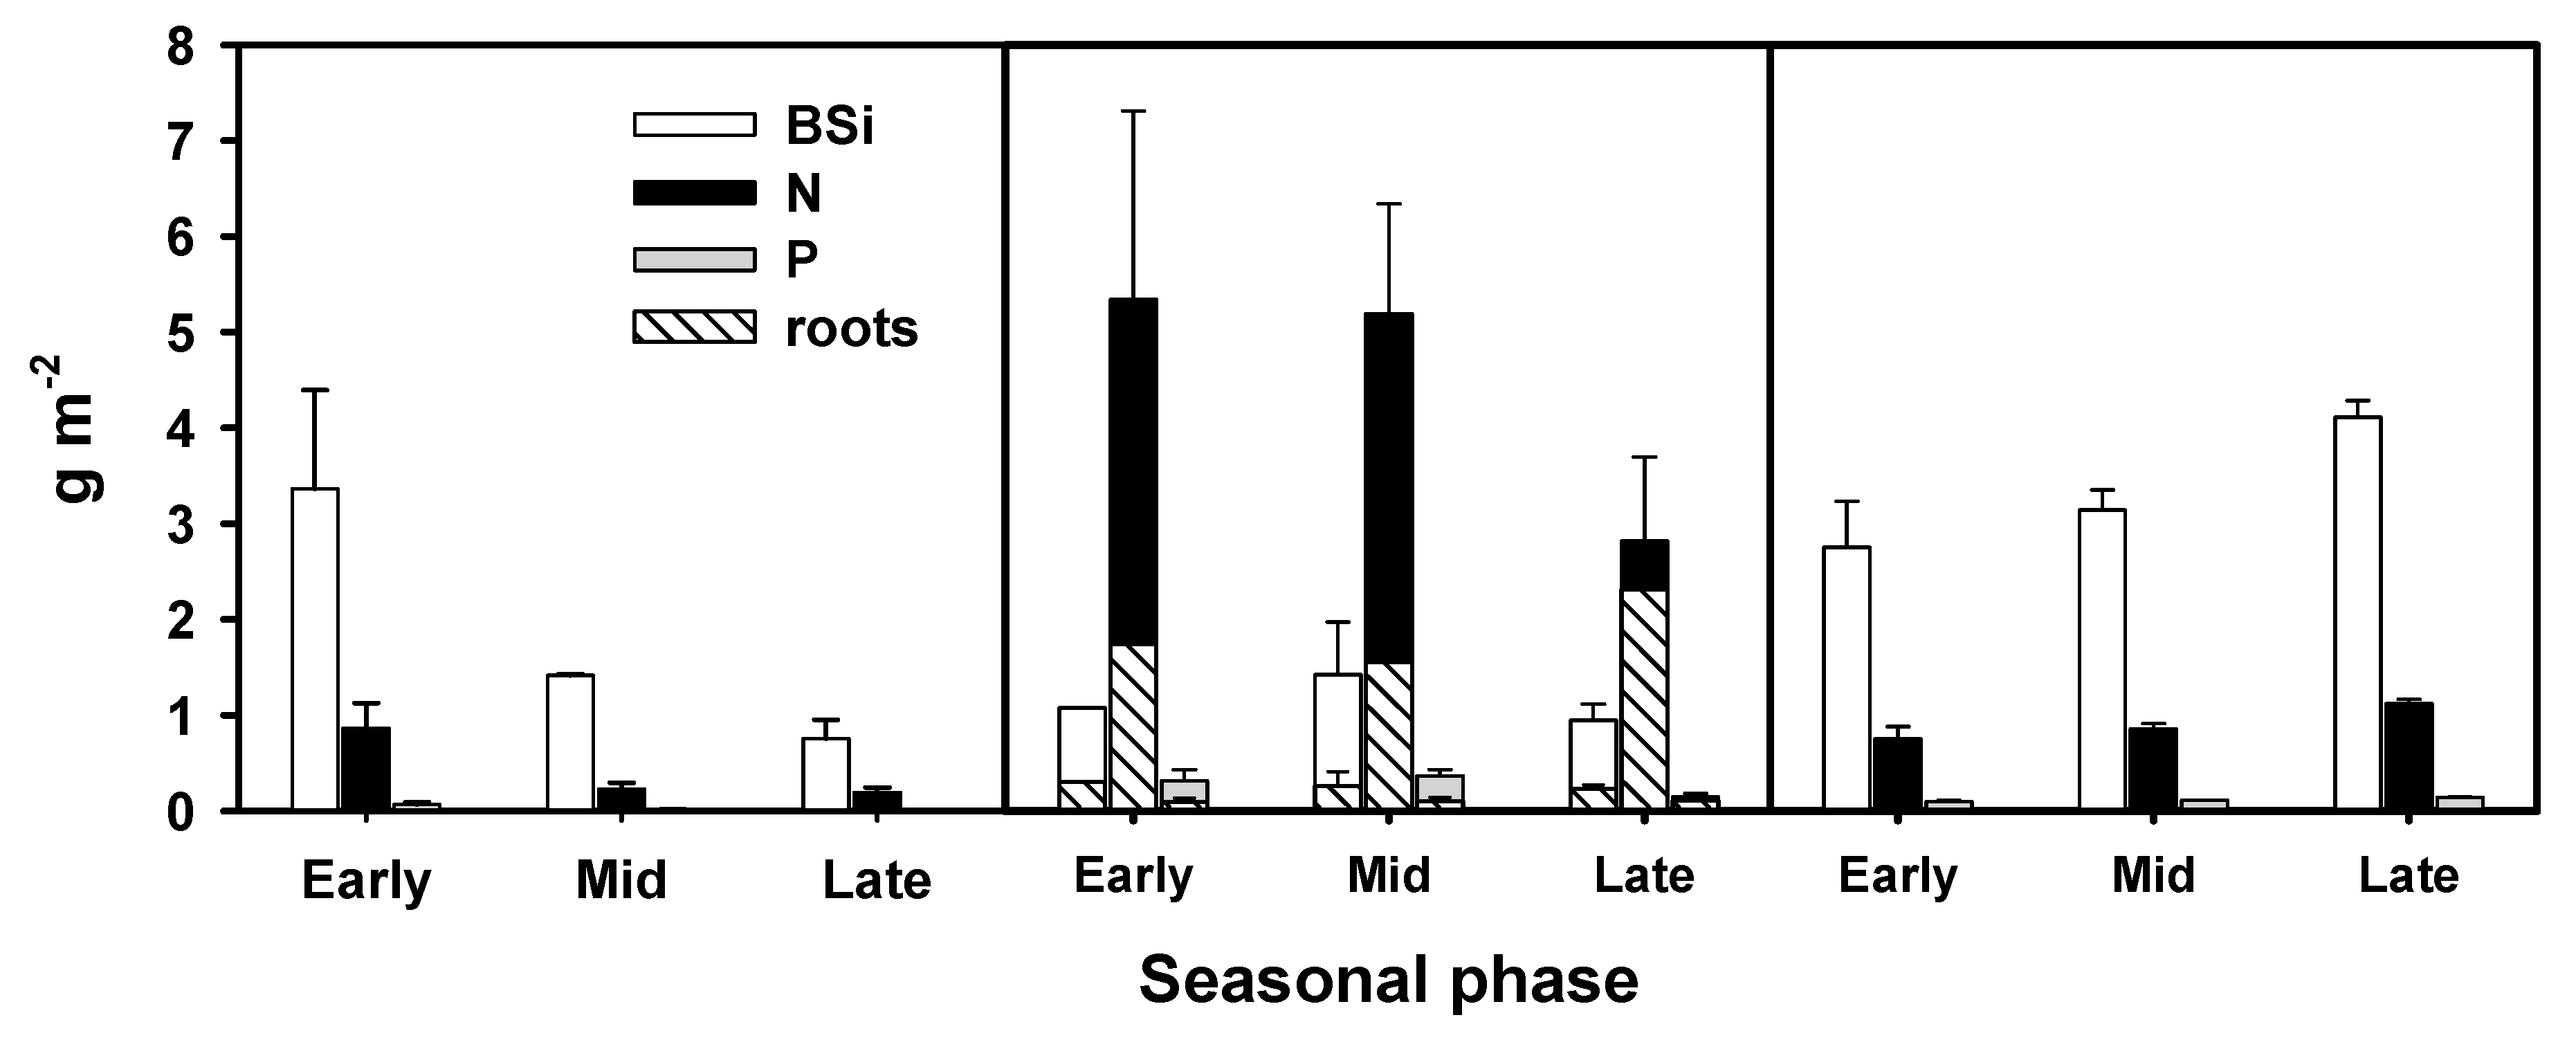
3.2. Primary Producer Biomass and Elemental Composition

The benthic community at RS was dominated by filamentous epilithic macroalgae (EA), specifically by Cladophora glomerata (Linnaeus) Kützing in late spring to early summer, and by Spirogyra spp. in late summer (Table 4). To sum up, the total biomass of filamentous algae decreased from early (63 ± 19 g DW m−2) to late summer (39 ± 22 g DW m−2). At the VS site, SAV biomass followed a clear seasonal pattern with the highest values in midsummer (Table 4). The SAV was mainly composed of Vallisneria spiralis and, to a lesser extent, of Najas marina. Chara globularis Thuiller, Lagarosiphon major (Ridl.) Moss, Myriophyllum spicatum L., Ceratophyllum demersum L., and Elodea nuttallii (Planch.) H. St. John occurred occasionally, contributing up to a maximum of 25% of the total biomass. At the BS site, the bare sediment was colonized by MPB, with Chl-a values ranging from 193 to 288 mg m−2 (Table 3). Here, rare and small individuals of C. globularis were also detected, but with negligible biomass. Microalgae also colonized hard substrata and sediment at RS and VS, attaining Chl-a concentrations from between 21 (RS) and 196 (VS) mg m−2 (Table 3). The Pha content, a proxy for degraded vegetal biomass, clearly decreased from macrophyte covered to bare sediments and hard substrates in the order VS > BS > RS (Table 3).
The BSi content was greater in the biomass of C. glomerata and Spirogyra ssp. (up to 5.5%) compared to the content recorded in V. spiralis and N. marina (up to 1.1%). In V. spiralis, the BSi content was higher in leaves than in roots, and was greater than in N. marina, in which roots and leaves exhibited a similar content (Table 4). In contrast, N and P content in filamentous algae were 1.7–3.0 times lower than in macrophytes, attaining values from 2.3 to 3.6% (N) and from 0.10 to 0.22% (P) in the above ground biomass of V. spiralis, and from 1.9 to 2.8% (N) and from 0.15 to 0.27% (P) in the above ground biomass of N. marina. In the same way, N and P content in belowground biomass were similar to those recorded above ground (Table 4). As a consequence the BSi:N:P stoichiometry in plant biomass differed between sites. At RS, the BSi:N molar ratio of macroalgae ranged from 2.0 to 3.1 and the BSi:P molar ratio ranged from 56 to 127, both attaining maximum values in midsummer.
Concurrently, the N:P molar ratio increased from 29 in spring to 49 in late summer. At VS, both BSi:N and BSi:P in macrophytes biomass were much lower, i.e., 0.06 to 0.19 (BSi:N) and 2.5 to 9.2 (BSi:P). Furthermore, the BSi:P ratio was greater in the leaves than in the roots of V. spiralis.
The standing stocks of BSi, N and P (Figure 2) retained by primary producer biomass varied between sites and throughout the season. The BSi stock was greater at RS than at VS. At RS, BSi underwent an abrupt decrease in midsummer, attaining a value similar to VS in late summer. In contrast, at the BS site, BSi associated with MPB progressively increased and was much greater than at RS and VS, especially from midsummer onwards.
At the VS site, BSi was mostly retained by the leaves, while only a small fraction accumulated in the roots. Both N and P stocks followed a different pattern, i.e., VS > BS > RS. However, while biomass-N decreased throughout the summer at both RS and VS, it remained steadily constant at BS. In addition, at VS, the nitrogen decrease was mainly accounted for by leaves, while it accumulated in roots in late summer. The P stocks accounted for by the different primary producer assemblages was always low and often negligible, when compared to BSi and N.

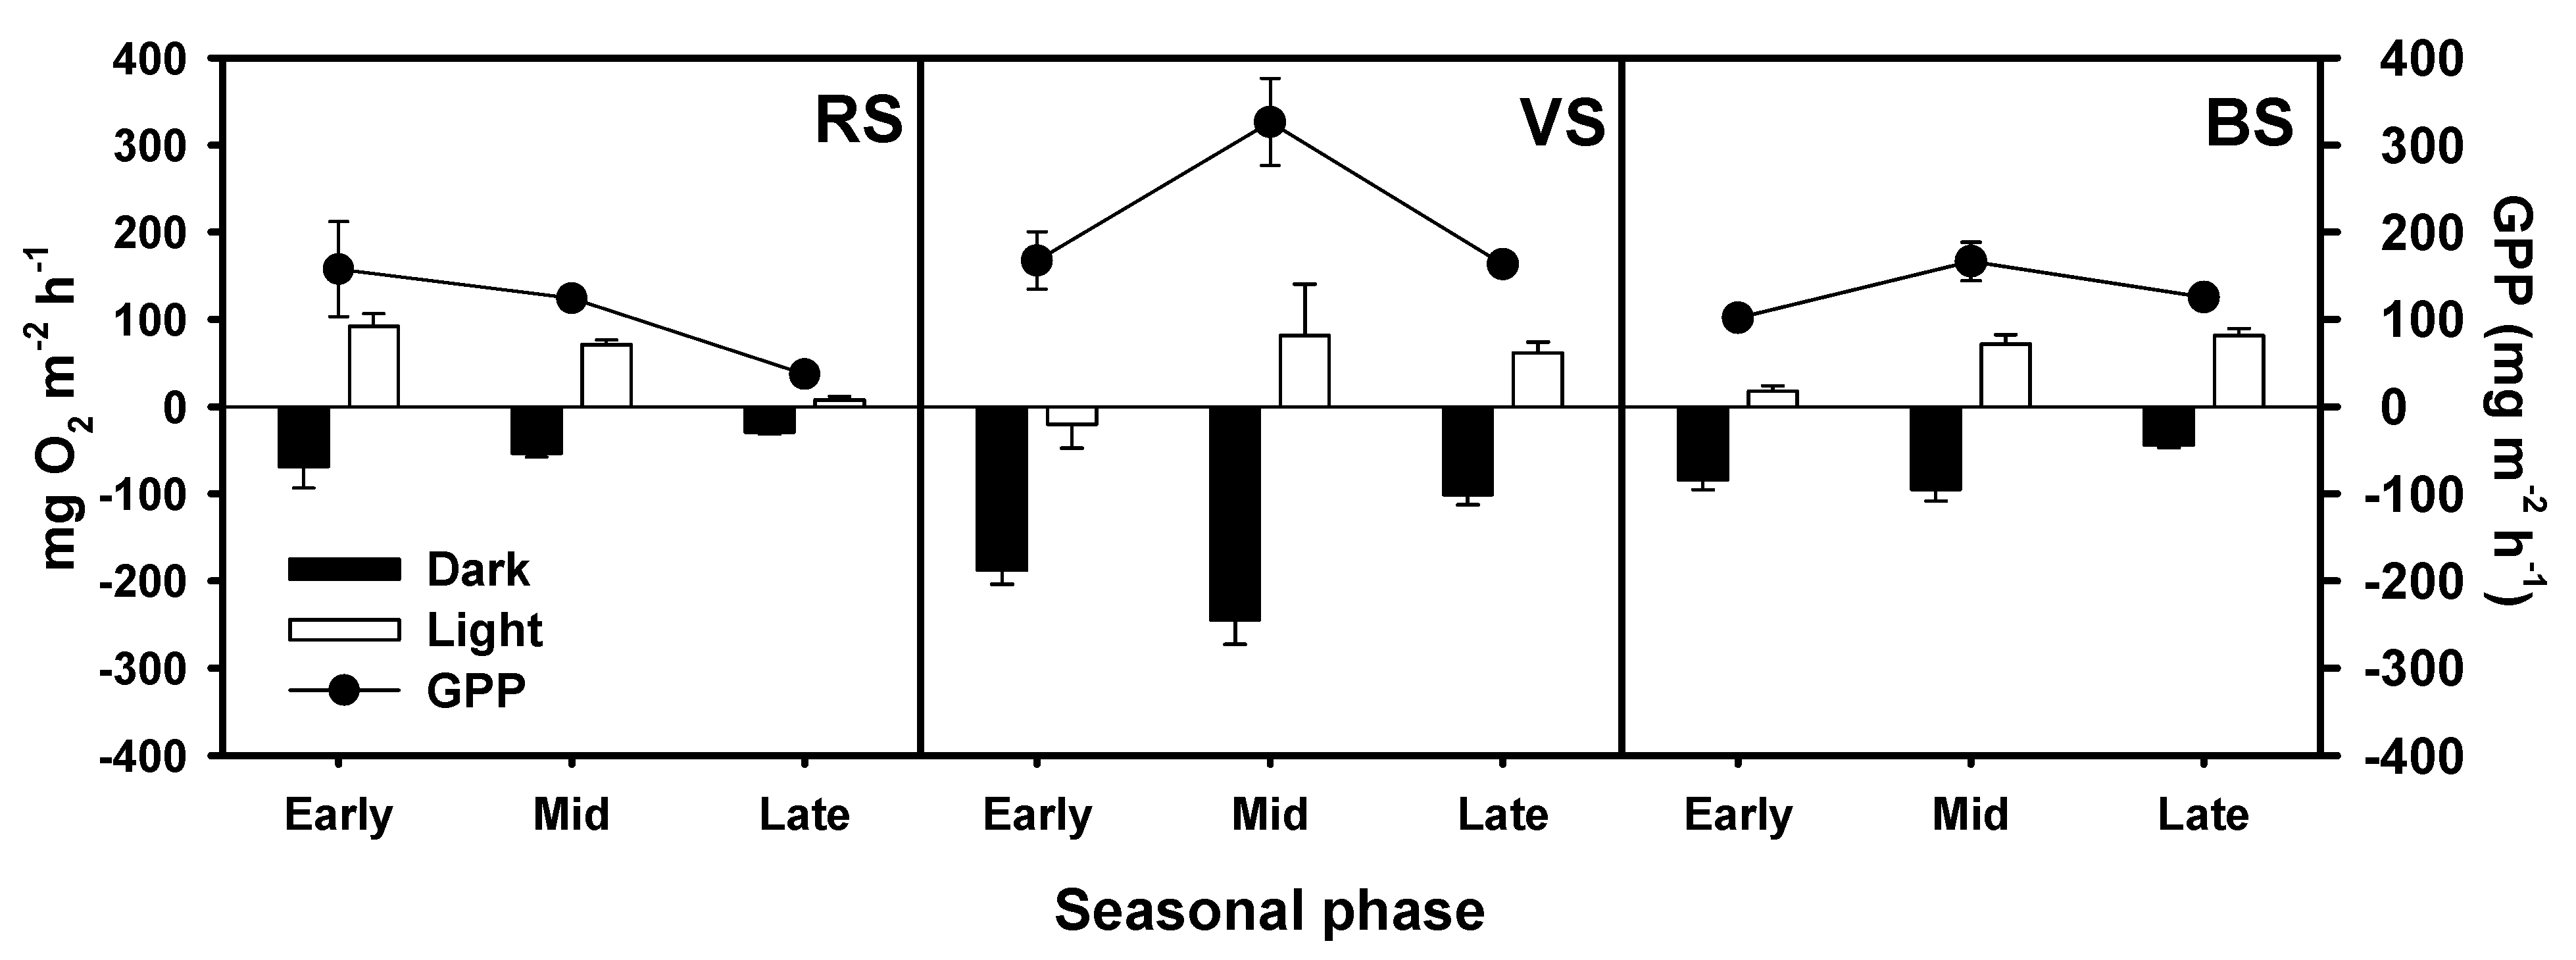
3.3. Oxygen Fluxes and Gross Primary Production

Oxygen fluxes differed significantly between light and dark conditions, among sites, and throughout the season (Figure 3, Table 5). At RS, both light and dark oxygen fluxes, as well as the resulting gross primary production (GPP), decreased from the early phase to the late seasonal phase. In contrast, at VS and, to a lesser extent, at BS, both dark and light fluxes and GPP peaked in midsummer.
At VS, the daily net oxygen flux was always negative, with a minimum in early summer (−2156 ± 417 mg O2 m−2 d−1). On the contrary, the net daily oxygen flux was positive at RS in the early phase at its peak (834 ± 269 mg O2 m−2 d−1) and in midsummer (582 ± 42 mg O2 m−2 d−1), becoming negative only in the late phase (−185 ± 67 mg O2 m−2 d−1). At BS, a slightly positive trend occurred during the sampled period: daily oxygen fluxes oscillated from a negative value in early summer (−590 ± 144 mg O2 m−2 d−1) to a positive value in late summer (322 ± 96 mg O2 m−2 d−1).

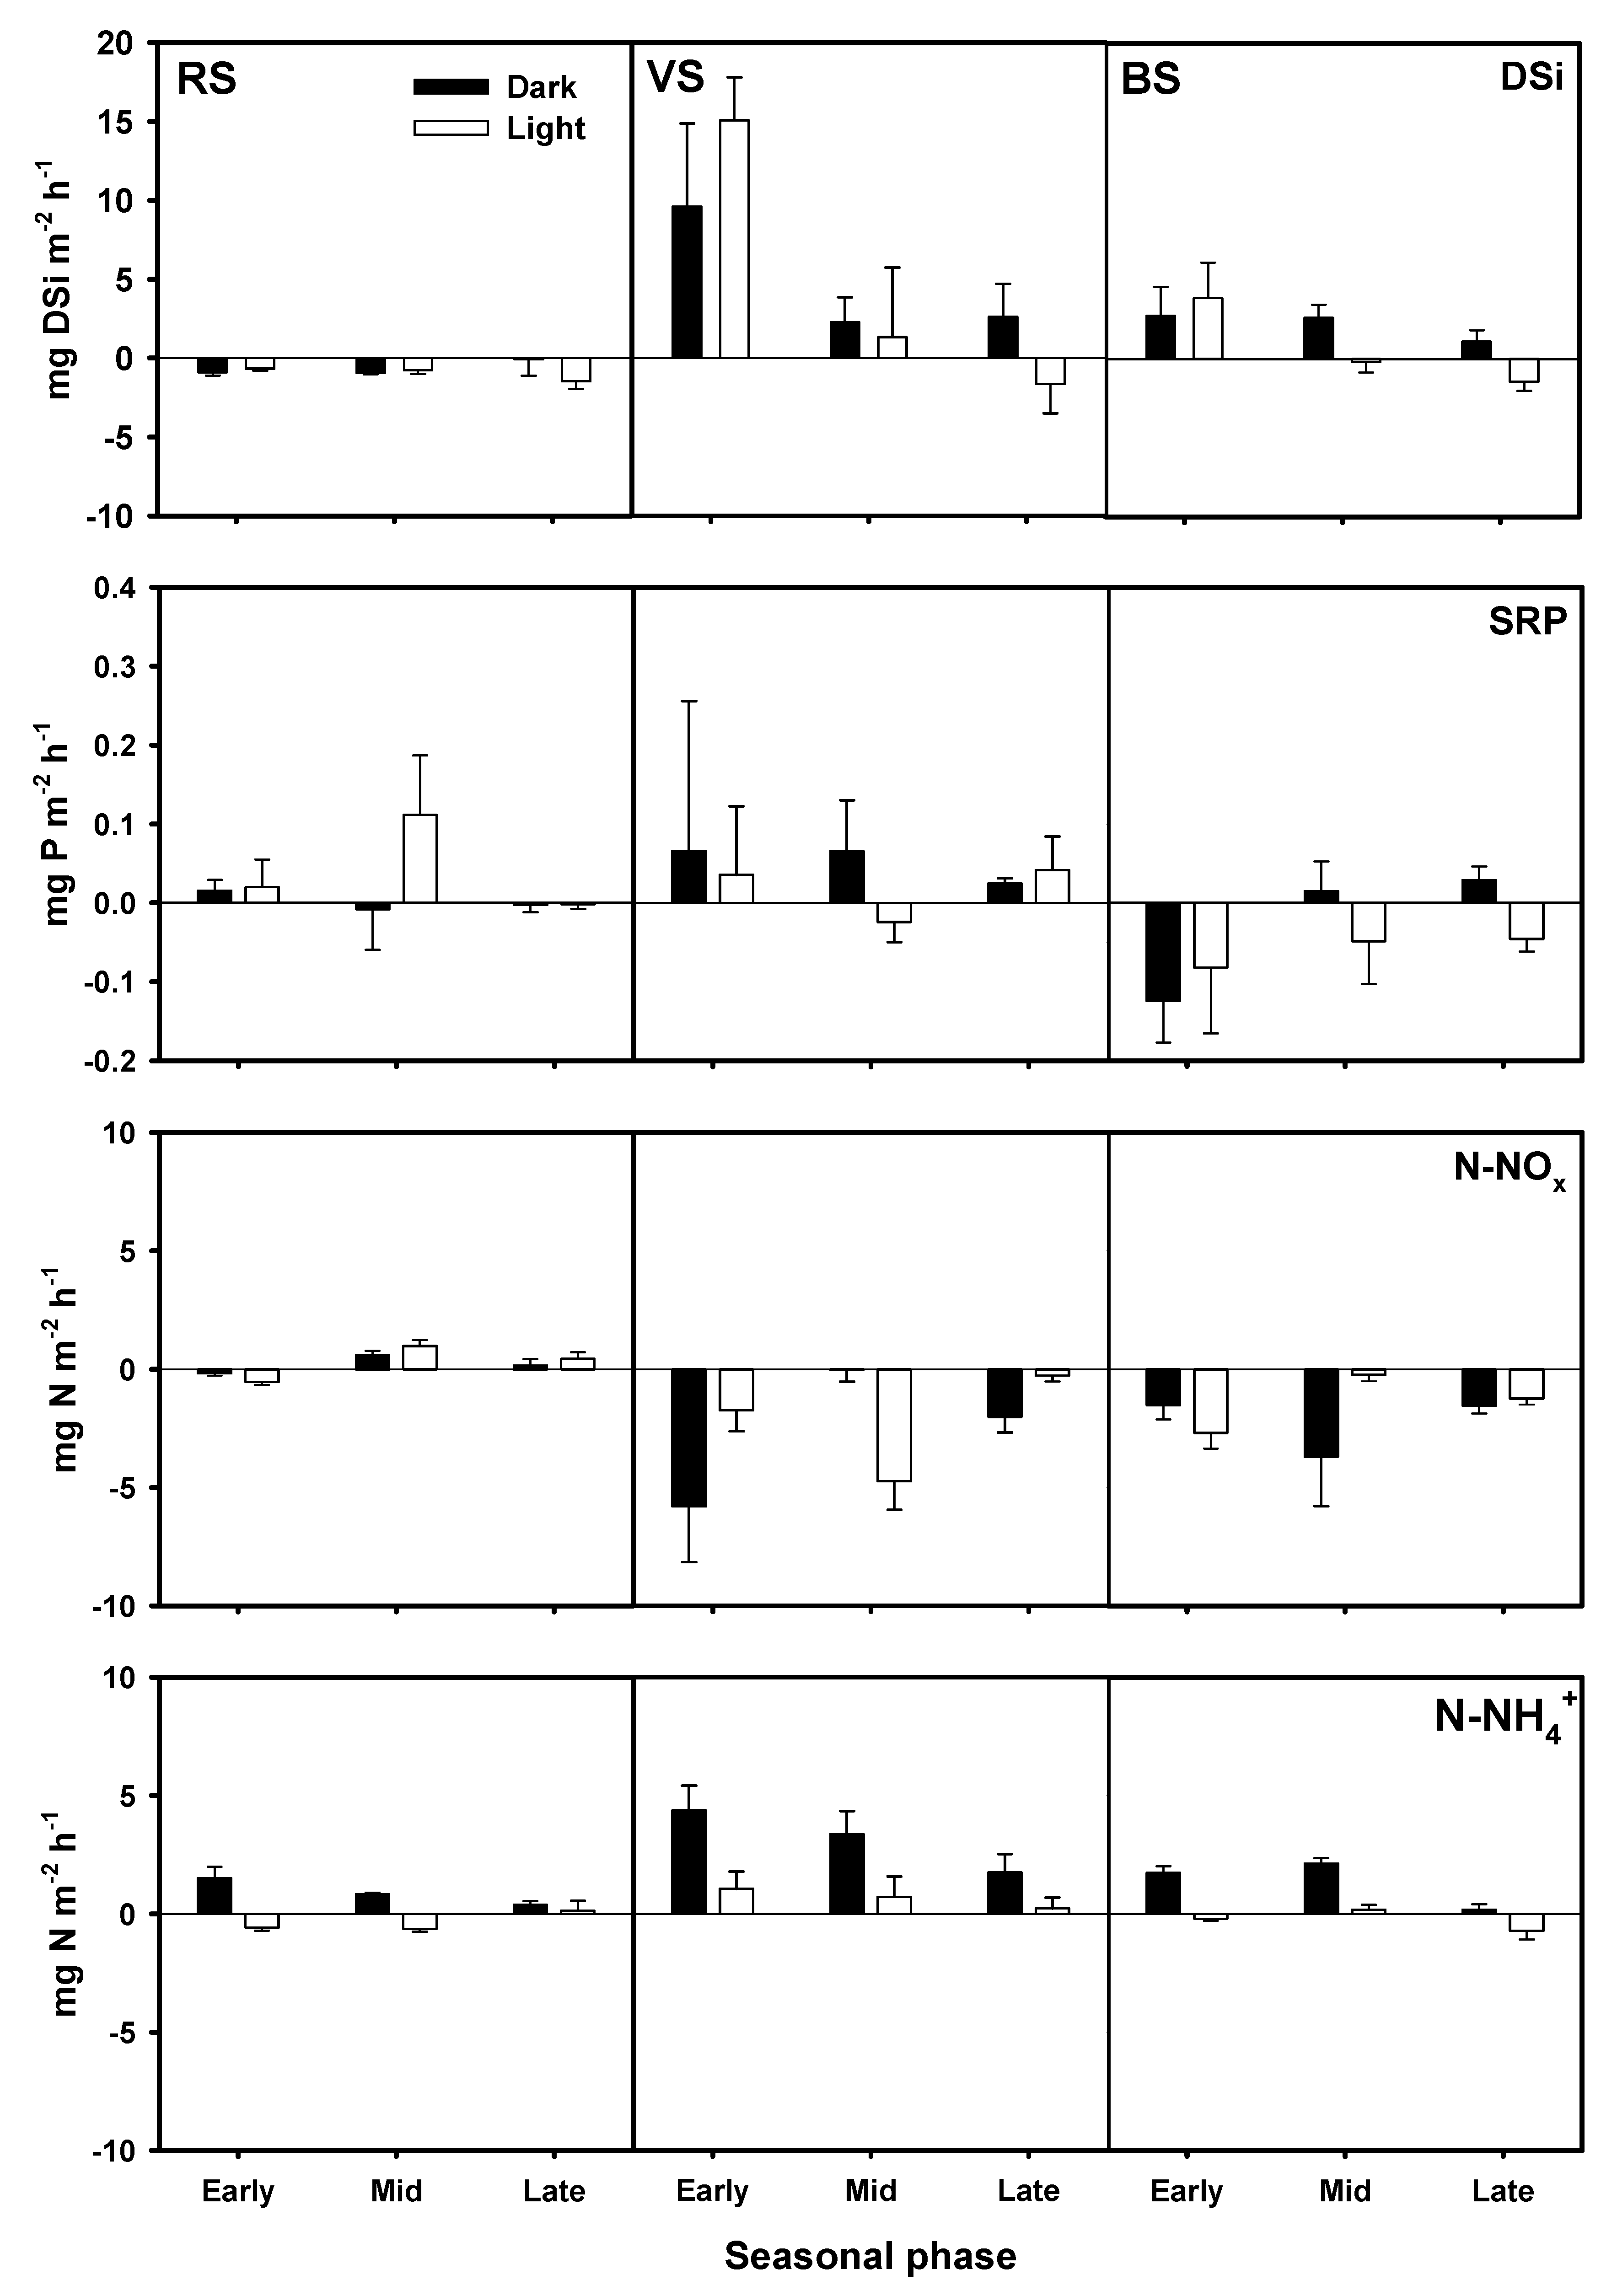
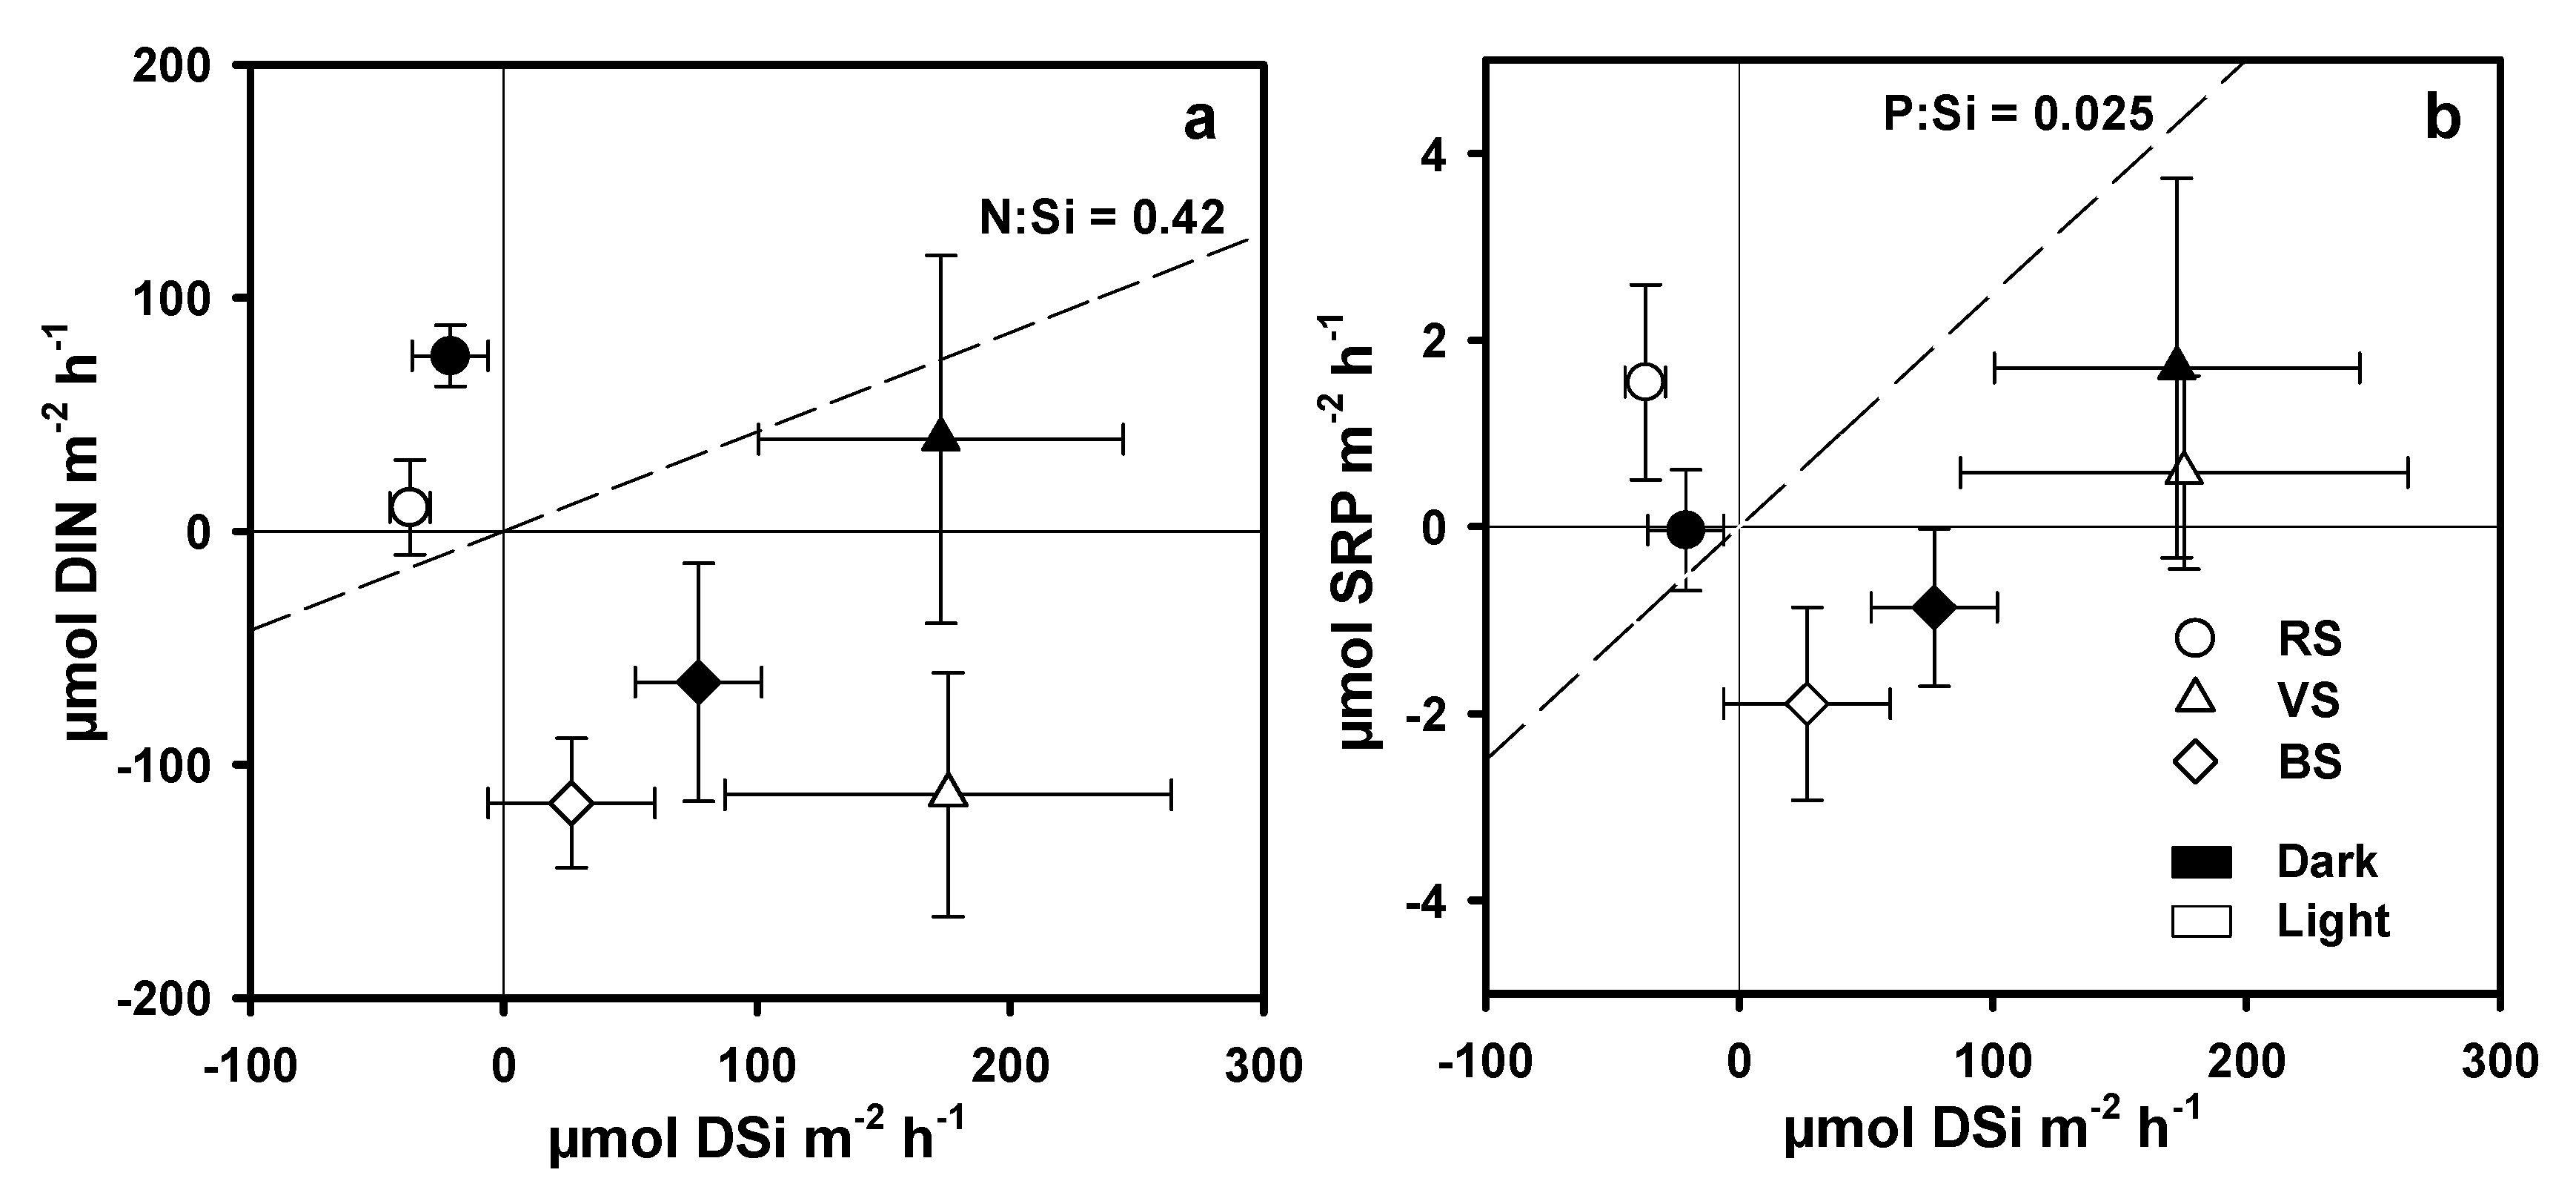
3.4. Nutrient Fluxes across the Water Sediment Interface

Differences in dissolved silica (DSi) fluxes were statistically significant between sites, but showed no evident difference between light and dark conditions or between dates (Figure 4; Table 5). The interaction between sites and seasonal phases was probably due to the steep decrease of DSi fluxes from late spring to mid-summer at the VS site. At the RS site, DSi fluxes were steadily negative from spring to fall, indicating a consistent uptake, although on average the extent of the flux was low. Dark silica fluxes were always positive at VS, while under light condition, they decreased from a marked release in late spring to a small uptake in late summer.
Over the time span of this study, daily fluxes of DSi were on average negative at the RS site (−20 ± 6 mg Si m−2 d−1), which indicates uptake by epilithic algae and sediment. Conversely, they were positive at the VS site (121 ± 49 mg Si m−2 d−1) and the BS site (34 ± 19 mg Si m−2 d−1), highlighting a net DSi release, even in late summer, when a small uptake was detected under light conditions.
Fluxes of soluble reactive phosphorus (SRP) were low and exhibited a large amount of variability, ranging from −0.5 to 0.7 mg P m−2 d−1 (Figure 4). Only the differences between sites were statistically significant (Table 5). However, weak seasonal patterns were also identified at BS, where uptake under light decreased from the early to the late phase, whereas SRP release from sediment to the water column simultaneously increased. At the VS site, SRP was mainly released from sediment to the water column, with the only exception of a slight uptake in midsummer, when GPP peaked.
N-NOx fluxes were statistically different between sites and dates (Table 5). At the RS site, they were negligible, exhibiting a large amount of variability, while at VS and BS, uptakes up to almost −10 mg N m−2 h−1 were detected in early summer (Figure 4). Patterns of N-NH4+ fluxes were almost specular to N-NOx, as N-NH4+ was steadily released from the sediment to the water column. Differences between sites and with relation to light and dark conditions were also clearly evidenced (Figure 4, Table 5).
To some extent, the benthic system was a net sink of dissolved inorganic nitrogen (DIN) under light conditions at VS and BS, while dark flux data was strongly affected by spatial and temporal heterogeneity. In contrast, the benthic system was a small DIN source (0.6 ± 0.2 mg N m−2 h−1) at RS. Differences between sites were also revealed by the stoichiometry of DSi, DIN, and SRP fluxes, with RS behaving in a much more diverse way than BS and VS (Figure 5).

4. Discussion

In this work, we assessed Si accumulation and recycling with respect to N and P in the littoral zone of Lake Iseo. These issues are little studied but of relevance given the importance of Si for primary producer growth, as they can provide new insights into the role of benthic processes that regulate DSi bioavailability. Several papers focus on DSi fluxes in similar systems, i.e., shallow brackish and freshwater ecosystems, but less is known about the BSi content of surface sediments, EA, and SAV biomass. Overall, while DSi fluxes measured in the present study fall within the ranges reported in the literature (Table 6), comparisons are less reliable for sedimentary BSi, since there is scarce data available.
The littoral zone is a filter between terrestrial and aquatic ecosystems, which can retain or release DSi, DIN, and SRP through primary production, grazing, detritus decomposition and mineralization, etc. [25]. In general terms, our results identify the components of the benthic communities that primarily account for the filtering capacity of lakes and lentic waters. In addition, lentic waters are key components of fluvial filters, which can selectively remove, retain, or release nutrients and chemical elements into outflowing waters [6,11].
The comparative contribution of SAV, MPB and EA to BSi storage and DSi fluxes is shown in Figure 6. Surprisingly, despite the fact that the primary producers considered in this study accumulated BSi, the littoral zone was on average a DSi source to the water column, especially the SAV meadow. However, the littoral zone was heterogeneous and patchy with two contrasting features that depend on hydro-morphology—i.e., flat, soft sediments and steep, hard (rocks and pebbles) substrates—which in turn shape the dominant community. On account of these differences, process rates and DSi outcomes were variable between the littoral communities due to the fact that the primary producers colonizing each area exhibited a distinct preference for Si. The SAV meadows and MPB patches were a net DSi source, while only EA assemblages on rocky substrates were a net sink.

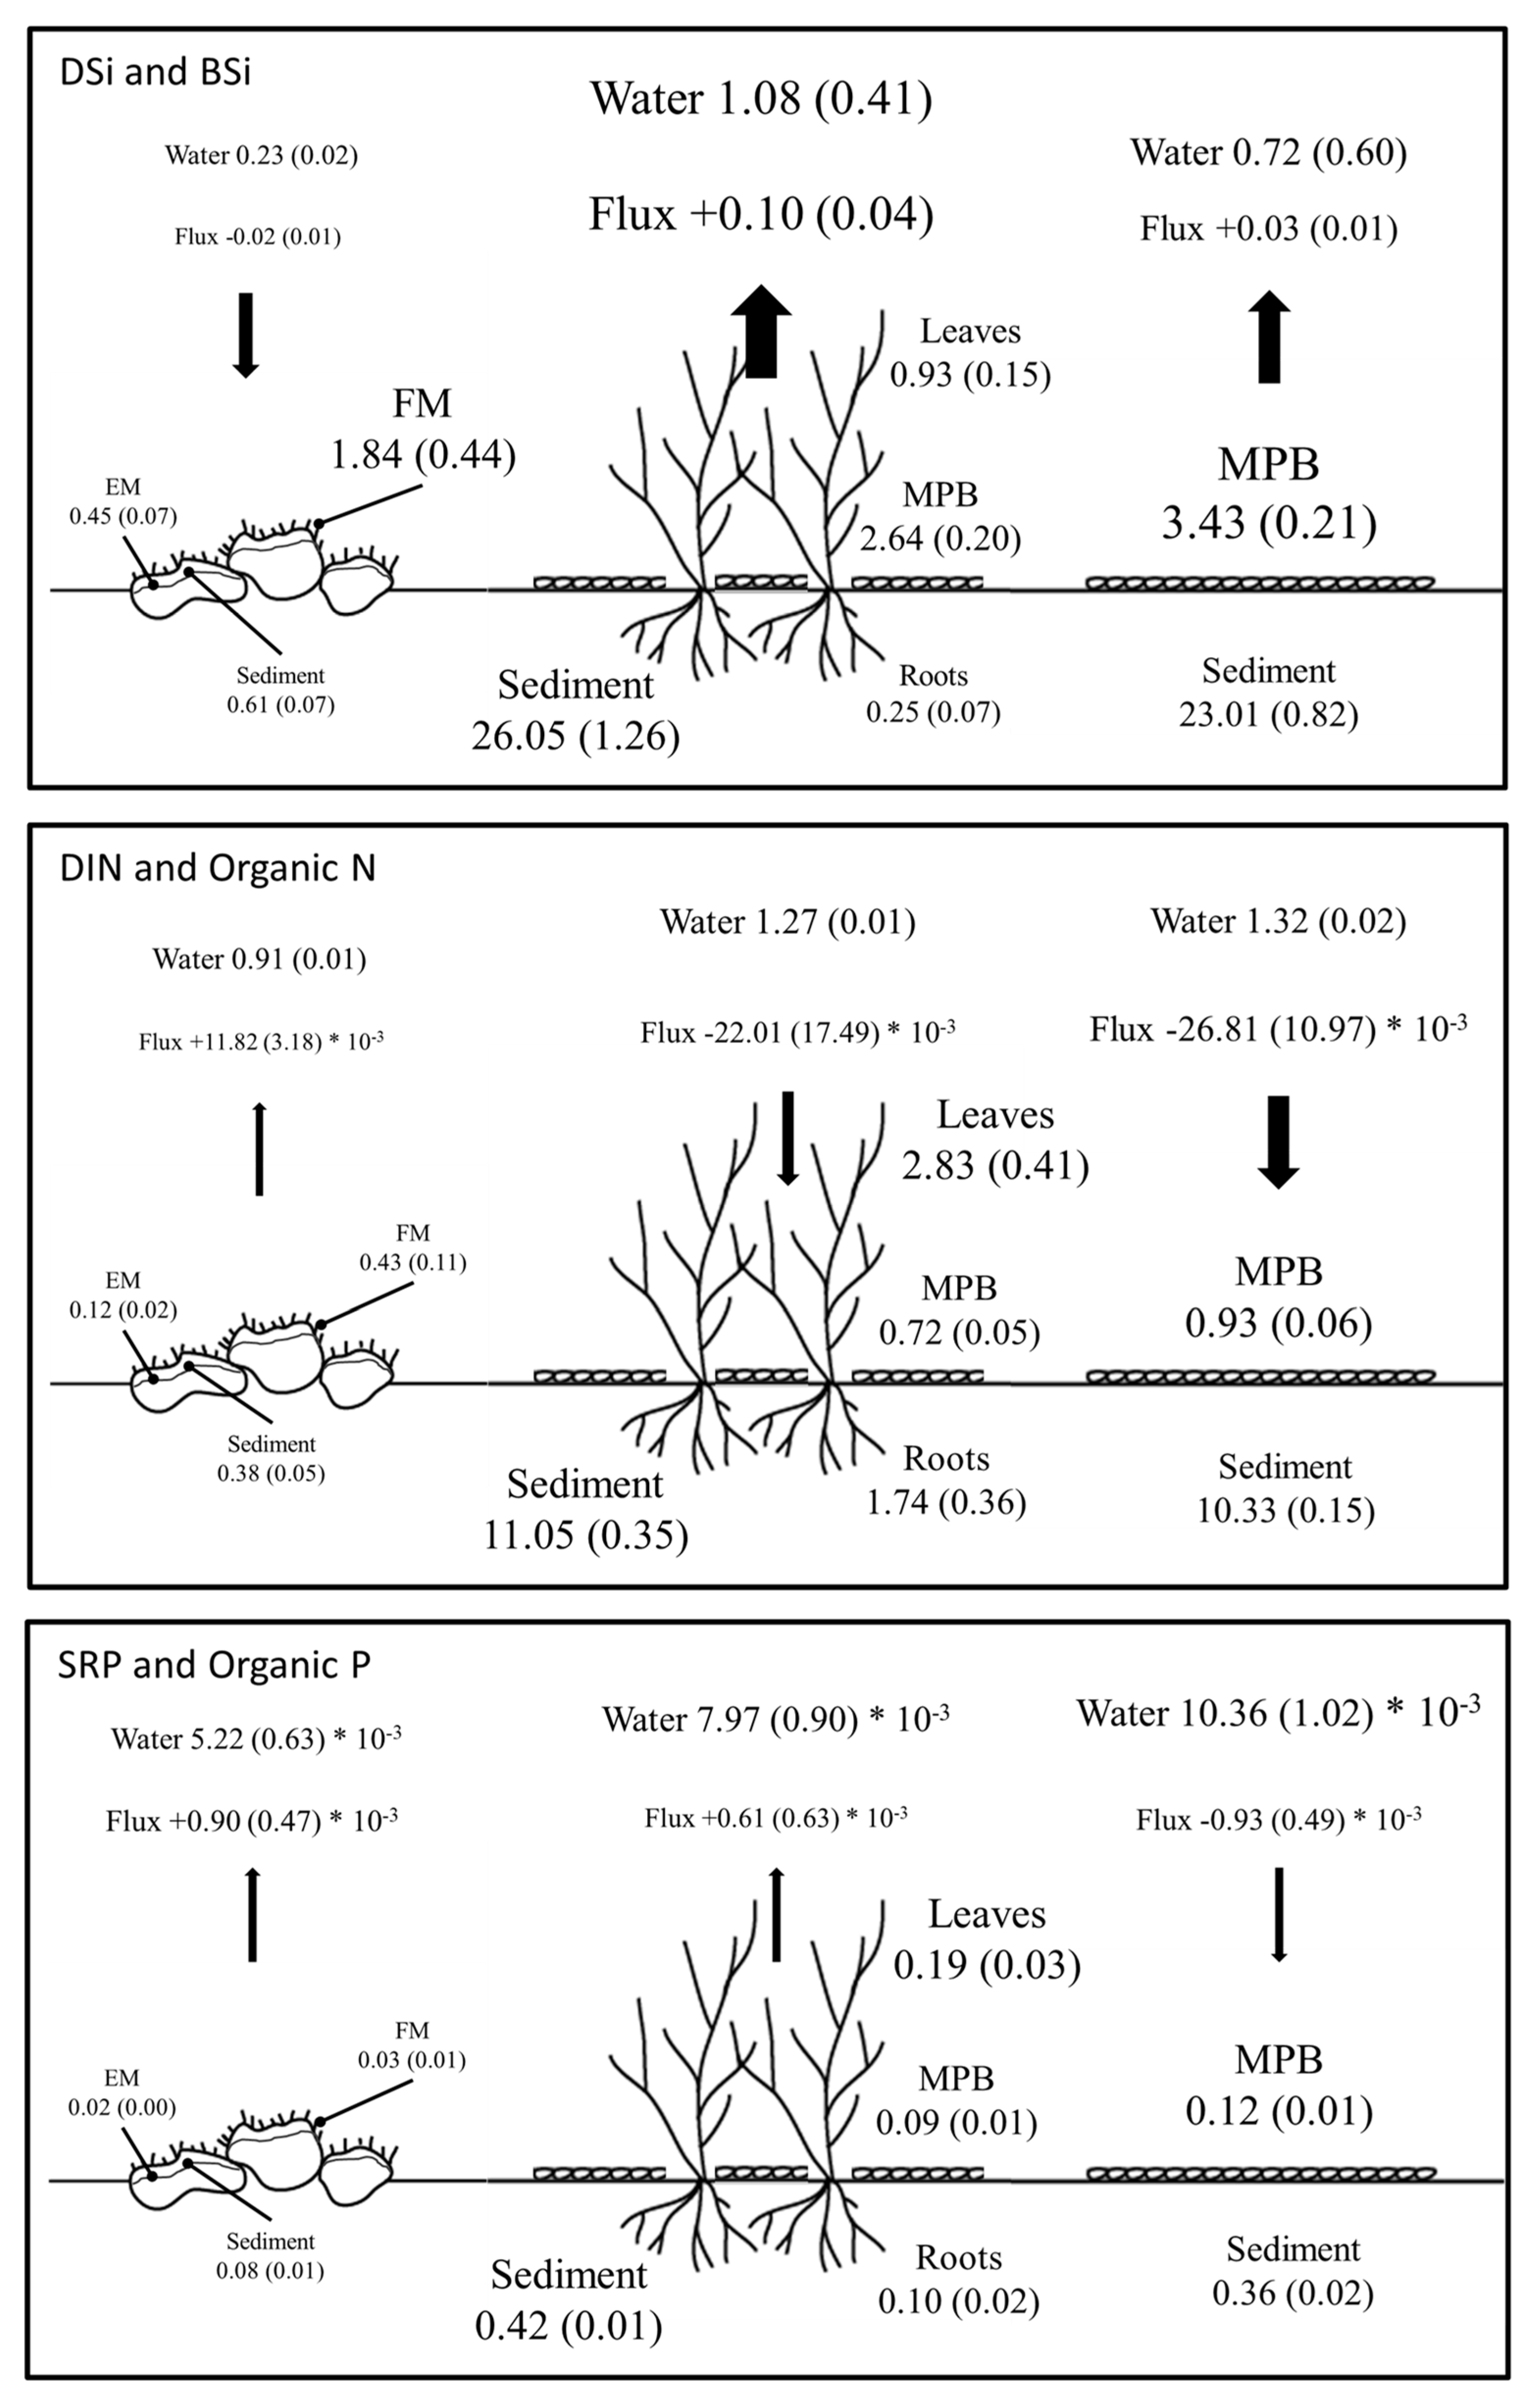
4.1. BSi Storage in Primary Producer Biomass and Surficial Sediment and BSi, N, and P Stoichiometry

Submerged vegetation in the littoral zone accumulated Si, but differences among species were observed.
As far as we know, our study is the first to report data on BSi content in Vallisneria spiralis, since previously published data gathered from Lake Maggiore by [53] did not distinguish between BSi and other Si forms. In addition, we only found a single value (BSi = 0.02%) for Najas marina, which grew in a turbulent, turbid, and presumably light-limited aquatic system [54]. The BSi content of SAV species measured in this study falls in the lower range of values (0.7–2.8%) detected for phanerogam species in shallow freshwater ecosystems, including running waters [19,55,56]. Usually, macrophytes are expected to have a lower BSi content in lakes than in rivers, since physical stressors, e.g., current velocity and turbulence, can stimulate BSi assimilation, thus conferring resistance against drag forces [57].
In N. marina, the Si, N, and P stoichiometry in the above- and below-ground biomass was similar. On the contrary, V. spiralis tended to accumulate more BSi in its leaves, also with respect to N and P, than in its roots. The difference between species can be explained by the ability of V. spiralis to exploit deep sediment layers, thanks to its long roots. Studies in the same area of Lake Iseo demonstrate that DSi concentrations are greater in pore waters of bare sediments than in sediments colonized by V. spiralis [68]. SAV species can, therefore, increment the transport of Si from sediment to the water mass. This capacity to take up DSi is reduced by organic enrichment of sediment, as demonstrated for N and P [69].
In rocky shores, the strong dominance of diatoms and the high Si:N and Si:P ratios in macroalgae tissues can account for Si accumulation, exceeding N and especially P uptake, despite a lower plant biomass [23,70,71,72]. We found that the P content in epilithic biomass was close to or below the lower limit of the optimal range for growth (0.01–0.02%) reported for epilithic primary producers [73,74,75,76]. The actual molar C:N:P = 443:23:1 at RS also evidenced a P and, to a lesser extent, N shortage, when compared to the optimal ratio for periphyton growth, i.e., C:N:P = 119:17:1 [77]. In contrast with what we found at the RS site, SAV species at VS efficiently accumulated N and P. These elements exhibited a seasonal pattern similar to the BSi one, with a peak in the early phase and a sharp decrease in the later part of the season (Figure 2). Such a pattern can be explained by both leaf detachment [78,79] and element translocation from leaves to roots and rhizomes. Both processes usually occur at the end of the vegetative growth phase.
The BSi stock was high at VS and less high at RS, but values were comparable with those of other studies [19,22,55,56,57,71]. In our analysis, the BSi bulk was on average 24–33 g Si m−2 in the SAV meadow, of which 6–12% was accounted for by MPB and by SAV fresh detritus, while in bare sediments at BS, BSi was 20–25 g Si m−2, of which 11–20% was from MPB (Table S1). In contrast, the BSi stock at RS was one order of magnitude lower than VS and BS sites and comprised between 2–4 g Si m−2, of which 60–80% was from epilithic macro- and microalgae. Accumulated debris at the rocky site contributed only 0.47–0.75 g Si m−2. The nutrients stored in the biomass were relevant compared to the nutrient content in the overlying water. At RS and BS sites, BSi in primary producers resulted one order of magnitude higher than DSi in overlying water, while at the VS site, it was four times higher than DSi in overlying water (Figure 6).
In this study, we did not quantify the amount of Si retained in the biomass of epiphytes growing on SAV leaves and filamentous macroalgae. Previous studies reported that epiphyte biomass on macrophytes varies greatly, from a negligible amount up to the same quantity as the host biomass, and depends on plant morphology, light, nutrient availability, and allopathic effects [80,81]. The BSi stocks in SAV and EA communities in this study should, therefore, be considered as a conservative estimate, since the microalgal epilithic community is commonly depicted as being very efficient in storing and retaining nutrients [16]. Additionally, diatoms are an important component of the epiphytic communities [71,82,83] and accumulate a large quantity of BSi. For example, epiphytic diatoms on Cladophora glomerata can store up to ~15% BSi, a larger amount than the BSi content stored by C. glomerata itself [71].

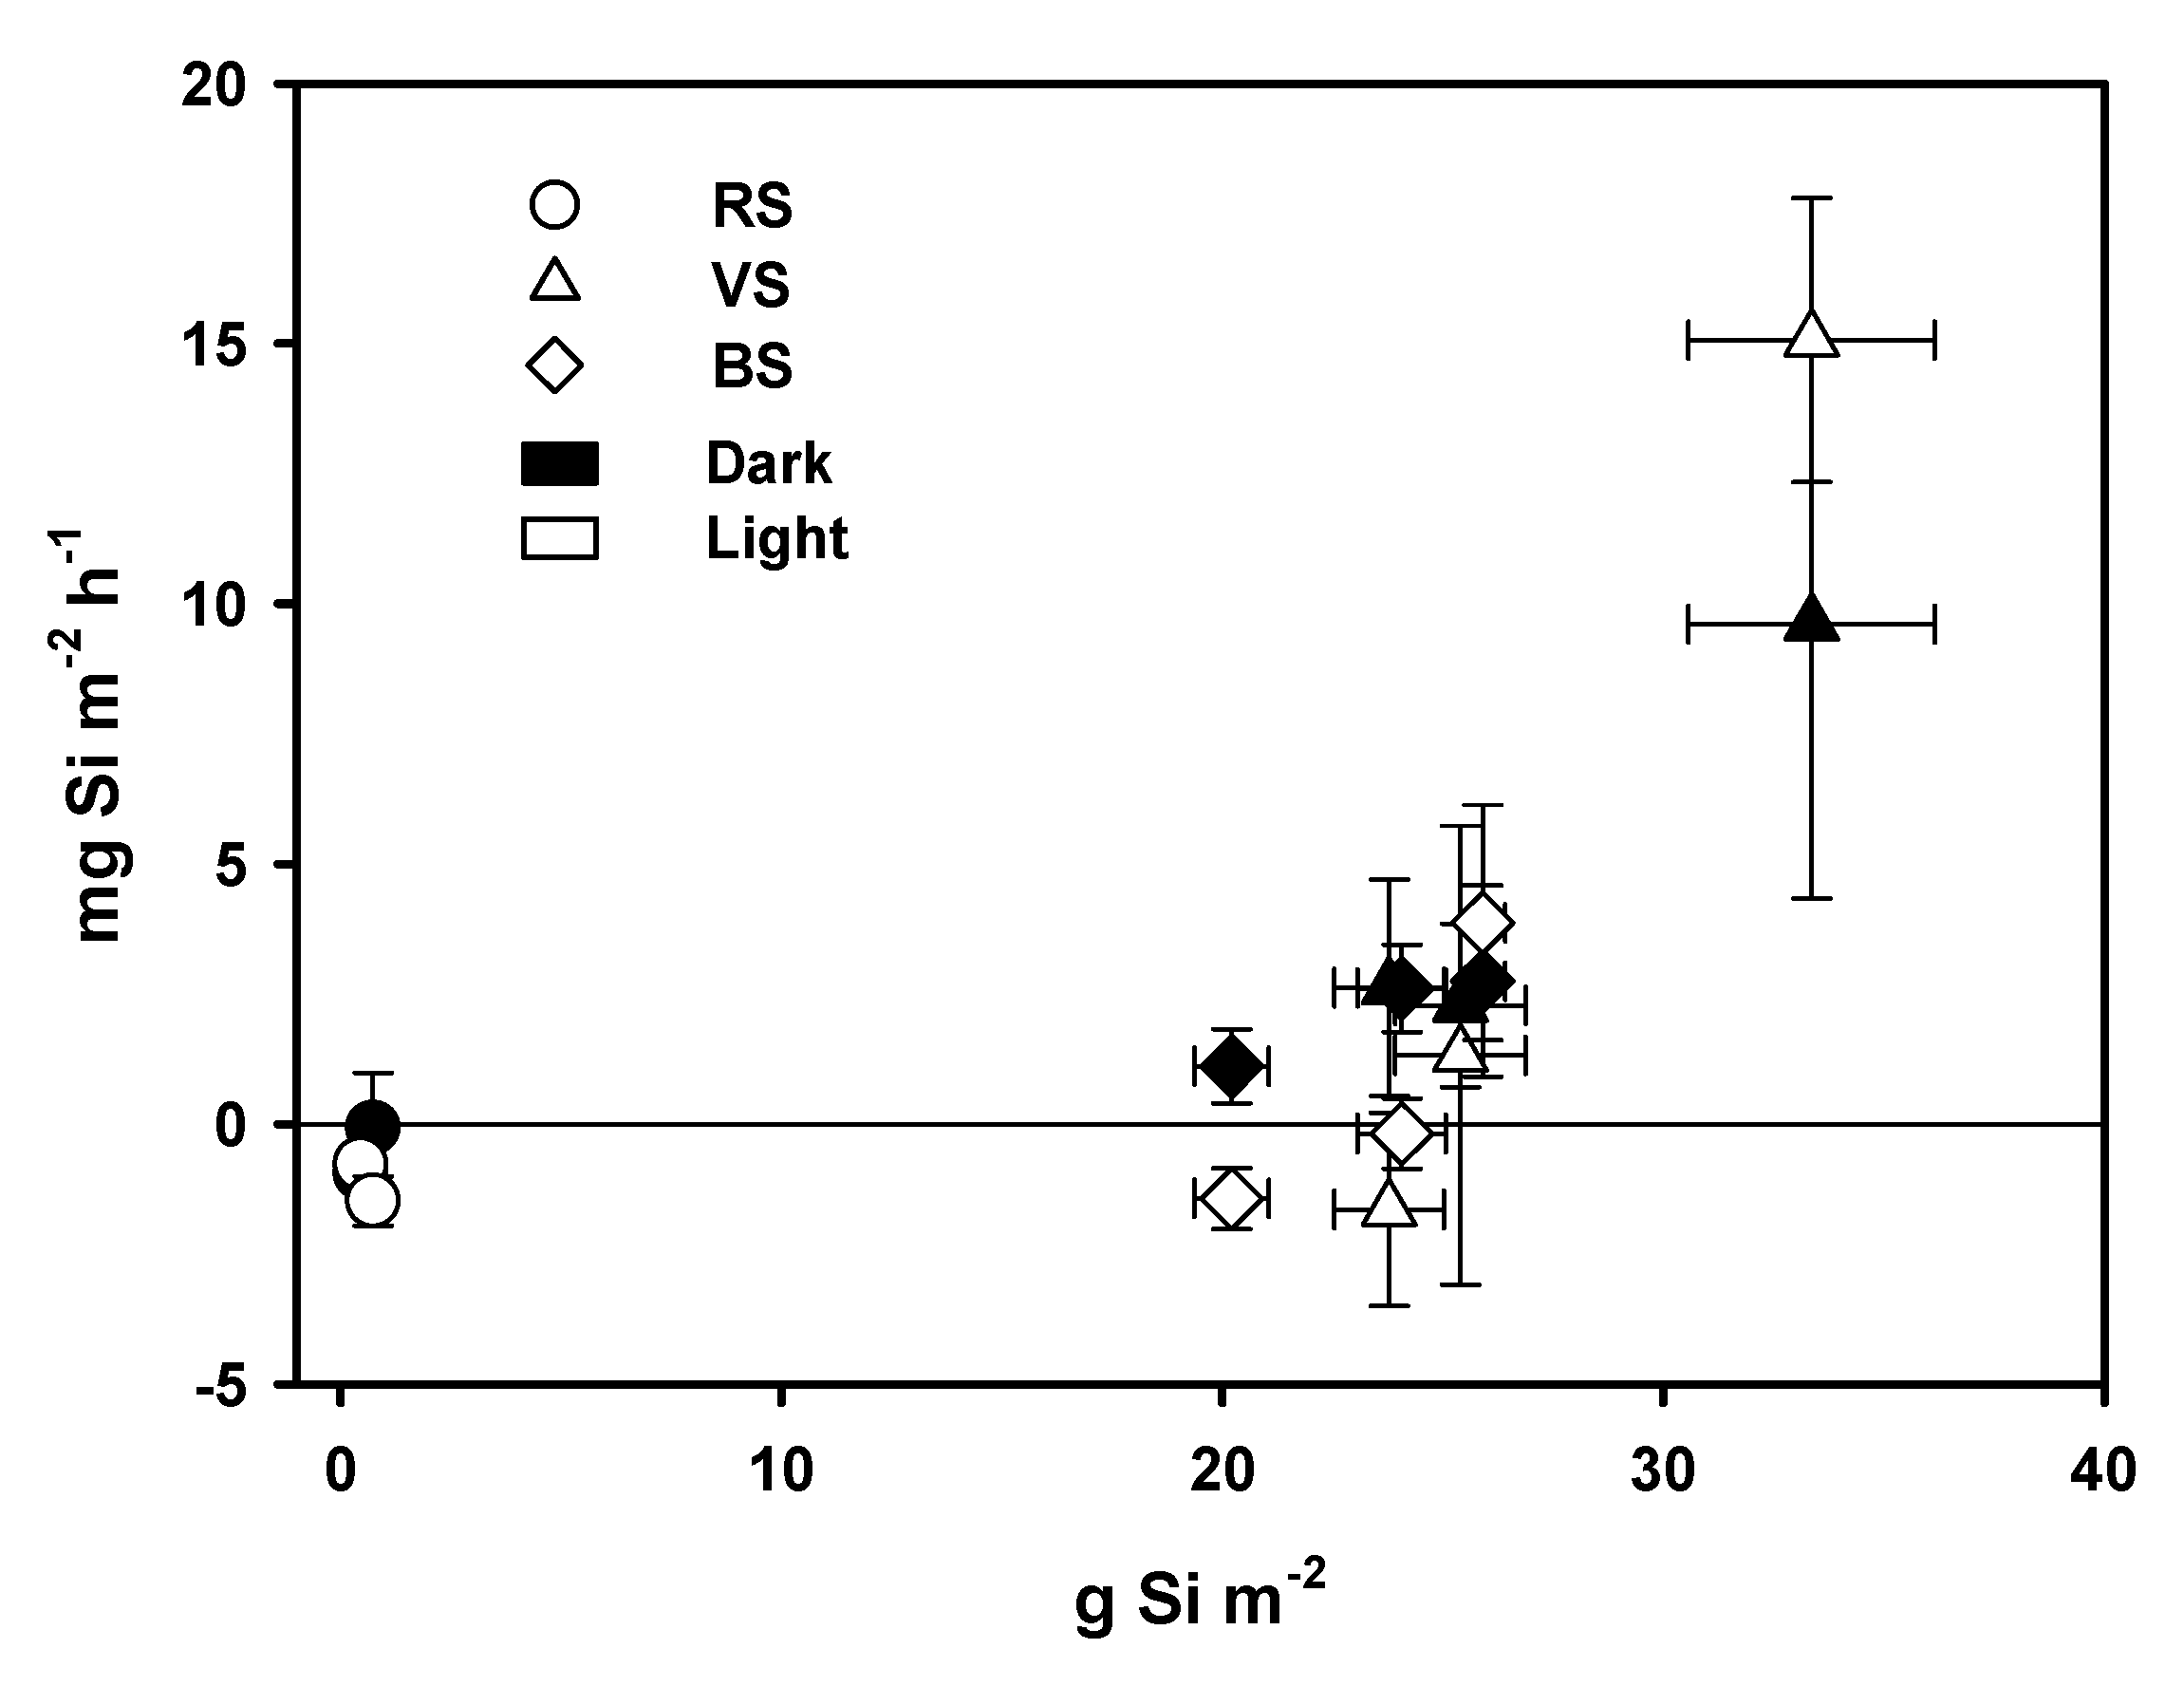
4.2. DSi, DIN, and SRP Fluxes across the Water Sediment Interface

Over ~4 months, from June to September, in the 0–2 cm sediment horizon in V. spiralis meadows, we estimated an average BSi decrease of 9.6 g Si m−2, representing the difference between the initial and final areal BSi concentrations (Table S1). In the same site, the average DSi release from sediment to the water column obtained from net daily fluxes integrated over the same time span (Figure 6) was 12.8 g Si m−2. At the BS site in the bare sediment, the BSi loss from the 0–2 cm horizon calculated in the same way was 5.7 g Si m−2, while the net DSi efflux for the same period was 3.9 g Si m−2. The concordance between the decrease of sedimentary BSi bulk and fluxes demonstrates how both vegetated and bare sediments were a net source of DSi, probably resulting from BSi dissolution, with the DSi efflux from the SAV meadow being almost three times greater than in bare sediment. These findings corroborate the hypothesis that SAV can mediate the DSi transport from pore water to the water column. Otherwise, silica fluxes were important when compared to overlying water: the DSi released at BS and VS sites represented 4.2% and 9.3% of DSi in the water column.
At both the VS and BS site, BSi decreased mainly during the early part of the season, with a negligible amount of efflux from sediment in late summer. Furthermore, the sedimentary DSi flux under both light and dark conditions was related to the sedimentary areal BSi (Figure 7). This pattern was probably due to the fast decay of detrital BSi from different sources, primarily SAV and its epiphytes, which are known to have a short half-life of just a few weeks [29]. It is likely that part of the lost BSi was taken up and retained by SAV, but then exported from the meadow as detached leaves [79]. The Si assimilation by MPB accounted for a slight BSi increase at the BS site (Figure 2) but, at <1 g m−2, it was not sufficient to compensate for the total BSi loss. In contrast, the rocky site accumulated BSi and the DSi flux was always directed from the water column to the epilithic algal community. DSi uptake at this site can be explained by the higher Si demand of the EA community, as evidenced by the higher BSi content in macroalgal tissues. However, despite the higher BSi tissue concentration, the total BSi bulk at this site was one order of magnitude lower than in SAV meadows and bare sediments as a consequence of lower plant biomass and sediment accumulation on rock surfaces.
To sum up, from late spring to late summer, the soft bottom in the littoral zone of Lake Iseo appeared to perform as a DSi source and, comparatively, as DIN and SRP sink, whereas the steep, rocky shore behaved as a DSi sink and DIN and SRP source. Such DIN and SRP patterns are not unexpected because in shallow and soft organic sediments, nitrate can be denitrified [14,35], while SRP can be either assimilated or co-precipitated [78,84,85]. Moreover, the high Si:N and Si:P ratios in macroalgal tissues can explain the Si consumption in RS, which exceeds N and especially P uptake.

4.3. The Fate of DSi in the Littoral Zone in Relation to Submerged Aquatic Vegetation

Human activity and its impact on lake ecosystems is mainly concentrated along the shore, where the coupling of terrestrial and aquatic systems is particularly evident [86]. Urban development, fluctuation of water levels, tourism, and pollution from diffuse or point sources contribute to the direct or indirect impairment of the structure and composition of benthic primary producer communities. Our results pose the question of whether modification of the littoral zone alters its filtering capacity and ultimately the availability of DSi in the water column.
The filtering capacity of littoral zones can be impaired by eutrophication and degenerative processes resulting from organic enrichment [69,87]. Like many other littoral zones, the southern part of Lake Iseo is under the influence of coastal runoff [88]. Such stressors can affect the health status of the extensive SAV meadows, which also undergo a great inter-annual variability [79]. Here, in soft, shallow sediments, meadows of V. spiralis, and to a much lesser extent N. marina, can produce dense biomass covering up to 100 ha, while zones with sparse SAV usually spread over an additional 300–400 ha [79]. In eutrophic waters, V. spiralis develops a large leaf mass, which is known to detach and drift due to waves and currents [78,89]. In the River Mincio, close to Lake Iseo, during the maximum growth phase, a very rapid leaf renewal was reported with plastochrone intervals of ≈3 days [78]. Under these conditions, the standing biomass is affected by a consistent leaf loss, resulting in a floating mass, which can also be detected in satellite images [79]. In addition, V. spiralis often undergoes uprooting, which exposes bare sediments to microphytobenthos colonization. Uprooting can be triggered by the organic enrichment of sediment, which stimulates oxygen consumption, exceeding the capacity of V. spiralis to supply oxygen to the rhizosphere [69]. The oxygen balance in the rhizosphere can be also impaired by epiphytes growing on leaves as they settle, thus accreting organic deposits on the surface sediment [90]. Simultaneously, the epiphyte cover can limit light accessibility to V. spiralis, negatively affecting photosynthesis and oxygen transport to roots, which triggers a negative feedback loop leading to plant dieback [69,87]. In 2017, in the littoral meadows of Lake Iseo, a bare sediment zone up to 67 ha was exposed as a result of uprooting, and was probably replaced by MPB [79]. In the light of this development, the question arose as to how this large-scale loss of SAV communities alters Si cycling at the land–water interface. When SAV was active, the DSi flux towards the water column was 12.8 g Si m−2 during the entire summer, while in the same zone and during the same period, the bare sediment released only 3.9 g Si m−2. The disappearance of pristine SAV communities could, therefore, potentially decrease DSi recycling and its availability in the water column, with direct repercussions on phytoplankton species composition, as Si shortage strongly impacts phytoplankton, driving the communities towards ones dominated by noxious or harmful algae [30].

5. Conclusions

One of the main findings of our study is that macro- and microalgae communities on rocky substrates behave as a DSi sink and are a source of inorganic nitrogen and phosphorus for the water column. In contrast, littoral sediments colonized by submerged aquatic vegetation and microphytobenthos behave as a DSi source for the water column and as a sink for inorganic nitrogen and phosphorus. Vallisneria spiralis, in particular, can transfer DSi from pore-water to the overlying water column through BSi synthesis and mineralization. This pathway can be a relevant DSi source, compensating for possible Si losses due to sedimentation and segregation in the deeper water mass. This is a key issue for oligomictic and, especially, meromictic lakes, which do not completely overturn. Two questions, however, remain unanswered: first, to what extent does the missing DSi influence lake productivity, especially in relation to the siliceous components of the phytoplankton community; and, second, how will the DSi budget downstream in the outflowing river be decreased as a result of this DSi shortage.
The capacity of SAV to simultaneously control both Si and N and P cycling depends on the health status of the community. This aspect should not be ignored when considering the anthropogenic impact from watersheds and lake surroundings. Recent studies have demonstrated that SAV meadows can suffer deterioration and leaf detachment at a greater rate than the expected physiological one, with even uprooting events taking place. A challenging issue is to assess what the fate of such organic matter bulk is, and how this can contribute to self-sustain lake deterioration.

Supplementary Materials

The following are available online at https://www.mdpi.com/2073-4441/11/10/2140/s1. Table S1. Features of organic matter (OM), biogenic silica (BSi), organic nitrogen (N), organic phosphorous (P), chlorophyll a (Chl-a) and phaeopigments (Pha) in the 0–2 cm sediment horizon at the three investigated sites (RS = rocky shores; VS = vegetated sediments; BS = bare sediments). All data represents the mean ± standard error (standard error in parenthesis), n.a. = not available. Table S2. Features of organic matter (OM), biogenic silica (BSi), organic nitrogen (N), organic phosphorous (P), chlorophyll a (Chl-a) and phaeopigments (Pha) in the 2–5 cm sediment horizon at the three investigated sites (RS = rocky shores; VS = vegetated sediments; BS = bare sediments). All data represents the mean ± standard error (standard error in parenthesis), n.a. = not available. Table S3. Conversion of sedimentary chlorophyll a (Chl-a) and phaeopigments (Pha) into BSi and organic P and N in the 0–2 cm sediment horizon at the three investigated sites (RS = rocky shores; VS = vegetated sediments; BS = bare sediments). All data represents the mean ± standard error (standard error in parenthesis), n.a. = not available.

Author Contributions

A.S., D.N. and P.V., conceived the experimental design, processed data, and wrote the manuscript. D.N. coordinated the experimental activity. D.N., A.S., D.C., D.L., R.B. contributed field and laboratory work. R.B. provided classification of benthic phanerogams and macroalgae.

Funding

This research is part of the ISEO (Improving the lake Status from Eutrophy to Oligotrophy) project and was made possible by CARIPLO foundation grant number 2015-0241. A.S. was partially supported by the EOMORES project (H2020, project number 730066), D.N. was partially supported by Lombardy Region within the project “Assessment of the limnological status of the Lombardy Region lakes and of nutrients loads formation in heavily exploited watersheds”.

Conflicts of Interest

The authors declare no conflict of interest.

References

  1. Redfield, A.; Ketchum, B.H.; Richards, F.A. The influence of organisms of the composition of seawater. In The Sea; Hill, M.N., Ed.; Wiley-Interscience: New York, NY, USA, 1963; Volume 2, pp. 26–77. [Google Scholar]
  2. Egge, J.K.; Aksnes, D.L. Silicate as regulating nutrient in phytoplankton competition. Mar. Ecol. Prog. Ser. 1992, 83, 281–289. [Google Scholar] [CrossRef]
  3. Struyf, E.; Conley, D.J. Emerging understanding of the ecosystem silica filter. Biogeochemistry 2012, 107, 9–18. [Google Scholar] [CrossRef]
  4. Frings, P.J.; Clymans, W.; Jeppesen, E.; Lauridsen, T.L.; Struyf, E.; Conley, D.J. Lack of steady-state in the global biogeochemical Si cycle: Emerging evidence from lake Si sequestration. Biogeochemistry 2014, 117, 225–277. [Google Scholar] [CrossRef]
  5. Vandevenne, F.; Struyf, E.; Clymans, W.; Meire, P. Agricultural silica harvest: Have human created a new loop in the global silica cycle? Front. Ecol. Environ. 2012, 10, 243–248. [Google Scholar] [CrossRef]
  6. Meybeck, M.; Vörösmarty, C. Fluvial filtering of land-to-ocean fluxes: From natural Holocene variations to Anthropocene. C. R. Geosci. 2005, 337, 107–123. [Google Scholar] [CrossRef]
  7. Harrison, J.A.; Maranger, R.J.; Alexander, R.B.; Giblin, A.E.; Jacinthe, P.; Mayorga, E.; Seitzinger, S.P.; Sobota, D.J.; Wollheim, W.M. The regional and global significance of nitrogen removal in lakes and reservoirs. Biogeochemistry 2009, 93, 143–157. [Google Scholar] [CrossRef]
  8. Struyf, E.; Conley, D.J. Silica: An essential nutrient in wetland biogeochemistry. Front. Ecol. Environ. 2009, 7, 88–94. [Google Scholar] [CrossRef]
  9. Verburg, P.; Horrox, J.; Chaney, E.; Rutherford, J.C.; Quinn, J.M.; Wilcock, R.J. Nutrient ratios, differential retention, and the effect on nutrient limitation in a deep oligotrophic lake. Hydrobiologia 2013, 718, 119–130. [Google Scholar] [CrossRef]
  10. Humborg, C.; Ittekkot, V.; Cociasu, A.; Bodungen, B.V. Effect of Danube river dam on Black Sea biogeochemistry and ecosystem structure. Nature 1997, 386, 385–388. [Google Scholar] [CrossRef]
  11. Ittekkot, V.; Humborg, C.; Schafer, P. Hydrological Alterations and Marine Biogeochemistry: A Silicate Issue? Bioscience 2000, 50, 776–782. [Google Scholar] [CrossRef]
  12. Scheffer, M. Ecology of Shallow Lakes, 1th ed.; Springer: Dordrecht, The Netherlands, 1997; Volume 22, pp. 1–357. [Google Scholar]
  13. Salmaso, N.; Anneville, O.; Straile, D. European large perialpine lakes under anthropogenic pressures and climate change: Present status, research gaps and future challenges. Hydrobiologia 2018, 824, 1–32. [Google Scholar] [CrossRef]
  14. Nizzoli, D.; Bartoli, M.; Azzoni, R.; Longhi, D.; Castaldelli, G.; Viaroli, P. Denitrification in a meromictic lake and its relevance to nitrogen flows within a moderately impacted forested catchment. Biogeochemistry 2018, 137, 143–161. [Google Scholar] [CrossRef]
  15. Viaroli, P.; Azzoni, R.; Bartoli, M.; Iacumin, P.; Salmaso, N.; Nizzoli, D. Persistence of meromixis and its effects on redox conditions and trophic status in Lake Idro (Southern Alps, Italy). Hydrobiologia 2018, 824, 51–69. [Google Scholar] [CrossRef]
  16. Vadeboncoeur, Y.; Steinman, A.D. Periphyton Function in Lake Ecosystems. Sci. World J. 2002, 2, 1449–1468. [Google Scholar] [CrossRef] [PubMed] [Green Version]
  17. Strayer, D.L.; Findlay, S.E.G. Ecology of freshwater shore zones. Aquat. Sci. 2010, 72, 127–163. [Google Scholar] [CrossRef] [Green Version]
  18. Zohary, T.; Ostrovsky, I. Ecological impacts of excessive water level fluctuations in stratified freshwater lakes. Inland Waters 2011, 1, 47–59. [Google Scholar] [CrossRef]
  19. Schoelynck, J.; Bal, K.; Backx, H.; Okruszko, T.; Meire, P.; Struyf, E. Silica uptake in aquatic and wetland macrophytes: A strategic choice between silica, lignin and cellulose? New Phytol. 2010, 186, 385–391. [Google Scholar] [CrossRef]
  20. Alfredsson, H.; Clymans, W.; Stadmark, J.; Conley, D.; Rousk, J. Bacterial and fungal colonization and decomposition of submerged plant litter: Consequences for biogenic. FEMS Microbiol. Ecol. 2016, 92, fiw011. [Google Scholar] [CrossRef]
  21. Borrelli, N.; Fernández, M.; Maris, S.; Osterrieth, M. Calcium and silica biomineralizations in leaves of eleven aquatic species of the Pampean Plain, Argentina. Aquat. Bot. 2011, 94, 29–36. [Google Scholar] [CrossRef]
  22. Carey, J.C.; Fulweiler, R.W. Nitrogen enrichment increases net silica accumulation in a temperate salt marsh. Limnol. Oceanogr. 2013, 58, 99–111. [Google Scholar] [CrossRef]
  23. Bartoli, M.; Nizzoli, D.; Viaroli, P. Microphytobenthos activity and fluxes at the sediment-water interface: Interactions and spatial variability. Aquat. Ecol. 2003, 37, 341–349. [Google Scholar] [CrossRef]
  24. Nizzoli, D.; Bartoli, M.; Cooper, M.; Welsh, D.T.; Underwood, G.J.C.; Viaroli, P. Implications for oxygen, nutrient fluxes and denitrification rates during the early stage of sediment colonisation by the polychaete Nereis spp. in four estuaries. Estuar. Coast. Shelf Sci. 2007, 75, 125–134. [Google Scholar] [CrossRef]
  25. Wetzel, R.G.; Likens, G.E. Limnological Analyses, 2nd ed.; Springer: New York, NY, USA, 1991; pp. 1–391. [Google Scholar]
  26. Den Heyer, C.; Kalff, J. Organic matter mineralization rates in sediments: A within- and among-lake study. Limnol. Oceanogr. 1998, 43, 695–705. [Google Scholar] [CrossRef]
  27. Bruesewitz, D.A.; Tank, J.L.; Hamilton, S.K. Incorporating spatial variation of nitrification and denitrification rates into whole-lake nitrogen dynamics. J. Geophys. Res. 2012, 117, 1–12. [Google Scholar] [CrossRef]
  28. Kelderman, P.; Lindeboom, H.J.; Klein, J. Light dependent sediment-water exchange of dissolved reactive phosphorus and silicon in a producing microflora mat. Hydrobiologia 1988, 159, 137–147. [Google Scholar] [CrossRef]
  29. Spears, B.M.; Carvalho, L.; Perkins, R.; Paterson, D.M. Effects of light on sediment nutrient flux and water column nutrient stoichiometry in a shallow lake. Water Res. 2008, 42, 977–986. [Google Scholar] [CrossRef]
  30. Glibert, P.M. Eutrophication, harmful algae and biodiversity—Challenging paradigms in a world of complex nutrient changes. Mar. Pollut. Bull. 2017, 124, 591–606. [Google Scholar] [CrossRef]
  31. Van Damme, S.; Frank, D.; Micky, T.; Olivier, B.; Eric, S.; Britta, G.; Oswald, V.C.; Patrick, M. Tidal exchange between a freshwater tidal marsh and an impacted estuary: The Scheldt estuary, Belgium. Estuar. Coast. Shelf Sci. 2009, 85, 197–207. [Google Scholar] [CrossRef]
  32. Carey, J.C.; Fulweiler, R.W. Salt marsh tidal exchange increases residence time of silica in estuaries. Limnol. Oceanogr. 2014, 59, 1203–1212. [Google Scholar] [CrossRef]
  33. Italian National Institute of Statistics (ISTAT). 2010. Available online: http://dati. istat.it/ (accessed on 21 April 2017).
  34. Salmaso, N.; Mosello, R. Limnological research in the deep southern subalpine lakes: Synthesis, directions and perspectives. Adv. Oceanogr. Limnol. 2010, 1, 29–66. [Google Scholar] [CrossRef]
  35. Nizzoli, D.; Welsh, D.T.; Longhi, D.; Viaroli, P. Influence of Potamogeton pectinatus and microphytobenthos on benthic metabolism, nutrient fluxes and denitrification in a freshwater littoral sediment in an agricultural landscape: N assimilation versus N removal. Hydrobiologia 2014, 737, 183–200. [Google Scholar] [CrossRef]
  36. Maasri, A.; Fayolle, S.; Gandouin, E.; Garnier, R.; Franquet, E. Epilithic chironomid larvae and water enrichment: Is larval distribution explained by epilithon quantity or quality? J. N. Am. Benthol. Soc. 2008, 27, 38–51. [Google Scholar] [CrossRef]
  37. Sigmon, D.E.; Cahoon, L.B. Comparative effects of benthic microalgae and phytoplankton on dissolved silica fluxes. Aquat. Microb. Ecol. 1997, 13, 275–284. [Google Scholar] [CrossRef]
  38. de Jonge, V.N. Fluctuations in the Organic Carbon to Chlorophyll a Ratios for Estuarine Benthic Diatom Populations. Mar. Ecol. Prog. Ser. 1980, 2, 345–353. [Google Scholar] [CrossRef]
  39. Kahlert, M. C:N:P ratios of freshwater benthic algae. Arch. Hydrobiol. Spec. Issue Adv. Limnol. 1998, 51, 105–114. [Google Scholar]
  40. Sundback, K.; Miles, A.; Goransson, E. Nitrogen fluxes, denitrification and the role of microphytobenthos in microtidal shallow-water sediments: An annual study. Mar. Ecol. Prog. Ser. 2000, 200, 59–76. [Google Scholar] [CrossRef]
  41. American Public Health Association (APHA). Standard Methods for the Examination of Water and Wastewaters, 20th ed.; APHA: Washington, DC, USA, 1998. [Google Scholar]
  42. Koroleff, F. Direct determination of ammonia in natural waters as indophenol blue. Information on techniques and methods for seawater analysis. ICES Interlab. Rep 1970, 3, 19–22. [Google Scholar]
  43. Valderrama, J.C. The simultaneous analysis of total nitrogen and total phosphorus in natural waters. Mar. Chem. 1981, 10, 109–122. [Google Scholar] [CrossRef]
  44. Golterman, H.L.; Clymo, R.S.; Ohnstand, M.A.M. Methods for Physical and Chemical Analysis of Freshwaters, 8th ed.; Blackwell: Oxford, UK, 1978; pp. 1–213. [Google Scholar]
  45. Lorenzen, C.J. Determination of chlorophyll and pheo-pigments: Spectrophotometric equations. Limnol. Oceanogr. Methods 1967, 12, 343–346. [Google Scholar] [CrossRef]
  46. Azzoni, R.; Nizzoli, D.; Bartoli, M.; Christian, R.R. Factors controlling benthic biogeochemistry in urbanized coastal systems: An example from Venice (Italy). Estuaries Coasts 2015, 38, 1016–1031. [Google Scholar] [CrossRef]
  47. Aspila, K.; Agemian, H.; Chau, A.S.Y. A semi-automated method for the determination of inorganic, organic and total phosphate in sediments. Analyst 1976, 101, 187–197. [Google Scholar] [CrossRef] [PubMed]
  48. Struyf, E.; Van Damme, S.; Gribsholt, B.; Middelburg, J.J.; Meire, P. Biogenic silica in tidal freshwater marsh sediments and vegetation (Schelde estuary, Belgium). Mar. Ecol. Prog. Ser. 2005, 303, 51–60. [Google Scholar] [CrossRef] [Green Version]
  49. DeMaster, D.J. The supply and accumulation of silica in the marine environment. Geochim. Cosmochim. Acta 1981, 45, 1715–1732. [Google Scholar] [CrossRef]
  50. Pinheiro, J.; Bates, D.; DebRoy, S.; Sarkar, D. Nlme: Linear and Nonlinear Mixed Effects Models 2016; R Package Version 3.1-126; R Foundation for Statistical Computing: Vienna, Austria, 2016. [Google Scholar]
  51. Lenth, R.; Singmann, H.; Love, J.; Buerkner, P.; Herve, M. Estimated Marginal Means, Aka Least-Squares Means 2018; R Package Version 1.3.1; R Foundation for Statistical Computing: Vienna, Austria, 2018. [Google Scholar]
  52. The R Core Team. R: A Language and Environment for Statistical Computing; R Foundation for Statistical Computing: Vienna, Austria, 2019. [Google Scholar]
  53. Gommes, R.; Muntau, H. The chemical composition of limnophytes in lake maggiore. Mem. Ist. Ital. Idrobiol. 1981, 38, 237–307. [Google Scholar]
  54. Xing, W.; Wu, H.; Hao, B.; Liu, G. Stoichiometric characteristics and responses of submerged macrophytes to eutrophication in lakes along the middle and lower reaches of the Yangtze River. Ecol. Eng. 2013, 54, 16–21. [Google Scholar] [CrossRef]
  55. Schaller, J.; Schoelynck, J.; Struyf, E.; Meire, P. Silicon Affects Nutrient Content and Ratios of Wetland Plants. Silicon 2016, 8, 479–485. [Google Scholar] [CrossRef]
  56. Schoelynck, J.; Struyf, E. Silicon in aquatic vegetation. Funct. Ecol. 2016, 30, 1323–1330. [Google Scholar] [CrossRef]
  57. Schoelynck, J.; Bal, K.; Puijalon, S.; Meire, P.; Struyf, E. Hydrodynamically mediated macrophyte silica dynamics. Plant Biol. 2012, 14, 997–1005. [Google Scholar] [CrossRef]
  58. Newberry, T.L.; Schelske, C.L. Biogenic silica record in the sediments of Little Round Lake, Ontario. Hydrobiologia 1986, 143, 293–300. [Google Scholar] [CrossRef]
  59. Conley, D.J.; Quigley, M.A.; Schelske, C.L. Silica and phosphorus flux from sediments: Importance of internal recycling in Lake Michigan. Can. J. Fish. Aquat. Sci. 1988, 45, 1030–1035. [Google Scholar] [CrossRef]
  60. House, W.A.; Denison, F.H.; Warwick, M.S.; Zhmud, B.V. Dissolution of silica and the development of concentration profiles in freshwater sediments. Appl. Geochem. 2000, 15, 425–438. [Google Scholar] [CrossRef]
  61. Friedrich, J.; Dinkel, C.; Grieder, E.; Radan, S.; Secrieru, D.; Steingruber, S.; Wehrli, B. Nutrient uptake and benthic regeneration in Danube Delta Lakes. Biogeochemistry 2003, 64, 373–398. [Google Scholar] [CrossRef]
  62. Ferris, J.A.; Lehman, J.T. Interannual variation in diatom bloom dynamics: Roles of hydrology, nutrient limitation, sinking, and whole lake manipulation. Water Res. 2007, 41, 2551–2562. [Google Scholar] [CrossRef] [PubMed]
  63. Hobbs, W.O.; Lalonde, S.V.; Vinebrooke, R.D.; Konhauser, K.O.; Weidman, R.P.; Graham, M.D.; Wolfe, A.P. Algal-silica cycling and pigment diagenesis in recent alpine lake sediments: Mechanisms and paleoecological implications. J. Paleolimnol. 2010, 44, 613–628. [Google Scholar] [CrossRef]
  64. Trachsel, M.; Grosjean, M.; Larocque-tobler, I.; Schwikowski, M.; Blass, A.; Sturm, M. Quantitative summer temperature reconstruction derived from a combined biogenic Si and chironomid record from varved sediments of Lake Silvaplana (south-eastern Swiss Alps) back to AD 1177. Quat. Sci. Rev. 2010, 29, 2719–2730. [Google Scholar] [CrossRef]
  65. Tallberg, P.; Lehtoranta, J.; Hietanen, S. Silicate Release from Sand-Manipulated Sediment Cores: Biogenic or Adsorbed Si? Silicon 2013, 5, 67–74. [Google Scholar] [CrossRef]
  66. Aigars, J.; Poik, R.; Dalsgaard, T.; Egl, E.; Jansons, M. Biogeochemistry of N, P and SI in the Gulf of Riga surface sediments: Implications of seasonally changing factors. Cont. Shelf Res. 2015, 105, 112–120. [Google Scholar] [CrossRef]
  67. Tallberg, P.; Heiskanen, A.S.; Niemistö, J.; Hall, P.O.J.; Lehtoranta, J. Are benthic fluxes important for the availability of Si in the Gulf of Finland? J. Mar. Syst. 2017, 171, 89–100. [Google Scholar] [CrossRef] [Green Version]
  68. Racchetti, E.; Bartoli, M.; Soana, E.; Longhi, D.; Christian, R.R.; Pinardi, M.; Viaroli, P. Influence of hydrological connectivity of riverine wetlands on nitrogen removal via denitrification. Biogeochemistry 2011, 103, 335–354. [Google Scholar] [CrossRef]
  69. Soana, E.; Naldi, M.; Bonaglia, S.; Racchetti, E.; Castaldelli, G.; Bruchert, V.; Viaroli, P.; Bartoli, M. Benthic nitrogen metabolism in a macrophyte meadow (Vallisneria spiralis L.) under increasing sedimentary organic matter loads. Biogeochemistry 2015, 124, 387–404. [Google Scholar] [CrossRef]
  70. Carrick, H.J.; Lowe, R.L. Nutrient limitation of benthic algae in Lake Michigan: The role of silica. J. Phycol. 2007, 43, 228–234. [Google Scholar] [CrossRef]
  71. Malkin, S.Y.; Sorichetti, R.J.; Wiklund, J.A.; Hecky, R.E. Seasonal abundance, community composition, and silica content of diatoms epiphytic on Cladophora glomerata. J. Gt. Lakes Res. 2009, 35, 199–205. [Google Scholar] [CrossRef]
  72. Cao, Y.; Zhang, N.; Sun, J.; Li, W. Responses of periphyton on non-plant substrates to different macrophytes under various nitrogen concentrations: A mesocosm study. Aquat. Bot. 2019, 154, 53–59. [Google Scholar] [CrossRef]
  73. Müller, C. Uptake and accumulation of some nutrient elements in relation to the biomass of an epilithic community. In Periphyton of Freshwater Ecosystems; Springer: Dordrecht, The Netherlands, 1983; Volume 17, pp. 147–151. [Google Scholar]
  74. Riber, H.H.; Sørensen, J.P.; Kowalczewski, A. Exchange of phosphorus between water, macrophytes and epiphytic periphyton in the littoral of Mikolajskie Lake, Poland. In Periphyton of Freshwater Ecosystems; Springer: Dordrecht, The Netherlands, 1983; Volume 17, pp. 235–243. [Google Scholar]
  75. Swift, D.; Nicholas, R. Periphyton and Water Quality Relationships in the Everglades Water Conservation Areas, 1978–1982; South Florida Water Management District Tech. Pub.: West Palm Beach, FL, USA, 1987; Volume 87-2, p. 44. [Google Scholar]
  76. Grimshaw, H.J.; Rosen, M.; Swift, D.R.; Rodberg, K.; Noel, J.M. Marsh phosphorus concentrations, phosphorus content and species composition of Everglades periphyton communities. Arch. Hydrobiol. 1993, 128, 257–276. [Google Scholar]
  77. Hillebrand, H.; Sommer, U. The nutrient stoichiometry of benthic microalgal growth: Redfield proportions are optimal. Limnol. Oceanogr. 1999, 44, 440–446. [Google Scholar] [CrossRef]
  78. Pinardi, M.; Bartoli, M.; Longhi, D.; Marzocchi, U.; Laini, A.; Ribaudo, C.; Viaroli, P. Benthic metabolism and denitrification in a river reach: A comparison between vegetated and bare sediments. J. Limnol. 2009, 68, 133–145. [Google Scholar] [CrossRef]
  79. Ghirardi, N.; Bolpagni, R.; Bresciani, M.; Valerio, G.; Pilotti, M.; Giardino, C. Spatiotemporal Dynamics of Submerged Aquatic Vegetation in a Deep Lake from Sentinel-2 Data. Water 2019, 11, 563. [Google Scholar] [CrossRef]
  80. Toporowska, M.; Pawlik-Skowrońska, B.; Wojtal, A.Z. Epiphytic algae on Stratiotes aloides L., Potamogeton lucens L., Ceratophyllum demersum L. and Chara spp. in a macrophyte-dominated lake. Oceanol. Hydrobiol. Stud. 2008, 37, 51–63. [Google Scholar] [CrossRef]
  81. Pettit, N.E.; Ward, D.P.; Adame, M.F.; Valdez, D.; Bunn, S.E. Influence of aquatic plant architecture on epiphyte biomass on a tropical river floodplain. Aquat. Bot. 2016, 129, 35–43. [Google Scholar] [CrossRef]
  82. Burkholder, J.M.; Wetzel, R.G. Microbial colonization on natural and artificial macrophytes in a phosphorus-limited, hardwater lake. J. Phycol. 1898, 25, 55–65. [Google Scholar] [CrossRef]
  83. Cattaneo, A.; Galanti, G.; Gentinetta, S.; Romo, S. Epiphytic algae and macroinvertebrates on submerged and floating-leaved macrophytes in an Italian lake. Freshw. Biol. 1998, 39, 725–740. [Google Scholar] [CrossRef]
  84. Moore, P.A.; Reddy, K.R.; Fisher, M.M. Phosphorus Flux between Sediment and Overlying Water in Lake Okeechobee, Florida: Spatial and Temporal Variations. J. Environ. Qual. 1998, 1439, 1428–1439. [Google Scholar] [CrossRef]
  85. Reynolds, C.S.; Davies, P.S. Sources and bioavailability of phosphorus fractions in freshwaters: A British perspective. Biol. Rev. 2001, 76, 27–64. [Google Scholar] [CrossRef] [PubMed]
  86. Francis, T.B.; Schindler, D.E.; Fox, J.M.; Seminet-reneau, E. Effects of Urbanization on the Dynamics of Organic Sediments in Temperate Lakes. Ecosystems 2007, 10, 1057–1068. [Google Scholar] [CrossRef]
  87. Viaroli, P.; Bartoli, M.; Giordani, G.; Naldi, M.; Orfanidis, S.; Zaldivar, J.M. Community shifts, alternative stable states, biogeochemical controls and feedbacks in eutrophic coastal lagoons: A brief overview. Aquat. Conserv Mar. Freshw. Ecosyst. 2008, 18, 105–117. [Google Scholar] [CrossRef]
  88. Barone, L.; Pilotti, M.; Valerio, G.; Balistrocchi, M.; Milanesi, L.; Chapra, S.C.; Nizzoli, D. Analysis of the residual nutrient load from a combined sewer system in a watershed of a deep Italian lake. J. Hydrol. 2019, 571, 202–213. [Google Scholar] [CrossRef]
  89. Donnermeyer, G.N.; Smart, M.M. The biomass and nutritive potential of Vallisneria americana Michx in navigation pool 9 of the upper Mississippi river. Aquat. Bot. 1985, 22, 33–44. [Google Scholar] [CrossRef]
  90. Viaroli, P.; Bartoli, M.; Bondavalli, C.; Christian, R.R.; Giordani, G.; Naldi, M. Macrophyte communities and their impact on benthic fluxes of oxygen, sulphide and nutrients in shallow eutrophic environments. Hydrobiologia 1996, 329, 105–119. [Google Scholar] [CrossRef]
Figure 1. Location of Lake Iseo (left), and a detailed map of the lake (right) showing the three sampling sites (RS = rocky shore; VS = vegetated sediment; BS = bare sediment).
Water 11 02140 g001
Figure 2. Biogenic silica (BSi), nitrogen (N), and phosphorus (P) stocks in the primary producer biomass in the three sampling periods. Error bars represent standard error (n = 6). Legend: RS = rocky shores; VS = vegetated sediments; BS = bare sediments. At site BS, BSi, N, and P were estimated from sedimentary Chl-a.
Water 11 02140 g002
Figure 3. Light and dark oxygen fluxes (O2) and gross primary production (GPP) measured in the three sampling sites in the different sampling dates. Error bars represent standard error (n = 6). Legend: RS = rocky shores; VS = vegetated sediments; BS = bare sediments.
Water 11 02140 g003
Figure 4. Light and dark fluxes of dissolved silica (DSi), soluble reactive phosphorus (SRP), nitrate and nitrite (N-NOx), and ammonium (N-NH4+) measured in the three sampling sites at the different dates. Error bars represent standard error (n = 6). Legend: RS = rocky shores; VS = vegetated sediments; BS = bare sediments.
Water 11 02140 g004
Figure 5. Average DSi:DIN (a) and DSi:SRP (b) ratios of benthic fluxes under light and dark conditions in the three sampling sites. Error bars represent standard error (n = 18). Legend: RS = rocky shores; VS = vegetated sediments; BS = bare sediments.
Water 11 02140 g005
Figure 6. Average water column concentrations, main fluxes, and compartments of Si, N, and P. Fluxes are reported as g m−2 d−1, while water concentrations, sediment, microphytobenthos (MPB), epilithic matter (EM), filamentous matter (FM), leaves and roots contents are reported as g m−2. Standard error is shown in parenthesis. The size of numbers and letters is proportional to flux and stock extent.
Water 11 02140 g006
Figure 7. Average Si content in sediments and Si benthic fluxes under light and dark conditions in the three sampling sites. Error bars represent standard error.
Water 11 02140 g007
Table 1. Main features of Lake Iseo and its watershed.
Watershed
Area, lake included (km2)1842
Mean altitude (m asl)1429
Lake
Altitude (m asl)185
Volume (km3)7.6
Maximum depth (m)258
Average depth (m)123
Total Area (km2)60.9
Littoral Area (km2)5.0
Theoretical renewal time (years)4.5
Table 2. Dissolved silica (DSi), soluble reactive phosphorus (SRP), ammonium (N-NH4+), nitrate and nitrite (N-NOx) and dissolved inorganic nitrogen (DIN) concentration and DSi:DIN, DSi:SRP and DIN:SRP molar ratios in the water column at the three investigated sites (RS = rocky shores; VS = vegetated sediments; BS = bare sediments). All data represents the mean of three replicates (standard error in parenthesis).
Water CharacteristicsRSVSBS
EarlyMidLateEarlyMidLateEarlyMidLate
DSi
(µg Si L−1)
57
(1)
130
(5)
225
(24)
404
(20)
400
(39)
494
(13)
137
(10)
238
(10)
490
(13)
SRP
(µg P L−1)
2
(0)
5
(1)
2
(0)
4
(1)
4
(0)
2
(0)
5
(1)
5
(1)
2
(0)
N-NOx
(µg N L−1)
592
(4)
509
(3)
538
(6)
426
(7)
376
(2)
442
(8)
497
(8)
420
(6)
485
(8)
N-NH4+
(µg N L−1)
56
(4)
85
(3)
63
(3)
100
(4)
94
(6)
89
(3)
74
(4)
55
(3)
54
(5)
DIN
(µg N L−1)
648
(5)
595
(4)
601
(6)
526
(4)
470
(6)
531
(9)
571
(9)
476
(6)
539
(10)
DSi:DIN
(mol:mol)
0.04
(0.00)
0.11
(0.00)
0.19
(0.02)
0.39
(0.02)
0.42
(0.04)
0.47
(0.01)
0.12
(0.01)
0.25
(0.01)
0.46
(0.01)
DSi:SRP
(mol:mol)
38
(3)
31
(4)
109
(13)
148
(20)
155
(26)
309
(29)
36
(5)
65
(5)
262
(32)
DIN:SRP
(mol:mol)
863
(88)
293
(38)
596
(42)
395
(55)
348
(44)
664
(57)
307
(40)
262
(18)
564
(56)
Table 3. Content of organic matter (OM), biogenic silica (BSi), total nitrogen (N), organic phosphorous (P), chlorophyll a (Chl-a), and phaeopigments (Pha) and BSi:N, BSi:P and N:P molar ratios in sediment at the three investigated sites (RS = rocky shores; VS = vegetated sediments; BS = bare sediments). All data represents the mean ± standard error (standard error in parenthesis), n.a. = not available.
Sediment CharacteristicsRSVSBS
EarlyMidLateEarlyMidLateEarlyMidLate
OM
(% DW)
n.a.7.238.724.46
(0.33)
4.00
(0.27)
4.30
(0.04)
2.57
(0.15)
2.57
(0.05)
2.78
(0.23)
BSi
(% DW)
n.a.0.78
(0.02)
1.08
(0.03)
0.89
(0.04)
0.72
(0.05)
0.82
(0.06)
0.54
(0.01)
0.46
(0.02)
0.41
(0.03)
P
(% DW)
n.a.0.100.120.01
(0.00)
0.01
(0.00)
0.01
(0.00)
0.01
(0.00)
0.01
(0.00)
0.01
(0.00)
N
(% DW)
n.a.0.420.580.32
(0.01)
0.31
(0.00)
0.35
(0.00)
0.21
(0.01)
0.20
(0.01)
0.21
(0.01)
BSi:N
(mol:mol)
n.a.0.980.721.37
(0.01)
1.16
(0.08)
1.16
(0.06)
1.27
(0.03)
1.19
(0.05)
0.98
(0.05)
BSi:P
(mol:mol)
n.a.9.077.4977
(1)
66
(4)
67
(3)
91
(4)
79
(2)
56
(6)
N:P
(mol:mol)
n.a.9.2310.3557
(2)
58
(2)
58
(2)
72
(4)
66
(1)
57
(3)
Chl-a
(mg m−2)
n.a.21
(3)
42
(7)
141
(5)
190
(23)
196
(22)
193
(34)
220
(15)
288
(12)
Pha
(mg m−2)
n.a.5
(1)
7
(1)
146
(1)
97
(10)
136
(12)
55
(9)
40
(3)
79
(4)
Table 4. Biomass (B, g DW m−2), biogenic silica (BSi, %), nitrogen (N, %) and phosphorus (P, %) content and BSi:N, BSi:P and N:P molar ratios in filamentous algae and macrophytes (leaves and roots). All data represents mean ± standard error (standard error in parenthesis), n.a. = not available.
Primary Producer Seasonal phaseBBSiNPBSi:NBSi:PN:P
Filamentous algae Early62 (19)3.36 (1.03)0.86 (0.26)0.07 (0.02)0.986263
Mid48 (21)1.41 (0.40)0.23 (0.06)0.01 (0.00)1.5414191
Late30 (22)0.75 (0.20)0.19 (0.05)0.01 (0.00)0.98106108
Vallisneria spiralisLeavesEarly99 (36)0.723.640.220.10437
Mid206 (16)1.002.350.130.21940
Late117 (11)0.912.450.100.191054
RootsEarly60 (22)0.482.920.160.08340
Mid125 (9)0.502.610.170.10334
Late70 (13)0.333.320.160.05246
Najas marinaLeavesEarly4n.a.n.a.n.a.n.a.n.a.n.a.
Mid97 (27)0.642.820.270.11323
Late54 (17)0.851.950.150.22629
RootsEarlyn.a.n.a.n.a.n.a.n.a.n.a.n.a.
Mid15 (4)0.611.830.120.17634
Laten.a.n.a.n.a.n.a.n.a.n.a.n.a.
Table 5. Summary of the results of two-way generalized least square (GLS) models of benthic oxygen (O2), dissolved silica (DSi), soluble reactive phosphorus (SRP), nitrate and nitrite (N-NOx), ammonium (N-NH4+) and dissolved inorganic nitrogen (DIN) fluxes. Significant (p < 0.05) outcomes are highlighted in bold.
Source of VariationDFO2DSiSRPN-NOxN-NH4+DIN
Site2<0.001<0.001<0.050<0.001<0.001<0.001
Condition1<0.0010.1820.8110.224<0.001<0.001
Sampling date20.2100.1850.263<0.001<0.0010.109
Site*Condition2<0.0010.7030.3040.6990.0670.601
Site* Sampling date4<0.001<0.0010.4670.346<0.0010.946
Condition* Sampling date2<0.0010.1080.5870.488<0.001<0.010
Site*Condition* Sampling date4<0.0010.5500.533<0.0010.879<0.050
Table 6. Sedimentary DSi fluxes (µg Si m−2 h−1) and BSi content (%) in sediments of different aquatic ecosystems. Legend: MPB = microphytobenthos, bare = bare sediment, algal = benthic macroalgae.
ReferenceSystemDepth
(m)
ConditionDSi Flux
(mg Si m−2 h−1)
BSi
(%)
Method *
[58]lake Bare2.3–4.610.2–15.91
[28]lake3MPB−1.6 to 11.5
[59]lake Bare2.6–11.81.0–22.02
[60]river Bare1.0–4.0
[23]coastal lagoon MPBlight −0.01 ± 0.08
dark 1.40 ± 0.20
[61]coastal lagoon2–4Bare1.2–29.9
Uptake3.8–28.7
[62]lake5–10Bare3.1 ± 0.31.71
[29]lake3.9MPBlight −2.3–21.9
dark −2.0–15.13
[63]lake20Bare0.050.4–1.51
[64]lake Bare0.1–3.40.2–1.41
[65]coastal33Algal0.28–3.36
[66]coastal44–45Bare1.1–2.9
[67]costal2–7Bare0.7–5.7
* Method used to analyze BSi: Na2CO3 (1) and NaOH (2).

