Analysis of Long-Term Water Level Variations in Qinghai Lake in China
by
 , ,
, ,
Jianmei Fang
1, 
Guijing Li
1,
Matteo Rubinato
2 ,
,
Guoqing Ma
3,
Jinxing Zhou
1,
Guodong Jia
1,
Xinxiao Yu
1,* and
Henian Wang
4 1
College of Soil and Water Conservation, Beijing Forestry University, Beijing 100083, China
2
School of Energy, Construction and Environment & Centre for Agroecology, Water and Resilience, Coventry University, Coventry CV1 5FB, UK
3
World Bank Loan Project Management Center of State Forestry and Grassland Administration, Beijing 100714, China
4
Institute of Wetland Research, Chinese Academy of Forestry, Beijing 100091, China
*
Author to whom correspondence should be addressed.
Water 2019, 11(10), 2136; https://doi.org/10.3390/w11102136
Submission received: 17 September 2019
/
Revised: 4 October 2019
/
Accepted: 9 October 2019
/
Published: 14 October 2019
(This article belongs to the Special Issue Advances in Modelling and Prediction on the Impact of Human Activities and Extreme Events on Environments)
Abstract
:Qinghai Lake is the largest inland saline lake on the Tibetan Plateau. Climate change and catchment modifications induced by human activities are the main drivers playing a significant role in the dramatic variation of water levels in the lake (Δh); hence, it is crucial to provide a better understanding of the impacts caused by these phenomena. However, their respective contribution to and influence on water level variations in Qinghai Lake are still unclear and without characterizing them, targeted measures for a more efficient conservation and management of the lake cannot be implemented. In this paper, data monitored during the period 1960–2016 (e.g., meteorological and land use data) have been analyzed by applying multiple techniques to fill this gap and estimate the contribution of each parameter recorded to water level variations (Δh). Results obtained have demonstrated that the water level of Qinghai Lake declined between 1960 and 2004, and since then has risen continuously and gradually, due to the changes in evaporation rates, precipitation and consequently surface runoff associated with climate change effects and catchment modifications. The authors have also pinpointed that climate change is the main leading cause impacting the water level in Qinghai Lake because results demonstrated that 93.13% of water level variations can be attributable to it, while the catchment modifications are responsible for 6.87%. This is a very important outcome in the view of the fact that global warming clearly had a profound impact in this sensitive and responsive region, affecting hydrological processes in the largest inland lake of the Tibetan Plateau.
1. Introduction
The observed climate changes [1] had a significant impact on physical and natural processes on Earth during the past decade. The IPCC’s (Intergovernmental Panel on Climate Change) latest report pointed out that if global warming will continue at its current rate, it could reach an increase in temperature up to 1.5 °C between 2030 and 2052 [2], causing the rising of sea levels as well as warming of water surfaces in oceans and lakes. Furthermore, human activities also had a strong impact on hydrological processes considering increased water consumption and situations of water shortage recorded around the world during the last decade. Hence, recent research focused on the impact of climate change and human activities on hydrological processes because this topic was identified by many researchers as a priority [3,4] when planning for the future and making new developments more sustainable. Lake ecosystems usually provide indicators (i.e., water temperature, water levels, dissolved organic carbon (DOC)) of climate change, either directly or indirectly [5]. Recently, many studies have also been completed to investigate what has caused water level variations of lakes, such as the ones conducted on (i) the North American Great Lakes [6,7,8]; (ii) Lake Chad [9]; (iii) the Salton Sea [10] in the United States; (iv) Lake Lisan, Dead Sea rift [11]; and (v) Poyang Lake in China [12,13,14]. Summarizing the results achieved to date, hydrological conditions of each lake are affected by the lake’s location, upstream boundaries, geographical climate and specific human activities undertaken on it such as residential developments, industry and irrigation tasks; hence, it is necessary to figure out the key factors that affect water levels to develop methods and procedures that can regulate those that alter or alleviate hydrological extreme processes in lakes.
The Tibetan Plateau (TP), known as “the roof of the world”, “the third pole” and “the water tower of Asia”, is the largest plateau in China and the highest plateau in the world [5,15], and it is considered the perfect location to identify the effects of global climate change [16,17,18]. Qinghai Lake is the largest inland saline lake on TP, and it has attracted extensive attention due to its special geographical location and its wide area characterized by fragile ecosystems. Over the last years, researchers have reported a drastic change in water levels in Qinghai Lake, indicating that the ecological environment around it is undergoing a rapid evolution [19,20,21,22]. Typically, inland closed lakes with no outlet streams are ideal to distinguish hydrologic processes and phenomena affecting the water balance because changes in water levels can result from limited factors such as precipitation, evaporation, groundwater infiltration [23,24,25] and the presence of specific vegetation [19].
The most effective way to estimate water levels in lakes is by applying the water-balance equation model, where the gain or loss of water directly reflects the changes in water levels [26,27]. Multiple inland lakes, due to the lack of funding and therefore resilient and accurate equipment to monitor basic data, are considered not appropriate to identify and quantify objectively the factors affecting the water balance. Nevertheless, Qinghai Lake, being a closed one with inlet river streams and without outlet river streams, is an ideal place to study, especially having the availability of meteorological and hydrological monitored data. To date, the study conducted by Li et al. [28] calculated the main water balance estimation of Qinghai Lake, while Cui et al. [20] preliminarily analyzed the climatic factors that affect the water level variations of Qinghai Lake. Despite this, there is still a need for new studies to fully distinguish and assess the relative contribution of anthropogenic activities and climate variability to water level variations in Qinghai Lake and their impacts on the corresponding water balance.
This paper present the analysis of water level variations recorded in Qinghai Lake during the last 57 years, examining the evolution and interpreting the impacts of driving factors to better understand the hydrological process of this inland lake basin in the northeast of TP, enhancing the present understanding of climatic variations on surface changes to provide a reference for local and regional water management.
The paper is organized as follows: Section 2 presents the description of the study area, introducing the data monitored and describing the statistical analysis used. Section 3 includes the estimation of long-term variations in Qinghai Lake as well as the impacts of climate change and catchment modifications for inflow runoff to Qinghai Lake. Section 4 provides a discussion of the results obtained, and Section 5 produces a brief summary and concluding remarks of the whole study.
2. Materials and Methods
2.1. Study Area and Data Availability
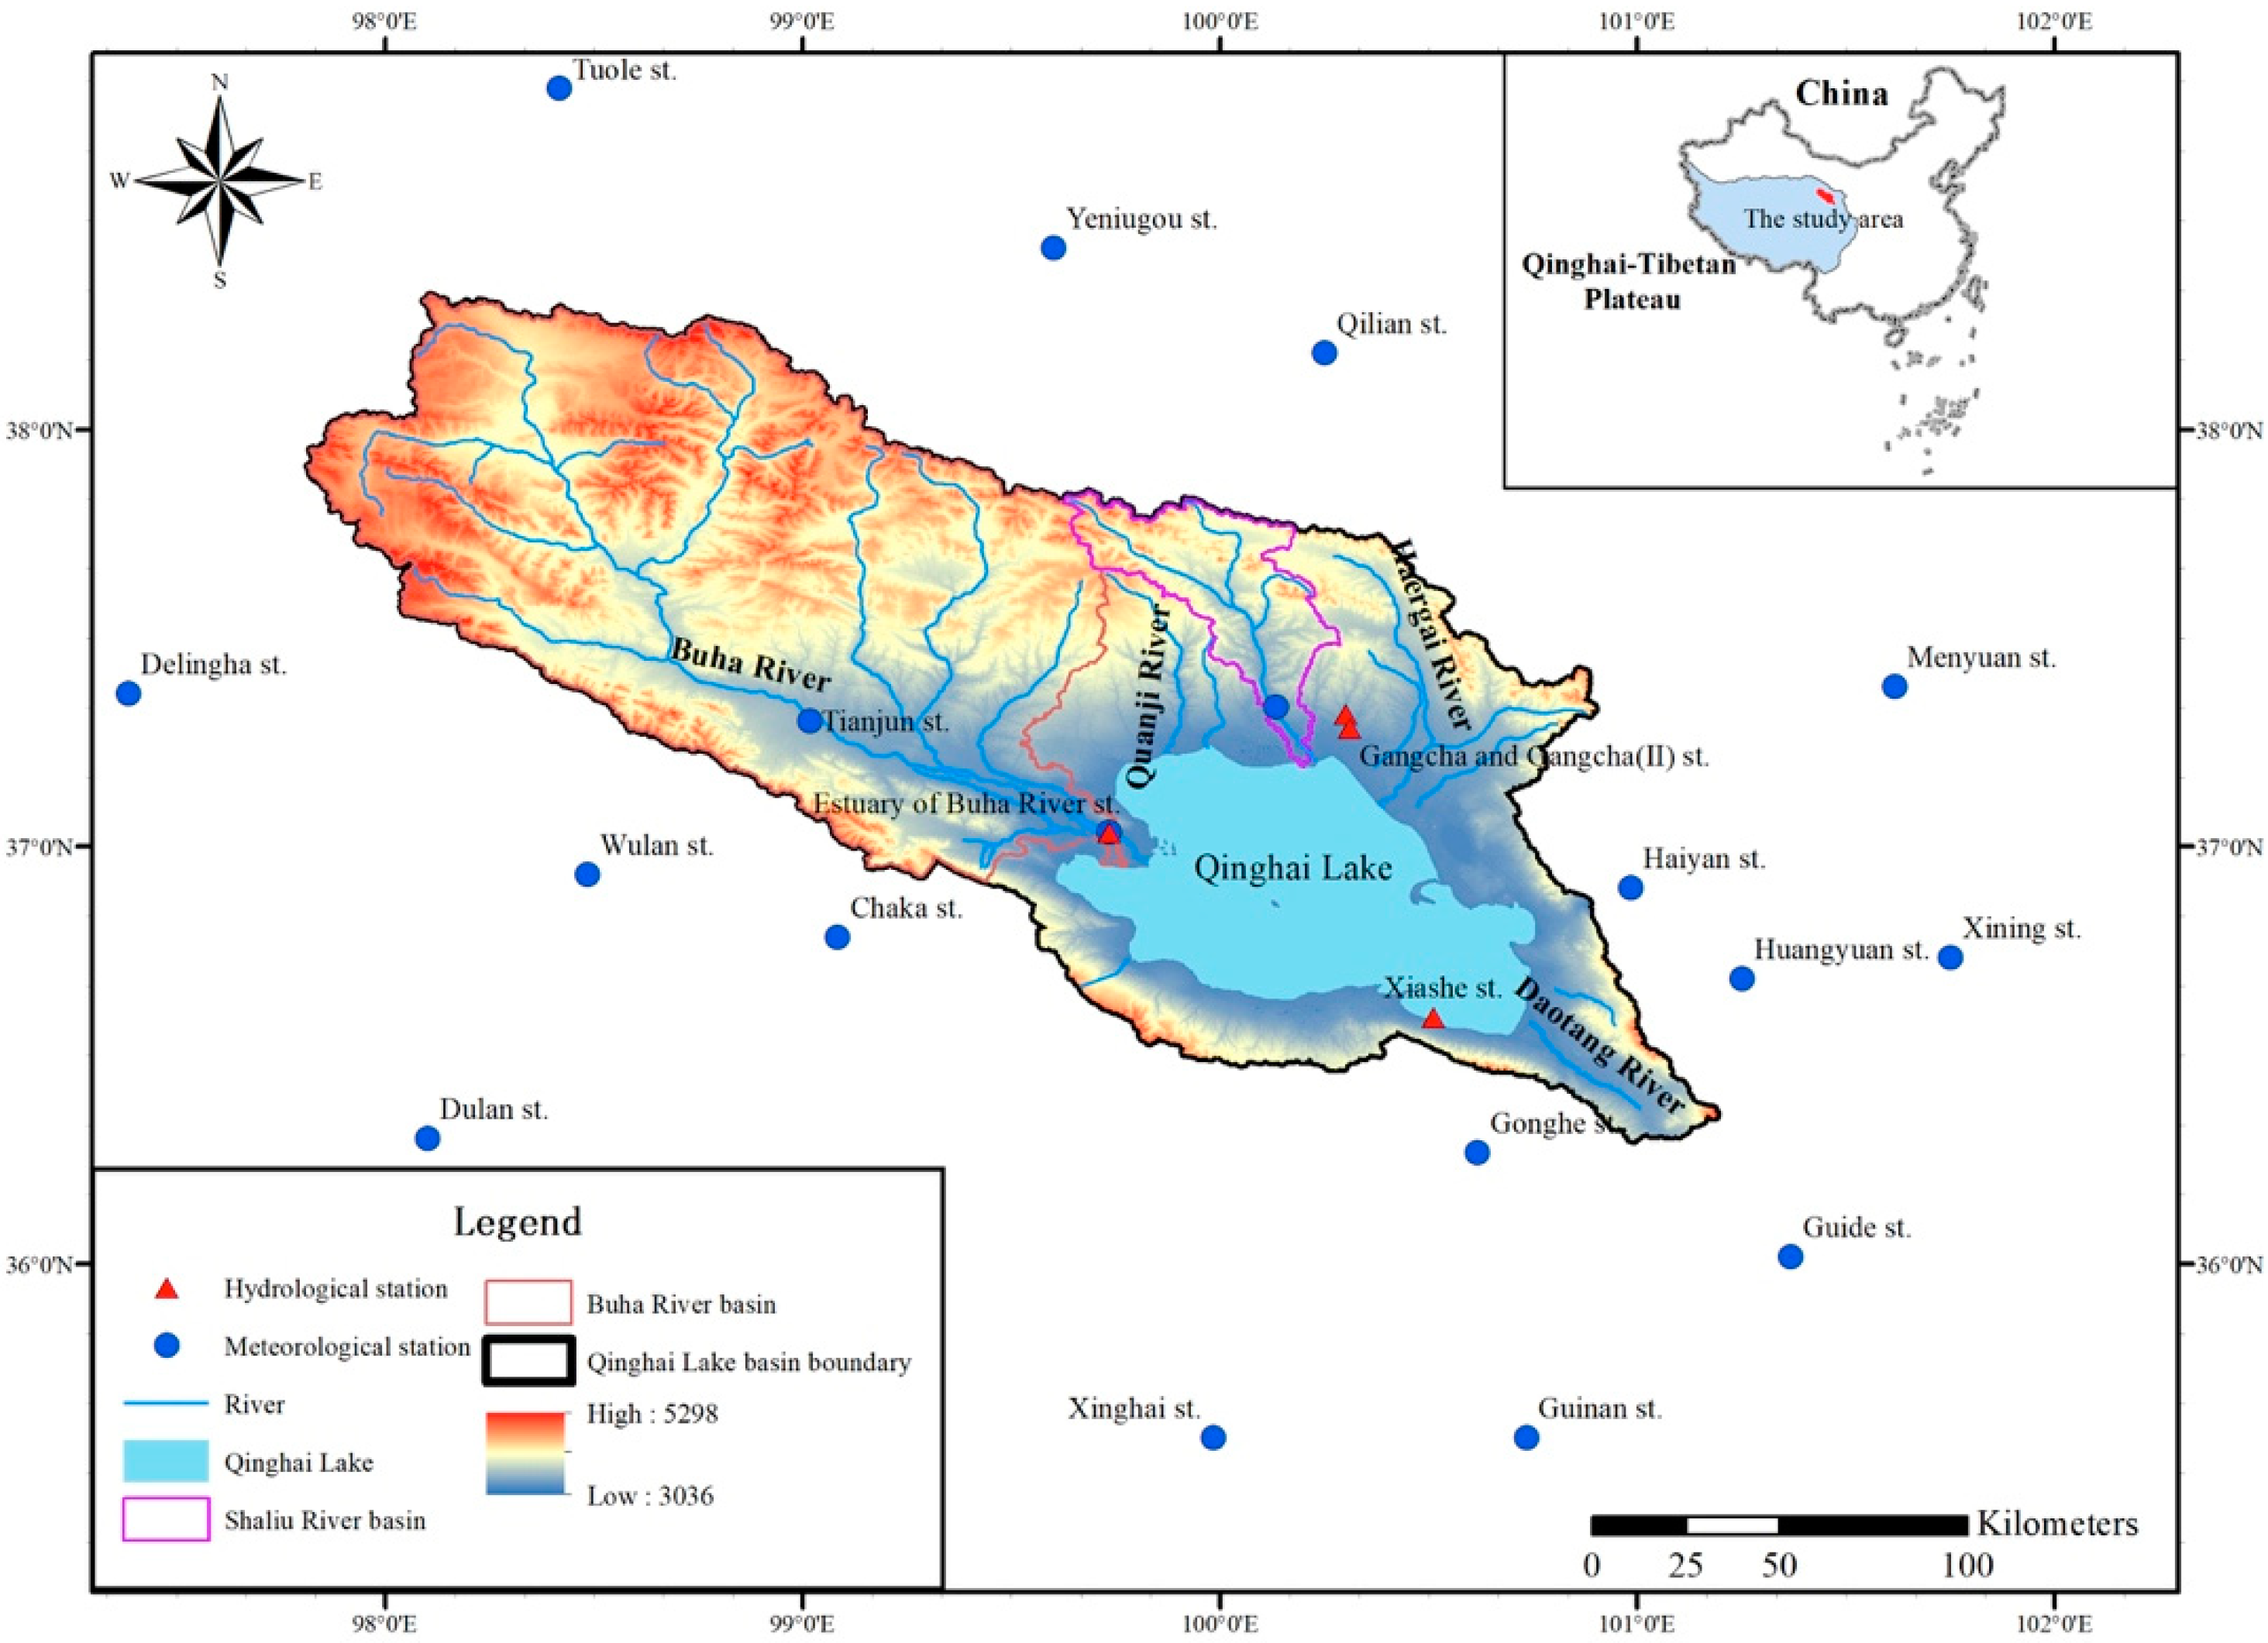
Qinghai Lake basin (97°50′~101°20′ E, 36°15′~38°20′ N) is located in the northeast of TP, covering an area of 29,664 km2. The average annual air temperature ranges from −0.8 °C to 1.1 °C, and the average annual precipitation ranges from 327 to 423 mm. However, the annual precipitation is unevenly distributed, decreasing from the east and south to the west and north. The total surface runoff of local main rivers including Buha River, Shaliu River, Haergai River, Heima River and Daotang River accounts for 83% of the total surface runoff into Qinghai Lake [28,29], with the first two (Buha & Shaliu) constituting the 64% of the surface runoff for the entire basin [30]. The main vegetation types in the basin are alpine meadows and alpine grasslands.
Qinghai Lake is the largest inland saline lake in this basin with an area of 4400 km2 (in 2016), and it is located at an altitude of 3193 m above sea level. As previously mentioned in Section 1, this lake is a closed one with no surface water outflow. It is about 106 km in length from east to west, and 63 km in width from north to south, and 360 km in circumference [30]. The average annual air temperature above the lake is about 1.2 °C, and the average annual precipitation near its proximity is about 357 mm.
The datasets available used for this study can be summarized as follows:
- Daily water levels in Qinghai Lake at Xiashe station (36°35′ N, 100°29′ E) from 1959 to 2016, obtained by the Information Center of Qinghai Hydrographic Bureau, China (ICQHB).
- Daily surface runoff of Buha River and Shaliu River, observed at the estuary of Buha River station (37°18′ N, 99°44′ E, from 1960 to 2016), at Gangcha station (37°17′ N, 100°19′ E, from 1960 to 1975) and at Gangcha II station (36°19′ N, 100°18′ E, from 1976 to 2016, obtained as well by ICQHB.
- Meteorological data:
- Daily meteorological data of 14 national meteorological stations from 1960 to 2016, obtained by the China Meteorological Information Center.
- Monthly meteorological data from 1960 to 2010 at three meteorological stations, obtained by Qinghai Meteorological Bureau in China.
- Daily precipitation data of Buha River rain station from 1962 to 2016 obtained by ICQHB.
- Daily evaporation data from 1984 to 2016 at Xiashe station obtained from ICQHB.
- Environmental and physical details of Qinghai Lake, and these datasets were obtained from ICQHB and the literature [30].
- Land use data from 1980 to 2015, obtained by the Data Center of Resources and Environmental Sciences, Chinese Academy of Sciences.
2.2. Governing Equations
2.2.1. Lake Water Balance Model
As Qinghai Lake is a closed-catchment with no surface water outflow, the annual hydrological water balance equation can be expressed as follows:
where Δh is the yearly water level variation, (mm); Pl is the yearly precipitation on the lake surface, (mm); El is the yearly evaporation from the lake surface, (mm); Rls is the yearly surface runoff into the lake, (mm); Rlg is yearly underground runoff on the lake bottom, (mm); ε is the error, (mm). For this watershed scenario, the surface runoff is almost equivalent to the river runoff and the slope surface runoff can be considered negligible. Δh can be quantified as well as follows:
where hi and hi−1 are the lake level at i year and at i − 1 year.
The yearly average water level of the lake was obtained from the daily water level data at Xiasha station. Pl was calculated by applying the Thiessen Polygon method focusing in the area between Buha River station, Gangcha station, Haiyan station and Gonghe station, which are the nearest stations to the lake. El was obtained from evaporation pan (type of E20) data at Xiashe station [29]. The yearly total surface runoff (Rls, mm) into the lake was obtained from the surface runoff (Qls, m3) of Buha River and Shaliu River by using the proportion amplification method [31].
In this paper, Δh is subject to a combination of climate and human activities effects (such as farmland reclamation, grazing, afforestation which indirectly influence runoff and catchment characteristics). Pl and El represents the climate variability, Rls and Rlg are the results of the combination of climate and catchment modifications. Hence, to correctly quantify the contribution rate of climate and catchment characteristics (human induced) to Δh, it is necessary to calculate accurately the contribution rate of climate and catchment characteristics (human induced) to Rls and Rlg. Therefore, the calculation method can be applied as follows:
where , respectively represent the contribution rate of climate and catchment modifications to Δh. , respectively represent the climate change contribution of Pl and El to Δh. , respectively represent the Rls contribution rate of climate change and catchment change to Δh. , respectively represent the Rlg ± ε contribution rate of climate change and catchment change to Δh.
2.2.2. Land Use Dynamic Index
Land use change can reflect the effect as well as the intensity of human activities. The Land Use Dynamic Index was proposed by Chen et al. [32] and was adopted in this study to describe the change of land use types in the research area for a certain period (1980–2015). The calculation method was completed as follows:
where LC is the Land Use Dynamic Index in a certain period of time in the research area (%), ΔUiin refers to the area of type i land use converted into the non- i type land use within a certain period of time in the research area (km2), Ui0 is the area of type i land use at the beginning of the study period (km2), T is the research period (years).
2.2.3. Statistical Analysis
(1) The Non-parametric Mann-Kendall Test
The non-parametric Mann-Kendall test [33,34] (M-K test) and the cumulative anomaly method were used to detect any point of abrupt changes in the variables considered. The M-K test has been widely applied to identify the point at which the hydrological processes change significantly due to the climate [35,36]. The details about this statistical method can be obtained in the relevant literature [37].
First, the partial M-K test statistics are calculated as:
Statistical variable is adopted and defined as:
Proceed to Equation (11) putting the data sequence x in reverse order:
In the M-K curve, if the value of the intersection of the curve forward () or the curve backward () is greater than 0, this suggests that the record sequence shows an upward trend; less than 0 suggests a downward trend. When the record exceeds the critical line (Given the significance level α = 0.05, the critical lines U0.05 = ±1.96), this suggests that an increase or decrease in the trend may be significant. The range of exceeding the critical line is the time zone in which the abrupt change occurs. If there is an intersection between the curves of and in the range of the critical lines, the time of the intersection is the time of the abrupt change started [38].
(2) The Cumulative Anomaly Method
The cumulative anomaly method is widely used to indicate the runoff [39], precipitation and other factors that deviate from the normal situations, focusing on the difference between a certain value and the average value of a series [38].
(3) The Principal Component Regression Analysis
The principal component regression (PCR) analysis [40] is a combination of principal component analysis and regression analysis. Typically, this method considers regressing the outcome on a set of covariates based on a standard linear regression model, using PCA (principal component analysis) for estimating the unknown regression coefficients. Generally, only a subset of all the principal components for regression is used; hence, PCR tends to act as a regularized procedure.
(4) The Grey Relational Analysis
The grey relational analysis [41] is adopted in this study to solve uncertain problems such as limited data and incomplete information by calculating the grey correlation degree γi, quantifying the correlation degree among the influential factors of underground runoff.
(5) The Least Square Method
The least square method [42] is applied to procure unknown data and minimize the sum of squared errors between the obtained data and the actual data. The least square method can also be used for curve fitting.
(6) The Partial Least Squares Regression Method
The partial least squares regression method [43] is a combination of multiple linear regression analysis, canonical correlation analysis and principal component analysis, reflecting the influence of the sample population on the predicted values and fully considering the influence of the comprehensive effect between individual factors on the predicted ones.
2.2.4. Sensitivity Analysis Based on the Budyko Framework
Climate change and human activities are the most important drivers to determine the river hydrological process of the catchment [44]. In this study, the sensitivity coefficient method [45] based on Budyko Theory [46] was used to quantitatively separate the impacts of climate change and human activities on the variations of streamflow into Qinghai Lake. The theoretical equation of Budyko curve [47] can be applied as follows:
where ET is the evapotranspiration of the upper catchment area, (mm); P is the precipitation of the catchment area, (mm); ET0 is the potential evapotranspiration of the catchment area, (mm); the empirical parameter ω represent catchment characteristics, such as human activities, land use, vegetation, topography, and properties of soil [48,49], [].
The change of surface runoff in a given basin can be characterized by climate and human activities changes as follows:
where ΔQc and ΔQu represent the surface runoff variation caused by climate change and human activities changes, respectively. The surface runoff variation caused by climate change can be expressed by the following formula [45]:
The surface runoff variation caused by human activities can be expressed by the following formula:
where is the variation of precipitation, is the variation of the empirical parameter ω of a given catchment; is the potential evapotranspiration variation; , , respectively represent the sensitivity coefficient of runoff to precipitation, runoff to potential evapotranspiration, runoff to precipitation, runoff to the empirical parameter represent catchment characteristics. All of the sensitivity coefficients can be calculated as follows:
In this paper, the potential evapotranspiration at the meteorological stations was calculated by applying the FAO56 method, Penman-Monteith model [50], because previous literature [51,52] has demonstrated how these methods are reliable to estimate potential effects of climate change on the calculation of the evaporation as well as the influence of climate change on water cycles. P and ET0 of the entire basin were obtained by applying the area-weight method of Tyson Polygon.
3. Results and Analysis
3.1. Long-Term Variations in Water Levels and the Hydro-Climatic Factors
3.1.1. Long-Term Variations in Water Levels
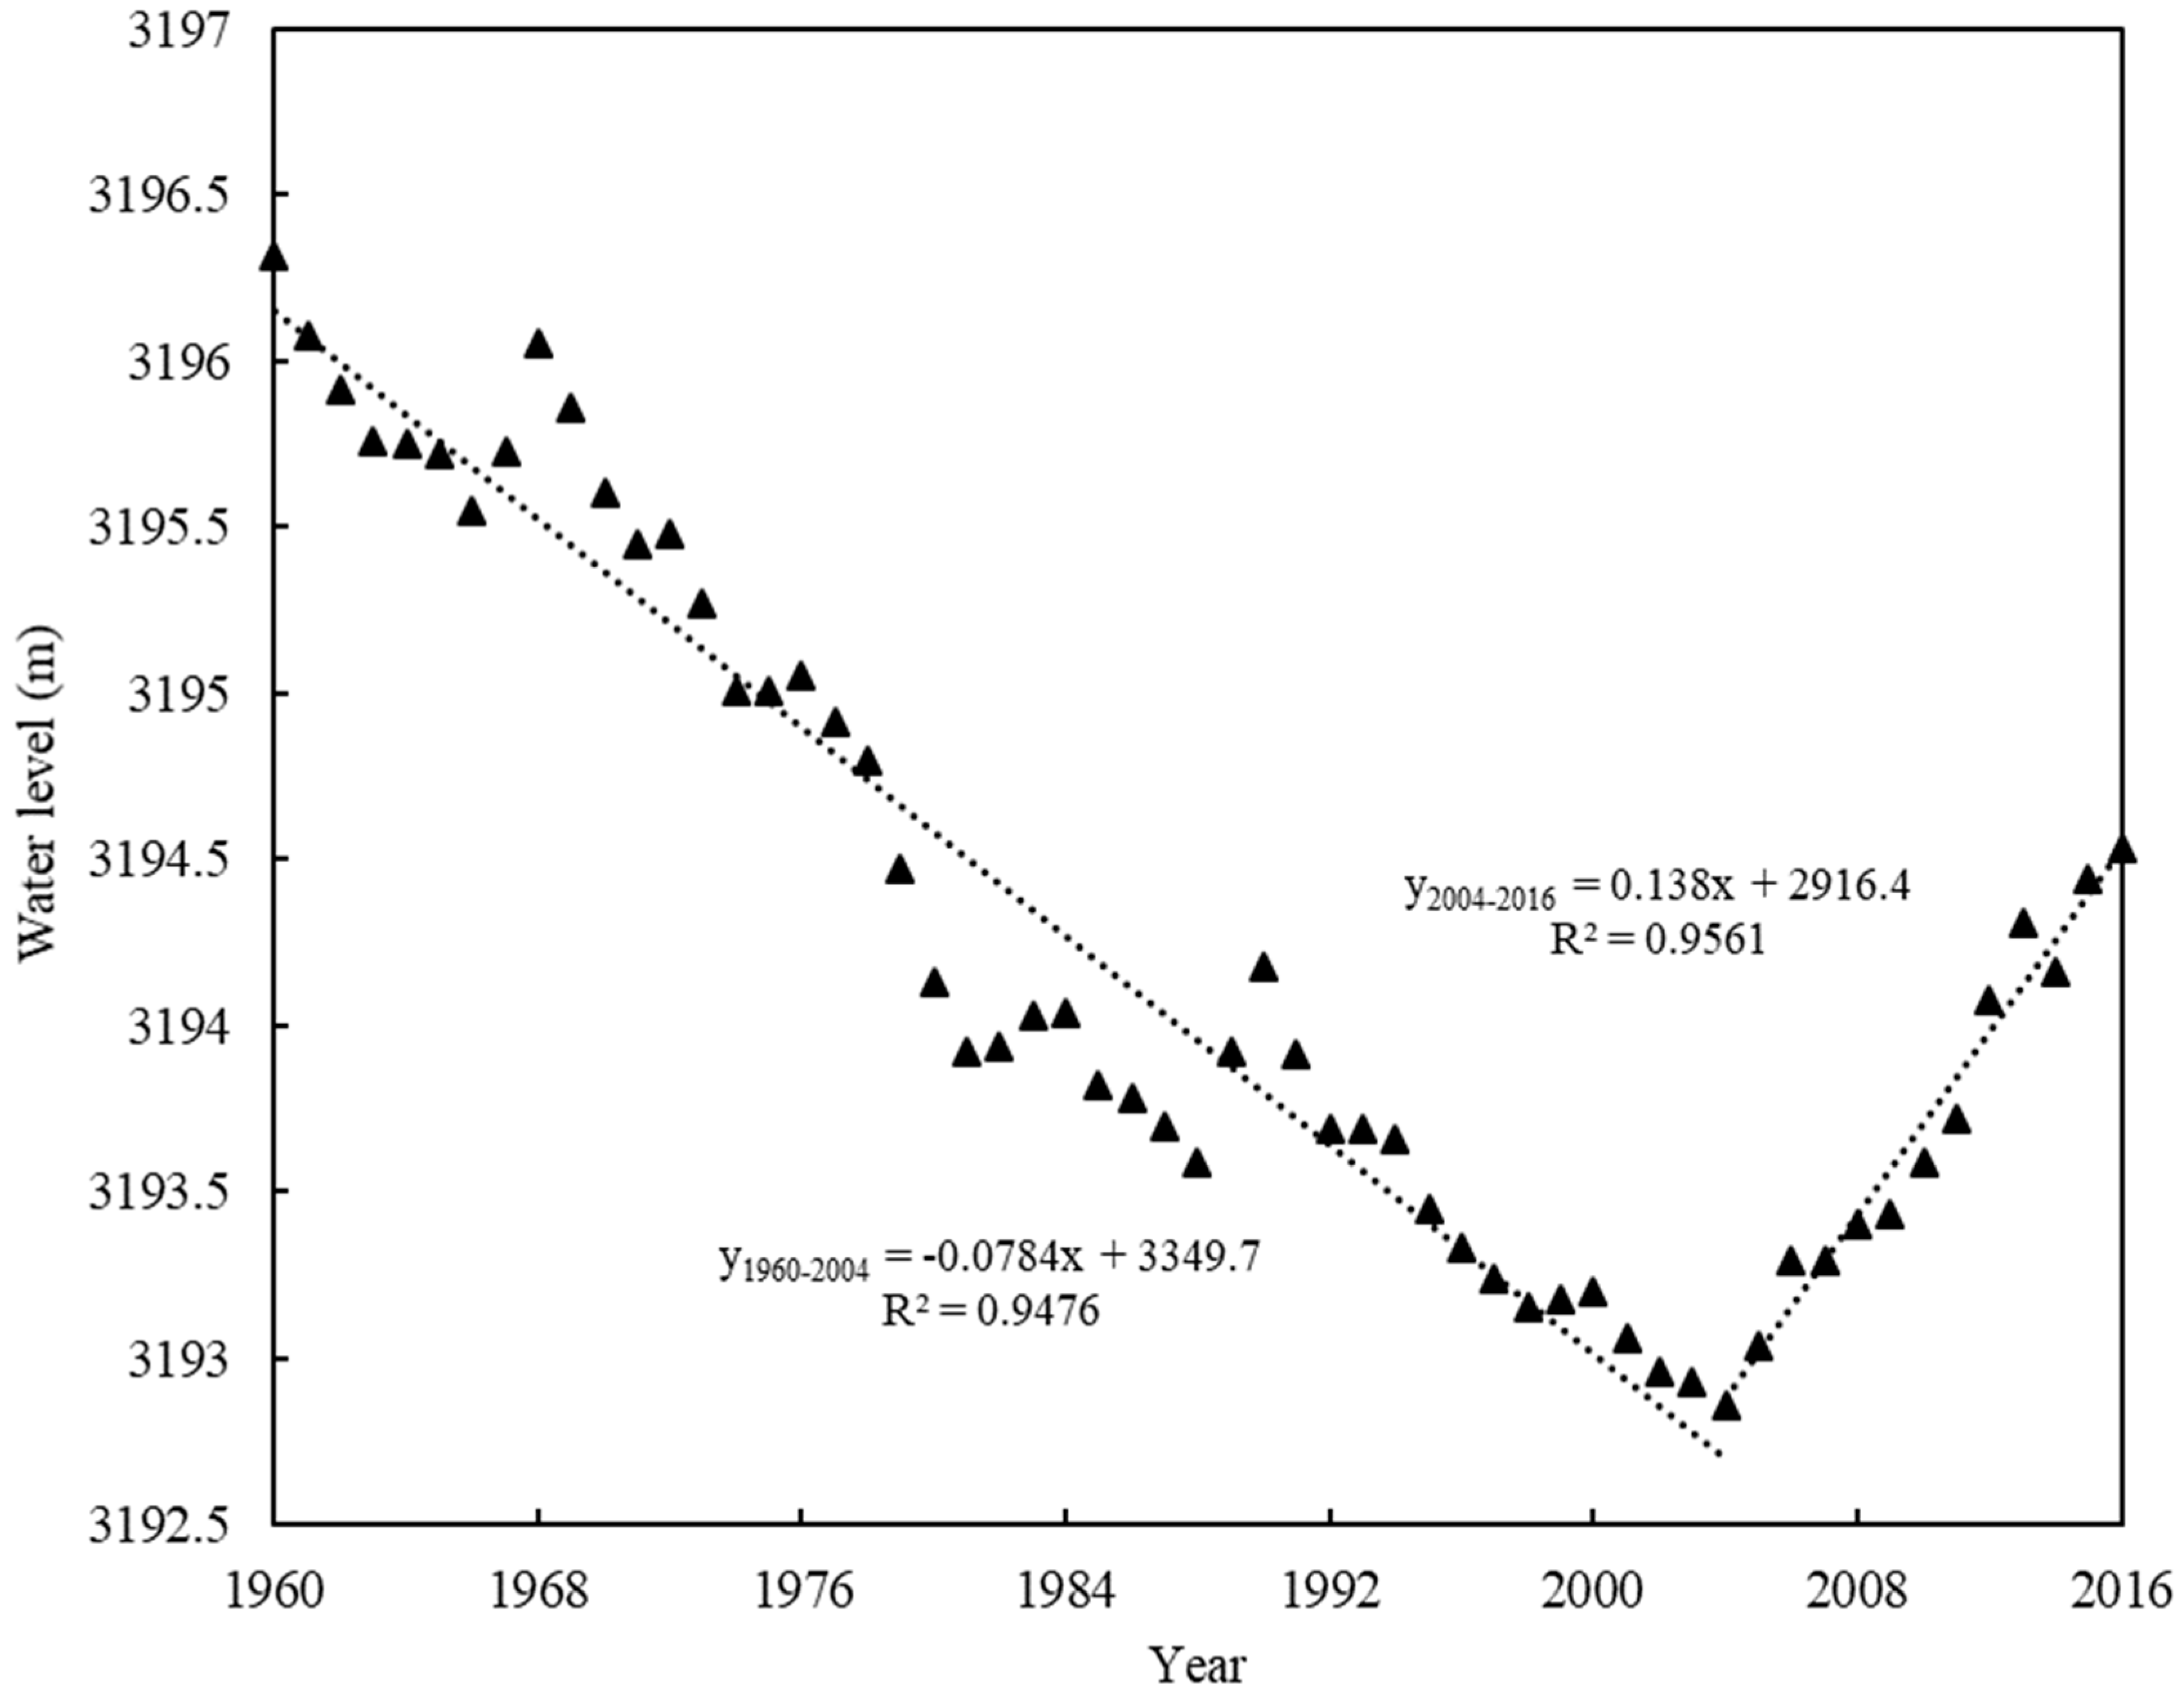
Figure 2 shows the annual water levels of Qinghai Lake recorded during the period 1960–2016. Overall, comparing datasets within other locations in the semi-arid areas of Western China, the water level varied significantly (≈3.5 m) and it is possible to notice a clear inflection point recorded in 2004. Herein, the analysis of the graph was divided into two periods to simplify the procedure: period I was selected to be between 1960 and 2004, while period II was selected to be between 2005 and 2016. The annual water level of the lake declined at the rate of 7.84 cm/year (P < 0.001), with a total decrease of 3.46 m in period I, while the annual water level of the lake has risen at the rate of 13.80 cm/year (P < 0.001), with a total increase of 1.49 m in period II.
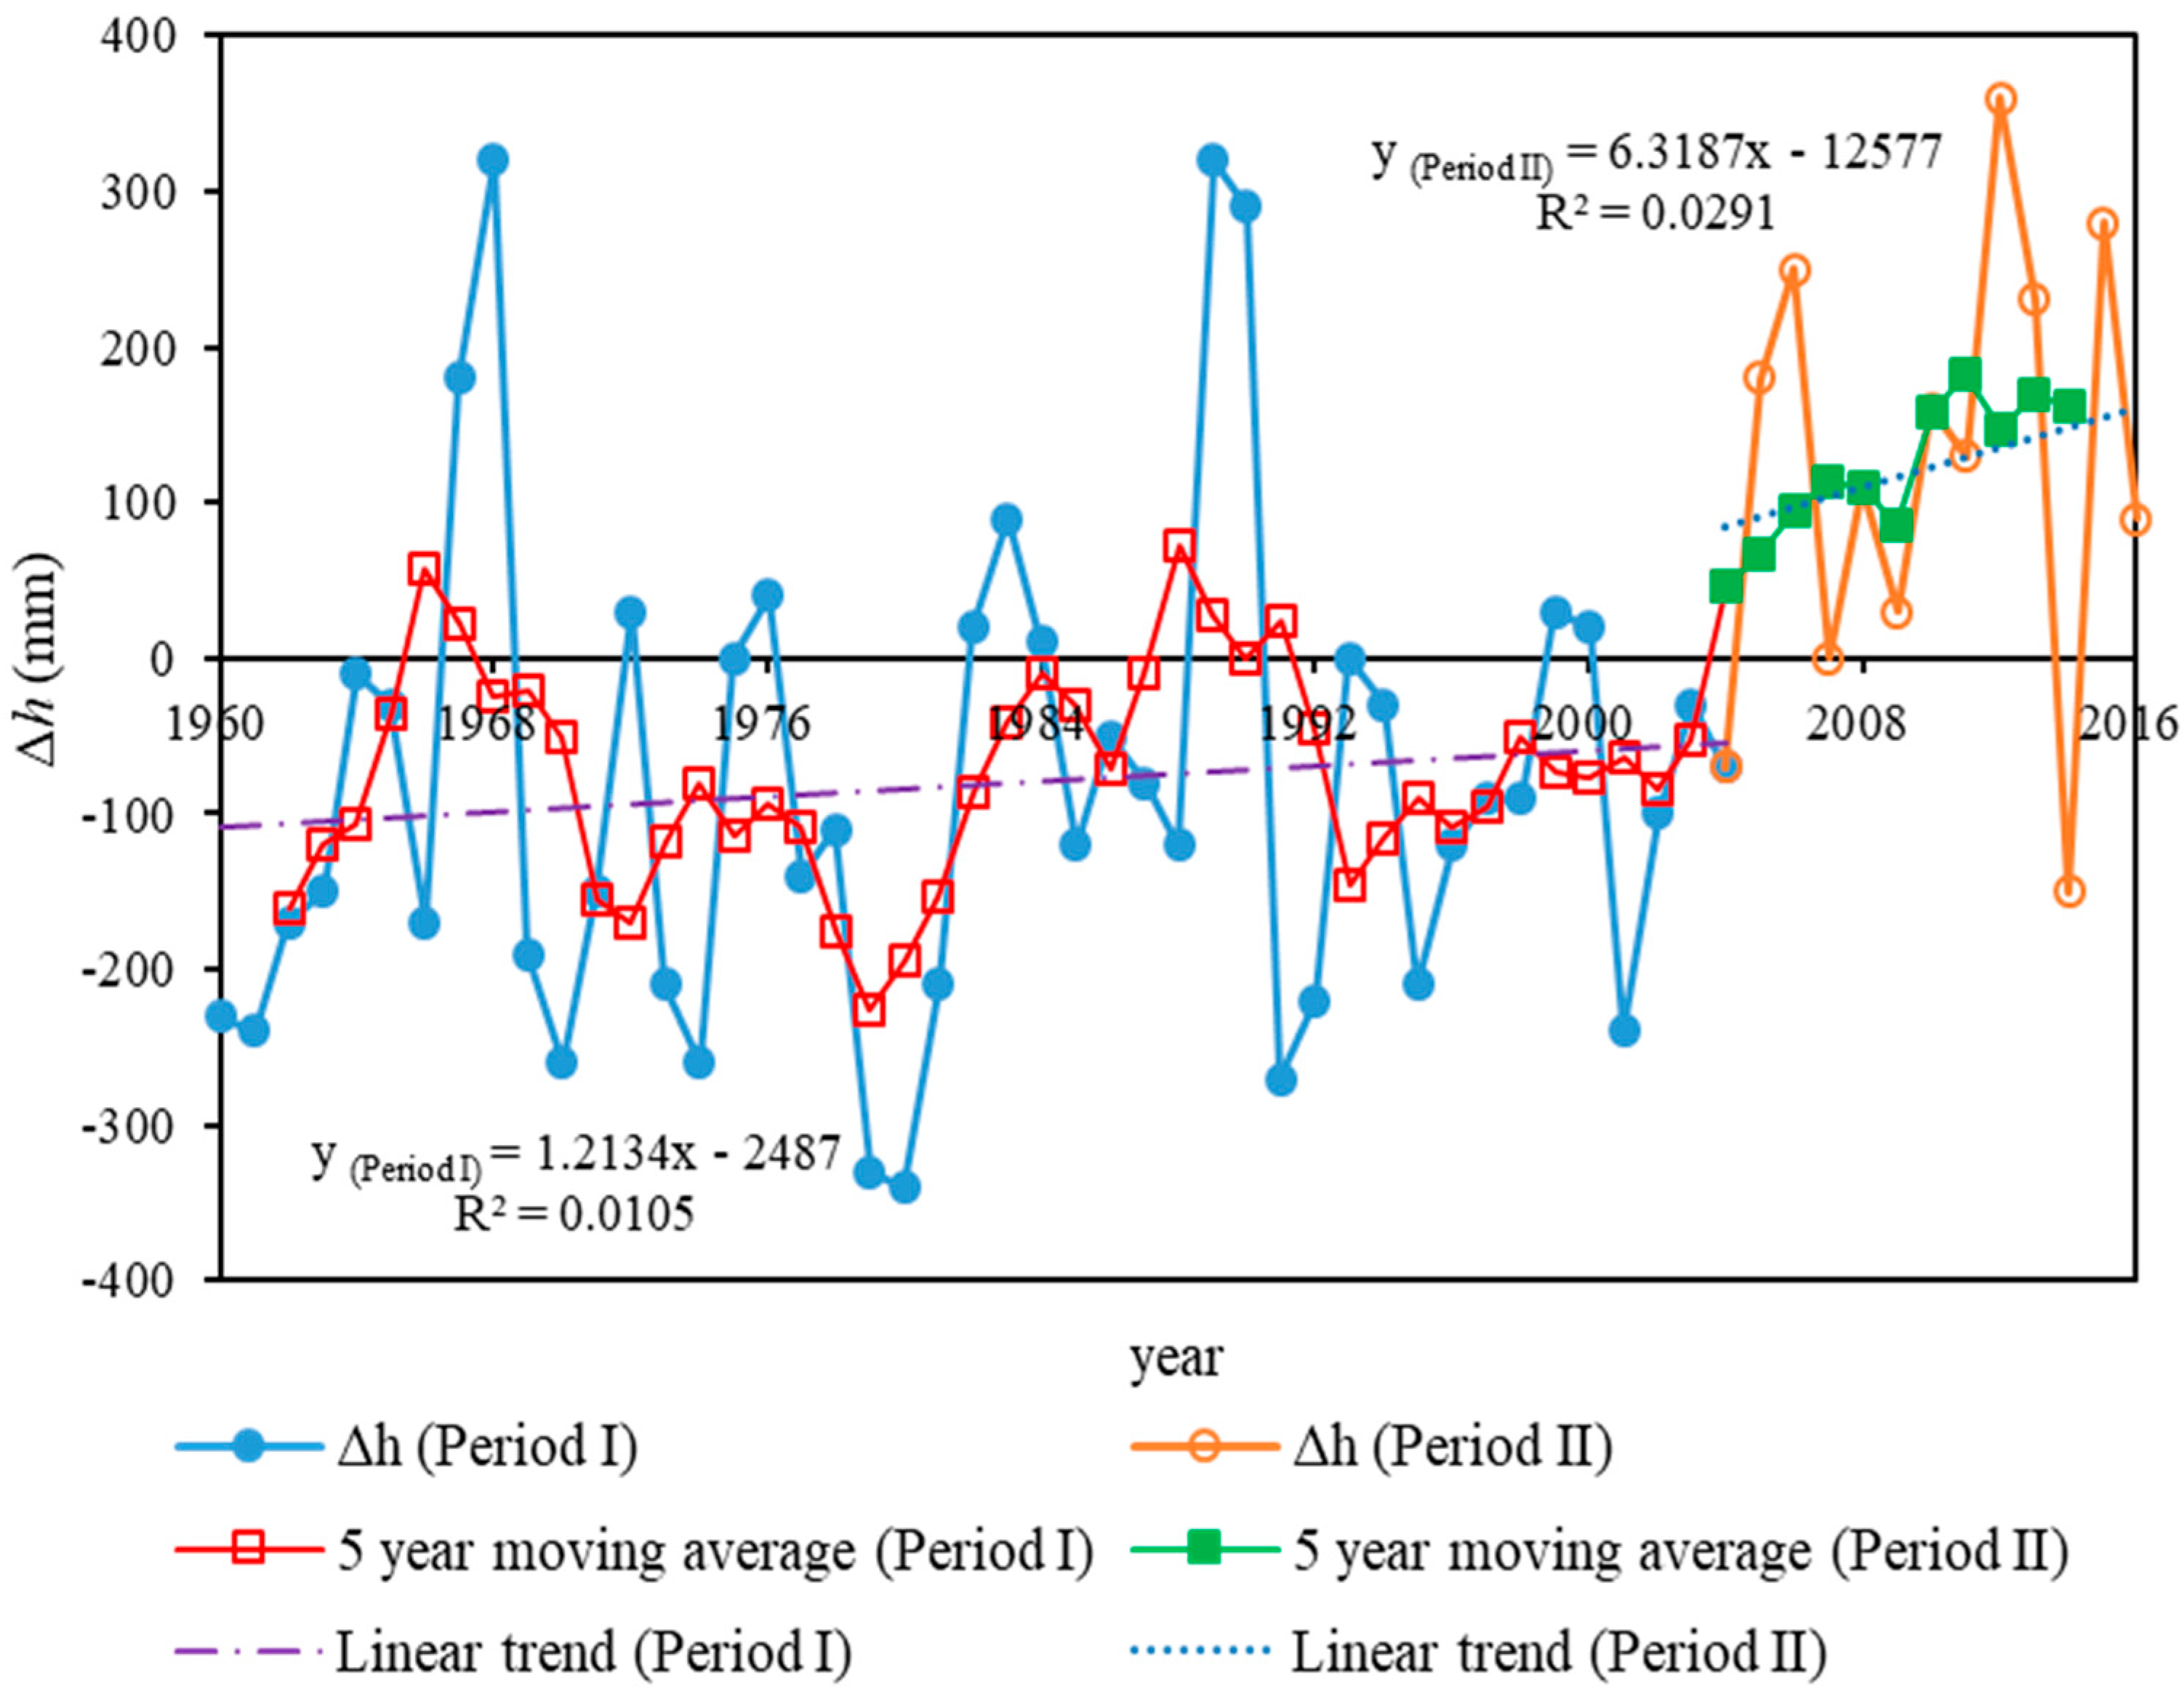
The variation of the water levels of the lake (Δh) reflected the acquisition and loss of water volume over the years due to multiple factors, and the trend is shown in Figure 3. According to the results obtained, Δh tended to increase during period I (R2 = 0.0105, P < 0.01) as well as during period II (R2 = 0.0291, P < 0.01). The increasing rate of the water level in period II was notably faster than the one in period I, and the water level of the lake in 1960 could be reached again by 2030 if the present increasing rate continues constantly.
3.1.2. Analysis of Hydro-Climatic Factors Influencing Water Levels
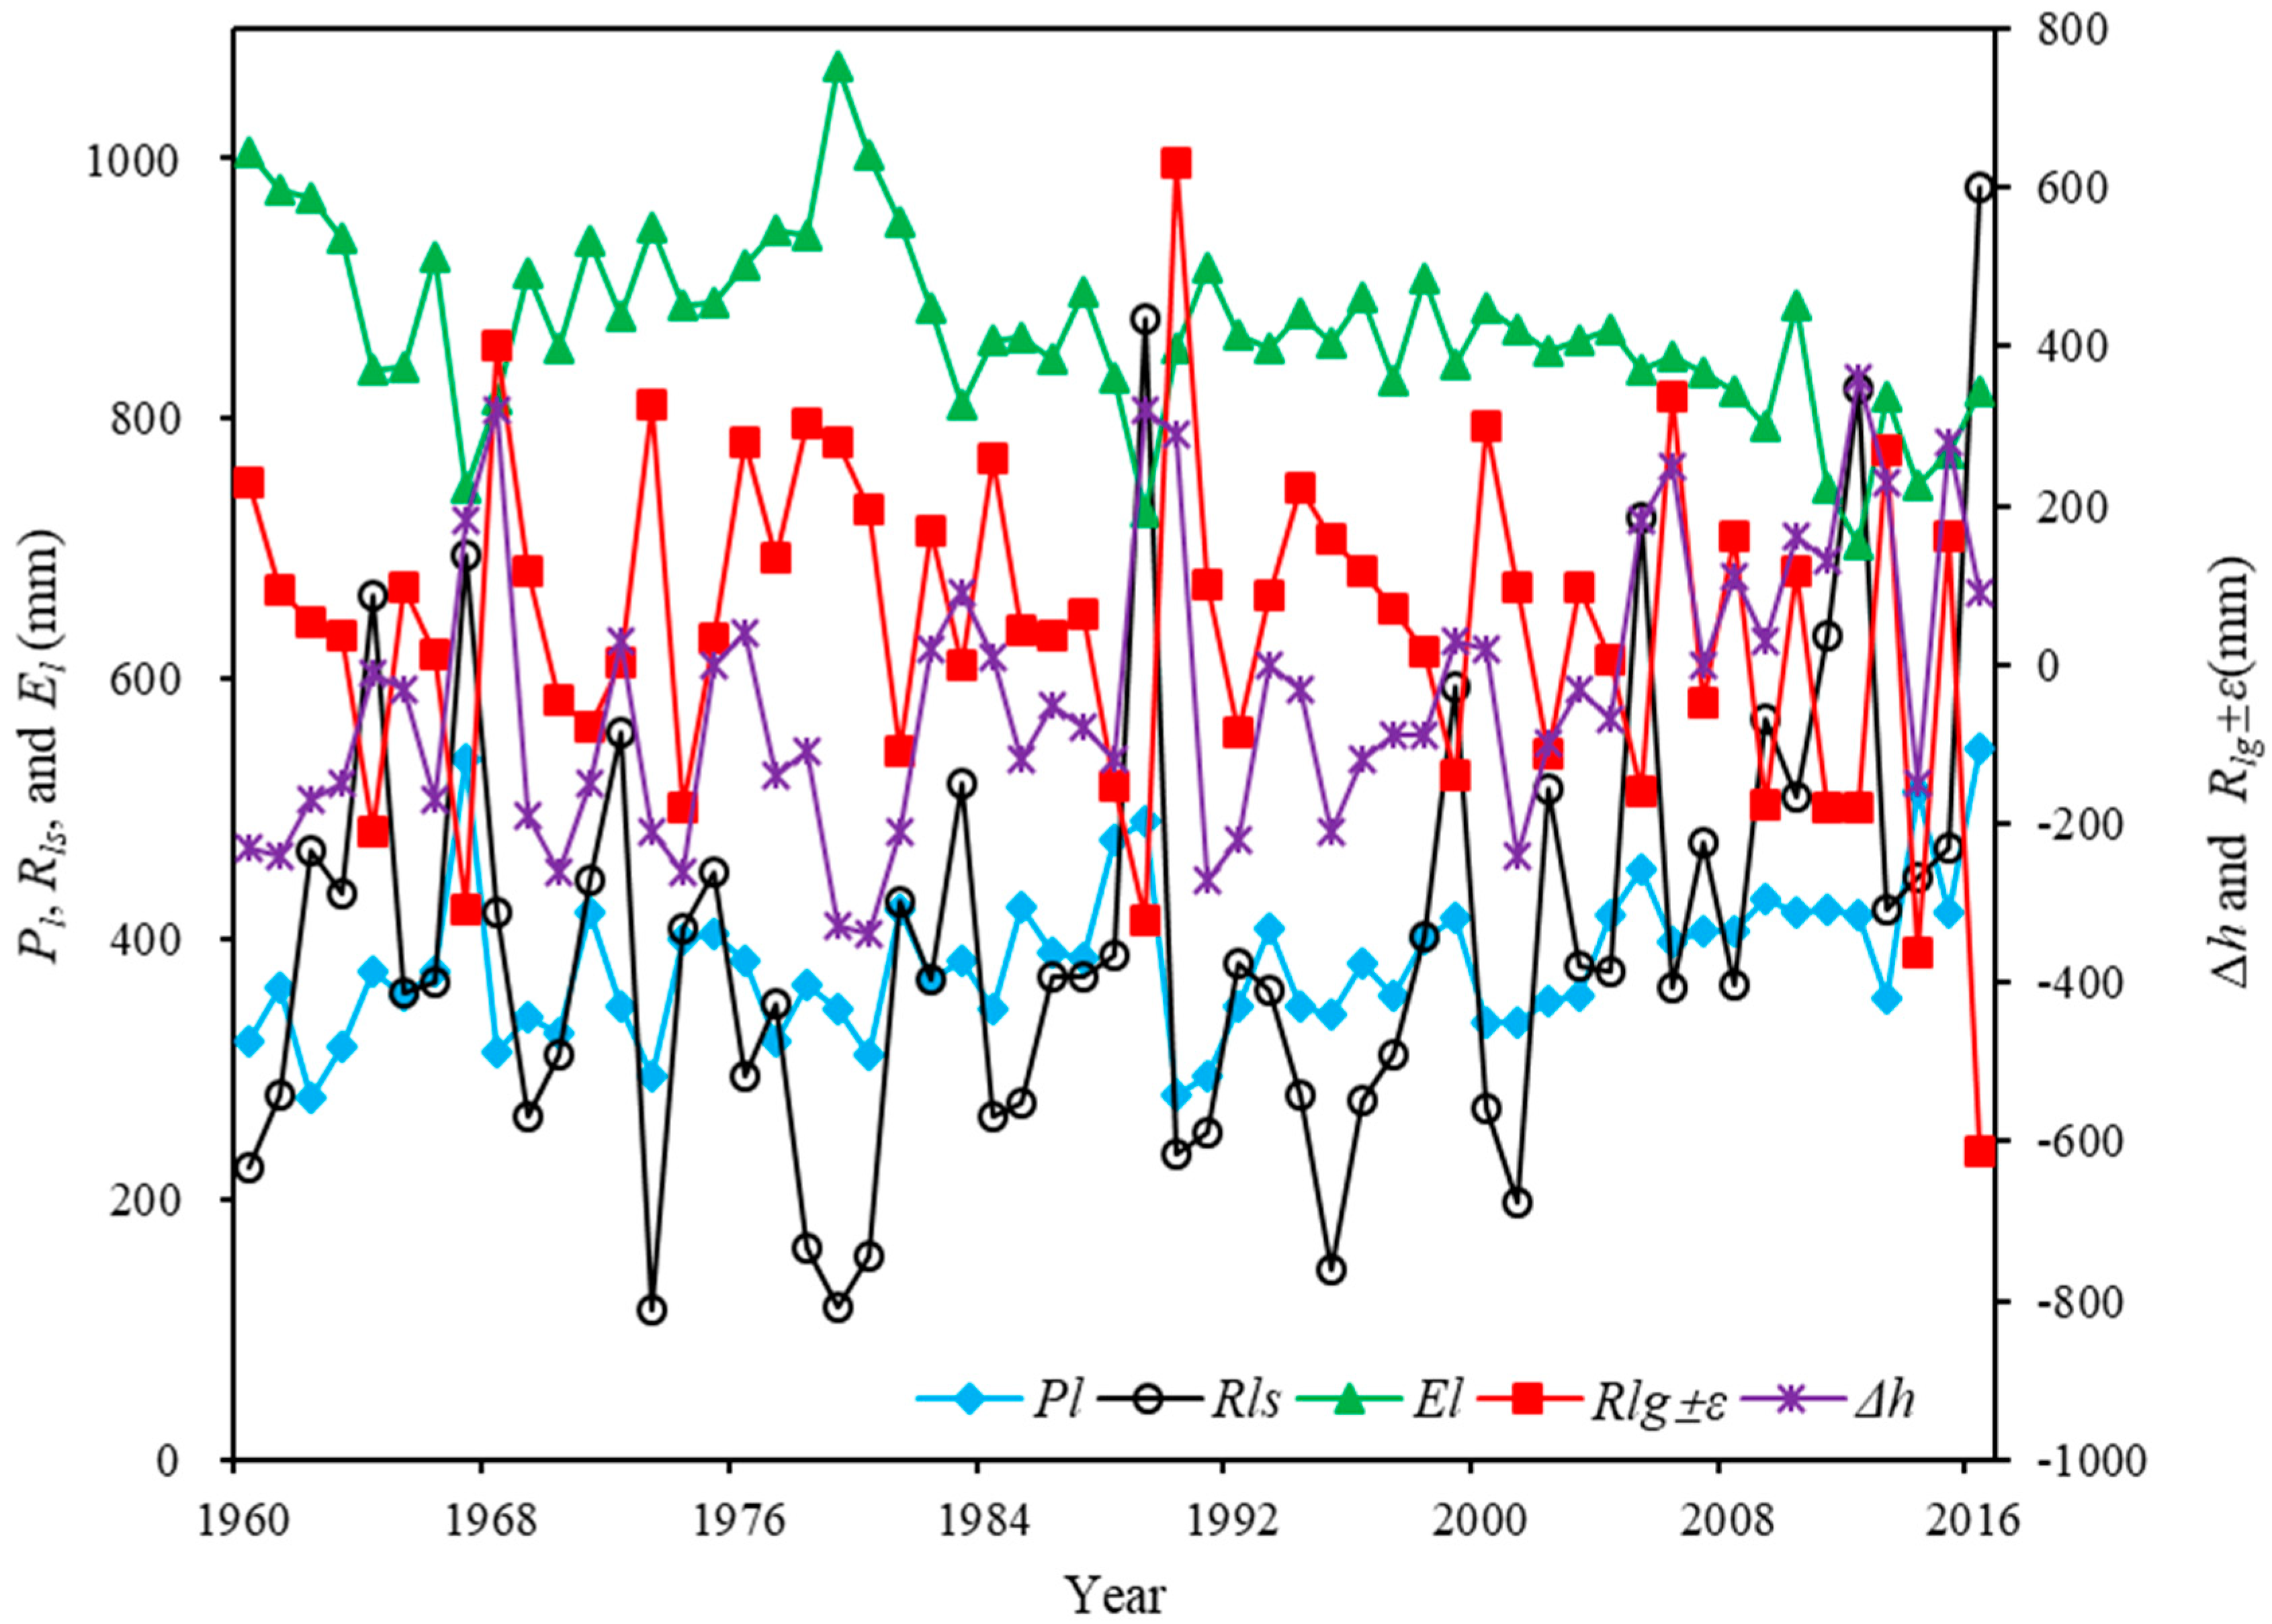
Δh was dependent on the lake hydro-climatic conditions Pl, El, Rls and Rlg ± ε. All together, these variables affected the rise or fall of the water level in the lake, and the relationship between them and the corresponding variations in the water levels of the lake are shown in Figure 4 and Table 2.
During the period under investigation, surface runoff into the lake (Rls) was mainly due to the Buha River and Shaliu River, which contributed about 48.70% of the total water in the lake. The underground runoff on the lake bed and the associated error (Rlg ± ε) accounted for 5.56% of the total water intake of the lake, and this value fluctuated significantly. The precipitation on the lake surface (Pl) contributed about 45.74% of the total water in the lake while the evaporation from the lake surface (El) contributed about 100% of the total water removed from the lake. As possible to notice from Figure 4, Pl, and Rls had similar trends, while this could not be confirmed for El and Rlg. The peak of Δh often corresponded to the peak of Pl, Rls.
The annual average values for each hydro-climatic variable Pl, Rls, Rlg ± ε, and El were 381.59 (mm), 406.32 (mm), 46.42 (mm), and 869.77 (mm), respectively. In period I, approximately 45.67% of the total water input into the lake came via Pl, with 45.18% of water input coming from Rls, and a small fraction of water input was due to Rlg ± ε. The whole outflow was estimated to be associated with El. In period II, approximately 43.38% and 56.62% of the total water input was associated with Pl and Rls, respectively, while El contributed 93.5% to the outflow with a small fraction of water escaping the lake attributed to Rlg ± ε (6.5%). This indicated that the water balance of Qinghai Lake was mainly determined by Pl, Rls and El. Therefore, the authors can confirm that Rlg ± ε, always being a small percentage, accounted for a small proportion of the water balance of Qinghai Lake.
3.2. Causes of Changes in Water Levels of the Lake
3.2.1. Impact of Climate Change on Water Levels
Figure 4 shows the relationship between Pl, El and Δh. The correlation coefficient between Pl and Δh calculated was 0.356 (P < 0.01). The fluctuation range for Pl was estimated between 277.2 and 546.4 (mm), where the mean value was obtained equal to 381.6 (mm), showing an upward trend at the rate of 1.4347 mm/year (R2 = 0.164, P < 0.01). The correlation coefficient between El and Δh was −0.705 (P < 0.01) and the fluctuation range for El was between 702.6 and 1070.5 (mm), where the mean value was 869.8 (mm), showing a downward trend at the rate of 2.2823 mm/year (R2 = 0.290, P < 0.01). Changes in behavior for Pl were consistent with the fluctuations of Δh, and the peaks of Δh were noticed to be delayed by 1 year when comparing them with those associated with Pl. However, El was generally contrary to the fluctuations of Δh.
Based on the results achieved, El and Pl were identified as the main important climate factors affecting the water level changes, and the correlation relationships between El and Δh estimated were of higher quality than those obtained between Pl and Δh.
It was clear that at peaks in the rising periods for Δh corresponded to higher values of Pl but lower values of El (e.g., 1968, 1989, and 2012). Furthermore, decreasing peaks of Δh corresponded to lower values of Pl but higher values of El (e.g., 1980 and 1991). Precipitation rates were quantified to affect both the runoff of the inflow rivers and underground runoff acting on the water level changes. Finally, evaporation was selected as the only factor of climate influencing water “exiting” the lake, playing a significant role in the fluctuation of the water level.
3.2.2. Impact of Human Activities on Catchment Modifications and Consequently on Water Levels
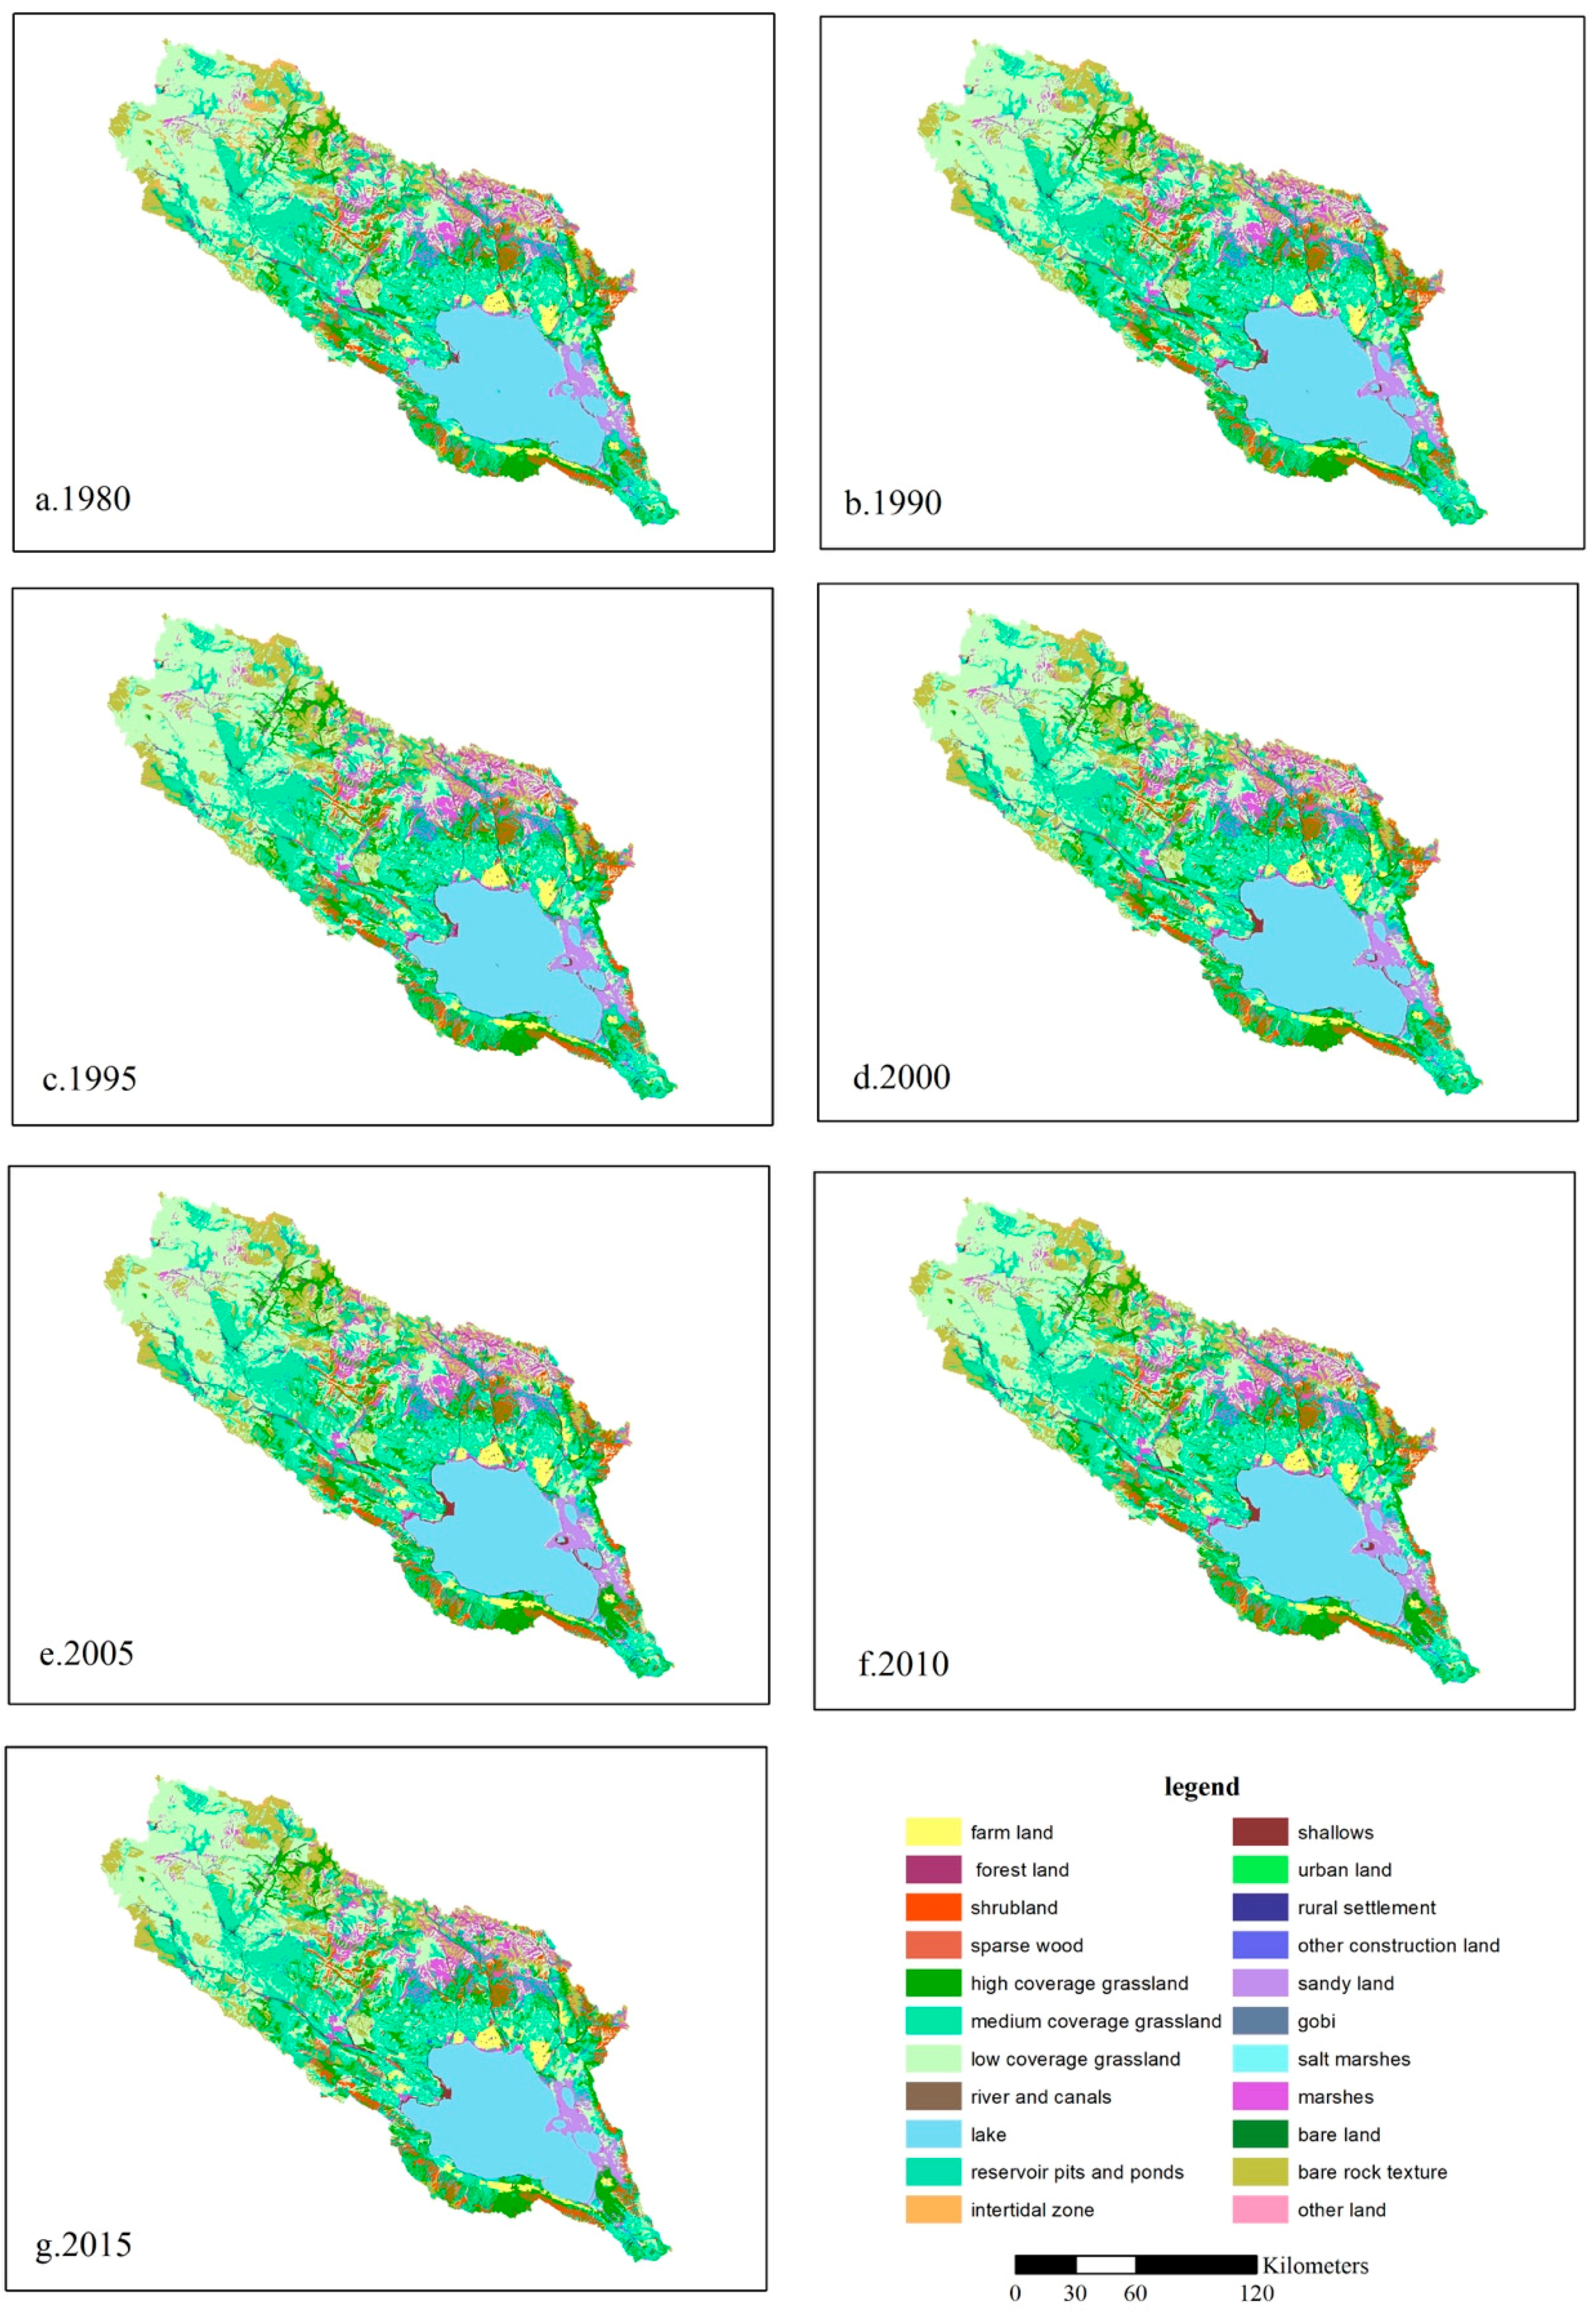
Figure 5 illustrates 7 different years spanning 1980 and 2015, to highlight the land use changes from 1980 to 2015 obtained by the superposition function fitted within ArcGIS10.2. Despite being present and noticeable, land use changes observed were not particularly significant as possible to notice in Figure 5 (Table 3 and Table 4).
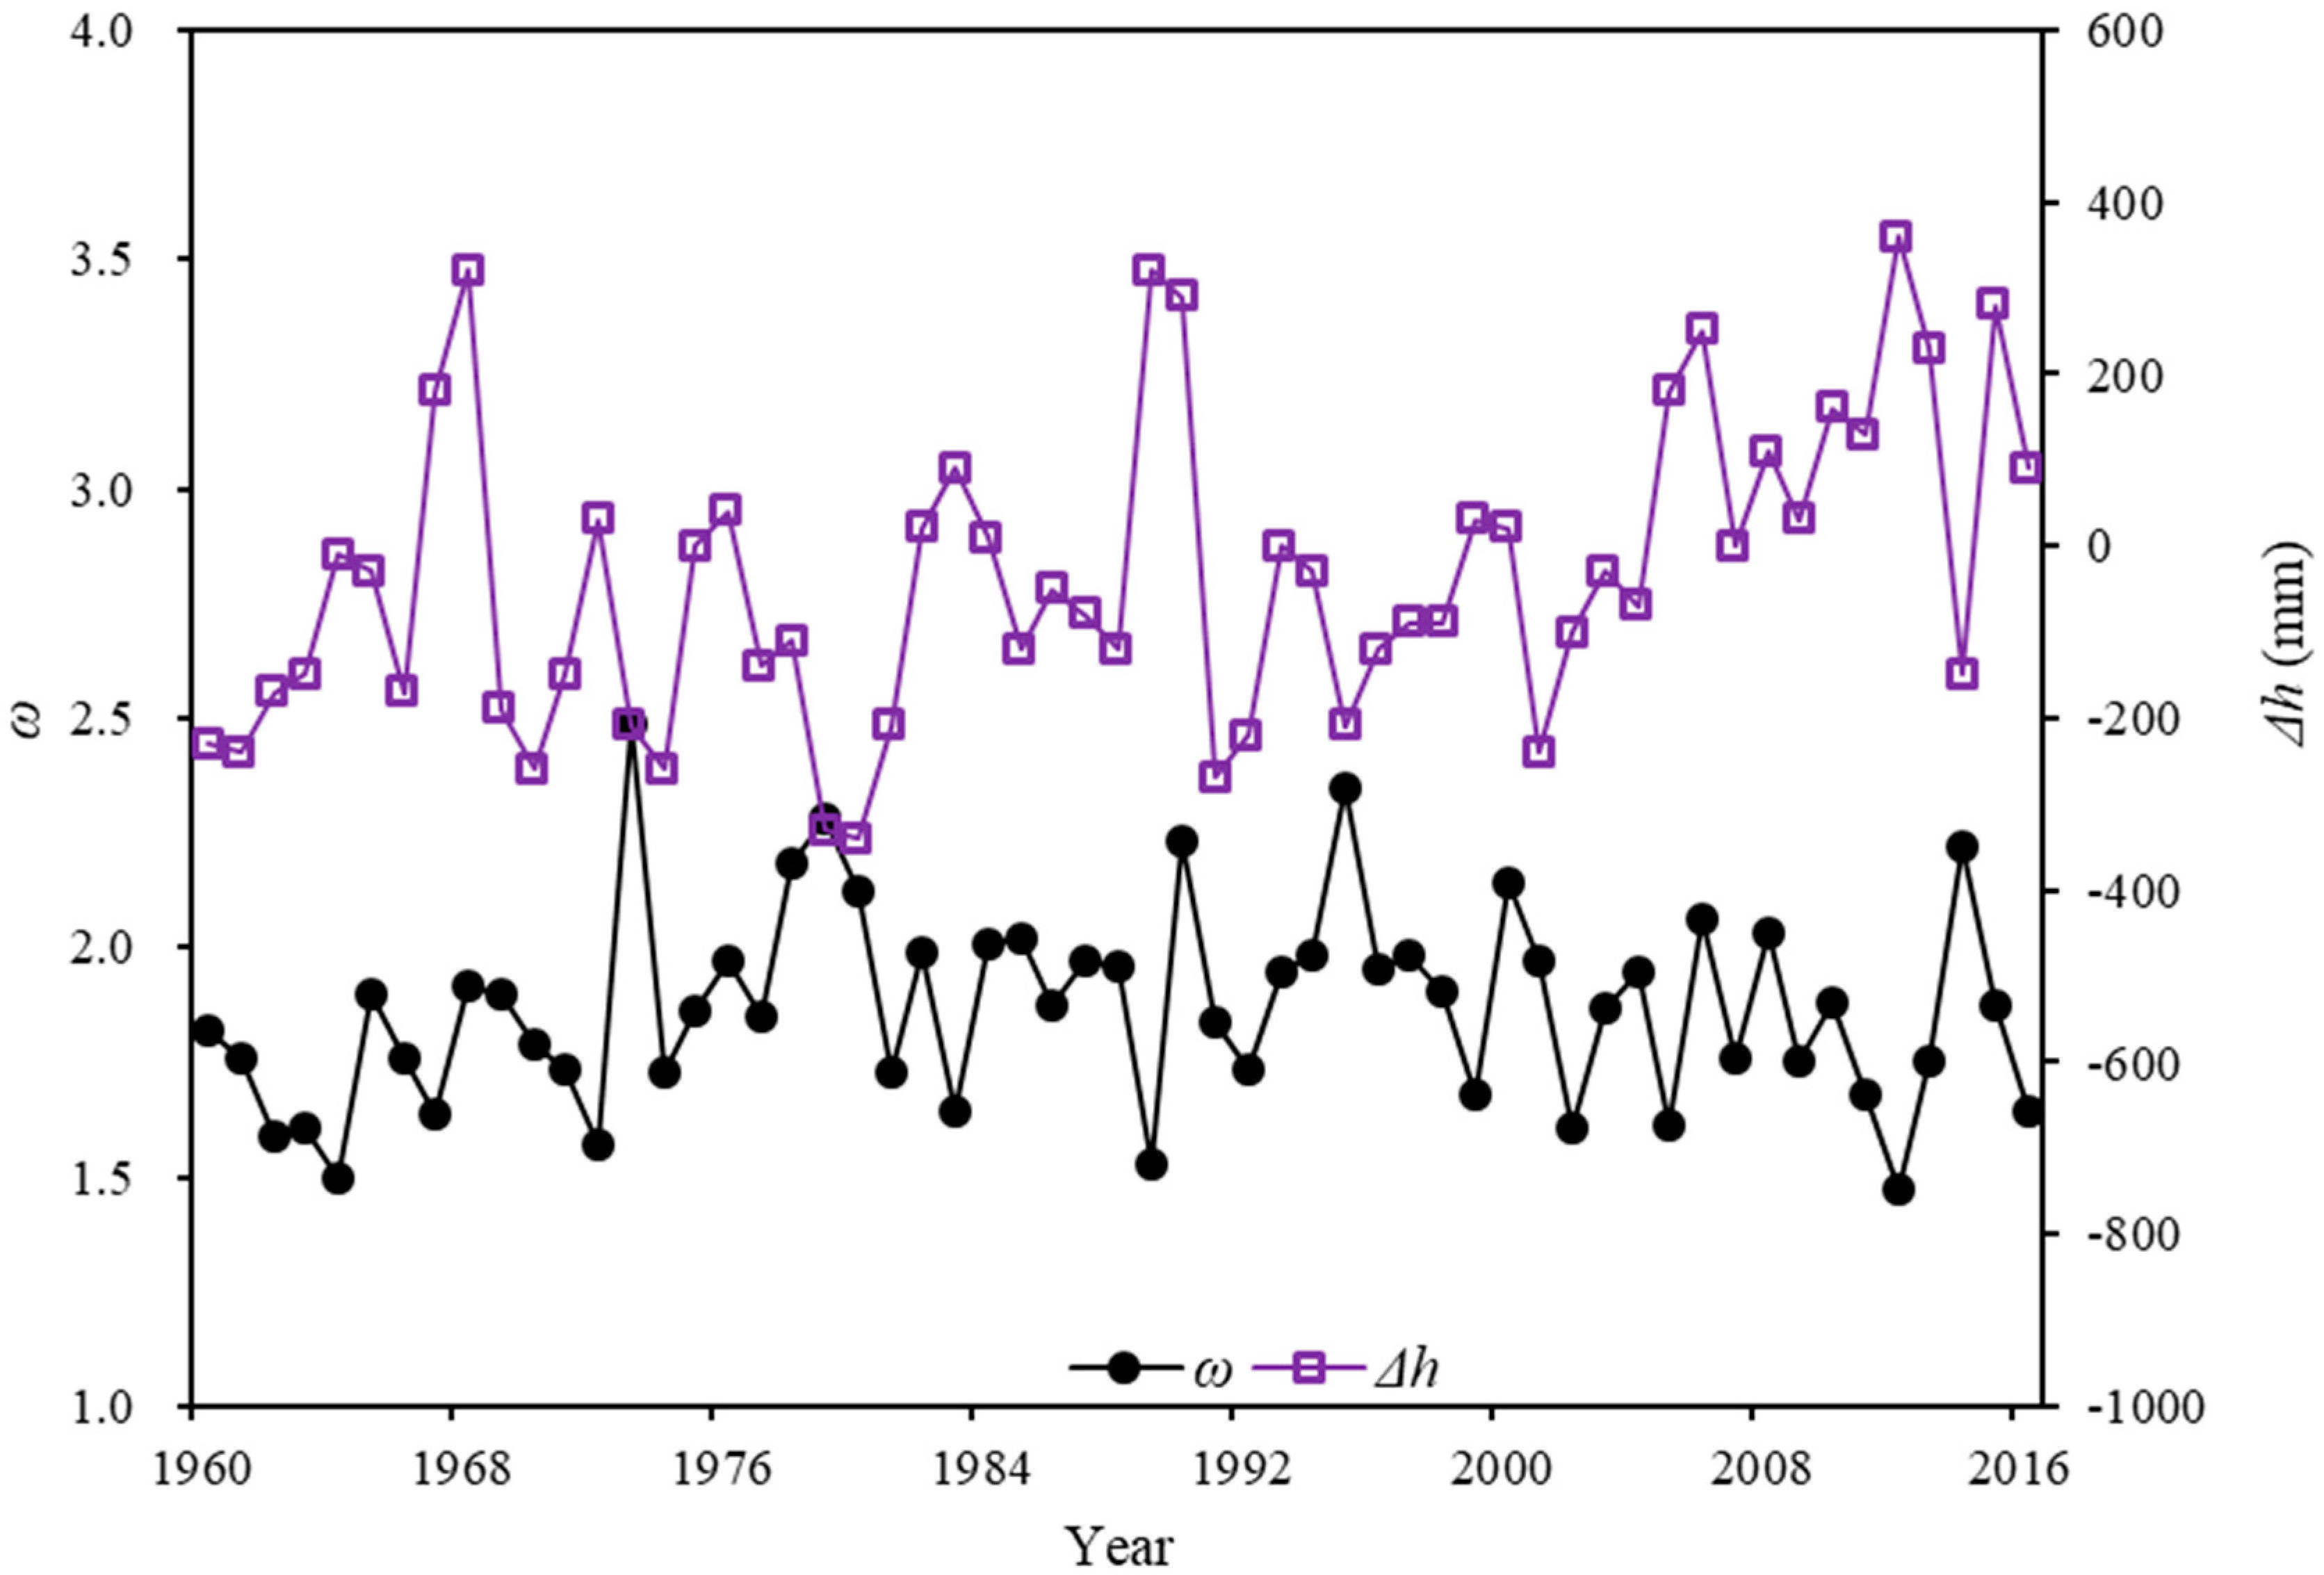
As the overall topography of Qinghai Lake basin is relatively gentle, the production and confluence of the runoff typically have longer durations, highly dependent on the catchment. The empirical parameter representing land surface characteristics of the basin (ω) was calculated by applying the least square method [45] according to Equation (6) and results are displayed in Figure 6. The correlation coefficient between ω and Δh was −0.262 (P < 0.05). Figure 6 and Table 4 confirmed as previously stated that there were little changes in the land use, and the main reasons causing ω changes were not associated with the land change use, but were probably due to changes in local vegetation and soil conditions.
By summarizing all the contributions, results have also confirmed that affecting factors Δh, Pl and El were entirely attributable to climate change, while Rls and Rlg ± ε were the results of the joint action between climate and catchment modifications. Therefore, it became necessary to focus on Rls and Rlg ± ε and to quantify their impact due to climate change and catchment change.
3.2.3. Impact of Climate and Catchment Modifications on the Surface Runoff (Rls)
Surface runoff is a crucial variable to consider when completing any lake water balance [20,53] and in this study it accounted for 45.18~56.62% of the total lake inflow during the study period, which demonstrates how this parameter was a key factor affecting the water level variations in the lake. The correlation coefficient between Rls, and Δh was calculated to be 0.590 (P < 0.01).
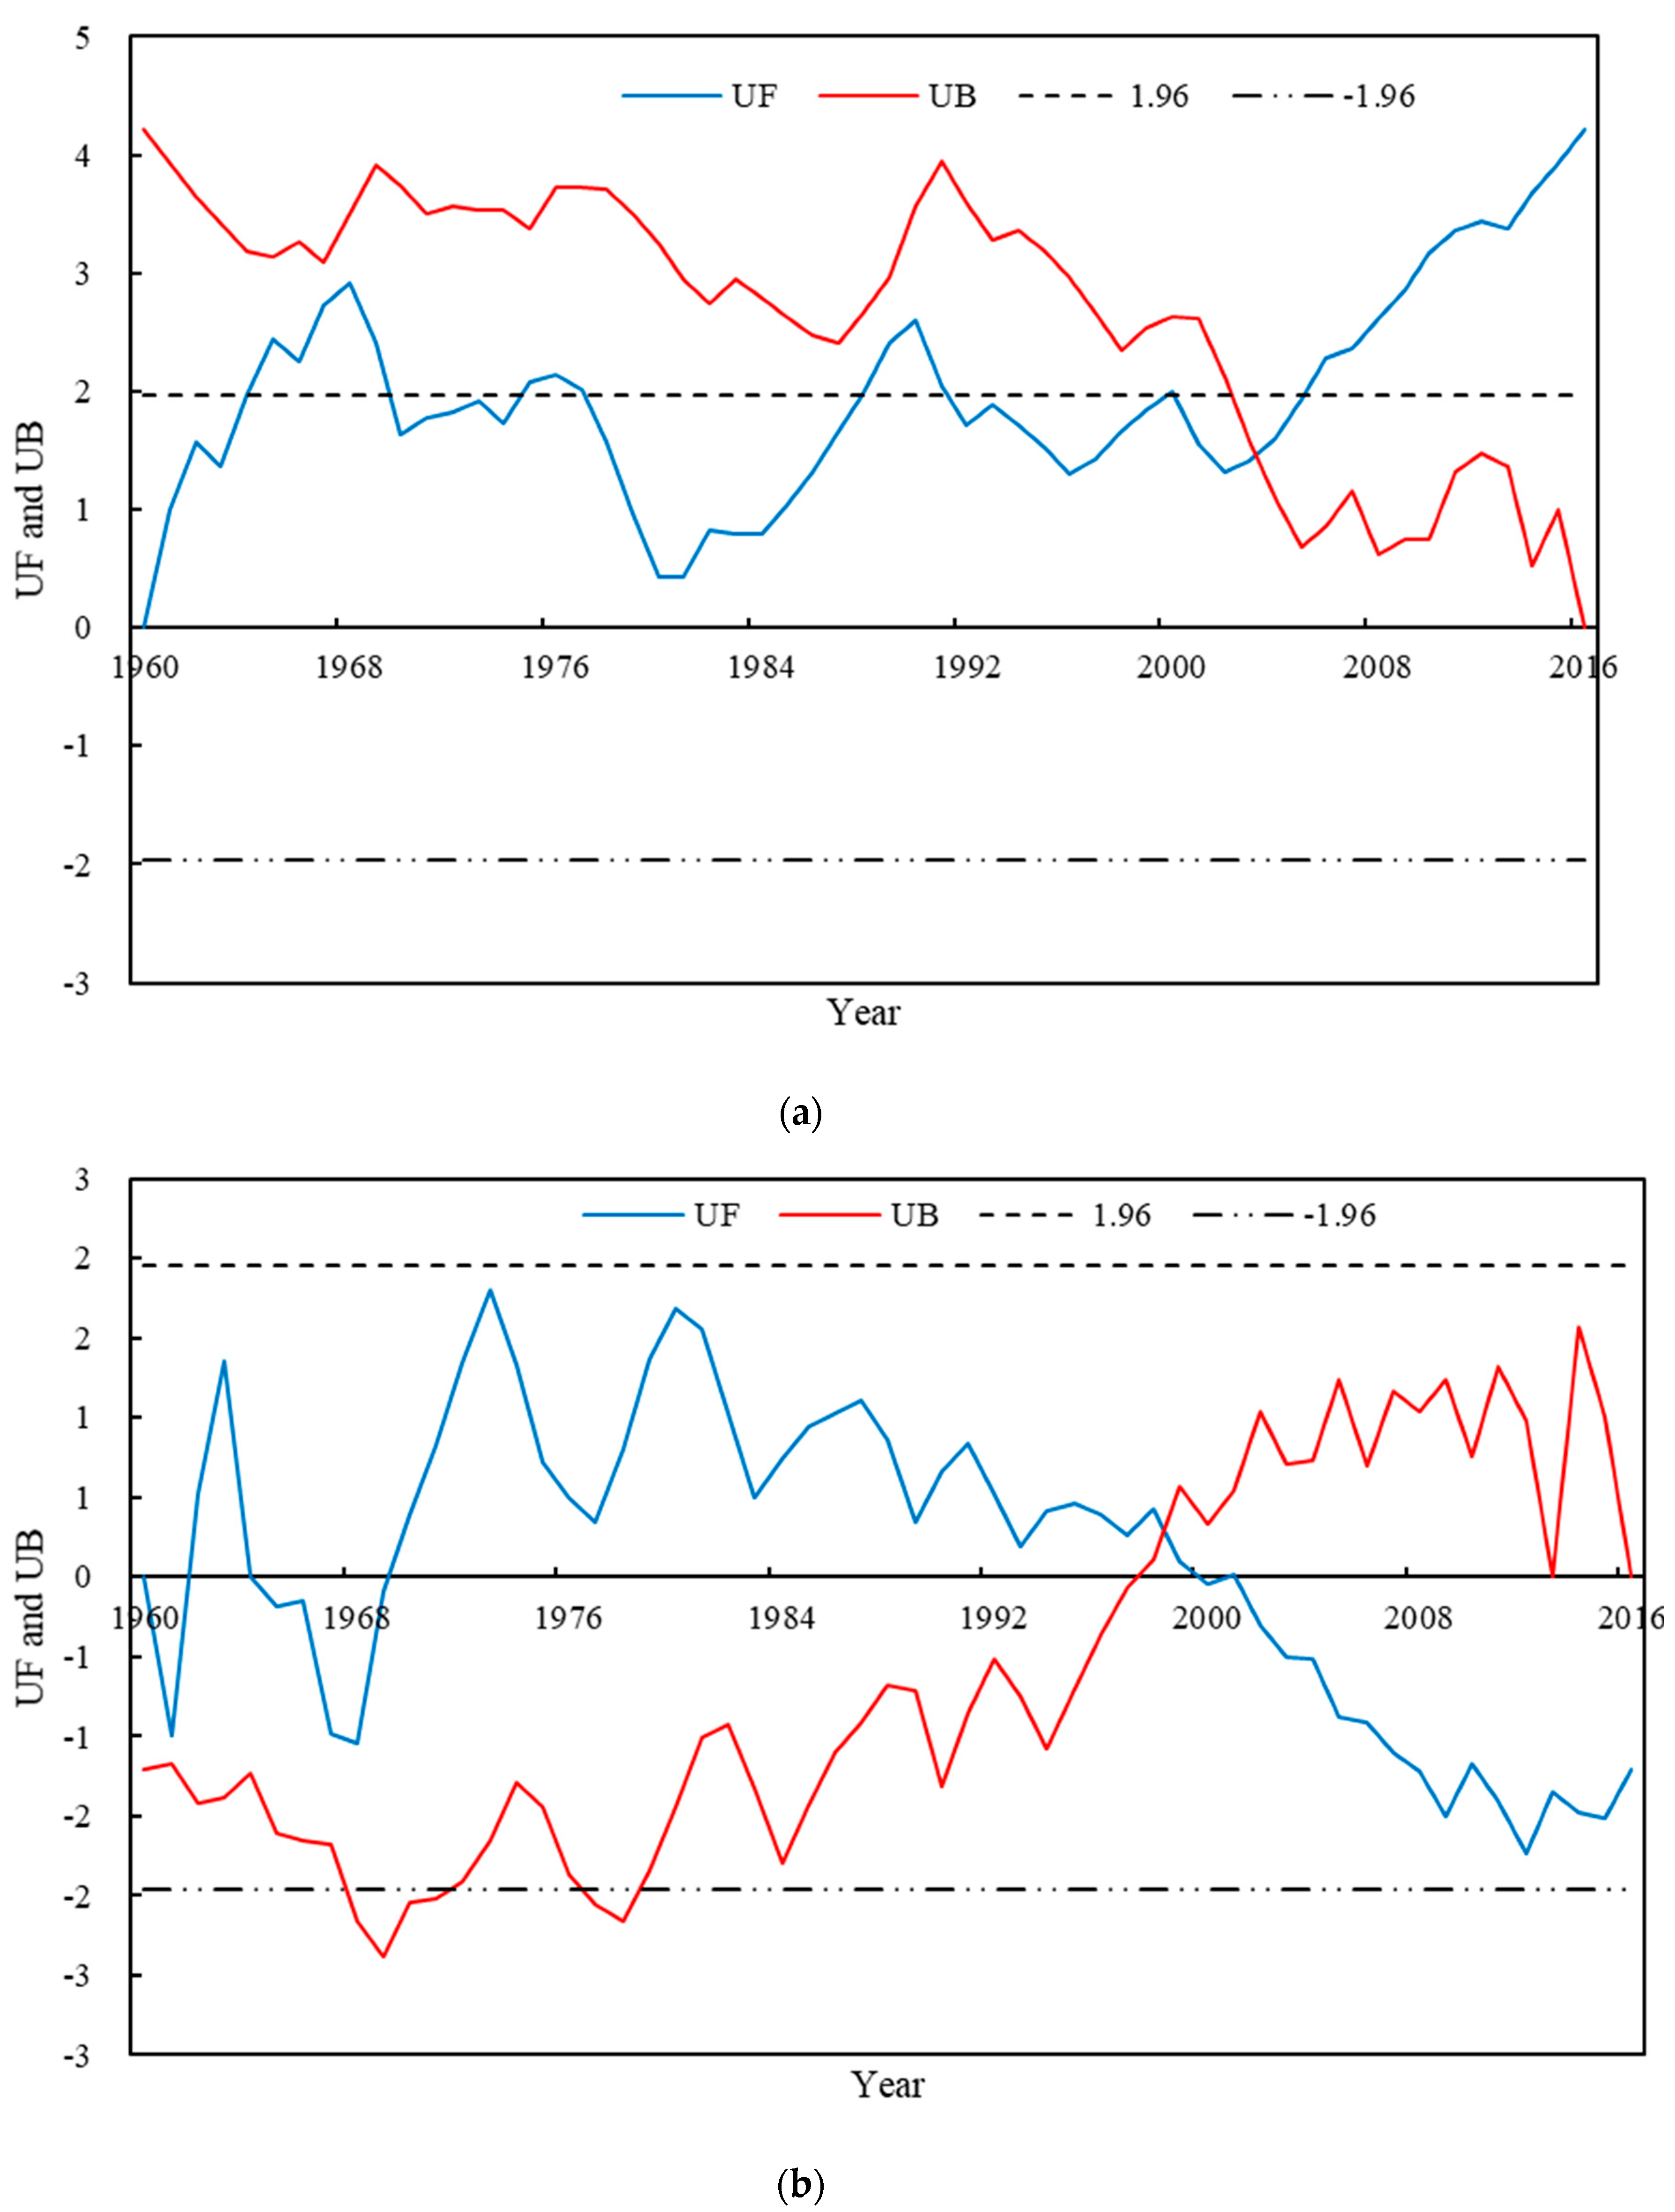
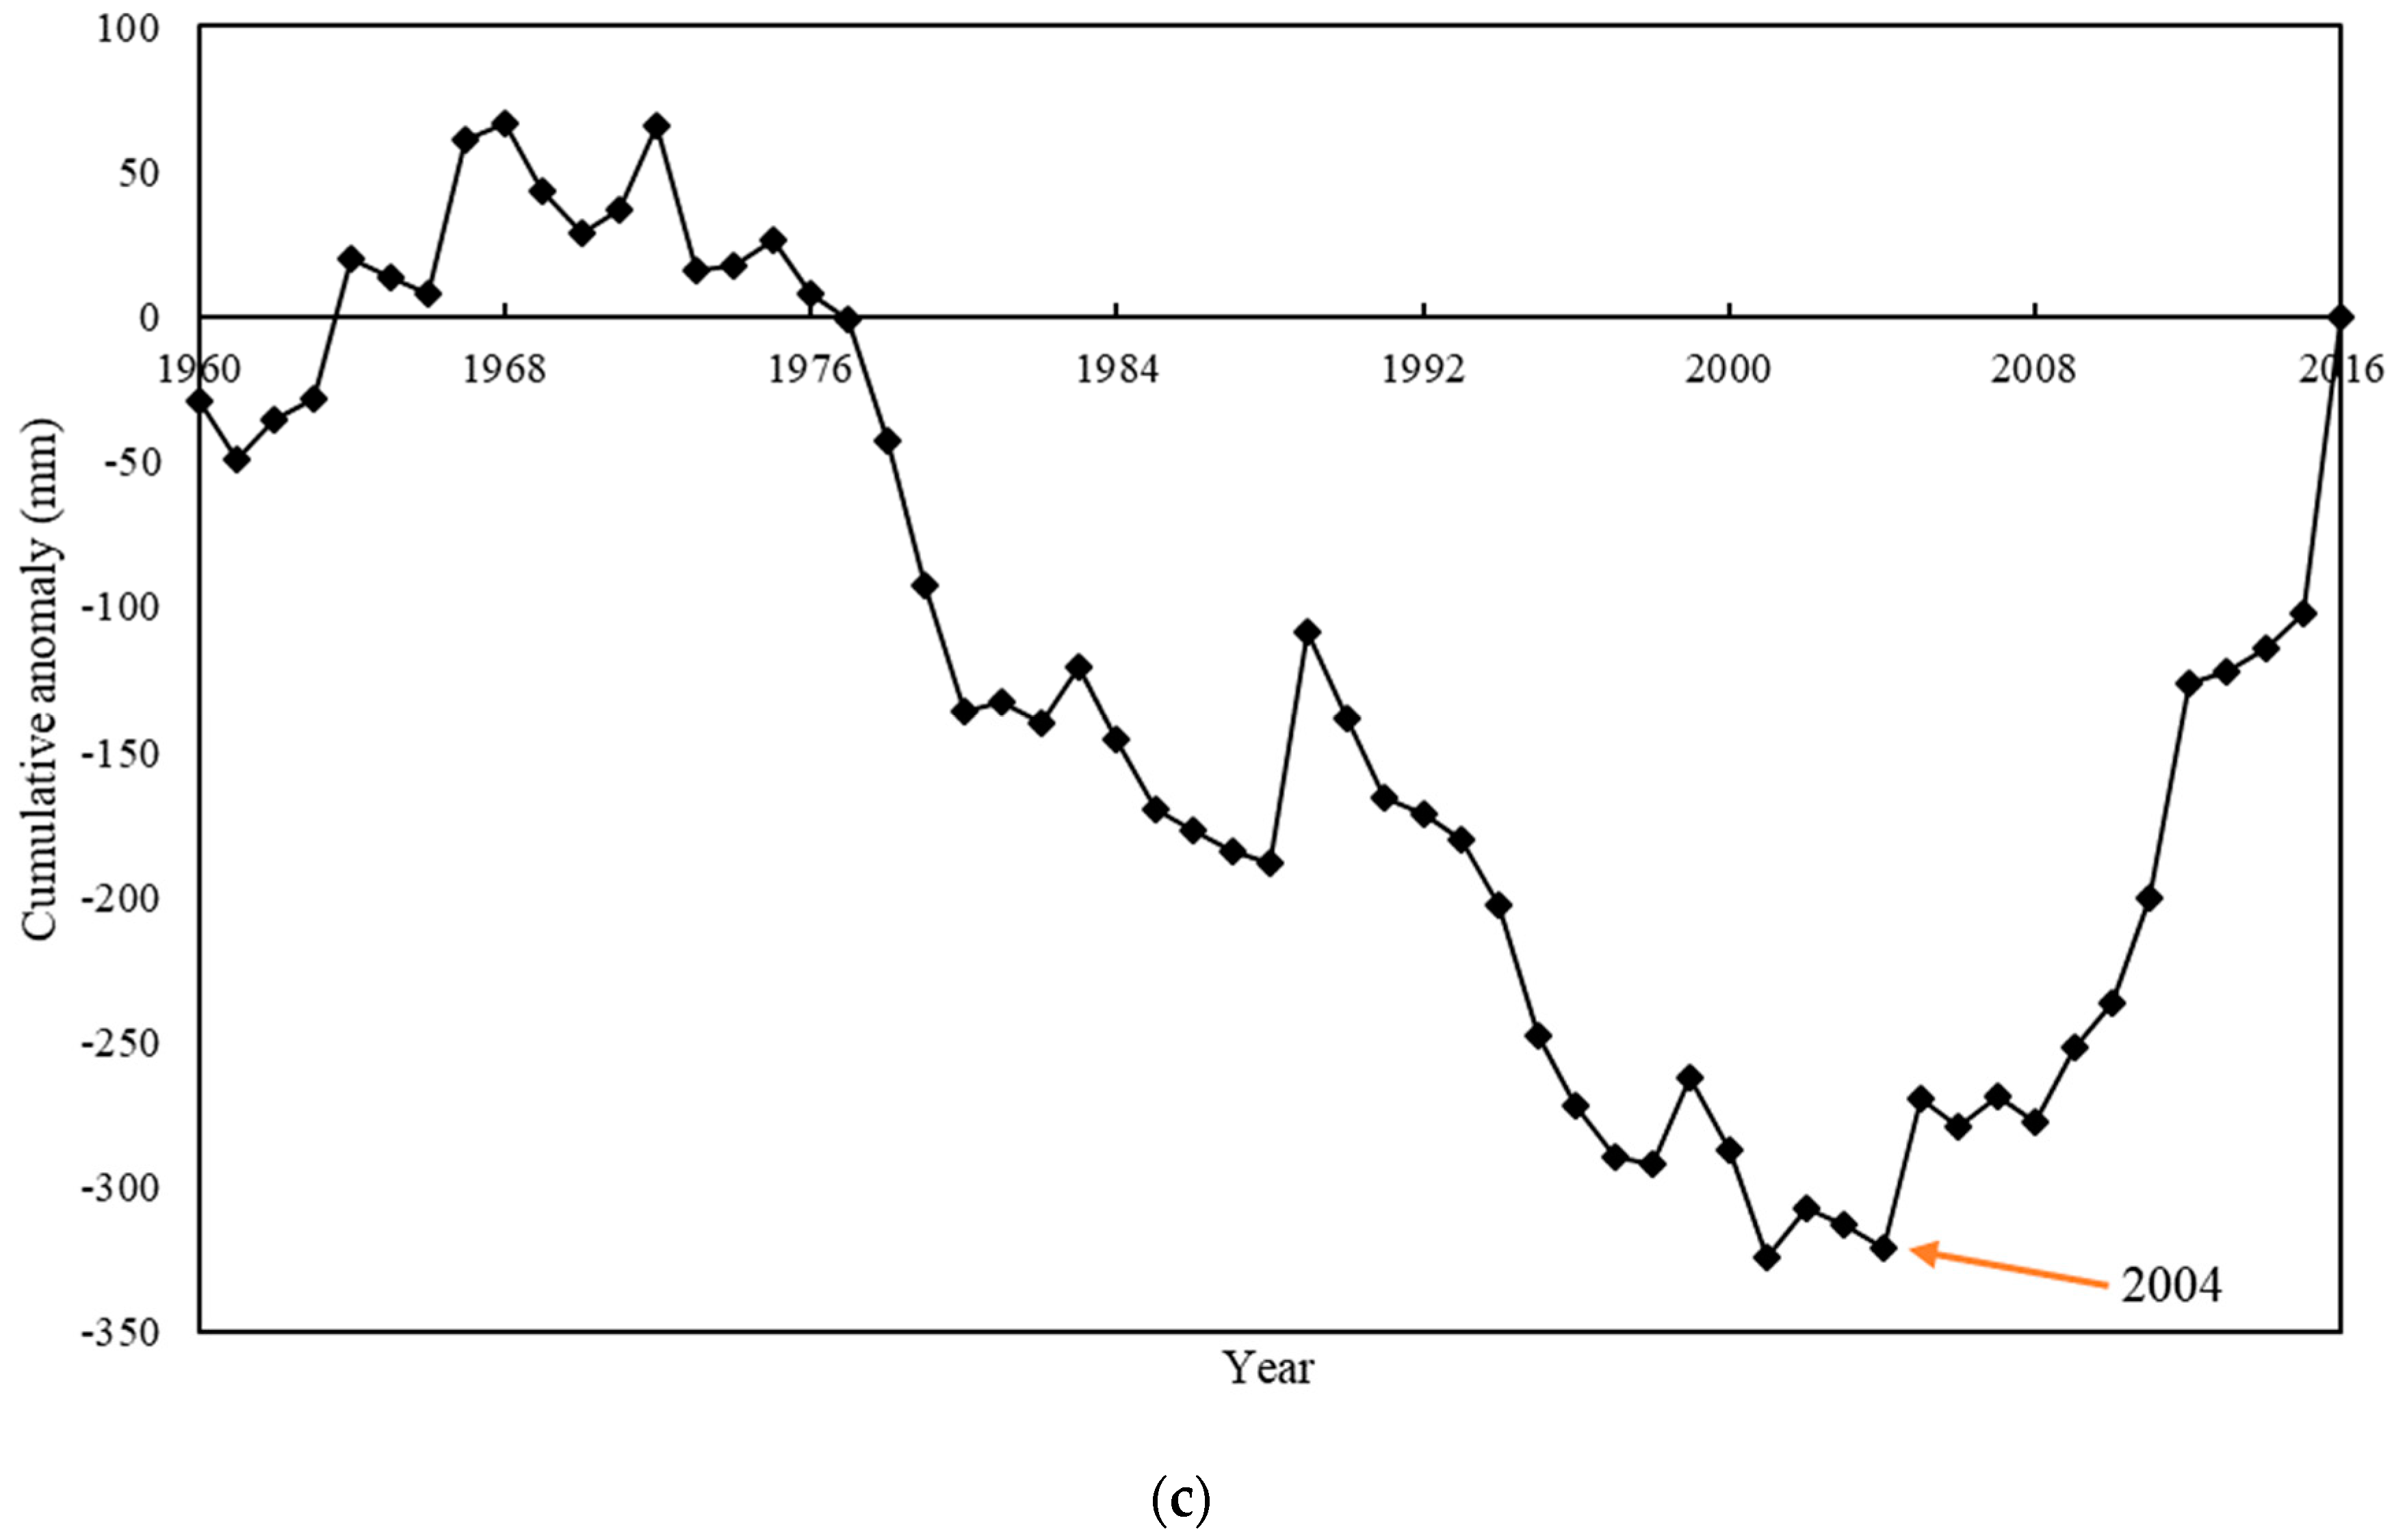
Surface runoff was generated from the surrounding catchment area of about 25,000 km2 (obtained by subtracting the lake area from the total basin area). Surface runoff (mm) was obtained by dividing the annual total runoff of the basin (m3) by the annual catchment area. The catchment area of annual maximum, annual minimum and mean annual values was 25,439.71 km2 (in 2004), 25,136.70 km2 (in 1960), and 25,308.56 km2, respectively. In this paper, the Mann-Kendall test method (M-K test) and the cumulative anomaly method were used to identify remarkable changes in the variables’ behaviors (i.e., surface runoff, precipitation and potential evapotranspiration). As shown in Figure 7a, the precipitation in the basin is always rising ( > 0), and the precipitation trend shows a significant change from 2005 ( > 1.96). The intersection of and curves indicates an abrupt change point in 2003. Furthermore, when focusing on the evapotranspiration trends in Figure 7b, and intersection point was noticed between the two curves in 1998. The M-K test failed to identify any abrupt change point in the trend of the surface runoff recorded, while the cumulative anomaly analysis method correctly estimated it as observed in 2004 (Figure 7c). The results indicated that surface runoff, precipitation and lake water levels were closely related. Additionally, the year corresponding to the anomalies noted in the variation of the lake water levels and the surface runoff slightly lagged behind the year corresponding to the abrupt change point related to the precipitation. Based on the cumulative anomaly analysis method, the runoff series were divided into two periods like the variation of water levels: period I (1960–2004) and period II (2005–2016), which enabled the authors to calculate the basin characteristic parameters and sensitivity coefficients for period I and period II that are presented in Table 5.
According to the results, the total surface runoff variation was measured as +33.9 mm. Contribution rates of climate change and catchment modifications to this variation were calculated using Equations (14) and (15) and the results show that the main cause of runoff change from 1960 to 2016 was climate change (producing an increased surface runoff by 25.54 mm for a corresponding contribution rate of 80.19%). On the other hand, the effect caused by catchment modifications was not to be considered a negligible factor, considering that it generated an increase in surface runoff of 6.31 mm and hence its contribution rate was 19.81%. Error was estimated to be 2 mm, corresponding to 5.91% of the total variation (Table 6).
3.2.4. Impact of Climate and Catchment Modifications on the Underground Runoff (Rlg ± ε)
Rlg ± ε was included in the water balance equation model but due to limitations in data availability, it was more challenging to accurately estimate the effects on its variations due to climate and catchment modifications. However, by applying the equations described in Section 2, the correlation between Rlg ± ε and Δh was calculated to be 0.143.
Underground runoff could be affected directly and indirectly by multiple factors; therefore, the authors believed it was not appropriate to complete a comprehensive and systematic analysis of its dynamic changes by using a single factor analysis. Hence, the principal component regression method [40] was used. The factors xi identified to influence the underground runoff (y) can be summarized as follows:
- water level variation in the lake (x1);
- precipitation on the lake surface area (x2);
- surface runoff of the basin (x3);
- evaporation from the lake surface (x4);
- precipitation across the entire basin area (x5);
- empirical parameter representing land surface characteristics of the basin (x6).
The correlation analysis is shown in Table 7; the multi-collinearity among the influential factors, and the grey relational degree analysis (Table 8) show that each factor had a closed relationship with y, and the grey relational degree of each factor xi is displayed as γi.
It can be seen from Table 9 that the cumulative contribution rates of the first, second and third principal components (F1, F2, F3) were more than 80%, indicating that they basically contained all the information of the original impact factors. Subsequently, the three principal components were used to analyse y. According to Table 10, the linear equations were obtained as follows:
Principal component F1 could be almost interpreted as precipitation on the lake surface area (x2) and precipitation across the entire basin area (x5), principal component F2 as the empirical parameter representing catchment characteristics (x6), and principal component F3 as lake surface evaporation (x4). The catchment factor represents the catchment change; the precipitation and lake evaporation factor represents the climate change. Taking F1 (precipitation factor), F2 (catchment factor), and F3 (evaporation factor) as independent variables and y as a dependent variable, multiple linear regression was carried out, and the partial least squares [43] was adopted to obtain the following equation:
By converting the influence of principal component factors on underground runoff into percentages, it could be known that evaporation had the largest influence on underground runoff (75%), while precipitation and catchment modifications had a significant influence on the underground runoff (−13.43% and −11.57%, respectively) with an inverse relationship.
Therefore, the contribution rate of climate change to underground runoff can be estimated to be 83.43%, while catchment modifications correspond to −11.57%.
3.2.5. Summary
The partial least squares method was used to analyze the contribution rate of Pl, Rls, El and Rlg ± ε to Δh according to Equation (1), and the relative contribution rate obtained was 20.86%, 29.58%, −41.28% and 9.36%, respectively.
The contribution rates of climate change and catchment variability to (Δh) were obtained by the Equations (3) and (4). It was concluded that the contribution rate to the lake water level variations caused by climate and catchment factors was 93.13%, and 6.87%, respectively (Table 11).
4. Discussion
4.1. Relationship between the Hydro-Climatic Factors and Lake Water Level Variations
In line with global warming consequences, high temperatures enhanced water vapor transport and redistribution across the entire catchment area, increasing the precipitation rates on the TP (the precipitation recorded in the basin under investigation increased by 1.4347 mm/year). Furthermore, datasets demonstrated that when temperatures increased, the potential evapotranspiration showed a decreasing trend, which confirmed the theory of the “Evaporation Paradox” [54]. Furthermore, according to datasets recorded, the annual maximum temperature and annual minimum temperatures in the basin had risen during the period of study, while the solar duration and wind speed had significantly decreased [55,56]; therefore, these factors may have had a crucial impact on the reduction of potential evapotranspiration [57]. The evaporation rate in the lake decreased at the beginning (1960–1967), then increased (1968–1979), then declined again towards the end of the period under investigation (1980–2016). During the period from 1960 to 2004, the main reasons for the decline of water levels were the overall strong evaporation, the lack of rain and runoff, and the decrease of evaporation since 1980 could not reverse this negative trend. On the other hand, since 2005, the water level of the lake increased and this could have been due to increased precipitation recorded, combined with more runoff and lower evaporation rates.
Song et al. pointed out that runoff in most parts of the world has been decreasing significantly [58], such as in southern Australia, southern Europe, the southern region of South America and the western region of North America [59], as well as in most areas in the North of China (such as the Huaihe River [60]). While previous studies completed by Zhao et al. [61] showed that the annual runoff reduction at four main hydrologic stations in the Yellow River basin (a neighborhood area adjacent to the one investigated by this study) ranged from 17.93% to 40.79%, the results of this study showed that runoff in Qinghai Lake basin presented an upward trend, which was similar to the research of Wang et al. [62]. The results of runoff evolution attribution analysis showed that the increase in precipitation and the decrease of evaporation are the main factors leading to the increase in runoff. The trends of surface runoff and water level variations of lake were strongly consistent, and water level variations were largely affected by the effects of the climate factors. The change in precipitation had a more obvious influence on the runoff in the basins of TP, which are relatively arid, than in the humid area.
It was found that fluctuation of the annual underground runoff was not only affected by precipitation, evaporation and infiltration of surface runoff in the lake area and surrounding areas, but was also related to the fluctuation of water levels of the lake [29], and there was a noticeable connection between surface water and groundwater [63,64], showing that the runoff into the lake had positive and negative values. Since 2005, the decrease of evaporation and the increase in precipitation changed the conversion process of surface runoff and underground runoff, and the negative values increased significantly, indicating that more and more water in the lake was replenishing groundwater.
4.2. Relationship between the Catchment Modifications and Water Level Variations
In general, water level variations in the lake were the result of combined effects due to climate change and human activities. Among them, direct water intake (e.g., agricultural irrigation and drinking water for livestock) only affected the inflow rates into the lake for 4.8% of the total river discharge [28]; hence, it can be considered a negligible factor. By also developing farming areas and reducing forests (especially with local projects started in 2000), direct water intake dropped even more. Therefore, this paper did not consider the influence of direct water intake on water level changes but mainly focused on the influence of climate change and catchment change on water levels.
In those areas potentially affected by major human activities, the changes in ω were mainly manifested in land use changes and vegetation changes. It was found that 72% of the total grassland showed significant improvement in Qinghai Lake basin [65]; however, Qinghai lake basin is located at a high altitude and it is affected by a cold climate, and has low population density (4.08 people/km2), so there was little impact due to the land use changes. With the implementation of the returning pasture (farmland) to grass project since 1999 and the comprehensive management project in Qinghai Lake basin since 2008, the vegetation condition had been improved, and changes are reflected in ω trends.
According to the research conducted by Yuan [66], the annual average ground temperature in Qinghai Lake area increased by a rate of 0.74 °C/10 years. The depth of the annual average maximum permafrost region was then reduced by the rate of 11.7 cm/10 years and the change of permafrost layers [25,67] could definitely change the hydrologic processes under investigation. By becoming smaller, the permafrost area could not contribute consistently as previously to regulate the runoff of the catchment.
4.3. Uncertainty
The range of hydrological processes typical of great lakes is inherently uncertain, plus data scarcity adds uncertainty and methodological limitations. Firstly, this study assumed that climate and catchment were independent of each other, but the two factors were interacting in nature [68], and the effects could have also cancelled each other out. Secondly, the mathematical statistics method was used to obtain the contribution rate of climate and catchment modifications to underground runoff, but these methods had some limitations within the assumptions. Finally, the presence of permafrost complicated the investigation of hydrological processes and the characterization of their anomaly behaviors associated with climate warming.
Despite these limitations, the main purpose of this study was to use existing monitoring data to analyze the evolution law of Qinghai Lake level, separating the contribution rate of climate and catchment change to the water level variation, and better guide the future water resource management and rational utilization. From 1960 to 2016, the maximum lake area of Qinghai Lake was 4527.3 km2 (in 1960), while the minimum was 4224.3 km2 (in 2004), with a difference of 303 km2, which is equivalent to the size of Co Nag Lake in China, the highest fresh water lake in the world. Therefore, this study can be very useful as a pilot case to associate with other behaviors recorded in lakes with similar and different conditions.
5. Conclusions
This study analyzed the trend of water level variation and hydro-climatic factors in Qinghai Lake Basin from 1960 to 2016 and revealed the main causes affecting the lake water levels. The paper provided a reference base for the development and management of water management in this region and provided important insights that could be applied to other basins.
Conclusions can be summarized as follows:
- (1)
- Qinghai lake experienced severe water level fluctuations in the past 57 years. In period I (1960–2004), the annual water level of the lake declined by 3.46 m at the rate of 7.84 cm/year (P < 0.001), while it rose by 1.49 m at the rate of 13.80 cm/year (P < 0.001) in period II (2005 to 2016). The variation in water level Δh mainly tended to increase during the study period, and the water quantity of the lake increased, passing temporarily from a deficit rate to a surplus one.
- (2)
- The correlation relationships between El, Pl, Rls, Rlg ± ε, ω and Δh followed this order: El (−0.705) > Rls (0.590) > Pl (0.356) > ω (−0.262) > Rlg ± ε (0.143). Overall, the major cause of water level change in Qinghai Lake was the combined effect of evaporation (causing a reduction in water quantities), and precipitation (causing a surface runoff increase).
- (3)
- The contribution rate of multiple factors to the water balance of Qinghai Lake Basin to Δh was quantified and it can be classified as follows: El (−49.34%) > Pl (29.82%) > Rls (16.76%) > Rlg ± ε (4.08%). Among all the factors investigated, El and Pl belong to climate change factors; hence, by combining the contribution rates of climate change and catchment change induced by human activities to Rls, the results obtained were 80.19%, 19.81%, respectively, and those related to Rlg ± ε were 8.44%, −11.56%, respectively. Therefore, the contribution rate for both groups of parameters to Δh was in total 93.13%, 6.87%, respectively. The results showed that climate change was the leading cause of significant changes in water levels in the lake.
- (4)
- The impact of global climate change on the hydrology and environment of the Tibetan Plateau was clear, strongly confirming the high sensitivity of great lakes on the Tibetan Plateau to climate change, and solutions need to be adopted to enable strategies to deal and cope with future climate change scenarios.
Author Contributions
J.F. and G.L. and J.Z. designed the study. J.F. performed the analysis and wrote the first draft of the manuscript. M.R., G.M., X.Y. and H.W. contributed to reviewing and editing the final version of the manuscript, software: G.J.
Funding
This research was supported by the National Key Research and Development Program of China (2016YFC0500802), and the Beijing Municipal Education Commission (CEFF-PXM2019_014207_000099), and Special Funds for Scientific Research of Forestry Public Welfare Industry (201404308), and Driving Analysis of Extreme Climate Events on Variation of Runoff and Sediment Discharge in Jinsha River Basin, the National Natural Science Foundation of China (Grant No. 41601279).
Acknowledgments
The authors would like to give special thanks to the Institute of Information Center of Qinghai Hydrographic Bureau, China (ICQHB) for providing data on water levels, evaporation and surface runoff.
Conflicts of Interest
The authors declare no conflict of interest.
References
- IPCC. Climate Change 2014: Synthesis Report. Contribution of Working Groups I, II and III to the Fifth Assessment Report of the Intergovernmental Panel on Climate Change; Core Writing Team; Pachauri, R.K., Meyer, L.A., Eds.; IPCC: Geneva, Switzerland, 2014; pp. 39–55. [Google Scholar]
- IPCC. Special Report on Global Warming of 1.5 °C (SR15); Cambridge University Press: Cambridge, UK, 2018; pp. 53–68. [Google Scholar]
- Vorosmarty, C.J.; Green, P.; Salisbury, J.; Lammers, R.B. Global water resources: Vulnerability from climate change and population growth. Science 2000, 289, 284–288. [Google Scholar] [CrossRef] [PubMed]
- Scanlon, B.R.; Jolly, I.; Sophocleous, M.; Zhang, L. Global impacts of conversion from natural to agricultural ecosystem on water resources: Quantity versus quality. Water Resour. Res. 2007, 43, W03437. [Google Scholar] [CrossRef]
- IJmker, J.; Stauch, G.; Pötsch, S.; Diekmann, B.; Wünnemann, B.; Lehmkuhl, F. Dry periods on the NE Tibetan Plateau during the late Quaternary. Palaeogeogr. Palaeoclimatol. Palaeoecol. 2012, 346–347, 108–119. [Google Scholar] [CrossRef]
- Clites, A.H.; Smith, J.P.; Hunter, T.S.; Gronewold, A.D. Visualizing relationships between hydrology, climate, and water level fluctuations on Earth’s largest system of lakes. J. Gt. Lakes Res. 2014, 40, 807–811. [Google Scholar] [CrossRef]
- Assani, A.A.; Landry, R.; Azouaoui, O.; Massicotte, P.; Gratton, D. Comparison of the Characteristics (Frequency and Timing) of Drought and Wetness Indices of Annual Mean Water Levels in the Five North American Great Lakes. Water Resour Manag. 2016, 30, 359–373. [Google Scholar] [CrossRef]
- Gronewold, A.D.; Fortin, V.; Lofgren, B.; Clites, A.; Stow, C.A.; Quinn, F. Coasts, water levels, and climate change: A Great Lakes perspective. Clim. Chang. 2013, 120, 697–711. [Google Scholar] [CrossRef]
- Zhu, W.B.; Jia, S.F.; Lall, U.; Cao, Q.; Mahmood, R. Relative contribution of climate variability and human activities on the water loss of the Chari/Logone River discharge into Lake Chad: A conceptual and statistical approach. J. Hydrol. 2019, 569, 519–531. [Google Scholar] [CrossRef]
- Paillisson, J.; Marion, L. Water level fluctuations for managing excessive plant biomass in shallow lakes. Ecol. Eng. 2011, 37, 241–247. [Google Scholar] [CrossRef]
- Rohling, E.J. Quantitative assessment of glacial fluctuations in the level of Lake Lisan, Dead Sea rift. Quat. Sci. Rev. 2013, 70, 63–72. [Google Scholar] [CrossRef]
- Ye, X.C.; Li, Y.L.; Li, X.H.; Zhang, Q. Factors influencing water level changes in China’s largest freshwater lake, Poyang Lake, in the past 50 years. Water Int. 2014, 39, 983–999. [Google Scholar] [CrossRef]
- Dai, X.; Wan, R.R.; Yang, G.S. Non-stationary water-level fluctuation in China’s Poyang Lake and its interactions with Yangtze River. J. Geogr. Sci. 2015, 25, 274–288. [Google Scholar] [CrossRef]
- Dai, X.; Wan, R.R.; Yang, G.S.; Wang, X.L.; Xu, L.G. Responses of wetland vegetation in Poyang Lake, China to water-level fluctuations. Hydrobiologia 2016, 773, 35–47. [Google Scholar] [CrossRef]
- You, Q.L.; Kang, S.C.; Aguilar, E.; Yan, Y.P. Changes in daily climate extremes in the eastern and central Tibetan Plateau during 1961–2005. J. Geophys. Res. 2008, 113, D07101. [Google Scholar] [CrossRef]
- Chen, S.Y.; Liang, T.G.; Xie, H.J.; Feng, Q.S.; Huang, X.D.; Yu, H. Interrelation among climate factors, snow cover, grassland vegetation, and lake in the Nam co basin of the Tibetan plateau. J. Appl. Remote. Sens. 2014, 8, 084694. [Google Scholar] [CrossRef]
- Ke, L.H.; Song, C.Q. Remotely sensed surface temperature variation of an inland saline lake over the central Qinghai–Tibet Plateau. ISPRS J. Photogramm. Remote Sens. 2014, 98, 157–167. [Google Scholar] [CrossRef]
- Zhang, G.Q.; Yao, T.; Xie, H.J.; Zhang, K.; Zhu, F.J. Lakes’ state and abundance across the Tibetan Plateau. Chin. Sci. Bull. 2014, 24, 3010–3021. [Google Scholar] [CrossRef]
- Zhang, Z.X.; Chang, J.; Xu, C.Y.; Zhou, Y.; Wu, Y.H.; Chen, X.; Jiang, S.S.; Duan, Z. The response of lake area and vegetation cover variations to climate change over the Qinghai-Tibetan Plateau during the past 30 years. Sci. Total Environ. 2018, 635, 443–451. [Google Scholar] [CrossRef]
- Cui, B.L.; Li, X.Y. The impact of climate changes on water level of Qinghai Lake in China over the past 50 years. Hydrol. Res. 2016, 47, 532–542. [Google Scholar] [CrossRef]
- Lu, F.; Li, X. Climate change and tectonic activity during the early Pliocene Warm Period from the ostracod record at Lake Qinghai, northestern Tibetan Plateau. J. Asian Earth Sci. 2017, 138, 446–476. [Google Scholar] [CrossRef]
- Tang, L.; Duan, X.; Kong, F.; Zhang, F.; Zheng, Y.; Li, Z.; Mei, Y.; Zhao, Y.; Hu, S. Influences of climate change on area variation of Qinghai Lake on Qinghai-Tibetan Plateau since 1980s. Sci. Rep. 2018, 8, 7331. [Google Scholar] [CrossRef]
- Karthe, D.; Malsy, M.; Kopp, B.J.; Minderlein, S.; Hülsmann, L. Assessing water availability and drivers in the context of an integrated water resources management (IWRM): A case study from the Kharaa river basin. Mong. Open-File Rep. 2013, 34, 5–26. [Google Scholar]
- Hampton, S.E.; Izmest’Eva, L.R.; Moore, M.V.; Katz, S.L.; Dennis, B.; Silow, E.A. Sixty years of environmental change in the world’s largest freshwater lake-Lake Baikal, Siberia. Glob. Chang. Biol. 2008, 14, 1947–1958. [Google Scholar] [CrossRef]
- Magnuson, J.J.; Robertson, D.M.; Benson, B.J.; Wynne, R.H.; Livingstone, D.M.; Arai, T.; Assel, R.A.; Barry, R.G.; Card, V.V.; Kuusisto, E.; et al. Historical trends in lake and river ice cover in the Northern Hemisphere. Science 2000, 289, 1743–1746. [Google Scholar] [CrossRef]
- Crapper, P.F.; Fleming, P.M.; Kalma, J.D. Prediction of lake levels using water balance models. Environ. Softw. 1996, 11, 251–258. [Google Scholar] [CrossRef]
- Soja, G.; Züger, J.; Knoflacher, M.; Kinner, P.; Soja, A. Climate impacts on water balance of a shallow steppe lake in Eastern Austria (Lake Neusiedl). J. Hydrol. 2013, 480, 115–124. [Google Scholar] [CrossRef]
- Li, X.Y.; Xu, H.Y.; Sun, Y.L.; Zhang, D.S. Lake-level change and water balance analysis at lake Qinghai, west China during recent decades. Water Resour. Manag. 2007, 21, 1505–1516. [Google Scholar] [CrossRef]
- Qu, Y.G. Water balance and forecasting of water level change in Qinghai Lake. J. Lake Sci. 1994, 6, 298–307. [Google Scholar] [Green Version]
- Ma, F.Y. Reason Analyses and Strategies for the Water Label Drop-Off of the Qinghai Lake; Xi’an University of Technology: Xi’an, China, 2002; pp. 22–27. [Google Scholar]
- Ding, Y.J.; Liu, F.J. Estimating water balance elements in the drainage basin of Qinghai Lake. Arid Land Geogr. J. 1993, 16, 25–30. [Google Scholar]
- Chen, S.P.; Tong, Q.X.; Guo, H.D. Research on the Mechanism of Remote Sensing Information; Science Press: Beijing, China, 1998; pp. 84–113. [Google Scholar]
- Mann, H.B. Nonparametric tests against trend. Econom. J. Econom. Soc. 1945, 13, 245–259. [Google Scholar] [CrossRef]
- Kendall, M.G. Rank Correlation Methods, 3rd ed.; Hafner Publishing Company: New York, NY, USA, 1962; pp. 92–126. [Google Scholar]
- Mitchell, J.M.; Dzerdzeevskii, B.; Flohn, H.; Hofmeyr, W.L.; Lamb, H.H.; Rao, K.N.; Wallen, C.C. Climatic Change, WMO Technical Note 79; World Meteorological Organization: Geneva, Switzerland, 1966; pp. 1–79. [Google Scholar]
- Liang, L.Q.; Li, L.J.; Liu, Q. Temporal variation of reference evapotranspiration during 1961–2005 in the Taoer River basin of Northeast China. Agric. For. Meteorol. 2010, 150, 298–306. [Google Scholar] [CrossRef]
- Wei, F.Y. Statistical Techniques of Modern Climatic Diagnosis and Forecasting; China Meteorological Press: Beijing, China, 1999; pp. 63–65. [Google Scholar]
- Shang, X.X.; Jiang, X.H.; Jia, R.N.; Chen, W. Land Use and Climate Change Effects on Surface Runoff Variations in the Upper Heihe River Basin. Water 2019, 11, 344. [Google Scholar] [CrossRef]
- Yang, L.S.; Feng, Q.; Yin, Z.L.; Wen, X.H.; Si, J.H.; Deo, R.C. Identifying separate impacts of climate and land use/cover change on hydrological processes in upper stream of Heihe River, Northwest China. Hydrol. Process. 2017, 31, 1100–1112. [Google Scholar] [CrossRef]
- Jolliffe, I.T. Principal Component Analysis; Springer: New York, NY, USA, 1986; pp. 111–137. [Google Scholar]
- Deng, J.L. Control problems of grey systems. Syst. Control Lett. 1982, 1, 288–294. [Google Scholar]
- Plackett, R.L. The discovery of the method of Least Squares. Biometrika 1972, 59, 239–251. [Google Scholar]
- Wold, S.; Ruhe, A.; Wold, H.; Dunn, I.W.J. The collinearity problem in linear regression, the partial least squares (PLS) approach to generalized inverses. Siam J. Sci. Stat. Comput. 1984, 5, 735–743. [Google Scholar] [CrossRef]
- Liu, X.M.; Zhang, D.; Luo, Y.Z.; Liu, C.M. Spatial and temporal changes in aridity index in northwest China: 1960 to 2010. Theor. Appl. Climatol. 2013, 112, 307–316. [Google Scholar] [CrossRef]
- Li, B.; Li, L.J.; Qin, Y.C.; Liang, L.Q.; Li, J.Y.; Liu, Y.M. Impact of climate variability on streamflow in the upper and middle reaches of the Taoer River based on the Budyko hypothesis. Resour. Sci. 2011, 33, 70–76. [Google Scholar]
- Budyko, M.I. Climate and Life; Academic Press: New York, NY, USA, 1974; pp. 317–508. [Google Scholar]
- Fu, B.P. On the calculation of the evaporation from land surface. Sci. Atmos. Sin. 1981, 5, 23–31. [Google Scholar]
- Yang, D.W.; Shao, W.W.; Yeh, P.J.F.; Yang, H.B.; Kanae, S.; Oki, T.K. Impact of vegetation coverage on regional water balance in the nonhumid regions of China. Water Resour. Res. 2009, 45, W00A14. [Google Scholar] [CrossRef]
- Donohue, R.J.; Roderick, M.L.; McVicar, T.R. Roots, storms and soil pores: Incorporating key ecohydrological processes into Budyko’s hydrological model. J. Hydrol. 2012, 436–437, 35–50. [Google Scholar] [CrossRef]
- Allen, R.G.; Pereira, L.S.; Raes, D.; Smith, M. Crop Evapotranspiration: Guidelines for Computing Crop Water Requirements-FAO Irrigation and Drainage Paper 56; FAO: Rome, Italy, 1998; Volume 300, p. D05109. [Google Scholar]
- Liu, C.M.; Zhang, D. Temporal and spatial change analysis of the sensitivity of potential evapotranspiration to meteorological influencing factors in China. Acta Geogr. Sin. 2011, 66, 579–588. [Google Scholar]
- Zhu, G.F.; He, Y.Q.; Pu, T.; Wang, X.F.; Jia, W.X.; Li, Z.S.; Xin, H.J. Spatial distribution and temporal trends in potential evaporation over Hengduan Mountains Region from 1960 to 2009. Acta Geogr. Sin. 2011, 66, 905–916. [Google Scholar]
- El-Zehairy, A.A.; Lubczynski, M.W.; Gurwin, J. Interactions of artificial lakes with groundwater applying an integrated MODFLOW solution. Hydrogeol. J. 2018, 26, 109–132. [Google Scholar] [CrossRef]
- Michael, L.R.; Graham, D.F. The cause of decreased pan evaporation over the past 50 years. Science 2002, 298, 1410–1411. [Google Scholar]
- Hao, X.N.; Li, Y.T.; Li, B.Y. Variation Characteristics of Pan Evaporation and Its Influence Factor. J. Anhui Agric. Sci. 2011, 39, 19405–19409. [Google Scholar]
- Liu, B.K. Spatial and Temporal Variation Characteristics of Grassland and Lake in Qinghai Lake Basin under Climate Change; Lanzhou University: Lanzhou, China, 2016; pp. 16–19. [Google Scholar]
- Yin, Y.H.; Wu, S.H.; Dai, E.F. Determining factors in potential evapotranspiration changes over China in the period 1971–2008. Chin. Sci Bull. 2010, 55, 2226–2234. [Google Scholar] [CrossRef]
- Song, X.M.; Zhang, J.Y.; Zhan, C.S.; Liu, C.Z. Review for impacts of climate change and human activities on water cycle. J. Hydraul. Eng. 2013, 44, 779–790. [Google Scholar]
- Milly, P.C.D.; Dunne, K.A.; Vecchia, A.V. Global pattern of trends in streamflow and water availability in a changing climate. Nature 2005, 438, 347–350. [Google Scholar] [CrossRef]
- Committee of China’s National Assessment Report on Climate Change. China’s National Assessment Report on Climate Change; Science Press: Beijing, China, 2007; pp. 202–211. [Google Scholar]
- Zhao, Y.; Hu, C.H.; Zhang, X.M.; Wang, Y.S.; Cheng, C.; Yin, X.L.; Xie, M. Analysis on runoff and sediment regimes and its causes of the Yellow River in recent 70 years. Trans. Chin. Soc. Agric. Eng. 2018, 34, 112–119. [Google Scholar]
- Wang, H.; Liu, J.F.; Xie, Z.Y.; Ma, L.J. Trend and attribution analysis of runoff in Qinghai Lake basin. Water Resour. Power 2018, 36, 19–21, 32. [Google Scholar]
- Carolina, G.A.; Jackson, C.R. Potential Impacts of Climate Change on Groundwater Supplies to the Doñana Wetland, Spain. Wetlands 2011, 31, 907–920. [Google Scholar]
- Kirshen, P.H. Potential Impacts of Global Warming on Groundwater in Eastern Massachusetts. J. Water Resour. Plan. Manag. 2002, 6, 216–219. [Google Scholar] [CrossRef]
- Wang, X.L.; Liang, T.G.; Xie, H.J.; Huang, X.D.; Lin, H.L. Climate-driven changes in grassland vegetation, snow cover, and lake water of the Qinghai Lake basin. J. Appl. Remote Sens. 2016, 10, 036017. [Google Scholar] [CrossRef]
- Yuan, Y.M. Analysis of temperature, ground temperature and permafrost variation in Qinghai Lake area in recent 30 years. Qinghai Meteorol. 2016, 2, 20–22. [Google Scholar]
- Törnqvist, R.; Jarsjö, J.; Pietroń, J.; Bring, A.; Rogberg, P.; Asokan, S.M.; Destouni, G. Evolution of the hydro-climate system in the Lake Baikal basin. J. Hydrol. 2014, 519, 1953–1962. [Google Scholar] [CrossRef] [Green Version]
- Wang, F.Y.; Duan, K.Q.; Fu, S.Y.; Gou, F.; Liang, W.; Yan, J.W.; Zhang, W.B. Partitioning climate and human contributions to changes in mean annual streamflow based on the Budyko complementary relationship in the Loess Plateau, China. Sci. Total Environ. 2019, 665, 579–590. [Google Scholar] [CrossRef]
Figure 1.
The location of Qinghai Lake basin in China (top right corner), physical characteristics of Qinghai Lake in Qinghai Lake basin (centre) and the spatial distribution of the hydrological stations (red triangles) and meteorological stations (blue dots).
Figure 1.
The location of Qinghai Lake basin in China (top right corner), physical characteristics of Qinghai Lake in Qinghai Lake basin (centre) and the spatial distribution of the hydrological stations (red triangles) and meteorological stations (blue dots).

Figure 2.
The annual water levels of Qinghai Lake recorded during the period 1960–2016.

Figure 3.
The trend of water level variation (Δh) during the period of 1960–2016.

Figure 4.
Variations of the hydro-climatic factors of Qinghai Lake during the period of 1960–2016. Pl is the precipitation over the lake (mm), El is the evaporation from the lake surface (mm), Rls is the surface runoff into the lake (mm), Rlg ± ε is the underground runoff and study error (mm), Δh is lake level variation (mm).

Figure 5.
The changes in land use in Qinghai Lake basin from 1980 to 2015.

Figure 6.
Variation the empirical parameter representing catchment characteristics (ω) and Δh in Qinghai Lake basin during the period of 1960–2016.
Figure 6.
Variation the empirical parameter representing catchment characteristics (ω) and Δh in Qinghai Lake basin during the period of 1960–2016.

Figure 7.
Mann-Kendall test of annual precipitation from 1960 to 2016 (a), Mann-Kendall test of annual potential evapotranspiration (b), and Cumulative anomaly of the annual surface runoff (c) in Qinghai Lake basin.
Figure 7.
Mann-Kendall test of annual precipitation from 1960 to 2016 (a), Mann-Kendall test of annual potential evapotranspiration (b), and Cumulative anomaly of the annual surface runoff (c) in Qinghai Lake basin.


Table 1.
Detailed information of the meteorological stations in and around Qinghai Lake basin used to collect the datasets previously described.
Table 1.
Detailed information of the meteorological stations in and around Qinghai Lake basin used to collect the datasets previously described.
| No. | Station Number | Station Name | Latitude (°N) | Longitude (°E) | ASL (m) | Data Collection Frame |
|---|---|---|---|---|---|---|
| 1 | 52,645 | Yeniugou | 38.43 | 99.60 | 3315 | 1960–2016 |
| 2 | 52,842 | Chaka | 36.78 | 99.08 | 3088 | 1960–2016 |
| 3 | 52,633 | Tuole | 38.82 | 98.42 | 3368 | 1960–2016 |
| 4 | 52,833 | Wulan | 36.93 | 98.48 | 2951 | 1960–2016 |
| 5 | 52,836 | Dulan | 36.30 | 98.10 | 3190 | 1960–2016 |
| 6 | 52,737 | Delingha | 37.37 | 97.38 | 2982 | 1960–2016 |
| 7 | 52,868 | Guide | 36.02 | 101.37 | 2274 | 1960–2016 |
| 8 | 52,657 | Qilian | 38.18 | 100.25 | 2788 | 1960–2016 |
| 9 | 52,754 | Gangcha | 37.33 | 100.13 | 3302 | 1960–2016 |
| 10 | 52,856 | Gonghe | 36.27 | 100.62 | 2836 | 1960–2016 |
| 11 | 52,943 | Xinghai | 35.58 | 99.98 | 3324 | 1960–2016 |
| 12 | 52,765 | Menyuan | 37.38 | 101.62 | 2851 | 1960–2016 |
| 13 | 52,866 | Xining | 36.73 | 101.75 | 2296 | 1960–2016 |
| 14 | 52,955 | Guinan | 35.58 | 100.73 | 3121 | 1960–2016 |
| 15 | 52,745 | Tianjun | 37.30 | 99.02 | 3417 | 1961–2010 |
| 16 | 52,855 | Huangyuan | 36.68 | 101.25 | 2675 | 1961–2010 |
| 17 | 52,853 | Haiyan | 36.90 | 100.98 | 3010 | 1961–2010 |
| 18 | 1,329,500 | The estuary of Buha River | 37.03 | 99.73 | 3191 | 1962–2016 |
Table 2.
The hydro-climatic factors calculated in different periods (mm) *.
| Periods | Pl | Rls | Rlg ± ε | El | Δh |
|---|---|---|---|---|---|
| I (1960–2004) | 367.94 (+45.67%) | 364.02 (+45.18%) | 73.68 (+9.15%) | 887.64 (−100%) | −82.00 |
| II (2005–2016) | 432.77 (+43.38%) | 564.93 (+56.62%) | −55.81 (−6.50%) | 802.73 (−93.50%) | +139.17 |
| 1960–2016 | 381.59 (+45.74%) | 406.32 (+48.70%) | 46.42 (+5.56%) | 869.77 (−100.00%) | −35.44 |
* The bracketed values refer to the percentage of total input or output represented by average yearly volumetric flux (mm) changes at different periods. Sign + represents water in, while sign - represents water out.
Table 3.
The land use dynamic attitude (LC) from 1980 to 2015.
| Period | ||||||
|---|---|---|---|---|---|---|
| Period | 1980–1990 | 1190–1995 | 1995–2000 | 2000–2005 | 2005–2010 | 2010–2015 |
| LC (%) | 0.06 | 0.04 | 0.05 | 0.03 | 0.01 | 0.03 |
Table 4.
Land use change parameters from 1980 to 2015 (km2).
| Type | Farmland | Forestland | Grassland | Water Area | Constructive Land | Unused Land | Total |
|---|---|---|---|---|---|---|---|
| Farmland | 493 | / | 1 | 1 | 4 | 1 | 500 |
| Forestland | / | 1371 | 10 | 2 | 1 | 1 | 1385 |
| Grassland | 64 | 5 | 17,475 | 30 | 7 | 16 | 17,596 |
| Water area | / | / | 142 | 4842 | / | 157 | 5141 |
| Constructive land | / | / | / | / | 26 | / | 26 |
| Unused land | / | / | 15 | 27 | / | 4975 | 5017 |
| Total | 557 | 1376 | 17,643 | 4901 | 37 | 5149 | 29,664 |
Table 5.
Basin characteristic parameters and sensitivity coefficients in each study period.
| Variable | Study Period | ||
|---|---|---|---|
| 1960 to 2016 | I | II | |
| Q (mm) | 69.96 | 62.84 | 96.69 |
| P (mm) | 349.13 | 334.65 | 403.42 |
| ET0 (mm) | 1078.55 | 1081.23 | 1068.49 |
| ω | 1.85 | 1.87 | 1.82 |
| ∂Q/∂P | 0.36 | 0.34 | 0.42 |
| ∂Q/∂ET0 | −0.05 | −0.05 | −0.07 |
| ∂Q/∂ω | −115.75 | −106.43 | −146.57 |
Table 6.
The results of attribution analysis of runoff change.
| ΔQ | ΔQc | ΔQu | Error | |
|---|---|---|---|---|
| Contribution Amount (mm) | 33.85 | 25.54 | 6.31 | 2.00 |
| Contribution Rate (%) | 100 | 80.19 | 19.81 | 5.91 |
Table 7.
Correlation coefficient matrix of influential factors.
| Correlation Coefficient | x1 | x2 | x3 | x4 | x5 | x6 |
|---|---|---|---|---|---|---|
| x1 | 1 | 0.36 ** | 0.51 ** | −0.71 ** | 0.39 ** | −0.26 * |
| x2 | 0.36 ** | 1 | 0.61 ** | −0.56 ** | 0.97 ** | −0.28 * |
| x3 | 0.51 ** | 0.61 ** | 1 | −0.56 ** | 0.64 ** | −0.59 ** |
| x4 | −0.71 ** | −0.56 ** | −0.56 ** | 1 | −0.55 ** | 0.31 * |
| x5 | 0.39 ** | 0.97 ** | 0.64 ** | −0.55 ** | 1 | −0.35 ** |
| x6 | −0.26 * | −0.28 * | −0.59 ** | 0.31 * | −0.35 ** | 1 |
* P < 0.05, ** P < 0.01.
Table 8.
Grey relational degree matrix of influential factors on subsurface runoff.
| Incidence Matrix | γ1 | γ2 | γ3 | γ4 | γ5 | γ6 |
|---|---|---|---|---|---|---|
| y | 0.8205 | 0.7683 | 0.7739 | 0.8295 | 0.7609 | 0.8441 |
Table 9.
Eigenvalue of the correlation coefficient matrix and variance contribution rate.
| Principal Components | The Eigenvalue | Contribution Rate (%) | Cumulative Contribution Rate (%) |
|---|---|---|---|
| F1 | 3.6055 | 60.0919 | 60.0919 |
| F2 | 0.9272 | 15.4527 | 75.5446 |
| F3 | 0.8867 | 14.7779 | 90.3225 |
| F4 | 0.3052 | 5.0872 | 95.4097 |
| F5 | 0.249 | 4.1507 | 99.5604 |
| F6 | 0.0264 | 0.4396 | 100 |
Table 10.
Eigenvectors of the correlation coefficient matrix.
| Principal Components | x1 | x2 | x3 | x4 | x5 | x6 |
|---|---|---|---|---|---|---|
| F1 | 0.3589 | −0.5745 | 0.3797 | 0.2533 | 0.5738 | 0.0598 |
| F2 | 0.4464 | 0.5176 | 0.1273 | −0.0852 | 0.119 | 0.7037 |
| F3 | 0.4448 | −0.0788 | −0.2944 | 0.6988 | −0.47 | −0.0069 |
Table 11.
Contribution rate of the hydro-climatic factors.
| Contribution Rate | Pl | Rls | El | Rlg ± ε | Δh |
|---|---|---|---|---|---|
| Climate Changes | 100 | 80.19 | 100 | 88.44 | 93.13 |
| Catchment Modifications | 0 | 19.81 | 0 | 11.56 | 6.87 |
© 2019 by the authors. Licensee MDPI, Basel, Switzerland. This article is an open access article distributed under the terms and conditions of the Creative Commons Attribution (CC BY) license (http://creativecommons.org/licenses/by/4.0/).
Share and Cite
MDPI and ACS Style
Fang, J.; Li, G.; Rubinato, M.; Ma, G.; Zhou, J.; Jia, G.; Yu, X.; Wang, H. Analysis of Long-Term Water Level Variations in Qinghai Lake in China. Water 2019, 11, 2136. https://doi.org/10.3390/w11102136
AMA Style
Fang J, Li G, Rubinato M, Ma G, Zhou J, Jia G, Yu X, Wang H. Analysis of Long-Term Water Level Variations in Qinghai Lake in China. Water. 2019; 11(10):2136. https://doi.org/10.3390/w11102136
Chicago/Turabian StyleFang, Jianmei, Guijing Li, Matteo Rubinato, Guoqing Ma, Jinxing Zhou, Guodong Jia, Xinxiao Yu, and Henian Wang. 2019. "Analysis of Long-Term Water Level Variations in Qinghai Lake in China" Water 11, no. 10: 2136. https://doi.org/10.3390/w11102136
Note that from the first issue of 2016, this journal uses article numbers instead of page numbers. See further details here.