A Classification Method for Fish Swimming Behaviors under Incremental Water Velocity for Fishway Hydraulic Design

1
State Key Laboratory of Simulation and Regulation of Water Cycle in River Basin, China Institute of Water Resources and Hydropower Research, Beijing 100038, China
2
China Water International Engineering Consulting Co., LTD, Beijing 100053, China
3
State Key Laboratory of Plateau Ecology and Agriculture, Qinghai University, Xining 810016, China
*
Author to whom correspondence should be addressed.
†
Xiangpeng Mu and Ping Cao contributed equally to this work.
Water 2019, 11(10), 2131; https://doi.org/10.3390/w11102131
Submission received: 30 July 2019
/
Revised: 7 October 2019
/
Accepted: 8 October 2019
/
Published: 14 October 2019
(This article belongs to the Section Water Quality and Contamination)
Abstract
:In fishway design, the combination of fish swimming behaviors and suitable fishway hydraulic characteristics increases the fish passage efficiency. In this study, the most representative grass carp among the “four major Chinese carps” was selected. Under conditions similar to the time period for feeding migration, juvenile grass carps were targeted to study the swimming characteristic indicators (i.e., critical and burst swimming speeds) and swimming behaviors that were closely associated with fishway hydraulic design using the incremental water velocity method in a homemade test water tank. (1) The study results reveal that both the absolute critical (Ucrit) and burst (Uburst) swimming speeds increased linearly with increasing body length and both the relative critical (U’crit) and burst (U’burst) swimming speeds decreased linearly with increasing body length. There existed a quantitative relationship between Uburst and Ucrit, which could facilitate the fishway hydraulic design. (2) This study analyzed the effects of water velocity changes on fish swimming behaviors and proposed a classification method for four fish swimming behaviors—swimming freely, staying, dashing at a long distance, and dashing at a short distance—of tested fish during the process of adapting to water velocity changes interspersed with one another. The entire swimming process under the incremental water velocity was divided into four stages. (3) This study suggests that the maximum water velocity of the mainstream in a fishway using grass carp as the major passage fish should not exceed 52–60% Uburst at stage 1. For the high-water velocity areas of a fishway, such as vertical slots and orifices, the optimal water velocity should not be higher than 76–79% Uburst at stage 2 and should absolutely not exceed 90–96% Uburst at stage 3.
1. Introduction
Fish migration is a feature acquired during a long period of adaptation due to seasonal and ontogenetic changes. It is a periodic, directional, and clustered migration activity among the overwintering areas, spawning sites, and feeding areas (three areas). The “four major Chinese carps”, which are the black carp (Mylopharyngodon piceus), grass carp (Ctenopharyngodon idellus), silver carp (Hypophthalmichthys molitrix), and bighead carp (Hypophthalmichthys molitrix), are important economic fish in China [1,2] and belong to potamodromous fish. In recent decades, numerous hydraulic engineering projects, such as dams and gates, were constructed in China [3,4,5]. The fish migration routes among the three areas have been artificially blocked [6,7]. Therefore, the population quantity of the wild “four major Chinese carps” has exhibited a continual decline [8].
Fishways are important channels for fish to pass through river barriers and their hydraulic design should be consistent with characteristics of fish swimming behaviors in order to improve fish passage efficiency [9,10,11,12,13]. It is generally recognized that the characteristic indicators of fish swimming behaviors mainly include sustained swimming speed (sustained swimming time >200 min), critical swimming speed (also known as maximum prolonged swimming speed, a sustained swimming time between 20 s and 200 min), and burst swimming speed (sustained swimming time <20 s) [14,15]. The critical swimming speed, which reflects endurance, is the maximum swimming speed that fish can maintain within a certain period of time [16]. The burst swimming speed reflects the capacity to avoid predators and break through water flow barriers [17].
A large effort has been made to study critical and burst swimming speeds. Mateus et al. [18] studied the effects of body length and sex on the critical swimming speed of Luciobarbus bocagei. Adams et al. [19] and Fang et al. [20] studied the water temperature effect on the critical swimming speed of juvenile shovelnose sturgeon (Scaphirhynchus platorynchus), pallid sturgeon (Scaphirhynchus albus) and silver carp. Xian et al. [21] and Cai et al. [22] studied the body length effect on the relative critical swimming speed of black carp (body length 7.93 ± 0.08 cm) and bighead carp (body length 9.8–12.3 cm). Xiong et al. [23] used the incremental water velocity method to study the burst swimming speed of the “four major Chinese carps” with body lengths of approximately 20 cm in the Songhua River Basin. In addition, Li et al. [24], Niu et al. [25], and Lu et al. [26] used the startle response method to measure the burst swimming behaviors of black carps with different body lengths (body lengths: 9.21 ± 1.89 cm, 17.83 ± 2.67 cm, and 61.45 ± 0.8 cm), silver carps (body lengths: 1.55 ± 0.25 cm, 20.05 ± 2.05 cm, and 43.19 ± 4.26 cm), and grass carps (body lengths: 8.47 ± 0.73 cm, 17.93 ± 1.27 cm, and 51.42 ± 3.24 cm) during the fast-start-up process.
Previous study results showed that studies on fish swimming behaviors mainly used adult fish as the study subjects and the results mainly focused on measurements of indicators of swimming behaviors, such as critical swimming speed and analyses of factors affecting swimming ability; however, there are fewer studies on the responses of swimming behaviors to water velocity changes. The design of fishways in China mostly refers to that of developed countries [27,28] and in China, there are valuable freshwater fishes and economic species, such as the “four major Chinese carps”, with small body lengths and weak swimming abilities, so it is difficult to directly apply these research results to China [10]. Furthermore, the swimming ability of fish is positively related to their body length [16,17]. The swimming ability of juvenile fish is relatively weaker. Hu [29] and He et al. [30] showed that the time period for feeding migration of the four major Chinese juvenile carps into the Poyang Lake mouth is mainly concentrated in mid-July and late August, the average water temperature of the lake mouth is approximately 25–30 °C, and the body lengths of juvenile fish are mainly between 5.00 and 14.99 cm. However, the present research on the fish swimming ability of the “four major Chinese carps” during this time period is insufficient. Therefore, studies on the swimming characteristic indicators of juvenile fish with body lengths within that range and analyses of the responses of swimming behaviors to the water velocity are especially important to improve or eliminate fishway obstacles and to guide fishway hydraulic design [31] and also have more practical significance for the protection of Chinese fish resources in the Yangtze River.
Commonly, critical swimming speed is an important indicator for the design of mainstream of fishway pool tanks and confirmation of the distance between resting pools [32]. Burst swimming speed is usually used as an important indicator to determine orifices or narrow slots, special structures and high-water velocity areas in a fishway [33,34]. However, it is still unclear how to use the two swimming characteristic indicators scientifically for fishway hydraulic design. Our purpose is to complement the swimming characteristic indicators (i.e., critical and burst swimming speeds) of the “grass carp” and provide basic parameters for fishway hydraulic study and design [35,36]. To this end, this study used a homemade test water tank, designed corresponding measurement methods for swimming behavior indicators, and targeted juvenile grass carp with body lengths of 5.70–15.00 cm to measure critical and burst swimming speeds, analyze the quantitative relationship between burst and critical swimming speeds, and analyze the responses of fish swimming behaviors to the rapidly changed water velocity. Furthermore, a classification of fish swimming behaviors was proposed to facilitate the use of these characteristic indicators for fishway hydraulic design.
2. Materials and Methods
2.1. Test Equipment
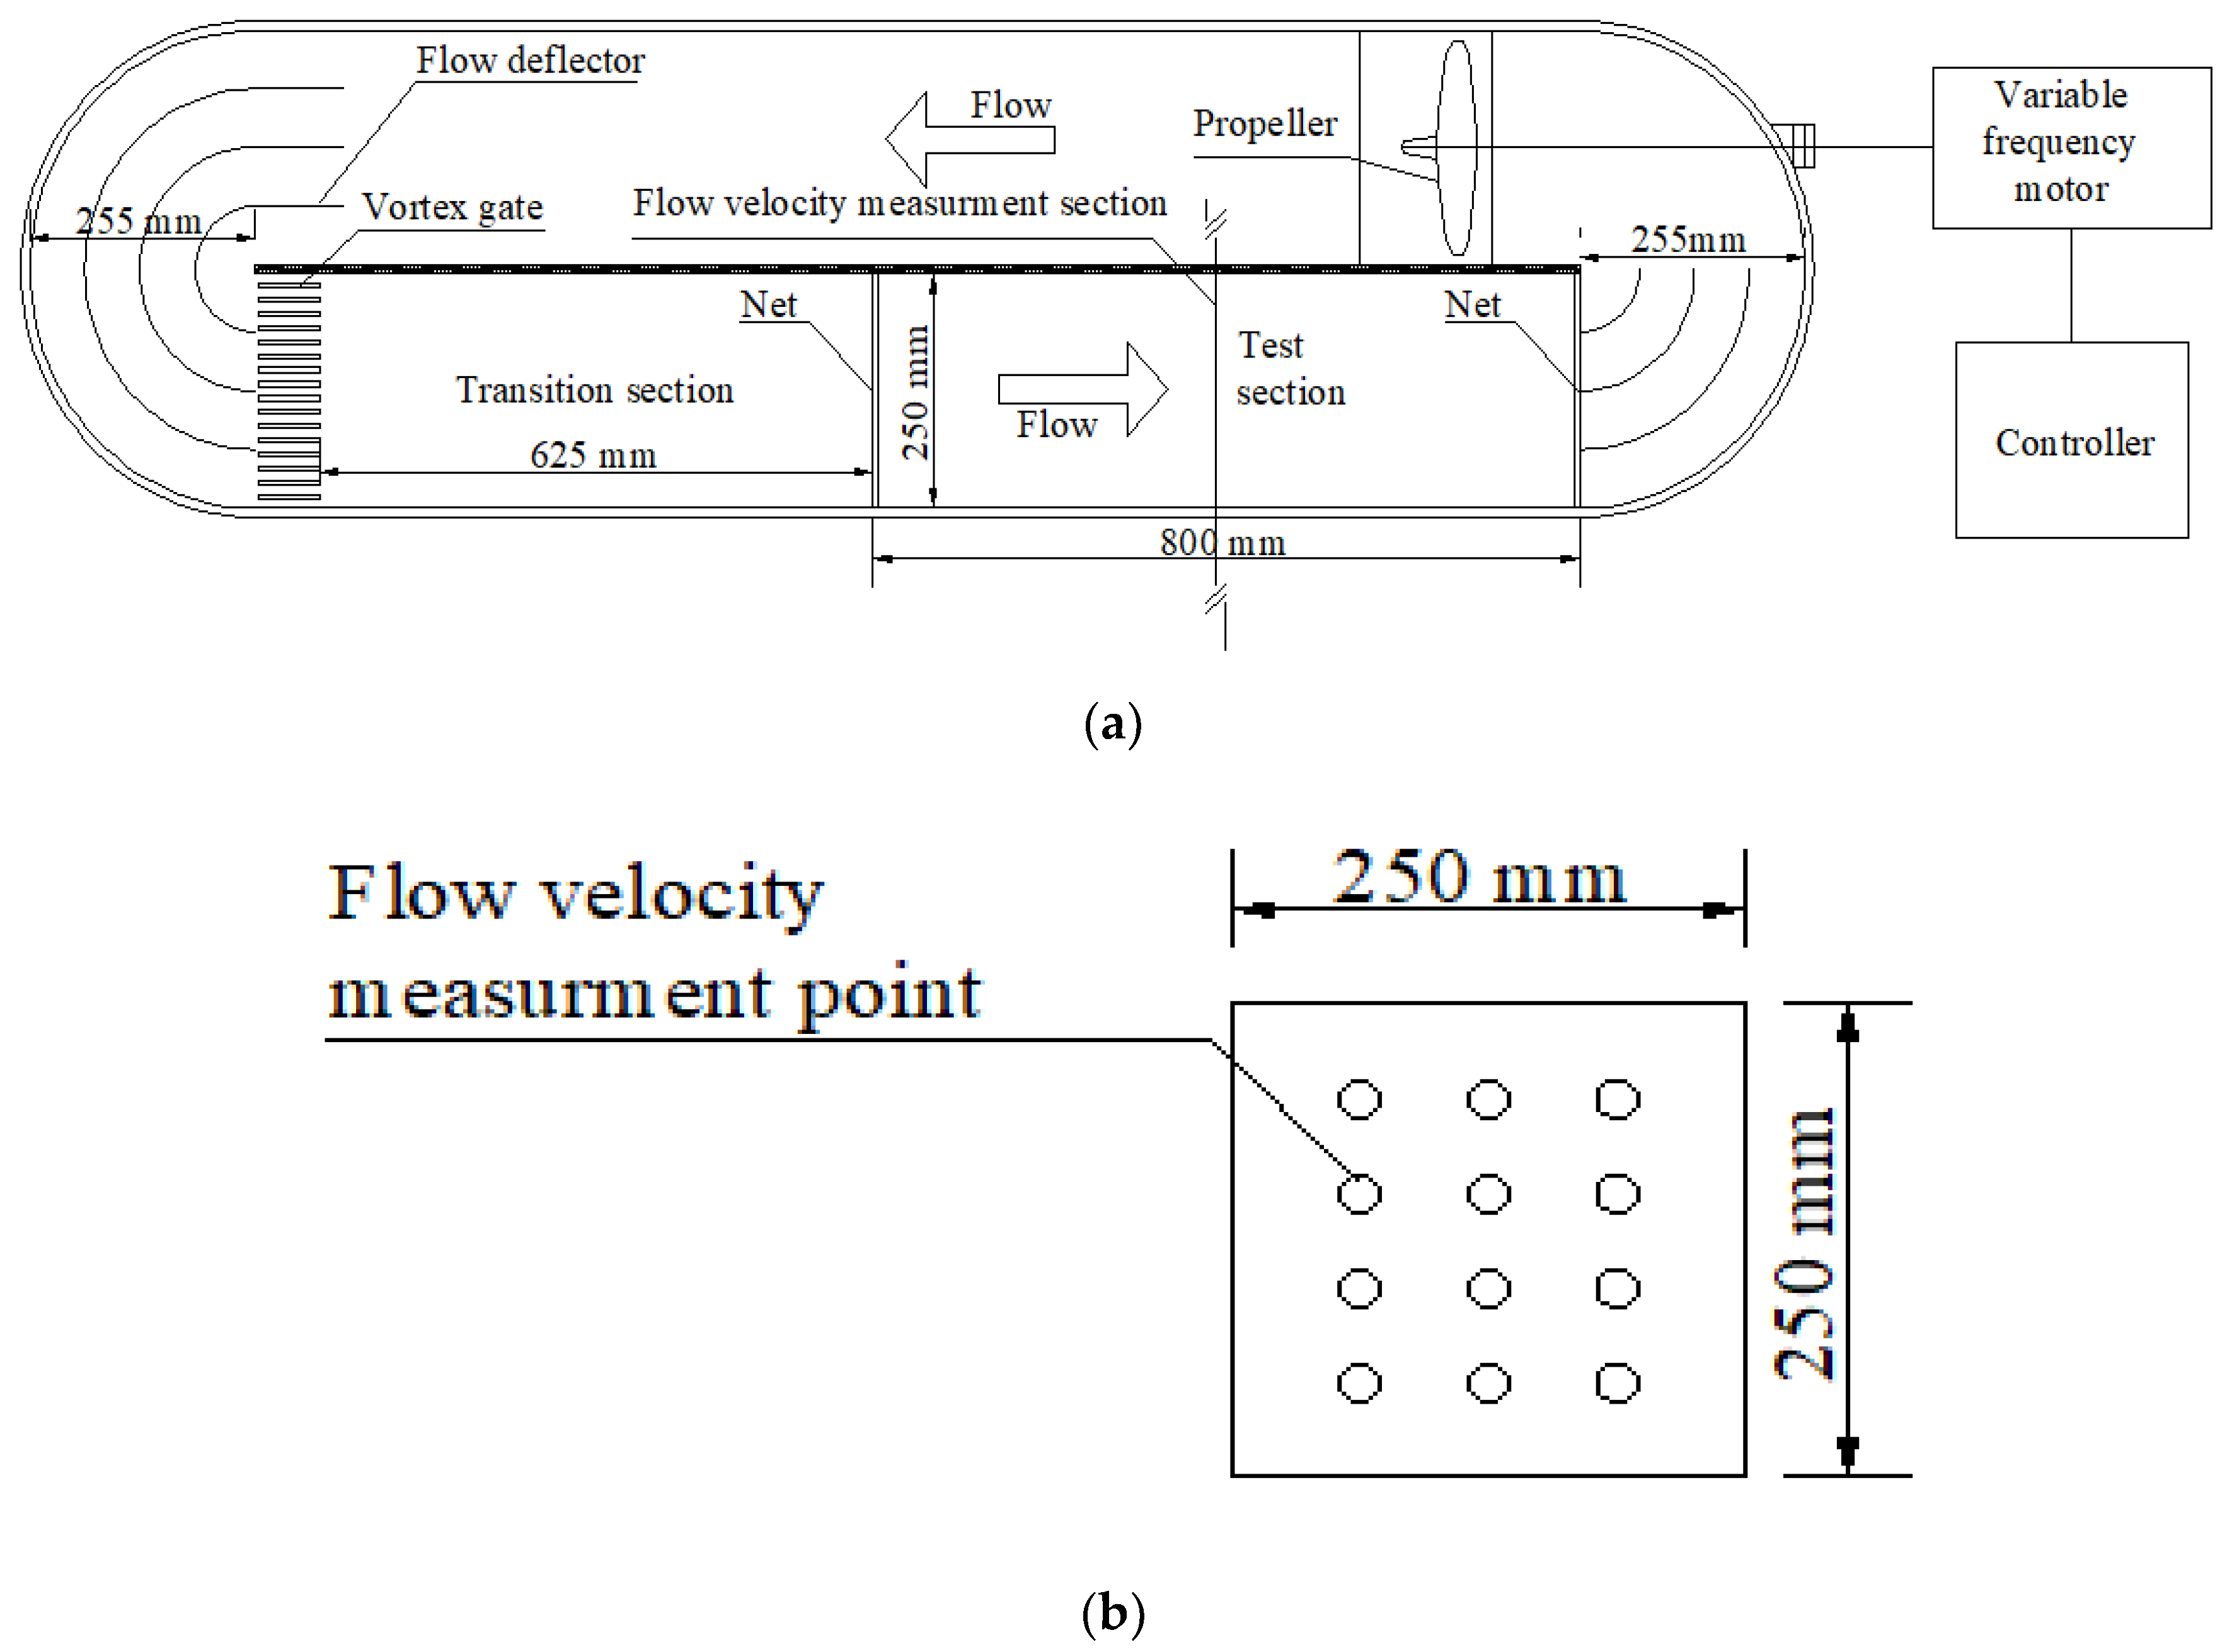
The test water tank used in this study is shown in Figure 1. This was a closed recirculating water system with an approximately oval shape. The circulating water flow was produced in the water tank using a propeller driven by a variable frequency motor. A variable frequency controller was used to adjust the motor speed in order to control the water velocity in the water tank. Circular flow deflectors on both sides of the closed water tank were set up, as was a vortex gate at the upstream of the test section. Thus, an even and steady flow field in the test section could be obtained. The cross section of the test water tank was 25 × 25 cm, and the length of the test section was 80 cm. Nets were set up both upstream and downstream of the test section to ensure that the tested fish always swam within the test section. The overall water tank was made of plexiglass to conveniently observe the fish swimming behaviors. Cameras were set up at the top and at the front view of the test section to record the entire fish swimming test period.
During the test, the water tank was full of water (the water depth was 25 cm), and the water velocity in the test section was measured using a Pitot tube. Three water velocity measuring vertical lines—left, middle, and right—crossing the calibration section were selected. Water velocity measurement points were set up at intervals of 5 cm water depth in each water velocity measuring line. The mean value at all the water velocity measurement points was the cross-sectional water velocity. In addition, the evenness of the water velocity in a cross section of each test section was analyzed. The mean value of the unevenness coefficient (see Appendix A) of the water flow distribution under all frequencies was 0.017. The coefficient was small, indicating that the evenness of water flow in the test section was excellent. The water velocity adjustment range of the test water tank was 0.00–1.50 m/s.
It has been shown, that when the cross section of a tested fish body is smaller than 10% of the cross-sectional area of the test water tank, the blocking effect of the water flow on the tested fish is negligible [37]. The cross-sectional area and the length of the test section of the water tank in this study were both large, and the distribution of the cross-sectional water velocity was even; therefore, the implementation of the swimming test on juvenile grass carp could obtain ideal test results.
2.2. Tested Fish and Environment
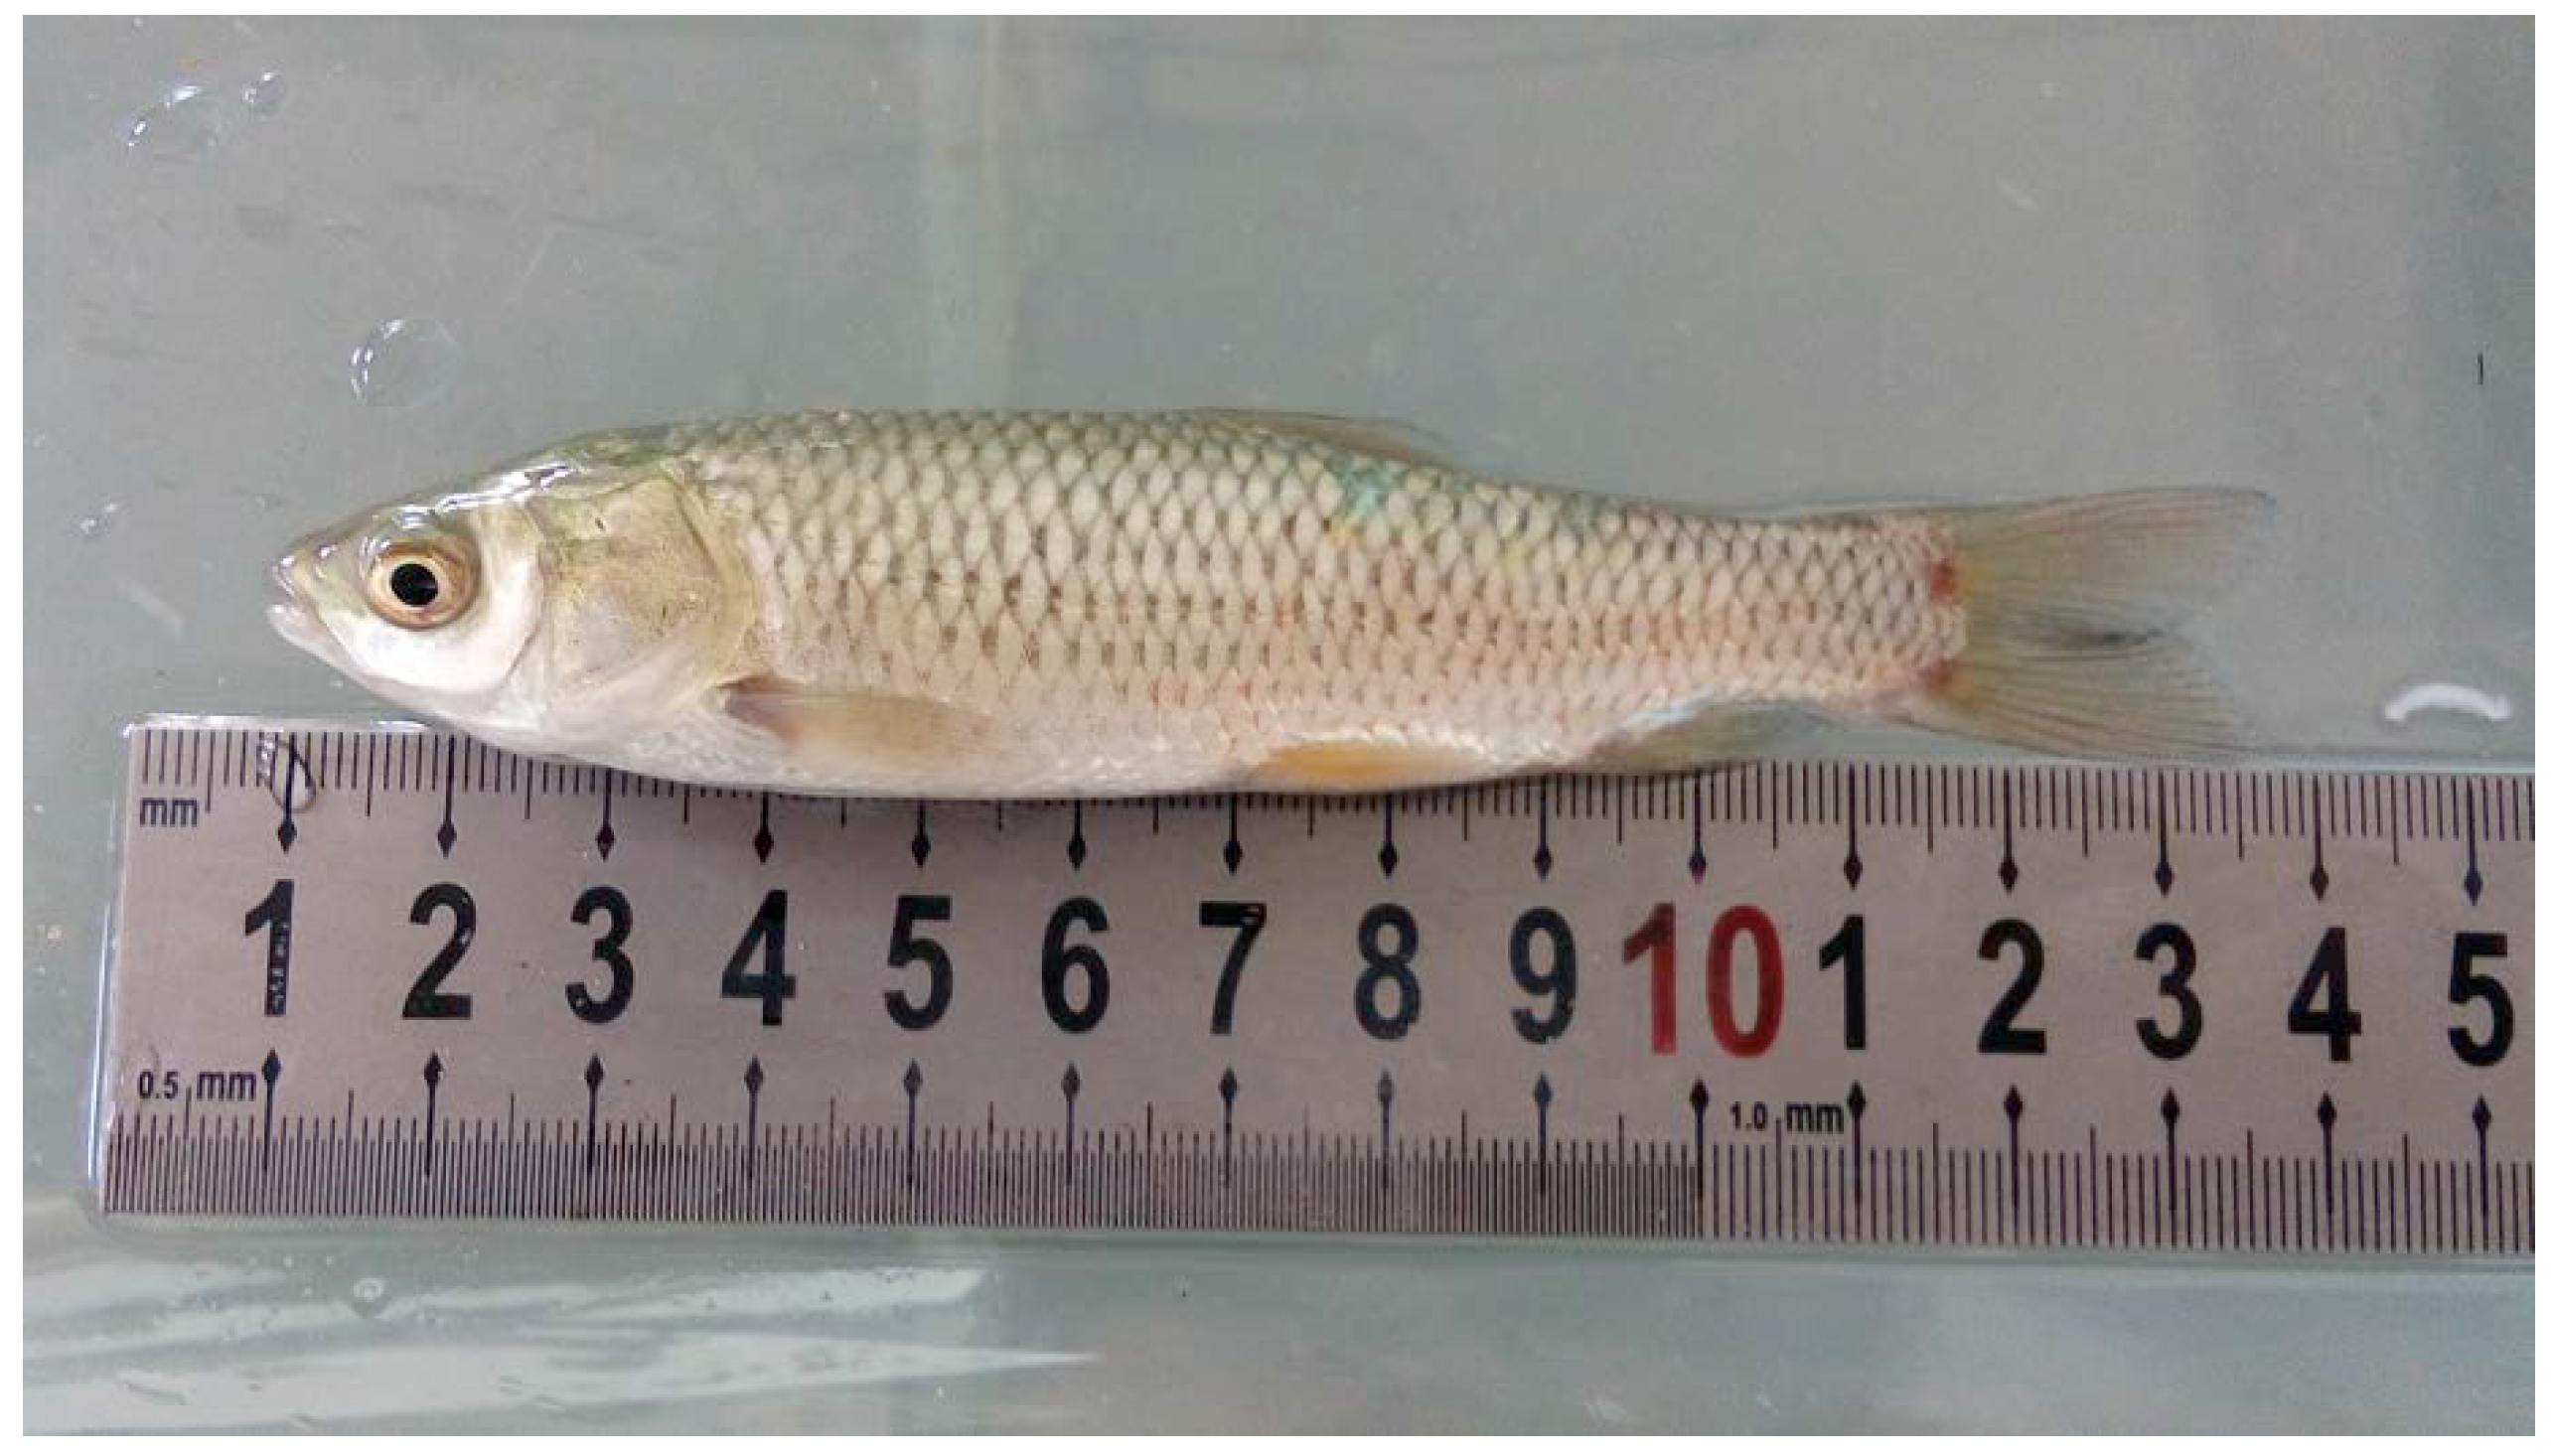
In this study, the tested fish, as seen in Figure 2 were collected in mid-July, 2014 and mid-August, 2016, respectively, using the fishing net from a fishery in Beijing and were transported to the test site by a professional aquatic transport container. Two tests were performed to explore the relationships between critical (in late July, 2014) and burst (in late August, 2016) swimming speeds and swimming behaviors of juvenile grass carp. A total of 57 grass carp individuals (body length: 5.70–15.00 cm; weight: 1.90–35.00 g) were used. Among them, 25 individuals (3 for the pre-test and 22 for the formal test) were used for the critical swimming speed test and 32 individuals (2 for the pre-test and 30 for the formal test) for the burst swimming speed test. Note that each fish was only used once in the test because the accuracy can be lowered by repeatedly testing the fish that had been affected.
According to the requirement of acclimation and to artificial feeding of the fish for the physiological tests, the tested fish were held in a 2.0 × 1.5 m (length × width) rectangular water tank for 2 weeks. The water depth was 1.0 m, the water used for artificial feeding was tap water exposed to dechlorination for 5 days; the water temperature was 28 ± 1 °C for critical swimming speed and 25 ± 1 °C for burst swimming speed, and the dissolved oxygen concentration was maintained above 6.0 mg/L [23], which satisfied the normal survival requirement for juvenile grass carps. The same water conditions were maintained in the tests. Indoor natural light was used. Feeding was stopped 2 days before the test. To avoid temperature differences caused by sunshine, the test was performed indoors. The test conditions were basically consistent with the natural water environment conditions (see Introduction) for the feeding migration of Chinese juvenile carps.
Before the test, the water flow acclimation condition was very important for accurate measurements of fish swimming ability. To avoid fish not adapting to the test water tank, which would cause this test to fail due to the handling stress, the tested fish were adapted to the test water tank before the test. By adjusting the acclimation water velocity, acclimation time period, prescribed interval time, and velocity increment, Xu et al. [38] studied the effects of acclimation conditions on the maximum sustained swimming time and the critical swimming speed of juvenile Brachymystax lenok. The results showed that the acclimation water velocities should be set to 1.0–1.5 BL/s and the optimal time for tested fish to adapt to the environment before the test should be set to 1 h. Based on results from that study and test methods of fish swimming ability in China in addition to other countries, the tested fish were adapted for 1 h at a 1 BL/s water velocity before the test started [18,39].
2.3. Test Methods
2.3.1. Incremental Water Velocity Method
Both the critical and burst swimming speeds (see Appendix B) in this study were measured using the “incremental water velocity” method. A pre-test was taken first, followed by a formal test to estimate the critical and burst swimming speeds. Note that fish were placed in the test section one at a time.
(1) Pre-test
Step 1: The tested fish was adapted for 1 h under a water velocity of 1 BL/s in the test section to eliminate the handle stress.
Step 2: The water velocity was increased by 0.4 BL/s every 2 min (for critical swimming speed)/20 s (for burst swimming speed) until the fish was tired. The water velocity value at that time was recorded.
Step 3: The estimated value of the critical/burst swimming speed was obtained using Equation (A2).
Step 4: The above steps were repeated. The mean value of the 3 (for critical swimming speed)/2 (for burst swimming speed) estimated values was used as the final estimation value for the reference in the test.
Note that the criterion for tested fish fatigue was a time period (20 s) during which the tested fish could not swim when they were washed to the net in the downstream region of the test section by water flow.
(2) Formal test
Step 1: One fish was placed in the test water tank and adapted to the water velocity of 1 BL/s for 1 h (similarly to the pre-test).
Step 2: The water velocity was increased to 60% of the estimated critical (0.5 BL/s every 5 min until the value was reached)/burst swimming speed value (within 10 s).
Step 3: The water velocity was increased by 15% of the estimated critical/burst swimming speed for every 20 min/20 s until the fish was tired and could not continue to swim. At that time, the water velocity and the swimming time were recorded.
Step 4: The value of the critical/burst swimming speed was obtained using Equations (A2) and (A3).
Step 5: The above steps were repeated for the other fish.
(3) Data analysis
We used the video playback to track manually, frame by frame, the fish swimming behaviors (such as tail beat, swimming distance and fatigue) with statistical analysis to classify movement in both the pre-test and the formal test.
A linear regression method was used to analyze the relationship between critical/burst swimming speed and the body length of juvenile grass carps (the significant level P was set to smaller than 0.05).
2.3.2. Classification of Fish Swimming Behaviors
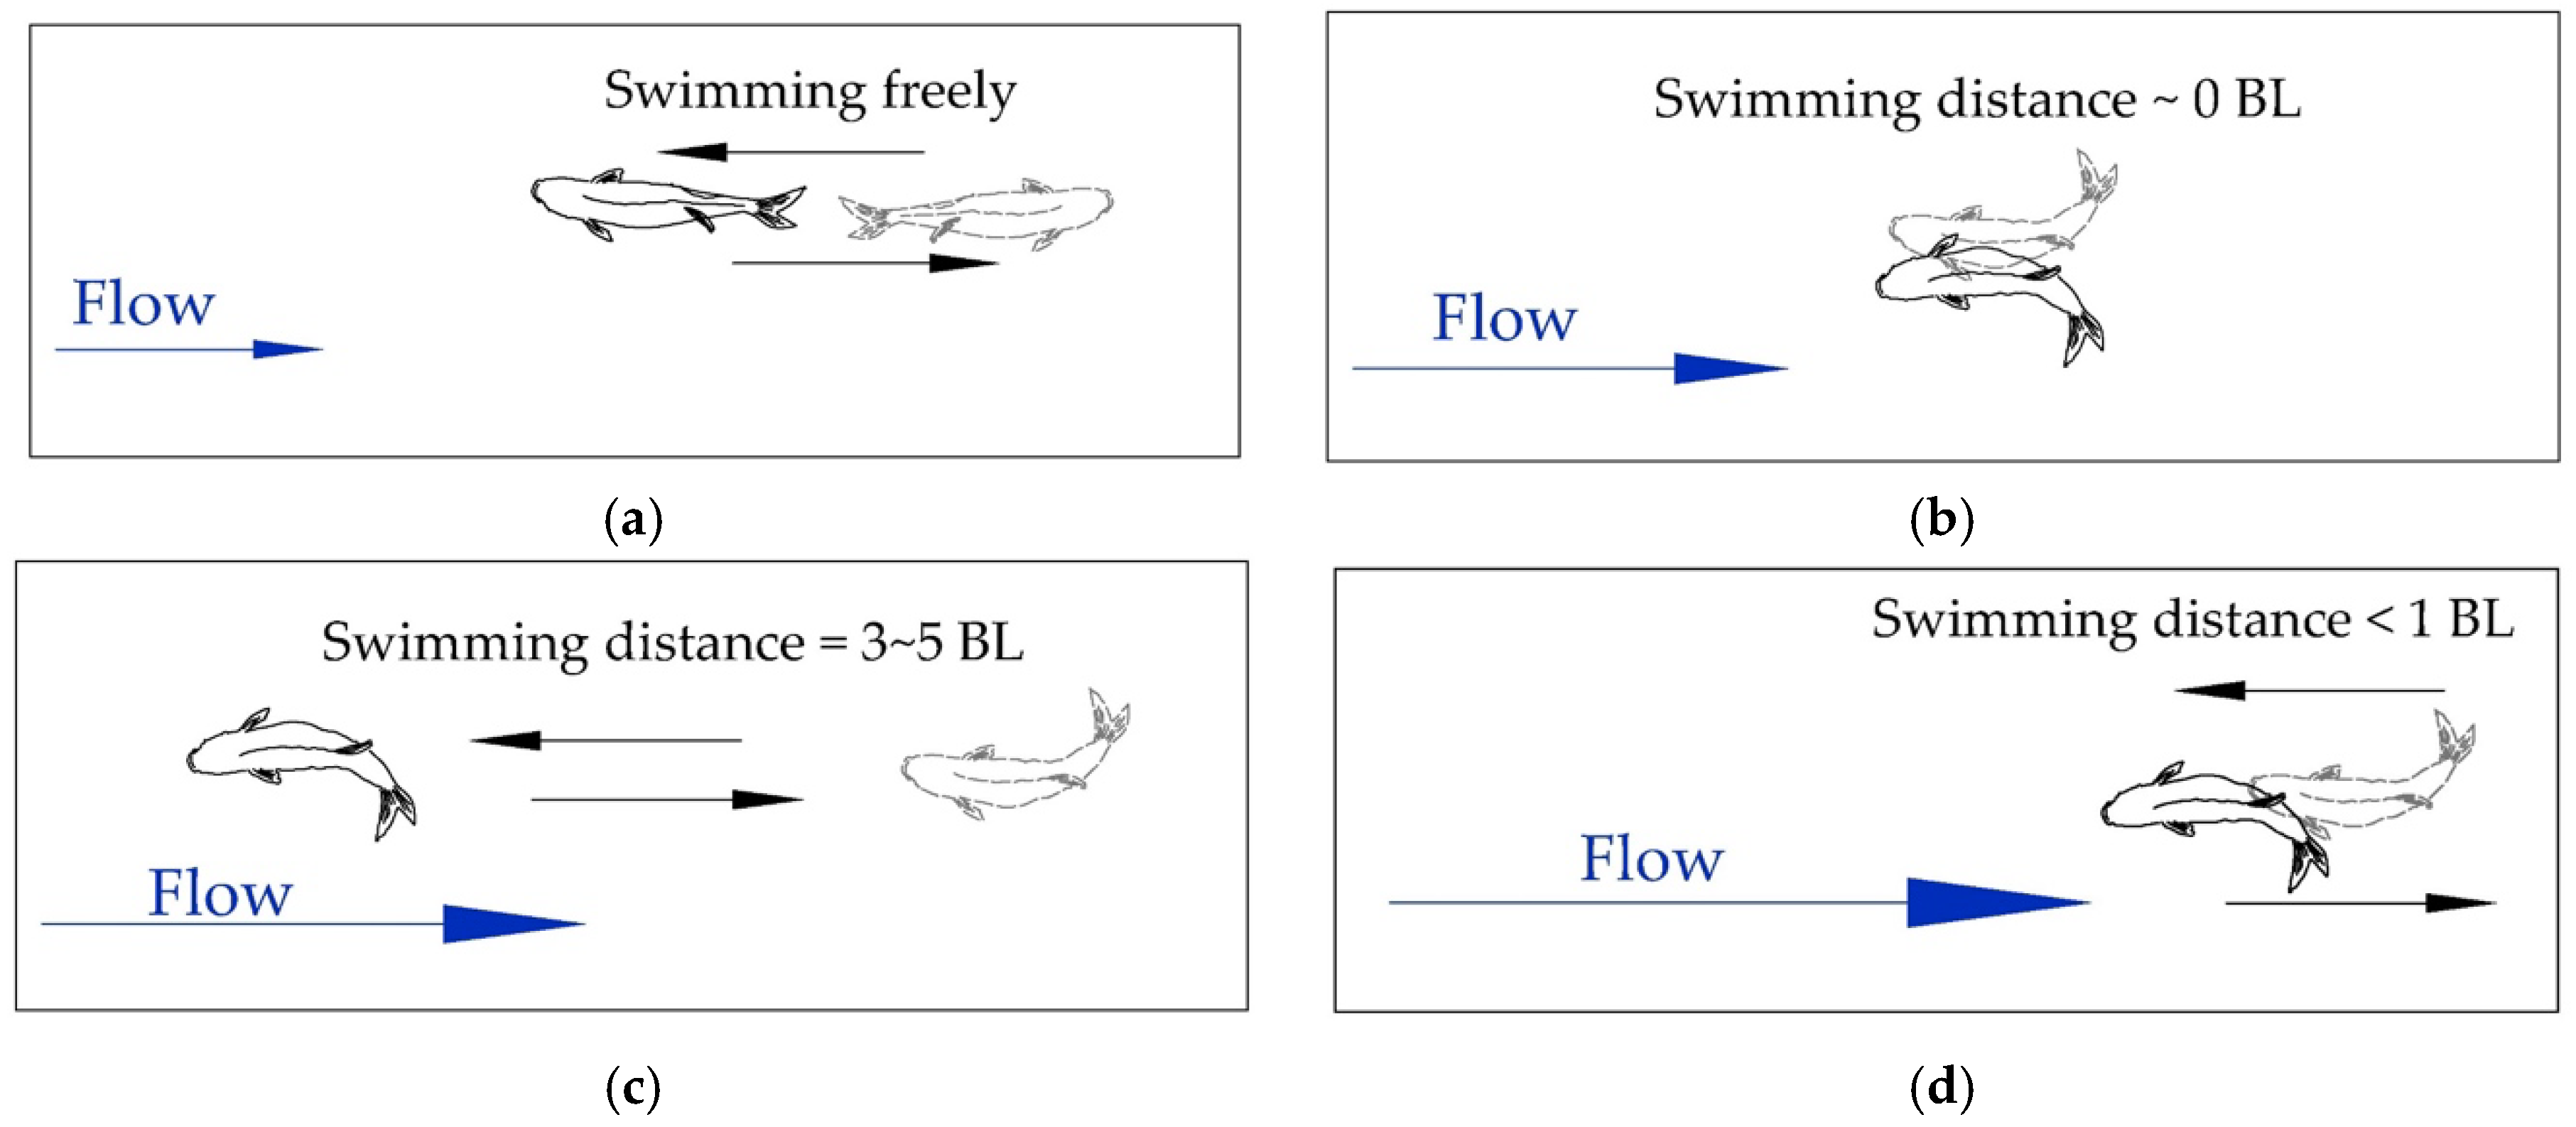
Fish swimming behaviors are one type of unstable movement. Swimming behaviors change with changes in water velocity. In addition, the staged sustained swimming, pause, and occasional dashing swimming intersperse with one another. Based on the long-term observation, the fish swimming behaviors of the tested fish under the incremental water velocity were roughly divided into four classes, as shown in Figure 3.
(1) Swimming freely: Fish can perceive the water flow direction, swim upstream or downstream, and the water flow has no obvious stress effect on the fish;
(2) Staying: Fish stay under the countercurrent with the swimming distance of around 0 BL;
(3) Dashing at a long distance: Fish dash with a swimming distance of around 3–5 BL and retreat due to the water flow stress effect;
(4) Dashing at a short distance: Fish dash with the swimming distance of smaller than 1 BL and retreat due to the water flow stress effect.
Note that the “water flow stress effect” refers to the responses of fish swimming behaviors (which can be characterized by the increase of tail beat and swimming speed) to the incremental water velocity. During the test, through rapid and frequent increments in speed, the fish were forced to adjust their body function to adapt to the excessive water velocity changes. Therefore, fish were always at the stress and tension state to simulate the explosive swimming behaviors of fish passing through water flow barriers. The four classes of fish swimming behaviors can be distinguished artificially and easily because the water velocity was increased incrementally, and the responses of fish swimming behaviors to water velocity were changed gradually.
3. Results
3.1. Relationship between Critical Swimming Speed and Body Length
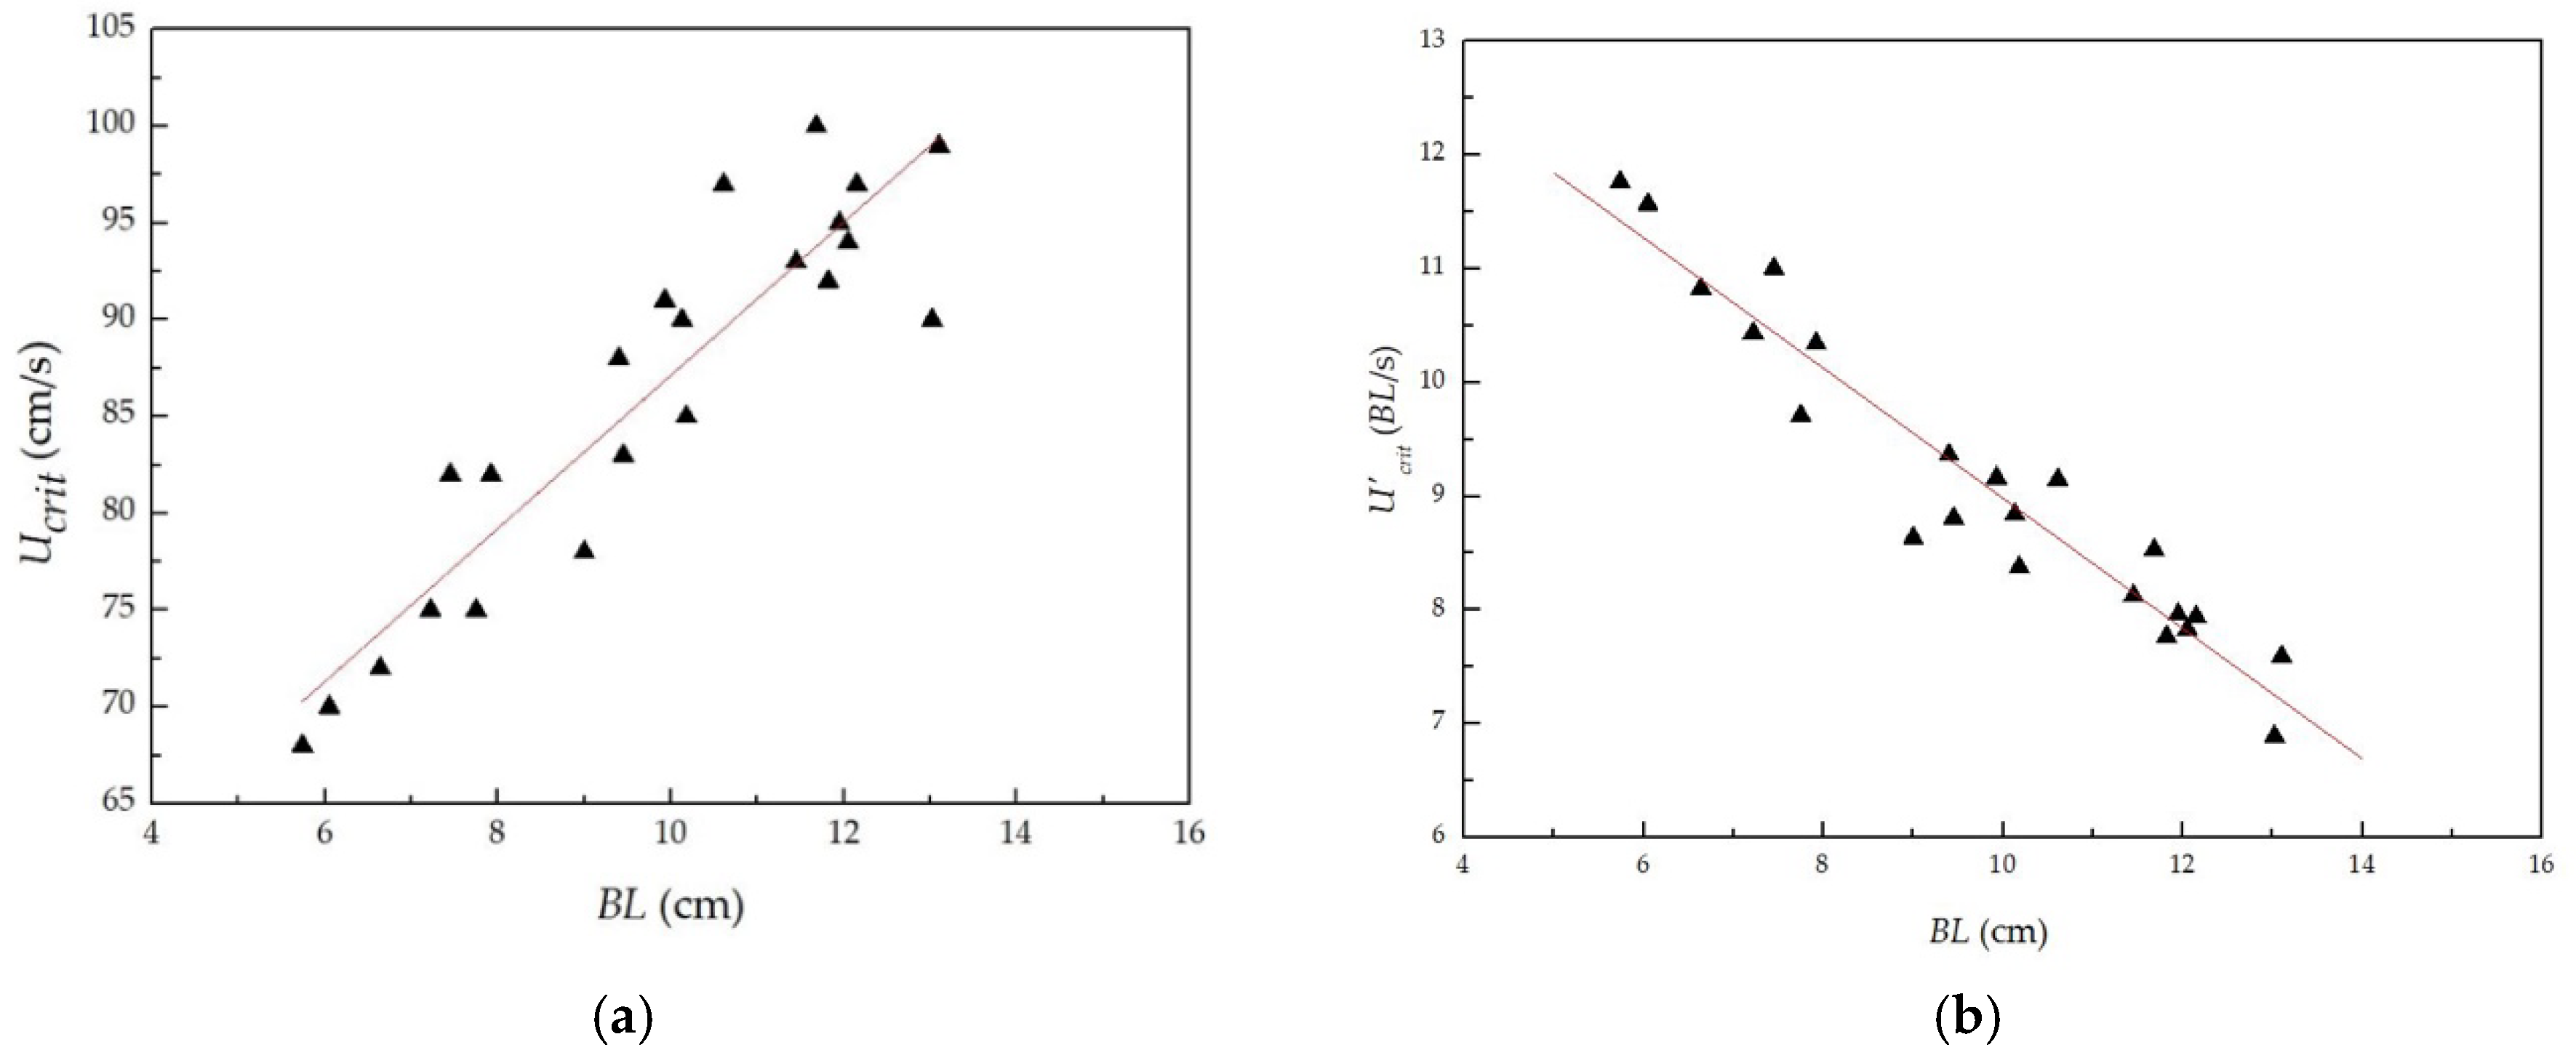
The relationship between the body lengths and the absolute/relative critical swimming speeds of the tested fish obtained in the test is shown in Figure 4. This figure shows that the absolute critical swimming speed increased with increasing body length, while the relative critical swimming speed decreased with the increase in the body lengths of the tested fish. The linear fitting relationships are
where and are the absolute and relative critical swimming speeds, respectively (cm/s).
3.2. Relationship between Burst Swimming Speed and Body Length
The relationship between the body lengths and the absolute/relative burst swimming speeds of the tested fish obtained in the test is shown in Figure 5. This figure shows that the absolute burst swimming speed increased with increasing body length, while the relative burst swimming speed decreased with the increase in the body lengths of the tested fish. The fitting relationships are
where and are the absolute and relative burst swimming speeds, respectively (cm/s).
3.3. Relationship between Absolute Critical and Burst Swimming Speeds
Critical and burst swimming speeds are both important characteristic indicators for fishway hydraulic design. The difference between them lies in the test time: the critical swimming speed is measured with a time of about 2 h, while the measurement of burst swimming speed is time saving, with a time of about 1 min. Studying the relationship between the two indicators can help to better understand the fish swimming behaviors and make it more convenient for fishway hydraulic design. For instance, in order to save time in practice, we can only measure the burst swimming speed and derive the critical swimming speed with the relationship between the two indicators in order to quickly obtain the key hydraulic characteristic parameters for fishway hydraulic design.
Combining Equations (1) and (3), the quantitative relationship between the absolute critical and the absolute burst swimming speeds of the tested fish is
The subtraction of Equation (1) from Equation (3) can be used to obtain the difference between the absolute burst and the absolute critical swimming speeds:
For juvenile grass carp with body lengths within the range of 5.70–15.00 cm, the absolute difference between Uburst and Ucrit was 6.14–30.2, which was equivalent to Uburst being approximately 1.05–1.28 × Ucrit. It can be easily deduced from Equation (6) that the longer the fish body length, the larger the absolute difference between Uburst and Ucrit.
The burst swimming speed under the incremental water velocity takes a relatively short time, the strong controllability of the water and the number of fish needed to obtain statistically significant results so it follows that the application of the burst swimming speed as indicator is most extensive [17,40]. In the following section, the burst swimming speed was selected for further analysis.
3.4. Fish Swimming Behaviors in Different Stages
According to the changes in swimming behaviors, the entire experimental process could be divided into four stages. At different flow velocity stages, the four swimming behaviors interspersed with one another and accounted for different percentages of time.
Stage 1: At the initial stage of measurement of the burst swimming speed, the fish rapidly adjusted their body function to adapt to rapid and great water velocity changes. At this stage, the time during which the fish stayed accounted for approximately 24–58% of the total time, the time period of dashing at a long distance accounted for approximately 20–41%, and the time period of dashing at a short distance accounted for approximately 19–35%. The distribution of these three states was relatively even. The percentage of swimming freely was very small and only accounted for 1–2%. At this stage, the distances of dashing and retreating were both short and did not exceed 1 BL. There was no rapid dashing phenomenon (either dashing at a long distance or at a short distance). Overall, the stress effect of water flow was not evident. The maximum swimming speed of the tested fish at this stage was approximately 52–60% of Uburst.
Stage 2: When the water velocity exceeded 60% of Uburst, the tail-beat frequency of the tested fish significantly increased, and fish muscles were under a relative tension state. At this stage, the swimming behaviors of the tested fish were mainly that of staying, which accounted for approximately 55–66%. The time period for dashing at a long distance accounted for approximately 19–26%, and the time period for dashing at a short distance accounted for approximately 15–20%. In addition, the distances while dashing and being retreated were both short and did not exceed 1 BL. The stress effect of water flow in fish swimming began to present at this stage; however, the tested fish did not exhibit the phenomenon of rapid dashing. The maximum swimming speed of the tested fish at this stage was approximately 76–79% of Uburst.
Stage 3: When the water velocity continued to increase to a certain stage, the tested fish began to exhibit the repeated rapid dashing and being retreated phenomenon. The dashing distance significantly increased in comparison to that in the previous two stages. The dashing distance was approximately 3–5 BL. The maximum dashing could be continued from the end of the test section to the front of the test section (the maximum dashing distance was close to 70 cm) 2–3 times. The maximum swimming speed of the tested fish at this stage was approximately 90–96% of the Uburst of the tested fish. The tested fish at this stage mainly dashed at a long distance and also dashed at a short distance, which accounted for 37–45.5% and 30–39% of the total time, respectively. The percentage of staying decreased to 19.5–33%. The stress effect of water flow on the tested fish was already very evident.
Stage 4: When the water velocity continued to increase, the tested fish continued to retreat, and their tails began to touch the downstream net. Fish repeatedly performed dashing and retreating; however, the distances were shorter and generally did not exceed 1 BL. The tested fish were already close to the exhaustion state. At this stage, the percentages of staying, dashing at a long distance, and dashing at a short distance were equivalent and were 27–36.5%, 31.5–38% and 32–35%, respectively. The tested fish already did not have the strength for dashing.
The tested fish were classified into four size groups based on the burst swimming speed (which is linearly correlated with body length) with an interval of 0.1 m/s (namely, <0.9 m/s, 0.9–1.00 m/s, 1.00–1.10 m/s, 1.10–1.2 m/s, >1.2 m/s). As shown in Table 1, “BL 1” indicates fish with body lengths of 6.00–8.50 cm, “BL 2” indicates fish with body lengths of 8.71–11.01 cm, “BL 3” indicates fish with body lengths of 11.30–12.30 cm, and “BL 4” indicates fish with body lengths of 12.70–15.00 cm. The maximum swimming speeds of juvenile grass fish with these four size groups at the above 4 stages are shown in Table 2. The time segment spent on all swimming behaviors are shown in Figure 6. In these four swimming stages, swimming freely was only present during stage 1, and the time period was very short. With increasing water velocity, staying showed a trend of first increasing followed by decreasing. Dashing at a long distance and dashing at a short distance showed an increasing trend with increasing water velocity. The tested fish only performed repeated long-distance dashing in stage 3. In stage 4, the fish were already unable to dash, the percentages of all swimming behaviors were equivalent, and the fish were close to the fatigue status. The maximum swimming speeds at each stage, in order, were approximately 52–60%, 76–79%, 90–96%, and 100% of the fish burst swimming speed.
4. Discussion
4.1. Comparison with Other Studies
The study results reveal that both the critical and burst swimming speeds showed a linear relationship with the body length of juvenile grass carps. Lu et al. [26] reported that the absolute burst swimming speeds of grass carps with body lengths of 8.47 ± 0.73 cm, 17.93 ± 1.27 cm, and 51.24 ± 3.24 cm were 1.449 ± 0.424 m/s, 2.359 ± 0.434 m/s, and 2.899 ± 0.457 m/s, respectively, indicating that the absolute burst swimming speed increased with increasing body length, and the longer the body length, the stronger the swimming ability. Similarly, other studies on the “four major Chinese carps” found a linear correlation between swimming ability and body length [23,24]. Mateus et al. [18] studied the effects of body length on the critical swimming speed of Luciobarbus bocagei and showed that body length was positively correlated with critical swimming speed. Bestgen et al. [41] also found a linear relationship between the body lengths and critical swimming speeds of Rio Grande silvery minnow (Hybognathus amarus). Therefore, when designing a fishway, the linear relationship can be applied to derive the swimming characteristic indicators based on the body lengths of the target species. In particular, the swimming ability of juvenile fish should be fully considered to improve fish passage efficiency.
On the other hand, other factors can also have influences on the measurement of fish swimming ability. For instance, Kern et al. [42] found that the size of the test water tank influenced the swimming ability of juvenile golden perch (Macquaria ambigua), and Farrell [43] revealed that different test methods resulted in different swimming abilities of rainbow trout (Oncorhynchus mykiss). In this study, water temperature was the only difference between the two tests on the critical and burst swimming speeds. Previous studies indicated that water temperature had an effect on fish swimming ability. For instance, Lyon et al. [44] and Kieffer et al. [45] found that under different water temperature conditions, the metabolic abilities of fish differed, which resulted in different fish swimming abilities. However, some studies argued that water temperature did not affect fish swimming ability. For instance, Adams et al. [19] studied the critical swimming speeds of juvenile shovelnose sturgeons and pallid sturgeons and showed that their critical swimming abilities at 20 °C and below 10 °C were not very different. At present, the quantitative relationship between critical swimming speed of juvenile grass carps and water temperature remains unclear. However, grass carps belong to warm water fish, and the maximum values of the critical swimming speeds of warm water fish occur at 25–30 °C [15,20]. On the other hand, the burst swimming speed reflects the stress ability of fish to avoid enemies and pass through obstacles and is usually only associated with species and fish body length [46]. Therefore, water temperature was not the key factor affecting the critical and burst swimming speeds, and the two test results could be compared.
4.2. Implications for Fishway Hydraulic Design
The above analyses show that as water velocity increased, the stress effect of the water flow on fish began to occur, gradually became evident, and finally, reached the limit of the fish swimming ability. Analyses of the above four swimming stages showed that starting at stage 2, the tested fish changed from the free-swimming behavior to the staying behavior, and the stress effect of the water flow on the tested fish began to occur. At stage 3, the tested fish began to exhibit the repeated dashing phenomenon, and the water flow stress effect became very evident. Rome et al. [47] showed that a water velocity greater than the critical swimming speed would result in the water flow barriers. Bestgen et al. [41] found that the endurance of Rio Grande silvery minnow declined sharply at velocities above 60 cm/s, a threshold that was consistent with critical swimming speed estimates. Gong et al. [48] showed that the preferred water velocity range of juvenile grass carps with body lengths of 8–12 cm was about 0.2–0.3 m/s. Fang et al. [49] studied the critical swimming speeds of juvenile grass carps with body lengths of 8–9.7 cm. Through analyses of the metabolism of tested fish, they showed that the water velocity in a fishway using grass carp as major passage fish should not exceed 0.8 Ucrit (45–55.6 cm/s). Therefore, for the grass carp that were used as the major passage fish, the maximum water velocity of the mainstream of the fishway pool should not exceed the maximum water velocity at stage 1 (52–60% of Uburst, 50.8–57.1 cm/s). Under that condition, the fish could easily swim upstream along the mainstream. For high water velocity areas of fishways, such as vertical slots and orifices, the optimal water velocity should not exceed the maximum water velocity at stage 2 (76–79% of Uburst). Under that condition, juvenile grass carps can easily pass through water flow barriers in high water velocity areas. If the water velocity at vertical slots and orifices cannot be reduced, it can be properly increased but cannot exceed the maximum water velocity at stage 3 (90–96% of Uburst); otherwise, vertical slots and orifices will become water flow barriers for juvenile grass carp swimming upstream. Schematic diagrams are shown in Figure 7.
5. Conclusions
This study selected the most representative grass carp of the “four major Chinese carps”. Juvenile grass carps with body lengths of 5.70–15.00 cm were targeted, a homemade test water tank was used, and an “incremental water velocity” method was employed to study the fish swimming behaviors. The major conclusions are described as follows:
(1) The quantitative linear relationship between the critical and burst swimming speeds and body lengths of tested fish was obtained. Moreover, the relationship between the absolute critical and burst swimming speeds was obtained.
(2) A classification method for fish swimming behaviors (i.e., swimming freely, staying, dashing at a long distance, and dashing at a short distance) was proposed. Based on changes in fish swimming behaviors, the stress effect of the water velocity on tested fish was determined to divide the entire swimming process under the incremental water velocity into four stages.
(3) According to the proposed classification method of fish swimming behaviors, the fish swimming behaviors and the fishway hydraulic design could be combined to propose the critical value of water velocity design in the high-water velocity areas of a fishway, including mainstream areas and vertical slots.
(4) This study provided critical parameters for fishway hydraulic design using grass carps as the major passage fish and proposed a new classification method for analyses of the water flow stress effects on fish, which can contribute to the study of the swimming ability of other fish.
The tests were carried out in an indoor closed water tank in this study. Future works could explore the fish swimming behaviors in an open water tank fishway (such as [14,27]), which can help to further understand the relationship between the upstream migration behaviors of fish and hydrodynamic conditions and to assist in the design and construction of fishway to improve fish passage efficiency.
Author Contributions
X.M. conceived and designed the experiment; X.M. and B.B. supervised the research; P.C. and L.G. conducted the experiment, analyzed the data and results; X.M. and P.C. wrote the manuscript; X.M. and X.L. reviewed the manuscript.
Funding
This research was funded by the National Key Research and Development Program of China, grant number 2016YFC0502207, the National Key Research and Development Program of China, grant number 2016YFC0401401, the National Natural Science Foundation of China, grant number 51609256, the Special Program of China Institute of Water Resources and Hydropower Research, grant number HY0145B372016, the Young Elite Scientists Sponsorship Program by the China Association for Science and Technology, grant number 2017QNRC001.
Acknowledgments
The authors would like to thank the editor and three anonymous reviewers for their in-depth reviews and constructive comments, which have led to substantial improvements of the paper.
Conflicts of Interest
The authors declare no conflict of interest.
Appendix A. Unevenness Coefficient
The unevenness coefficient of the water flow distribution was calculated using the following equation:
where is the water velocity measurement point; is the total number of measurement points; is the water velocity at each measurement point (m/s); is the mean water velocity at the cross section (m/s), and .
Appendix B. Critical and Burst Swimming Speeds
The absolute critical/burst swimming speed was calculated as
where is the absolute critical/burst swimming speed (cm/s); is the water velocity before the tested fish was tired (cm/s); is the water velocity increment that was 15% of the estimated value of the critical/burst swimming speed; is the time spent when the fish was tired at that time period (s); and was the time interval of flow velocity increment (20 min for critical swimming speed; 20 s for burst swimming speed).
The relative critical/burst swimming speed was calculated as
where is the relative critical/burst swimming speed and is the body length (cm).
References
- Wu, X.; Rao, J.; He, B. The history of the Chinese freshwater fisheries. In Cultivation of the Chinese Freshwater Fishes; Science Press: Beijing, China, 1992; pp. 5–29. [Google Scholar]
- Newbold, L.R.; Shi, X.T.; Hou, Y.; Han, D.; Kemp, P.S. Swimming performance and behavior of bighead carp (Hypophthalmichthys nobilis) application to fish passage and exclusion criteria. Ecol. Eng. 2016, 95, 690–698. [Google Scholar] [CrossRef]
- Shi, X.T.; Kynard, B.; Liu, D.F.; Qiao, Y.; Chen, Q.W. Development of fish passage in China. Fisheries 2015, 40, 161–169. [Google Scholar] [CrossRef]
- Mu, X.P.; Zhen, W.Y.; Li, X.; Cao, P.; Gong, L.; Xu, F.R. A study of the impact of different flow velocities and light colors at the entrance of a fish collection system on the upstream swimming behavior of juvenile grass carp. Water 2019, 11, 322. [Google Scholar] [CrossRef]
- Tan, J.; Tao, L.; Gao, Z.; Dai, H.; Shi, X.T. Modeling fish movement trajectories in relation to hydraulic response relationships in an experimental fishway. Water 2018, 10, 1511. [Google Scholar] [CrossRef]
- Laine, A.; Kamula, R.; Hooli, J. Fish and lamprey passage in a combined Denil and vertical slot fishway. Fish. Manag. Ecol. 1998, 5, 31–44. [Google Scholar] [CrossRef]
- Zhang, J.M.; Wu, Z.Q.; Hu, M.L. Resource status of four major Chinese carps in the Xiajiang reach of Ganjiang river. J. Hydroecol. 2010, 3, 34–37. [Google Scholar]
- Ministry of Environmental Protection of the People’s Republic of China. Bulletin on Ecological and Environmental Monitoring of the Three Gorges Project of the Yangtze River (BEEMTGP); Ministry of Environmental Protection of the People’s Republic of China: Beijing, China, 2013. Available online: http://www.cnemc.cn/jcbg/zjsxgcstyhjjcbg/ (accessed on 12 October 2019).
- Castro-Santos, T.; Cotel, A.J.; Webb, P.W. Fishway evaluations for better bioengineering: An integrative approach. In American Fisheries Society Symposium; American Fisheries Society: Bethesda, MD, USA, 2009; Volume 69, pp. 557–575. [Google Scholar]
- Chen, K.Q.; Tao, J.; Chang, Z.N.; Cao, X.H.; Ge, H.F. Difficulties and prospects of fishways in china: An overview of the construction status and operation practice since 2000. Ecol. Eng. 2014, 70, 82–91. [Google Scholar] [CrossRef]
- Castro-Santos, T.; Sanz-Ronda, F.J.; Ruiz-Legazpi, J. Breaking the speed limit—Comparative sprinting performance of brook trout (Salvelinus fontinalis) and brown trout (Salmo trutta). Can. J. Fish. Aquat. Sci. 2012, 70, 280–293. [Google Scholar] [CrossRef]
- Kim, J.H.; Yoon, J.D.; Baek, S.H.; Park, S.H.; Lee, J.W.; Lee, J.A.; Jang, M.H. An efficiency analysis of a nature-like fishway for freshwater fish ascending a large Korean river. Water 2016, 8, 3. [Google Scholar] [CrossRef]
- Bermudez, M.; Rico, A.; Rodriguez, A.; Pena, L.; Rabunal, J.R.; Puertas, J.; Castillo, M. FishPath: Computer application for design of vertical slot fishways. Ing. Del Agua 2015, 19, 179–191. [Google Scholar]
- Sanz-Ronda, F.J.; Ruiz-Legazpi, J.; Bravo-Córdoba, F.J.; Makrakis, S.; Castro-Santos, T. Sprinting performance of two Iberian fish: Luciobarbus bocagei and Pseudochondrostoma duriense in an open channel flume. Ecol. Eng. 2015, 83, 61–70. [Google Scholar] [CrossRef]
- Hammer, C. Fatigue and exercise tests with fish. Comp. Biochem. Physiol. Part A Physiol. 1995, 112, 1–20. [Google Scholar] [CrossRef]
- Brett, J.R. The respiratory metabolism and swimming performance of young sockeye salmon (Oncorhynchus nerka). J. Fish. Board Can. 1964, 21, 1183–1226. [Google Scholar] [CrossRef]
- Beamish, F.W.H. Swimming capacity. Fish Physiol. 1978, 7, 101–187. [Google Scholar]
- Mateus, C.S.; Quintella, B.R.; Almeida, P.R. The critical swimming speed of Iberian barbel Barbus bocagei in relation to size and sex. J. Fish Biol. 2008, 73, 1783–1789. [Google Scholar] [CrossRef]
- Adams, S.R.; Adams, G.L.; Parsons, G.R. Critical swimming speed and behavior of juvenile shovelnose sturgeon and pallid sturgeon (Scaphirhynchus platorynchus). Trans. Am. Fish. Soc. 2003, 132, 392–397. [Google Scholar] [CrossRef]
- Fang, M.; Cai, L.; Gao, Y.; Tu, Z.Y.; Wang, C.F.; Huang, Y.P. Effect of temperature on swimming capability and oxygen consumption of juvenile Hypophthalmichthys molitrix. J. Hydroecol. 2013, 34, 49–53. [Google Scholar]
- Xian, X.M.; Cao, Z.D.; Fu, S.J. The comparison of critical swimming speed and endurance at high speed of four species of juvenile fish. J. Chongqing Norm. Univ. 2010, 27, 16–20. [Google Scholar]
- Cai, L.; Tu, Z.Y.; Yuan, X.; Liu, G.Y.; Liu, D.F.; Shi, X.T.; Huang, Y.P. Swimming capability and swimming behaviour of juvenile Aristichthys nobilis. Resour. Environ. Yangtze Basin 2013, 21, 89–95. [Google Scholar]
- Xiong, F.; Wang, C.J.; Liu, D.F.; Kou, F.L.; Mo, W.J.; Liu, W.; Shi, X.T. Comparative study of burst swimming speed of black carp, grass carp, silver carp and bighead carp from Songhua river. Ecol. Sci. 2014, 33, 339–343. [Google Scholar]
- Li, C.W.; Bo, L.U.; Chen, T.; Liu, L.; Zhu, H.F.; Liu, D.F.; Wang, X.; Shi, X.T. The burst-coast behavior in escape response of black carp. Chin. J. Zool. 2014, 49, 860–866. [Google Scholar]
- Niu, S.; Lu, B.; Luo, J.; He, L.; Niu, J.T.; Chen, T.; Liu, D.F.; Shi, X.T. Swimming performance of fast escapement of silver carp. Acta Hydrobiol. Sin. 2015, 2, 394–398. [Google Scholar]
- Lu, B.; Liu, W.; Liang, Y.; Chen, Q.; Huang, Y.; Pan, L.; Liu, D.F.; Shi, X.T. The burst-coast swimming behavior of grass carp (Ctenopharyngodon idellus) during fast-start. J. Fish. China 2014, 38, 829–834. [Google Scholar]
- Sanz-Ronda, F.J.; Bravo-Córdoba, F.J.; Fuentes-Pérez, J.F.; Castro-Santos, T. Ascent ability of brown trout, Salmo trutta, and two Iberian cyprinids− Iberian barbel, Luciobarbus bocagei, and northern straight-mouth nase, Pseudochondrostoma duriense—In a vertical slot fishway. Knowl. Manag. Aquat. Ecosyst. 2016, 10. [Google Scholar] [CrossRef]
- Katopodis, C. Developing a toolkit for fish passage, ecological flow management and fish habitat works. J. Hydraul. Res. 2005, 43, 451–467. [Google Scholar] [CrossRef]
- Hu, M.L. Characteristics of Water Level, Water Environment and Effects on Fish Communication and Migration in the Hukou of Poyang Lake; Nanchang University: Nanchang, China, 2009. [Google Scholar]
- He, G.; Fang, C.L.; Chen, W.J.; Fu, P.F.; Zhou, H.M.; Zhang, Y.P.; Wu, B.; Wang, S. Community structure and variation of migration fishes in Pingfeng area of Poyang lake channel. Hubei Agric. Sci. 2015, 54, 926–930. [Google Scholar]
- Santos, J.M.; Silva, A.T.; Katopodis, C.; Pinheiro, P.; Pinheiro, A.N.; Bochechas, J.; Ferreira, M.T. Ecohydraulics of pool-type fishways: Getting past the barriers. Ecol. Eng. 2012, 48, 38–50. [Google Scholar] [CrossRef]
- Plaut, I. Critical swimming speed: Its ecological relevance. Comp. Biochem. Physiol. Part A Mol. Integr. Physiol. 2001, 131, 41–50. [Google Scholar] [CrossRef]
- Blank, M.D.; Cahoon, J.; McMahon, T. Using three dimensional hydrodynamic modeling and fish swimming energetics to assess culverts as potential physical barriers to upstream fish movement. In Proceedings of the Transportation Research Board 88th Annual Meeting, Washington, DC, USA, 11–15 January 2009. [Google Scholar]
- Blake, R.W. Functional design and burst-and-coast swimming in fishes. Rev. Can. Zool. 1983, 61, 2491–2494. [Google Scholar] [CrossRef]
- Gong, L.; Wu, Y.H.; Baiyin, B.L.G.; Mu, X.P. Experimental study on swimming capability and swimming behavior of juvenile grass carp. J. China Inst. Water Resour. Hydropower Res. 2015, 13, 211–216. [Google Scholar]
- Cao, P.; Mu, X.P.; Baiyin, B.L.G.; Wang, X.Y.; Chen, Y.F. Study on swimming behavior of juvenile grass carp for the fish channel hydraulic design. J. Hydraul. Eng. 2017, 48, 1456–1464. [Google Scholar]
- Bell, W.H.; Terhune, L.D.B. Water Tunnel Design for Fisheries Research; Fisheries Research Board of Canada, Biological Station: Ottawa, ON, Canada, 1970.
- Xu, G.F.; Yin, J.S.; Ha, Y.; Ma, B.; Mou, Z.B. Effects of different acclimation conditions on sustainable swimming performance of juvenile lenok, Brachymystax lenok (Pallas). Acta Ecol. Sin. 2015, 35, 1938–1946. [Google Scholar]
- Farlinger, S.; Beamish, F.W.H. Effects of time and velocity increments on the critical swimming speed of largemouth bass (Micropterus salmoides). Trans. Am. Fish. Soc. 1977, 106, 436–439. [Google Scholar] [CrossRef]
- Kolok, A.S. Interindividual variation in the prolonged locomotor performance of ectothermic vertebrates: A comparison of fish and herpetofaunal methodologies and a brief review of the recent fish literature. Can. J. Fish. Aquat. Sci. 1999, 56, 700–710. [Google Scholar] [CrossRef]
- Bestgen, K.R.; Mefford, B.; Bundy, J.M.; Walford, C.D.; Compton, R.I. Swimming performance and fishway model passage success of Rio Grande silvery minnow. Trans. Am. Fish. Soc. 2010, 139, 433–448. [Google Scholar] [CrossRef]
- Kern, P.; Cramp, R.L.; Gordos, M.A.; Watson, J.R.; Franklin, C.E. Measuring Ucrit and endurance: Equipment choice influences estimates of fish swimming performance. J. Fish Biol. 2018, 92, 237–247. [Google Scholar] [CrossRef] [PubMed]
- Farrell, A.P. Comparisons of swimming performance in rainbow trout using constant acceleration and critical swimming speed tests. J. Fish Biol. 2008, 72, 693–710. [Google Scholar] [CrossRef]
- Lyon, J.P.; Ryan, T.J.; Scroggie, M.P. Effects of temperature on the fast-start swimming performance of an Australian freshwater fish. Ecol. Freshw. Fish 2008, 17, 184–188. [Google Scholar] [CrossRef]
- Kieffer, J.D. Limits to exhaustive exercise in fish. Comp. Biochem. Physiol. Part A Mol. Integr. Physiol. 2000, 126, 161–179. [Google Scholar] [CrossRef]
- Randall, D.; Brauner, C. Effects of environmental factors on exercise in fish. J. Exp. Biol. 1991, 160, 113–126. [Google Scholar]
- Rome, L.C.; Alexander, R.M. The influence of temperature on muscle velocity and sustained performance in swimming carp. J. Exp. Biol. 1990, 154, 163–178. [Google Scholar] [PubMed]
- Gong, L.; Wu, Y.H.; Baiyin, B.L.G.; Mu, X.P.; Jin, Z.J. Study on impact of water flow at fishway entrance on migratory behavior of juvenile grass carp. Water Resour. Hydropower Eng. 2016, 106, 89–93. [Google Scholar]
- Fang, M.; Cai, L.; Gao, Y.; Tu, Z.Y.; Wang, C.F.; Huang, Y.P. Effect of activity cost on swimming capability of grass carp (Ctenopharyngodon idellus). Resour. Environ. Yangtze Basin 2014, 23, 816–820. [Google Scholar]
- Silva, A.T.; Katopodis, C.; Santos, J.M.; Ferreira, M.T.; Pinheiro, A.N. Cyprinid swimming behaviour in response to turbulent flow. Ecol. Eng. 2012, 44, 314–328. [Google Scholar] [CrossRef] [Green Version]
Figure 1.
Illustration of test water tank. (a) Plane graph of test water tank; (b) Cross section of water velocity measurement.
Figure 1.
Illustration of test water tank. (a) Plane graph of test water tank; (b) Cross section of water velocity measurement.

Figure 2.
Sample of tested juvenile grass carp.

Figure 3.
Classification of fish swimming behaviors under incremental water velocity: (a) Swimming freely; (b) Staying; (c) Dashing at a long distance; (d) Dashing at a short distance.
Figure 3.
Classification of fish swimming behaviors under incremental water velocity: (a) Swimming freely; (b) Staying; (c) Dashing at a long distance; (d) Dashing at a short distance.

Figure 4.
Relationship between absolute/relative critical swimming speeds and body lengths of tested juvenile grass carp: (a) Relationship between absolute critical swimming speeds and body lengths; (b) Relationship between relative critical swimming speeds and body lengths.
Figure 4.
Relationship between absolute/relative critical swimming speeds and body lengths of tested juvenile grass carp: (a) Relationship between absolute critical swimming speeds and body lengths; (b) Relationship between relative critical swimming speeds and body lengths.

Figure 5.
Relationship between absolute/relative burst swimming speeds and body lengths of tested juvenile grass carp: (a) Relationship between absolute burst swimming speeds and body lengths; (b) Relationship between relative burst swimming speeds and body lengths.
Figure 5.
Relationship between absolute/relative burst swimming speeds and body lengths of tested juvenile grass carp: (a) Relationship between absolute burst swimming speeds and body lengths; (b) Relationship between relative burst swimming speeds and body lengths.

Figure 6.
Time segment of fish swimming behaviors by size groups at various swimming stages: (a) Stage 1; (b) Stage 2; (c) Stage 3; (d) Stage 4. Note: the time segments (which are rounded to seconds) of individual fish swimming behaviors (staying, dashing at a long distance, swimming freely and dashing at a short distance) are represented by small circle, small square, and small triangles; the bar with the range represents the mean time ± standard deviation; the yellow, blue, red and purple bars represent the mean times of fish swimming behaviors of staying, dashing at a long distance, dashing at a short distance and swimming freely, respectively.

Figure 7.
Illustration of typical fishways. (a) Vertical slot fishway (adapted from Rodríguez et al. [10]); (b) Offset orifices pool type fishway (adapted from Silva et al. [50]).


Table 1.
Classification of tested juvenile grass carp based on burst swimming speed.
| Classification | BL (cm) | W (g) | Uburst (m/s) | Tested Fish Number |
|---|---|---|---|---|
| BL 1 | 6.00–8.50 | 3.80–12.21 | <0.90 m/s | 6 |
| BL 2 | 8.71–11.01 | 10.40–15.48 | 0.90–1.10 m/s | 11 |
| BL 3 | 11.30–12.30 | 15.00–20.71 | 1.10–1.20 m/s | 8 |
| BL 4 | 12.70–15.00 | 22.17–35.00 | >1.20 m/s | 5 |
Table 2.
Maximum swimming speeds of tested juvenile grass carp with four size groups at four stages.
Table 2.
Maximum swimming speeds of tested juvenile grass carp with four size groups at four stages.
| Classification | BL 1 | BL 2 | ||
| Uburst (m/s) | Uburst (%) | Uburst (m/s) | Uburst (%) | |
| Stage 1 | 0.56 ± 0.08 | 58 ± 10.50 | 0.58 ± 0.10 | 55.70 ± 8.50 |
| Stage 2 | 0.76 ± 0.08 | 78 ± 11 | 0.79 ± 0.11 | 75.80 ± 9 |
| Stage 3 | 0.84 ± 0.12 | 90.50 ± 1 | 0.97 ± 0.13 | 95.8 ± 2.6 |
| Stage 4 | 0.91 ± 0.10 | 100 | 1.03 ± 0.13 | 100 |
| Classification | BL 3 | BL 4 | ||
| Uburst (m/s) | Uburst (%) | Uburst (m/s) | Uburst (%) | |
| Stage 1 | 0.64 ± 0.07 | 60 ± 8 | 0.69 ± 0.01 | 52 ± 8 |
| Stage 2 | 0.84 ± 0.07 | 78.40 ± 9 | 0.92 ± 0.07 | 79 ± 6 |
| Stage 3 | 1.09 ± 0.06 | 95.70 ± 2.80 | 1.18 ± 0.13 | 96 ± 3 |
| Stage 4 | 1.11 ± 0.07 | 100 | 1.31 ± 0.04 | 100 |
Note: “±” indicates the range. For example, “0.56 ± 0.08” indicates that the average of Uburst is 0.56 m/s, and the range of Uburst is 0.48–0.64 m/s.
© 2019 by the authors. Licensee MDPI, Basel, Switzerland. This article is an open access article distributed under the terms and conditions of the Creative Commons Attribution (CC BY) license (http://creativecommons.org/licenses/by/4.0/).
Share and Cite
MDPI and ACS Style
Mu, X.; Cao, P.; Gong, L.; Baiyin, B.; Li, X. A Classification Method for Fish Swimming Behaviors under Incremental Water Velocity for Fishway Hydraulic Design. Water 2019, 11, 2131. https://doi.org/10.3390/w11102131
AMA Style
Mu X, Cao P, Gong L, Baiyin B, Li X. A Classification Method for Fish Swimming Behaviors under Incremental Water Velocity for Fishway Hydraulic Design. Water. 2019; 11(10):2131. https://doi.org/10.3390/w11102131
Chicago/Turabian StyleMu, Xiangpeng, Ping Cao, Li Gong, Baoligao Baiyin, and Xiang Li. 2019. "A Classification Method for Fish Swimming Behaviors under Incremental Water Velocity for Fishway Hydraulic Design" Water 11, no. 10: 2131. https://doi.org/10.3390/w11102131
Note that from the first issue of 2016, this journal uses article numbers instead of page numbers. See further details here.