Designing Aquaponic Production Systems towards Integration into Greenhouse Farming
by

Ragnar Ingi Danner
1,2, 
Utra Mankasingh
1,
Kesara Anamthawat-Jonsson
1 and
Ragnheidur Inga Thorarinsdottir
2,3,* 1
Faculty of Life and Environmental Sciences, University of Iceland, Sturlugata 7, 101 Reykjavik, Iceland
2
Svinna-verkfraedi Ltd., Fannafold 61, 112 Reykjavik, Iceland
3
Faculty of Civil and Environmental Engineering, University of Iceland, Taeknigardur, Dunhagi 5, 107 Reykjavik, Iceland
*
Author to whom correspondence should be addressed.
Water 2019, 11(10), 2123; https://doi.org/10.3390/w11102123
Submission received: 31 July 2019
/
Revised: 14 September 2019
/
Accepted: 9 October 2019
/
Published: 13 October 2019
(This article belongs to the Section Water, Agriculture and Aquaculture)
Abstract
:Aquaponics is a sustainable method of food production, whereby aquaculture and hydroponics are combined in one circular system. A few aquaponics startup companies are emerging in Europe with a limited production area of a few hundred or a few thousand square meters, whereas hydroponics is a common practice in a commercially viable manner most often with production units of several hectares. In Iceland, greenhouse farmers operate on relatively small production units, often between 2000 and 5000 m2. The aim of the present study was, therefore, to develop and design aquaponic production systems towards integration into small greenhouse farming strengthening economic viability and sustainability. Since the local market in Iceland is small and import is relatively expensive due to the distance from other markets, the suitability of commercially available fish feed and the selection of plant species were assessed in relation to production efficiency and available market and resources. The effects of water flow on plant growth and on nutrient utilization in culture water were measured and evaluated. Four aquaponics test systems were designed, built and operated, and results were used to develop a pilot commercial aquaponics system implemented for greenhouse farming in Iceland. One of the test systems was a media filled flood and drain system and the other three were deep water culture systems. Tilapia (Oreochromis niloticus), one of the most popular fish in aquaculture, was reared in all systems, while different leafy greens and fruiting vegetables were grown in the hydroponics. The fish was fed with commercial aquaculture feed made for cod and charr. The feed conversion ratio (FCR) was used to assess the effectiveness of feed on fish growth. The FCR observed in this research was between 0.9 and 1.2, within the typical values for tilapia growth in aquaculture. The production of the leafy green plants (e.g., pak-choi) was approximately four times, by weight, that of the production of fish, a similar yield as shown in other researches in the field. The continuous rise of nitrate and phosphate concentrations in the aquaponic system indicated the potential to support even higher crop yield. Long daylength in the summer in Iceland is clearly beneficial for crop production in aquaponics. Based on the results, it is concluded that aquaponics can be a feasible opportunity for greenhouse farming at least to diversify the current business model. Not only can the fish provide an extra income but also the effluent from the aquaculture is easily used as fertilizer for the plants, thus the circular production system offers new innovative ideas for diversifying and value-adding the business further, for example into crayfish production and/or into educational and experience tourism.
1. Introduction
Dwindling natural resources are forcing us to look into more sustainable ways of living. Aquaponics is a developing sustainable food production method coupling aquaculture and horticulture together in one circular system mimicking nutrient and water cycles in nature. The methodology of aquaponics has gained increased interest in recent years and the number of aquaponic practitioners has increased greatly since 2007 [1].
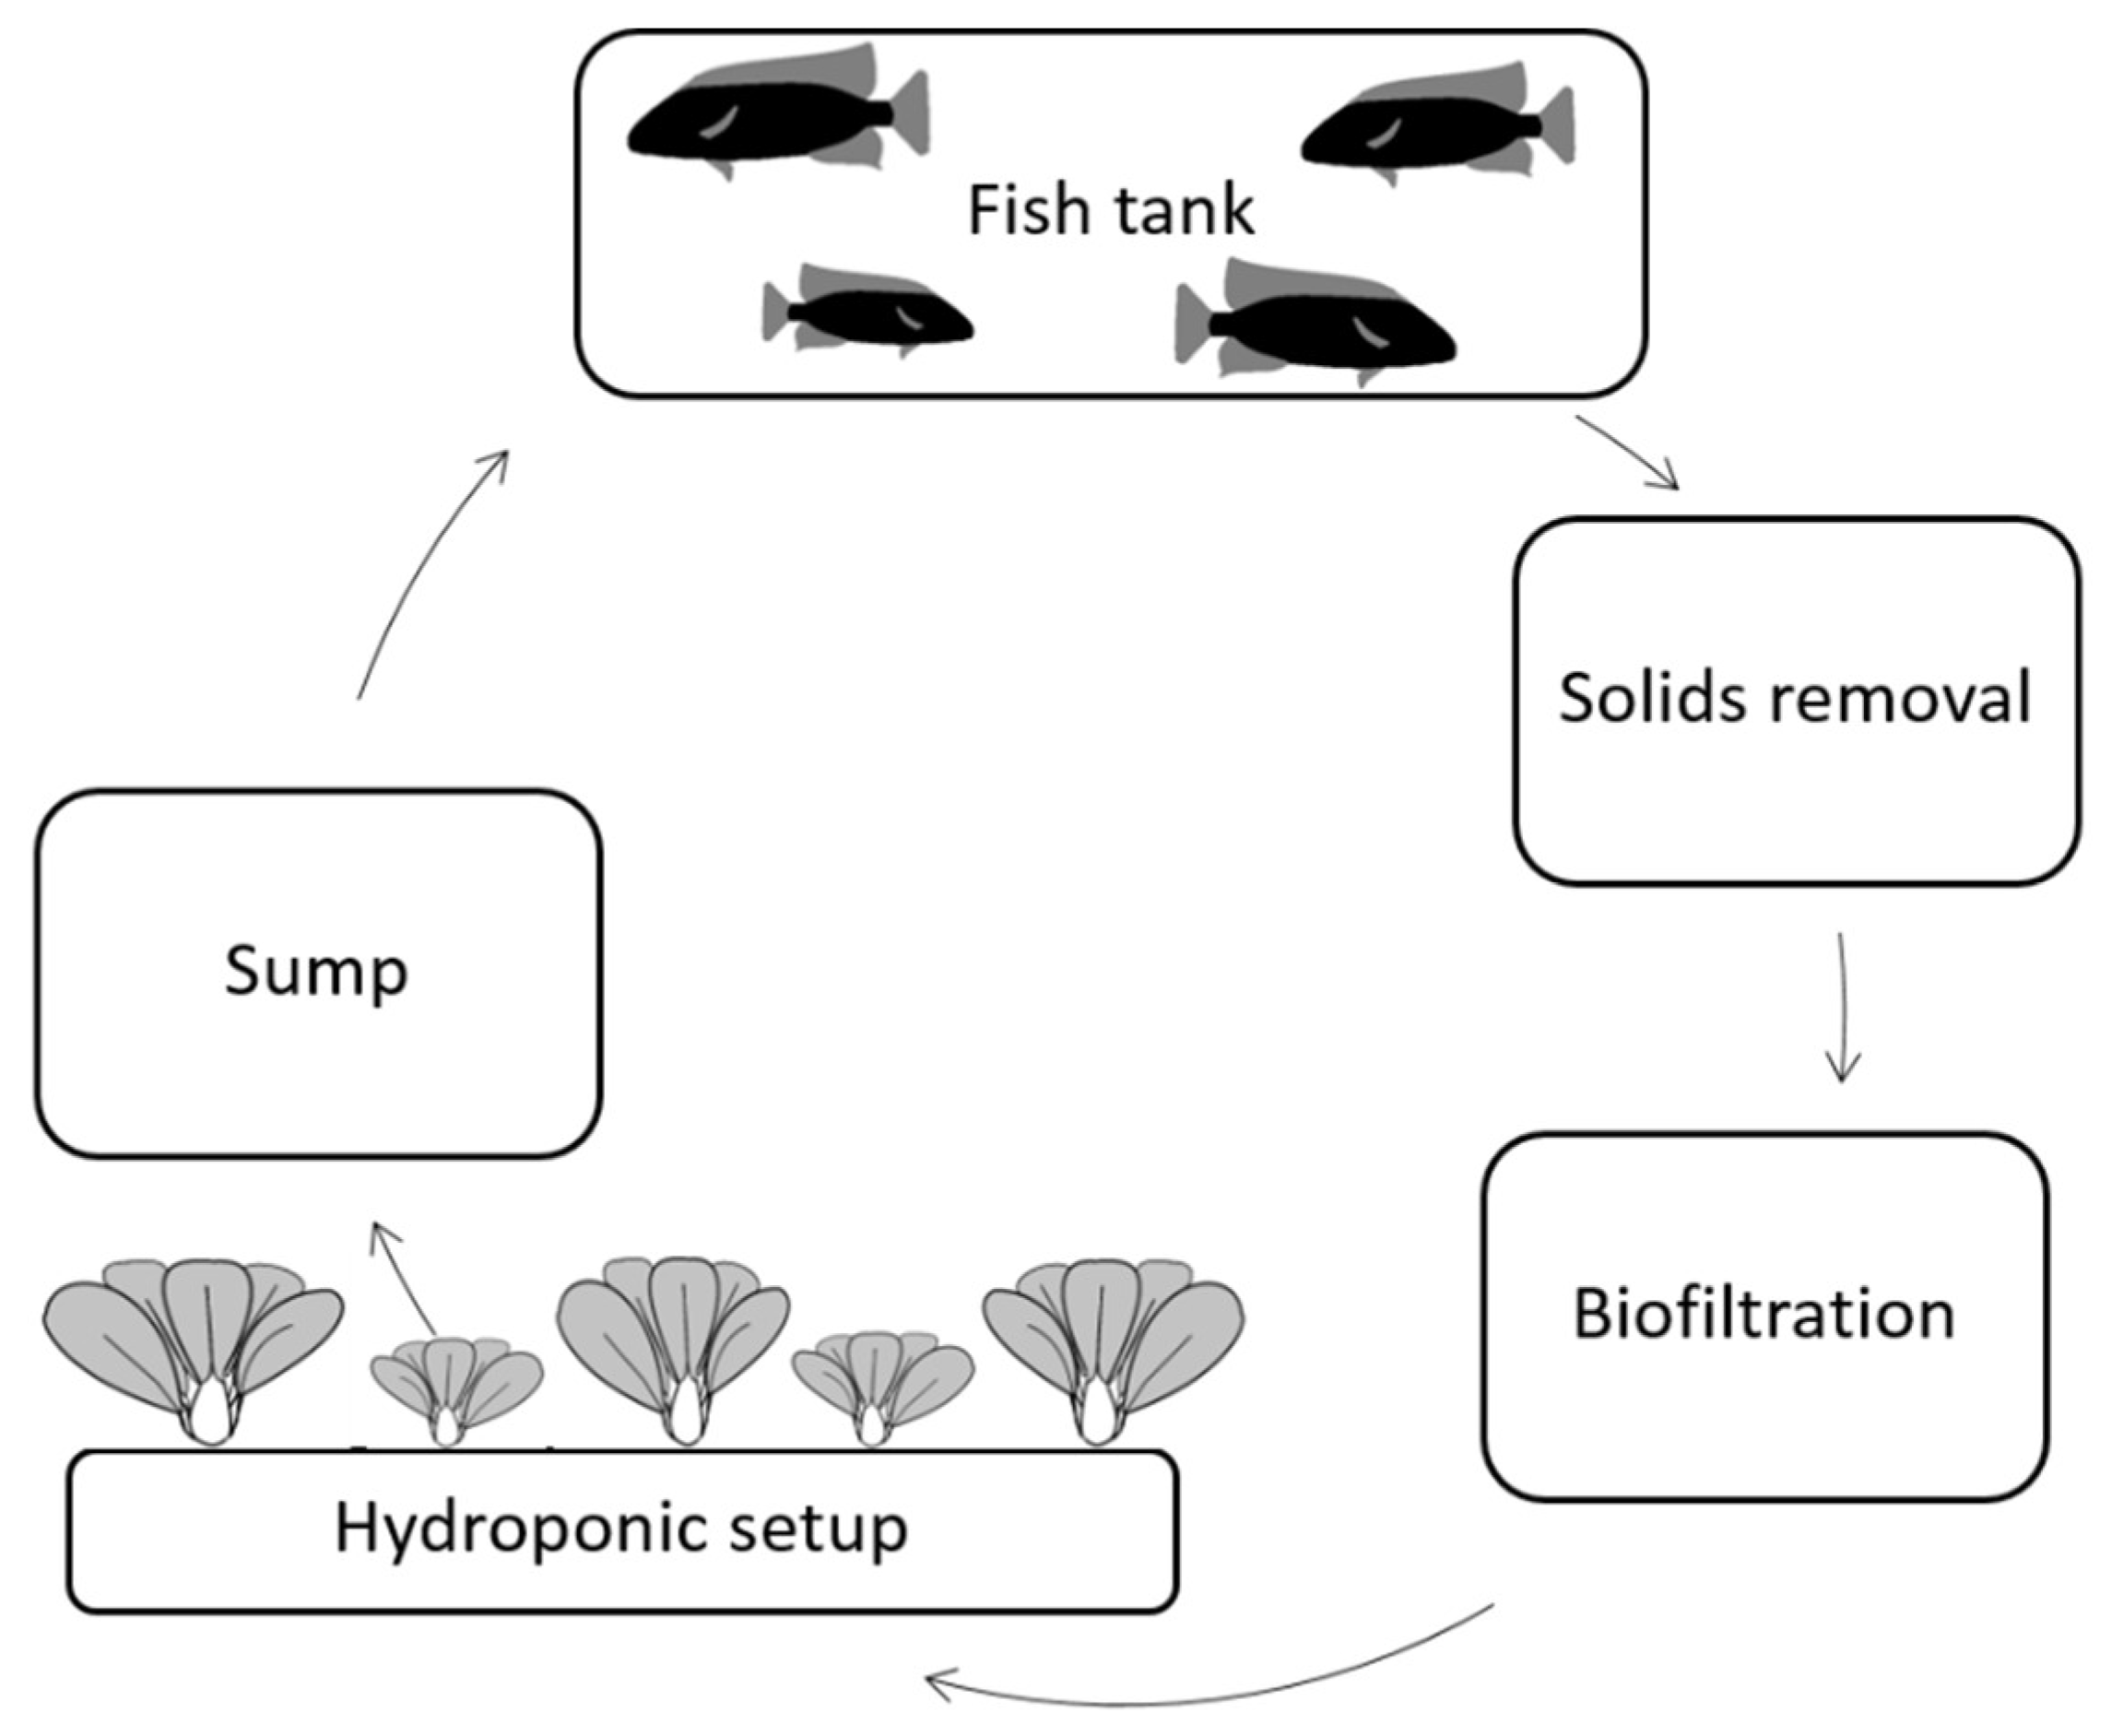
Aquaponics is a combination of recirculating aquaculture systems (RAS) and hydroponics, which is growing plants without soil in circulating water containing nutrients [2]. A typical aquaponic system (Figure 1) consists of a fish rearing tank, a solids removal tank, a biofilter, a hydroponic unit, and optionally a sump tank [3]. In RAS, it is important to maintain good water quality for the fish health by removing solid waste and dissolved nutrients that would become toxic to the fish at high concentrations. The release of large amounts of nutrients into the environment can cause eutrophication, leading to imbalances in the ecosystem such as algal bloom and changes in the local fauna [4]. Conversely, in hydroponics, it is beneficial to keep high nutrient concentrations for good growth and health of the plants. Combining these two production systems thus reduces nutrient waste through reuse, making the food production system more sustainable.
The water flowing from the fish rearing tank is first mechanically filtered to remove suspended solids that will adhere to plant roots and may affect rhizosphere health. Accumulated solids can lead to depleted dissolved oxygen in the water, due to a high biological- and chemical oxygen demand (BOD and COD) and elevated ammonia levels [5]. Organic particles can also lead to reduced effectiveness of the biofilter [6]. After removal, the solids can be mineralized to release nutrients and then re-introduced into the aquaponic system, where the released nutrients can be of further use for the plant growth [7].
After solids removal, the water is passed through biomedia (biofilter), whereby the biological conversion takes place via a two-step bacterial nitrification of the ammonia in the fish waste. In the first step, ammonia is converted to nitrite, and in the second step, nitrite is converted to plant-usable nitrate. The nitrate-enriched water then flows to the hydroponic unit, where the plants remove nutrients from the water by utilizing them for growth. The main types of hydroponic setups are deep water culture (DWC), nutrient film technique (NFT), and flood-and-drain (F&D) systems, and these differ mostly in the method of irrigation [7].
The success of recirculating aquaponic systems relies on a healthy environment for both fish and plants, by securing good aeration, a suitable pH in the system, efficient biological conversion of harmful ammonia to beneficial nitrate and the plant uptake of dissolved nutrients. Plants utilize nitrogen mostly as nitrate (NO3−) or ammonium (NH4+), but the total ammonium nitrogen (TAN) in the fish waste consists of two forms, i.e., ammonia (NH3) and ammonium (NH4+). Generally, biological membranes are highly permeable to NH3 but impermeable to NH4+, consequently causing NH3 toxicity to fish at high concentrations [8]. The NH3/NH4+ balance, and thereby the level of toxicity of TAN, is related to the pH within the system, with NH3 predominating at higher pH [8]. Nitrite, the intermediate product of bacterial conversion of ammonia to nitrate, is also toxic. Its toxicity is due to its affinity to the Cl− binding mechanism in fish gills [9]. It can cause methemoglobinemia and it also has an effect on the osmoregulatory and endocrine systems in fish [10]. However, nitrite can be detoxified in aquatic animals at high environmental oxygen concentrations [11]. The potential toxicity within the aquaponic system can be prevented by good design, planning, and management. Water temperature, pH, and good aeration to maintain sufficient dissolved oxygen are critical parameters that need to be regularly monitored and controlled.
Most aquaponic systems are small-scale hobbies or research units built by enthusiasts mostly interested in making their own food in environmentally positive cultivation [1]. However, a few startup companies in Europe have taken the step towards commercial production [7]. Goddek et al. [12] suggested aquaponics as an important driver for the development of integrated food production systems and identified opportunities to fill the gap between research and implementation of commercial aquaponics. The interest in aquaponics has been awakened by both conventional aquaculture and horticulture companies since the aquaculture needs to minimize organic waste from fish farming and the horticulture is looking for environmentally friendly fertilizer, and in some cases, possibilities to diversify the business. For large-scale production systems, several challenges need to be addressed. One of these is to optimize the design and the production ratio between fish and plants and setting up pilot units that can be scaled up to commercially viable units, as conducted in the present study.
The living components of the aquaponics system drive the system design. Tilapia (Oreochromis niloticus) is one of the most popular fish species in aquaculture and in aquaponics. A market test was carried out in Iceland in 2011 and fresh tilapia was very well received and could be sold at the same price as cod fillets in the Icelandic market. The popularity of tilapia in aquaculture is due to its omnivorous nature, rapid breeding, and fast growth. Higher productivity has been reached by all-male cultures [13]. The Food and Agricultural Organization of the United Nations (FAO) has suggested that aquaculture of tilapia should replace agriculture of livestock in poorer regions because it has lower feed conversion ratio (FCR), based on similar feed as used for livestock, i.e., 1.6 for tilapia versus 8.8 for cereal-fed beef [14,15]. Tilapia is also very hardy and tolerant of a wide range of water quality, such as a large temperature variation (15–30 °C), although thrives at the optimum of 26–28 °C. Other species of fish have also been tested in aquaponic systems. Rainbow trout (Oncorhyncus mykiss) and brown trout (Salmo trutta), for example, are already popular, dominant aquacultural species in Europe. They need better water quality than tilapia and are reared at a lower temperature (<17 °C), therefore requiring a larger biofilter and more aeration. Trout has been cultured with good results in a test aquaponic system at Nibio in Norway [7].
Various species of plants have successfully been cultivated in aquaponic systems (Table 1) [6,16,17,18,19,20,21,22,23,24,25,26,27]. To date, they are all edible species. Many studies show that leafy green plants, such as various cultivars of lettuce (Lactuca sativa) and basil (Ocimum basilicum), give good yield in aquaponic systems [16,17,18].
Aquaponics startup companies have met several challenges not least due to the small pilot units and simple setups not using best practices within both the aquaculture and horticulture parts. The main goal of this project was to design and implement a pilot commercial aquaponic system suitable for implementation and incorporation into already operating greenhouse farming in Iceland. Different aquaponic crops were tested and the production ratio between plants and fish was determined for each system. The effect of flow rate on the plant yield and nutrient removal was also assessed. Smaller tests were carried out adding Australian red claw crayfish (Cherax quadricarinatus) and red worms (Eisenia fetida) to the system. Moreover, the main aquaponics products from the tests (tilapia, pak-choi, and herbs) were offered to a consumer test group to receive their feedback on quality and acceptance for aquaponics products.
2. Materials and Methods
2.1. System Design and Development
The aquaponic system design was developed in four separate stages (Table 2, Figure 2 and Figure 3): System 1 was a small showcase system (Figure 2a), Systems 2 and 3 were small-scale greenhouse pilot systems (Figure 2b,c), System 4 was a larger scale experimental system (Figure 3). Each stage represented a design improvement based on knowledge gained from the previous system design. Tilapia was the fish used in all systems, although the life-stages varied. Water was a mixture of hot/cold non-chlorinated water obtained from the municipal supply. The temperature was maintained using 300 W per 0.3 m3 of water.
2.2. Systems 1, 2 and 3
System 1 (Figure 2a) was an experimental flood-and-drain type system (F&D) that was set up at the Iceland Ocean Cluster House in Reykjavik. The pumice (Manufacturer: Jardefnaidnadur Ltd. Iceland (www.jei.is)) in the growbed acted as both mechanical and biological filtering as well as plant support. Various leafy greens and fruit vegetables were tested in this system, where fish of mixed sizes from 20 to 200 g were reared. The fish was fed 1% of its weight daily and weighed monthly to assess its growth. The fish was reared on charr feed (42% protein, 26% fat). The pH of 6–7 was maintained with the addition of the alkali KOH (25%) and Ca(OH)2 (1%). Australian red claw crayfish and red worms were added to the system to feed on the sludge.
The subsequent Systems 2 and 3 were both constructed inside a greenhouse and were operational during June–September, allowing up to 22 h of natural light during summertime. Both systems used sedimentation basins as mechanical filters and moving bed bioreactors as biofilters. The system of deep water culture (DWC) was used with herbs and leafy greens (Figure 2b,c, Table 2). System 2 did not have a sump, whereas System 3 had a sump regulating the water level within the fish tank. In all systems, fish were introduced at Week 1.
2.3. System 4
System 4 was built in an industrial building. The system design was based on System 3 and improved from the earlier test systems, comprised of three successive production phases: Test, Trial 1, and Trial 2. The growbeds were set up as pairs (Figure 3) with differing flowrates of 500, 160, and 40 L/h. Each individual growbed had a surface area of 1.2 m2. In Trials 1 and 2, the mechanical filtration capacity was increased and the final Trial 3 system consisted of a 1 m3 fish tank, a 1 m3 sediment filter, a biofilter with 0.2 m3 media divided into two 0.2 m3 barrels (total surface area of biofilter material was >200 m2), six growbeds, 0.36 m3 (1.2 m2 surface) each, and a 0.5 m3 sump tank. A 400 W metal halide bulb (400 W Powerplant SuperVeg Metal Halide Bulb) with a eurowing reflector suspending over each pair of the DWC beds gave artificial lighting of >100 W/m2. From the growbeds, the water was collected in the sump and pumped back into the fish tank. The fish density was 15 kg/m3 when starting the tests and in each growbed, 40 pak-choi seedlings were grown in 50 mm net pots. In Trial 1, ambient lighting through windows in the building was also present for up to 22 h/day. All fish in System 4 was between 200 and 400 g initial weight. Daily feeding was 1% of the initial fish biomass in the system and the fish was weighed monthly. In the test run, the fish was reared on charr feed (42% protein, 26% fat). After that the feed was changed to cod feed as it had a lower fat content (51% protein, 17% fat).
2.4. Productivity and Yield
Different plants were grown in the systems (Table 2). In System 1, various species were tested, including fruiting vegetables (tomato, pepper, and okra), leafy vegetables (pak-choi and komatsuna), salad (watercress) and herbs (basil). In Systems 2 and 3, rucola salad and herbs including basil, coriander, and mint were selected for growing in the greenhouse facility. On the other hand, only the leafy vegetable species pak-choi was grown in System 4. All plants were grown within seeds. The fresh weight of tilapia and pak-choi produced was measured to calculate the mass balance of production for each trial. Biomass, or other forms of yield such as seed yield or fruit harvest, always has a direct correlation to the plant’s net photosynthetic rate, plant productivity [28,29], and is the main quantitative measure of a successful horticultural practice. However, in the context of aquaponics, especially during the designing and optimization stages as in the present study, biomass can be used to indicate plant metabolism and health, due to the efficiency of mineral nutrition and uptake by the roots.
2.5. Water Quality Management
Physicochemical parameters were measured in Systems 2–4. Conductivity, total dissolved solids (TDS) and pH were measured twice weekly using PCSTestr 35 multi-Parameter device (Eutech Instruments, Vernon Hills, IL, USA). Dissolved oxygen was monitored using the CyberScan DO300 DO meter (manufactured by Eutech Instruments). Dissolved oxygen (DO) levels were maintained over 7 mg/L by controlling the aeration with air-blowers. Ammonia, nitrate/nitrite, and phosphate in the water system were measured on site twice weekly and analyses were performed using Multitest NO2/NO3, Multitest Ammonia and Multitest Phosphate (Seachem Laboratories, Madison, GA, USA). Iron was measured weekly with a hand-held colorimeter (Iron Checker® HC-HI721, Hanna Instruments). Iron was maintained at 0.3 mg/L in all systems by adding AquaIron DTPA Iron Chelate as needed.
2.6. Water Sampling and Nutrient Analysis
The water quality within System 4 Trials 1 and 2 was monitored weekly: two 100 mL samples were collected from nine locations (fish tank, biofilter, beds A1, A2, B1, B2, C1, C2, and the sump) every seven days. For each sampling, one of the two samples was filtered within six hours of collection, using a 0.45µm cellulose acetate filter to remove any suspended solids, and the dissolved fraction was used for the analysis of ammonia, nitrite, nitrate, and phosphate. All samples were kept frozen until analysis. Nitrite (NO2-N) was analyzed by spectrophotometry (540 nm) after reaction with Greiss reagent [30]. Nitrate (NO3-N) was reduced to nitrite with hydrazine-copper/zinc [31] and then measured spectrophotometrically as described for nitrite [30]. The TAN (total ammonium nitrogen) (NH4-N) was measured according to Koroleff [32]. Phosphorus (PO4-P) was determined using the method described in Murphy and Riley [33]. Subsequent to nutrient analysis, the samples were acidified, and selected samples were sent for analysis of total dissolved magnesium (Mg), calcium (Ca), potassium (K), Molybdenum (Mo), and Boron (B), using inductively coupled plasma optical emission spectroscopy (ICP-OES).
2.7. Data Analysis
Statistical analysis of data was performed using the statistical software package RStudio Version v.0.99.491. Analysis of variance (ANOVA) was used to test if the flow rate affected the plant yield or nutrient removal (significance level 0.05). Total dissolved elements from the ICP-OES analyses were excluded from statistical analyses.
3. Results
3.1. System Design
Fruit plants and leafy vegetable crops all grew well in System 1, with salads and herbs easier to produce in the closed aquaponic loop, possibly due to the lower and more stable nutrient levels the system provided. Salads and herbs are also less demanding in terms of light quality and daylength, compared to flower and fruit crops. Design improvements made from System 1 to the last trial of System 4 were mainly about the filtering units, both the mechanical filtering and biofilters. System 1 was an F&D system with limited solids removal, thus functioned well during the first 18 months, after which, water quality issues related to low pH became persistent and frequent and could not be managed with alkali addition only. Solids settling in the pumice lowered the system to pH 5 within a few hours after water exchanges with neutral to alkaline exchange water (pH 7–8). This issue could only be mitigated by washing the media. The addition of crayfish and red worms increased the breakdown of solids in System 1 but this was not sufficient to keep the system in balance. Therefore, improved solids removal was included in all subsequent system designs. Systems 2 and 3 were constructed simultaneously and the decision was also made to switch to DWC for easier and more economical maintenance of water quality and cleaning of the growbeds. System 2 was built without a separate sump so the water level in the fish tank fluctuated, while the design of System 3 included a sump (Figure 2) and in System 4 the sedimentation and biofilter were further improved (Figure 3). The design of System 4 featured three different flow rates, the growbeds with the fastest flow (Pair A) showed the most solids buildup with visibly more solids covering the roots of the plants, especially in the Test run and Trial 1, while slower flow rates in the growbeds Pairs B and C had fewer solids buildup on the roots.
3.2. Biofilter and Nutrient Water Quality
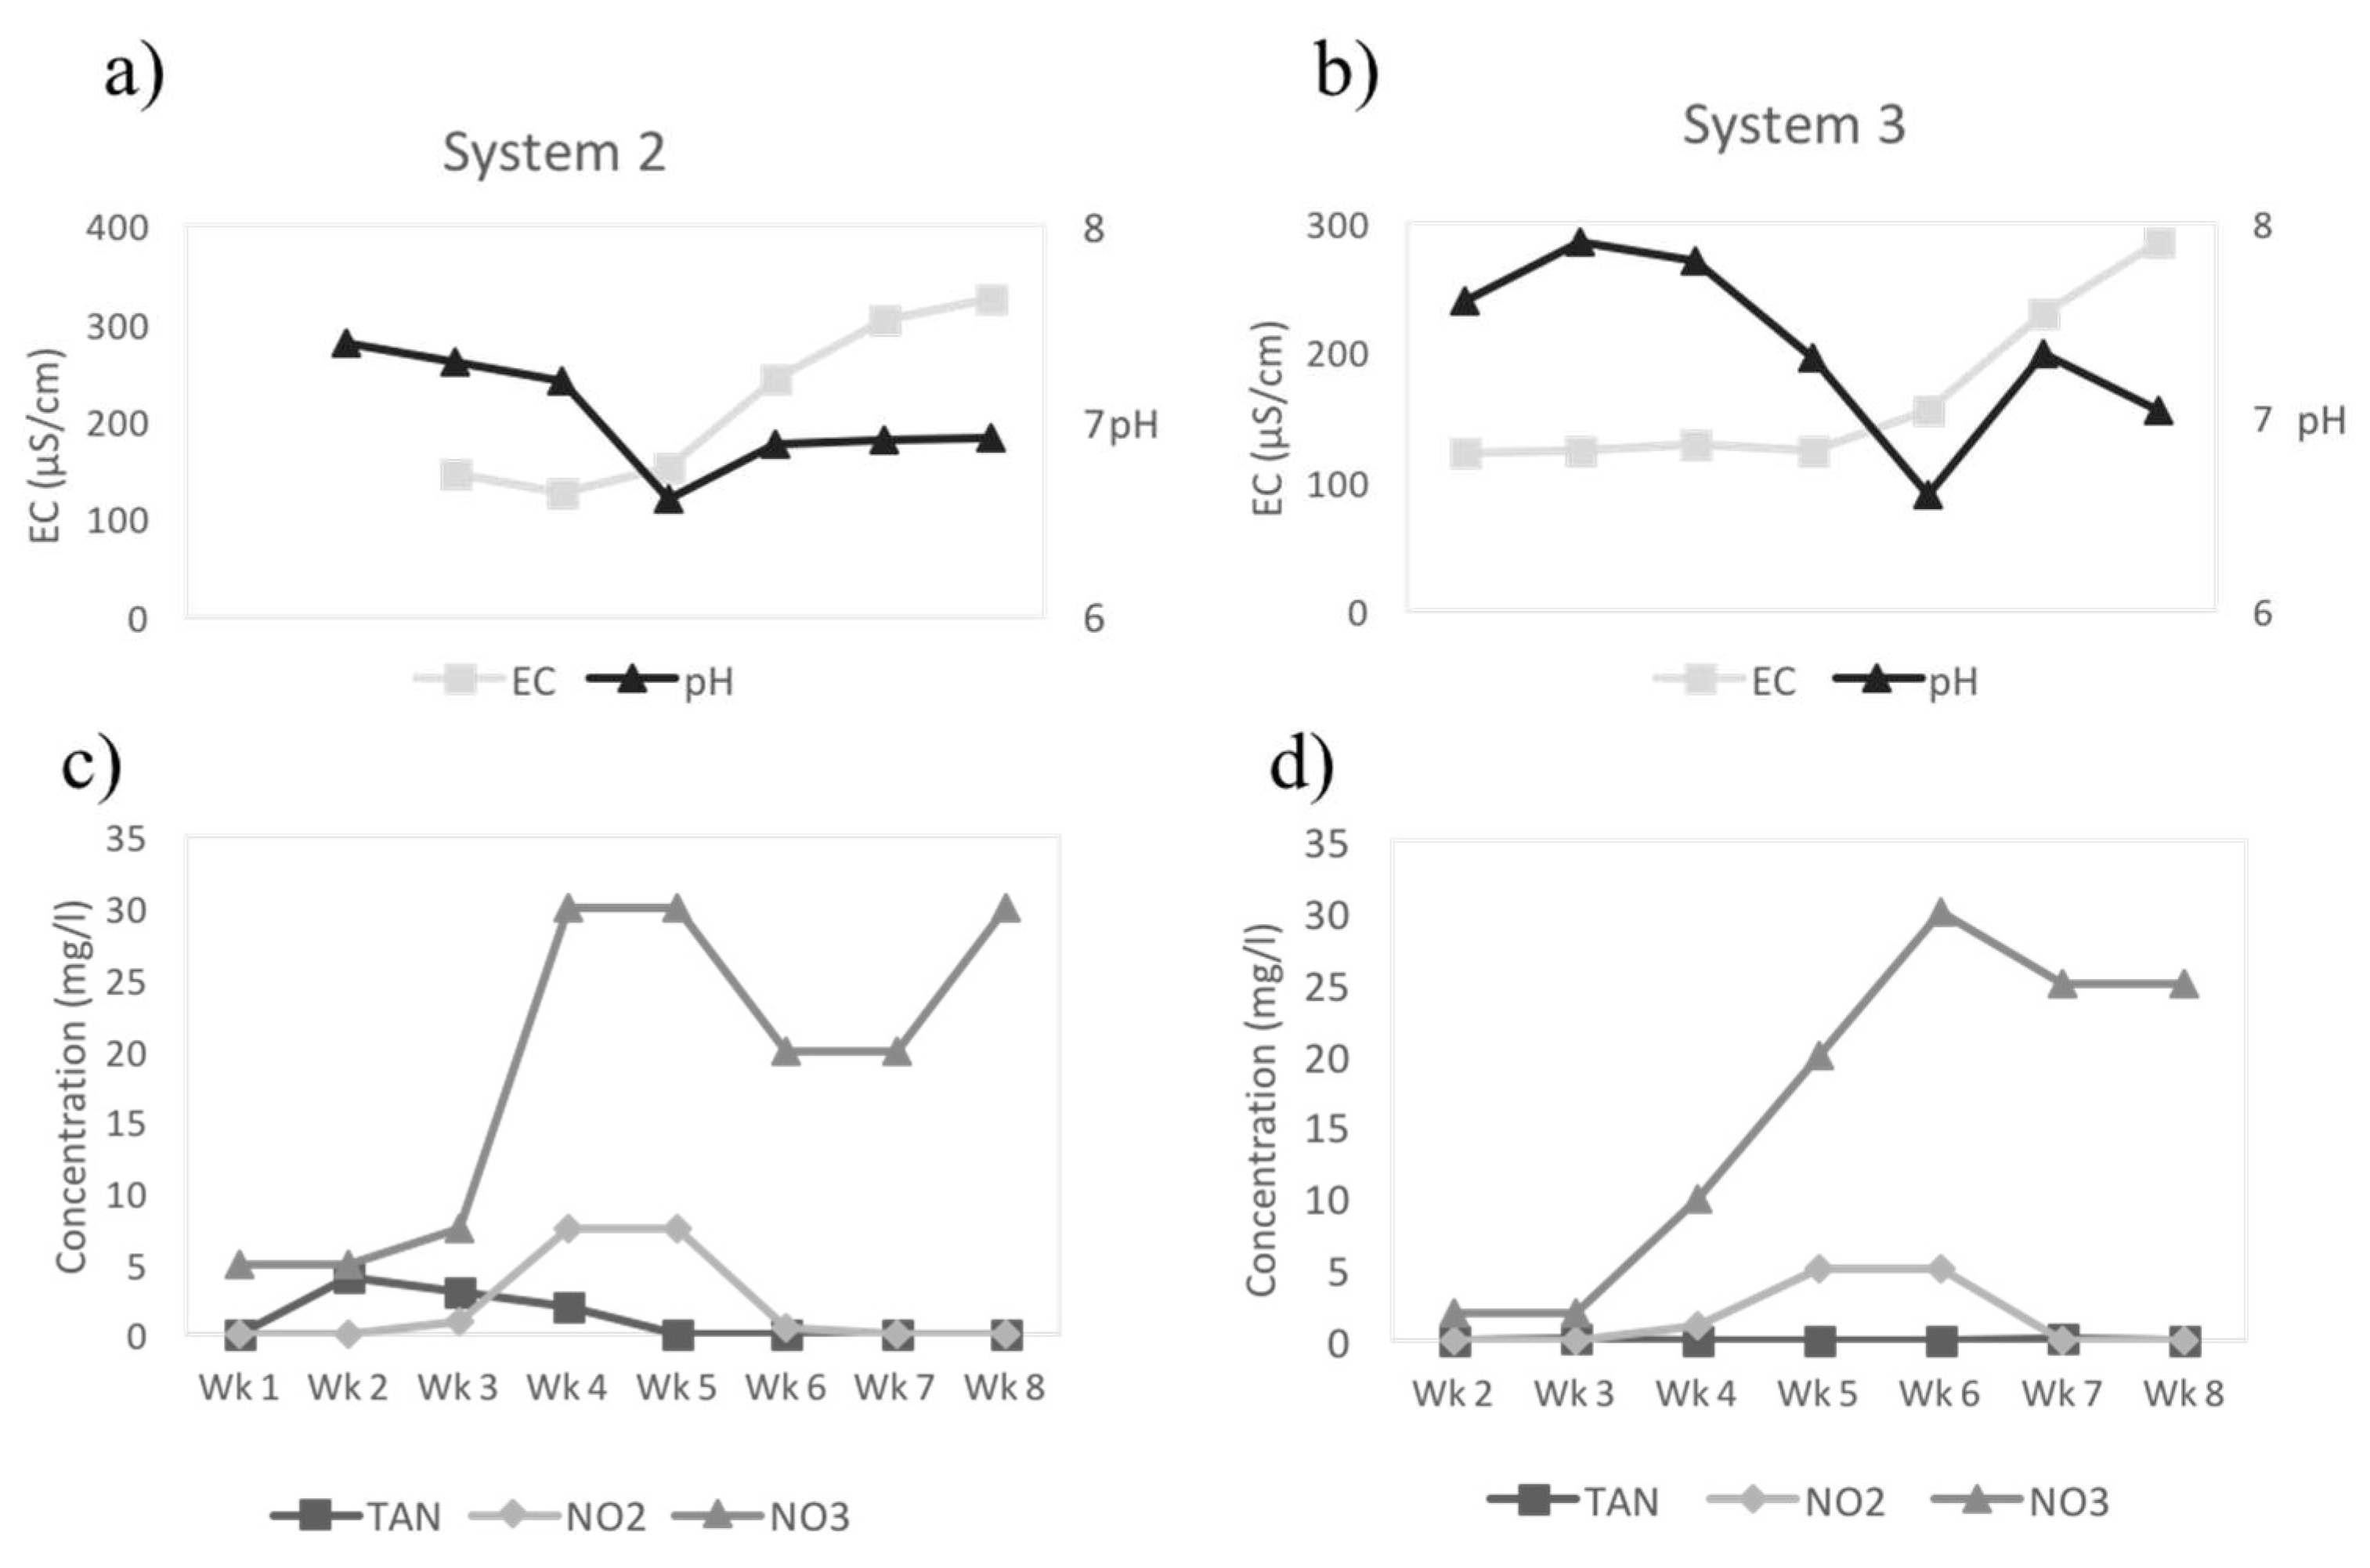
The development of the biofilter in Systems 2 and 3, with regard to the efficient conversion of nitrifying bacteria, was monitored for eight weeks (Figure 4). Conductivity and pH increased as the ammonium ions accumulated in the system, from the increasing fish waste (Weeks 1–4), before dropping sharply as bacterial nitrification of the ammonia waste by the biofilter reduced the TAN and with a concurrent increase in nitrite and then nitrate concentrations (Figure 4). The pH also decreased between Weeks 2 and 4 as the nitrifying process was acidifying the water system and the nitrification of ammonia to nitrite surpassed the build-up of ammonia. The steep increase of the nitrate concentration clearly indicated high conversion efficiency in the process. A fully mature system, that is when TAN and nitrite could not be detected (<0.03 mg NH4-N/L and <0.01 mg NO2-N/L, respectively) was obtained by Week 7 in both systems.
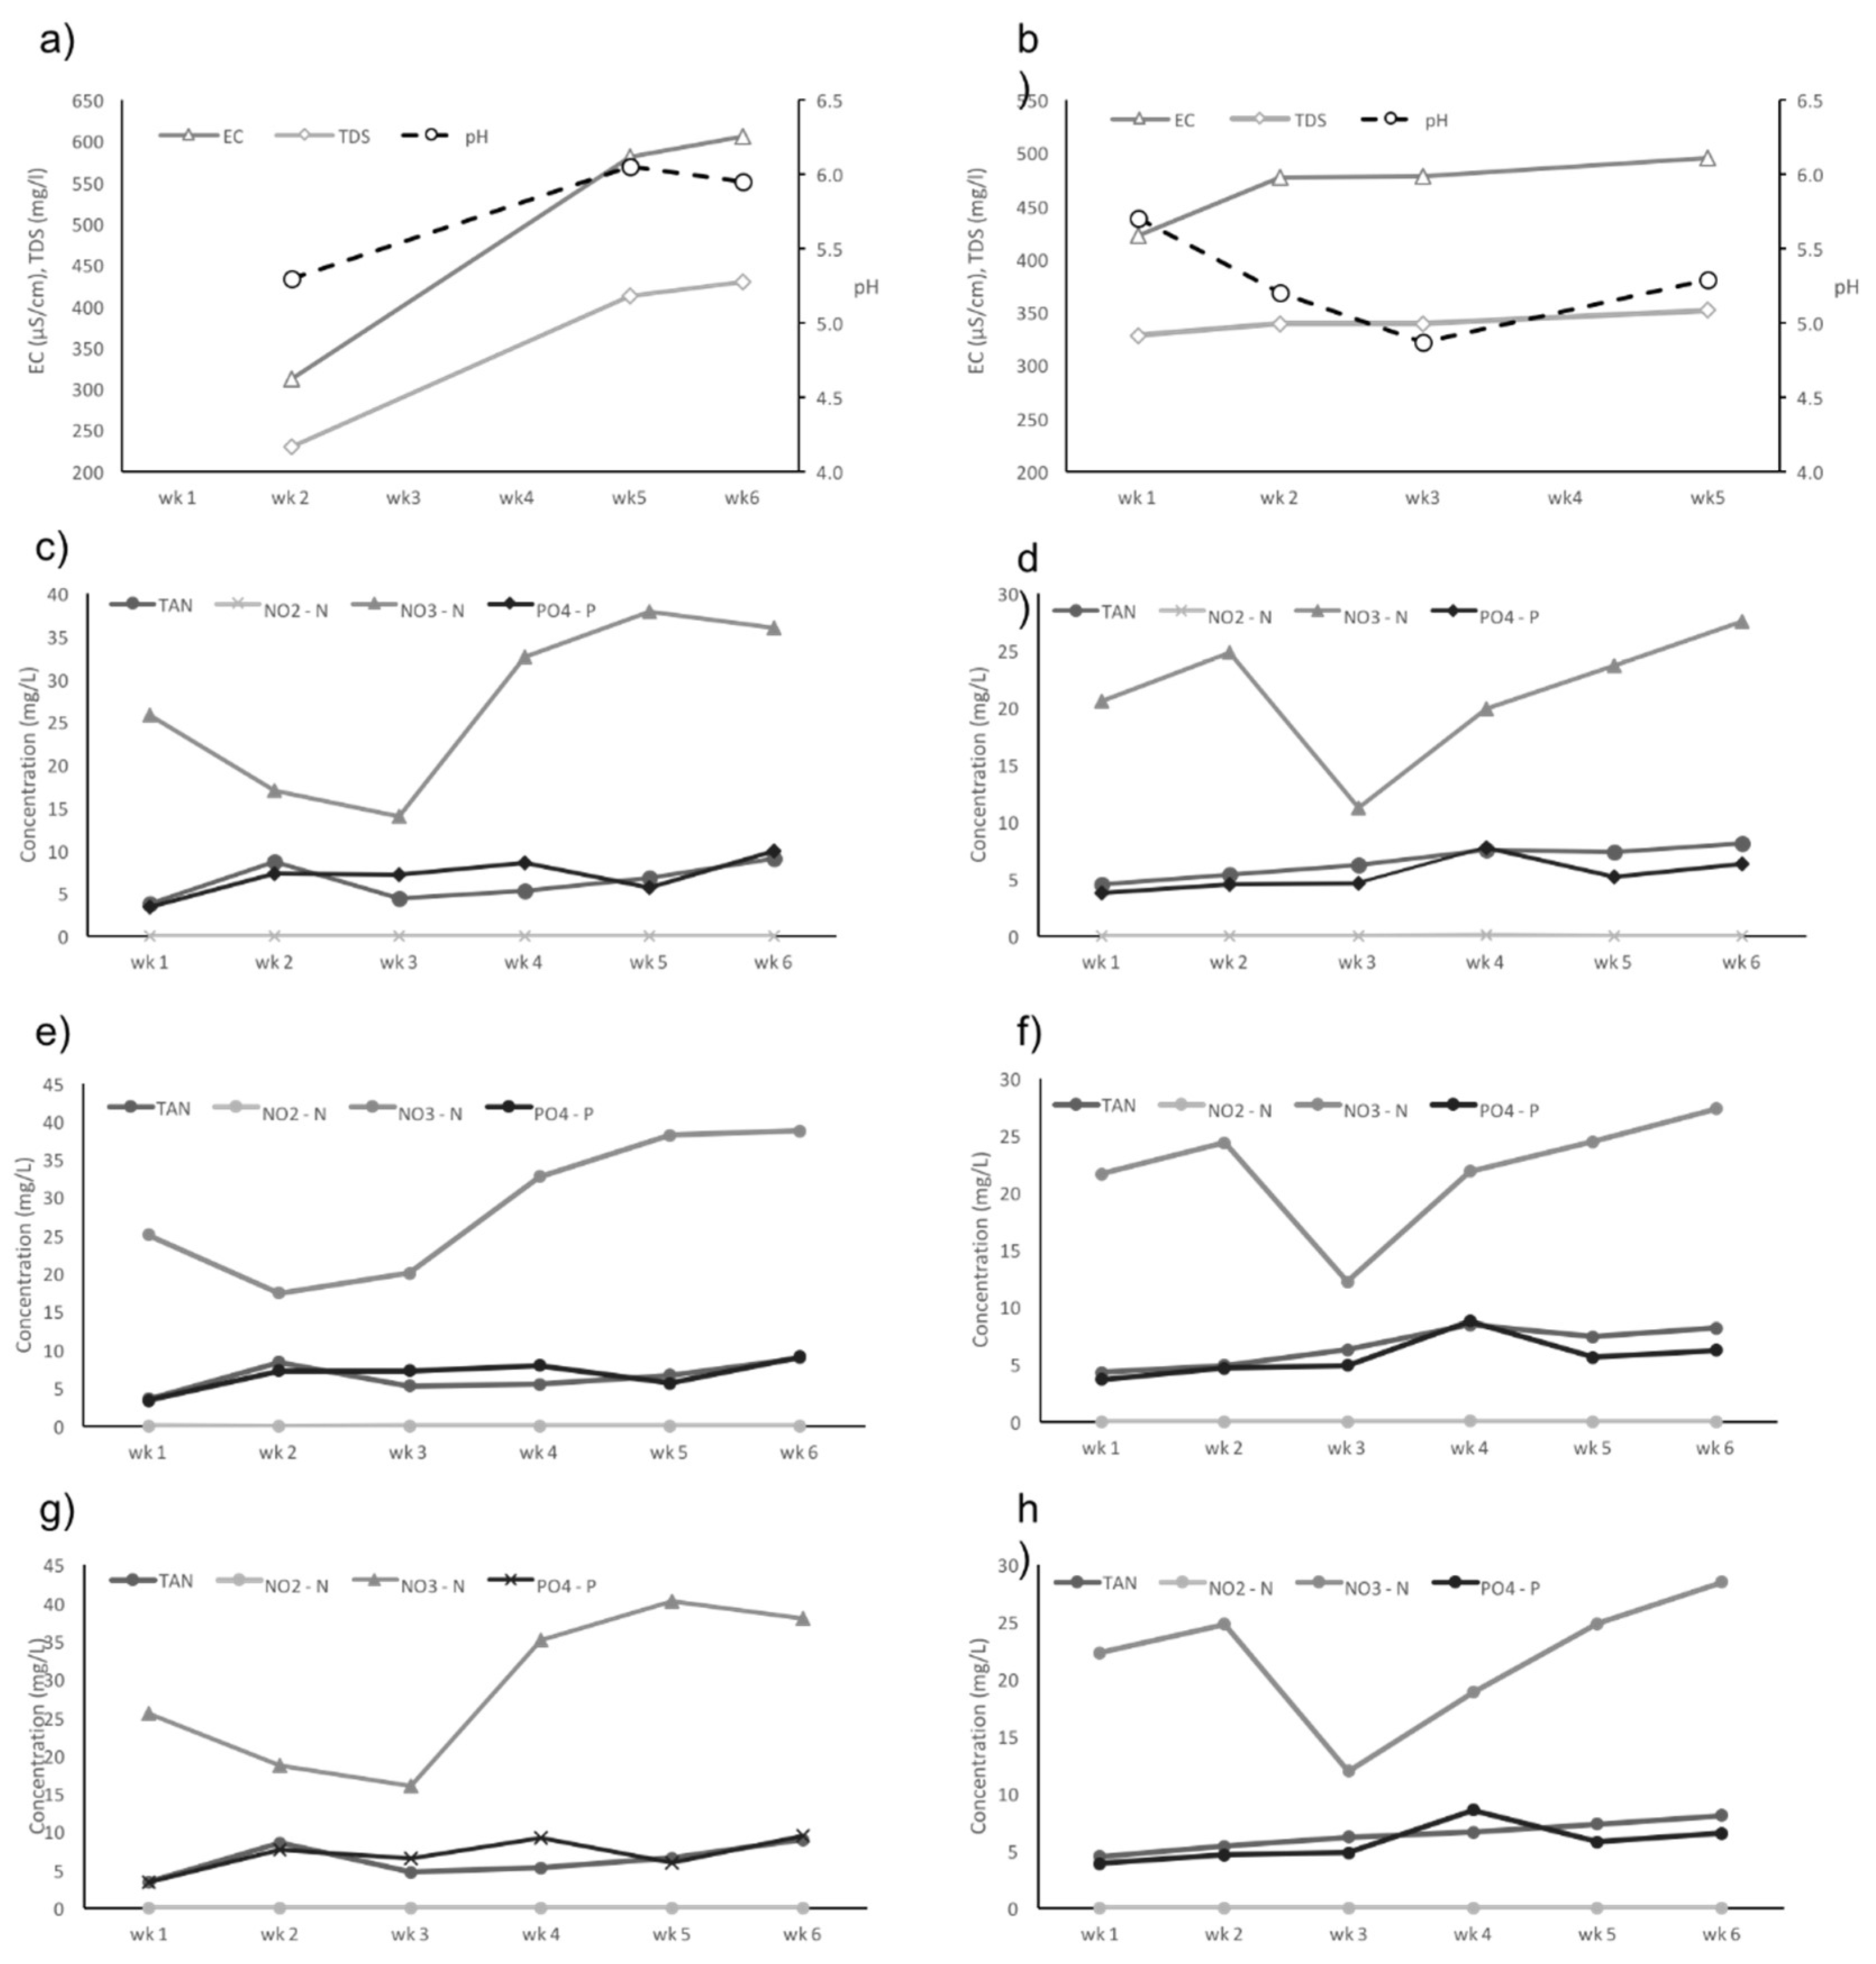
The water quality was measured throughout the experiments in System 4 Trials 1 and 2 (Figure 5a–h). The inorganic N-species and phosphate concentrations were measured at different locations within System 4. Nutrient concentrations followed the same main trends throughout each trial of System 4 (Figure 5c–h). Statistical analysis indicated that the flow rate had no significant effect on plant growth (Table 3) nor nutrient removal within each grow-bed (Table 4). The drop in nitrate between Weeks 2 and 3 in Trial 2 was due to an interruption in feeding (Figure 5d,f,h), as a result of system failure. Table 5 shows the dissolved macro- and micronutrients (mg/L) in water samples from selected sampling points in System 4 Trial 2. An overall increase in concentration of essential elements soon after Week 1 has been detected throughout the system, especially the macronutrients (Table 5), indicating that the system has the potential for higher plant yield than tested in the present study.
3.3. FCR and Yield
The feed conversion ratio (FCR) of 0.9–1.4 for tilapia obtained in the present study (Table 6) is within the range often experienced with tilapia. The fish was fed with a high-energy feed thus a low FCR would be expected. Figure 6 shows the pak-choi yield from System 4. The highest plant:fish ratio of 4.0 was obtained in Trial 1 (Table 6), with good growth at all flow rates applied. Trial 1 was operated during summertime. Plant yield from System 4 Test was three times lower than in Trial 1, as the establishment of nitrifying bacteria in the system was still in a developing stage, thus was not expected to give any considerable plant yield (see also Figure 4). Unfortunately, the results from Trial 2, which was conducted under winter conditions, were not reliable due to failure in feeding and temperature control. A higher yield would be expected in a mature system when the nutrient levels have stabilized. There was no significant difference found in plant biomass due to flow in the growbeds (Table 3).
3.4. Comparison of Plant Species
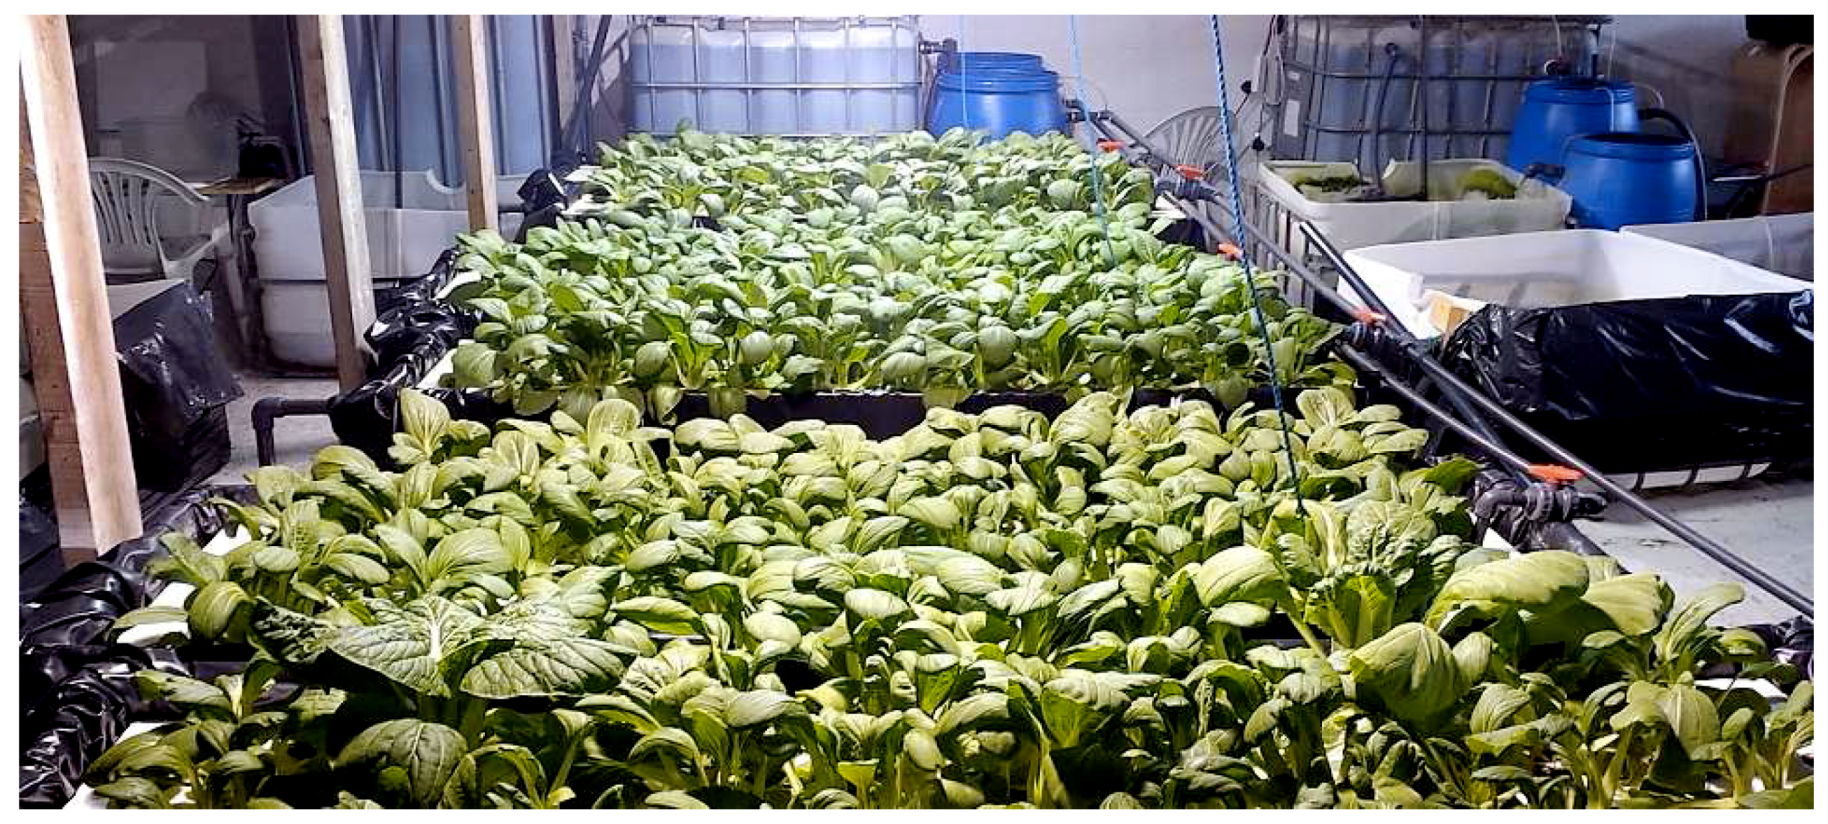
Pak-choi as a single crop grown in System 4 was a success. The hydroponic area was 7.2 m2 for each of the three set-ups in this system, larger than in the earlier systems (Table 2). The best results were obtained from Trial 1, the summer set-up in the industry building with 12 h/day artificial light together with 18–22 h/day ambient light through the window. Pak-choi aquaponics of System 4 Trial 1 came out the best, with a production ratio of 4:1 (plant to fish), see Table 6. During the cultivation in this trial, pak-choi plants looked healthy (Figure 7) and showed no signs of mineral deficiency. Root growth appeared active and healthy even though roots started accumulating solids. The vegetable quality at harvest was satisfactory. To consumers, the most important property of leafy vegetables, such as pak-choi, is freshness. Pak-choi harvested from this system had this freshness, turgidity (high water content) and clean stems and leaves (void of symptoms of nutrition/mineral deficiency). It is a cool-season crop, hence suitable for greenhouse cultivation in Iceland, hydroponic or not. Several varieties of salad greens (in particular, Lactuca sativa) have been for the past years a prominent option of fresh vegetables available in supermarkets. On the contrary, Pak-choi, or other varieties of Brassica rapa, was and is still unknown among growers in Iceland. Consumer tests showed that pak-choi clearly has market potential.
In Systems 2 and 3, rucola salad green and herbs, including basil, coriander, and mint, were grown in the greenhouse (Table 2). Some of the plants tested showed better results than others–basil and mint grew very well and showed healthy, fast growth. Other species, such as dill and coriander, showed mostly stem growth and flowered intensely without producing much biomass, the roots of these plants were healthy until Week 12 when older roots started to die and rot away. Both dill and coriander are known to be very sensitive to day length, therefore the long 18–22 h daylight in the summer in the present study must have been the main reason for them to switch to the flowering phase quickly. All plant species considered, the total production ratios (plant to fish biomass) from Systems 2 and 3 were 1.2:1 and 1:1, respectively.
Rucola (salad green) in Systems 2 and 3 showed severe symptoms of deficiency, with stunted growth and purple leaves (excess anthocyanins), indicating phosphorus deficiency [34,35]. At that point the plants had no roots sprouting outside of the rehydrated peat growing medium, thus causing a suspicion that the rhizosphere conditions within the peat were too acidic. After the addition of CaCO3 to the growbeds, the rucola plants showed some improvement and roots started sprouting outside the peat. Even though their condition improved, the plants started flowering after only a few days and the root growth was very little. When measured, phosphorus was in good supply (3 mg/L) and the water pH of 6.4 was considered optimal. However, from the pH of 6.5 and up [35], a few essential nutrient elements, especially phosphorus, manganese, and boron, are not in the form available to plant root uptake, i.e., the pH being too alkaline in this context. Interestingly, the nitrate availability rose sharply after weeks 3–4 in both systems (Figure 4), indicating the inefficiency of nitrate utilization by the plant, resulting in poor vegetative growth as a whole.
3.5. Pilot Unit in Greenhouse Farm
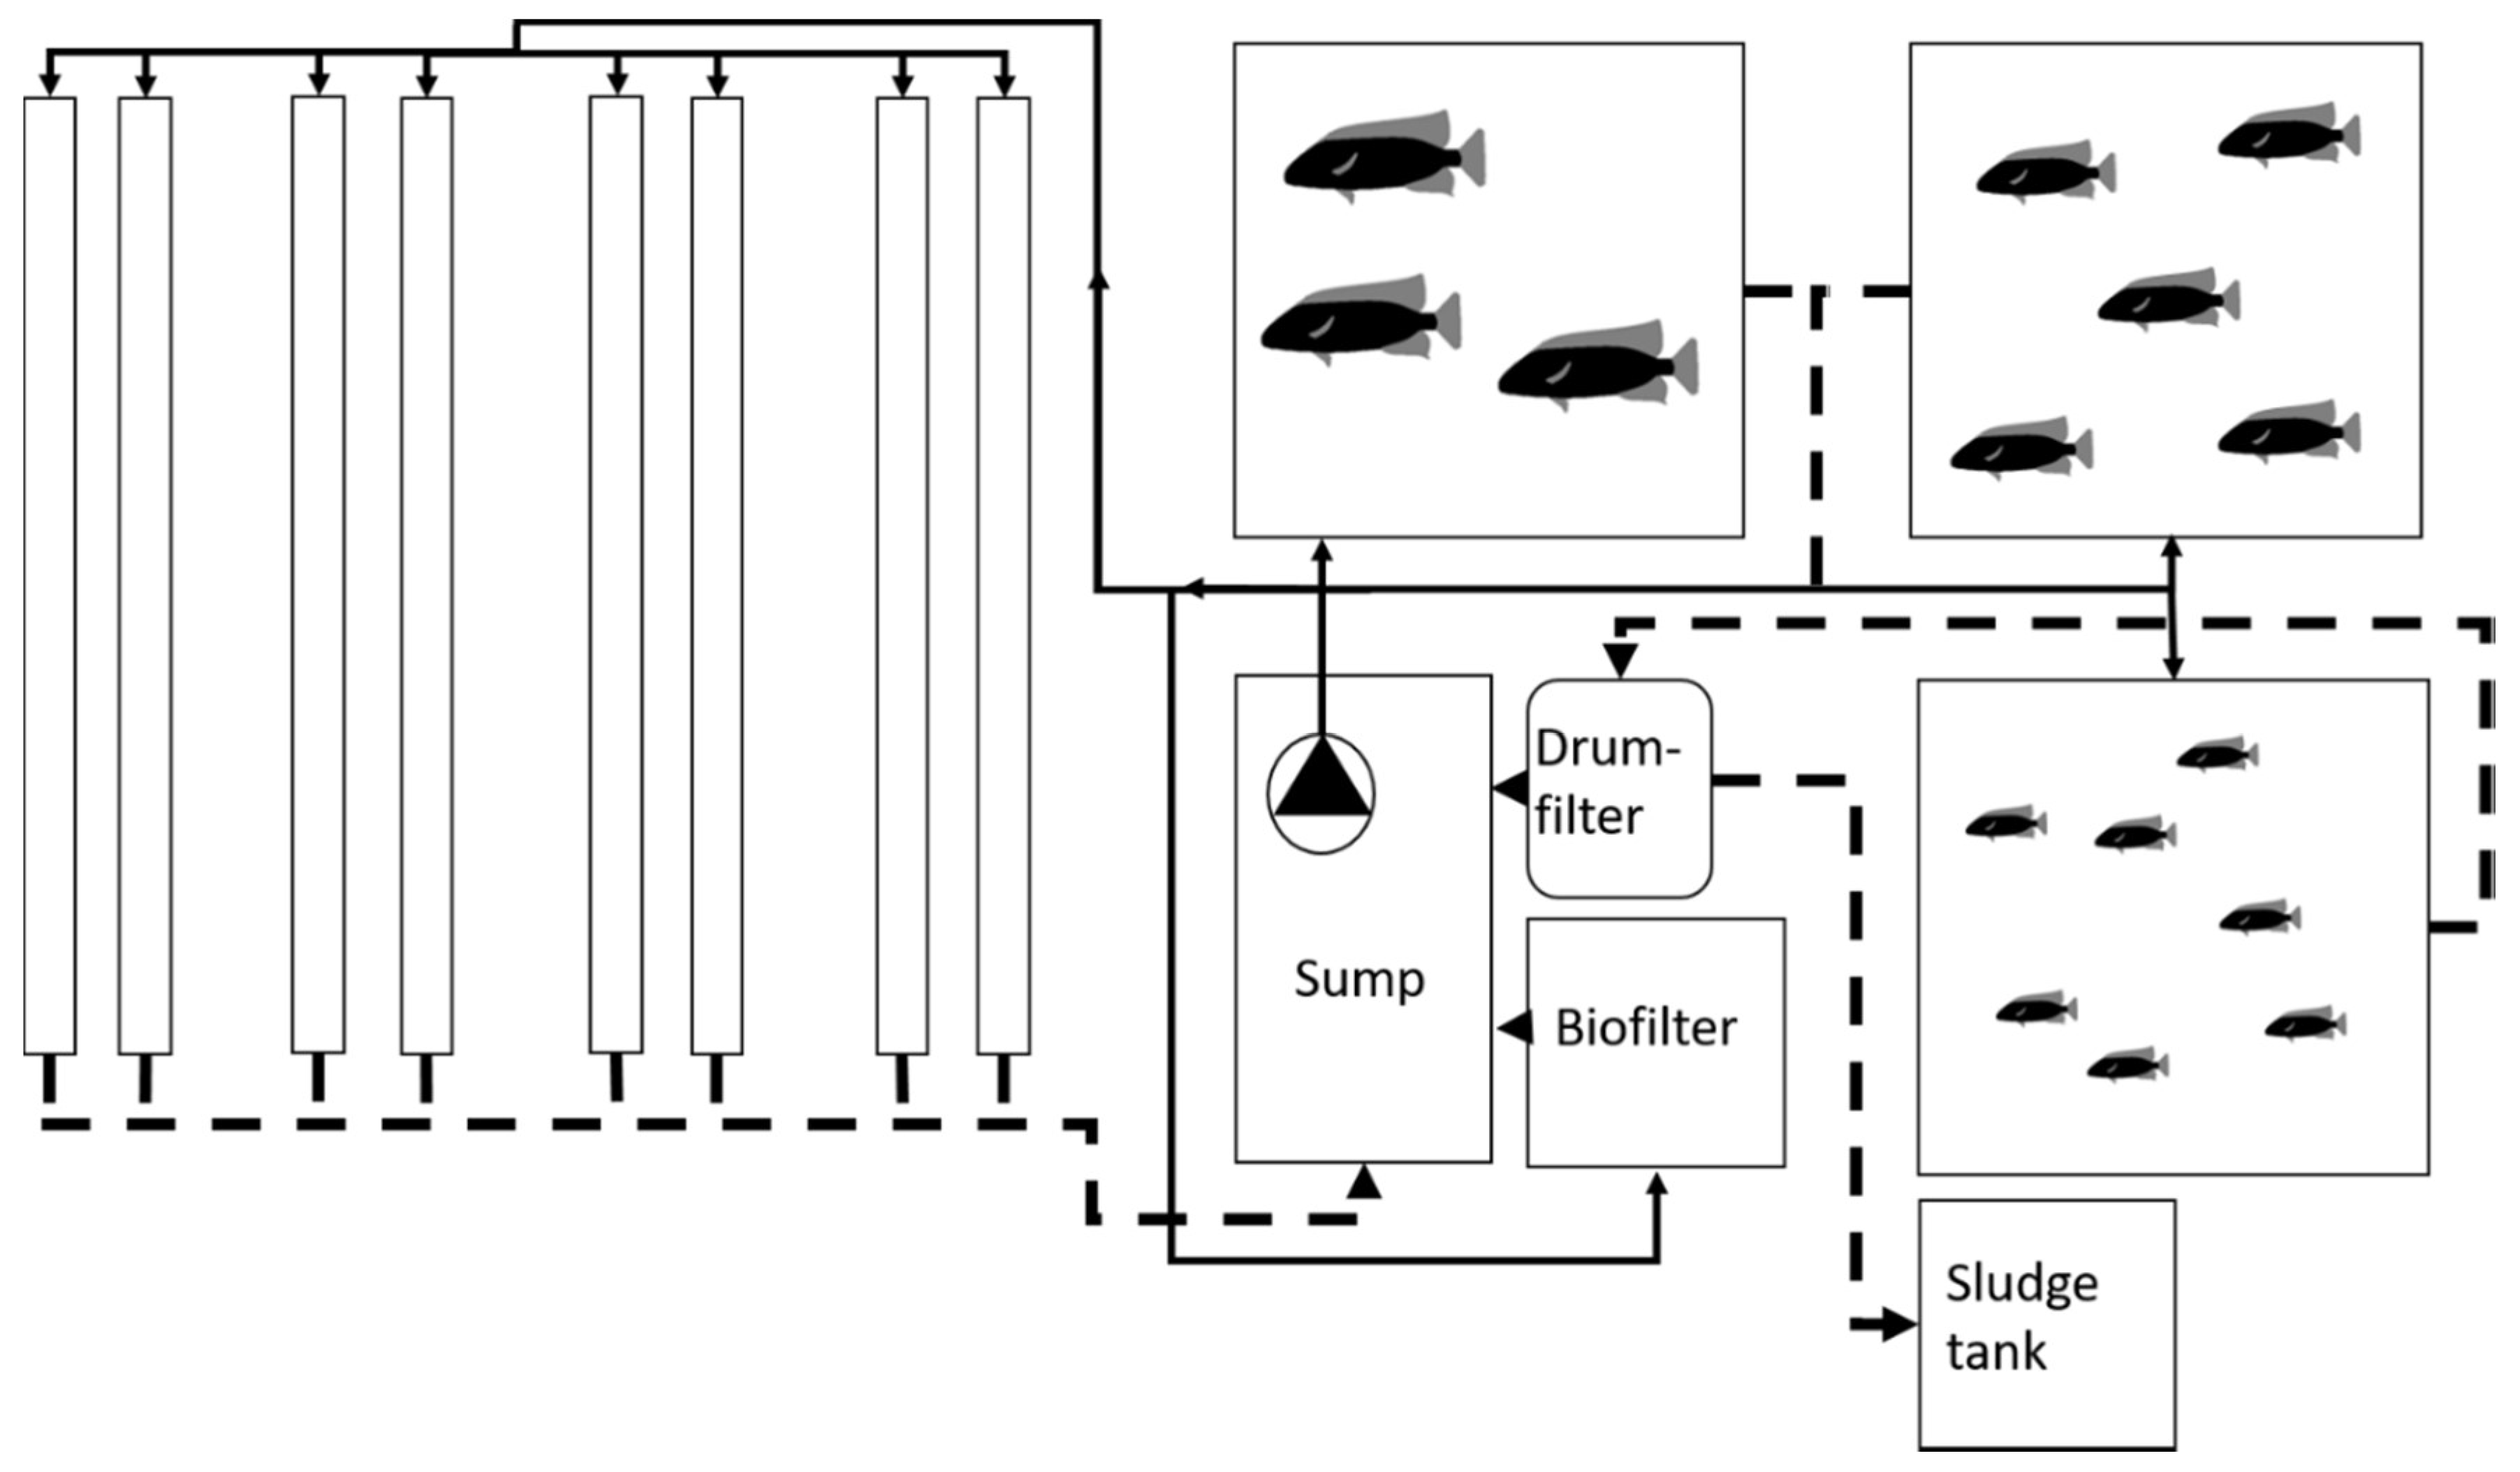
Based on the results from the four systems described above, a pilot commercial production unit was built in a greenhouse farm in South Iceland. Special emphasis was made on developing a filtering system with efficient removal of solids, including a drumfilter. To decrease the pumping of the water and make the cleaning process more efficient the raft was exchanged with an NFT based design. The overall design was partly decoupled, with the production of vegetables in the NFT hydroponics and the use of excess nutrient rich water for irrigation of the pre-existing greenhouse crops grown in soil. The NFT system (Figure 8) had three fish tanks, each of which had a functioning volume of 2 m3. All of the tanks overflowed into the same water pipe leading to the Hydrotech HDF 501 microscreen drumfilter, which separated solids from the water. Solids were gathered in a 0.1 m3 tank, from which they were pumped automatically twice daily. The filtered water went into a sump, from where it was pumped in three directions. One outlet from the pump went to the biofilter, one to the fish and one to the hydroponic unit.
The hydroponic unit consisted of eight 140 mm PPE pipes each. Plants were pre-planted in coco husk and put in net pots with pumice for added hydration. For the first week, the pipes were flooded so the plants could sprout roots outside the pots in order to be able to draw water from the bottom of the pipe.
4. Discussion
4.1. Mechanical Filtration
The tests have proved to be a successful demonstration of the necessity of proper solids removal. Ineffective solids removal is believed to be the main reason for failed aquaponic systems. System 1 that has been running for more than 36 months to date was without problems during the first 18 months, but then the fish started showing symptoms of stress and the plants were not growing well (slow growth and showing signs of poor mineral and water uptake). Instability in water conditions with regards to pH values, including the dropping to below pH 5, was most likely caused by the buildup of solids in the system. The addition of crayfish and red worms did not solve the problem. Stability returned following a thorough cleaning of the substrate media. A settling tank for solids removal was added to the system to keep good water quality and prevent the system from failing.
The strong acidity in aquaponics (pH below 5) is detrimental to all living organisms in the system. While the plants generally prefer a slightly acidic pH (5.5–6.5), as it increases solubility of essential mineral nutrients thus facilitating effective root uptake [35], fungi (decomposing microorganisms) predominate in a more neutral pH (around 7) and bacteria (including the most important group in aquaponics, the nitrifying bacteria) become more prevalent in alkaline (pH 7.5–9) medium [23,24]. Fish prefers a relatively alkaline pH, from 6.5 to 9, depending on fish species [36]. An optimal water pH for tilapia is between 6.8 and 9.6, given there is a good supply of dissolved oxygen, but extreme alkalinity pH (>10) leads to instant mortality [37]. Fish experiencing acid-pH stress, particular young fish, will grow poorly (pH 4 is acid death point) and reproduction will be affected at consistently higher or lower pH levels than the optimum [38]. Therefore, pH management in aquaponics is an exercise in compromise between the two ranges (acidic-alkaline). An ideal target is pH 6.8–7.0.
Mechanical filtration can be based on gravity (sedimentation, swirl separators) or screening (drumfilter, sandfilter, beadfilter), and for finer particles, oxidation (ozone treatment) and foam fractionation can be used [4,39]. The methods based on gravity are only efficient at removing large settleable particles (>100 μm) and require a larger surface area and manual cleaning. They are, however, simple and cheap to construct and can offer a good solution for smaller systems. For larger production systems, screening methods become necessary. Thus, when designing and implementing the pilot aquaponic system in the greenhouse farm the sedimentation tank was exchanged for a drumfilter.
4.2. Biofiltration
The moving bed biofiltration was, in general, working well. However, the elevated TAN levels and the negligible nitrite observed in Systems 4 indicated the need for a larger biomedia surface area. As a high level of nitrification can be achieved at pH as low as 4.3 [40], the pH should not have affected the process. On the contrary, the pH level in System 4 (Trial 1) was most of the time stable at around pH 6, and this pH is known to be the condition that can maximize nitrogen utilization efficiency (NUE) of an aquaponic system, when measured in the form of fish and plant biomass [23]. The nitrification process depends also highly on the temperature [41] and is much more efficient at temperatures above 20 °C. The pilot setup at the greenhouse farm was designed to include a 1 m3 biofiltration tank with 0.5 m3 biomedia (total surface area of 500 m2).
4.3. Vermiculture and Crayfish Production
Redworm (Eisenia fetida) was added to the media bed in System 1 to aid mineralization of the solids accumulating in the media. Although this mechanism is well-known, it was not sufficient to maintain a healthy system in our study, thus a sedimentation tank was necessary as described above. For larger systems, the use of pumice or gravel growbeds in the hydroponic unit is too time-consuming and expensive. Vermiculture or the use of worms should be more effective in a separate system for breaking down of the solid organic waste in fertilizer production. This has been done by the aquaponics startup company Breen in Spain with good results keeping the production at zero-waste [7].
Red-clawed crayfish (Cherax quadricarinatus) were added to the settling tank in System 1 to allow feeding on the sludge. The crayfish had a high survival rate and reproduced during the test. The crayfish could become a valuable added value to the commercial setup and thus were planned to be added to the greenhouse farming system.
4.4. Farming Efficiency
The production cycle of pak-choi from seed to harvest was six weeks and yielded 1–2.5 kg/m2. This yield is within the same range found for lettuce in aquaponics (1.4–6.5 kg/m2) [42,43], but much better than the leaf vegetable amaranth in a recirculating aquaponic system with total biomass (with roots) of 0.8–1.0 kg/m2 [21]. It is, however, not so straightforward to compare biomass yield in terms of kg/m2 as plant density per unit area may be different and when comparing different plant species. Nevertheless, the success of pak-choi in the present study is an example of the success of leafy green vegetables grown in aquaponic systems. The weight ratio was measured up to 4:1 (pak-choi:tilapia) and the rising nitrate and phosphate concentrations indicated that this ratio could be even higher. This is in line with earlier results of 4:1 and 6:1 ratios at Nibio in Norway producing lettuce with trout [44], 8:1 with African catfish and spinach farming [45] and up to 10:1 with tilapia and tomato farming [46].
4.5. Nutrition and Physiology
After harvesting tilapia from the test systems, it became evident that the charr feed might not be suitable. Tilapia mainly collects fat in visceral adipose tissue [47], in fact, the internal organs were all contained in a white mass of fat. The decision was made to switch to cod feed, a lower fat feed (17% fat in cod feed vs 26% in charr feed). This would still be considered a high fat feed for tilapia when 5–7.4% fat is considered being the optimum [47]. Another feed related issue is the accumulation of sodium (Na) in the system as the plants are not taking up the sodium. Common vegetable and herbaceous crops, like those grown in our study, are so-called C3 plant species and these plants do not require sodium as much as C4 plants. Amaranth is an example of a C4 vegetable crop, but it is not yet a common crop in aquaponics. C3 plants fix CO2 first into the C3 sugar 3-phosphoglycerate by the Rubisco enzyme, whereas C4 plants fix carbon first into the C4 sugar oxaloacetate with the help of PEP carboxylase, before delivering the carbon to Rubisco [35]. Sodium ions are vital for this first C4 step of carboxylation [48], and under sodium deficiency the C4 plants exhibit severe chlorosis and necrosis or even fail to flower. The future development will include switching to a feed with minimum sodium content as well as a lower fat content or growing new and marketable C4 crops.
4.6. Flow Rate Through Growbeds
Plant biomass was not affected by flowrate, but faster flowrates promoted more solids accumulation on roots. Even though not measured there were visibly more solids that covered the roots of these plants. The slower flow in the growbeds Pairs B and C had less of the solids built up on the roots. After officially ending System 4 Trial 1, the plants were put back in the system with their protruding roots removed. Within one week the plants in all growbeds showed a minor increase in growth and with healthy root growth, indicating that solids buildup was having a negative effect on them. Slow or low flow rate has also been shown to promote plant growth in aquaponics as the condition allows better uptake of essential nutrients such as P and N by plant roots [45].
Light and temperature were different between the two trials of System 4 and this may have made the largest contribution to alleviating the difference in biomass (shoot growth) between those two trials. The high nitrate and phosphate concentrations within the System 4 suggest the growing capacity of the system has not been exceeded and that such systems still have the capacity to support a larger number of plants or types of plants that require more nitrogen and phosphorus. Therefore, this amount of fish can potentially support a larger biomass yield given the right amount of temperature and light.
4.7. Decoupled Aquaponics
A closed circulating aquaponic system is based on a tradeoff between optimum conditions for farming fish and growing plants. The plants need a lower pH for optimum growth, and optimum temperatures and other environmental parameters differ between the two production units. Plants need higher nutrient concentration, but long exposure to high levels of nitrate can have a negative effect on hemoglobin in the fish [49]. The addition of atmospheric CO2 increases photosynthesis in the plant above ground, consequently increasing nitrogen uptake and plant growth, whereas the fish rearing system design aims to minimize CO2 levels within the system as increased CO2 impairs the growth of the fish [50].
Certain nutrients need to be added to the system, e.g., Fe, Ca, K, Mg, B, and Zn, depending on the crops. Additional sulfur and zinc in fertilizer are required to maintain high quality (e.g., vitamin C) in vegetables such as broccoli and salad greens [51]. Sulfur-demanding crops including Brassica species, such as pak-choi and mustard, are dependent on this element in order to maintain optimal osmotic potential and nitrogen metabolism in plants [52]. The present study shows that additional phosphorus is needed for rucola vegetative growth, and probably manganese and boron as well, as the optimum pH in aquaponics is too high for plant absorption of these elements. Ineffective solid removal increases solids build-up and lowers pH too far, the situation that can lead to Fe, N, P, S, Ca, Mg, B, Cu, and Mo deficiencies [35]. To fully utilizing the nutrient output from the aquaculture, a new version of aquaponics systems for future commercial aquaponics has been developed within two European funded projects, INAPRO, and ECOPONICS, known as “decoupled aquaponics” [7,53]. The wastewater from the fish is used for the plant production, nutrients are added as necessary and the temperature and pH are regulated in each system. The water is not returned to the fish except for possibly condensed evaporation from the greenhouses.
Decoupled systems vary from the traditional aquaponics system in that the aquaculture and hydroponic parts of the system are not joined in a closed loop. Instead, the fish are raised in a traditional RAS manner with optimized conditions for the fish’s growth. Water is exchanged in the system typical of RAS systems but instead of disposing of it, the water is used for irrigation in a traditional hydroponic unit. This decoupling allows for optimization of each individual production part of the system and gives the freedom of selecting fish and plant species that have separate needs [7,53]. The system developed for the greenhouse is partly decoupled as part of the water from the aquaculture system is used for fertilizing the soil.
4.8. Public Perception
The visitors to the systems have been from diverse groups, e.g., young children, high school, and university students, entrepreneurs, researchers, aquaculture and horticulture people, policy advisors and people from government and municipalities. All visitors have shown interest in the ideology of aquaponics providing ideas for adding educational and experience tourism to the aquaponics farm. The consumer acceptance tests carried out show that the general public is positive towards aquaponics and the products. The environmental consciousness is increasing, and people want to know where their food comes from and how it is produced. The test marketing of products shows that there is a market for new species on the Icelandic market, including Asian species such as pak-choi and tilapia. In Iceland, the people are also very positive about utilizing geothermal energy to the full, including for sustainable food production. Aquaponics is thus an attractive, and economically viable, option. A case study of aquaponics in the US indicated that raising fish (tilapia) was a net loss while growing crops was a net gain when comparing market prices to energy (electricity) costs [20]. Geothermal energy may help reducing energy costs in aquaponic farming in Iceland, but this needs further investigation. Long summer daylength is definitely beneficial to growing crops, both fruit vegetables such as tomato and cucumber and vegetable greens such as lettuce, pak-choi, and salads. Operating aquaponics in greenhouse in a geothermal area has been shown to be considerably energy-efficient, as calculated from the tomato/okra-tilapia system in the pilot farm aquaponics, using hot water from the abundant geothermal resources in the vicinity for heating [54].
5. Conclusions
The idea of adding an aquaculture unit into smaller greenhouse farms is believed to be successful in diversifying the business. Not only do the fish and fertilizing water provide an added value, but the circular production system offers new innovative ideas for novel high value products such as crayfish and new services such as educational and experience tourism. However, further research is needed to optimize the combined production unit.
The principal conclusions highlight the importance of an effective filtering system to maintain a healthy system and a production ratio of more than 4 kg of leafy greens per kg of farmed fish. The following recommendations on system design for commercial aquaponic production systems are based on the findings of this research.
(1) Removal of solids is very important to maintain good water quality and prevent the system from collapsing. This can be done by a settling tank or a microscreen drumfilter. For commercial production systems, the drumfilter would be preferred as it can remove finer particulates.
(2) Commercial NFT systems are recommended for the hydroponics. They use less water than DWC, are easy to maintain and clean, and for well controlled large commercial systems they would not be vulnerable to mishaps. For the longevity of the F&D system, the bed has to be cleaned regularly as solids will build up in the media, regardless of filtration methods. For large systems, this would become time consuming and expensive.
(3) An improved fish feed with lower sodium and fat content would be preferable for future development to keep the system healthy and improve the sustainability and efficiency of fish farming.
(4) Sludge should be re-used to obtain a zero-waste system. As examples, crayfish grow well on solid waste from the system and vermiculture or anaerobic digestion can provide fertilizer.
(5) Leafy green vegetables with similar requirements as lettuce and pak-choi should be a good choice for production in a larger scale system. Further research into plant choices with regards to their physiological responses to environmental factors in the aquaponic systems is necessary.
(6) For less compromise between optimal conditions for fish rearing and hydroponic plant production, a decoupled design would be preferred as the plants prefer low pH and high nutrient concentrations for optimal growth, all of which have a negative effect on the fish.
Author Contributions
All authors conceived and designed the experiments; R.I.D. and R.I.T. performed the system designs and experiments; R.I.D. and U.M. performed the chemical analysis and U.M. contributed reagents and analysis methods. K.A.-J. supervised the plant part of the project. All authors wrote the paper.
Funding
This research was funded by The Icelandic Centre for Research grant number 142372 and the European Commission grant number ECO/12/332783. The APC was funded by the University of Iceland.
Acknowledgments
Coworkers at the University of Iceland, the Agricultural University of Iceland, Svinna-verkfraedi Ltd and growers providing assistance and infrastructure are acknowledged.
Conflicts of Interest
The authors declare no conflict of interest.
References
- Love, D.C.; Fry, J.P.; Genello, L.; Hill, E.S.; Frederick, J.A.; Li, X.; Semmens, K. An international survey of aquaponics practitioners. PLoS ONE 2014, 9, e102662. [Google Scholar] [CrossRef] [PubMed]
- Rakocy, J.E. Hydroponic lettuce production in a recirculating fish culture system. Isl. Perspect. 1988, 3, 4–10. [Google Scholar]
- Rakocy, J. The status of Aquaponics, Part 1. Aquac. Mag. 1999, 4, 83–88. [Google Scholar]
- Lekang, O.-I. Aquaculture Engineering; John Wiley & Sons Ltd.: Oxford, UK, 2013. [Google Scholar]
- Rakocy, J.E. Ten Guidelines for Aquaponic Systems. Aquaponics J. 2007, 46, 14–17. [Google Scholar]
- Graber, A.; Junge, R. Aquaponic Systems: Nutrient recycling from fish wastewater by vegetable production. Desalination 2009, 246, 147–156. [Google Scholar] [CrossRef]
- Thorarinsdottir, R.; Kledal, P.R.; Skar, S.L.G.; Sustaeta, F.; Ragnarsdottir, K.V.; Mankasingh, U.; Pantanella, E.; van de Ven, R.; Shultz, C. Aquaponics Guidelines; University of Iceland: Reykjavik, Iceland, 2015. [Google Scholar]
- Randall, D.J.; Tsui, T.K.N. Ammonia toxicity in fish. Mar. Pollut. Bull. 2002, 45, 17–23. [Google Scholar] [CrossRef]
- Jensen, F.B. Nitrite disrupts multiple physiological functions in aquatic animals. Comp. Biochem. Physiol. A Mol. Integr. Physiol. 2003, 135, 9–24. [Google Scholar] [CrossRef]
- Deane, E.E.; Woo, N.Y.S. Impact of nitrite exposure on endocrine, osmoregulatory and cytoprotective functions in the marine teleost Sparus sarba. Aquat. Toxicol. 2007, 82, 85–93. [Google Scholar] [CrossRef]
- Doblander, C.; Lackner, R. Metabolism and detoxification of nitrite by trout hepatocytes. Biochim. Biophys. Acta Gen. Subj. 1996, 1289, 270–274. [Google Scholar] [CrossRef]
- Goddek, S.; Delaide, B.; Mankasingh, U.; Ragnarsdottir, K.V.; Jijakli, H.; Thorarinsdottir, R. Challenges of sustainable and commercial aquaponics. Sustainability 2015, 7, 4199–4224. [Google Scholar] [CrossRef]
- Baroiller, J.F.; D’Cotta, H.; Bezault, E.; Wessels, S.; Hoerstgen-Schwark, G. Tilapia sex determination: Where temperature and genetics meet. Comp. Biochem. Physiol. A Mol. Integr. Physiol. 2009, 153, 30–38. [Google Scholar] [CrossRef]
- FAO. Livestock’s Long Shadow-Environmental Issues and Options; Food and Agriculture Organization of the United Nations: Rome, Italy, 2006; Volume 3, pp. 1–377. [Google Scholar]
- Wilkinson, J.M. Re-defining efficiency of feed use by livestock. Animal 2011, 5, 1014–1022. [Google Scholar] [CrossRef] [PubMed] [Green Version]
- Rakocy, J.; Shultz, R.C.; Bailey, D.S.; Thoman, E.S. Aquaponic production of tilapia and basil: Comparing a batch and staggered cropping system. South Pacific Soil. Cult. Conf. 2003, 648, 63–69. [Google Scholar] [CrossRef]
- Savidov, N.; Hutchings, E.; Rakocy, J.E. Fish and plant production in a recirculating aquaponic system: A new approach to sustainable agriculture in Canada. Acta Hortic. 2007, 742, 209–222. [Google Scholar] [CrossRef]
- Trang, N.; Schierup, H.-H.; Brix, H. Leaf vegetables for use in integrated hydroponics and aquaculture systems: Effects of root flooding on growth, mineral composition and nutrient uptake. African J. Biotechnol. 2010, 9, 4186–4196. [Google Scholar]
- Rakocy, J.E.; Bailey, D.S.; Shultz, R.C.; Thoman, E.S. Update on tilapia and vegetable production in the UVI aquaponic system. New dimensions on farmed Tilapia. In Proceedings of the Sixth International Symposium on Tilapia in Aquaculture, Manila, Philippines, 12–16 September 2004; pp. 676–690. [Google Scholar]
- Love, D.C.; Fry, J.P.; Li, X.; Hill, E.S.; Genello, L.; Semmens, K.; Thompson, R.E. Commercial aquaponics production and profitability: Findings from an international survey. Aquaculture 2015, 435, 67–74. [Google Scholar] [CrossRef] [Green Version]
- Medina, M.; Jayachandran, K.; Bhat, M.G.; Deoraj, A. Assessing plant growth, water quality and economic effects from application of a plant-based aquafeed in a recirculating aquaponic system. Aquac. Int. 2016, 24, 415–427. [Google Scholar] [CrossRef]
- Hu, Z.; Lee, J.W.; Chandran, K.; Kim, S.; Brotto, A.C.; Khanal, S.K. Effect of plant species on nitrogen recovery in aquaponics. Bioresour. Technol. 2015, 188, 92–98. [Google Scholar] [CrossRef]
- Zou, Y.; Hu, Z.; Zhang, J.; Xie, H.; Guimbaud, C.; Fang, Y. Effects of pH on nitrogen transformations in media-based aquaponics. Bioresour. Technol. 2016, 210, 81–87. [Google Scholar] [CrossRef]
- Tyson, R.V.; Simonne, E.H.; Treadwell, D.D.; White, J.M.; Simonne, A. Reconciling pH for ammonia biofiltration and cucumber yield in a recirculating aquaponic system with perlite biofilters. HortScience 2008, 43, 719–724. [Google Scholar] [CrossRef]
- Liang, J.-Y.; Chien, Y.-H. Effects of feeding frequency and photoperiod on water quality and crop production in a tilapia–water spinach raft aquaponics system. Int. Biodeterior. Biodegrad. 2013, 85, 693–700. [Google Scholar] [CrossRef]
- Lam, S.S.; Ma, N.L.; Jusoh, A.; Ambak, M.A. Biological nutrient removal by recirculating aquaponic system: Optimization of the dimension ratio between the hydroponic & rearing tank components. Int. Biodeterior. Biodegrad. 2015, 102, 107–115. [Google Scholar]
- Castillo-Castellanos, D.; Zavala-Leal, I.; Ruiz-Velazco, J.M.J.; Radilla-García, A.; Nieto-Navarro, J.T.; Romero-Bañuelos, C.A.; González-Hernández, J. Implementation of an experimental nutrient film technique-type aquaponic system. Aquac. Int. 2016, 24, 637–646. [Google Scholar] [CrossRef]
- Sage, R.F.; Coleman, J.F. Effects of low atmospheric CO2 on plants: More than a thing of the past. Trends Plant Sci. 2001, 6, 18–24. [Google Scholar] [CrossRef]
- Liu, C.; Wang, Y.; Pan, K.; Zhu, T.; Li, W.; Zhang, L. Carbon and nitrogen metabolism in leaves and roots of dward bambbo (Fargesia denudata Yi) subjected to drought fro two consectutive years during sprouting period. J. Plant Growth Regul. 2014, 33, 243–255. [Google Scholar] [CrossRef]
- APHA/AWWA. Standard Methods for the Examination of Water and Wastewater, 18th ed.; American Public Health Association; American Water Works Association; Water Environment Federation: Washington, DC, USA, 1992. [Google Scholar]
- Shand, C.A.; Williams, B.L.; Coutts, G. Determination of N-species in soil extracts using microplate techniques. Talanta 2008, 74, 648–654. [Google Scholar] [CrossRef] [PubMed]
- Koroleff, F. Determination of ammonia. In Methods of Seawater Analysis; Grasshoff, K., Ed.; Verlag Chemie: Weinheim, Germany, 1976; pp. 126–133. [Google Scholar]
- Murphy, J.; Riley, J.P. A modified single solution method for the determination of phosphate in natural waters. Anal. Chim. Acta 1962, 27, 31–36. [Google Scholar] [CrossRef]
- Bradley, L.; Hosier, S. Guide to Symptoms of Plant Nutrient Deficiencies; AZ1106; University of Arizona Cooperative Extension: Phoenix, AZ, USA, 1999; pp. 1–3. [Google Scholar]
- Taiz, L.; Zeiger, E. Plant Physiology, 5th ed.; Sinauer Associates, Inc.: Sunderland, MA, USA, 2010; ISBN 978-0-87893-866-7. [Google Scholar]
- Goddek, S.; Espinal, C.A.; Delaide, B.; Jijakli, M.H.; Schmautz, Z.; Wuertz, S.; Keesman, K. Navigating towards decoupled aquaponics systems: A system dynamics design approach. Water 2016, 8, 303. [Google Scholar] [CrossRef]
- Mukherje, S.; Golder, D.; Rana, S.; Jana, B.B. Responses of succinate dehydrogenase and non-specific alkaline phosphatases and mortality of tilapia to ambient pH stress in a sewage-fed aquaculture pond. IJEB 2007, 45, 630–637. [Google Scholar]
- Han, D.-Y.; Zheng, Q.-M.; Sun, Z.-T. Gene expression and activities of antioxidant enzymes in liver of hybrid tilapia, Oreochromis niloticus x orechromis aureus, under acute pH stress. JWAS 2016, 47, 260–267. [Google Scholar]
- Ebeling, J.M.; Timmons, M.B. Recirculating Aquaculture, 2nd ed.; Cayuga Aqua Ventures: Ithaca, NY, USA, 2010. [Google Scholar]
- Tarre, S.; Green, M. High-rate nitrification at low pH in suspended- and attached-biomass reactors. Appl. Environ. Microbiol. 2004, 70, 6481–6487. [Google Scholar] [CrossRef] [PubMed]
- Suhr, K.I.; Pedersen, P.B. Nitrification in moving bed and fixed bed biofilters treating effluent water from a large commercial outdoor rainbow trout RAS. Aquac. Eng. 2010, 42, 31–37. [Google Scholar] [CrossRef]
- Rakocy, J.E.; Bailey, D.S.; Shultz, K.A.; Cole, W.M. Evaluation of a Commercial-Scale Aquaponic Unit for the Production of Tilapia and Lettuce. Fourth Int. Symp. Tilapia Aquac. 1997, 1, 357–372. [Google Scholar]
- Seawright, D.E.; Stickney, R.R.; Walker, R.B. Nutrient dynamics in integrated aquaculture-hydroponics systems. Aquaculture 1998, 160, 215–237. [Google Scholar] [CrossRef]
- Gangenes Skar, S.L.; (Nibio, Grimstad, Norway). Personal Communication, 2016.
- Endut, A.; Jusoh, A.; Ali, N.; Wan Nik, W.B.; Hassan, A. A study on the optimal hydraulic loading rate and plant rations in recirculation aquaponics system. Bioresour. Technol. 2010, 101, 1511–1517. [Google Scholar] [CrossRef] [PubMed]
- Graber, A.; (Urban Farming, The Hague, The Netherlands). Personal Communication, 2016.
- He, A.; Ning, L.; Chen, L.; Chen, Y.; Xing, Q.; Li, J.; Qiao, F.; Li, D.; Zhang, M.; Du, Z. Systemic adaptation of lipid metabolism in response to low- and high-fat diet in Nile tilapia (Oreochromis niloticus). Physiol. Rep. 2015, 3, e12485. [Google Scholar] [CrossRef] [PubMed]
- Brownell, P.F.; Bielig, L.M. The role of sodium in the conversion of pyruvate to phosphoenolpyruvate in mesophyll chloroplasts of C4 plants. Aust. J. Plant Physiol. 1996, 23, 171–177. [Google Scholar]
- Jensen, F.B. Uptake, elimination and effects of nitrite and nitrate in freshwater crayfish (Astacus astacus). Aquat. Toxicol. 1996, 34, 95–104. [Google Scholar] [CrossRef]
- Stiller, K.T.; Vanselow, K.H.; Moran, D.; Bojens, G.; Voigt, W.; Meyer, S.; Schulz, C. The effect of carbon dioxide on growth and metabolism in juvenile turbot Scophthalmus maximus L. Aquaculture 2015, 444, 143–150. [Google Scholar] [CrossRef]
- Slosar, M.; Uher, A.; Andrejiova, A.; Jurikova, T. Selected yield and qualitative parameters of broccoli in dependence on nitrogen, sulfur, and zinc fertilization. Turk. J. Agric. For. 2016, 40, 465–473. [Google Scholar]
- Sorin, E.; Etienne, P.; Maillard, A.; Zamarreno, A.-M.; Garcia-Mina, J.-M.; Arkoun, M.; Jamois, F.; Cruz, F.; Yvin, J.-C.; Ourry, A. Effect of sulphur deprivation on osmotic potential components and nitrogen metabolism in oilseed rape leaves: Identification of a new early indicator. J. Exp. Bot. 2015, 66, 6175–6189. [Google Scholar] [CrossRef] [PubMed]
- Kloas, W.; Groß, R.; Baganz, D.; Graupner, J.; Monsees, H.; Schmidt, U.; Staaks, G.; Suhl, J.; Tschirner, M.; Wittstock, B.; et al. A new concept for aquaponic systems to improve sustainability, increase productivity, and reduce environmental impacts. Aquac. Environ. Interact. 2015, 7, 179–192. [Google Scholar] [CrossRef]
- Atlason, R.; Danner, R.I.; Unnthorsson, R.; Oddsson, G.V.; Sustaeta, F.; Thorarinsdottir, R.I. Energy return on investment for aquaponics: Case studies from Iceland and Spain. In BioPhysical Economics and Resource Quality; Springer: Basel, Switzerland, 2017; Volume 2, pp. 1–12. [Google Scholar] [CrossRef]
Figure 1.
A schematic representation of an aquaponic system. The arrows indicate the water flow through the system.
Figure 1.
A schematic representation of an aquaponic system. The arrows indicate the water flow through the system.

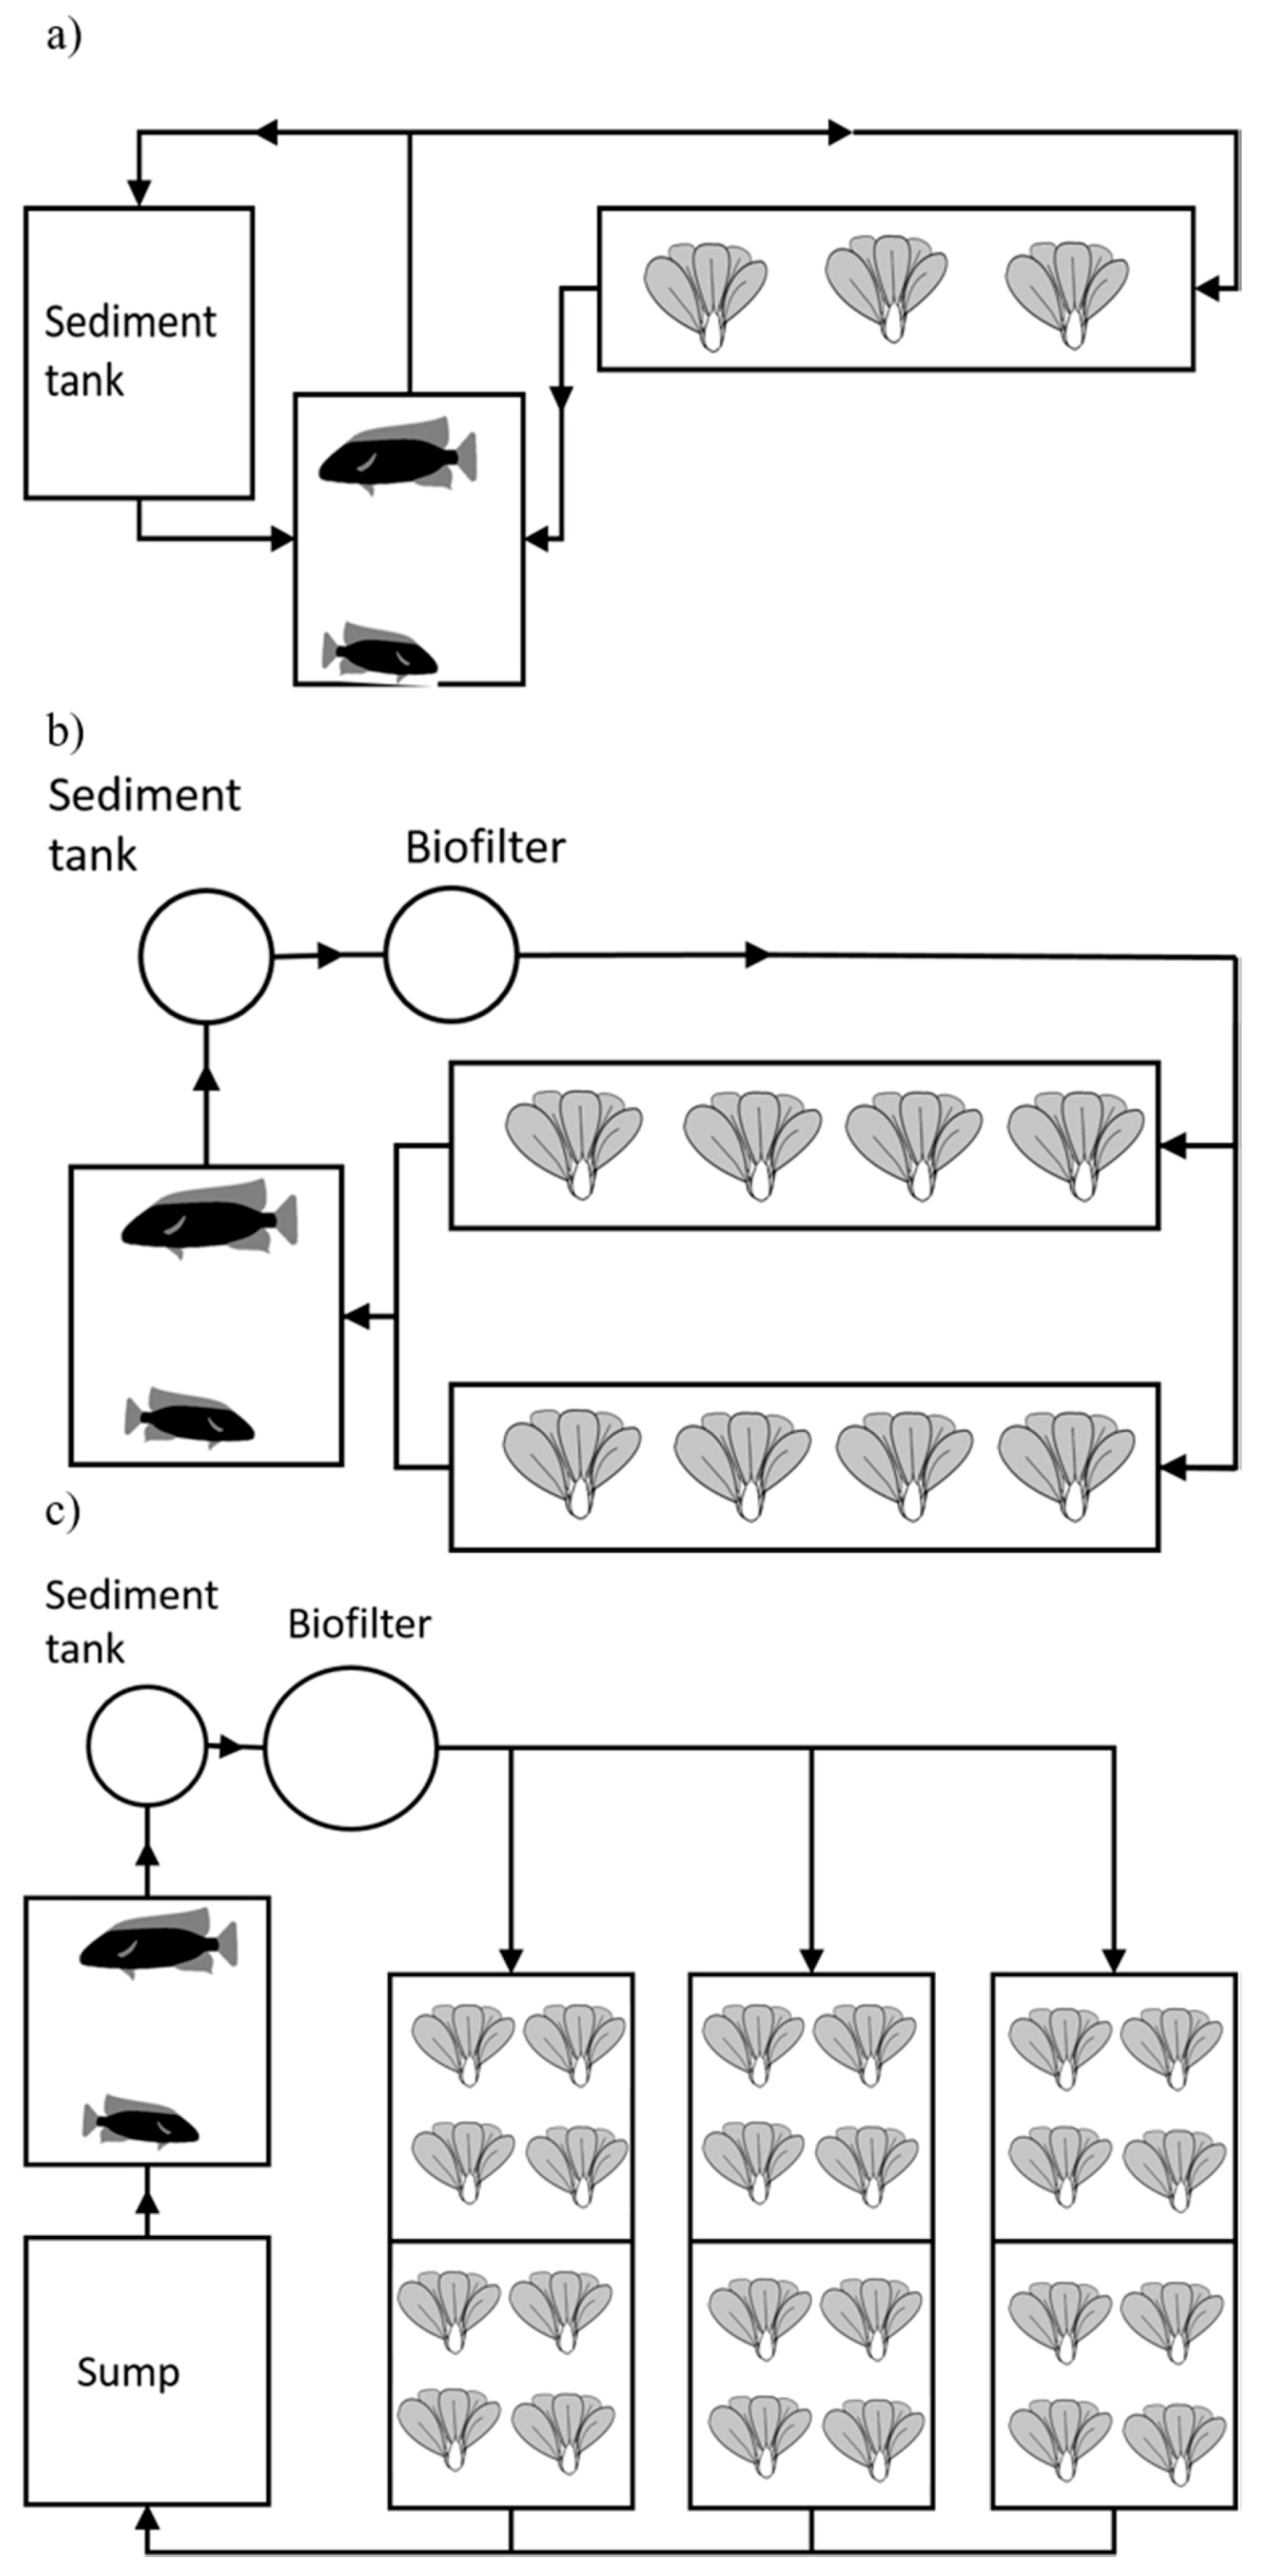
Figure 2.
Schematic representation of Systems 1–3: (a) System 1, an F&D system with the mechanical filter and biofilter included in the pumice bed, (b,c) Systems 2 and 3 respectively, both DWC. System 3 had a larger volume for biofiltration and a sump for improved water quality and regulation of the water flow. Tilapia and pak-choi were cultured in this system.

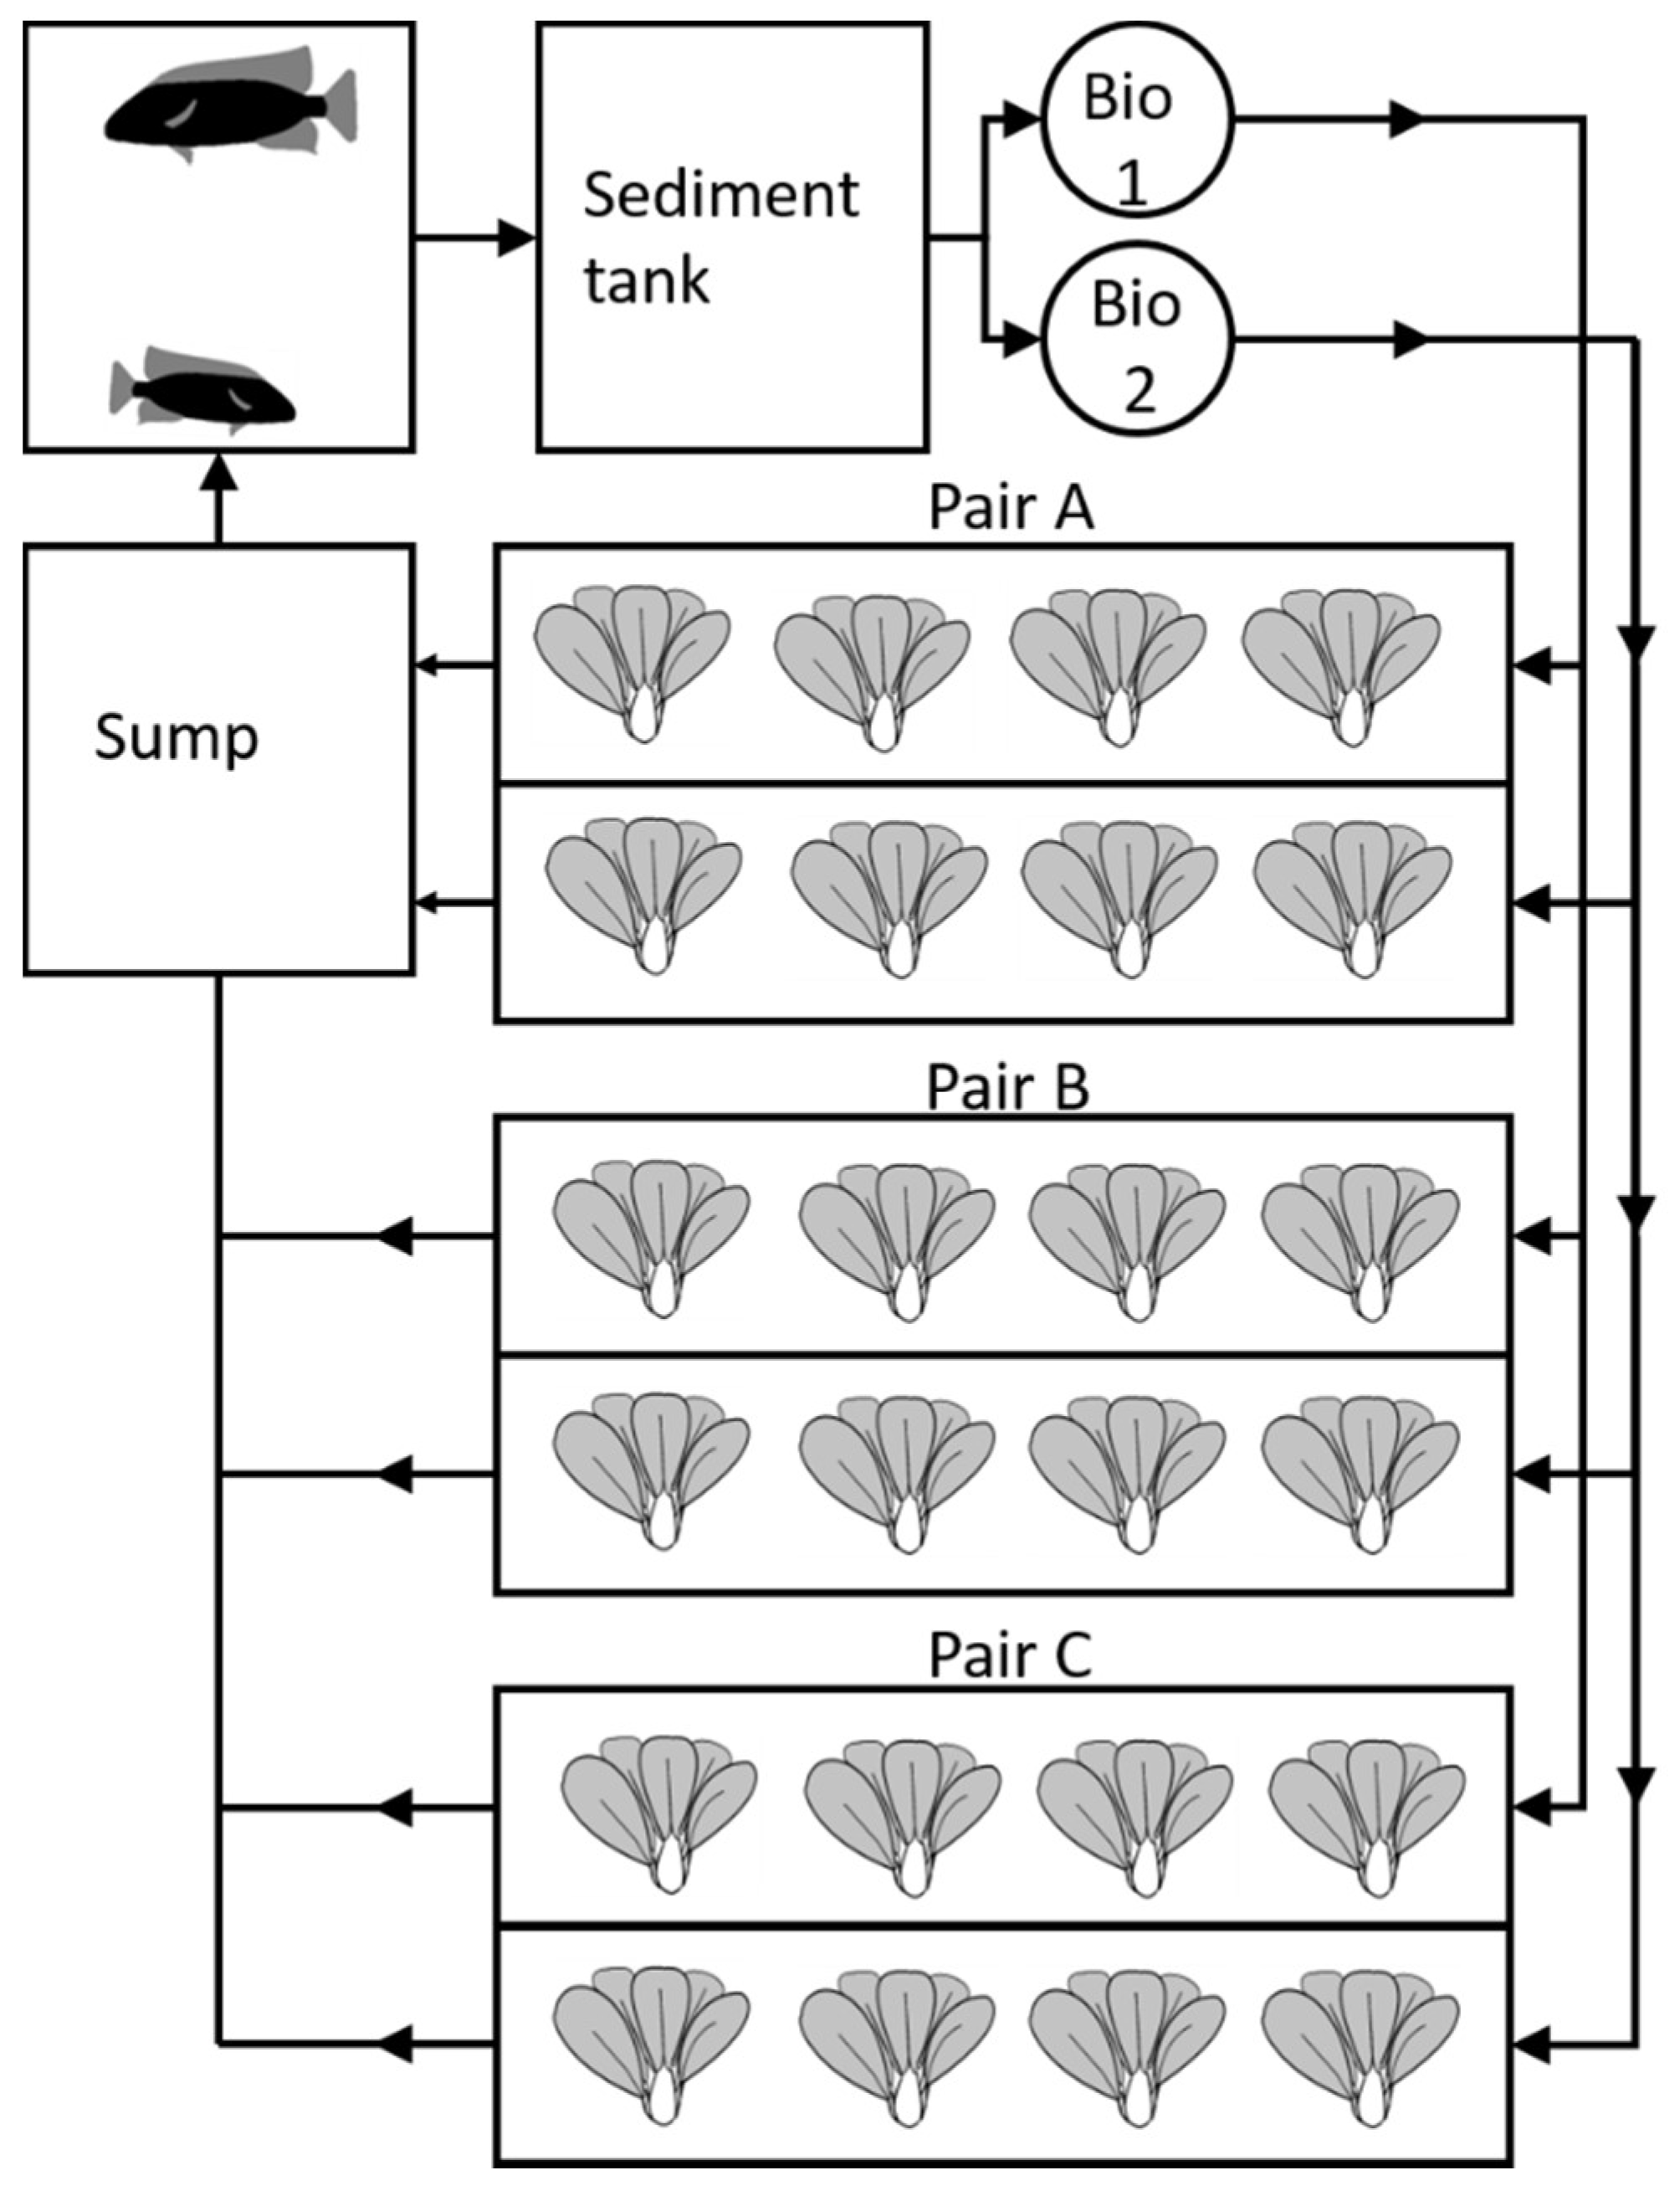
Figure 3.
Schematic representation of System 4 used for testing different water flow rates through the plant beds. Flow rates through growbeds in Pairs A, B and C were 500, 160 and 40 L/h, respectively. Tilapia and pak-choi were cultured in this system.
Figure 3.
Schematic representation of System 4 used for testing different water flow rates through the plant beds. Flow rates through growbeds in Pairs A, B and C were 500, 160 and 40 L/h, respectively. Tilapia and pak-choi were cultured in this system.

Figure 4.
Biofilter stabilization in Systems 2 and 3: (a,b) show the measured conductivity (EC) and pH whereas (c,d) show the N-species dynamics in the system. All N-species are reported as N (TAN, NH4-N, nitrite, NO2-N, and nitrate, NO3-N). As ions accumulate in the system the EC rises whereas the pH drops because of the acidifying effects of nitrification. TAN rises at first, and as nitrifying bacteria establish, they eliminate TAN (NH4-N), the same happens with nitrite (NO2-N) as more bacteria populate the system. A fully mature system can be seen in Week 7 as TAN and nitrite are no longer detectable.

Figure 5.
Nutrient water quality and dynamics in System 4 Trials 1 and 2 were monitored over a 6-week period and the mean concentrations for all parameters measured in the growbeds pairs are presented. The pH, EC, and TDS are shown for (a) Trial 1 and (b) Trial 2. The N-species and phosphate (PO4-P) dynamics are shown for the growbeds at three different flowrates: (c) Trial 1-Growbed Pair A, 500 L/h, (d) Trial 2-Growbed Pair A, 500 L/h, (e) Trial 1-Growbed Pair B, 160 L/h and (f) Trial 2-Growbed Pair B, 160 L/h, (g) Trial 1-Growbed Pair C, 40 L/h and (h) Trial 2-Growbed Pair C, 40 L/h.

Figure 6.
Pak-choi yield (biomass, fresh weight of whole plants without roots) from System 4. The test run included the initial stages of the system where nutrients were still accumulating, and the bacteria were still settling in the system. Trial 1 was during the summertime when the ambient light was present for 22 h/day. Trial 2 was during the winter with ambient light only present for 4 h/day and low indoor temperature.

Figure 7.
Growbeds in System 4 Trial 1 on the day of pak-choi harvest.

Figure 8.
The design of a small-scale commercial production system in the greenhouse farm. The design is based on using only one pump to run the whole system. The arrows indicate water flow through the system, the solid lines indicate pipes from the pump while the dashed lines indicate return pipes. The water runs from the sump to both the plants and the fish tanks.


Table 1.
Crops that have been grown in aquaponics systems.
| Scientific Name | Plant Name | Reference | Crop |
|---|---|---|---|
| Abelmoschus esculentus | Okra | [19] | Fruit vegetable |
| Allium schoenoprasum | Chives | [17,20] | Herb |
| Amaranthus tricolor | Red amaranth | [21] | Leaf vegetable |
| Brassica rapa var. chinensis | Pak-choi | [18,22,23] | Leaf vegetable |
| Brassica rapa var. parachinensis | Choy sum | [18] | Leaf vegetable |
| Capsicum annuum | Sweet pepper | [20] | Fruit vegetable |
| Cucumis sativus | Cucumber | [6,17,24] | Fruit vegetable |
| Ipomoea aquatica | Water spinach | [17,25,26] | Leaf vegetable |
| Lactuca sativa | Lettuce | [17,18,27] | Leaf vegetable |
| Nasturtium officinale | Watercress | [17] | Leaf vegetable |
| Ocimum basilicum | Basil | [16,17,20] | Herb |
| Petroselinum crispum | Parsley | [17] | Herb |
| Solanum lycopersicum | Tomato | [6] | Fruit vegetable |
| Solanum melongena | Eggplant | [6,17] | Fruit vegetable |
| Spinacia oleracea | Spinach | [17] | Leaf vegetable |
Table 2.
Description of the design and implementation conditions of Systems 1–4.
| System | Phase | Period | System Type | System Volume (m3) | Area of Hydroponic Beds (m2) | Housing | Artificial Lighting | Sunlight/Ambient Light | Crops | Initial Fish Weight | Feed Added, in % of Fish Weight |
|---|---|---|---|---|---|---|---|---|---|---|---|
| System 1 | Year-round | F&D | 1.2 | 1.2 | Office Building | 12 h | 4–22 h | Basil, watercress, pak-choi, komatsuna (Brassica rapa var. perviridis), okra, tomato, pepper | 3 g | 1% daily | |
| System 2 | Summer | DWC | 1.4 | 2.4 | Greenhouse | No | 18–22 h | Basil, coriander (Coriandrum sativum), mint (Mentha sp.), rucola (Eruca sativa) | 25–100 g/2.4 kg * | 1% daily | |
| System 3 | Summer | DWC | 4.9 | 6 | Greenhouse | No | 18–22 h | Basil, coriander, mint, rucola | 25–100 g/7 kg * | 1% daily | |
| System 4 | Test | Winter | DWC | 4.5 | 7.2 | Industrial building | 12 h | 8–12 h | Pak-choi | 200–400 g/15 kg * | 1% daily |
| System 4 | Trial 1 | Summer | DWC | 4.5 | 7.2 | Industrial building | 12 h | 18–22 h | Pak-choi | 300–560 g/15 kg * | 1% daily |
| System 4 | Trial 2 | Winter | DWC | 4.5 | 7.2 | Industrial building | 12 h | 4–6 h | Pak-choi | 350–600 g/15 kg * | 1% daily |
* Total fish biomass at the start of the experiment. * F&D (flood and drain) systems are based on a large tray positioned over a reservoir. The water is pumped to the tray to fill the system until it reaches the height of an overflow tube and then it drains back to the reservoir. * DWC (deep water culture) is a raft system where floating rafts are used to suspend plant roots into a pool of nutrient rich water.
Table 3.
Statistical analysis (ANOVA) of the plant yield between System 4 growbeds (Trial 1 and Trial 2), which were subjected to different flow rates (500, 160 and 40 L/h).
Table 3.
Statistical analysis (ANOVA) of the plant yield between System 4 growbeds (Trial 1 and Trial 2), which were subjected to different flow rates (500, 160 and 40 L/h).
| System 4, Trial 1 | System 4, Trial 2 | ||||||||
|---|---|---|---|---|---|---|---|---|---|
| Df | F | Pr(>F) | Significance | Df | F | Pr(>F) | Significanc 1 | ||
| Between | 2 | 4.77 | 0.12 | NS | Between | 2 | 0.066 | 0.94 | NS |
| Within | 3 | Within | 3 | ||||||
1 NS = not significant.
Table 4.
Statistical analysis (ANOVA) of nutrients in the System 4 growbeds (Trial 1 and Trial 2), which were subjected to different flow rates (500, 160, and 40 L/h).
Table 4.
Statistical analysis (ANOVA) of nutrients in the System 4 growbeds (Trial 1 and Trial 2), which were subjected to different flow rates (500, 160, and 40 L/h).
| TAN (mg/L) | NO2-N (mg/L) | ||||||
| Df | F | Pr (>F) | Significance | F | Pr(>F) | Significance | |
| Trial | 1 | 3.73 | 0.63 | NS | 0.14 | 0.71 | NS |
| Trial:Week | 1 | 1.45 | 0.24 | NS | 1.33 | 0.26 | NS |
| Trial:Week:Flow | 2 | 0.09 | 0.91 | NS | 0.41 | 0.67 | NS |
| Residuals | 32 | ||||||
| NO3-N (mg/L) | PO4-P (mg/L) | ||||||
| Df | F | Pr (>F) | Significance | F | Pr(>F) | Significance | |
| Trial | 1 | 2.29 | 0.14 | NS | 1.94 | 0.174 | NS |
| Trial:Week | 1 | 0.16 | 0.69 | NS | 2.672 | 0.112 | NS |
| Trial:Week:Flow | 2 | 0.01 | 0.99 | NS | 1.172 | 0.323 | NS |
| Residuals | 32 | ||||||
Table 5.
Total dissolved macro- and micronutrients (mg/L) in water samples from selected sampling points in System 4 Trial 2 over a 6-week period1. All samples were filtered (0.45 µm, cellulose acetate) immediately after collection.
Table 5.
Total dissolved macro- and micronutrients (mg/L) in water samples from selected sampling points in System 4 Trial 2 over a 6-week period1. All samples were filtered (0.45 µm, cellulose acetate) immediately after collection.
| Week | Sampling Point | P | K | Ca | Mg | Na | Fe | Si | Mo | B |
|---|---|---|---|---|---|---|---|---|---|---|
| 1 | Fish Tank | 9.64 | 4.71 | 22.80 | 5.27 | 36.08 | 0.049 | 0.297 | <0.002 | 0.041 |
| 1 | Bio 1 | 9.58 | 4.63 | 22.96 | 5.18 | 36.29 | 0.051 | 0.348 | <0.002 | 0.029 |
| 1 | Sump | 9.39 | 4.55 | 22.34 | 5.11 | 34.90 | 0.047 | 0.291 | <0.002 | 0.028 |
| 2 | Fish Tank | 10.99 | 5.85 | 23.73 | 5.50 | 36.86 | 0.047 | 0.304 | <0.002 | 0.028 |
| 2 | Bio 1 | 11.17 | 5.99 | 24.18 | 5.65 | 37.88 | 0.046 | 0.338 | <0.002 | 0.029 |
| 2 | Sump | 10.97 | 5.80 | 23.86 | 5.51 | 36.97 | 0.051 | 0.326 | <0.002 | 0.041 |
| 3 | Fish Tank | 9.69 | 5.20 | 21.19 | 4.64 | 29.08 | 0.039 | 0.355 | <0.002 | 0.024 |
| 3 | Bio 1 | 12.24 | 6.83 | 24.25 | 5.75 | 37.44 | 0.046 | 0.371 | <0.002 | 0.029 |
| 3 | Sump | 12.49 | 6.99 | 24.41 | 5.86 | 38.38 | 0.047 | 0.345 | <0.002 | 0.029 |
| 6 | Fish Tank | 10.81 | 5.34 | 21.26 | 4.59 | 28.37 | 0.339 | 0.291 | <0.002 | 0.021 |
| 6 | Bio 1 | 12.15 | 6.25 | 22.74 | 5.24 | 33.25 | 0.373 | 0.343 | <0.002 | 0.036 |
| 6 | Sump | 9.09 | 4.41 | 19.23 | 3.87 | 24.05 | 0.283 | 0.356 | <0.002 | 0.018 |
Limit of detection (LOD): P (0.003 mg/L), K (0.01 mg/L), Ca (0.001 mg/L), Mg (0.00004 mg/L), Na (0.001 mg/L), Fe (0.0002 mg/L), Si (0.13 mg/L), Mo (0.002 mg/L), and B (0.002 mg/L).
Table 6.
Harvest results from the systems. Plants grown in Systems 2 and 3 were mixed herbs and leafy greens, whereas in System 4 pak-choi was grown as a single crop (see Table 2).
Table 6.
Harvest results from the systems. Plants grown in Systems 2 and 3 were mixed herbs and leafy greens, whereas in System 4 pak-choi was grown as a single crop (see Table 2).
| System/Phase | Feed (kg) | Fish Biomass Increase (kg) | Feed Conversion Ratio | Plant Yield (kg) | Plant to Feed Conversion Ratio | Plant to Fish Ratio |
|---|---|---|---|---|---|---|
| System 2 | 2.9 | 3.2 | 0.9 | 3.8 | 1.3 | 1.2 |
| System 3 | 4.0 | 3.8 | 1.1 | 3.6 | 0.8 | 1.0 |
| System 4/Test | 10.6 | 9.2 | 1.2 | 4.8 | 0.5 | 0.5 |
| System 4/Trial 1 | 6.0 | 4.4 | 1.4 | 17.7 | 3.0 | 4.0 |
© 2019 by the authors. Licensee MDPI, Basel, Switzerland. This article is an open access article distributed under the terms and conditions of the Creative Commons Attribution (CC BY) license (http://creativecommons.org/licenses/by/4.0/).
Share and Cite
MDPI and ACS Style
Danner, R.I.; Mankasingh, U.; Anamthawat-Jonsson, K.; Thorarinsdottir, R.I. Designing Aquaponic Production Systems towards Integration into Greenhouse Farming. Water 2019, 11, 2123. https://doi.org/10.3390/w11102123
AMA Style
Danner RI, Mankasingh U, Anamthawat-Jonsson K, Thorarinsdottir RI. Designing Aquaponic Production Systems towards Integration into Greenhouse Farming. Water. 2019; 11(10):2123. https://doi.org/10.3390/w11102123
Chicago/Turabian StyleDanner, Ragnar Ingi, Utra Mankasingh, Kesara Anamthawat-Jonsson, and Ragnheidur Inga Thorarinsdottir. 2019. "Designing Aquaponic Production Systems towards Integration into Greenhouse Farming" Water 11, no. 10: 2123. https://doi.org/10.3390/w11102123
Note that from the first issue of 2016, this journal uses article numbers instead of page numbers. See further details here.