Investigation into Groundwater Resources in Southern Part of the Red River’s Delta Plain, Vietnam by the Use of Isotopic Techniques


1
Department of Hydrogeology, Hanoi University of Mining and Geology, Duc Thang Ward, North Tu Liem District, 1000 Hanoi, Vietnam
2
National Center for Water Resources Planning and Investigation, Sai Dong Ward, Long Bien District, 1000 Hanoi, Vietnam
3
Institute for Nuclear Science and Technology, Nghia Do Ward, Cau Giay District, 1000 Hanoi, Vietnam
*
Author to whom correspondence should be addressed.
Water 2019, 11(10), 2120; https://doi.org/10.3390/w11102120
Submission received: 10 August 2019
/
Revised: 7 October 2019
/
Accepted: 8 October 2019
/
Published: 12 October 2019
(This article belongs to the Special Issue Use of Water Stable Isotopes in Hydrological Process)
Abstract
:Groundwater in the Red River’s delta plain, North Vietnam, was found in Holocene, Pleistocene, Neogene and Triassic aquifers in fresh, brackish and saline types with a total dissolved solids (TDS) content ranging from less than 1 g L−1 to higher than 3 g L−1. Saline water exists inHolocene aquifer, but fresh and brackish water exist in Pleistocene, Neogene and Triassic aquifers. This study aims at the investigation into genesis and processes controlling quality of water resources in the region. For this isotopic, combined with geochemical techniques were applied. The techniques include: (i) measurement of water’s isotopic compositions (δ2H, δ18O) in water; (ii) determination of water’s age by the 3H- and 14C-dating method, and (iii) chemical analyses for main cations and anions in water. Results obtained revealed that saline water in Holocene aquifer was affected by seawater intrusion, fresh water in deeper aquifers originated from meteoric water but with old ages, up to 10,000–14,000 yr. The recharge area of fresh water is from the northwest highland at an altitude of 140–160m above sea level. The recharge water flows northwesterly towards southeasterly to the seacoast at a rate of 2.5m y−1. Chemistry of water resources in the study region is controlled by ferric, sulfate and nitrate reduction with organic matters as well as dissolution of inorganic carbonate minerals present in the sediment deposits. Results of isotopic signatures in water from Neogene, Triassic and Pleistocene aquifers suggested the three aquifers are connected to each other due to the existence of faults and fissures in Mesozoic basement across the delta region in combination with high rate of groundwater mining. Moreover, the high rate of freshwater abstraction from Pleistocene aquifer currently causes sea water to flow backwards to production well field located in the center of the region.
1. Introduction
The Red River Delta plain (RRDP), covering an area of approximately 15,000 km2 is situated across the northern part of Vietnam and is one of the two most productive deltas in the country. In RRDP, water is used for irrigation, industrial and domestic purposes, out of which irrigation consumes around 95% of the 83.031 km3 annual production [1]. In the RRDP, groundwater is the main source of domestic usage water. Reports state that the groundwater storage capacity of the RRDP is over 23 billion m3, out of which, roughly 20% is located in the southern part, i.e., Thai Binh, Nam Dinh and a part of the Ninh Binh provinces [2,3].
Groundwater in the RRDP was found in four aquifers, namely in Holocene (qh), Pleistocene (qp), in the fissured basement rock Neogene (n) and Triassic (t) aquifers [3,4]. The origin and chemistry of groundwater in entire RRDP were studied by a number of researchers, e.g., Luu et al. [5] and Nguyen et al. [6,7]. Groundwater in the RRDP was classified into three types: fresh, low saline and high saline [5,7]. Vietnamese hydrogeologists have drawn conclusions that fresh groundwater recharges across mountainous areas in the northwest (NW) and discharges in the southeast (SE) into the sea. This hypothesis is based on the topography of the Delta without any conclusive evidence [3].
The aims of this study are to elucidate the genesis of groundwater, to determine recharge area, to estimate flow rate of the recharged water and to provide evidences proving hydro-geochemical processes controlling quality of groundwater in the southern part of the RRDP by isotopic and related techniques.
1.1. Study Site
The study site encompasses the southern RRDP that comprises a part of Thai Binh, Nam Dinh and Ninh Binh provinces (Figure 1).
The study site occupies an area of 4600 km2 where 4.848 million habitants are residing [8]. The climate in the study region is sub-tropical with a rainy season from May to October and a dry season from November to April. During the rainy season, precipitation ranges from 1400 to 1750 mm and from 150 to 300 mm during the dry season. The potential annual evaporation in the region is in the range of 700–800 mm [9]. The monthly average temperature varies between 16 °C and 35 °C with the lowest temperature in January and the highest in July [9].
1.2. Geology and Hydrogeology of the Study Site
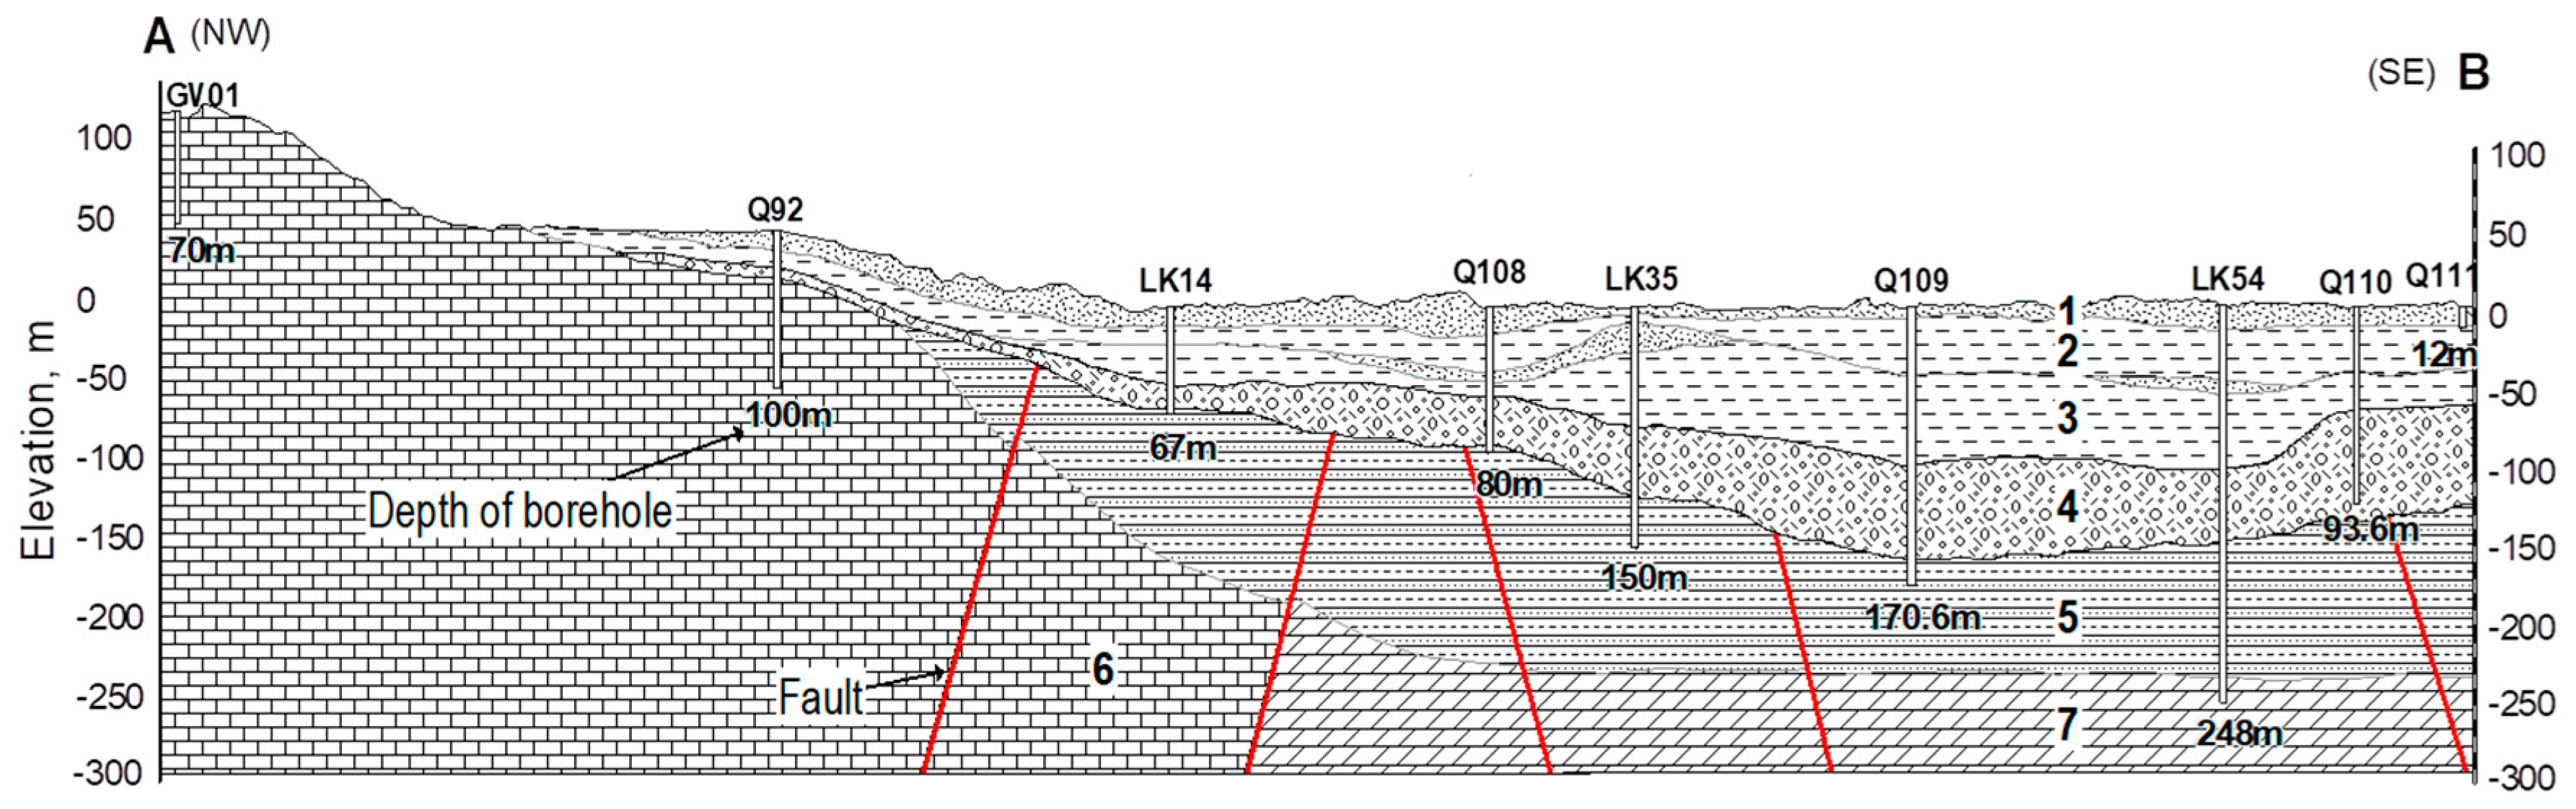
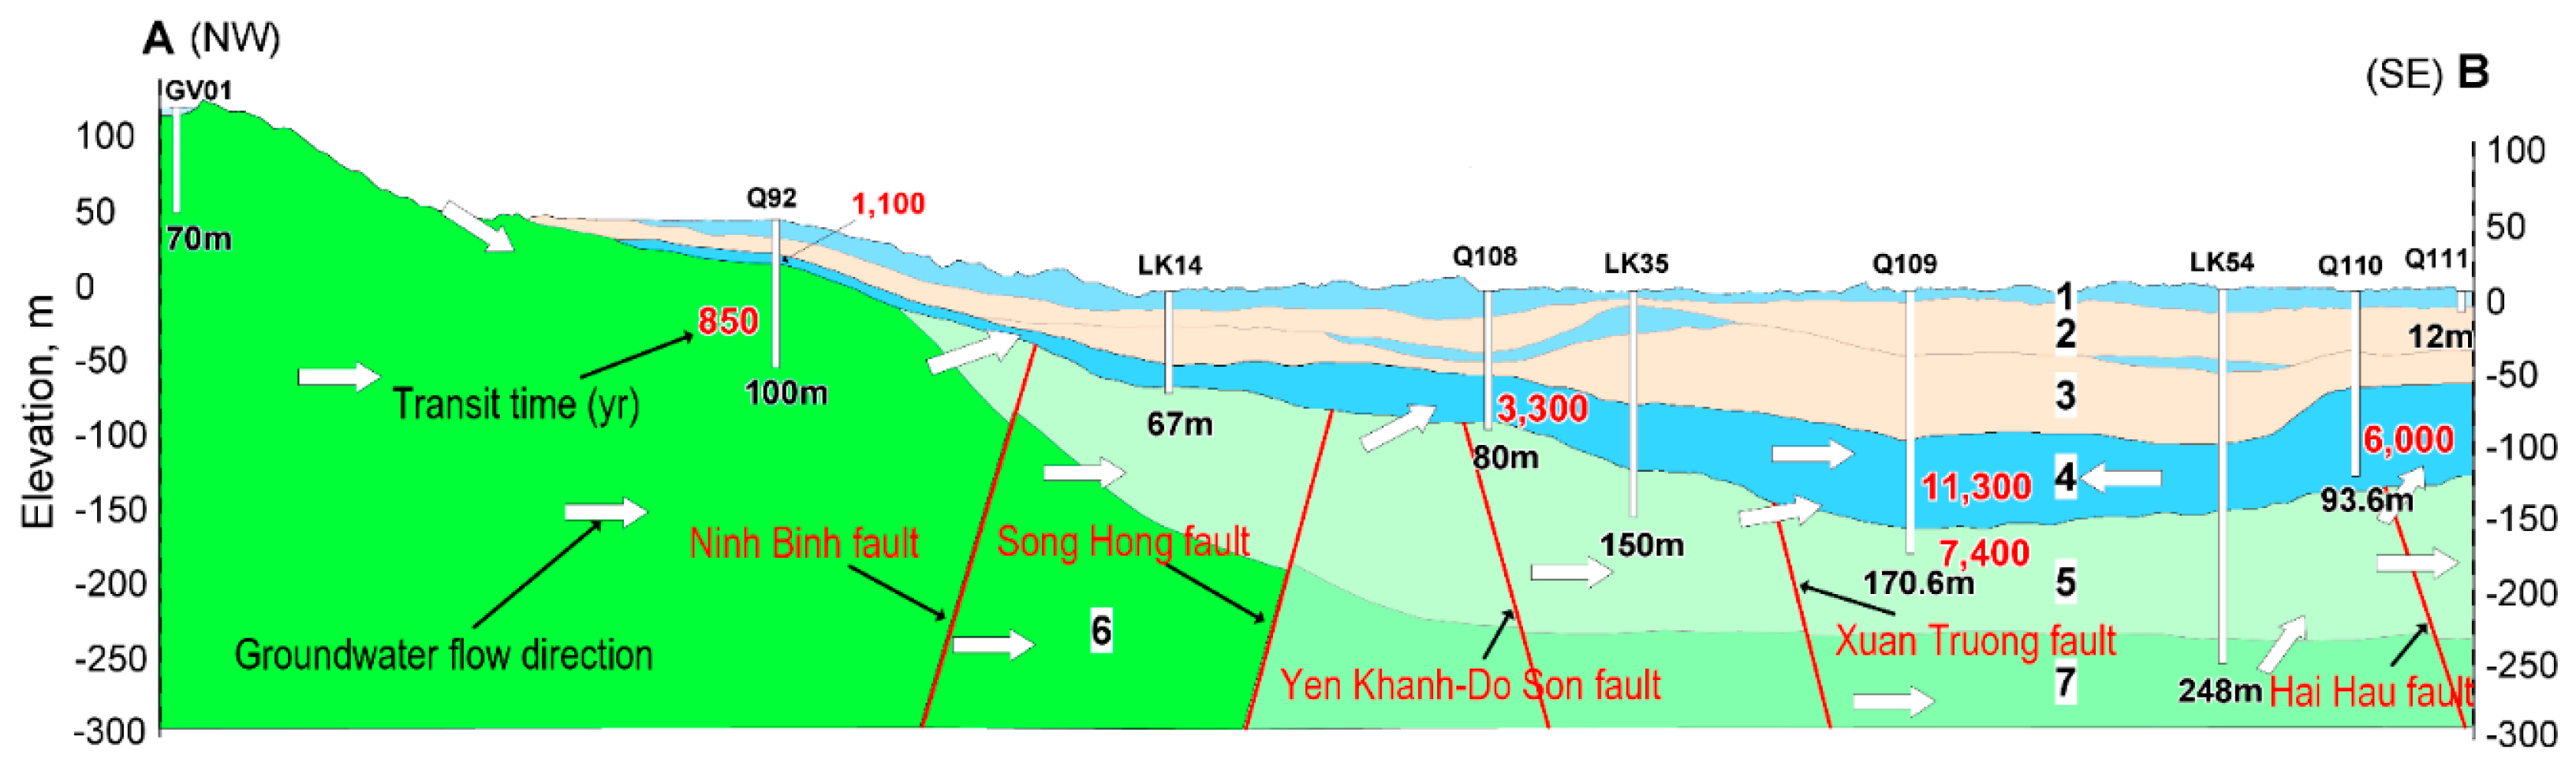
The geology and hydrogeology of the study site drawn for a NW-SE oriented cross-section AB (Figure 1) is shown in Figure 2.
The Red River Delta plain sediments consist of Holocene, Pleistocene and Neogene deposits [3]. Holocene deposits in study region are found from elevation of +2 m to −15 m (layer #1, Figure 2) and contain alluvial sediments and fine sand with disseminated wood debris as well as biogenic calcite such as shells and carbonate mud, etc. [10]. The Holocene sediment layer forms the Holocene unconfined aquifer (qh) where water exists within sediment pores [2,3]. Below Holocene deposit there is a silty-clay layer of Holocene and Pleistocene with a thickness up to 100 m (layers #2 and #3, Figure 2) that forms an aquitard, a low permeable clay layer, to separate the Holocene aquifer from deeper aquifers. Following aquitard, in the NE area there are medium to coarse fluvial and marine sediment deposits, but in the SW area there are silty and fine to medium grained marine sand deposits of Pleistocene with a thickness up to 75 m (layer #4, Figure 2). The NE and SW areas were presumably separated from each other by boundary between blue and light brown color areas in the Nam Dinh province (Figure 1). The NE area comprises the northern part of Nam Dinh and Thai Binh provinces. The SW area comprises the southern part of Nam Dinh province and a part of Ninh Binh province (Figure 1).
The sediment in Pleistocene deposit contains disseminated fragments of organic materials like wood remnants as well as biogenic carbonate such as shells, skeletal debris, etc., [10]. The porous water in Pleistocene sediment layer forms Pleistocene (qp) confined aquifer [2,3]. The underlying Neogene silt and sandstone deposits are located from 120 to 130m to 220–230m below the surface (layer #5, Figure 2). The water existing in the Neogene formation forms the Neogene water bearing layer or Neogene (n) aquifer. The Mesozoic stone basement is located from 230m below the ground surface (layer #7, Figure 2).
Data of drilling works combined with geophysical measurements revealed that the Mesozoic block #6 and #7 comprises of 4 zones: uplifted, moderate depressed, depressed and active depressed ones that created Ninh Binh, Song Hong, Nam Dinh, Song Chay and Vinh Ninh faults oriented from NW towards SE. In each zone, it was observed also uplifted and depressed subzones that created from seaside to inland Hai Hau, Xuan Truong and Yen Khanh faults oriented from SE towards NE. All the faults as well as fissures formed during the tectonic activities had created channels allowing recharge water from mountainous region in the uplifted zone in the SW to leak up to the Neogene and Quaternary formations. The water in fractured Mesozoic rocks basement constitutes Triassic (t) water zone (layers #6 and #7, Figure 2).
1.3. Hydrology in the Study Region
The river network of the study region is very dense. Almost 3% of the land area is covered by rivers and irrigation canals [11]. The main rivers flowing through region are Red River and Day River (Figure 1). Dao and Ninh Co Rivers (Figure 1) are tributaries of Red River that have been man-made during the Tran’s Dynasty in the thirteenth century to control floods during the rainy season and for irrigation purposes in the dry season. Red River annually discharges 119,837 km3 of water into the Ton Kin Gulf, and discharge from Day River is 1848 km3, annually [12].
The tidal regime in the region is diurnal with a level ranging from 2.6 to 3.6 m as recorded at Quang Phuc hydrological monitoring station, around 50 km NE of the mouth of Red River [13].
2. Methods
In this study, isotopic techniques combined with chemical analyses of the ionic contents of local precipitation, water from the Red River and groundwater samples, are applied. Results of chemical analyses give an insight into geochemical processes controlling quality, while isotopic techniques provide evidences to verify the mechanisms behind geochemical processes as well as genesis and flow pattern of groundwater. The isotopic techniques used in this study include: (1) tritium (3H) and carbon-14 (14C) dating to verify recharge areas, the patterns of groundwater flows and to estimate the flow rate of recharge water; (2) determination of isotope composition of hydrogen (δ2H) and oxygen (δ18O) in water to delineate the hydraulic interaction between local precipitation and groundwater and the inter-connection between aquifers, as well as to examine the recharge area; (3) determination of isotope composition of carbon (δ13C) of dissolved inorganic carbon (DIC) to evaluate the type of mineralization of groundwater existing during water seepage and recharge conditions. All these approaches were successfully applied in hydrogeological studies worldwide, e.g., in [14,15,16,17,18,19,20].
During the water cycle, isotope composition of hydrogen and oxygen in water will be changed due to the isotopic fractionation effect. The extent of the fractionation during phase transformation was expressed in delta notation as follows:
where: , , , are the isotopic ratios of [2H]/[1H] and [18O]/[16O] in water samples and standard, respectively. The delta notation is expressed in per mil (‰).
The standard used in these analyses is Vienna Standard Mean Ocean Water 2 (VSMOW2) supplied by the Isotopes Hydrology Laboratory of International Atomic Energy Agency (IAEA IHL) based in Vienna.
The fractionation of stable carbon isotope in DIC due to geochemical processes, e.g., isotopic exchange between atmospheric CO2 and biogenic carbon dioxide released from plants’ roots respiration, as well as dissolution of carbonate, etc., which occur during seepage of water in the unsaturated zone was characterized by delta notation as follows:
Standard used in this analysis is IAEA-603, which is calcite minerals supplied by the IAEA IHL.
At the global scale the relationship of δ2H vs. δ18O for precipitation will follow a so-called Global Meteorological Water Line (GMWL) [21]:
δ2H = 8 × δ18O + 10
At the regional scale, the slope and intercept of Equation (4) are much dependent upon the conditions under which the water was yielded, so for assessing the origin of groundwater of a certain region using water isotopic signatures (δ2H and δ18O), regional meteoric water line (RMWL) is used instead of the GMWL. The approach for assessing the genesis of groundwater based on the water isotopic compositions was described in detail in, e.g., [15,18].
2.1. Sampling Procedure and Field Measurement
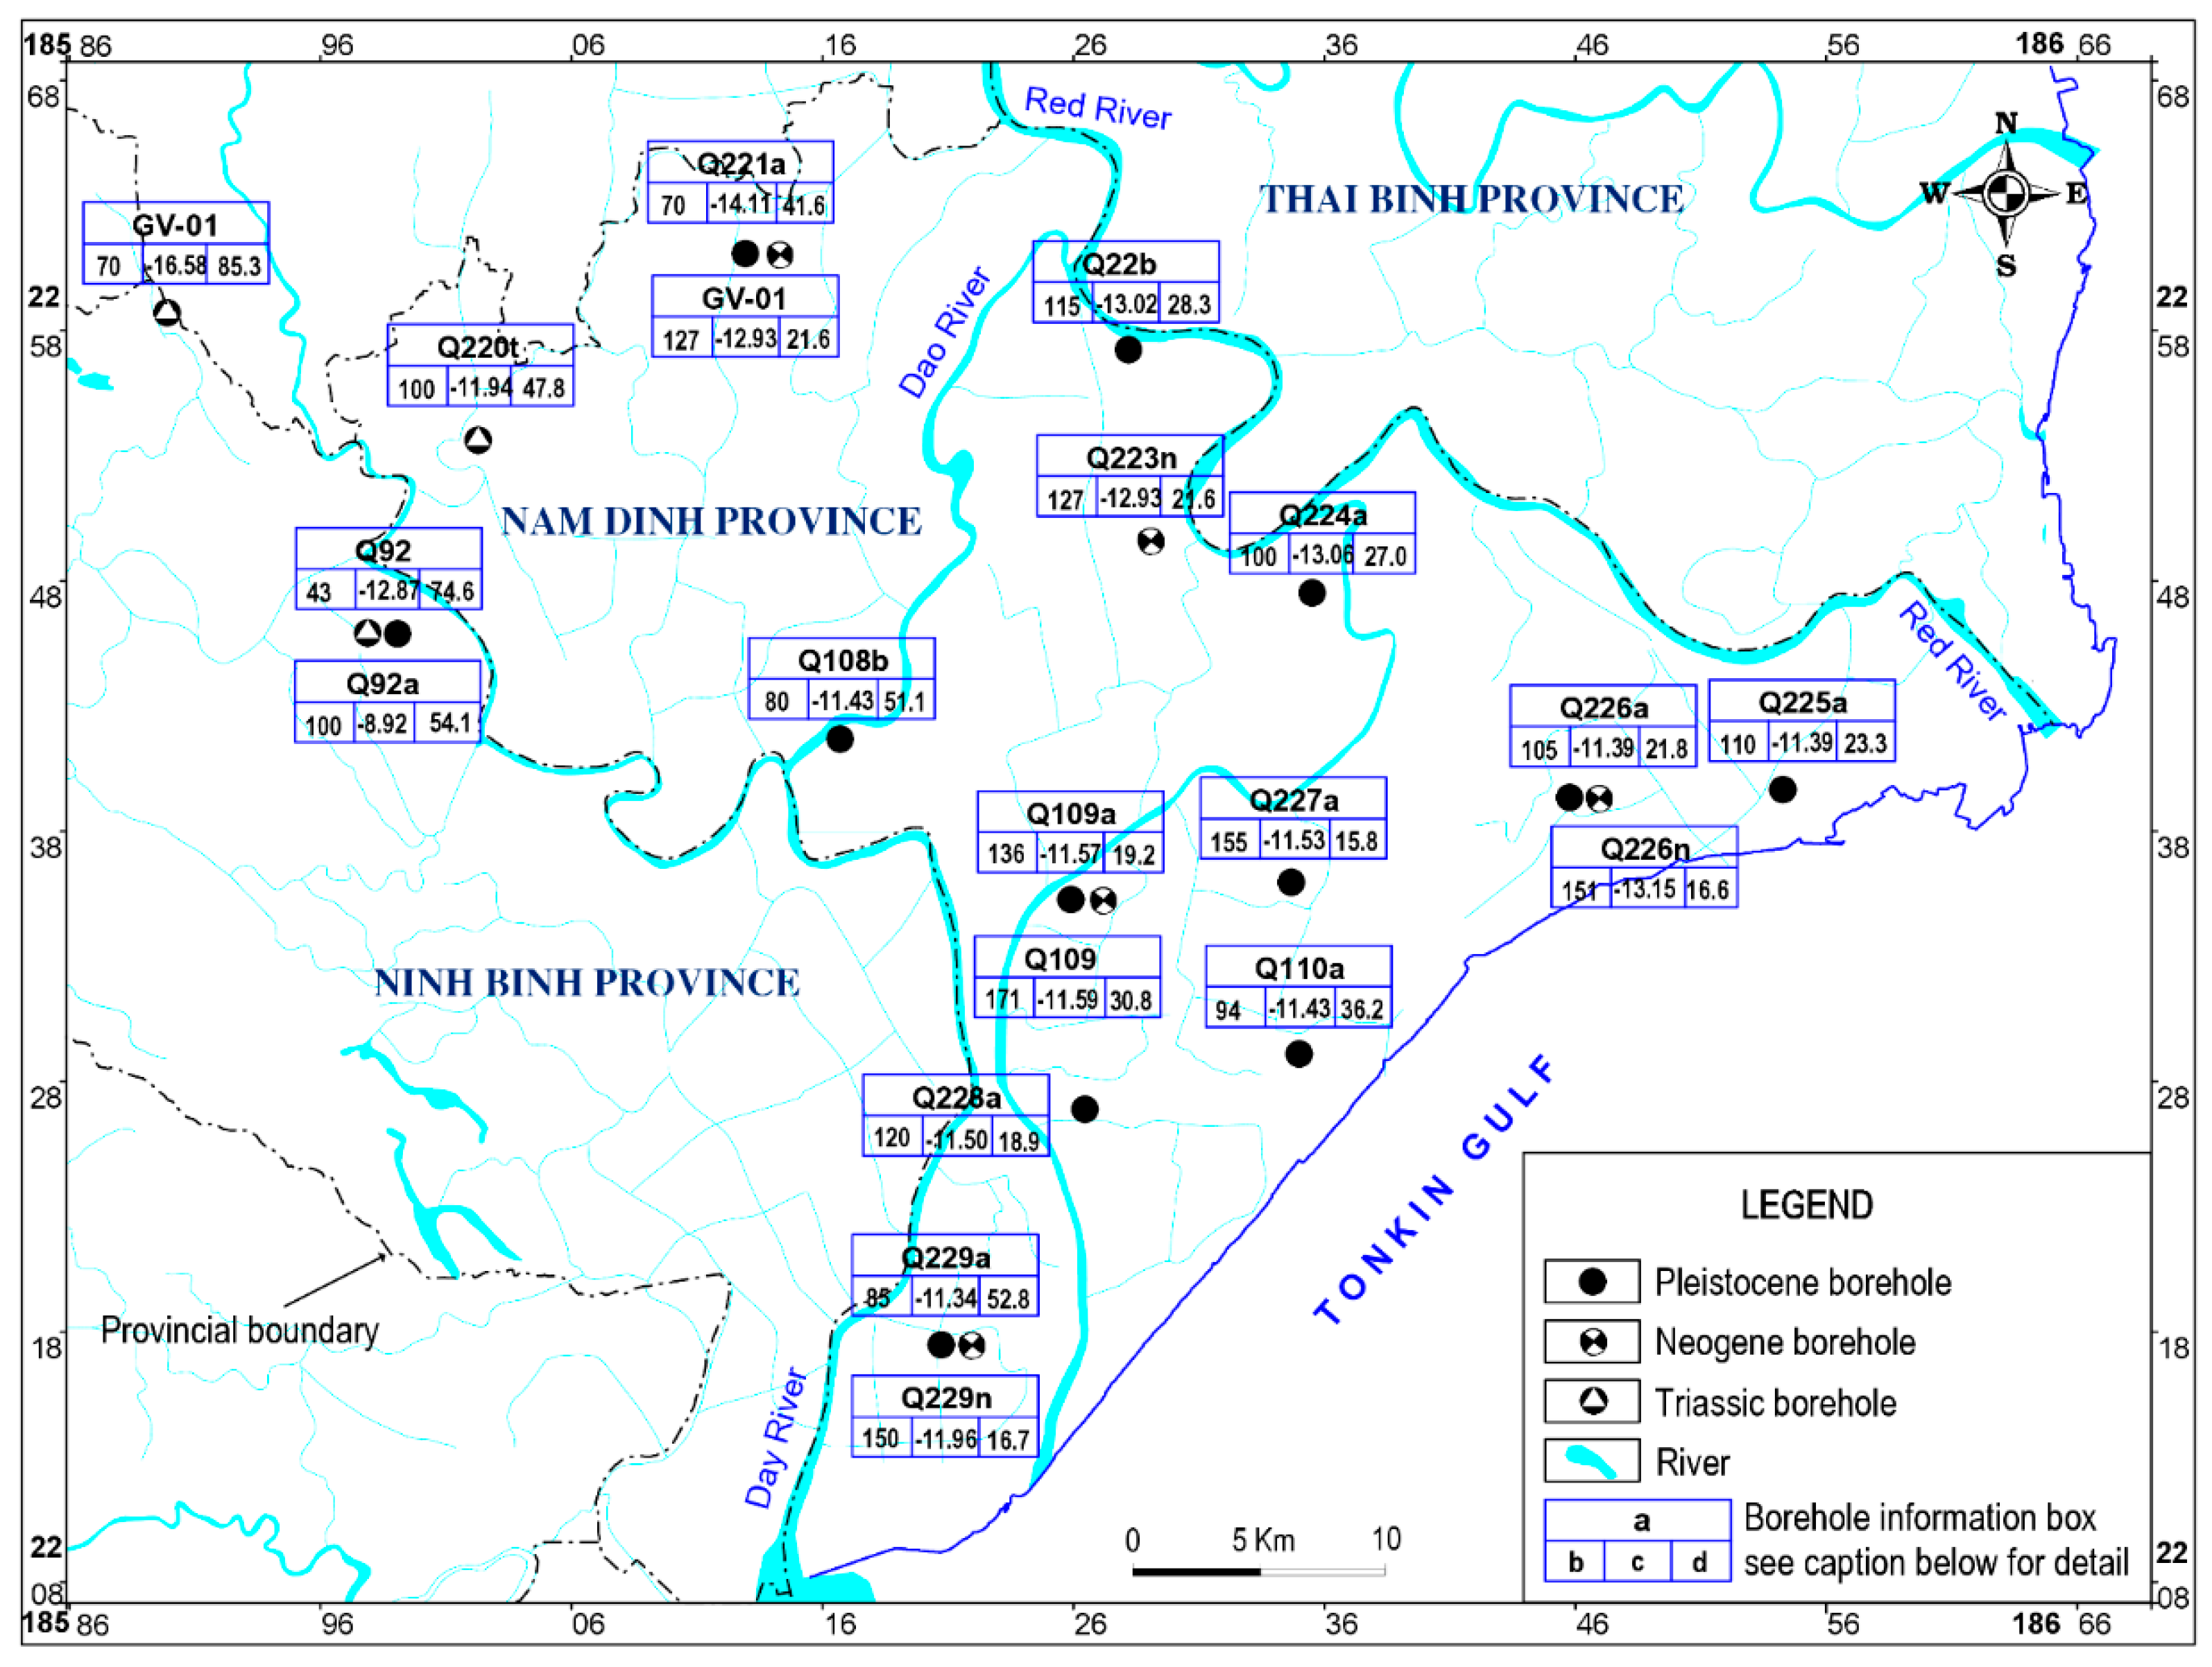
Sixteen (16) groundwater samples from Holocene, twelve (12) samples from Pleistocene, five (5) samples from Neogene, three (3) samples from Triassic aquifers and two (2) surface water (NM) samples from Dao and Ninh Co River (Table S1) were taken during rainy (August 2011) and dry (March 2012) seasons using a submersible pump, a Grundfos MP1. Sampling locations for Holocene aquifer were marked with symbol OB and red dots in the region adjacent to the Red River as shown in Figure 1. The sampling locations for Pleistocene, Neogene and Triassic aquifers are shown in Figure 3 along with depth of boreholes, δ13C- and 14C-values in groundwater from those boreholes.
Before taking groundwater samples, water table level in each sampling location was first measured using a logger system then the stagnant water in the wells was completely flushed out by pumping it out till the pH and temperature of water were unchanged. A flow cell equipped with probes for pH, temperature, and electrical conductivity (EC) was mounted directly on sampling tube. The measurements were carried out with a WTW Multi 197i multi-purpose instrument using a WTW Tetracon 96 EC probe and a WTW SenTix 41 pH electrode.
Alkalinity was determined shortly after sampling using the Gran-titration method [22]. Ferrous ion (Fe2+) concentration in the water samples was determined by colorimetry using a Hach DR/2010 instrument and Ferrozine method [23]. The dissolved inorganic carbon (DIC) including bicarbonate, carbonate ions and CO2 dissolved in water, used to determine δ13C and 14C content was precipitated in the form of BaCO3 from around 100 L of groundwater at pH 10 using saturated BaCl2 solution and CO2-free KOH (Merck based in Darmstadt, Germany).
Around 100 mL of groundwater were first filtered through 0.45 µm mesh polycarbonate membranes to remove suspended matters then split into two parts. One part was acidified with HNO3 (65%, PA grade, Merck) to a pH of about 1–2. These samples were subject to the quantification of cations NH4+, Na+, K+, Ca2+ and Mg2+. Another part was kept without acidification for Cl−, NO3− and SO42− determination. All samples were stored in bottles made from high density polyethylene (HDPE) resin and refrigerated until laboratory analysis.
Surface water from Dao and Ninh Co River (NM1 and NM2 sites, Figure 1) was collected the same day of groundwater sampling. The samples were taken at a depth of 0.5 m from surface and around 2 m apart from the bank of the rivers.
Precipitation was collected monthly for the 2011–2012 years using a device constructed following an IAEA’s recommendation to establish regional meteoric water line and to determine 3H-activity [24]. The device was installed on the roof of the premises of the Meteorological Station (marked with a star in Figure 1) in the city of Nam Dinh. Precipitation, surface water and groundwater samples for water stable isotopic composition determination were filtered through 0.45 µm mesh polycarbonate membranes and stored in 50 mL capacity double caps HDPE bottles.
For the tritium determination, in each sampling site 1 L of water was sampled into a HDPE bottle closed with a tight cap to avoid the isotopic exchange with atmospheric moisture. The samples were transferred to laboratory in Ha Noi for further treatment and measurement of tritium activity.
2.2. Samples Treatment and Analytical Procedure
The ionic content of water samples was quantified by ion chromatography method (IC) using a DIONEX 600 at Institute for Nuclear Science and Technology (INST in Ha Noi). A quality control program was applied for the ionic content determination by analyzing standard solutions supplied by the IC supplier (DIONEX). The standard deviation of results derived by the laboratory was within ±5% from the certified value for respective constituents.
The stable isotopes compositions of hydrogen, oxygen and carbon (δ2H, δ18O and δ13C) were analyzed at the INST on an Isotope Ratio Mass-Spectrometer (IR MS, IsoPrime, GV, UK) equipped with an Elemental Analyzer (EA 3000, Eurovector based in Milan, Italy). To analyze for δ13C, the barium carbonate precipitate was first washed off the excess of alkali by boiled deionized water till neutral pH was attained then freeze-dried. The dry and alkali-free carbonate barium was stored in HDPE vials till analysis. For the δ2H and δ18O analyses, the water samples collected and filtered in the field did not need any additional treatment in the laboratory.
Procedures applied for analyzing the stable isotopic compositions were implemented as per the supplier’s manual [25] and as follows.
For the δ2H analysis, 2 µL of water was injected into the EA where the sample was decomposed on the Ni-catalyst at 1050 °C to form hydrogen gas [25]. A continuous flow of He-carrier gas carried the H2 gas through a Mg(ClO4)2 moisture trap to dry then by passing through a chromatographic column to purify from contaminants before entering the ionization chamber of the IR MS where H2 was ionized. The flow of He-carrier gas carried the H2+ ions into the mass separator of the IR MS where masses 2 (1H2+) and 3 (1H2H+) were separated from each other. The H2+ and H3+ ions were collected and counted by the respective Faraday cups installed on the exit from the separator.
For the δ18O analysis, the decomposition of water was carried out in the EA on the glassy carbon catalyst at 1150 °C to form CO2 gas [25]. A continuous flow of He-carrier gas carried the CO2 through a Mg(ClO4)2 moisture trap followed by the chromatographic purification before entering the ionization chamber to ionize the CO2 gas. The carrier gas carried the ions of masses 44 (12C16O2+) and 46 (12C16O18O+) into the mass separator of the IR MS where they were separated from each other. Ions 12C16O2+ and 12C16O18O+ were collected and counted by the respective Faraday cups installed on the exit from the separator.
For the δ13C analysis, around 100 µg of the freeze-dried BaCO3 was wrapped in tin capsules and subjected to decomposition at 1050 °C on the chromium oxide catalyst in the EA of the IR MS to form CO gas [25]. The formed CO was carried by a continuous flow of He-carrier gas through a chromatographic column to purify from contaminants before entering the ionization chamber to ionize. A flow of the He-carrier gas carried the ions of masses 28 (12C16O+) and 29 (13C16O+) into the mass separator of the IR MS where they were separated from each other. The ions 12C16O+ and 13C16O+ were collected and counted by respective Faraday cups installed on the exit from separator.
To calculate the δ2H, δ18O and δ13C the Mass Lynx software supplied by the IR MS supplier was used. Precision of δ2H determination was ±2‰ and that of δ18O and δ13C was ±0.2‰.
For tritium measurement, water samples were first subjected to distillation to remove the minerals dissolved till EC was less than 10 µS cm−1, then tritium content in the samples were enriched by electrolysis at 4 °C till around 10 mL was attained [26,27]. The tritium enriched water samples were mixed with the low tritium Ultima Gold scintillation cocktail (Hewlett-Packard, HP Supplier based in Palo Alto, CA, USA) in vials of 20 mL capacity to count for the 3H activity on a low background HP Liquid Scintillation Counter TriCarb TR 3700. The 3H activity in water was expressed in the Tritium Unit (TU, 1 TU = 0.118 Bq L−1). The limit of quantification (LOQ) for 3H was estimated to be as low as 0.4 TU. The accuracy of the determination was validated by our participation in the inter-comparison exercises of the TRI-2004 and TRI-2008 organized by the IAEA IHL in the years 2004 and 2008. In the 2004 exercise, the Hanoi laboratory (no.74) produced results having Z-scores of −1.25 and 0.59 for the samples of 1.74 TU and 5.43 TU, respectively. In the 2008 exercise, the laboratory (no. 27) produced results with Z- scores of 0.42 and 1.57 for the samples of 4.07 TU and 1.54 TU, respectively [28,29].
The 14C-analysis was conducted at the Center for Nuclear Techniques in the city of Ho Chi Minh (HCM) where BaCO3 was decomposed by concentrated H3PO4 (PA grade, Merck supplier) to obtain CO2 for further benzene synthesis [30,31]. The yield of the benzene synthesis was from 95% to 98%. The benzene obtained was mixed with the Ultima Gold scintillation cocktail (HP Supplier) in vials of 20 mL capacity, and then counted for the 14C activity on the HP LSC TriCarb TR 3770. Counting time for the 14C activity determination was estimated in order to achieve a precision of 5%, usually it took 1000 min but split into 10 cycles, each cycle was set for 100 min to count.
2.3. Estimate Groundwater Age by the 14C-Dating Method
The aim of groundwater age determination is to verify follow pattern and to estimate its flow rate. The age of groundwater was calculated based on the law of radioactive decay [15,18] as follows:
where 14t denotes the age in years Before Present (aBP) of a groundwater sample estimated by the 14C-content in the DIC; the number 8268 is quotient of half-life of 14C-isotope (5730 a) to ln2; is the initial 14C-content in the DIC before entering the saturated zone (pMC), and 14asample is the 14C-content (pMC) in the DIC of the sample to be measured. The term “Before Present” implies the age relative to the time when the standard was produced. This means that the 14asample must be measured relative to a standard to reduce uncertainty of the 14C-activity measurements [15,18] and it was expressed by the formula:
where 14asample is the relative 14C-activity or the 14C-content in a sample; 14Asample and 14Astd are the absolute activities (Bq g−1 C) of 14C in the sample and standard, respectively.
The standard used in this study was oxalic acid II (ox-II) made from French beet molasses planted in 1977 and supplied by the National Institute of Standards and Technology (NIST based in Gaithersburg, MD, USA), which has a 14C-activity of 0.2147 Bq g−1 C and δ13C = −25‰ [32].
The in Equation (5) was calculated using an isotope mixing model referred to as the model of complete exchange with CO2 in the unsaturated zone proposed by Gonfantini [33] for a closed/confined system was applied as follows:
where δ13CDIC, δ13Ccc and are carbon-13 compositions, respectively, in DIC of a groundwater sample, in calcareous materials in soil/sediment and in biogenic dioxide originated from decomposition of organic matters; is fractionation coefficient for 13C in the isotopic exchange reaction between biogenic carbon dioxide and DIC, which is temperature dependent [34,35]:
where T is the temperature of the groundwater sample, in Kelvin.
In the study area the δ13Ccc in soil was found to be ranging from 1 to 2‰ with an average value of 1.5‰ was taken to calculate for . The δ13CCO2,org in Equation (7) was taken as high as −23‰, as it is characterized for carbon dioxide generated from mineralization of remnants of C3 plants in tropical areas followed by its diffusion to aquifer [36].
3. Results
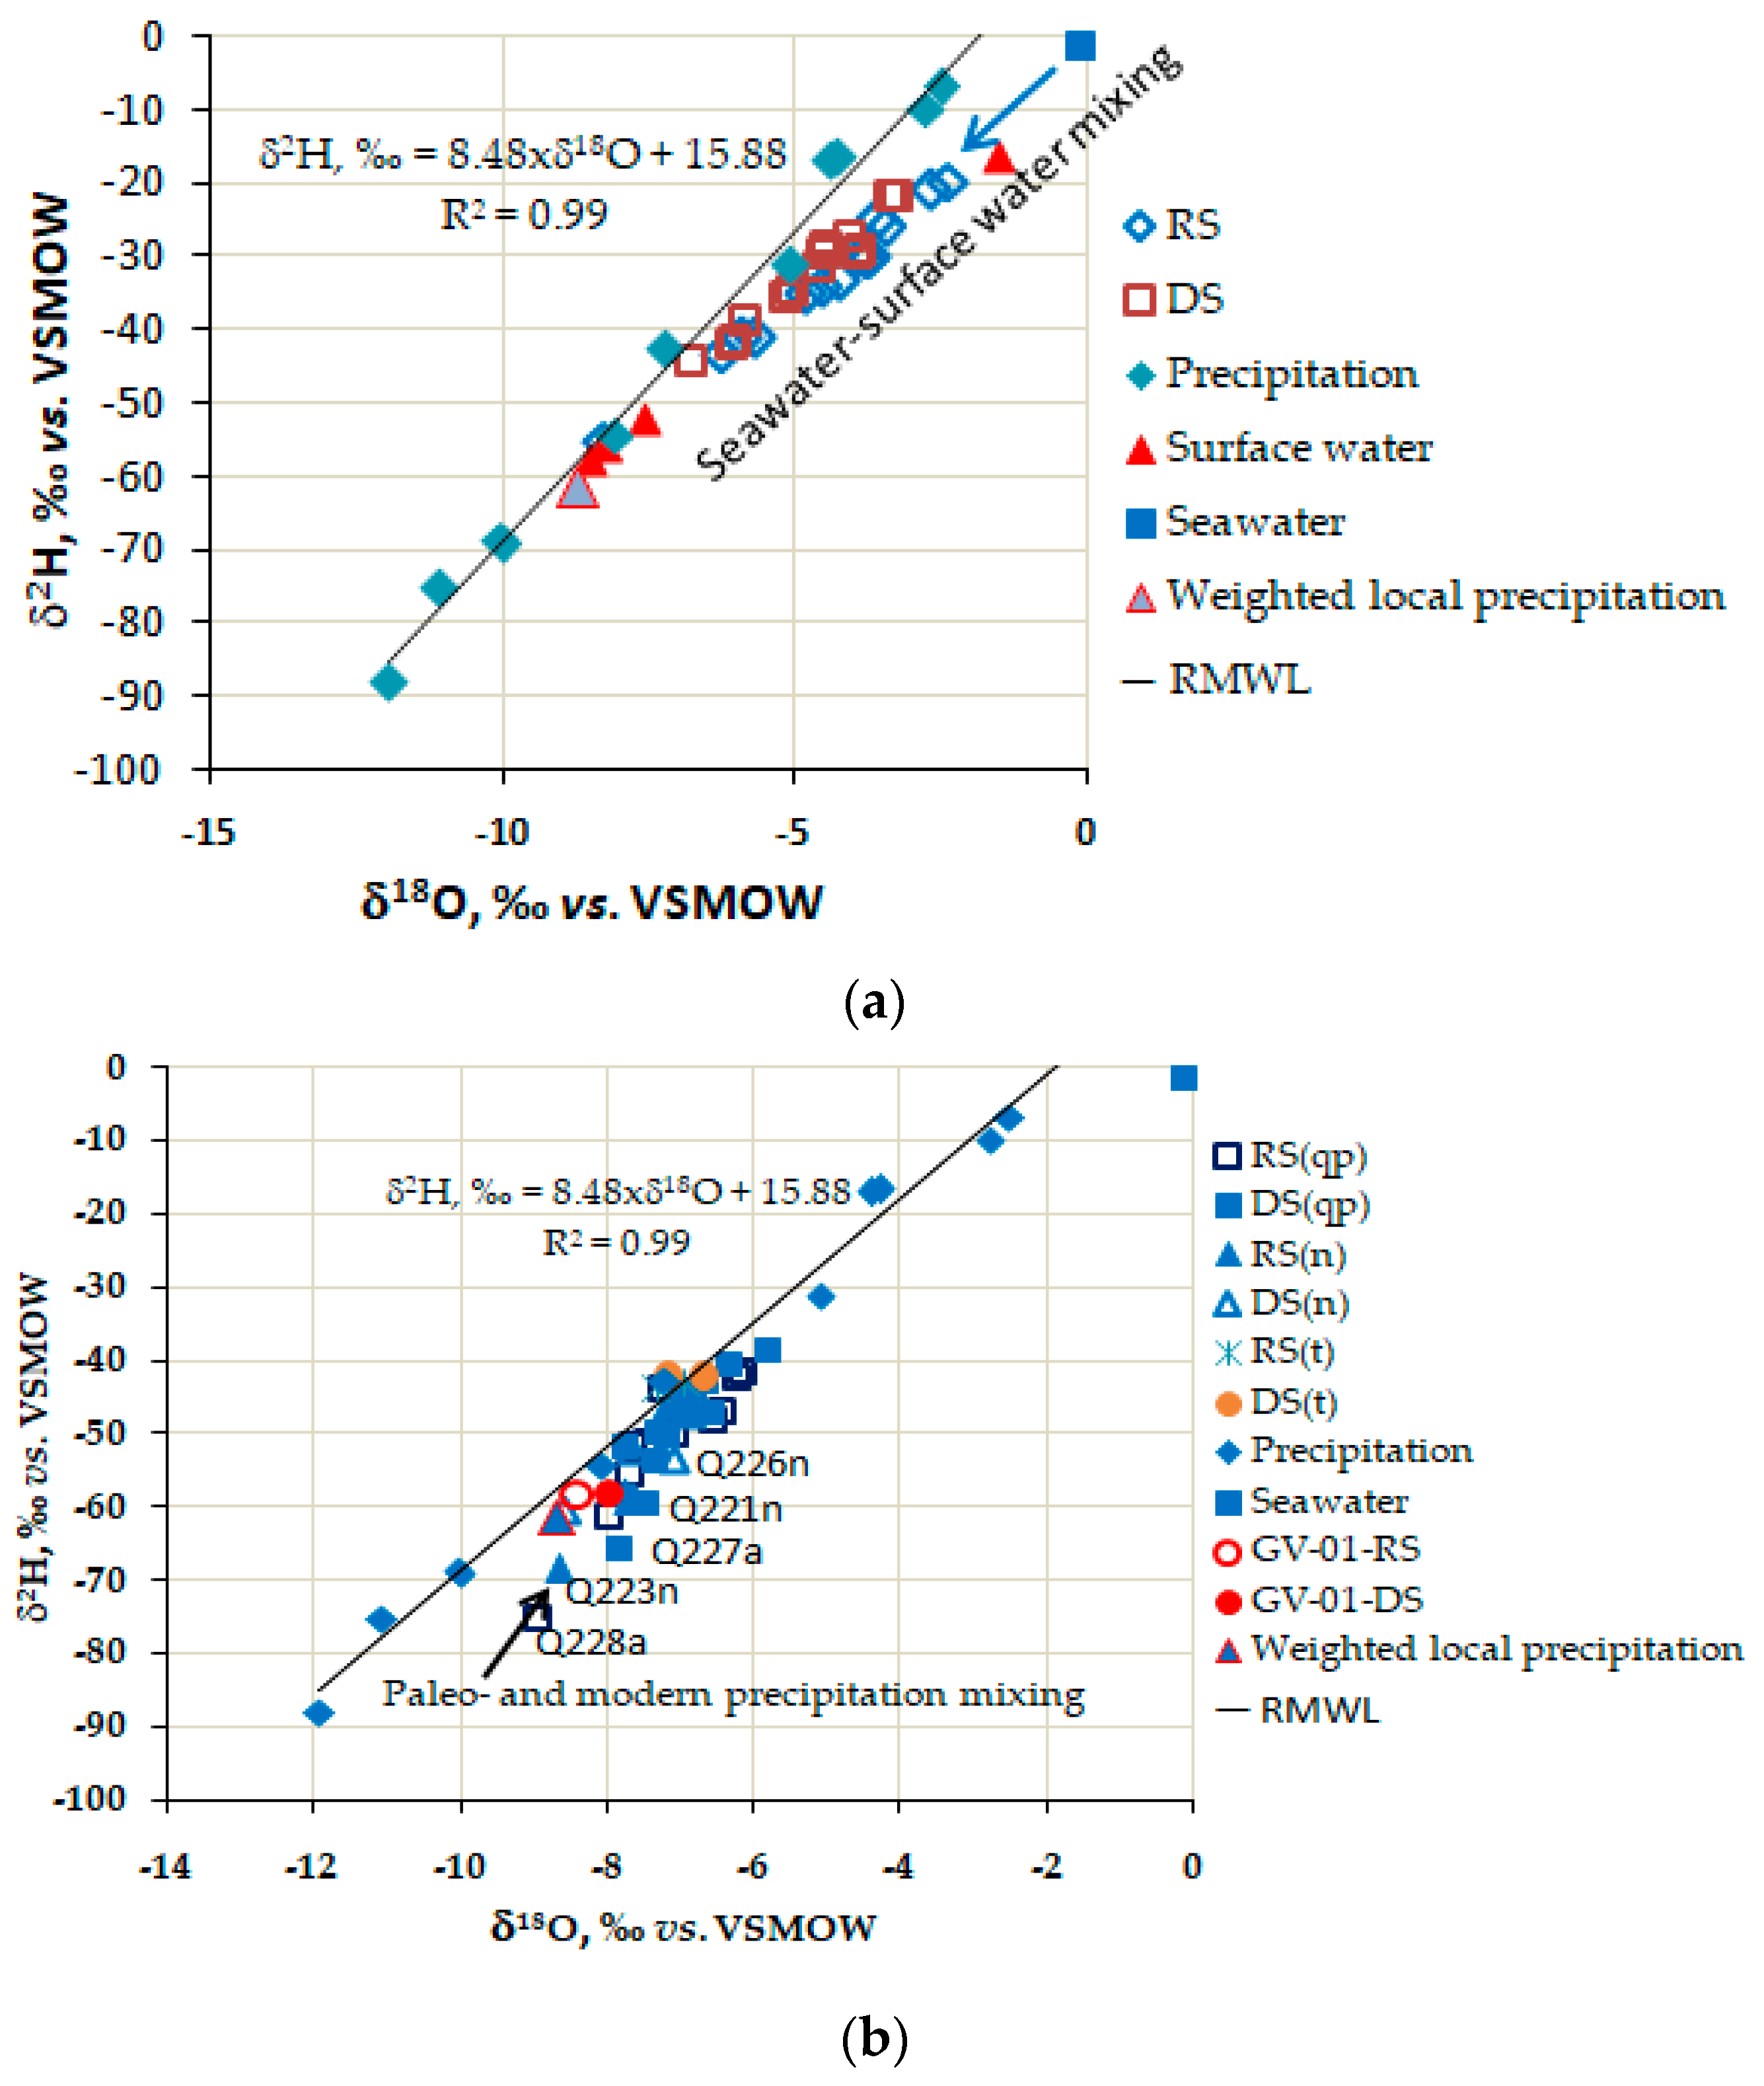
3.1. Regional Meteoric Water Line
Results of the stable isotopic compositions of precipitation collected in Nam Dinh city for one meteorological year, beginning in August 2011 to the end of July 2012 allowed one to construct a regional meteoric water line (RMWL), a graph of δ2H vs. δ18O of local precipitation. This relationship was deduced based on the ordinary least square regression method. The RMWL follows a model with a correlation coefficient R2 = 0.99 as shown by Equation (9):
δ2H = 8.48 × δ18O + 15.88
The slope and intercept of the RMWL in region (Equation (9)) was a little higher than those of the Global Meteoric Water Line of, respectively, 8 and 10, probably due to the kinetic effect during rain fall in the tropical regions where atmospheric temperatures are usually high [15].
The RMWL was inserted in Figure 4a,b to compare with water stable isotopic compositions of groundwater samples. In Figure 4a,b the mean weighted isotopic composition of precipitation was taken from [40] which was calculated based on the precipitation depth and δ2H and δ18O of each event over whole the Red River’s delta plain for a time period from March 2001 till March 2011.
3.2. Water Level
Table 1 shows elevation, in meter above mean sea level (m asl), of water table in boreholes installed in different aquifers from those groundwater samples were taken.
As seen from Table 1, elevations of water table of Holocene aquifer were all above the mean sea level. Elevations of water table in deep aquifers are descending from northeasterly towards southwesterly, from northwesterly towards the seaside and from seaside towards production well field located in proximity to borehole 109a. These data were used to draw isolines of hydraulic heads of groundwater as it was depicted in Figure 1.
3.3. Groundwater Isotopic Composition
Figure 4a,b depicts the isotopic compositions in groundwater collected during the rainy (RS) and dry (DS) seasons from Holocene (Figure 4a), Pleistocene, Neogene and Triassic aquifers (Figure 4b), respectively, along with the RMWL.
The open and solid red color circles in Figure 4b represent isotopic composition in water collected in the RS and DS from borehole GV01 installed in Gia Vien district, Ninh Binh province. Though the borehole was made into Triassic limestone bedrock (Figure 2) water in it characterizes the local and modern precipitation with its isotopic composition positioned close to the RMWL (Figure 4b), it contains (85.30 ± 0.87) pMC and 2.03 TU (Table S1), i.e., comparable with the average tritium activity found year round in precipitation in the Red River Delta region [40].
3.4. The Age of Groundwater in the Aquifers
Tritium activity in groundwater from Holocene aquifer was comparable with the surface water ranging from 2.0 to 3.0 TU (Table S1). However, the tritium content in groundwater from Pleistocene, Neogene and Triassic aquifers was lower than LOQ of determination of 0.4 TU, excepted for water in borehole GV01. This finding reflects the fact that groundwater in Holocene aquifer is modern and that it is continuously recharged from surface water. This was confirmed by the 14C-age of water from wells OB-10 and OB-12 for which the 14C-content was 101.2 pMC and 103.5 pMC, respectively (Table S1). In contrast, groundwater in Pleistocene, Neogene and Triassic aquifers did not receive recent recharge, therefore it was of an older age, e.g., water in borehole Q223n made into Neogene aquifer has a 14C-age as old as 14.5 ka BP (Table S1).
Results of 14C-dating revealed that along transect AB (Figure 1) groundwater in borehole GV01 made into Triassic aquifer is modern (i.e., recent precipitation), while in Pleistocene aquifer it was 1.1 ka old at borehole Q92, 3.3 ka old in Q108a and 11.3 ka old in borehole Q109a (Figure 5). However, the age of groundwater found in Q110a borehole installed behind borehole Q109 at the sea coast decreased down to 6 ka (Figure 5 and Table S1).
3.5. Groundwater Chemistry
The chemistry of the water samples studied were presented in Table S2. Sodium and chloride were the dominant cation and anion in water from Holocene aquifer, excepted for water tapped from borehole OB-09 (Table S2). Concentration of Na+ ion ranged from 3.0 to 5961.5 mg L−1 in the RS, and from 3.5 to 5768.5 mg L−1 in the DS. Concentration of Cl− ranged from 3.0 to 11,699.5 mg L−1 in the RS and from 3.6 to 11,699.5 mg L−1 in the DS.Molar [Ca2+] to [Mg2+] ratio ranged from 0.1 to 4.99 in both rainy and dry seasons. The lowest concentrations of [Na+] and [Cl−] ions and the highest value of molar [Ca2+] to [Mg2+] ratiowas found in water tapped from borehole OB-09 (see Figure 1 for location). It seems that water in Holocene aquifer of the study region is affected by seawater.
Concentration of Na+ ion in water tapped from deep aquifers of the study region varied from 3.5 to 1003.3 mg L−1 in the RS and from 4.6 to 1146.3 mg L−1 in the DS, whilst concentration of Cl− ion in water varied from 7.4 to 2216.0 mg L−1 in the RS and from 6.8 to 2247.0 in the DS. Molar [Ca2+] to [Mg2+] ratio ranged from 0.1 to 5.1 in the RS and from 0.32 to 6.8 in the DS (Table S2). The highest value of the [Ca2+] to [Mg2+] ratio was found in water tapped from borehole GV01 located in a mountainous site of Ninh Binh province where it was expected to be the recharge area for groundwater in the study region. The source of salinity in water of deep aquifers seems to be not from the sea.
Groundwater in the study region could be divided into three types based on its total dissolved solids (TDS) content. In the NE area, groundwater was found of two types. in Thai Binh province and northernmost part of Nam Dinh province (Figure 1), groundwater in all Holocene, Pleistocene, Neogene and Triassic aquifers is saline with TDS > 3 g L−1 but in a part of northern Nam Dinh province lying along the Red River (Figure 1), groundwater in these aquifers is brackish with TDS ranging from 1 to 3 g L−1. In the SW area, the southern part of Nam Dinh and northern part of Ninh Binh province (Figure 1), groundwater in the deep aquifers is fresh containing TDS < 1 g L−1. The fresh-brackish and brackish-saline water boundaries drawn based on the TDS content in the deep aquifers groundwater of the study region is presented in Figure 1. The blue, light brown and dark brown color in Figure 1 indicate the areas of fresh, brackish and saline waters, respectively. Brackish water in the deep aquifers in the NE area seems to be resulting from the migration of saline water from the NE or/and from the diffusion downwards of saline water from the upper aquitard due to the high rate of fresh water mining in the SW and this will be discussed later on.
4. Discussion
4.1. Genesis of Groundwater Resources in the Southern Part of Red River’s Delta Plain
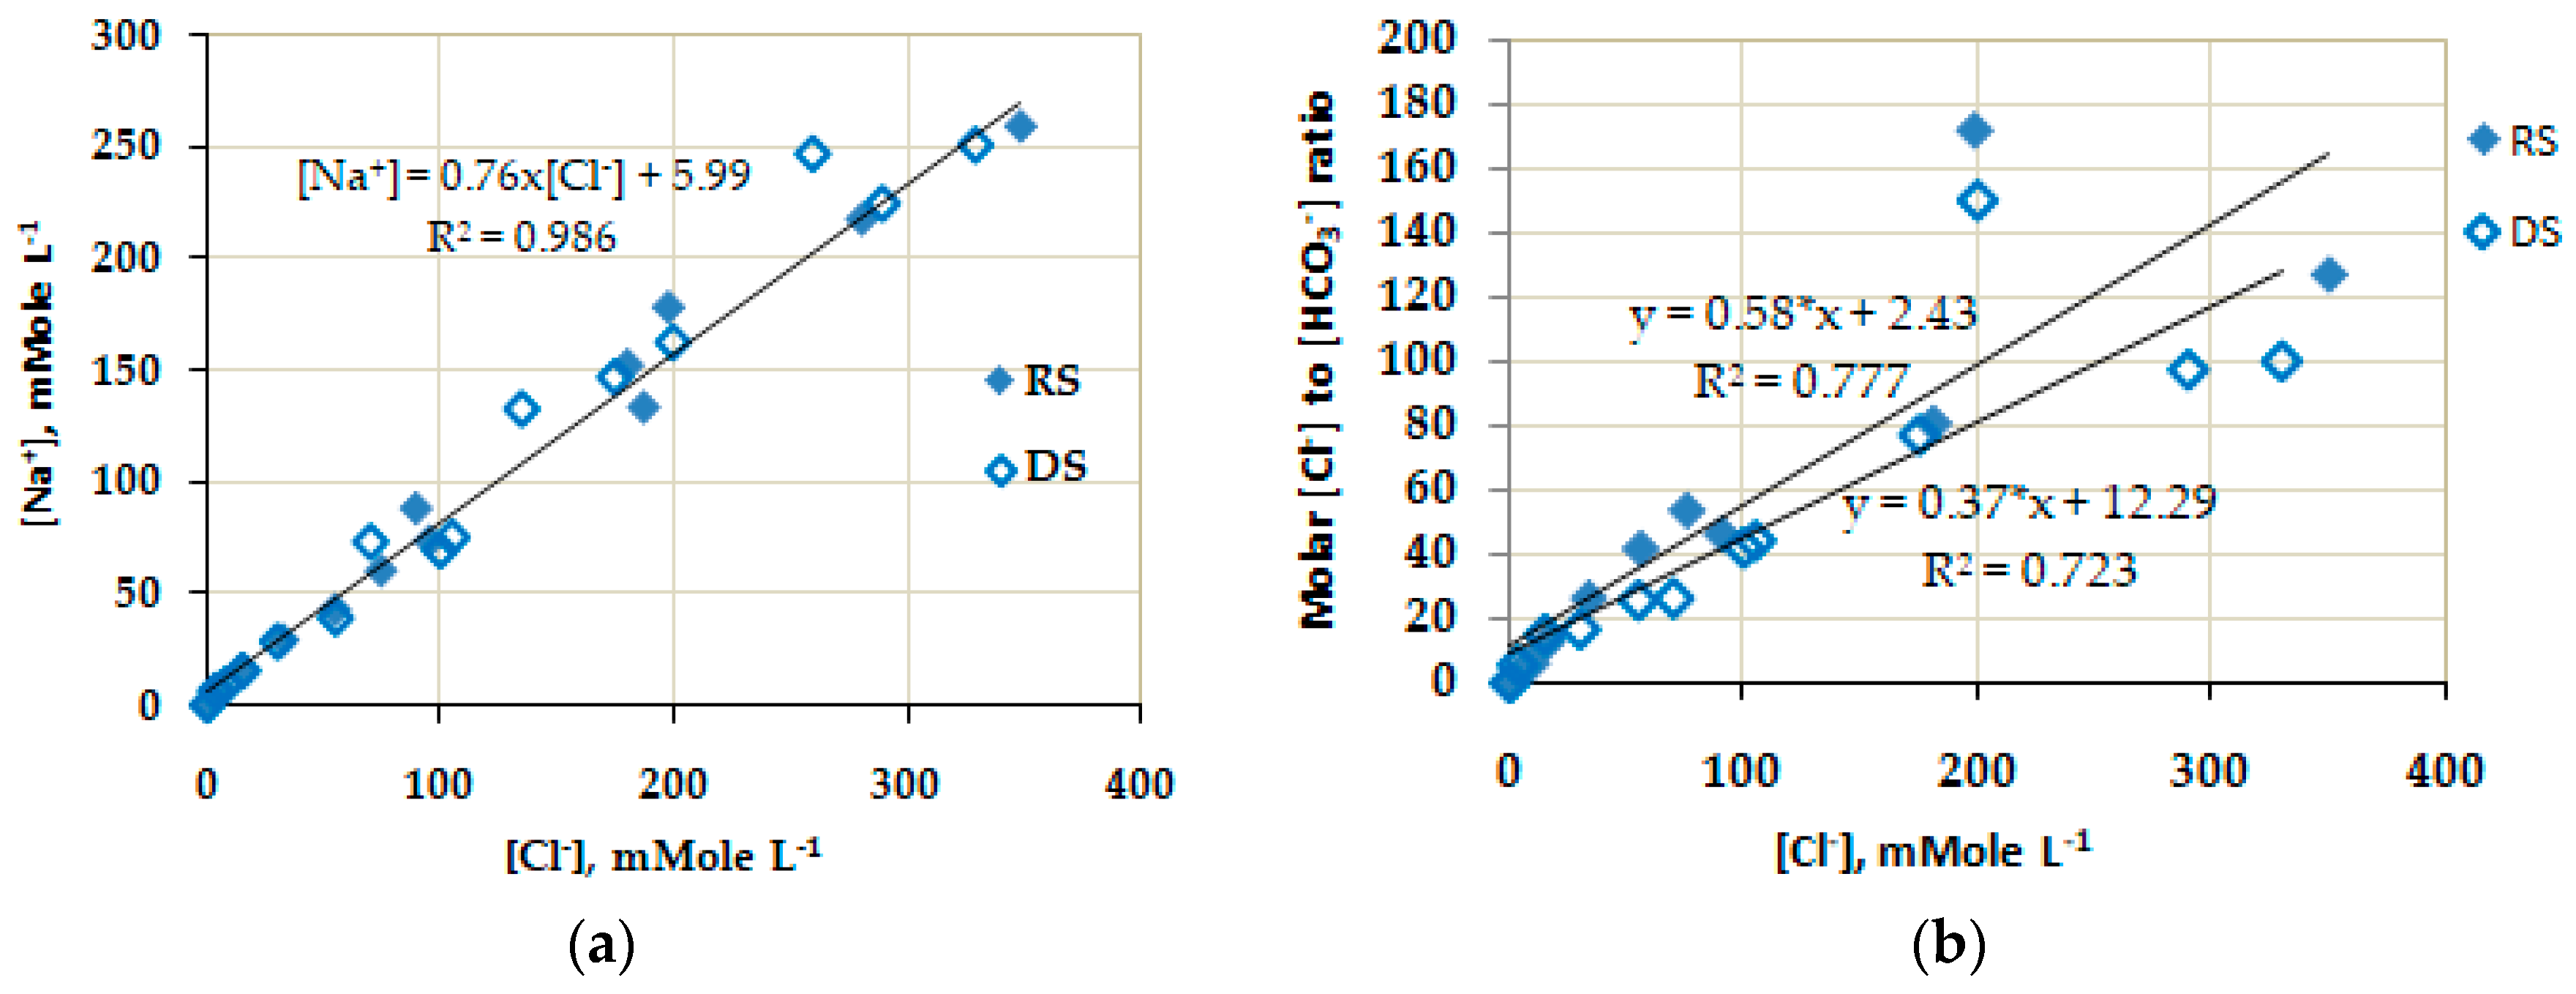
Groundwater in Holocene aquifer of the study region is affected by seawater intrusion. This thought was evident from Figure 4a, where the trend of water isotopic signatures appeared to extend to the point characterizing for seawater (Figure 4a). Moreover, as it was shown in Figure 6a, that the molar concentrations of sodium ion in water of Holocene aquifer are strongly correlated (R2 = 0.986) with concentrations of chloride for both rainy and dry seasons (Figure 6a). The slope of 0.76 of the correlation is very close to the value of 0.8 representing for seawater.
Data presented in Table S2 showed molar ratio of [Cl−] to [HCO3−] of water from Holocene aquifer to range from 0.21 to 170.2 and it is positively correlated with concentrations of chloride ions (R2 > 0.7) for both RS and DS, as seen in Figure 6b. Among 16 samples from Holocene aquifer, the only sample taken from borehole OB-09 (see Figure 1 for location) has the lowest value of [Cl−]/[HCO3−] ratio of 0.21, less than 0.5. This reflects a fact that water in borehole OB-09 was not affected by seawater like Mohan Babu et al. have shown [41].
Groundwater in Holocene aquifer is a mixture of three end-members, namely: local precipitation, water from Red River and seawater. The three end-members mixing character of water in Holocene aquifer is clearly demonstrated in Figure 7, where the relationship of δ18O vs. chloride concentration ([Cl−]) in water was arranged within a triangle with three apexes representing local precipitation, Red River’s water and seawater (Figure 7).
Let the contribution of precipitation’s water to groundwater in Holocene aquifer be x, the River’s be y and seawater be z, then one could compute x, y and z for each water sample based on δ18O, and [Cl−] using three end-members model [42] as follows:
where subscripts p, r, s, and gw denote the precipitation, river’s water, seawater and groundwater, respectively.
x + y + z = 1
x × δ18Op + y × δ18Or + z × δ18Os = δ18Ogw
x × [Cl−]p + y × [Cl−]r + z × [Cl−]s = [Cl−]gw
Table 2 shows results of estimated contribution (in percent) by local precipitation, river’s water and seawater to groundwater in different boreholes made into Holocene aquifer in the study region during the RS and DS. This estimate was made based on the average δ18Op, δ18Or and δ18Os of −8.40‰, −4.0‰ and −0.1‰ (vs. VSMOW), and [Cl−]p, [Cl−]r, and [Cl−]s of 0.10 mmol L−1; 0.11 mmol L−1 and 566 mmol L−1, respectively. The data of δ18Op, δ18Or, [Cl−]p, and [Cl−]rfor precipitation and Red River’s water in the RRDP were from [43]. The δ18Ogw and [Cl−]gw were taken from Tables S1 and S2, respectively. Here, the river’s water must be included as well as water from irrigation canals in the region because this system is directly connected to Red River via Dao and Ninh Co tributaries (Figure 1).
As seen from Table 2, groundwater from boreholes located deep inland, e.g., OB-07, OB-08, OB-12, and OB-16 (see Figure 1 for locations) has low contribution of seawater. This contribution was only from 0.4 to 5.5% in the RS and from 1.1 to 6.1% in DS. However, waters from boreholes nearby the River’s mouth and coastline do have a high contribution of seawater. Water from the OB-01 and OB-04 boreholes installed close to the Red River’s mouth contains, respectively, 37% and 61% seawater in the RS and 37% and 65% seawater in the DS (Table 2). Borehole OB-01 is about 500-m from the River’s bank, while OB-04 is installed right on the River’s bank. Apparently, seawater intruded Holocene aquifer via the River. Active sand excavation (for construction purposes) from the River’s bed combined with construction of upstream hydroelectric reservoirs, reduce downstream sediments deposits; the combination of these factors could much facilitate seawater to intrude deep inland and to diffuse to the aquifers. Boreholes OB-02 and OB-13 are located at 50 and 100m from the sea shore (Figure 1) so apparently groundwater around these locations could be directly affected by seawater intrusion.
From Table 2, one can see that groundwater from borehole OB-09 was fresh with no seawater detected. δ18O and chloride concentration in groundwater from borehole OB-09 were −8.25‰ and 0.10 mmol L−1, respectively (Tables S1 and S2) that almost coincided with the heavy oxygen isotope signature and [Cl−] found in local precipitation (see the point of isotopic signature weighted for local precipitation in Figure 4a). This supports the rainwater origin of groundwater around OB-09 borehole. In fact, borehole OB-09 is located in a lower area of Giao Thuy district that is capable of storing rain water year-round making rain water to be the most dominant source recharging shallow aquifer. On the other hand, the aquifer sediment around borehole OB-09 is purely coarse sand so chemistry of groundwater in this area is mainly dependent upon the chemistry of the local precipitation.
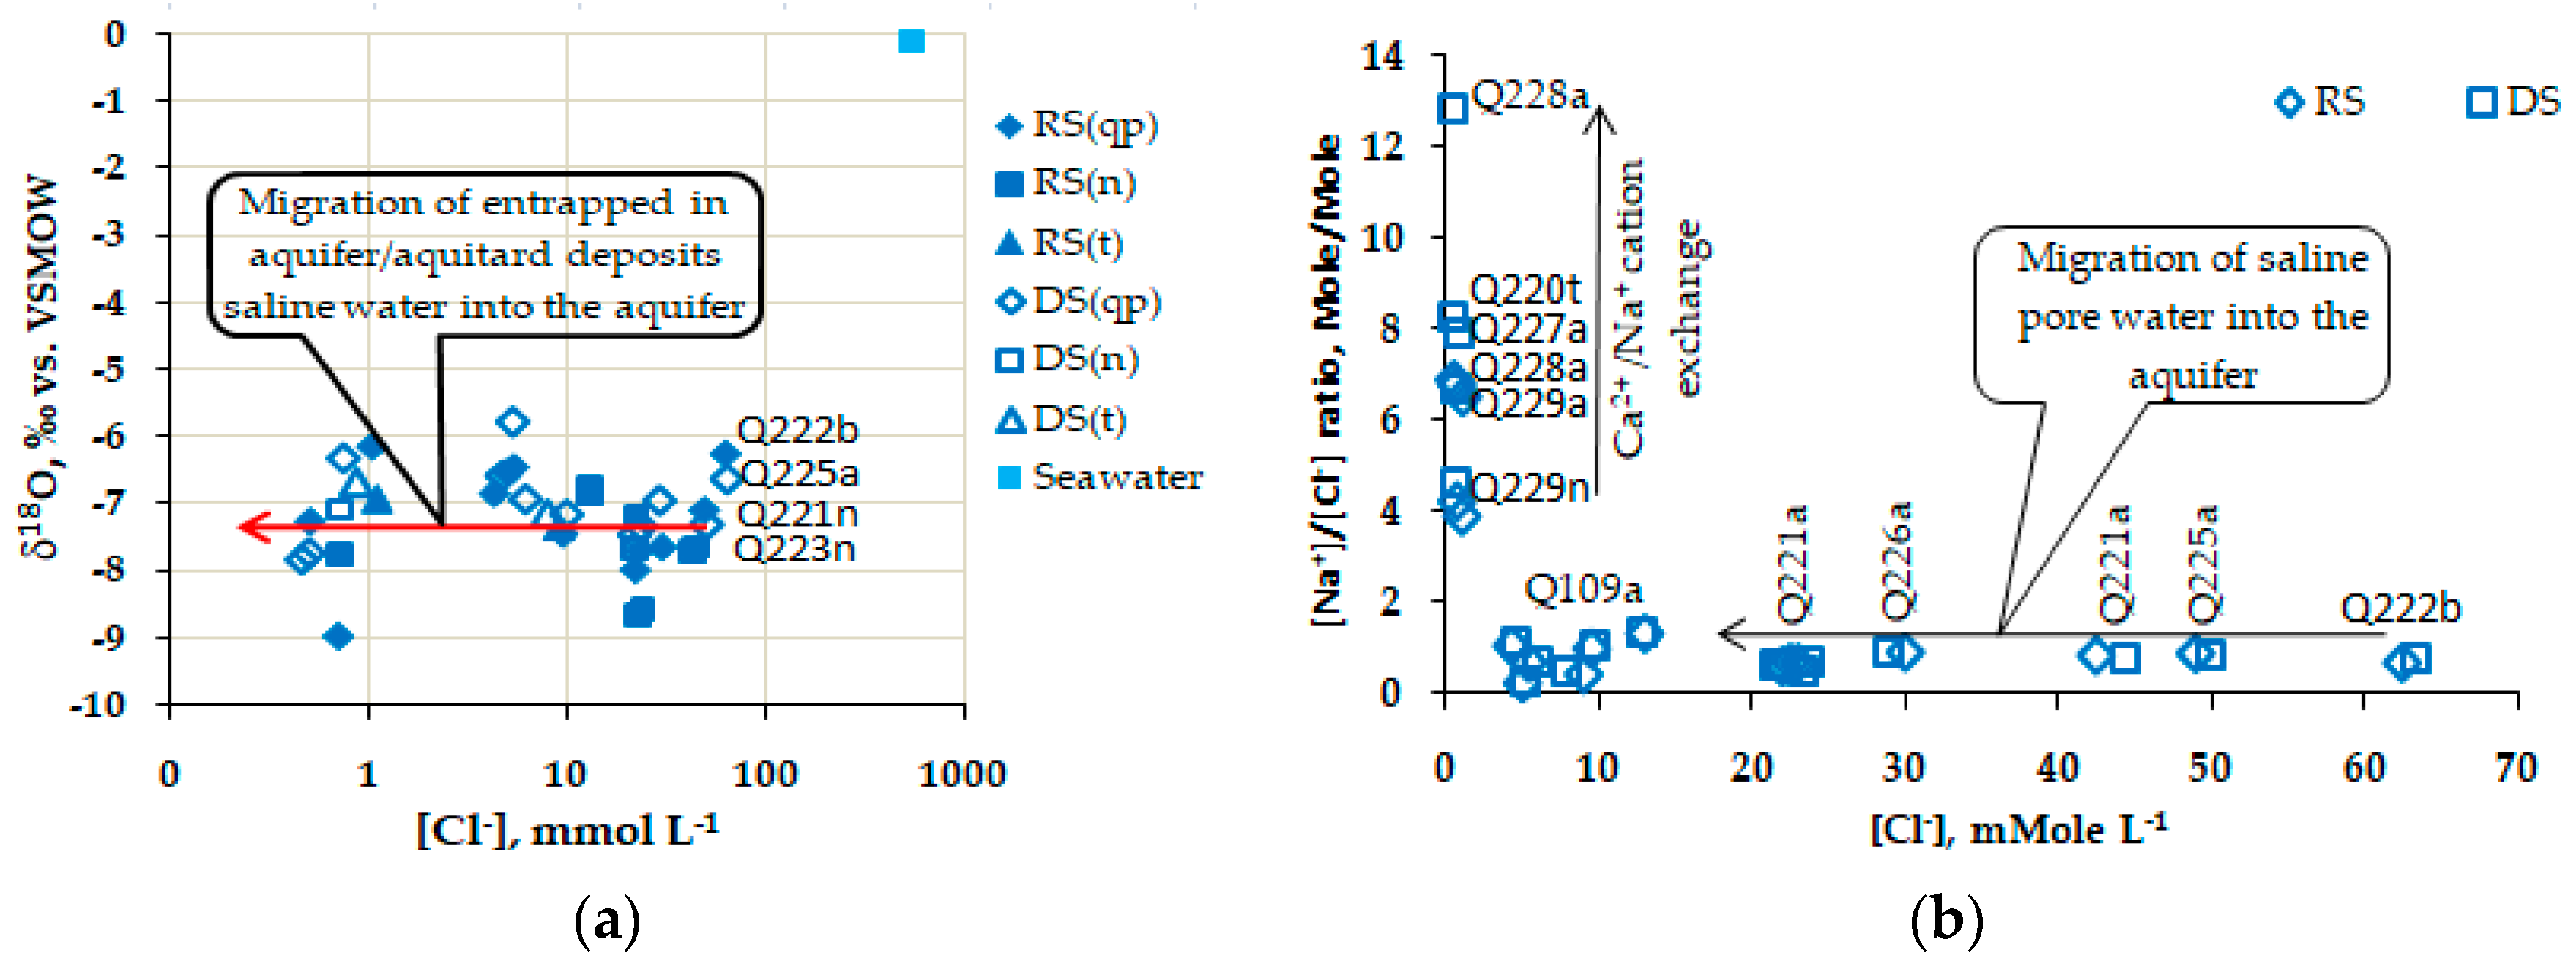
Groundwater in Pleistocene and Neogene aquifers in the NE area is brackish and saline. The EC and [Cl−] in water from boreholes Q221a, Q222b, Q224a, Q225a, Q226a, Q221n, Q223n and Q226n range from 2540 to 6980 µS cm−1 and from 22 to 63 mmol L−1, respectively, in the RS and DS (Table S2). The high salinity and chloride concentration in groundwater of Pleistocene and Neogene aquifers in the NE area could not be explained by recharge of saline water from Holocene aquifer or salt intrusion neither through the River’s bank nor the Ghyben-Herzberg mechanism like in the case of Holocene aquifer aforesaid. It was revealed that the relationships of the δ18O vs. [Cl−] as well as the molar [Na+] to [Cl−] ratio vs. [Cl−] for groundwater in Pleistocene and Neogene aquifers within entire study region do not reflect a conservative mixing character of fresh and seawater (Figure 8a,b).
Non-parametric z-test was applied to examine hydraulic interaction between groundwater in Holocene and Pleistocene aquifers in the study region. For the test, the mean δ18O and its standard deviation in water from Holocene and Pleistocene aquifers were used as variables. It was revealed that mean of δ18O in water from Holocene aquifer, −(4.78 ± 1.08)‰, n =15, was very significant different from that in water of Pleistocene aquifer −(7.21 ± 0.62)‰, n = 12, as z = 7.05 (in RS) and 8.49 (in DS) > z-critical = 2.58 at α = 0.01. This indicates a fact that water from Holocene aquifer does not recharge Pleistocene aquifer.
As seen from Figure 8a, the δ18O in groundwater of Pleistocene, Neogene and Triassic aquifers vary within a narrow range of −(7.26 ± 0.76)‰, n =17,whilst chloride concentration in water does within a wide range, from 22 mmol L−1 (Q221a) up to 63 mmol L−1 (Q222b). By definition (Equation (2)), δ18O for seawater should be close to 0‰, therefore if seawater intruded to Pleistocene and Neogene aquifers then the heavy oxygen isotope content in water of those aquifers must be enriched more than −(7.26 ± 0.76)‰.On the other hand, results presented in Figure 4b show the mixing character of young age precipitation with paleo-water in Q221n, Q223n, Q222b, Q224a, Q226n, Q227n having enriched oxygen-18 signature (Figure 4b). The trend of water line for deep aquifers (Figure 4b) is similar to those that was observed for groundwater in Qatar city [44]. Here, the paleo-water must be understood as groundwater having an old age, up to several thousand years. In fact, it was found that the age of water in Pleistocene and Neogene aquifers, e.g., water in Q221a, Q222b, Q224a, Q225a, Q228a, Q221n, Q223n and Q226n boreholes, was from 6 to 14.5 ka old (Table S1, see Figure 3 for locations), i.e., the age of the middle and early Holocene.
Data in Table S2 showed molar [Ca2+] to [Mg2+] ratio in water of Pleistocene and Neogene aquifers in NE area (Q221a, Q222b, Q224a, Q226a, Q227a, Q223n boreholes, see Figure 3 for locations), in both RS and DS, to vary within a range of (0.60 ± 0.05), n = 9, which is 3 times higher than that ratio characterizing for seawater of around 0.2. It seems that groundwater in deep aquifers in that area is freshening. This freshening process would cause dead marine flora and fauna in the aquifer deposits to mineralize making molar [Br−] to [Cl−] ratio in water of Pleistocene and Neogene aquifers in NE area to be higher than those ratio in seawater. Calculation showed that the molar [Br−] to [Cl−] ratio for water in Pleistocene and Neogene aquifers in NE area was (2.4 ± 0.5) × 10−3 (n = 9) that was higher than that ratio representing for seawater of around 1.5 × 10⁻³.
All results presented suggest that brackish and saline waters in Pleistocene and Neogene aquifers in NE area originated from entrapped in aquifer and/or aquitard deposits saline pore water which existed since Holocene transgression as it was also pointed out by [3,5,6,7]. High salinity in groundwater of deep aquifers in NE area (Q221a, Q222b, Q225a, Q226a) associated with molar [Na+] to [Cl−] ratios varying within the range of seawater (0.73 ± 0.14) (Figure 8b) probably indicates that the migration rate of saline water from the aquifer/aquitard deposits was over the rate of submarine discharge. The rate of the two processes apparently depends upon hydraulic conductivity of both aquifer and aquitard deposits.
Recently, it has been documented that the hydraulic properties and thickness of the aquitard in the Quaternary Red River Delta plain control recharge and leaching of saline water into Pleistocene aquifer [45]. Results from the simulation work of Larsen et al., [45] allow one to assume that permeability of clayey aquitard in the NE area was higher than that in the SW area. This made the diffusion rate of saline water from the aquitard to Pleistocene aquifer in latter area to be insignificant compared to the rate of the submarine discharge flow, hence groundwater in Pleistocene aquifer of the SW area became fresh today.
Groundwater of Pleistocene and Neogene aquifers in SW area have low EC and [Cl−], except for water from borehole Q109b. Groundwater in Q92, Q108b, Q110a, Q227a, Q228a and Q229a boreholes (see Figure 3 for the locations) has EC < 1000 µS cm−1 and [Cl−] < 7 mmol L−1. The salinity of groundwater around borehole Q109bresults from brackish water in the NE flowing to production well field located in proximity of the borehole, due to the high mining rate of fresh water from Pleistocene aquifer. This was evident from Figure 1 and Table 1 that the isolines of water hydraulic head in Pleistocene aquifer were lowdown from −2 m above sea level (asl) in the area close to the Red River to −8 masl in area around Q109b borehole.
4.2. Recharge Area, Flow Direction and Flow Rate of Groundwater in the Southern Part of the Red River’s Delta Plain
The recharge to aquifers in the southern part of the Red River’s Delta plain is from mountainous areas around GV01 point (Figure 1), where the water isotopic composition is close to that of recent precipitation, 14C-content is modern and tritium activity is in the range of 2–3 TU that prevails in the RRDP surface water (Table S1). There is no recharge to Pleistocene aquifer through the thick Holocene clays, as indicated by high salinity profiles in these clays as well as z-test for mean δ18O in groundwater of Pleistocene and Holocene aquifers that was discussed in previous section.
Mean value of δ18O in groundwater of Pleistocene and Neogene aquifers in study region was −7.25‰ vs. VSMOW (Table S1), whereas average δ18O in precipitation over the RRDP was −8.40‰ vs. VSMOW ([40] and Figure 4a, b). Thus, the difference of mean δ18O in groundwater of Pleistocene and Neogene aquifers and those in precipitation over the region was −1.15‰ vs. VSMOW. Considering an altitude gradient of −0.3‰ per each 100m rise [14,18], the recharge area to Pleistocene and Neogene aquifers in study region was supposed to be a region at about 380m higher than aquifer altitude or around 150 m above sea level. This area should correspond to the northwest extension of the region and outcrops in Ninh Binh province, i.e., an area around the GV01 point, where the elevation is from 140 to 160m above sea level (Figure 1 and Figure 5).
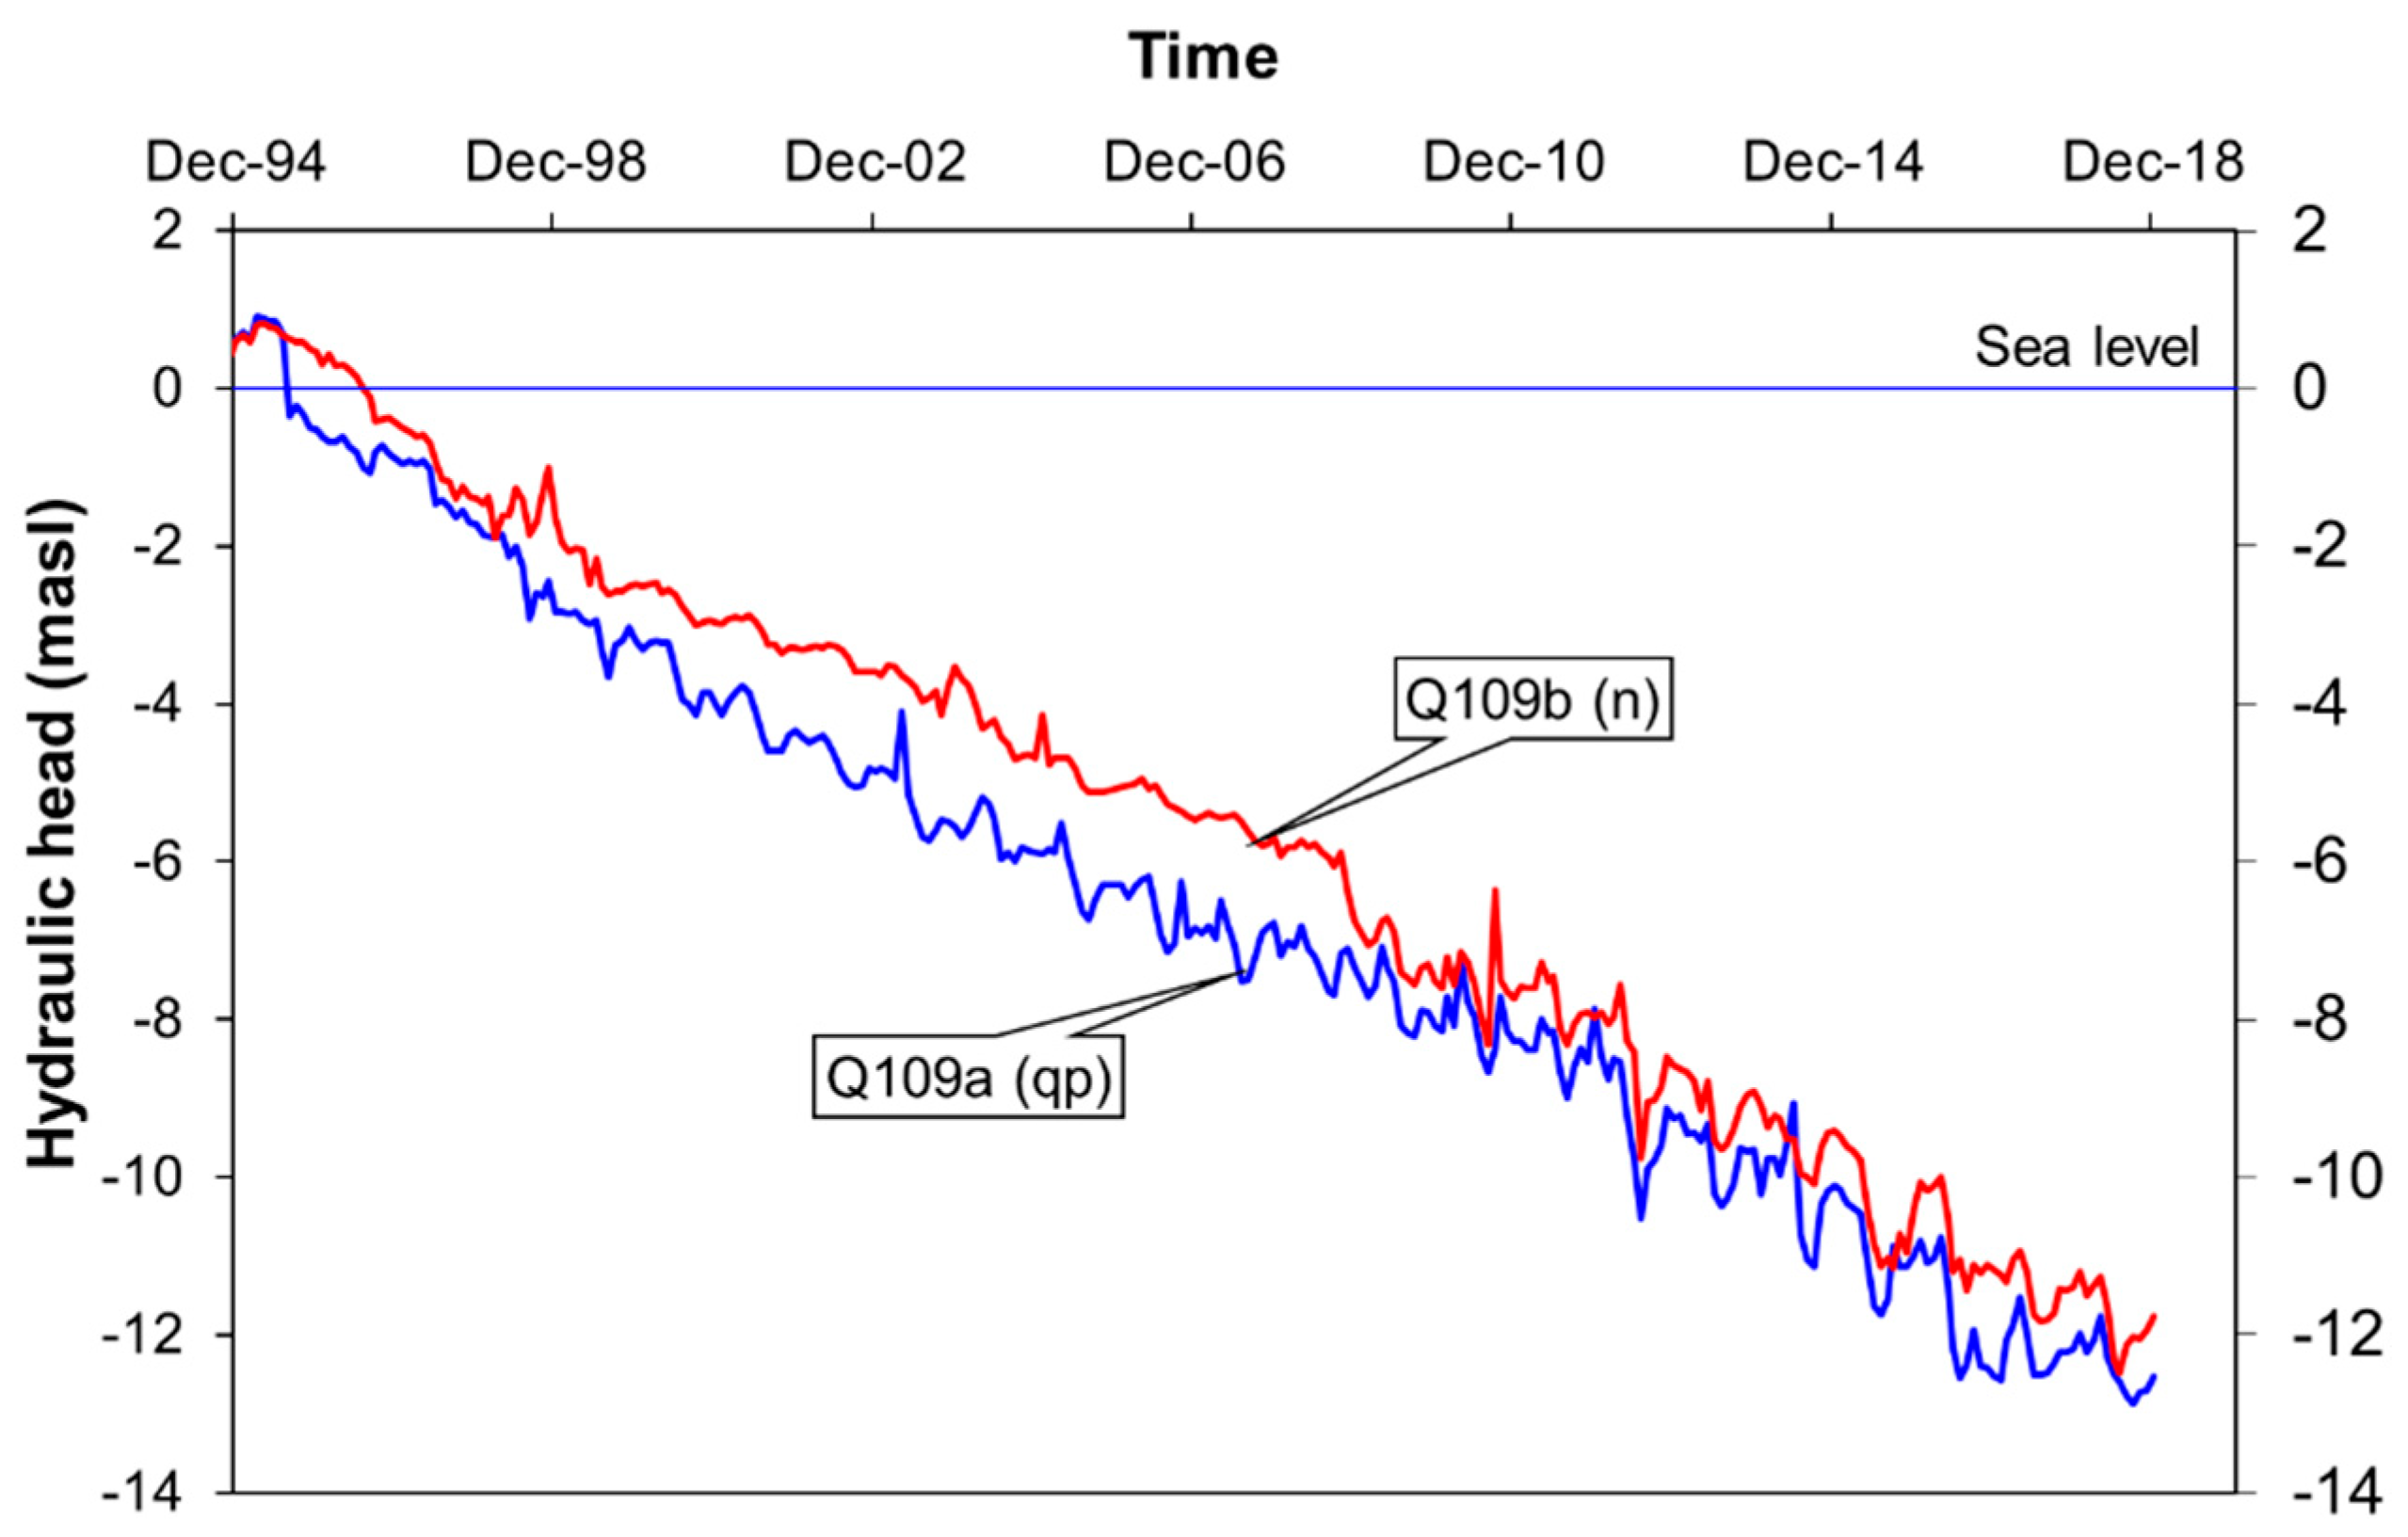
A non-parametric, Mann-Whitney or z-test using δ18O as variable was revealed that mean of δ18O in water from Pleistocene aquifer was not different from that in water in Neogene and Triassic aquifers, z = 0.75 < z-critical = 1.96 at α = 0.05. This implies that water in Pleistocene aquifer connected with those in Neogene and Triassic aquifers and vice versa. This was termed as the inter-aquifer leakage. The inter-aquifer leakage of water between deep aquifers in this case was proven by the water line depicted in Figure 4b where the isotopic compositions of groundwater from Pleistocene, Neogene and Triassic aquifers positioned along a line characterized for mixing paleo-water of old age with recent precipitation. In addition, it was observed that hydraulic head of water in Neogene aquifer was always higher than that in Pleistocene aquifer (Table 1). As an example, Figure 9 shows the comparison of hydraulic heads of water in Q109b and Q109a boreholes installed, respectively, in Neogene and Pleistocene aquifer. Water levels in boreholes 109b and 109a were consecutively monitored during the time from December 1994 to December 2018. It was clear that water level in Neogene aquifer all time was higher than that in Pleistocene aquifer, though production well field is located in proximity to those boreholes (Figure 9). This provides another evidence for Pleistocene-Neogene inter-aquifer connection. The inter-aquifer leakage of groundwater in the study region is possible because of the existence of faults and fissures in the basement rock as it was mentioned early.
Based on the results of the 14C-dating, a conceptual model of groundwater flow in Pleistocene and Neogene aquifers was suggested, as depicted in Figure 5. As seen in Figure 5, recharge water in study region flows from northwesterly towards southeasterly to the sea, which is in phase with [3] statement. From Figure 5 one can see also that groundwater from Neogene and Triassic aquifers is leaking upwards to Pleistocene aquifer making the age of water in the upper aquifer to be older than that of water in the lower aquifers because the leakage needs time to travel from one to another aquifer.
The yield of fresh water mining in recent years in the center of region, in Nam Dinh city, was reportedly to be as high as 95,000 m3 a day [46] that seems to be over rate of recharge that caused not only inter-aquifer leakage but also could cause backwards flowing of sea water from seaside to well field. Water in borehole Q110 in seaside tapped from Pleistocene aquifer has a 14C-age of 6 ka, almost two times younger than the age (11.3 ka) of water in borehole Q109a installed in proximity of well field (Figure 3). Apparently, in SW area seawater is currently intruding into deeper aquifers according to the Ghyben-Herzberg rule making the age of water in boreholes installed at proximity to sea coast to be younger than those inland. Modeling with the use of a MODFLOW model confirmed the scenario [47].
It should be noted, that EC of water in borehole Q110 was 825 µS cm−1, which was lower than EC found in the water from boreholes Q109a and Q92a(see Figure 3 for locations) being around 1100 µS cm−1 (Table S2). This implies that saline water in boreholes Q109a and Q92a was not only from the sea but also coming from NE. Results from water head measurements confirmed three flow directions of groundwater in study region. The isolines of water head measured for Pleistocene aquifer are depicted in Figure 1. The descent of hydraulic water head delineates direction of water flow. As seen from Figure 1, groundwater in study region flows from northwesterly towards southeasterly to the sea, northeasterly towards southwesterly and from the seaside to the production well field in proximity to borehole Q109 as shown by the white arrows (Figure 1).
The ineluctable consequence from current over-extraction rate of fresh groundwater in region is that good quality water in the deep aquifers could be under the threat of salt intrusion in future.
Assuming the recharge area is in the highlands around the GV01 point then one can estimate the mean flow rate based on the transit time and distance between recharge area and sampling point. The recharge rate to Neogene aquifer of borehole Q221n was estimated to be as high as 2.5 m a year with a 30 km distance from the recharge area and a water age of 11.3 ka.
4.3. Chemistry of Groundwater in the Southern Part of the Red River’s Delta Plain
Sulphate and nitrate ions were found to be in low concentrations in groundwater of Holocene aquifer whilst concentrations of ferrous and ammonia ions were in an elevated range, of up to 0.85 mmol L−1 and 5.0 mmol L−1, respectively (in borehole OB-02 in the RS, Table S2). The [Fe2+] ion found in groundwater tapped from Holocene aquifer in both RS and DS seems to correlate with concentrations of NH4+ ion, though R2 ~ 0.4 (figure not shown here), suggesting that reduction of iron-oxyhydroxide by organic matters is on-going in Holocene aquifer as shown by reaction (13).
CH2O + 4FeOOH + 7H+ → 4Fe2+ + HCO3− + 6H2O
The relatively weak correlation between [Fe2+] and [NH4+] is probably due to the influence of an additional amount of ammonia generated from biological reduction of nitrate in the aquifer that proceeds following reaction (14) making concentration of nitrate in water to be reduced:
NO3− + 10H+ + enzyme → NH4+ + 3H2O
In addition, it was found that [Fe2+] ions in groundwater of Holocene aquifer were not correlated with [HCO3−], i.e., reaction (13) seemingly does not proceed in aquifer. However, there would be several processes which could make the correlation of [Fe2+] vs. [HCO3−] in water to be pure. These could be ferrous ions formed are either adsorbing onto aquifer deposits or precipitating as siderite or pyrite. Table 3 presents saturation indices (SI) of several minerals possibly existed in aquifer deposits of Holocene age for RS. In DS absolute values of SI for all the minerals were a little bit changed, but the trend of dissolution/precipitation of the minerals in groundwater was the same. Unfortunately, in this study concentrations of sulphide in groundwater were not analyzed so that SI for pyrite was not be able to calculate, however water from Holocene aquifer strongly smelled with H2S. It was believed that pyrite is precipitating also.
As seen in Table 3, gypsum in all sampling sites is undersaturated suggesting dissolution of the mineral is on-going. Calcite and aragonite in 8 out of 16 sampling points are dissolving (Sicc < 0 and SIarag < 0), dolomite and siderite in most sampling points are precipitating (SIdol > 0, SIsid > 0), excepted for the case of borehole OB-09 in which deposit was pure sandy as it was discussed previously. Thus, siderite’s precipitation is one of the reasons why the concentrations of ferrous ions in groundwater of Holocene aquifer werepurely correlated with those of bicarbonate.
Depletion of δ13Cin DIC as it was checked for DICin water of OB-08 (−17.27‰ vs. VPDB, Table S1) partly proved the mineralization of organic matters by goethite (reaction 13) is occurring in Holocene aquifer, as it was well known that organic matters originated from C3 plants in the tropical regions like Vietnam do haveδ13C ranging from −20‰ to −27‰ vs. VPDB [36].
Low concentration of sulphate in groundwater samples could be explained by its reduction with organic matters following reaction (15):
2CH2O + SO42− → H2S + 2HCO3− → H+ + HS− + 2HCO3− → 2H+ + S2− + 2HCO3−
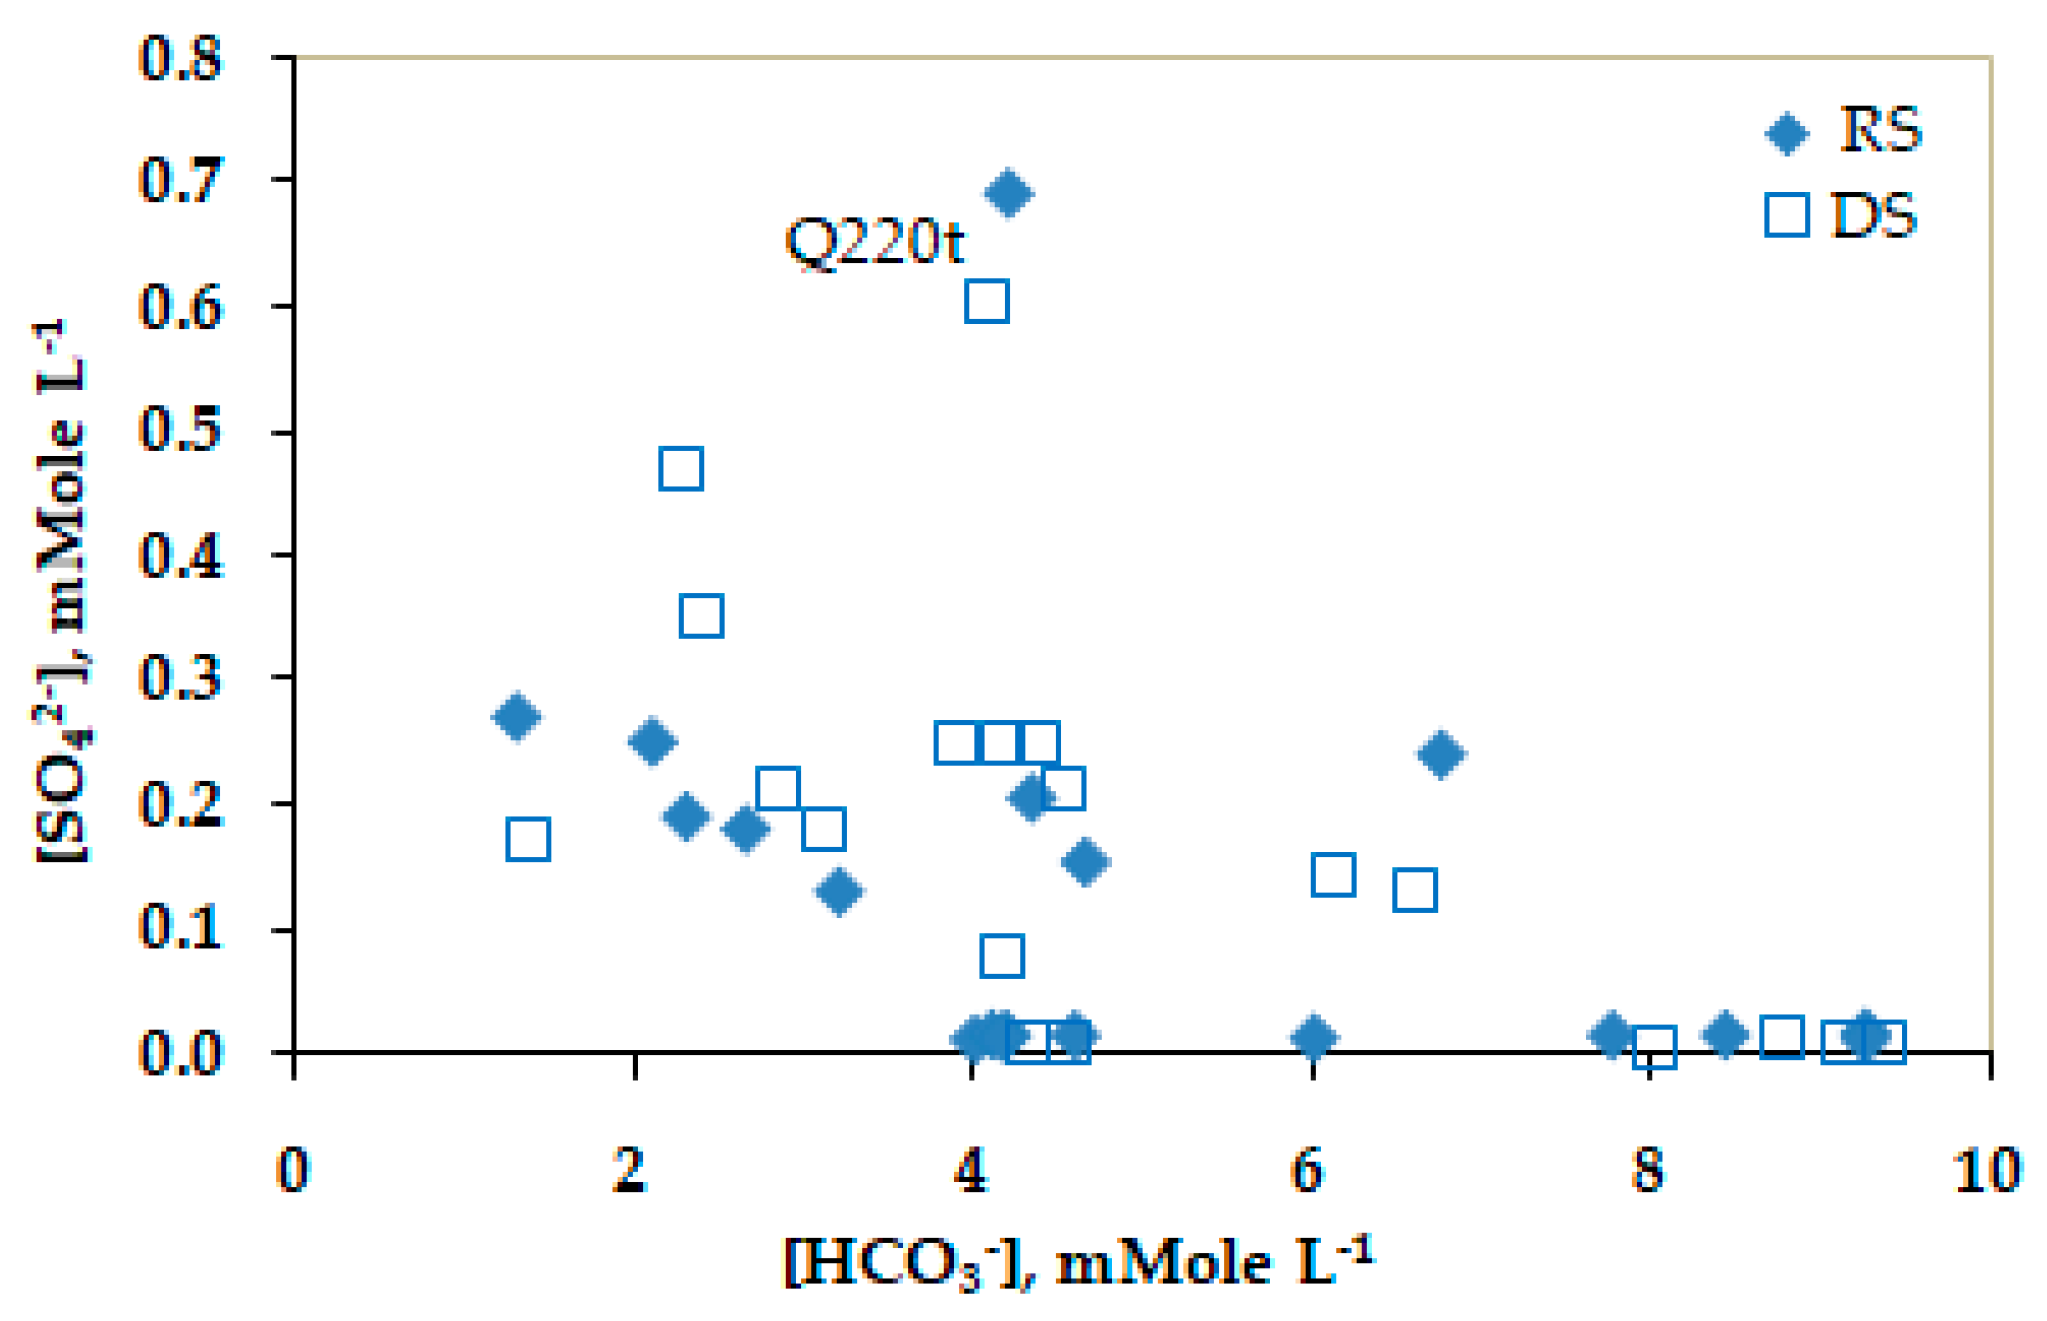
The reduction of sulphate occurred not only in Holocene aquifer but also in Pleistocene one. It was revealed that [SO42−] correlated with [HCO3−] for both aquifers as shown in Figure 10. As seen from Figure 10 the higher [HCO3−] the lower [SO42−] in groundwater. Here, one can see that the gained [HCO3−] were not equivalent to the lost [SO42−], but it is understood because bicarbonate could be formed from other routes, e.g., from reaction (13) or dissolution of calcite, aragonite and dolomite minerals presented in aquifers’ deposits.
Results presented in Table S2 show that the [Ca2+, meq L−1] to [Na+, meq L−1] ratio for water in Pleistocene and Neogene aquifers in study region ranged from 0.01 to 0.57, which is much lower compared to that ratio for water in borehole GV01 where groundwater is purely fresh and of Ca-HCO3 type for which the equivalent [Ca2+] to [Na+] ratio was 28. This finding combined with the results presented in Figure 8b suggests that cation exchange between calcium ions in groundwater and sodium ions adsorbed on sediment’s surface [36]. Figure 8b shows the molar [Na+] to [Cl−] ratio in water from boreholes Q227a, Q228a, Q229a and Q229n be much higher than 0.8, the value representing seawater. This indicates the excess of sodium over chloride concentration that is due to the release of sodium from aquifers sediment by Ca2+/Na+ exchange as it was explained by otherresearchers, e.g., [48]. However, it could be happened, that the weathering of silicate minerals releasesboth sodium and calcium but calcium ions would tie up in calciteand other precipitating carbonate minerals in the system, so that [Na+] in water increased whilst [Ca2+] decreased resulting in increase of [Na+]/[Ca2+] ratio in water. Calculation with the results presented in Table S2 showed that all calcite, aragonite and dolomite in deposits around boreholesQ227a, Q228a, Q229a and Q229n are dissolving as it was shown in Table 4. This is evident for the fact, that Ca2+ ions are not lost from the systemof those boreholes.
It was revealed that concentrations of ferrous ions in water of Pleistocene, Neogene aquifers are inversely correlated with δ13C in DIC as shown in Figure 11. This suggests that reduction of goethite by organic matters (reaction 13) is also occurring in these aquifers.
Results in Table 4 showed that calcite and aragonite in most sampling points are dissolving as Sicc< 0 and SIarag< 0. Consideringδ13C in DIC originated from mineralization of organic matters of C3 plants be −23‰, δ13C in DIC resulted from carbonates mineralization be −1.5‰ for the region, andaverage δ13C in DIC of water samples be −12.5‰ (Figure 11), one could estimate the contribution ofinorganic carbonateto DICin water samples to be as high as around 50% based on binary mixing model.
5. Conclusions
Data of water isotopic compositions in groundwater in southern part of the Red River’s Delta plain show that water in shallow Holocene aquifer is saline of Na-Cl type and currently affected by saltwater intrusion. Groundwater in deep Pleistocene, Neogene and Triassic aquifers of SW area is fresh, however that occurring across the NE region is brackish. Higher salinity of groundwater from deep aquifers of NE is due to migration of entrapped saline pore water from aquifer and/or aquitard deposits to aquifers. The hydro-geochemistry of the region is controlled by reduction of sulphate and iron-oxyhydroxide by organic matters and dissolution of inorganic carbonate minerals in aquifer sediments. Groundwater in deep aquifers of the study region is originated from meteoric water. The recharge area of deep aquifers is the northwest extension of the study region, at an altitude of 140-160m above sea level and water flows from northwesterly towards southeasterly to the sea coast at a rate of 2.5 m year−1.
The extraction rate of fresh water from Pleistocene aquifer was over its recharge rate, thus leading to inter-aquifer leakage of water from Neogene and Triassic aquifers to Pleistocene aquifer through faults and fissures in the basement formation. At the same time, the over rate of freshwater mining from Pleistocene causes saline water from the seaside to flow backwards to the production well field that deteriorates the quality of drinking water supplied to local population. Therefore, it is highly advisable that a short-term appropriate strategy for groundwater management in the region is developed and implemented in order to avoid the threat of saltwater intrusion. The most effective measure for preventing seawater intrusion at present is control over groundwater mining at a rate not exceeding current production yield of 95,000 m3 day−1.
Supplementary Materials
The following are available online at https://www.mdpi.com/2073-4441/11/10/2120/s1, Table S1: Water isotopic compositions in water and carbon-13 in DIC and 14C-age of water samples under the study, Table S2: Chemistry of water samples under the study.
Author Contributions
Project administration, conceptualization, review: N.V.L.; software, validation, writing: H.V.H.; Methodology, analysis, writing-review and editing: D.D.N.
Funding
This research is funded by the Vietnam National Foundation for Science and Technology Development (NAFOSTED) under grant number 105.99-2014.19.
Acknowledgments
The authors would like to express their sincere thanks to anonymous reviewers for their helpful comments and review of the manuscript.
Conflicts of Interest
The authors declare no conflict of interest.
References
- Frenken, K. (Ed.) Irrigation in Southern and Eastern Asia in Figures; Food and Agriculture Organization of the United Nations (FAO) Report No. 37; FAO: Rome, Italy, 2007. [Google Scholar]
- Le, V.H.; Bui, H.; Chau, V.Q.; Dang, H.O.; Le, H.H.; Nguyen, T.T.; Tran, M. Groundwater in the Bac Bo Plain (North Vietnam); A Technical Report to the General Department of Geology and Minerals of Viet Nam; Ministry of Natural Resources and Environment: Hanoi, Vietnam, 2000; 153p. (In Vietnamese)
- Bui, D.D.; Kawamura, A.; Tong, N.T.; Amaguchi, H.; Nakagawa, N.; Iseri, Y. Identification of aquifer system in the whole Red River Delta. Vietnam Geosci. J. 2011, 15, 323–338. [Google Scholar] [CrossRef]
- Hoang, H.V. Saltwater Intrusion in Quaternary Sediment in Nam Dinh Area. Ph.D. Thesis, Hanoi University of Mining and Geology, Hanoi, Vietnam, 5 September 2014. (In Vietnamese). [Google Scholar]
- Tran, L.T.; Larsen, F.; Pham, N.Q.; Christiansen, A.V.; Tran, N.; Vu, H.V.; Tran, L.V.; Hoang, H.V.; Hinsby, K. Origin and extent of fresh groundwater, salty paleowaters and recent saltwater intrusions in the Red River flood plain aquifers, Vietnam. Hydrogeol. J. 2012, 20, 1295–1313. [Google Scholar] [CrossRef]
- Nguyen, T.T.; Kawamura, A.; Tong, N.T.; Nakagawa, N.; Amaguchi, H.; Gilbuena, R., Jr. Hydrogeochemical characteristics of groundwater from the two aquifers in the Red River Delta, Vietnam. J. Asian Earth Sci. 2014, 93, 180–192. [Google Scholar] [CrossRef]
- Nguyen, T.T.; Kawamura, A.; Tong, N.T.; Nakagawa, N.; Amaguchi, H.; Gilbuena, R., Jr. Clustering spatio-seasonal hydrogeochemical data using self-organizing maps for groundwater quality assessment in the Red River Delta, Vietnam. J. Hydrol. 2015, 522, 661–673. [Google Scholar] [CrossRef]
- Nam Dinh Province Statistical Office (NDPSO) Area and Population of the Province. 2018. Available online: http://www.gso.gov.vn (accessed on 10 June 2019).
- Nguyen, D.N.; Nguyen, T.H. Climate and Climate Resources in Vietnam; Agriculture Publishing House: Ha Noi, Vietnam, 2004; 210p. (In Vietnamese) [Google Scholar]
- Tanabe, S.; Hori, K.; Saito, Y.; Haruyama, S.; Doanh, L.Q.; Sato, Y.; Hiraide, S. Sedimentary facies and radiocarbon dates of the Nam Dinh-1 core from the Song Hong (Red River) delta, Vietnam. J. Asian Earth Sci. 2003, 21, 503–513. [Google Scholar] [CrossRef]
- Kasbohm, J.; Grothe, S.; Le, T.L. Province Nam Dinh an Analysis for a Future Integrated Water Resource Management. 2013. Available online: http://www.idm.gov.vn (accessed on 15 June 2019).
- Luu, T.M.N.; Garnier, J.; Billen, G.; Orange, D.; Nemery, J.; Le, T.P.Q.; Tran, H.T.; Le, L.A. Hydrological regime and water budget of the Red River Delta (Northern Vietnam). J. Asian Earth Sci. 2010, 37, 219–228. [Google Scholar] [CrossRef]
- National Center for Monitoring the Hydrology in the Marine Coast (NCMH). The Hydrological Regime Along the Marine Coast, North Vietnam in the 2017 Year; Annual Report to the General Directorate of Meteorology and Hydrology of Vietnam; NCMH: Hanoi, Vietnam, 2017; 53p. (In Vietnamese)
- Erickson, E. Stable Isotopes and Tritium in Precipitation. Guidebook on Nuclear Techniques in Hydrology; IAEA Technical Report Series No. 91; IAEA: Vienna, Austria, 1983; pp. 19–33. [Google Scholar]
- Clark, I.D.; Fritz, P. Environmental Isotopes in Hydrology; Lewis Publisher: New York, NY, USA, 1997; 328p. [Google Scholar]
- Kalin, R.M. Radiocarbon dating of groundwater systems. In Environmental Tracers in Subsurface Hydrology; Cook, P.G., Herczeg, A.L., Eds.; Springer: Boston, MA, USA, 2000; pp. 57–68. [Google Scholar]
- Zhu, C. Estimate of recharge from radiocarbon dating of groundwater and numerical flow and transport modeling. Water Resour. Res. 2000, 36, 2607–2620. [Google Scholar] [CrossRef]
- MookW, G. (Ed.) Environmental Isotopes in the Hydrological Cycle. Principles and Applications; Volume II: Atmospheric Water; IAEA: Vienna, Austria, 2001; 288p. [Google Scholar]
- Glynn, P.D.; Plummer, L.N. Geochemistry and the understanding of groundwater systems. Hydrogeol. J. 2005, 13, 263–287. [Google Scholar] [CrossRef]
- Sánchez-Murillo, R.; Brooks, E.S.; Elliot, W.J.; Boll, J. Isotope hydrology and baseflow geochemistry in natural and human-altered watersheds in the Inland Pacific Northwest, USA. Isot. Environ. Health Stud. 2015, 51, 231–254. [Google Scholar] [CrossRef] [Green Version]
- Craig, H. Isotopic variation in meteoric water. Science 1961, 133, 1702–1703. [Google Scholar] [CrossRef]
- Stumm, W.; Morgan, J.J. Aquatic Chemistry, 2nd ed.; Wiley & Sons: New York, NY, USA, 1981; 780p. [Google Scholar]
- Stookey, L.L. Ferrozine—A new spectrophotometric reagent for iron. Anal. Chem. 1970, 42, 779–781. [Google Scholar] [CrossRef]
- International Atomic Energy Agency (IAEA). Water and Environment Newsletter of the Isotope Hydrology Section; International Atomic Energy Agency: Vienna, Austria, 2002; 8p. [Google Scholar]
- IsoPrime User’s Guide; Micromass UK Limited: Wemslow, UK, 2000; 18p.
- Villa, M.; Manjon, G. Low-level measurements of tritium in water. Appl. Radiat. Isot. 2004, 61, 319–323. [Google Scholar] [CrossRef] [PubMed]
- Plastino, W.; Chereji, I.; Cuna, S.; Kaihola, L.; de Felice, P.; Lupsa, N.; Balas, G.; Mirel, V.; Berdea, P.; Baciu, C. Tritium in water electrolytic enrichment and liquid scintillation counting. Radiat. Meas. 2007, 42, 68–73. [Google Scholar] [CrossRef]
- Groening, M.; Dargier, M.; Tatzber, H. Seventh IAEA Inter-Comparison of Low-Level Tritium Measurement in Water (TRIC-2004); International Atomic Energy Agency: Vienna, Austria, 2007; Available online: http://www-naweb.iaea.org/napc/ih/documents/IHL/TRIC/TRIC2004-Report.pdf (accessed on 15 June 2019).
- Groening, M.; Tatzber, H.; Trinkl, A.; Klaus, B.; van Duren, M. Eighth IAEA Inter-Comparison of Low-Level Tritium Measurement in Water (TRIC-2008); International Atomic Energy Agency: Vienna, Austria, 2009; Available online: http://www-naweb.iaea.org/napc/ih/documents/IHL/TRIC/TRIC2008-Report.pdf (accessed on 15 June 2019).
- Tamers, M.A. Chemical yield optimization of the benzene synthesis for radiocarbon dating. Int. J. Appl. Radiat. Isot. 1975, 26, 676–682. [Google Scholar] [CrossRef]
- Gupta, S.K.; Polach, H.A. Radiocarbon Dating Practices at ANU; Radiocarbon Laboratory, Research School of Pacific Studies, ANU: Canberra, Australia, 1985. [Google Scholar]
- Mann, W.B. An international reference material for radiocarbon dating. Radiocarbon 1983, 25, 519–522. [Google Scholar] [CrossRef]
- Salem, O.; Visser, J.M.; Deay, M.; Gonfiantini, R. Groundwater flow patterns in the western Lybian Arab Jamahitiya evaluated from isotope data. In Arid Zone Hydrology: Investigation with Isotope Techniques; IAEA: Vienna, Austria, 1980; pp. 165–179. [Google Scholar]
- Bigeleisen, C.T.; Mayer, M.G. Calculation of equilibrium constants for isotopic exchange reactions. J. Chem. Phys. 1947, 15, 261–270. [Google Scholar] [CrossRef]
- Mook, W.G.; Bommerson, J.C.; Staverman, W.H. Carbon isotope fractionation between dissolved and gaseous carbon dioxide. Earth Planet Sci. Lett. 1974, 22, 169–176. [Google Scholar] [CrossRef]
- Appelo, C.A.J.; Postma, D. Geochemistry, Groundwater and Pollution, 2nd ed.; A.A.Balkema Publisher: Amsterdam, The Netherlands, 2007; pp. 175, 226. [Google Scholar]
- Fontes, J.C.; Garnier, J.M. Determination of the initial activity of the total dissolved carbon: A review of the existing models and anew approach. Water Resour. Res. 1979, 12, 399–413. [Google Scholar] [CrossRef]
- Fontes, J.C. Dating of groundwater. Guidebook on Nuclear Techniques in Hydrology; IAEA Technical Report Series No. 91; IAEA: Vienna, Austria, 1983; pp. 285–317. [Google Scholar]
- Plummer, N.L.; Prestemon, E.C.; Parkhurst, D.L. An Interactive Code (NETPATH) for Modeling Net Geochemical Reactions along a Flow Path, version 2.0; US Geological Survey Water Resources Investigations Report 94–4169; USGS: Reston, VA, USA, 1994.
- Nhan, D.D.; Lieu, D.B.; Minh, D.A.; Anh, V.T. Isotopic Compositions of Precipitation Over Red River’s Delta Region (Vietnam): Data of the GNIP Hanoi. 2013. Available online: www.iaea/gnip (accessed on 15 March 2019).
- Babu, M.M.; Viswanadh, G.K.; Rao, S.V. Assessment of saltwater intrusion along coastal areas of Nellore District, A.P. Int. J. Sci. Eng. Res. 2013, 4, 173–178. [Google Scholar]
- Stiefel, J.M.; Melesse, A.M.; McClain, M.E.; René, M.P.; Anderson, E.P.; Chauhan, N.K. Effects of rainwater-harvesting induced artificial recharge on the groundwater of wells in Rajasthan, India. Hydrogeol. J. 2012, 17, 2061–2073. [Google Scholar] [CrossRef]
- Nguyen, V.H. Investigation into the Rainwater Recharge to the Holocene Aquifer in Hanoi Area by Using Isotopicand Related Techniques. Master’s Thesis, Hanoi University of Mining and Geology, Hanoi, Vietnam, 11 August 2009. (In Vietnamese). [Google Scholar]
- Yurtsever, Y.; Payne, B.R. Application of environmental isotopes to groundwater investigations in Qatar. Isot. Hydrol. 1979, 2, 465–490. [Google Scholar]
- Larsen, F.; Long, V.T.; Hoan, H.V.; Luu, T.T.; Christiansen, A.V.; Nhan, P.Q. Groundwater salinity influenced by Holocene seawater trapped in incised valleys in the Red River Delta plain. Nat. Geosci. 2017, 10, 376–381. [Google Scholar] [CrossRef]
- Doan, V.C. Investigation to Propose Criteria and Zones for Sustainable Exploitation and Protection of Groundwater Resources in the Red River’s (Bac Bo) and Mekong River’s (Nam Bo) Deltas; Final Report to the Ministry of Science and Technology of Vietnam) for a Research Program; Ministry of Sci. & Technol. of Vietnam: Hanoi, Vietnam, 2015; 277p. (In Vietnamese)
- Lindenmaier, F.; Bahls, R.; Wagner, F. Assessment of Groundwater Resources in Nam Dinh Province; Final Technical Report, Part B: Three Dimensional Structural and Numerical Modelling; Ministry of Natural Resources and Environment of Vietnam: Hanoi, Vietnam, 2011; 131p.
- Hoang, H.T.; Bäumle, R. Complex hydrochemical characteristics of the Middle-Upper Pleistocene aquifer in Soc Trang province, Southern Vietnam. Environ. Geochem. Health 2019, 41, 325–341. [Google Scholar] [CrossRef] [PubMed]
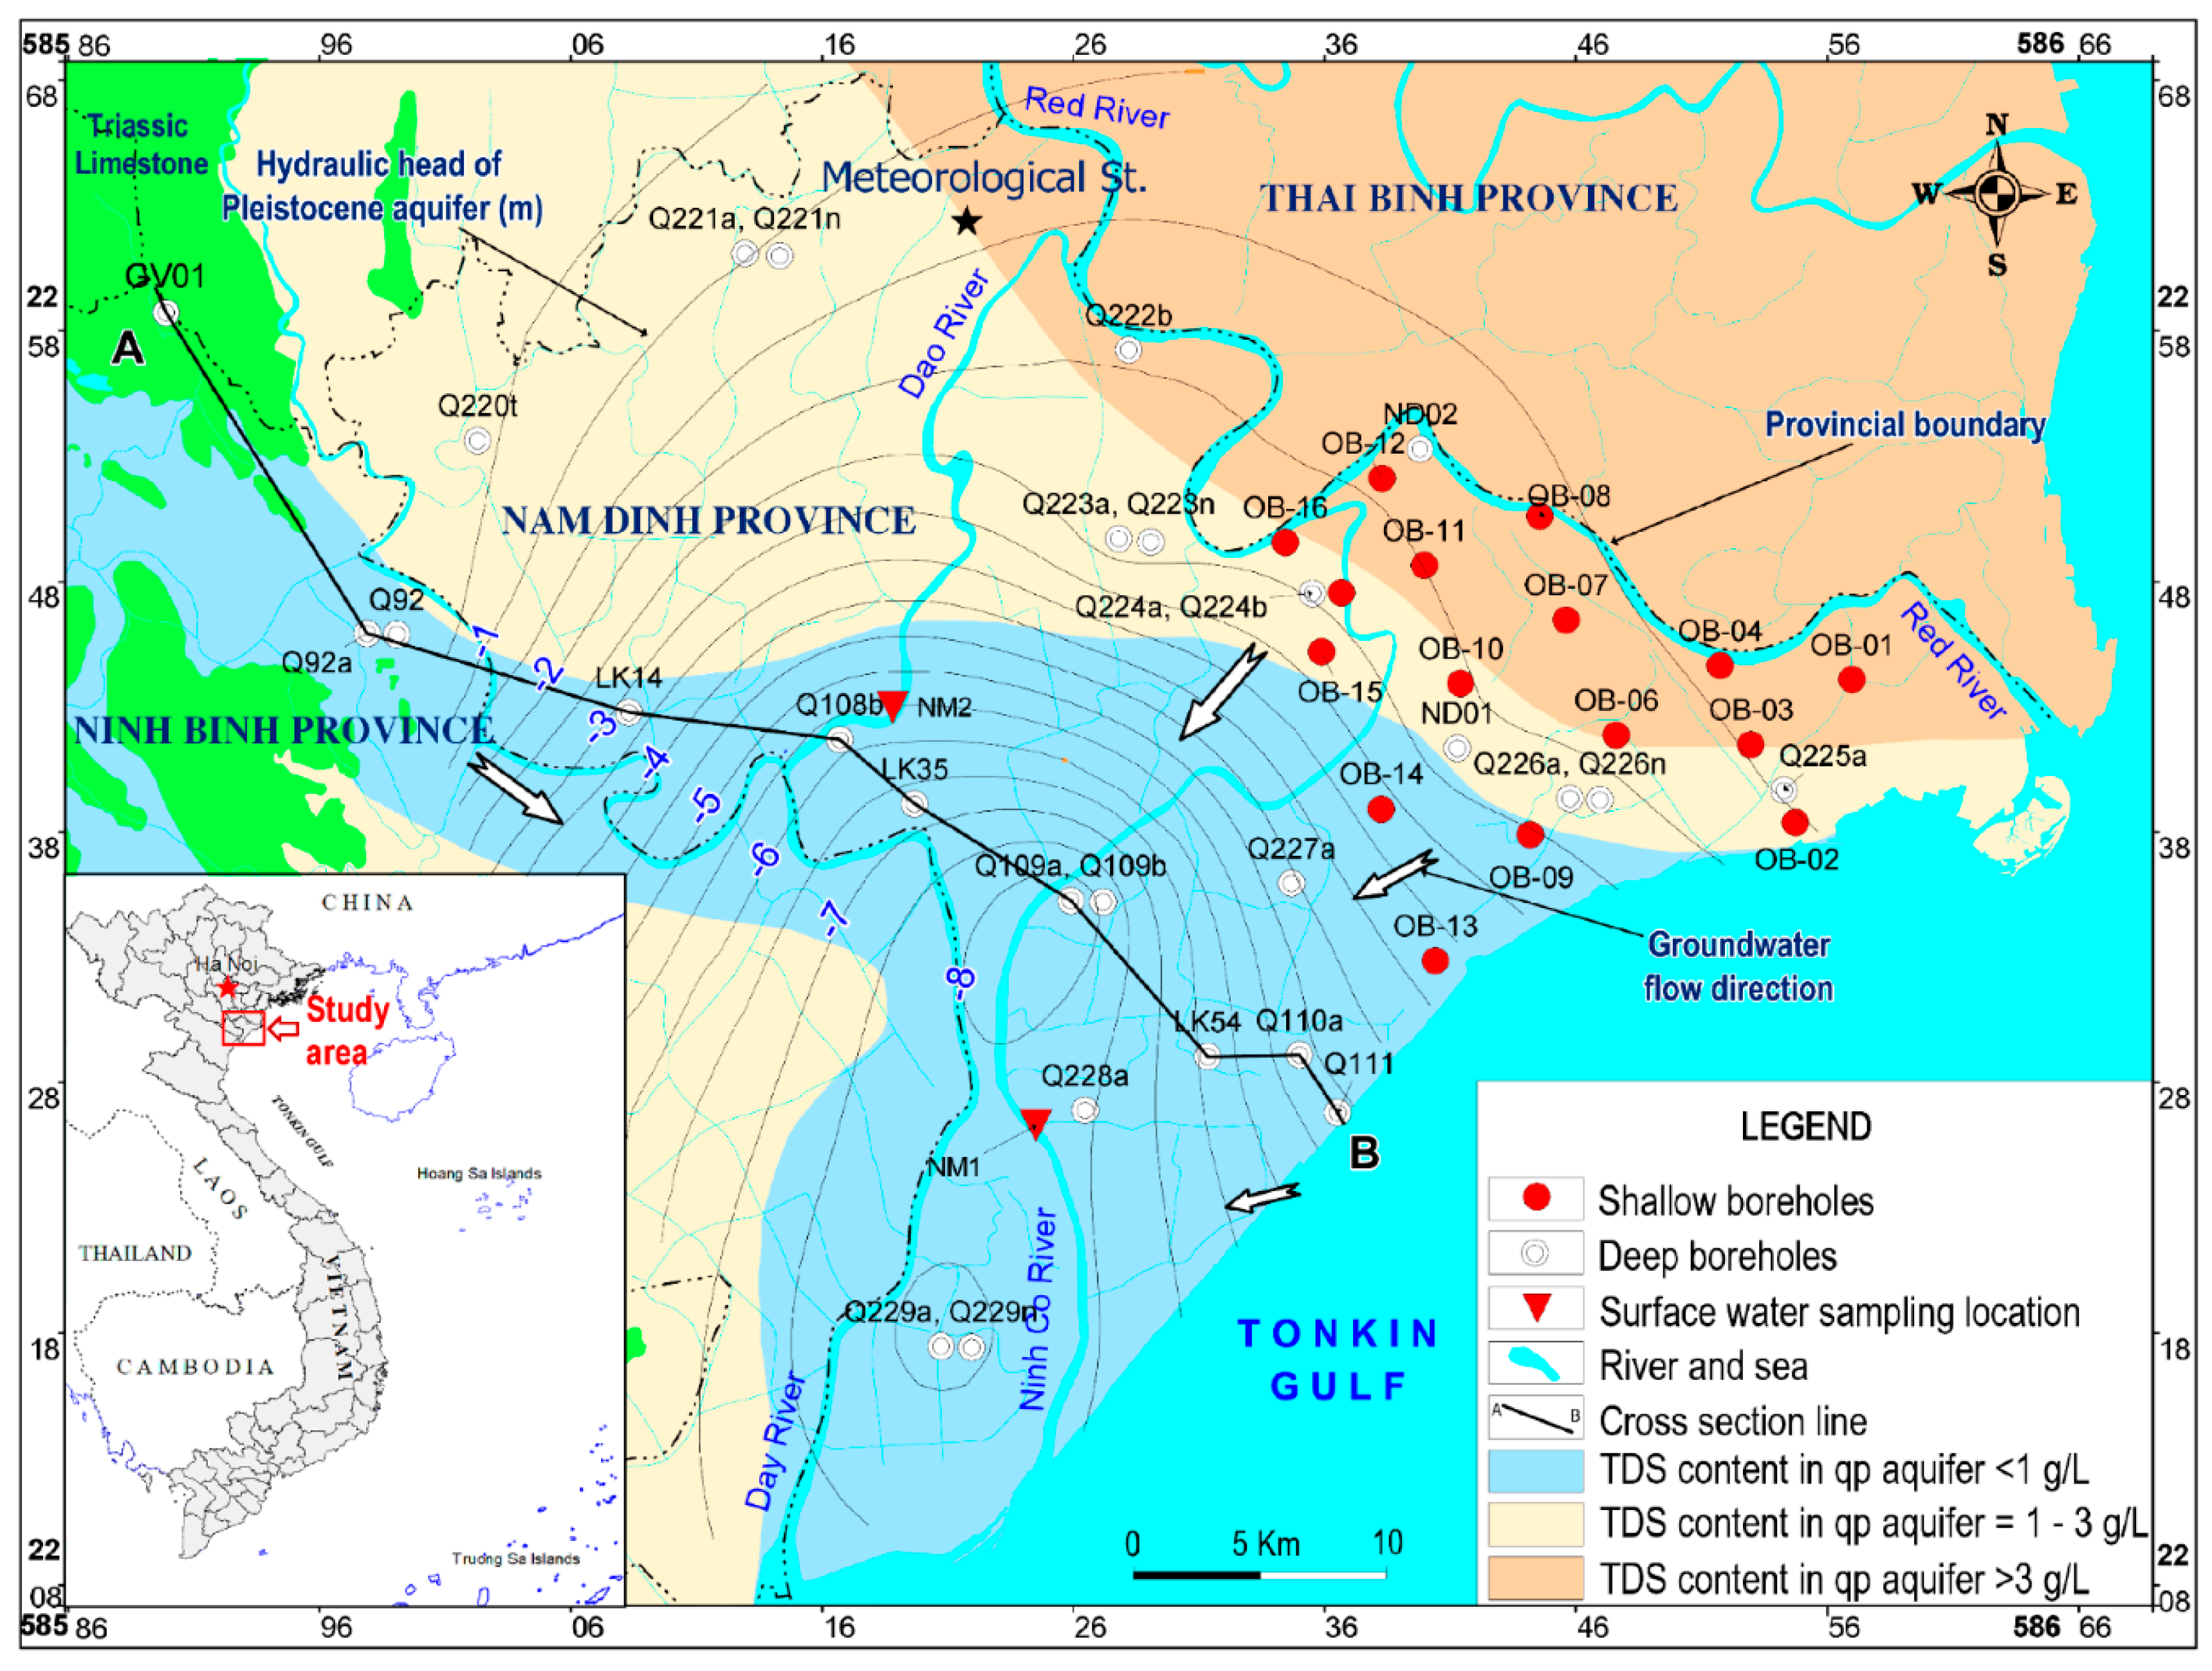
Figure 1.
Map showing the study site: southern part of the Red River’s Delta plain: Thai Binh, Nam Dinh, and Ninh Binh provinces; sampling locations for groundwater of Holocene aquifer (●points), surface water (▼points); saline-brackish-fresh water boundary; and isolines of water hydraulic head of groundwater in Pleistocene (qp) aquifer.

Figure 2.
Geological setting of the study region drawn for the transect AB. See explanations for the sequence of the geological formation in the text.
Figure 2.
Geological setting of the study region drawn for the transect AB. See explanations for the sequence of the geological formation in the text.

Figure 3.
Sampling locations of the groundwater from Pleistocene, Neogene and Triassic aquifers along with information related to boreholes and water in the boreholes. In the borehole information box: a: Borehole ID (Q stands for boreholes of the National Groundwater Monitoring Network with a sequence number in the Network; Characters a or b, n and t standing aside the borehole ID indicate the Pleistocene, Neogene and Triassic aquifers, respectively); b: borehole depth (meter from the ground surface); c: δ13C of DIC (‰); d: 14C content in DIC (pMC).

Figure 4.
Isotopic composition in regional precipitation along with that in water from Holocene (a) and Pleistocene (qp), Neogene (n) and Triassic (t) aquifers (b) of the study area during dry (DS) and rainy (RS) seasons.
Figure 4.
Isotopic composition in regional precipitation along with that in water from Holocene (a) and Pleistocene (qp), Neogene (n) and Triassic (t) aquifers (b) of the study area during dry (DS) and rainy (RS) seasons.

Figure 5.
14C-ages and conceptual model indicating flow directions of groundwater in Pleistocene, Neogene and Triassic aquifers in the study region.
Figure 5.
14C-ages and conceptual model indicating flow directions of groundwater in Pleistocene, Neogene and Triassic aquifers in the study region.

Figure 6.
Relationship between molar concentrations of Na+ and Cl− ions (a), and relationship between molar [Cl−] to [HCO3−] ratio and [Cl−] (b) for water tapped from Holocene aquifer indicating the influence of seawater to water in the shallow aquifer (the data for constructing graphs (a,b) were taken from Table S2).

Figure 7.
The δ18O vs. molar [Cl−] relationship for groundwater in Holocene aquifer in the study region representing a mixture of three end-members: local precipitation, Red River’s water and seawater (see Figure 1 for OB-09, OB-16, OB-02 and OB-13 locations).
Figure 7.
The δ18O vs. molar [Cl−] relationship for groundwater in Holocene aquifer in the study region representing a mixture of three end-members: local precipitation, Red River’s water and seawater (see Figure 1 for OB-09, OB-16, OB-02 and OB-13 locations).

Figure 8.
Relationships of δ18O vs. molar [Cl−] (a) and molar [Na+] to [Cl−] ratios vs. [Cl− (b) for groundwater in Pleistocene and Neogene aquifers within the study region showing the migration of entrapped in aquifer and/or aquitard deposits saline pore water to the recharge-fresh water (a) as well as the Ca2+/Na+ cation exchange that proceeds in the areas around the Q227a, Q228a and Q229a boreholes (b). (a) was drawn in semi-logarithmic scale (see Figure 3 for the boreholes locations).

Figure 9.
The hydraulic heads of groundwater in Pleistocene and Neogene that have been consecutively monitored in boreholes Q109a and Q109b since late 1994 indicating inter-aquifer leakage between the two aquifers due to over rate of freshwater mining from Pleistocene aquifer.
Figure 9.
The hydraulic heads of groundwater in Pleistocene and Neogene that have been consecutively monitored in boreholes Q109a and Q109b since late 1994 indicating inter-aquifer leakage between the two aquifers due to over rate of freshwater mining from Pleistocene aquifer.

Figure 10.
Scatter plot of molar [SO42−] vs. [HCO3−] for groundwater in both Holocene and Pleistocene aquifers showing the sulphate reduction led to lowering SO42− concentration in water.
Figure 10.
Scatter plot of molar [SO42−] vs. [HCO3−] for groundwater in both Holocene and Pleistocene aquifers showing the sulphate reduction led to lowering SO42− concentration in water.

Figure 11.
Scatter plot of δ13C vs. [Fe2+] for water in Pleistocene, Neogene and Triassic aquifers in the study region.
Figure 11.
Scatter plot of δ13C vs. [Fe2+] for water in Pleistocene, Neogene and Triassic aquifers in the study region.


Table 1.
Elevation of groundwater table in boreholes from those water samples were taken.
| Borehole | Depth, m bgs | Elevation of Water Table, m asl | Borehole | Depth, m bgs | Elevation of Water Table, m asl |
|---|---|---|---|---|---|
| Shallow Holocene Aquifer in NE Area | Deep Aquifers in NE Area | ||||
| OB-01 | 7.6 | 0.38 | Q223n | 138 | −1.94 |
| OB-02 | 8.5 | 0.34 | Q224a | 100 | −2.46 |
| OB-04 | 8.3 | 0.25 | Q225a | 110 | −1.45 |
| OB-06 | 6.7 | 0.26 | Q226a | 105 | −2.27 |
| OB-07 | 7.3 | 0.42 | Q226n | 151.5 | −2.25 |
| OB-08 | 8.1 | 0.40 | Q227a | 105.5 | −4.57 |
| OB-09 | 6.1 | 0.45 | Deep Aquifers in SW Area | ||
| OB-10 | 8.0 | 0.50 | GV01 | 70 | 94.5 |
| OB-11 | 7.8 | 0.57 | Q220t | 100 | 0.96 |
| OB-12 | 7.6 | 0.74 | Q92a | 43 | 0.50 |
| OB-13 | 6.7 | 0.52 | Q92t | 100 | 1.03 |
| OB-14 | 8.4 | 0.60 | Q108b | 80 | −5.89 |
| OB-15 | 8.8 | 0.62 | Q109a | 136 | −8.51 |
| OB-16 | 9.6 | 0.78 | Q109n | 171 | −7.45 |
| Deep Aquifers in NE Area | Q228a | 120 | −7.57 | ||
| Q221a | 70 | −0.97 | Q110a | 94 | −5.12 |
| Q221n | 127 | −0.96 | Q229a | 85 | −8.18 |
| Q222b | 115 | −2.05 | Q229n | 150 | −6.89 |
Note: m bgs: meter below ground surface; m asl: meter above mean sea level; a, n, and t stand for Pleistocene, Neogene and Triassic aquifers, respectively.
Table 2.
Contribution (%) of seawater (SW), Red River’s water (RW) and local precipitation (LP) to groundwater in Holocene aquifer in study region during rainy and dry seasons.
Table 2.
Contribution (%) of seawater (SW), Red River’s water (RW) and local precipitation (LP) to groundwater in Holocene aquifer in study region during rainy and dry seasons.
| Rainy Season | Dry Season | |||||||
|---|---|---|---|---|---|---|---|---|
| Borehole | SW | RW | LP | Total | SW | RW | LP | Total |
| OB-01 | 36.97 | 28.49 | 34.53 | 100 | 36.63 | 43.25 | 20.12 | 100 |
| OB-02 | 53.62 | 1.34 | 45.03 | 100 | 51.96 | 22.00 | 26.03 | 100 |
| OB-04 | 61.02 | 7.98 | 31.00 | 100 | 64.56 | 14.29 | 21.15 | 100 |
| OB-06 | 12.93 | 29.91 | 57.16 | 100 | 13.85 | 37.11 | 49.04 | 100 |
| OB-07 | 0.60 | 66.59 | 32.81 | 100 | 1.08 | 88.73 | 10.19 | 100 |
| OB-08 | 2.75 | 59.12 | 38.13 | 100 | 2.80 | 65.87 | 31.33 | 100 |
| OB-09 | 0.00 | 1.67 | 98.33 | 100 | 0.00 | 5.58 | 94.43 | 100 |
| OB-10 | 4.95 | 37.17 | 57.88 | 100 | 33.38 | 29.46 | 37.16 | 100 |
| OB-11 | 19.39 | 67.71 | 12.90 | 100 | 16.62 | 76.06 | 7.32 | 100 |
| OB-12 | 5.52 | 55.15 | 39.32 | 100 | 6.08 | 56.50 | 37.43 | 100 |
| OB-13 | 48.07 | 32.23 | 19.70 | 100 | 64.72 | 19.45 | 15.83 | 100 |
| OB-14 | 32.35 | 44.51 | 23.14 | 100 | 34.66 | 49.03 | 16.32 | 100 |
| OB-15 | 10.15 | 64.36 | 25.49 | 100 | 10.18 | 78.66 | 11.16 | 100 |
| OB-16 | 0.45 | 99.62 | 0.00 | 100 | 1.56 | 98.43 | 0.00 | 100 |
Table 3.
Saturation indices (SI) of several minerals possibly existed in Holocene deposits in rainy season.
Table 3.
Saturation indices (SI) of several minerals possibly existed in Holocene deposits in rainy season.
| Boreholes | Calcite | Aragonite | Dolomite | Siderite | Gypsum |
|---|---|---|---|---|---|
| OB-01 | −0.23 | −0.36 | 0.72 | 1.64 | −1.89 |
| OB-02 | 1.19 | 1.06 | 3.01 | 2.64 | −1.47 |
| OB-04 | 1.24 | 1.11 | 3.89 | 2.57 | −2.24 |
| OB-06 | −0.02 | −0.15 | 1.10 | 1.16 | −2.63 |
| OB-07 | −0.06 | −0.19 | 0.16 | 1.48 | −1.53 |
| OB-08 | −0.48 | −0.61 | −0.46 | 1.31 | −2.27 |
| OB-09 | −1.06 | −1.19 | −2.37 | −0.47 | −2.79 |
| OB-10 | 0.34 | 0.21 | 1.86 | 1.88 | −2.22 |
| OB-11 | 0.41 | 0.28 | 1.71 | 1.17 | −1.90 |
| OB-12 | 0.01 | −0.12 | 0.51 | 1.54 | −1.99 |
| OB-13 | 0.72 | 0.59 | 2.61 | 1.85 | −1.67 |
| OB-14 | 0.05 | −0.08 | 1.35 | 1.38 | −2.24 |
| OB-15 | −0.30 | −0.43 | −0.34 | 1.36 | −1.71 |
| OB-16 | −0.30 | −0.43 | 0.09 | 0.80 | −2.15 |
Table 4.
Saturation indices (SI) of calcite, aragonite and dolomite in groundwater of Pleistocene, Neogene and Triassic in the study region.
Table 4.
Saturation indices (SI) of calcite, aragonite and dolomite in groundwater of Pleistocene, Neogene and Triassic in the study region.
| Borehole | Rainy Season | Dry Season | ||||
|---|---|---|---|---|---|---|
| SIcc | SIarag | SIdol | SIcc | SIarag | SIdol | |
| Q221a | 0.44 | 0.31 | 1.16 | 0.48 | 0.34 | 1.15 |
| Q222b | −0.39 | −0.52 | −0.30 | −0.37 | −0.51 | −0.32 |
| Q224a | 0.01 | −0.12 | 0.26 | 0.00 | −0.14 | 0.25 |
| Q225a | 0.68 | 0.55 | 1.87 | 0.70 | 0.56 | 1.84 |
| Q226a | 0.46 | 0.33 | 1.39 | 0.53 | 0.39 | 1.37 |
| Q227a | −0.39 | −0.52 | −0.03 | −0.16 | −0.30 | −0.31 |
| Q228a | −1.31 | −1.44 | −1.24 | −0.84 | −0.98 | −0.91 |
| Q229a | −0.16 | 0.03 | −0.21 | −0.11 | −0.03 | −0.11 |
| Q110a | 0.07 | −0.06 | 0.48 | 0.17 | 0.03 | 0.60 |
| Q109a | −0.45 | −0.58 | 0.09 | −0.24 | −0.38 | 0.19 |
| Q108b | −0.90 | −1.03 | −1.07 | −0.91 | −1.05 | −1.13 |
| Q92 | 0.50 | 0.37 | 1.41 | 0.45 | 0.31 | 1.33 |
| Q229n | −0.62 | −0.75 | −0.55 | −0.70 | −0.84 | −0.55 |
| Q109 | 0.51 | 0.38 | 1.48 | 0.51 | 0.37 | 1.51 |
| Q226n | 0.42 | 0.29 | 1.22 | 0.55 | 0.41 | 1.26 |
| Q221n | 0.40 | 0.27 | 1.24 | 0.47 | 0.33 | 1.27 |
| Q223n | −0.53 | −0.66 | −0.84 | −0.52 | −0.66 | −0.76 |
| Q220t | −1.51 | −1.64 | −1.93 | −1.19 | −1.33 | −1.96 |
| Q92a | 0.46 | 0.33 | 1.39 | 0.54 | 0.40 | 1.47 |
© 2019 by the authors. Licensee MDPI, Basel, Switzerland. This article is an open access article distributed under the terms and conditions of the Creative Commons Attribution (CC BY) license (http://creativecommons.org/licenses/by/4.0/).
Share and Cite
MDPI and ACS Style
Van Lam, N.; Van Hoan, H.; Duc Nhan, D. Investigation into Groundwater Resources in Southern Part of the Red River’s Delta Plain, Vietnam by the Use of Isotopic Techniques. Water 2019, 11, 2120. https://doi.org/10.3390/w11102120
AMA Style
Van Lam N, Van Hoan H, Duc Nhan D. Investigation into Groundwater Resources in Southern Part of the Red River’s Delta Plain, Vietnam by the Use of Isotopic Techniques. Water. 2019; 11(10):2120. https://doi.org/10.3390/w11102120
Chicago/Turabian StyleVan Lam, Nguyen, Hoang Van Hoan, and Dang Duc Nhan. 2019. "Investigation into Groundwater Resources in Southern Part of the Red River’s Delta Plain, Vietnam by the Use of Isotopic Techniques" Water 11, no. 10: 2120. https://doi.org/10.3390/w11102120
Note that from the first issue of 2016, this journal uses article numbers instead of page numbers. See further details here.