Effects of Tractor Passes on Hydrological and Soil Erosion Processes in Tilled and Grassed Vineyards


1
Institute for Agricultural and Earthmoving Machines (IMAMOTER), National Research Council of Italy, Strada delle Cacce, 73, 10135 Torino, Italy
2
Interuniversity Department of Regional and Urban Studies and Planning (DIST), Politecnico di Torino and Università di Torino, Castello del Valentino, Viale Mattioli, 39, 10125 Torino, Italy
*
Author to whom correspondence should be addressed.
Water 2019, 11(10), 2118; https://doi.org/10.3390/w11102118
Submission received: 31 August 2019
/
Revised: 5 October 2019
/
Accepted: 7 October 2019
/
Published: 12 October 2019
(This article belongs to the Special Issue The Effect of Hydrology on Soil Erosion)
Abstract
:Soil erosion is affected by rainfall temporal patterns and intensity variability. In vineyards, machine traffic is implemented with particular intensity from late spring to harvest, and it is responsible for soil compaction, which likely affects soil hydraulic properties, runoff, and soil erosion. Additionally, the hydraulic and physical properties of soil are highly influenced by vineyards’ inter-rows soil management. The effects on soil compaction and both hydrological and erosional processes of machine traffic were investigated on a sloping vineyard with different inter-row soil managements (tillage and permanent grass cover) in the Alto Monferrato area (Piedmont, NW Italy). During the investigation (November 2016–October 2018), soil water content, rainfall, runoff, and soil erosion were continuously monitored. Field-saturated hydraulic conductivity, soil penetration resistance, and bulk density were recorded periodically in portions of inter-rows affected and not affected by the machine traffic. Very different yearly precipitation characterized the observed period, leading to higher bulk density and lower infiltration rates in the wetter year, especially in the tilled vineyard, whereas soil penetration resistance was generally higher in the grassed plot and in drier conditions. In the wet year, management with grass cover considerably reduced runoff (−76%) and soil loss (−83%) compared to tillage and in the dry season. Those results highlight the need to limit the tractor traffic, in order to reduce negative effects due to soil compaction, especially in tilled inter-rows.
1. Introduction
Viticulture represents one of the most important agricultural activities worldwide, covering, at a global scale in 2018, 7.4 million ha [1]. In Europe, vineyards are mostly devoted to wine production, and, in 2016, they covered 3.3 million ha, and Italy, with 690.000 ha, was ranked third, after Spain and France [1]. The vineyard agro-ecosystem has relevant socio-economic impacts on the vine-growing regions, because of its interactions with the environment, landscape, the cultural and touristic features, and employment [2].
The vineyard agro-ecosystem needs to be carefully managed to preserve essential resources such as soil and water, and its overall socio-economic and environmental sustainability [3]. Since the last decade, a growing attention was paid to the impacts of agricultural activities on the ecosystem services, defined as “the direct and indirect contributions of ecosystems to human well-being” [4]. Such ecosystem services are negatively affected by soil degradation, namely soil compaction and soil erosion, offsite contamination, biodiversity reduction, and pressure on water resources [5,6,7]. Soil erosion and soil compaction were identified as two of the major threats that affect worldwide agricultural soils by the Soil Thematic Strategy from the European Union [8,9] and the FAO Status of the World’s Soil Resources [10].
Vineyard operations are highly mechanized, so the traffic of tractors and other machines (e.g., harvesters) necessarily occurs along fixed paths. Traffic is particularly intense from late spring to harvest and has a relevant effect on soil compaction, on soil hydraulic properties, and, consequently, on runoff and soil erosion at field scale [11,12,13]. The soil management that is adopted in vineyards’ inter-rows, as well as in other permanent crops, such as fruit and olive orchards, affects the hydrological response of the soil, the ecosystem services, and the cultural, landscape, and aesthetic values. Several studies report cover crops (or grass cover) in the inter-rows as a soil management practice adopted to reduce runoff and soil erosion in vineyards, with differences in its effectiveness depending on local conditions [14,15,16,17,18,19,20,21]. The use of vegetation cover in vineyards also has a relevant effect in improving biodiversity [22], soil organic matter and physical properties [23], and water availability and trafficability [24]. The vineyard inter-row soil management has a fundamental impact on the water balance at field scale, due to its effects on evapotranspiration, runoff formation, and several hydrological characteristics of the soil, such as hydraulic conductivity, soil water content, soil water retention, and ground-water recharge [25,26,27,28,29]. Depending on the pedoclimatic context, when not properly managed, cover crops may affect grapevine yield because of the competition for water and nutrients [30,31,32]. For this reason, in semi-arid environments, the soil is usually maintained bare, while, in regions with a less-dry climate, different soil managements to improve soil quality and ecosystem services are adopted [33]. For example, in the framework of the 2007–2013, the local regional Rural Development Program the Piedmont region (NW Italy) set up and supported measures for soil erosion prevention and the maintenance of soil organic carbon (SOC) levels based on the grass covering on more than 13,000 ha of orchards and vineyards [34].
Wide use of machinery during vineyard plantation and management in modern viticulture affects soil and water conservation. Deep ploughing and, occasionally, land levelling are carried out with heavy machinery before plantation [35,36]. Multiple tractor passes on fixed paths in the inter-rows are required every year for operations such as mechanical weeding, chemical spreading, green and winter pruning, and harvesting [37]. The repeated tractor traffic in inter-rows causes soil compaction on most of the vineyard surface [37], and when operations are performed on wet soil conditions, the risk of soil compaction worsens [38]. Soil compaction increases soil resistance to roots’ exploration, reduces yields [39,40], and negatively affects soil physical fertility and soil organic carbon stock, resulting in the reduction of soil porosity, water infiltration capacity, and increased runoff, with a decrease of storage and supply of water in the soil [11,12,13]. Scaling-up spatially the effects of soil compaction, the increase of surface runoff at field-scale impacts the peak discharge at the catchments scale, and thus could have a relevant role in increasing flood risk [40].
In the sloping vineyards of the Alto Monferrato region, previous studies showed the effectiveness of inter-rows’ permanent grass cover in reducing runoff and soil erosion, with respect to soil management with tillage [12,16,20,41]. Such behavior is likely related to soil compaction induced by tractor traffic, which also influences soil water infiltration and retention. This study aimed to investigate the blended effects of soil management and tractor traffic on the spatial and temporal variability of soil compaction and both hydrological and erosional processes. Soil water content, rainfall, runoff, and soil erosion were continuously monitored for two years in coupled field-scale plots, with inter-rows managed with permanent grass cover and tillage, respectively. In addition, periodic surveys were carried out during the growing seasons, to measure temporal variations in soil compaction and field-saturated hydraulic conductivity after the implementation of tractor passages.
2. Materials and Methods
2.1. Study Site
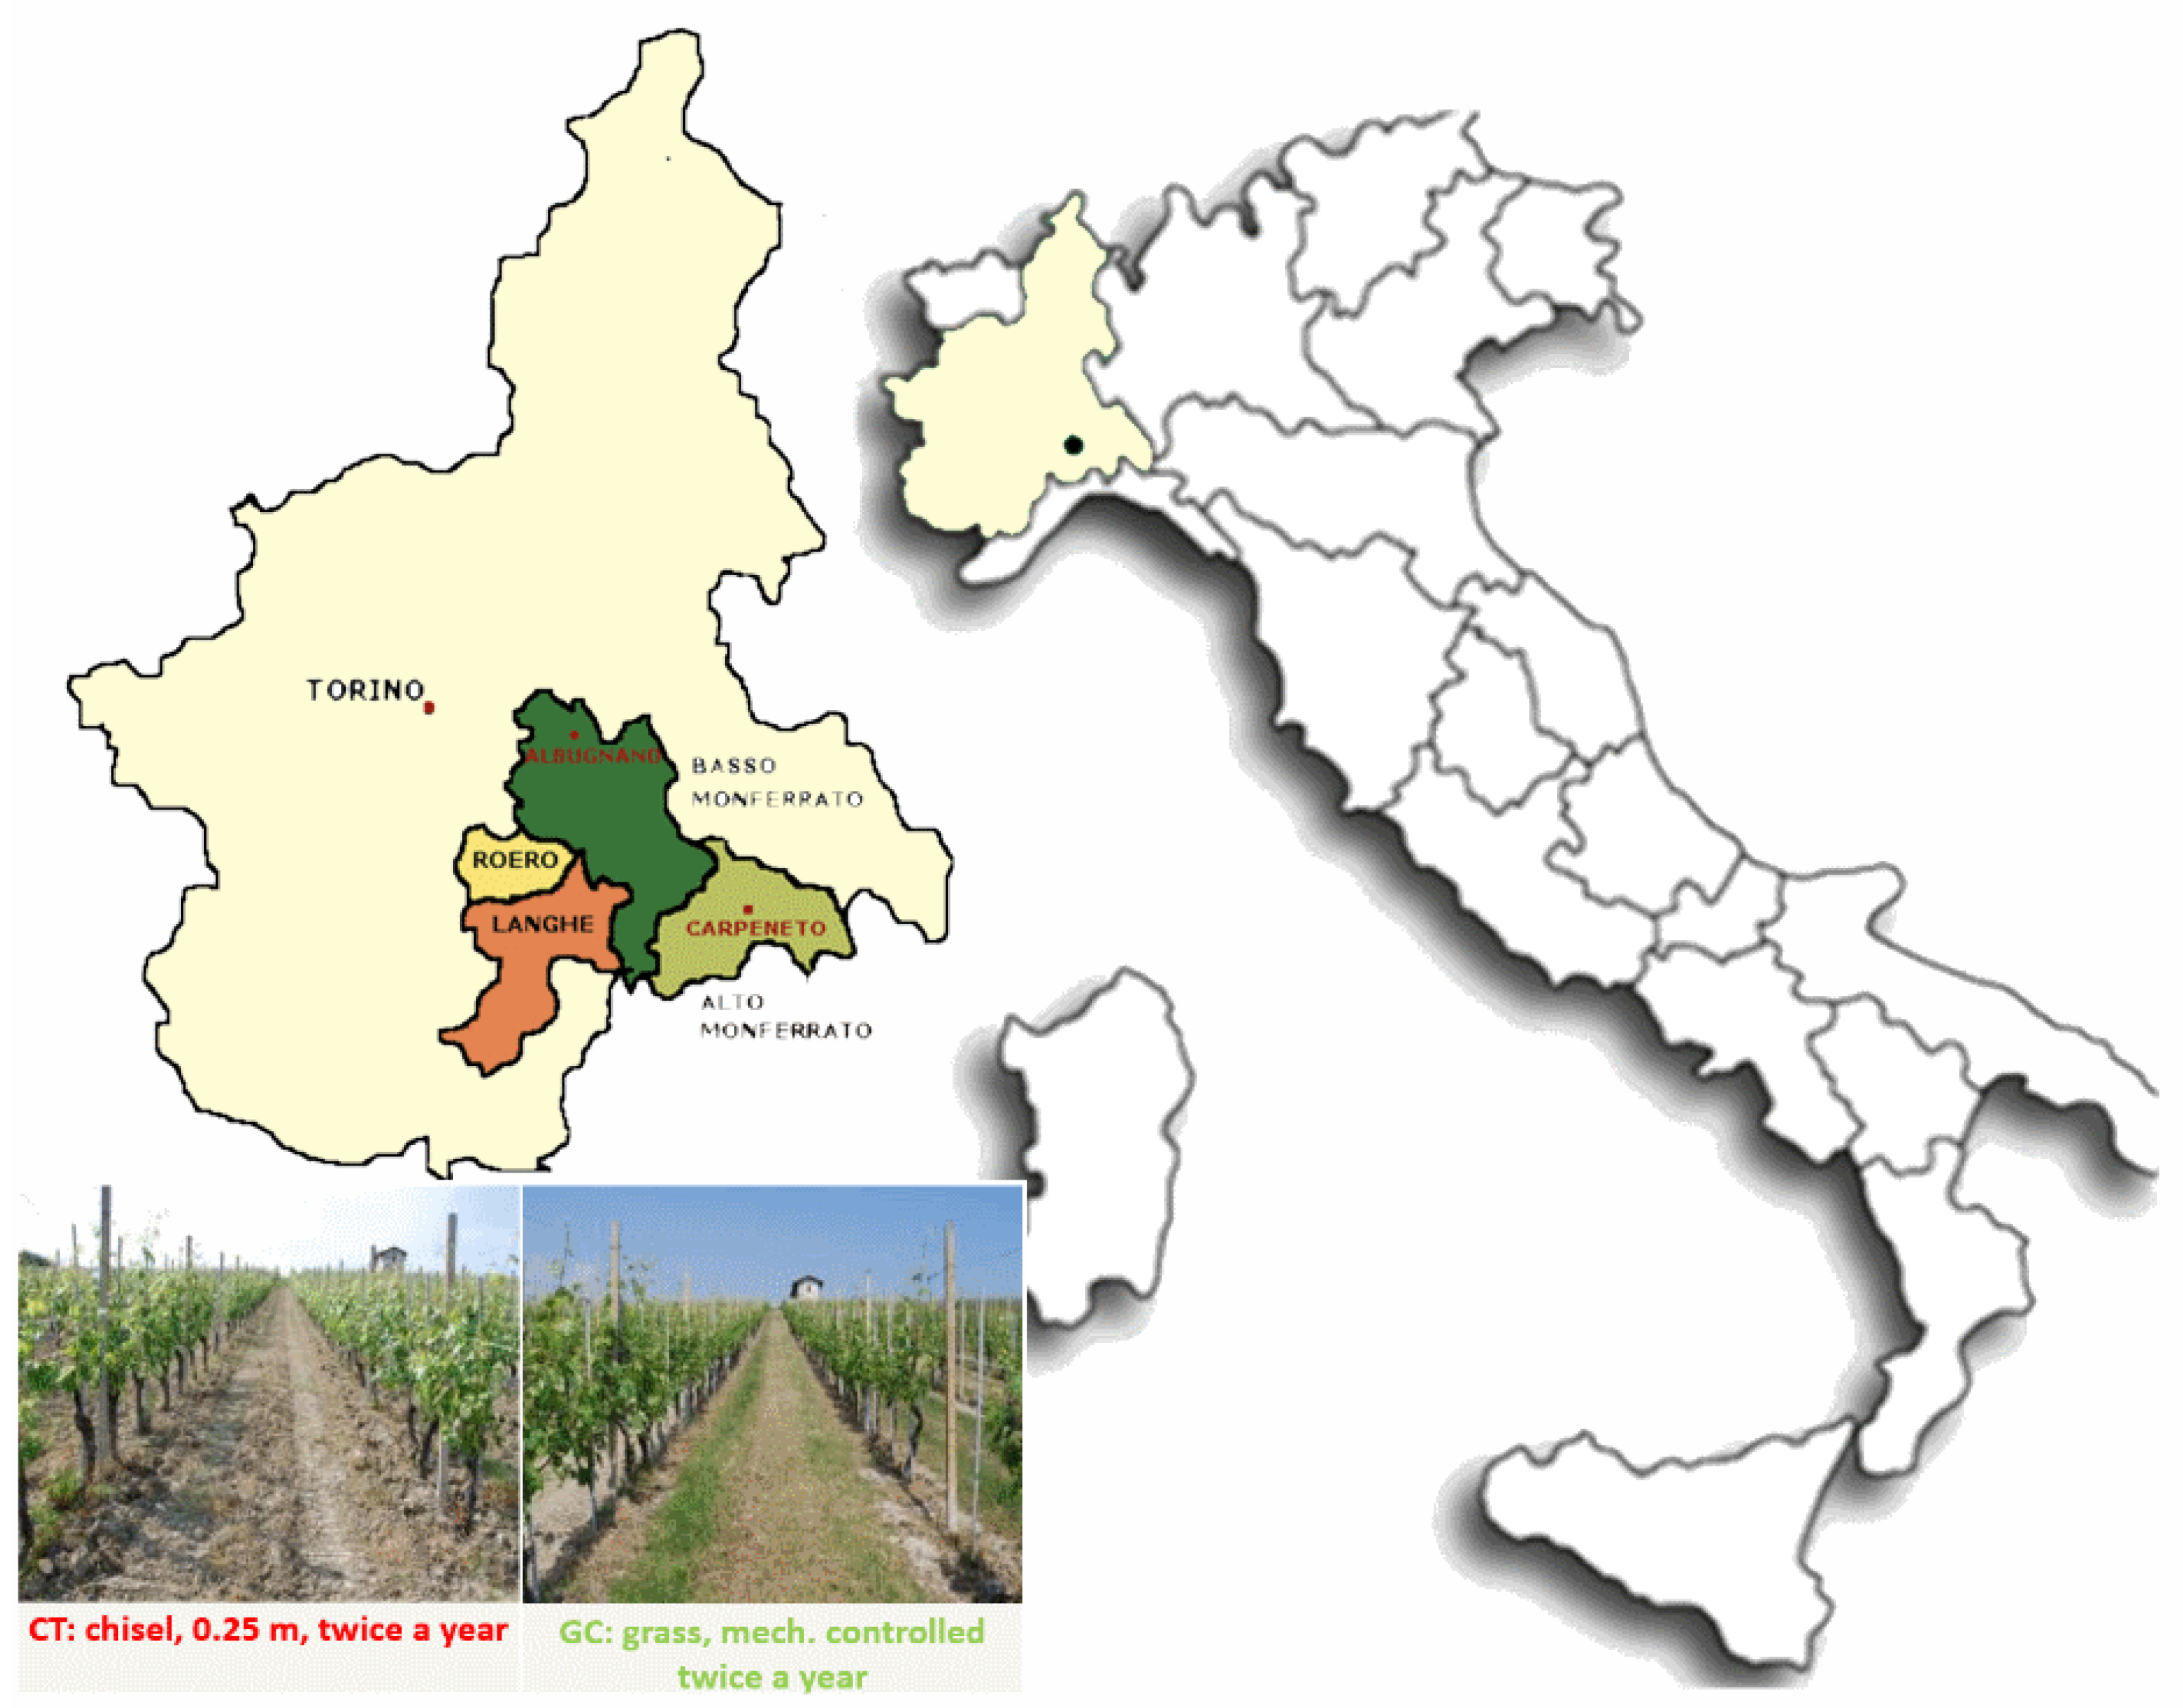
The study was carried out at the Tenuta Cannona Experimental Vine and Wine Centre of Agrion Foundation. It is located in the Alto Monferrato hilly area of Piedmont, North-West Italy, at an average elevation of 296 m above sea level (a.s.l.) (Figure 1). The study site lies on Pleistocenic fluvial terraces in the Tertiary Piedmont Basin, including highly altered gravel, sand, and silty-clay deposits, with red alteration products [42]. Soil has a clay-to-clay-loam texture, and it is classified as Typic Ustorthents, fine-loamy, mixed, calcareous, mesic [43], or Dystric Cambisols [44]. The climate is Csa (Hot-summer Mediterranean climate in the Köppen climate classification [45]). The average annual precipitation value recorded in the experimental site in the period 2000–2016 was 852 mm, ranging from a minimum of 539 mm (year 2007) to a maximum of 1336 mm (year 2002). The annual mean air temperature in the same period was 13 °C. Rainfall is mainly concentrated in October and November (about 40% of annual precipitation observed in autumn), when major runoff events usually occur [46], and, secondarily, in March. Summer, particularly July, is the driest season, with 12% of annual precipitation.
The 2-years’ experiment was carried out in two vineyard plots (1221 m2, 6 rows aligned along the slope, spaced 2.75 m, where the vines are spaced 1.0 m along the row), located on a hillslope with average 15% slope and SE aspect. The vineyard was planted in 1988 with Barbera grape variety and managed according to conventional farming for wine production. The soil of the two plots was managed with different techniques since 2000. Twice a year, in spring and autumn, either cultivation with chisel at a depth of about 0.25 m or mulching of the spontaneous grass cover was carried out, in the conventional tillage plot (CT, hereafter) and in the controlled grass (GC), respectively. Most of the farming operations in the vineyard were carried out using tracked or tyred tractors (Table 1), carrying or towing implements, with passage intensification from spring to the grape harvest time. The dates of tractor passages and field measurements are reported in Table 2, along with soil water content measured during surveys.
2.2. Measurements
The experiment was conducted in the period November 2016–October 2018. Measurements were periodically carried out in the two plots, both in the track position (T), which is the portion of inter-row affected by the passage of tractor wheels or tracks, as this is where the compressive effects tend to concentrate [47], and in the middle of the inter-row, identified as the no-track position (NT), that is not affected by direct contact with tractor wheels or tracks. Thus, measurements were carried out in four positions: CT-T and CT-NT in the tilled plot, and GC-T and GC-NT in the grassed plot. Periodic measurements (Table 2) were carried out to obtain values of compaction, namely soil penetration resistance (PR), bulk density (BD), and the associated initial soil water content (SWC). They were performed monthly in the growing season (depending on weather conditions) and two times before and after winter passages. Infiltration tests were performed according to the simplified falling head (SFH) technique [48] to detect the temporal variability of the field-saturated soil hydraulic conductivity (Kfs) at the surface of the vineyard inter-rows. A weather station and a monitoring system measured and recorded rainfall, runoff, and soil loss in the experimental plots.
2.2.1. Rainfall, Runoff, and Soil Water Content
From November 2016 to October 2018, rainfall and runoff related to 93 events were recorded for the two plots. Rainfall was recorded at 10 min intervals by a rain-gauge station, with 0.2 mm resolution, placed near the plots. Based on the records, RIST (Rainfall Intensity Summarization Tool) [49] was used to obtain the rainfall amount (P), event duration (D), rainfall maximum intensity at 15, 30, and 60 min time intervals (MAX15, MAX 30, and MAX60), rainfall energy (E) (based on the equation proposed by Brown and Foster [50]), and the event erosivity index (EI30) [51] for each precipitation event. Rainfall events were defined as the time between the initiation and cessation of rainfall with a lack of rainfall for at least 12 h, in order to separate long-lasting events. Isolated events with less than 1 mm of rainfall were omitted from the analysis, because they were not significant for runoff initiation or for soil moisture changes. Runoff generated by rainfall was collected separately for each plot. Each vineyard portion was hydraulically bounded, and runoff was collected at the extremity by a channel, connected with a sedimentation trap, and then a tipping bucket device measured the hourly volumes of runoff (RO) and the runoff rates (RC) in CT and GC. Runoff samples were collected to obtain sediment yield (SY) for erosive events. Furthermore, if sedimentation occurred in the channels and sediment trap, then sediment yield was collected and weighted (see Biddoccu et al. [46], for details). Soil moisture was monitored by indirect method [52] by capacitance/frequency domain sensors (ECH2O-5TM sensors, Decagon Devices Inc., Pullman, WA, USA), gravimetrically calibrated, and placed at 0.1, 0.2, and 0.3 m depth in each plot in NT and T positions. Soil water content was obtained every hour from the average of 1 min measurements and stored by a Decagon EM50 Datalogger.
2.2.2. Soil Compaction Measurements
Soil compaction was evaluated with two different methods: bulk density (BD) and penetration resistance (PR). The use of two separate methods was meant to offer a robust experimental setup, capable of internal corroboration and multiple detection capacity, where the effects that may elude one method are captured by the other [46,53].
For each of the four positions, 5 PR profiles and 9 BD were yielded, with a total number of 20 PR and 36 BD for each recurrent measurement. Measurements were repeated 10 times in Year 1 (200 PR and 360 soil cores), and 8 times in Year 2 (160 penetration resistance profiles and 288 soil cores). Dates of field sampling, along with soil water content measured in the same day, and dates of tractor passages in each plot are reported in Table 2. For reference values, the survey farther from tractor passages (20/2/2017) was chosen for the GC plot, whereas values recorded on 17/5/2018 were selected for the CT plot, that were obtained just after the tillage without tractor passages. The standard Proctor compaction test [54] was performed on soil samples taken in the two treatments for both years.
(1) Penetration resistance (PR)
Soil penetration resistance was measured using a dynamic penetrometer, built according to the design of Herrick and Jones [55]. The cone used for the tests had an ASAE-standard 30° cone angle (3.22 cm2 base area). The penetrometer was placed vertically, with the cone tip inserted into the soil. The mass of the slide hammer was 2 kg, falling from a height of 0.3 or 0.4 m. The number of hits necessary to reach the penetration depths of 3.5 – 7.0 – 10.5 – 14.0 – 17.5 – 21.0 – 24.5 – 28.0 cm was recorded manually to evaluate changes in penetration resistance values down the soil profile. At each survey, 5 repetitions were performed in the T and NT positions, both in the GC and in the CT plot. The PR was then estimated as the work done by the soil to stop the movement of the penetrometer, divided by the cone travelled distance [55] according to the following equation:
where Rs is soil resistance (N), Ws is work done by the soil (J), and Pd is cone travel distance through the soil (m).
The work done by the soil was calculated as the change in the kinetic energy of the penetrometer, according to Equation (2) [56]. As the penetrometer was driven into the soil by the hammer, the kinetic energy of the hammer was transferred to the penetrometer cone. Therefore, the work done by the soil was equal to the kinetic energy (KE) transferred to the cone from the penetrometer when the hammer contacted the strike plate, which was calculated as follows:
where v is hammer velocity (m s−1) and m is hammer mass (2 kg).
In turn, velocity (v) was calculated as:
where x is falling height (0.3 m), a is gravity acceleration (9.81 m s−2), and v0 is initial velocity (assumed as null).
The previous calculations assume that all of the hammer’s kinetic energy was transferred to the cone.
Finally, average PR was estimated for each depth interval of soil travelled by a given number of hammer strikes as:
where m is hammer mass (2 kg), n is number of strikes, and Pd is penetration depth (m).
PR is directly correlated with BD and shows an inverse relationship with SWC, but those relationships are not linear over a wide range of values of BD and SWC. Several studies suggest to operate cone penetrometer measurements at water contents close to a standardized matric potential to obtain comparable results [57]. To allow comparison of measurements taken at different SWC conditions, Busscher [58] introduced the practice of normalizing PR readings to a common SWC value. According to the procedure illustrated by Vaz et al. [59], the measured data were used to parameterize the exponential function proposed by Jakobsen and Dexter [60]:
that expresses PR as function of SWC and BD. The PR mean values for 10-cm depth intervals were associated to corresponding BD and SWC values measured during each survey. Each of the four datasets obtained in different treatments and positions during the study period was used to obtain the best fitting equations, minimizing root mean square error. Then PR data for the 10 cm depth intervals were normalized using a common SWCcorr value that was set at 0.300 m3 m−3.
(2) BD (and SWC)
BD is a dynamic soil property that varies according to its structure, which can be altered by flora and microorganisms, by agricultural practices, by trampling, or by heavy vehicle traffic, but also by the impact of precipitation. To determinate BD and SWC, core samples (V = 100 cm3) were collected in the T and NT position both in the GC and in the CT plot, at the depth of 0–0.10, 0.10–0.20, and 0.20–0.30 m. Then, samples were weighed before and after oven-drying at 105 °C for 48 h. SWC was determined by gravimetric method from each sample. Three samples were collected at each position and depth; thus, BD and SWC were calculated as the average of values obtained from the three repetitions.
2.2.3. Field-Saturated Soil Hydraulic Conductivity (Kfs)
The Kfs was measured in the four investigated positions at each periodic sampling by infiltration tests carried out according to the simplified falling head technique (SFH) proposed by Bagarello et al. [48]. With respect to the original test setup, a larger second ring concentric to the inner one was inserted to assure one-dimensional flow. The two PVC cylinders were 0.30 m high, and the diameters were 0.305 and 0.486 m, for the inner and the external ring, respectively. They were inserted in the soil to a minimum depth of 0.05 m. The applied water volumes were 7.0 L in the inner ring and 10.8 L in the external one. According to Bodhinayake et al. [61], the slope of the experimental plots does not affect the measurements significantly. In winter, the soil temperature was checked to be sure that the soil was not frozen. Next to the investigated area and, after the water infiltration, inside the inner ring, undisturbed soil cores (V = 100 cm3) were collected at the depth of 0–0.07 m, in order to determine initial and saturated volumetric water content values (SWCi and SWCs). Overall, 38 infiltration tests were carried out in Year 1 and 36 in Year 2.
2.2.4. Statistical Analysis
The statistical frequency distributions of the data were assumed to be normal for the SWCi and the BD, and log-normal for the Kfs, as common for these variables [62,63]. Arithmetic means were used to represent the SWC, PR, and BD results. Geometric means were used to represent the Kfs. Mean values of BD, PR, and Kfs obtained for each position were analyzed statistically, by means of t-test [64], in order to find significant difference: (i) with respect to the undisturbed soil conditions, by comparing values obtained in each survey with the reference ones, for BD and PR; (ii) for BD topsoil values, in selected dates—between the two plots, within the same date and position (i.e., CT-T vs. GC-T) and (iii) between values measured in the same plot and same position in corresponding survey dates in the two monitored years; and (iv) for Kfs, between average annual values measured in different position and plot. The elected significance level for all tests was α < 0.05.
3. Results
3.1. Rainfall
The first year observed during the present study (from November 2016 to October 2017, Year 1 hereafter) was characterized by cumulated precipitation lower than the Mean Annual Precipitation (MAP) (569 mm, 67% of MAP). In particular, the period June–October 2017 was very dry. The second year (November 2017–October 2018, Year 2 hereafter) was a relatively wet period, with cumulated precipitation of 1125 mm (132% MAP). Total erosivity (EI30) of rainfall felt in the entire period of observation was 4715 MJ mm ha−1 h−1, and only 12% of the erosivity was due to events that occurred during Year 1.
Table 3 shows the classification of rainfall events following the cumulated rainfall depth. The maximum rainfall event depth was 127.2 mm in Year 1 (autumn 2016) and 217.4 mm in Year 2 (autumn 2018); the latter was the only event with more than 200 mm of precipitation in the observed period. More than 60% of the rainfall events cumulated less than 10 mm during each period of observation. Rainfall events with cumulated rainfall between 1 and 50 mm gathered most of the precipitation fallen during each year of observation, namely 76% and 53% in Year 1 and Year 2, respectively. The average 15 min rainfall intensity and erosivity of events belonging to the two first classes were lower than 17 mm h−1 and 63 MJ mm ha−1 h−1. Only three events were observed for the class 50–100, with all of them occurring during Year 2, characterized by mean EI30 equal to 430 MJ mm ha−1 h−1: the corresponding cumulated erosivity accounted for the 27% of the total. Only three rainfall events with more than 100 mm of precipitation were observed. These three events accounted for 38% of the total erosivity (average 595 MJ mm ha−1 h−1). This class showed the highest rainfall erosivity (more than 1600 MJ mm ha−1 h−1). Just two events showed very high erosivity (>1000 MJ mm ha−1 h−1), and they occurred in autumn 2018 (27/10) and in summer 2018 (16/07). The latter also reached the maximum rainfall intensity (84.3 mm h−1).
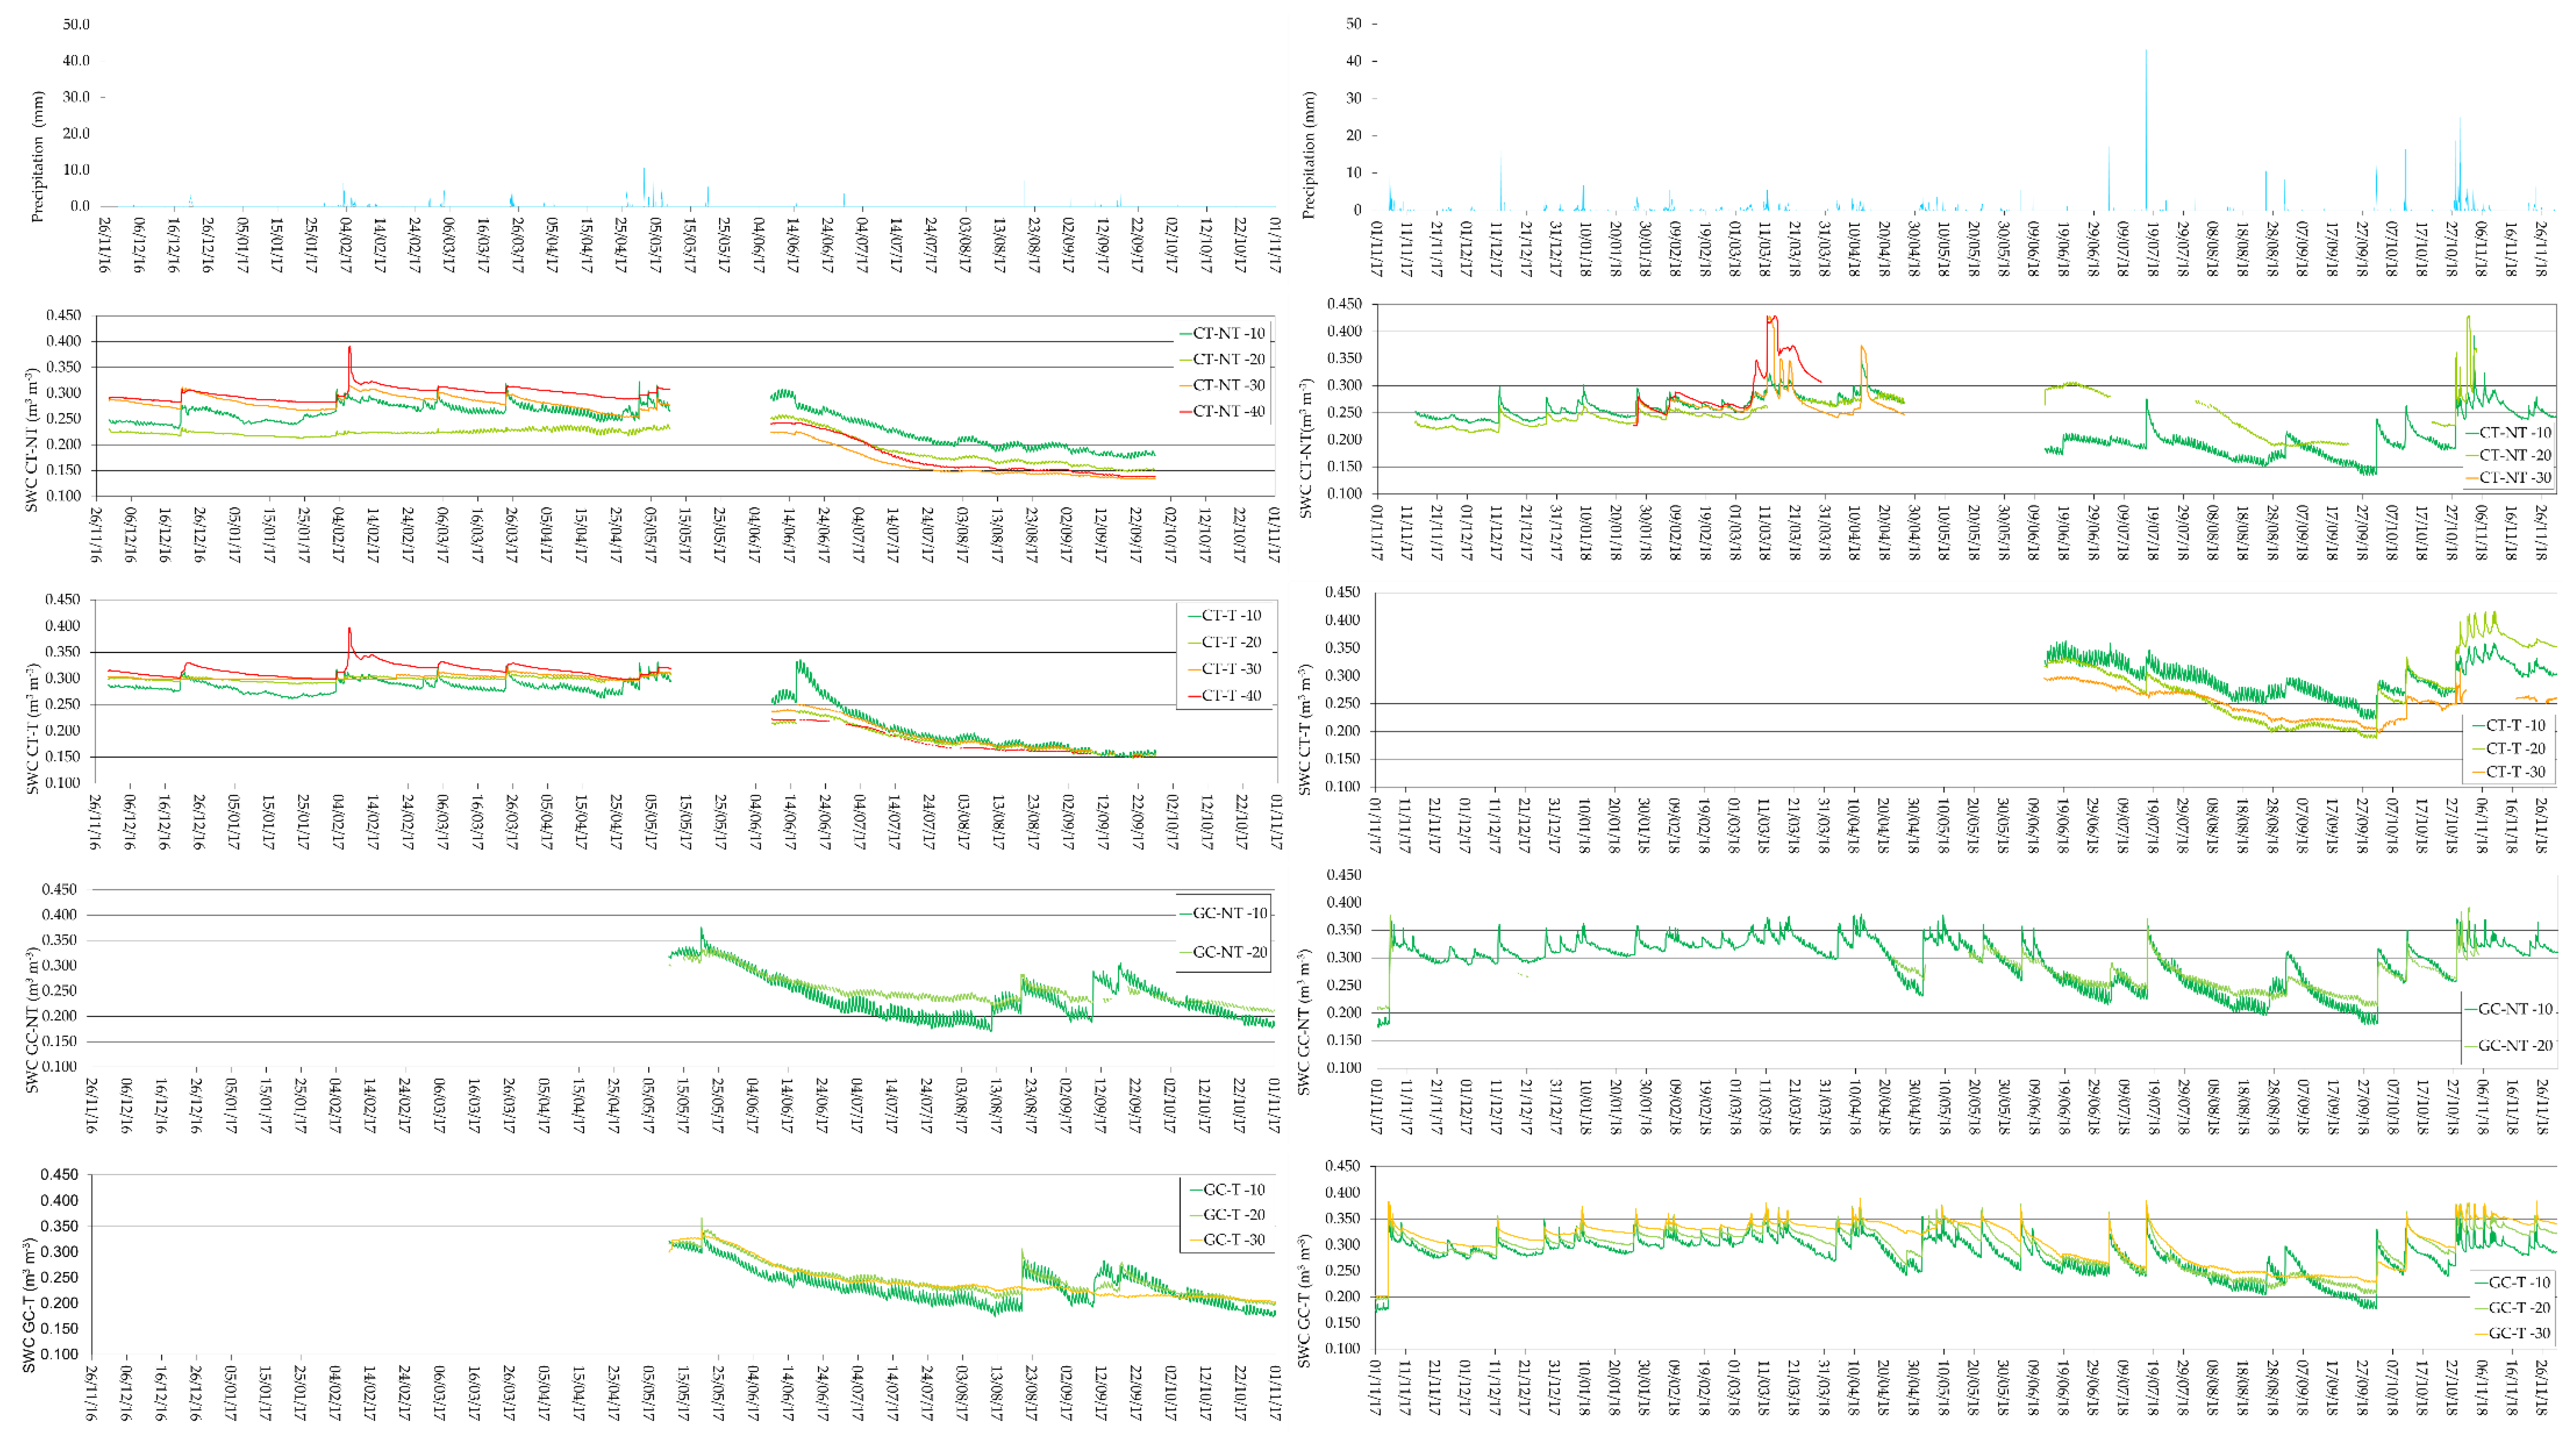
3.2. Soil Moisture
In general, SWC was higher in T than in NT and in GC than in CT (Figure 2). During winter and until May of Year 1 (Figure 2), the SWC in the CT soil was higher (over 0.250 m3 m−3) at depths of −30 and −40 cm than in more superficial layers. No data are available for that period for the GC plot. During the summer, after tillage and mowing operations, the soil was very dry in consequence of the absence of rain. Since July, SWC in CT was lower than 0.200 m3 m−3 (except at −10 cm depth in CT-NT), and it reached values close to 0.150 m3 m−3 after mid-September. In GC, the lowest values were measured at mid-August, with values lower than 0.200 m3 m−3 for the most superficial layer. Nevertheless, after the following rainfall events, an increase in soil moisture, which was not evident in the CT plot, was recorded. Furthermore, from June to September, the SWC measured in CT positions both at −10 and −20 cm was higher than soil moisture at higher depth, whereas, before the tillage, the trend was the opposite. Monitoring also shows that, in winter, every rain event caused higher SWC increase in deepest soil layers of the CT plot than in the superficial ones. In Year 2 (Figure 2), winter and early-spring precipitation resulted in SWC higher than 0.250 and 0.300 m3 m−3 along the entire soil profile, in CT-NT and GC, respectively (measurements for CT-T not available) until mid-April. Then, during summer, many rainfall events occurred and caused higher variability in soil moisture than in the previous year, with SWC increasing after precipitation events in the two treatments. In fact, SWC was higher than 0.200 m3 m−3 during most of the summer, both in CT and in GC. In both years, the value at −30 cm in GC-T does not generally drop below the most superficial one.
3.3. Soil Compaction
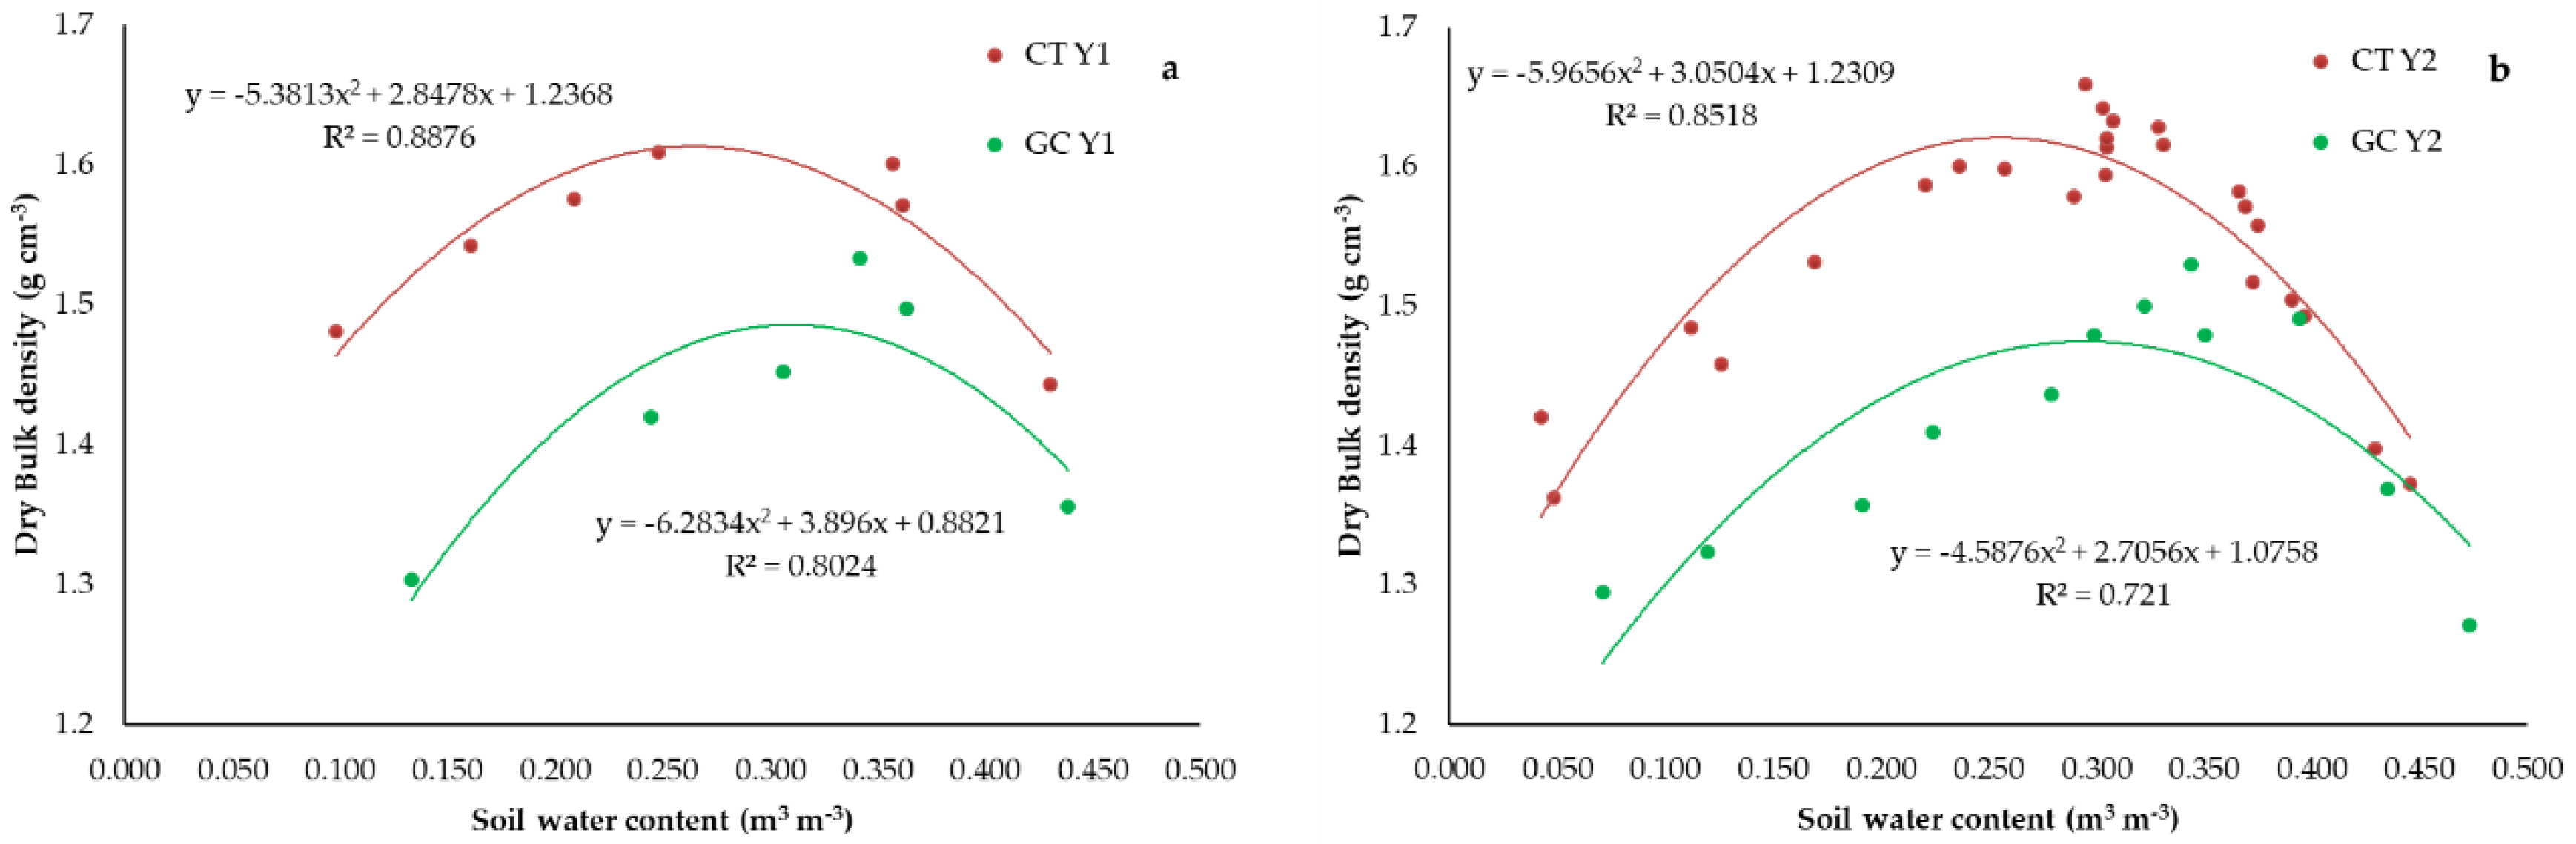
3.3.1. Proctor Test
The volumetric soil water content at the maximum compaction was evaluated by the standard Proctor compaction test [54] for the soil of each plot (Figure 3), using samples collected in both years. For each treatment, the results were similar in the two Years: SWC at maximum compaction was always higher in GC than in CT, equal to 0.331 and 0.289 m3 m−3, respectively; and, in both tests, the corresponding BD was higher in CT than in GC and reached, respectively, 1.61 and 1.48 g m−3.
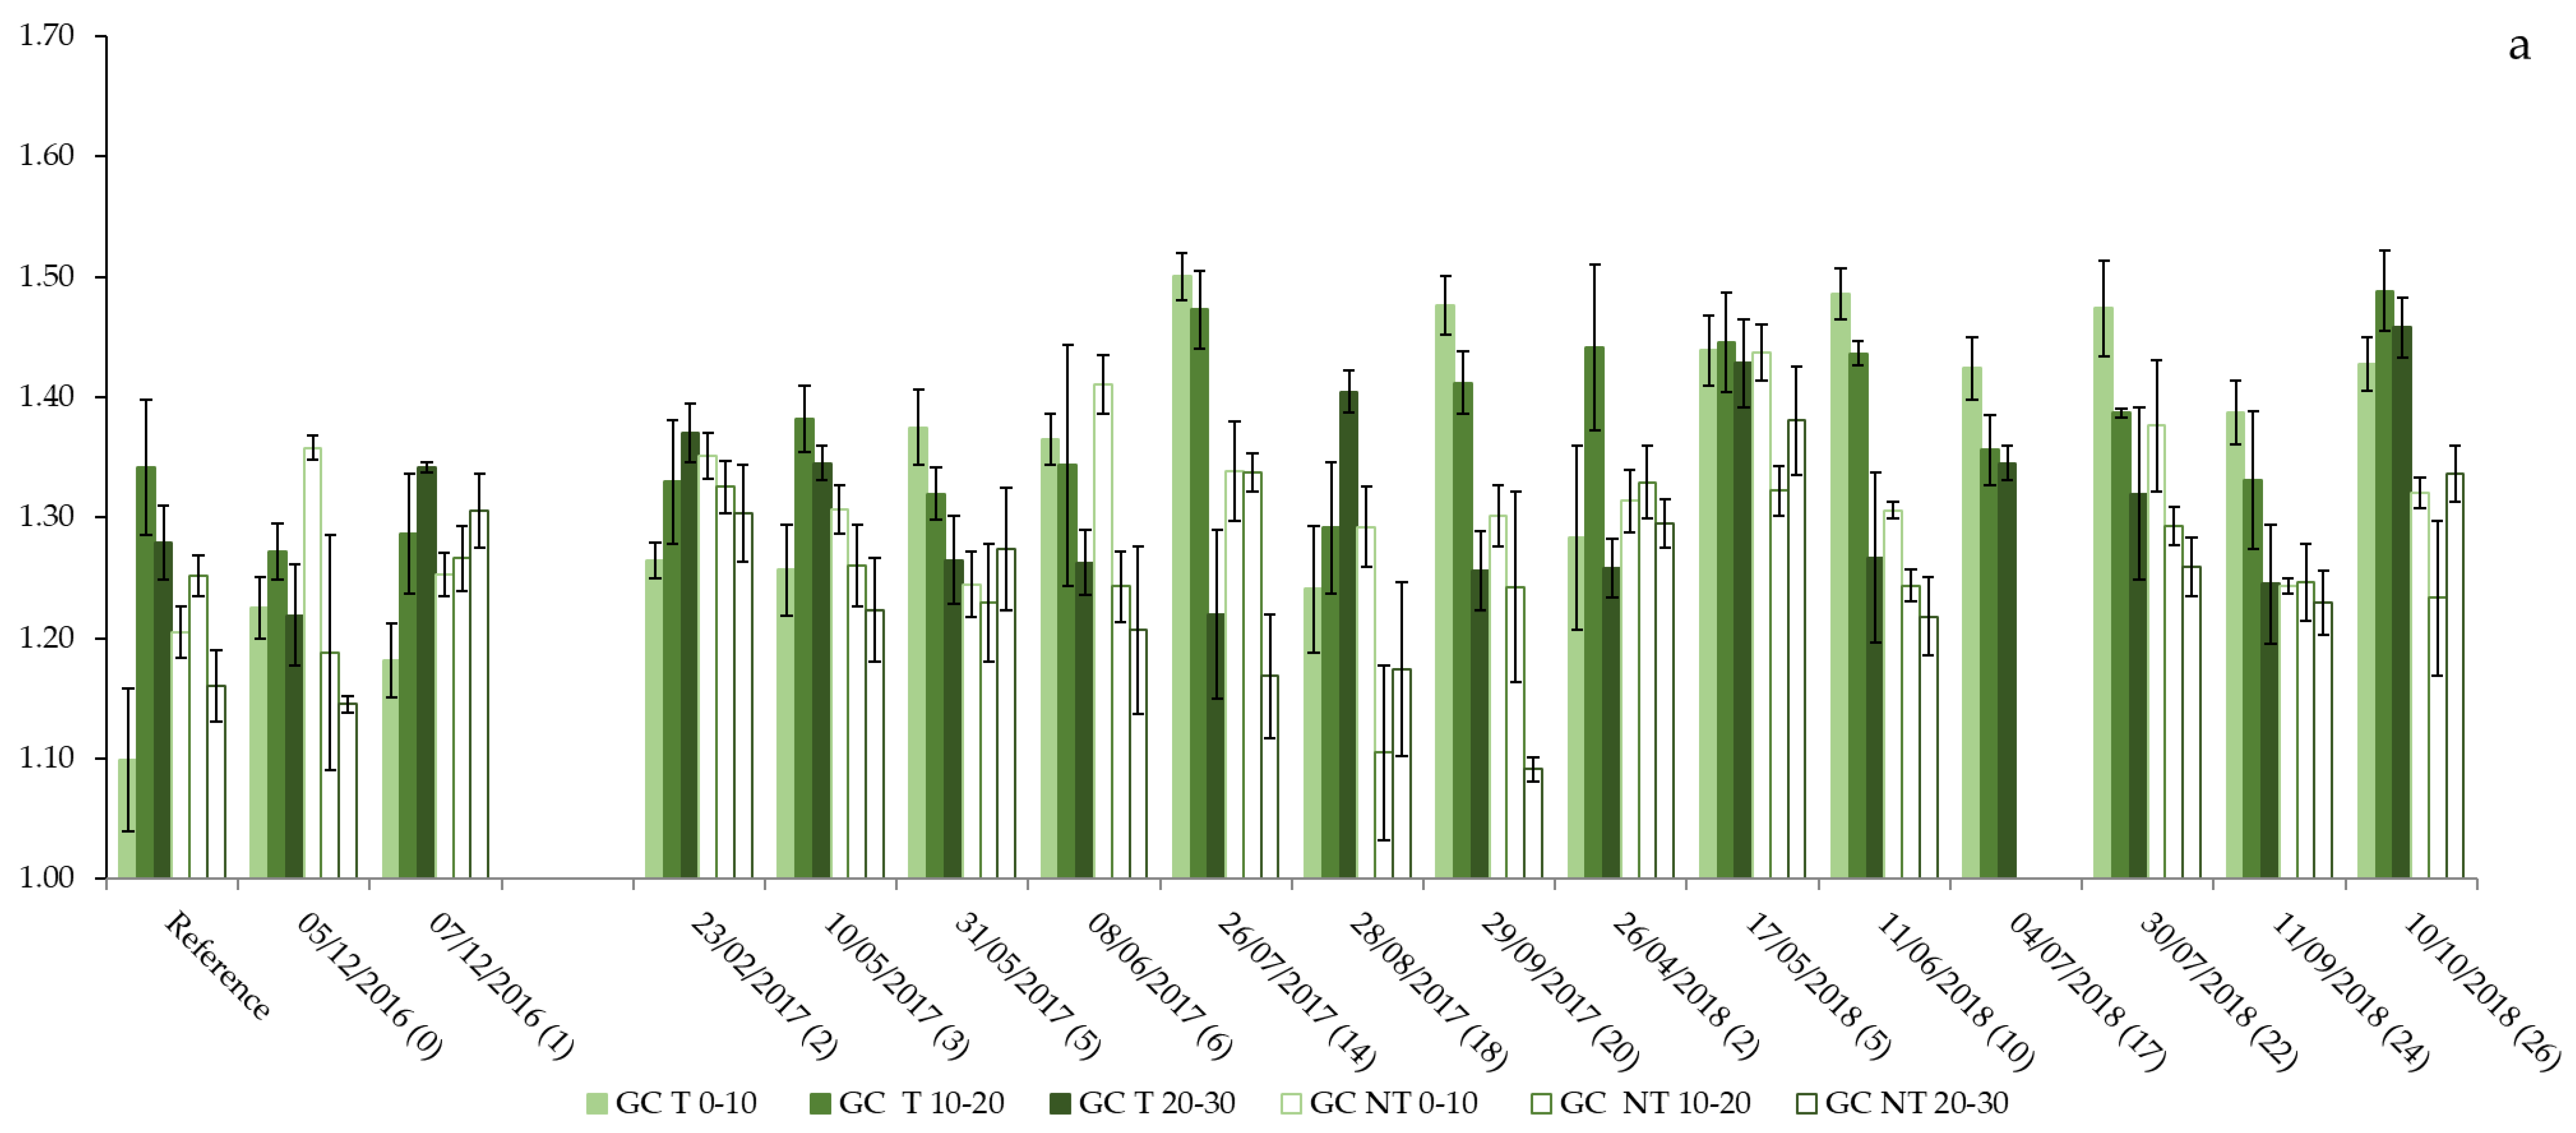
3.3.2. Bulk Density
The reference bulk density ranged between 1.10 and 1.34 kg m−3 and between 1.17 and 1.32 kg m−3 in the GC and CT plots, respectively. During the study period, BD ranged from 1.18 and 1.50 kg m−3 and from 1.09 and 1.44 kg in the GC-T and GC-NT positions, respectively (Figure 4a). The highest BD values were observed in the most superficial layer on 26/07/2017 (after 14 passages) in GC-T and on 17/5/2018 in GC-NT (after 5 passages). In GC-T, BD was significantly higher than the reference values (t-test, p < 0.05) in the most superficial layer in almost all dates after five tractor passages, in both monitored seasons. The only exception were the values obtained on 28/8/2017. In the deepest layer of GC-T (20–30 cm), the BD significantly increased only after 18 passages in 2017 and after 26 passages in 2018. In the GC-NT, the BD in the most superficial layer was significantly higher with few exceptions from December 2016 to June 2017 in the first season, from late April to June and in the final survey in the second season. In the 10–20 cm layer, the BD increase was significant only on 26/7/2017. At the 20–30 cm depth, the BD was significantly higher just after the first winter passage (7/12/2016), and then, on some dates in the second season, namely after two and five passages in the springtime and in the final survey.
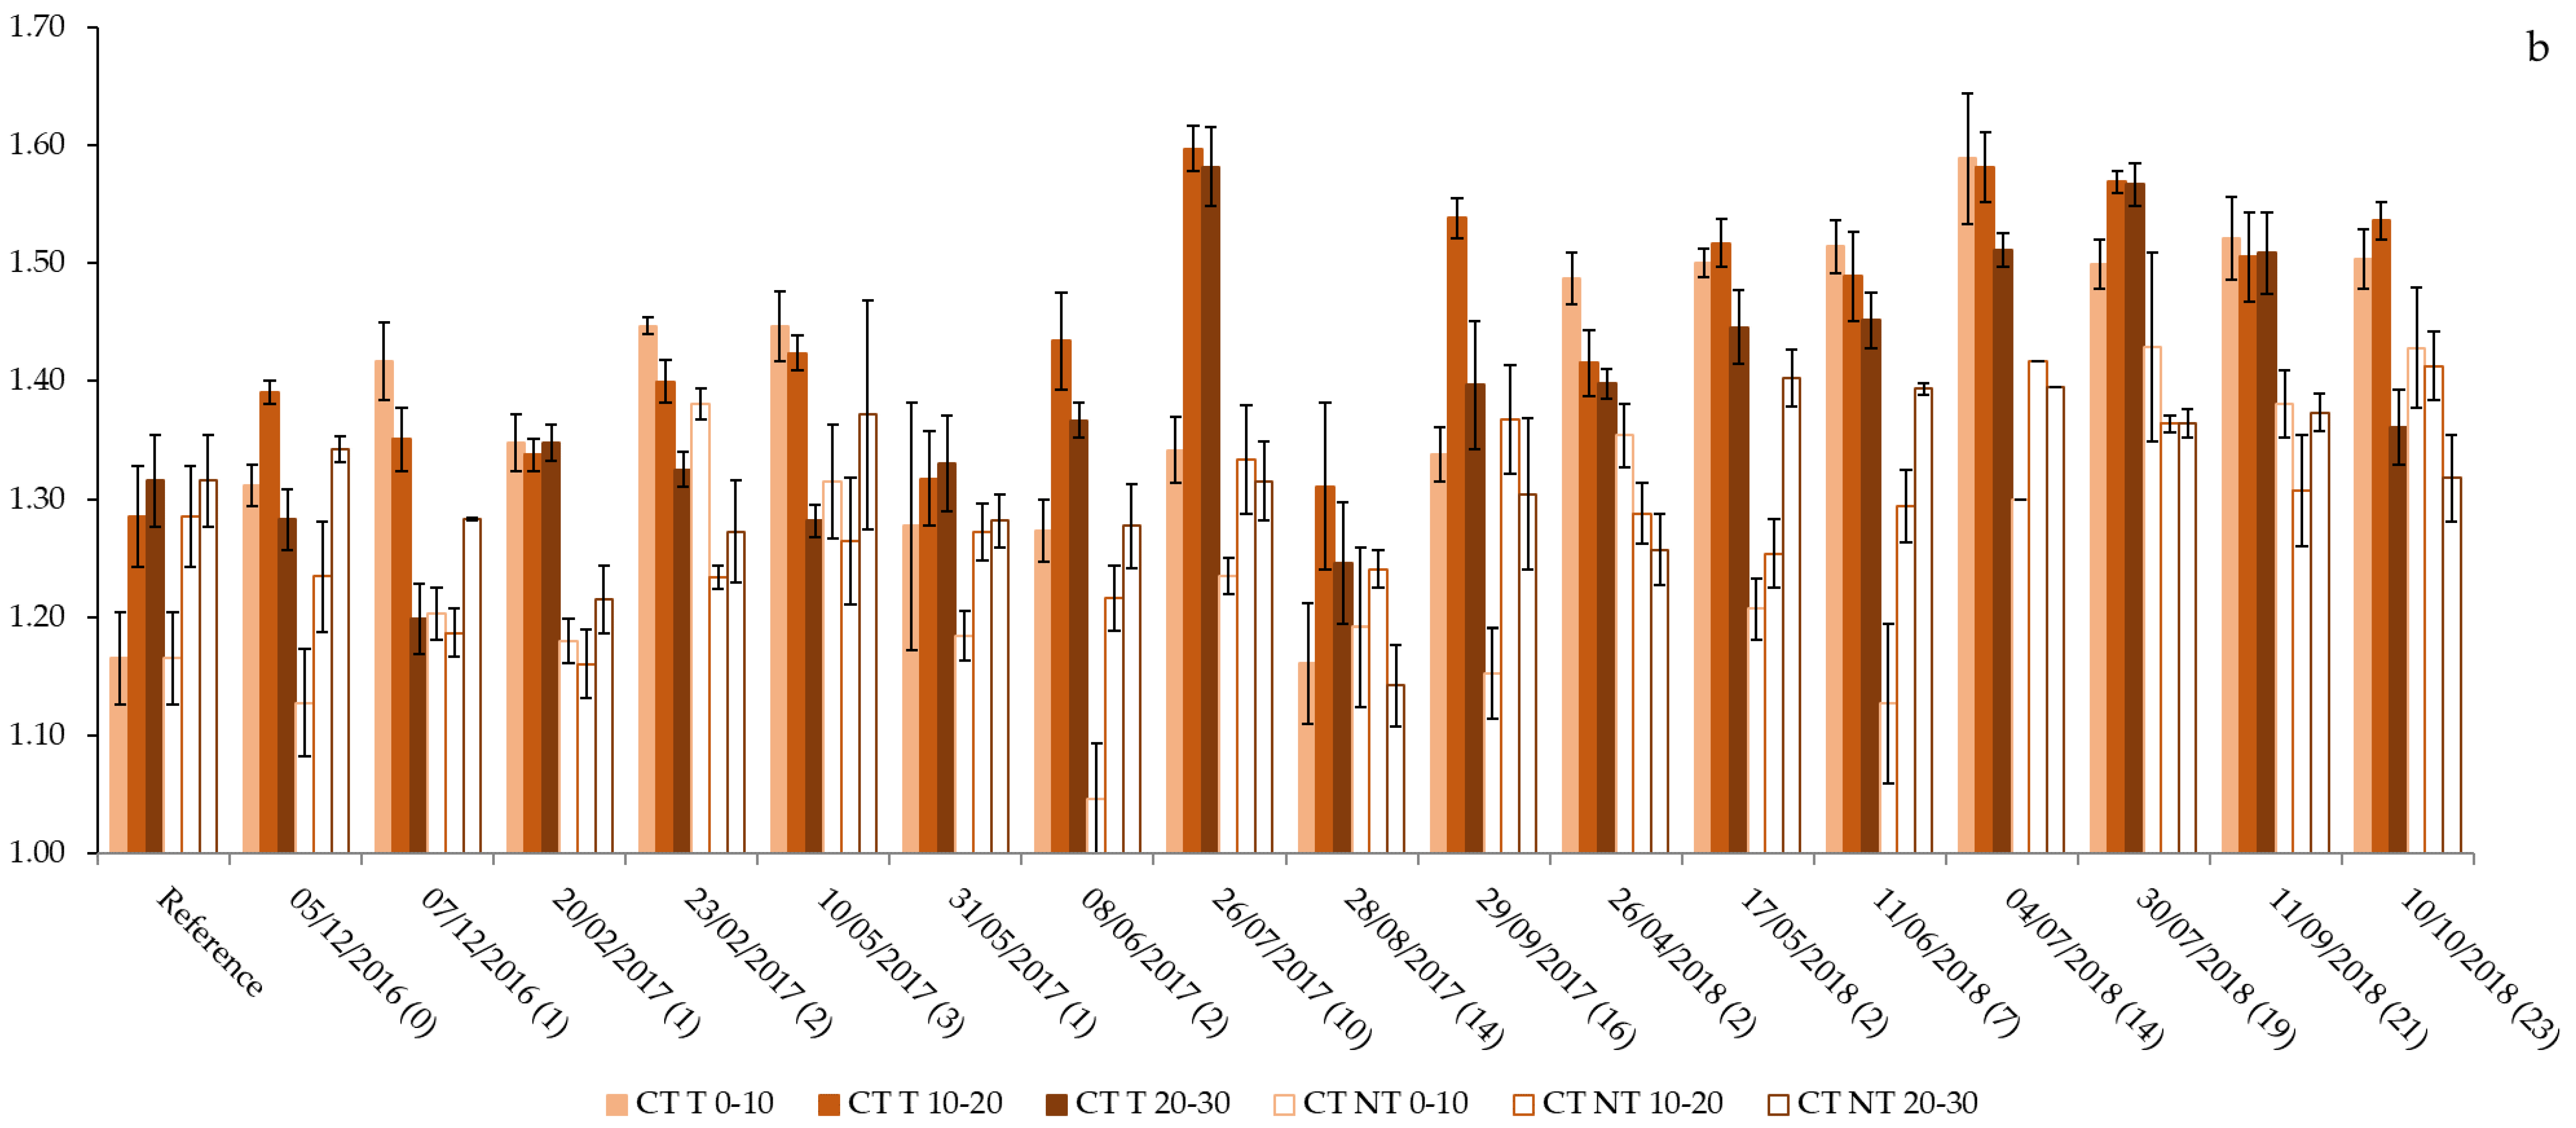
In the CT plot, BD assumed values ranging from 1.16 to 1.60 kg m−3 and from 1.05 to 1.43 kg m−3 in the CT-T and CT-NT positions, respectively (Figure 4b). The highest BD was obtained on 26/07/2017 (after 10 passages) in CT-T and on 30/07/2018 in CT-NT (after 19 passages). In CT-T, Year 1, at the depth 0–10 cm, BD was significantly higher than the reference in all dates before the spring tillage, on 26/07/2017, just after the first harvest, and in all dates during Year 2. At deeper layers, in Year 1, BD was significantly higher than reference at 26/07/2017 and on 27/09/2017 (in the latter date only at 10–20 cm depth), but it increased significantly during the entire Year 2 at 10–20 cm depth and, in the summertime, at 20–30 cm depth.
Table 4 shows the BD mean values measured in the topsoil in each plot and position in the two years in selected dates, which represent similar conditions with respect to the tillage operations and traffic with tractors. In Year 1, the values of BD in CT-T were significantly higher than in GC-T after one to three tractor passages occurred before spring tillage; afterward, BD was lower in CT-T, being the difference significant in July (after more than 10 passages) and at the end of the season. In the NT position, BD was higher in GC than in CT during most of the surveys, without significant difference. During Year 2, BD measured in the track position was always higher in CT than in GC, with a significant difference only before harvest. In the same date, BD in the middle of the inter-row was also significantly higher in CT than in GC. BD was higher in GC-NT than in CT-NT only during the survey carried out after one to two passages following spring tillage, and, in that case, the difference was statistically significant. The comparison between the two monitored seasons revealed significant differences during almost the entire season in the CT-T treatment, with highest BD values obtained in Year 2. In the NT position treatments, the BD was significantly higher in Year 2 in the first survey after spring tillage (after one to two tractor passages) in GC and in CT, after harvest.
3.3.3. Soil Penetration Resistance
Figure 5 shows the profiles of soil penetration resistance (PR) in each treatment in the two years. In GC, the mean values of reference PR along the profile varied between 1.5 and 3.7 MPa and from 2.5 to 4.3 MPa in NT and T positions, respectively. In GC-NT, during the 2016–2017 winter, PR did not significantly increase with respect to reference values after one and three tractor passages. After 5 passages, on 31/5/2017, the mean PR values increased significantly (up to 9.5 MPa) in the first 20 cm of soil profile, and later in the entire soil profile until the end of the season, with a maximum value of about 25 MPa at 7 cm depth at the end of July 2017. In 2018, mean PR was not higher than 7.4 MPa, values obtained at maximum depth before the harvest. Nevertheless, after only two tractor passages, the mean PR was significantly higher than the reference values up to 17.5 cm depth, and later it increased gradually at higher depth, until it was significantly different along the entire profile after the 2018 harvest. In Year 1, in the GC-T position, the PR significantly increased through the first centimetres of soil after three passages. Starting from the late spring, the increase of PR was significant (with mean values exceeding 10 MPa) up to 10.5 cm of depth on 31/05/2017 and then along the entire soil profile. In Year 2, the PR was significantly higher than the reference values up to 10.5 cm depth and at maximum depth after two tractor passages following the spring tillage. A decrease of PR was detected in the following survey (17/5/2018), and then it increased gradually during the summer, exceeding 15 MPa between 24 and 30 cm of depth on 4/7/2018. Finally, after harvest, PR generally decreased.
Reference values for mean PR in CT ranged between 0.3 and 2.5 MPa. In CT-NT, after three tractor passages, the mean PR measured in spring 2017 was about 1 MPa, with a significant increase with respect to reference values. Later, after a single passage following the spring tillage operation, the PR showed significant increase between 10 and 20 cm (0.9 and 1.7 MPa) and at maximum depth (3.5 MPa). At the end of July (after 10 passages), the soil PR was higher (3.1–8.3 MPa) than the reference below 10.5 cm, and then in the entire soil profile up to the end of season, it exceeded 9 MPa at maximum depth. In Year 2, the soil had high PR just after two early spring passages. Following spring tillage, the soil showed high PR at maximum depth again after the first two passages, and then the entire soil profile showed higher PR than the reference values, reaching highest mean values at maximum depth (7.6 MPa). In CT-T, after the first tractor passage following the autumn tillage operations, and until the spring tillage, the soil showed higher soil PR than the reference values up to 10.5 cm depth. After tillage in May 2017, a single tractor passage caused a significant increase of PR up to 25 cm in depth (mean values between 2.0 and 6.4 MPa), and, in the rest of the season, the entire profiles showed PR significantly higher than the reference (up to 24.8 MPa). During Year 2, after two tractor passages the PR was significantly higher, up to 10.5 cm, and up to 28 cm in following measurements (up to 11.1 MPa at maximum depth before harvest).
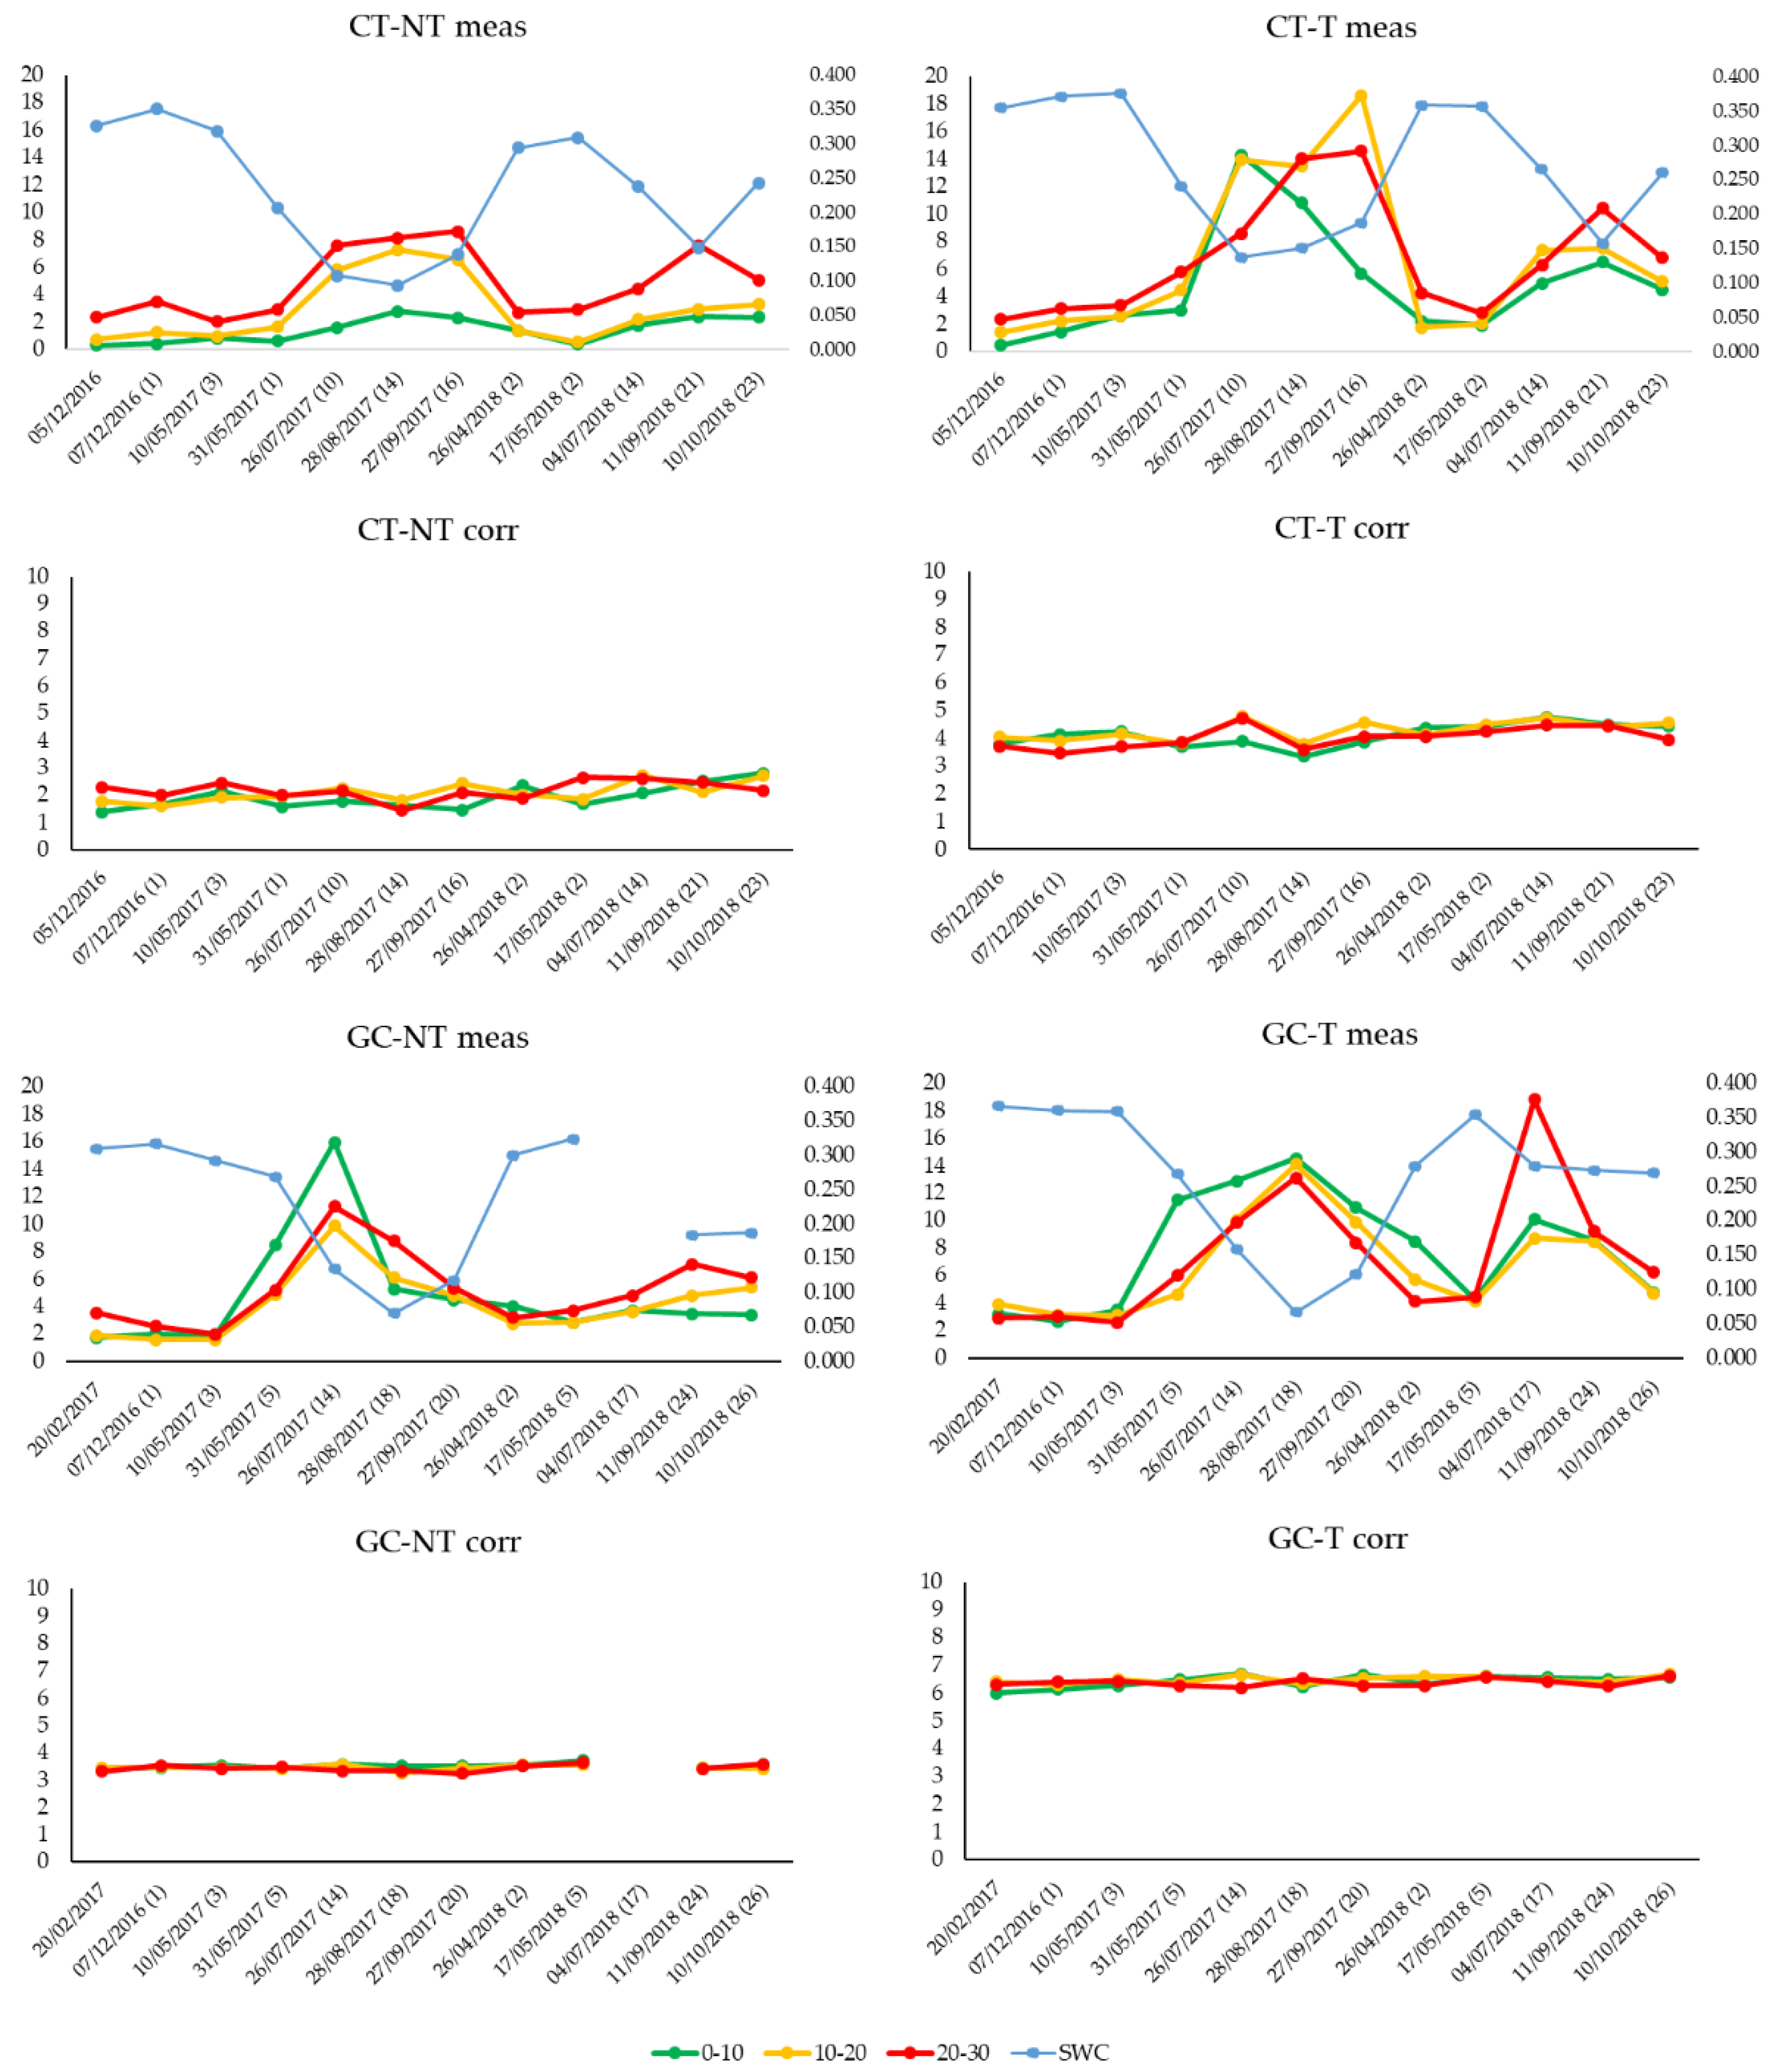
In Figure 5, it is evident, in both the treatments, how original PR values are higher when the SWC is lower, and the opposite. Such fluctuations were softened when normalized values were used. CT-NT is the only one position where most of normalized PR values are lower than 2.5 MPa (which is, according to Whalley et al. [65], the limit value generally accepted beyond which root elongation is significantly restricted); meanwhile, GC-T was the condition with higher values, above 6 MPa. The track positions presented normalized PR value always higher than NT positions, as well GC positions present always higher values than CT positions.
3.4. Field-Saturated Hydraulic Conductivity
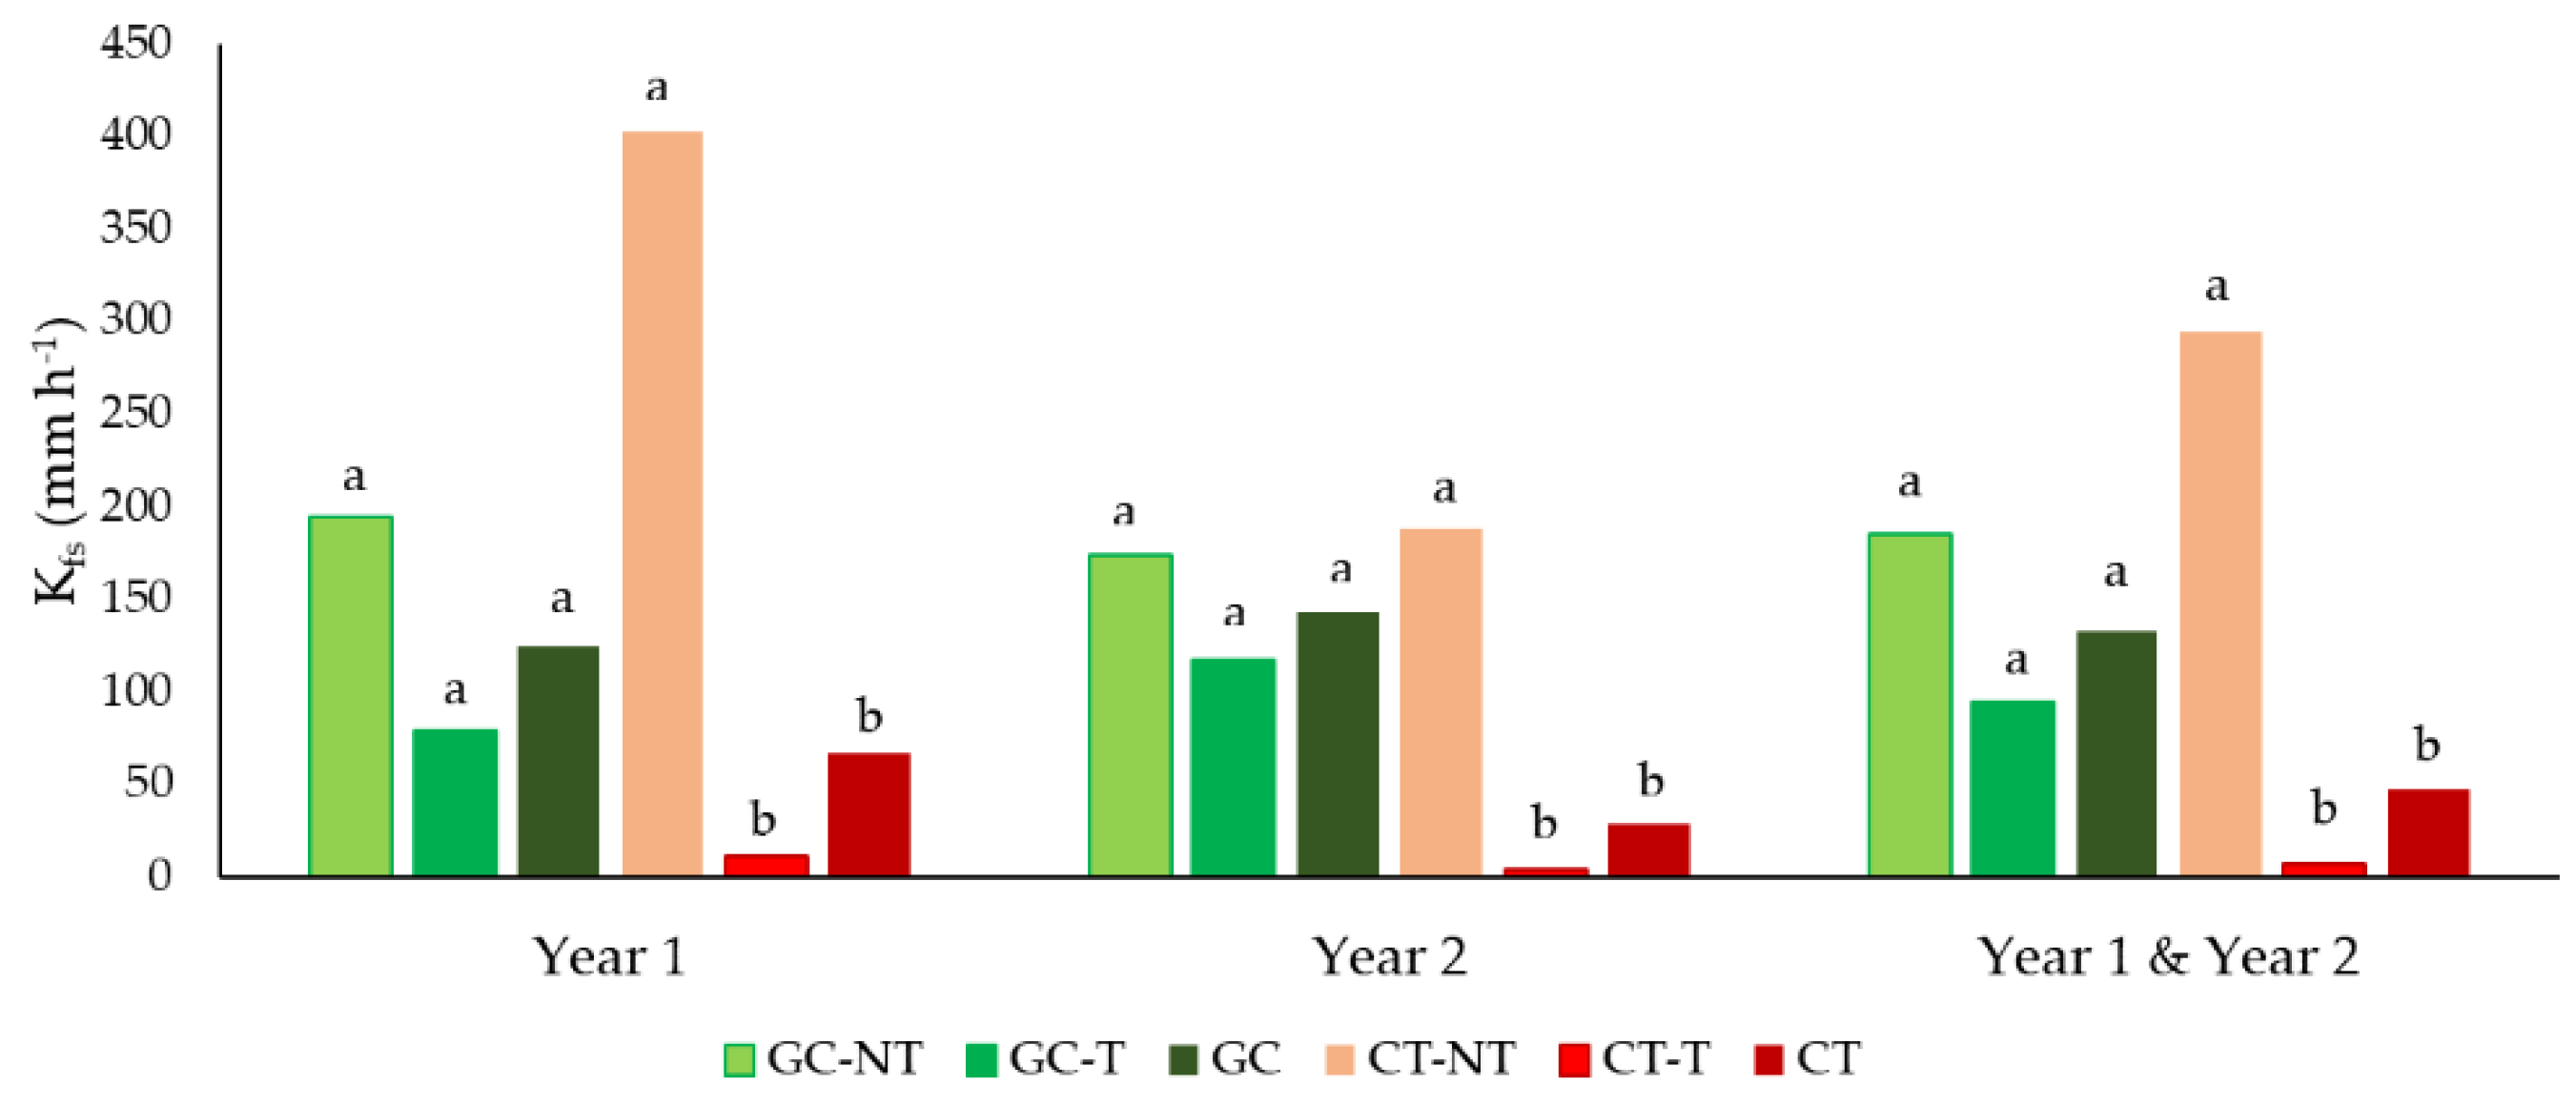
The mean values of the field-saturated hydraulic conductivity (Kfs) measured in the plots are shown in Figure 6. The mean annual values of Kfs ranged between 4 and 402 mm h−1, and they are significantly different when comparing NT and T measurements in CT in each season. Whilst the CT-NT mean values are not significantly different from GC-NT, the T and the overall mean values differ significantly between the two plots, both in each season and in the entire period of observation. Table 4 shows Kfs values measured in each plot and position in the two years in selected dates. In CT-T, all Kfs values were lower than 26 mm h−1, and they were lower than 10 mm h−1 after only one tractor passage on wet soil following the tillage operations. In CT-NT, values of Kfs ranged from 33 to 2642 mm h−1, with the lowest values (<50 mm h−1) measured before harvest. In the grassed plots, the Kfs values ranged from 33 to 1484 mm h−1 and from 12 to 527 mm h−1 in GC-T and GC-NT, respectively. Most of the measured values were higher than 50 mm h−1.
3.5. Runoff and Soil Losses
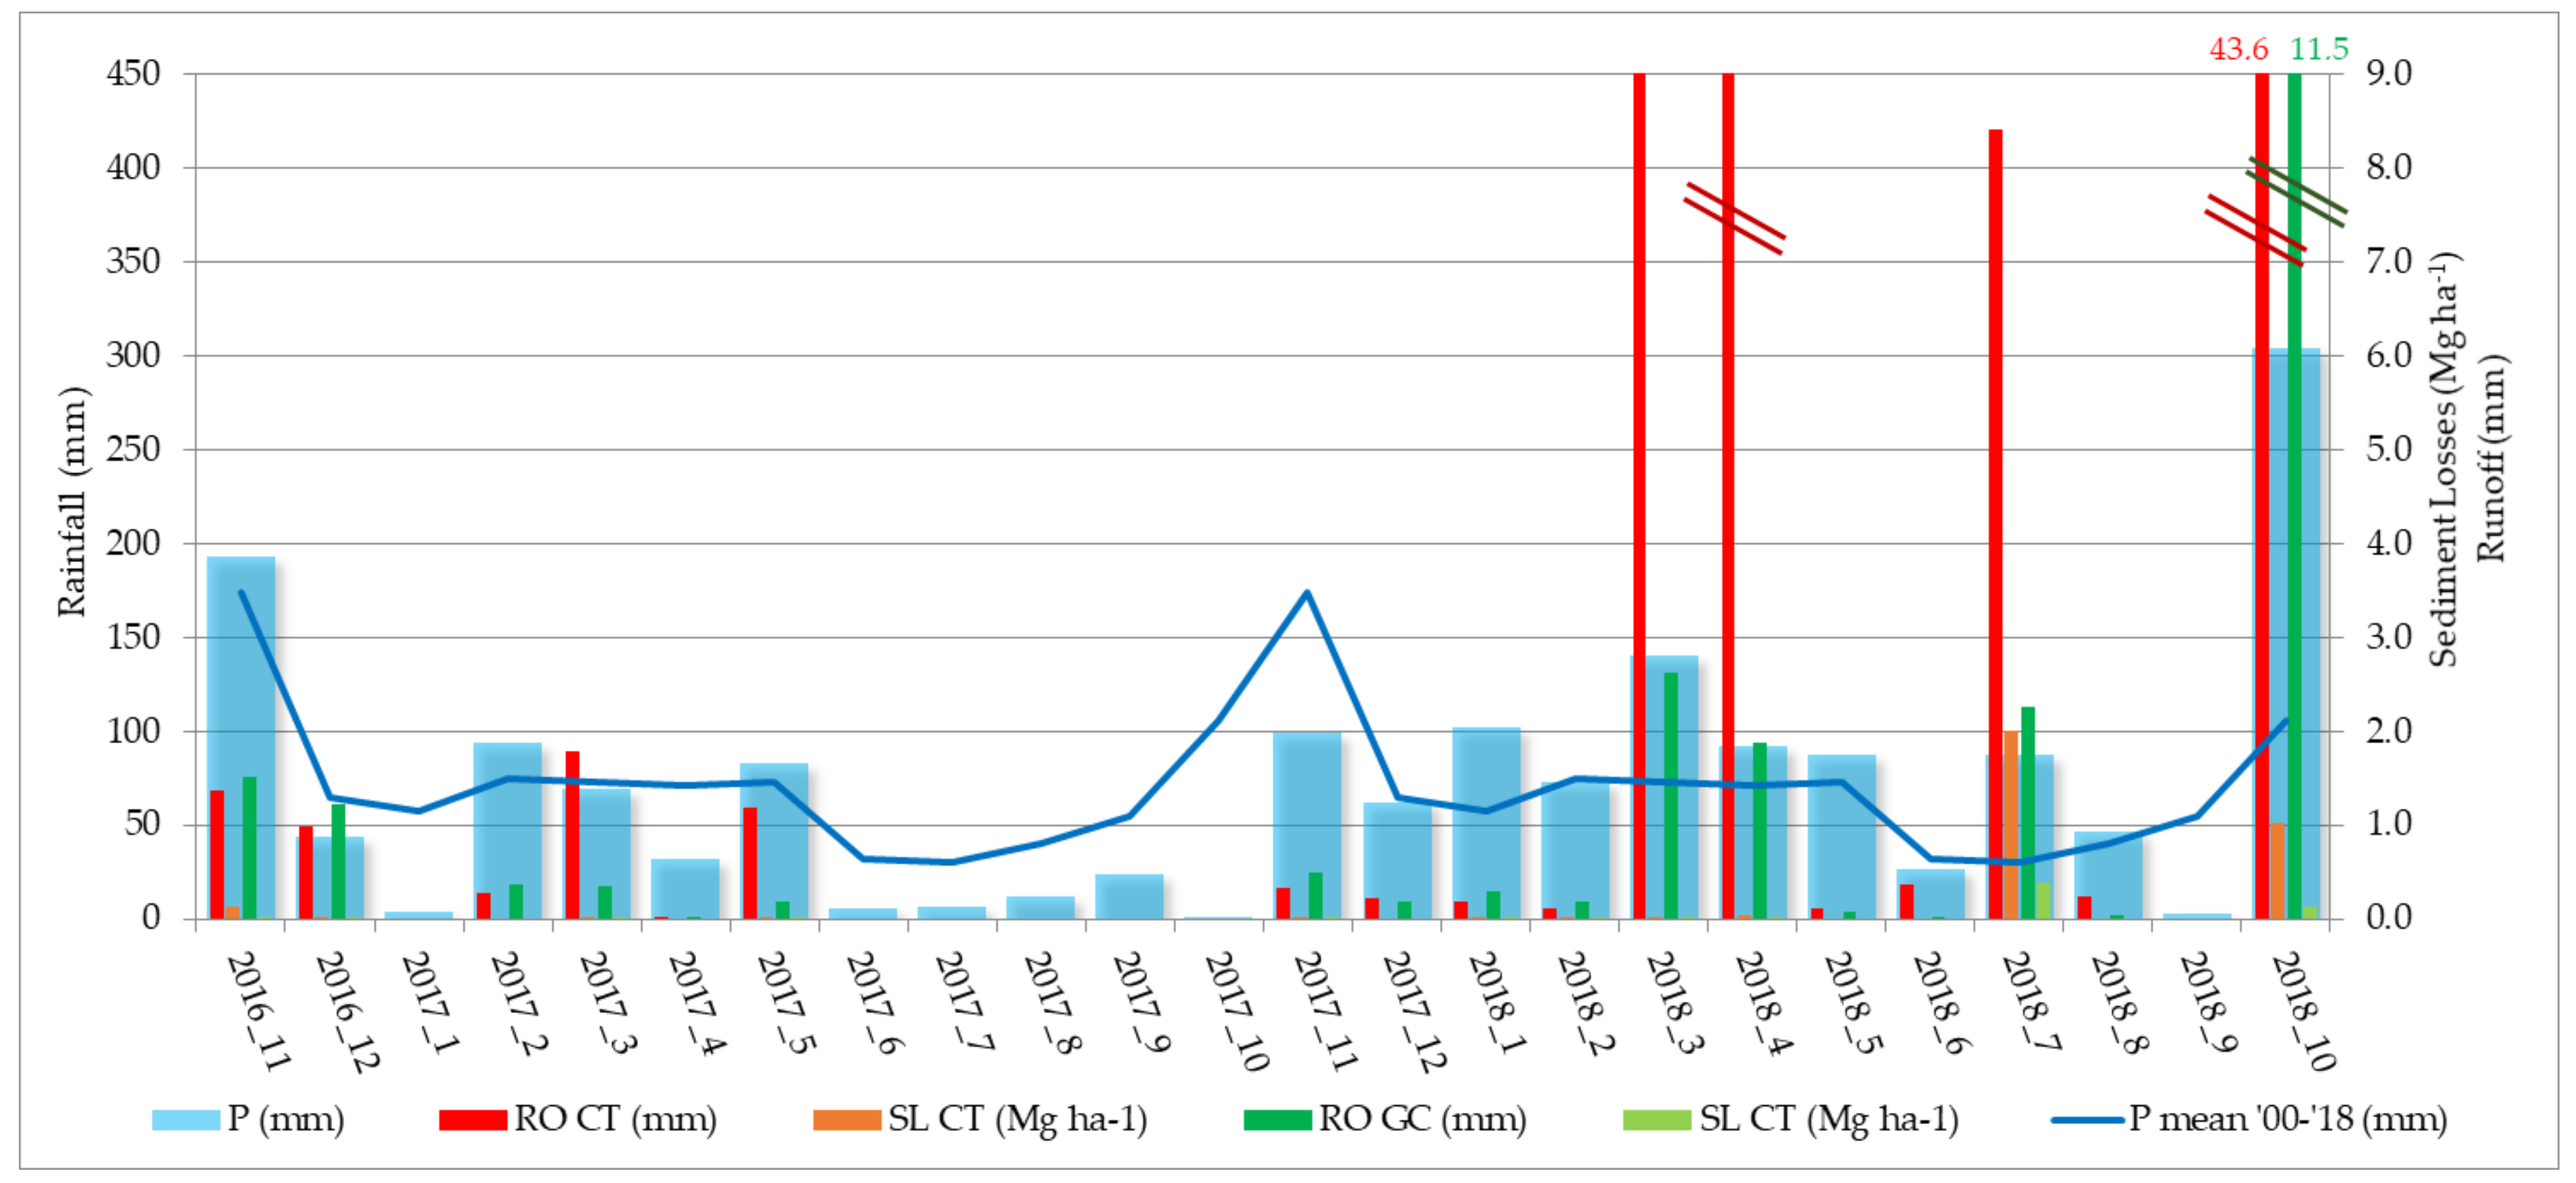
Figure 7 shows monthly runoff (RO) and soil loss (SL). As a consequence of 569 mm of precipitation (67% MAP) in Year 1, the runoff coefficient was lower than 1% and soil losses were only 5.8 and 3.3 kg ha−1 in CT and GC, respectively (Table 4). Sediment yield was 0.1% and 0.2% of the average annual soil loss measured in the 2000–2016 period (6.6 and 1.5 Mg ha−1 in CT and GC, respectively, according to Capello et al. [66]).
Year 2 was characterized by precipitation higher than MAP (149%), and, consequently, the runoff coefficient was 8% and 2% in CT and GC, respectively. In 2018, runoff was mainly concentrated during four rainfall events (10/3, 11/4, 16/7, and 27/10) that accumulated more than 94% and 91% of the annual runoff in CT and GC, respectively. The highest runoff coefficient was recorded during the 10/3 event in CT (26.7%) and the 27/10 event in GC (5.2%). Soil losses were 3.1 and 0.5 Mg ha−1 in CT and GC, respectively (that is 47% and 33% of the average 2000–2016 annual soil loss). They were concentrated during the rainfall occurred the 16/7/2018: 2 Mg ha−1 of soil loss in CT (64%) and 0.38 Mg ha−1 in GC (76%).
4. Discussion
During the study, Year 1 was not rainy, particularly in the period June–October 2017, when, after tillage and mowing operations, the soil was very dry. Summer rainfall increased the soil moisture in the topsoil in GC, without getting deeper, while no changes were recorded in CT. After a few sunny days, the soil dried rapidly, returning to a low SWC value. In addition, after spring tillage, the soil surface in CT maintained the “ripped” appearance, and the superficial crust that is usually observed in tilled inter-rows after first rainfall events [46,67], or shallow ruts due to the traffic, were not observed. The GC soil was less turfed than in other years, and there were many up to 2 cm size cracks. In Year 2, precipitations were higher than MAP, particularly abundant in spring months, and relevant also in summer. Consequently, soil moisture was higher than 0.200 cm3 cm−3, even in summer months, when tractor traffic is frequent. In both years, SWC gravimetrically measured during surveys resulted generally higher in GC than in CT and in T than in NT. Increase in BD, PR, and SWC after traffic operations was measured by Barik et al. [68], where an increase in BD, at almost constant gravimetric water content, corresponds to an increase of the volumetric water content. Higher volumetric SWC and BD were also observed in grassed inter-rows, rather than tilled, by Bogunovic et al. [69] in a Croatian vineyard.
The inter-annual high variability of rainfall and soil moisture conditions were reflected by the different evolution of BD and PR values along the two growing seasons. As expected, during Year 1, BD generally increased already during winter and spring, also in the CT-T position, since the first tractor passage occurred in December 2016. On 08/06/2017, after six (GC) and two (CT) tractor passages, BD did not show significant differences with reference in both plots. On 26/07/2017, very high BD values were observed, that in CT-T below 10 cm of depth reached the maximum value, very close to the proctor value identified for the CT soil (1.60 g cm−3). In the same date, the highest seasonal BD values were observed in the GC-T position up to 20 cm depth, exceeding the GC proctor values. Since the winter and the last tillage operation 14 and 10 tractor passages have occurred in GC and CT, respectively. The last passage was performed just the day before the survey (25/07/2017), and a minor storm (only 3 mm of rain) was recorded the previous evening (24/07/2017 between 18.00 and 19.00), but moisture sensors did not show increasements of SWC in any position. The high compaction level was likely due to the increasing number of passages, even if they were performed on soil with SWC lower than 0.200 m3 m−3. Since May, and until the post-harvest survey, BD was higher in GC than in CT, especially in the most superficial layer, as Guzmán et al. [25] already observed in vineyards of the Montilla-Moriles region (with MAP of 604 mm). During the following survey (28/08/2017), BD decreased to lower values despite the additional tractor passages, whereas it was expected to increase, as usually observed in vineyards with various soil management [61]. This behaviour could be explained with a recovery of soil properties thanks to some wet/dry cycles consequent to rainfall events that occurred between the last tractor passage and the survey. An increase of the Kfs was also observed in CT-T. O’Keefe [70] showed that changes of the bulk density after three wetting/drying cycles can be significantly different. Also the measured PR values were very high in all positions at the end of July, up to 25 MPa at the 7 cm depth in GC-NT. Similarly, Bogunvic et al. [69] observed PR values significantly higher in a grassed inter-row than in tilled one. High values of PR were generally measured during the 2017 summer, with dry soil (mean SWC < 0.200 m3 m−3 at 0–30 cm depth, during the measurements). The PR profiles were similar to those obtained by Vaz et al. [59] in dry, sandy clay loam soil, with PR higher than 16 MPa. Such high values are not comparable with measurements obtained with moister soil. Looking at the corrected PR values (calculated for SWCcorr = 0.300 m3 m−3), the temporal trend of PRcorr reflects the one of BD, as expected due to correction equation, and the highest PRcorr values were associated with the GC treatment, both in T and in NT positions. The most limiting Kfs values in CT-T (lower than 20 mm h−1) were associated to BD higher than 1.42 g cm−3 up to 20 cm depth. The inverse relationship between BD and Kfs is especially evident in T position with both soil managements, as already observed in previous seasons [12,66]. During summer 2017, despite higher BD and PR values in GC-T than in CT-T, Kfs in GC-T was always higher than 50 mm h−1, favouring more water infiltration and avoiding the conditions for Hortonian runoff during rainfall events. An increase of surface cracks was observed during summer, especially in the GC plot, and the presence of preferential flow ways can explain the increase of hydraulic conductivity [70]. In the NT position of the two plots, the Kfs was higher than 100 mm h−1 until the end of August.
In Year 2, surveys were not carried out during the winter. Since the first survey, which occurred on 26/4/2018 after two tractor passages, the BD showed some values higher than the reference values. The frequent tractor passages on the moist soil during spring and summer resulted in BD approaching or overcoming the proctor value in the first 20 cm of soil both in GC-T, and in CT-T during almost all surveys until the end of August. Highest values were reached in T in GC-T after 10 passages, and in CT-T after 14 passages. In Year 2, the range of PR values was less wide than in the previous season, reflecting the lower variations of SWC. However, this parameter showed an increasing trend during spring and summer: the highest values were reached on the same dates as BD. Considering PRcorr values, they resulted similar to Year 1, but generally higher in CT-T in the second observed season than in the first one, with most of values exceeding 4.1 MPa. Similar to Year 1, the lowest values of Kfs (lower than 10 mm h−1) were observed in CT-T, where soil always showed a BD higher than 1.42 g cm−3, at least in the first 20 cm of soil. On the contrary, the PR, both directly measured and corrected, seems to be less related with variations of Kfs. As an example, GC-T, for which PRcorr always showed higher values than other treatments, did not show the lowest values of Kfs. The combination of weather conditions, soil, and traffic management solutions resulted in relevant runoff during some spring, summer, and autumn rainfall events, especially in the CT plot.
In both Years, Kfs in CT resulted significantly lower in T than NT and both positions of GC: in particular, after just one tractor passages on wet soil after tillage operation, Kfs in CT-T fell down from value over 1000 to near 1 mm h−1. Those results highlight the need to limit the soil surface directly interested by tractor traffic, in order to reduce negative effects due to soil compaction. In their study on the spatial variability of soil compaction in the Languedoc vineyard region, Lagacherie et al. [30] highlighted that the use of tractor and trailed tools is the mainly responsible for compaction, representing this management practice as the cause of 42% of the compacted soil in their study.
In Year 1, runoff and soil erosion were very low, in consequence of the absence from December to October of rainfall events with p > 50 mm and intensity (MAX_15) >16 mm, which Bagagiolo et al. [12] demonstrated to be responsible for relevant runoff in sloping vineyards of Monferrato. In this case, soil management and tractor passages influenced hydrological and soil degradation processes to a lesser extent than usual. In fact, runoff and soil losses were reduced by 35% and 43% in the GC compared to the CT plot, whereas the average event reduction by grass cover in the study area resulted in 55% and 79% for runoff and soil losses, respectively [16]. Nevertheless, high-erosive events can occur also in semi-arid climates, and studies in Portugal and Spain [14,71,72] already showed how inter-row’s vegetative cover can reduce soil losses in vineyards, compared to the management with tillage, especially during the most intense precipitations. More than 90% of runoff in Year 2 was concentrated during four rainfall events, which can be classified, according to Bagagiolo et al. [16], as “long lasting” (10/3, 11/4, 27/10), for which saturation-excess runoff occurred (driven by high SWC, as evident in the graph of Figure 2), and “intense” (16/7), for which infiltration-excess runoff occurred, as observed by Biddoccu et al. [34]. When analyzing the 16/7 event, it is clear how Kfs in CT-T was 20 times lower (4.2 mm h−1) than the 15 min maximum intensity (84.3 mm h−1). Consequently, it is almost certain that there was runoff along the track, notwithstanding, in the no-track position, the Kfs was higher (120.1 mm h−1). In GC, Kfs was higher (371.2 and 150.7 mm h−1 in GC-T and GC-NT, respectively) than the intensity; this can explain why runoff was higher in CT (8.27 mm) than in GC (2.26 mm).
In these cases (both in saturation-excess and in infiltration-excess runoff) the effect of the soil management, as well as traffic over wet soil, was evident: runoff and soil loss were considerably higher in CT than in GC. In such a climate, with some possible intense or long lasting events, the soil management with permanent grass cover provides more soil hydraulic conductivity and soil water recharge, reducing runoff and soil losses. In particular, in autumn and winter, because the runoff generally occurs due to soil saturation in CT [12], rainfall events caused runoff higher than GC despite the autumn ripping and the usually higher Kfs, in respect to the other seasons and to the management with grassing [73]. Lateral flow under the soil surface could also occur when infiltrating water moves laterally and locally along an inclined hydraulically restrictive layer, such as the compacted plough pan, as observed by Jiang et al. [74]. The loss of water in the winter period can be the cause of the lower water recharge of the entire soil profile in the CT vineyard, compared to GC, especially in the less-rainy seasons, as directly measured by Gaudin et al. [29].
The mostly erosive events were characterized by high rainfall amount (peculiar of autumn and winter) or by their high intensity (spring and summer storms). In both the cases, GC erosion was reduced in respect to CT. Moreover, the considerable soil loss of the 16/07/2018 (3.1 and 0.5 Mg ha−1 in CT and GC, respectively) could be influenced by frequent tractors and people passages over dry soil, which can favor presence of detached soil particles that can be transported by runoff and also on occasions of a little precipitation, as observed by Kirchhoff et al. [17] in the German Mosella vineyards.
5. Conclusions
The effect of the soil management and tractor passes over wet soil was evident in the wet year (Year 2), where GC reduced considerably runoff (−76%) and soil loss (−83%) compared to CT. When weather conditions present possible intense or long-lasting events, the soil management with permanent grass cover provides greater soil hydraulic conductivity (most of the measured values were higher than 50 mm h−1) and soil water recharge, reducing runoff and soil losses.
Soil bulk density and penetration resistance in CT-T increase, compared to GC-T, after only one to three tractor passages following tillage operation, especially in the topsoil (first 10 cm). Soil compaction affects water infiltration, especially in the wet year. In CT, one tractor passage on wet soil after tillage operation dramatically reduced Kfs from over 1000 to near 1 mm h−1, while in GC, Kfs remained above the usual rain-intensity values, allowing water to infiltrate the soil. Consequently, runoff and soil erosion were higher in the tilled plot, even if lower than the long-period average values. Soil benefits from tillage only if there isn’t any machine traffic; therefore, management in alternate rows, with traffic only in grassed rows, could be a valid alternative that is worth investigating in future studies. This study raises interest on issues such as the effects of traffic on the subsoil compaction and the role of the plow pan on the subsurface runoff, and their effects on water balance (water input), as well as on a spatial scale wider than on a single plot.
Author Contributions
Conceptualization, G.C. and M.B.; methodology, G.C. and S.F.; validation, M.B.; formal analysis, M.B.; data curation, G.C.; writing—original draft preparation, G.C. and M.B.; writing—review and editing, S.F. and E.C.; visualization, G.C. and M.B.; supervision, M.B. and S.F.; project administration, E.C.; funding acquisition, E.C.
Funding
This research was partially funded by the Fondazione Giovanni Goria and Fondazione CRT (Bando Talenti della Società Civile 2016). Part of this research was carried out within the framework of the WATER4EVER Project, which is funded under the WaterWorks2015 2 Call, with contribution of EU and MIUR.
Acknowledgments
The Authors thank Giuseppe Delle Cave, Giancarlo Padovan, Giorgia Bagagiolo, and Guarino Benvengù for the support in field operations and in laboratory analysis; the staff of the Tenuta Cannona Experimental Centre, which collaborated managing the vineyards and in sample collections. The content of this article reflects only the authors’ views, and the WaterWorks2015 Consortium is not liable for any use that may be made of the information contained therein.
Conflicts of Interest
The authors declare no conflicts of interest. The funders had no role in the design of the study; in the collection, analyses, or interpretation of data; in the writing of the manuscript; or in the decision to publish the results.
References
- OIV-Organizzazione Internazionale della Vigna e del Vino. Available online: http://www.oiv.int/ (accessed on 15 August 2019).
- Martucci, O.; Arcese, G.; Montauti, C.; Acampora, A. Social Aspects in the Wine Sector: Comparison between Social Life Cycle Assessment and VIVA Sustainable Wine Project Indicators. Resources 2019, 8, 69. [Google Scholar] [CrossRef]
- Vaudour, E.; Costantini, E.; Jones, G.V.; Mocali, S. An overview of the recent approaches to terroir functional modelling, footprinting and zoning. Soil 2015, 1, 287–312. [Google Scholar] [CrossRef] [Green Version]
- Millennium Ecosystem Assessment. Ecosystems and Human Well-Being: Synthesis; Island Press: Washington, DC, USA, 2005; ISBN 1-59726-040-1. [Google Scholar]
- Beaufoy, G. EU Policies for Olive Farming; Unsustainable on All Counts; BirdLife International-WWF: Brussels, Belgium, 2001. [Google Scholar]
- Scheidel, A.; Krausmann, F. Diet, trade and land use: A socio-ecological analysis of the transformation of the olive oil system. Land Use Policy 2011, 28, 47–56. [Google Scholar] [CrossRef]
- Fernandez Escobar, R.; de la Rosa, R.; Leon, L.; Gomez, J.A.; Testi, F.; Orgaz, M.; Gil-Ribes, J.A.; Quesada-Moraga, E.; Trapero, A. Evolution and sustainability of the olive production systems. In Present and Future of the Mediterranean Olive Sector; Arcas, N., Arroyo López, F.N., Caballero, J., D’Andria, R., Fernández, M., Fernandez, E.R., Garrido, A., López-Miranda, J., Msallem, M., Parras, M., et al., Eds.; CIHEAM/IOC: Zaragoza, Spain, 2013; pp. 11–42. [Google Scholar]
- Communication from the Commission to the Council, the European Parliament, the European economic and social Committee and the Committee of the Regions. Thematic Strategy for Soil Protection; CEC: Brussels, Belgium, 2006. [Google Scholar]
- European Parliament. Proposal for a Directive of the European Parliament and of the Council Establishing a Framework for the Protection of Soil and Amending Directive 2004/35/EC; CEC: Brussels, Belgium, 2006.
- FAO & ITPS. Status of the World’s Soil Resources (Main Report); FAO: Rome, Italy, 2015; p. 608. [Google Scholar]
- Hamza, M.A.; Anderson, W.K. Soil compaction in cropping systems: A review of the nature, causes and possible solutions. Soil Tillage Res. 2005, 82, 121–145. [Google Scholar] [CrossRef]
- Biddoccu, M.; Ferraris, S.; Pitacco, A.; Cavallo, E. Temporal variability of soil management effects on soil hydrological properties, runoff and erosion at the field scale in a hillslope vineyard, North-West Italy. Soil Tillage Res. 2017, 165, 46–58. [Google Scholar] [CrossRef] [Green Version]
- Ferrero, A.; Usowicz, B.; Lipiec, J. Effects of Tractor Traffic on Spatial Variability of Soil Strength and Water Content in Grass Covered and Cultivated Sloping Vineyard. Soil Tillage Res. 2005, 84, 127–138. [Google Scholar] [CrossRef]
- Ferreira, C.S.S.; Keizer, J.J.; Santos, L.M.B.; Serpa, D.; Silva, V.; Cerqueira, M.; Ferreira, A.J.D.; Abrantes, N. Runoff, sediment and nutrient exports from a Mediterranean vineyard under integrated production: An experiment at plot scale. Agric. Ecosyst. Environ. 2018, 256, 184–193. [Google Scholar] [CrossRef]
- Gómez, J.A. Sustainability using cover crops in Mediterranean tree crops, olives and vines—Challenges and current knowledge. Hung. Geogr. Bull. 2017, 66, 13–28. [Google Scholar] [CrossRef]
- Bagagiolo, G.; Biddoccu, M.; Rabino, D.; Cavallo, E. Effects of rows arrangement, soil management, and rainfall characteristics on water and soil losses in Italian sloping vineyards. Environ. Res. 2018, 166, 690–704. [Google Scholar] [CrossRef]
- Kirchhoff, M.; Rodrigo-Comino, J.; Seeger, M.; Ries, J.B. Soil erosion in sloping vineyards under conventional and organic land use managements (Saar-Mosel Valley, Germany). Cuadernos de Investigación Geográfica 2017, 207, 119–140. [Google Scholar] [CrossRef]
- Comino, J.R.; Senciales, J.M.; Ramos, M.C.; Martínez-Casasnovas, J.A.; Lasanta, T.; Brevik, E.C.; Ries, J.B.; Sinoga, J.R. Understanding soil erosion processes in Mediterranean sloping vineyards (Montes de Málaga, Spain). Geoderma 2017, 296, 47–59. [Google Scholar] [CrossRef]
- Novara, A.; Gristina, L.; Saladino, S.S.; Santoro, A.; Cerdà, A. Soil erosion assessment on tillage and alternative soil managements in a Sicilian Vineyard. Soil Tillage Res. 2011, 117, 140–147. [Google Scholar] [CrossRef]
- Biddoccu, M.; Opsi, F.; Cavallo, E. Relationship between runoff and soil losses with rainfall characteristics and long-term soil management practices in a hilly vineyard (Piedmont, NW Italy). Soil Sci. Plant Nutr. 2014, 60, 92–99. [Google Scholar] [CrossRef] [Green Version]
- Biddoccu, M.; Zecca, O.; Audisio, C.; Godone, F.; Barmaz, A.; Cavallo, E. Assessment of long-term soil erosion in a mountain vineyard, Aosta Valley (NW Italy). Land Degrad. Dev. 2018, 29, 617–629. [Google Scholar] [CrossRef]
- Winter, S.; Bauer, T.; Strauss, P.; Kratschmer, S.; Paredes, D.; Popescu, D.; Landa, B.; Guzmán, G.; Gómez, J.A.; Guernion, M.; et al. Effects of vegetation management intensity on biodiversity and ecosystem services in vineyards: A meta-analysis. J. Appl. Ecol. 2018, 55, 2484–2495. [Google Scholar] [CrossRef] [PubMed] [Green Version]
- Novara, A.; Minacapilli, M.; Santoro, A.; Rodrigo-Comino, J.; Carrubba, A.; Sarno, M.; Venezia, G.; Gristina, L. Real cover crops contribution to soil organic carbon sequestration in sloping vineyard. Sci. Total Environ. 2019, 652, 300–306. [Google Scholar] [CrossRef] [PubMed]
- Garcia, L.; Celette, F.; Gary, C.; Ripoche, A.; Valdés-Gómez, H.; Metay, A. Management of service crops for the provision of ecosystem services in vineyards: Areview. Agric. Ecosyst. Environ. 2018, 251, 158–170. [Google Scholar] [CrossRef]
- Guzmán, G.; Cabezas, J.M.; Sánchez-Cuesta, R.; Zaller, J.G.; Gómez, J.A. A field evaluation of the impact of temporary cover crops on soil properties and vegetation communities in southern Spain vineyards. Agric. Ecosyst. Environ. 2019, 272, 135–145. [Google Scholar] [CrossRef]
- López-Vicente, M.; Álvarez, S. Stability and patterns of topsoil water content in rainfed vineyards, olive groves, and cereal fields under different soil and tillage conditions. Agric. Water Manag. 2018, 201, 167–176. [Google Scholar] [CrossRef]
- Haruna, S.; Nkongolo, N.; Anderson, S.; Eivazi, F.; Zaibon, S. In situ infiltration as influenced by cover crop and tillage management. J. Soil Water Conserv. 2018, 73, 164–172. [Google Scholar] [CrossRef]
- Capello, G.; Biddoccu, M.; Ferraris, S.; Pitacco, A.; Cavallo, E. Year-round variability of field-saturated hydraulic conductivity and runoff in tilled and grassed vineyards. Chem. Eng. Trans. 2017, 58, 739–744. [Google Scholar] [CrossRef]
- Gaudin, R.; Celette, F.; Gary, C. Contribution of runoff to incomplete off season soil water refilling in a Mediterranean vineyard. Agric. Water Manag. 2010, 97, 1534–1540. [Google Scholar] [CrossRef]
- Celette, F.; Gaudin, R.; Gary, C. Spatial and temporal changes to the water regime of a Mediterranean vineyard due to the adoption of cover cropping. Eur. J. Agron. 2008, 29, 153–162. [Google Scholar] [CrossRef]
- Fourie, J.C. Soil Management in the Breede River Valley Wine Grape Region, South Africa. Organic matter and macro-nutrient content of a medium-textured soil. S. Afr. J. Enol. Vitic. 2012, 33, 105–114. [Google Scholar] [CrossRef]
- Guilpart, N.; Metay, A.; Gary, C. Grapevine bud fertility and number of berries per bunch are determined by water and nitrogen stress around flowering in the previous year. Eur. J. Agron. 2014, 54, 9–20. [Google Scholar] [CrossRef]
- Ruiz-Colmenero, M.; Bienes, R.; Marques, M.J. Soil and water conservation dilemmas associated with the use of green cover in steep vineyards. Soil Tillage Res. 2011, 117, 221–223. [Google Scholar] [CrossRef]
- IPLA. Programma di Sviluppo Rurale 2007–2013—Monitoraggio Ambientale. Available online: http://www.regione.piemonte.it/agri/psr2007_13/dwd/monitoraggio/PSRvalutazioneFinale2016.pdf (accessed on 29 December 2018).
- Cerdà, A.; Keesstra, S.D.; Rodrigo-Comino, J.; Novara, A.; Pereira, P.; Brevik, E.; Giménez-Morera, A.; Fernández-Raga, M.; Pulido, M.; di Prima, S.; et al. Runoff initiation, soil detachment and connectivity are enhanced as a consequence of vineyards plantations. J. Environ. Manag. 2017, 202, 268–275. [Google Scholar] [CrossRef] [PubMed] [Green Version]
- Ramos, M.C.; Martínez-Casasnovas, J.A. Impact of land levelling on soil moisture and runoff variability in vineyards under different rainfall distributions in a Mediterranean climate and its influence on crop productivity. J. Hydrol. 2006, 31, 131–146. [Google Scholar] [CrossRef]
- Lagacherie, P.; Coulouma, G.; Ariagno, P.; Virat, P.; Boizard, H.; Richard, G. Spatial variability of soil compaction over a vineyard region in relation with soils and cultivation operations. Geoderma 2006, 134, 207–216. [Google Scholar] [CrossRef]
- Marinello, F.; Pezzuolo, A.; Cillis, D.; Chiumenti, A.; Sartori, L. Traffic effects on soil compaction and sugar beet (Beta vulgaris L.) taproot quality parameters. Span. J. Agric. Res. 2017, 15, 11. [Google Scholar] [CrossRef]
- Spinelli, R.; Magagnotti, N.; Cavallo, E.; Capello, G.; Biddoccu, M. Reducing soil compaction after thinning work in agroforestry plantations. Agrofor. Syst. 2019, 93, 1765–1779. [Google Scholar] [CrossRef]
- Alaoui, A.; Roggerb, M.; Pethc, S.; Blöschlb, G. Does soil compaction increase floods? A review. J. Hydrol. 2018, 557, 631–642. [Google Scholar] [CrossRef]
- Tropeano, D. Rate of soil erosion processes on vineyards in Central Piedmont (NW Italy). Earth Surf. Process. Landf. 1984, 9, 253–266. [Google Scholar] [CrossRef]
- Boni, A.; Casnedi, R. Note illustrative della Carta Geologica d’Italia alla scala 1:100,000 Fogli 69 e 70 Asti-Alessandria; Servizio Geologico d’Italia, Poligrafica & Cartevalori: Ercolano (Napoli), Italy, 1970; p. 64. [Google Scholar]
- Soil Survey Staff. Keys to Soil Taxonomy, 11th ed.; USDA-Natural Resources Conservation Service: Washington, DC, USA, 2010.
- FAO/ISRIC/ISSS. World Reference Base for Soil Resources; World Soil Resources Report, No. 84; FAO: Rome, Italy, 1998. [Google Scholar]
- Kottek, M.; Grieser, J.; Beck, C.; Rudolf, B.; Rubel, F. World Map of the Köppen-Geiger climate classification updated. Meteorol. Z. 2006, 15, 259–263. [Google Scholar] [CrossRef]
- Biddoccu, M.; Ferraris, S.; Opsi, F.; Cavallo, E. Long-term monitoring of soil management effects on runoff and soil erosion in sloping vineyards in Alto Monferrato (North-West Italy). Soil Tillage Res. 2016, 155, 176–189. [Google Scholar] [CrossRef]
- Sohne, W. Druckverteilung im Boden und Boden-verformung unter Schlepperreifen. Grundlagen der Landtechnik 1953, 5, 49–63. [Google Scholar]
- Bagarello, V.; Iovino, M.; Elrick, D. A simplified falling-head technique for rapid determination of fieldsaturated hydraulic conductivity. Soil Sci. Soc. Am. J. 2004, 68, 66–73. [Google Scholar] [CrossRef]
- ARS-USDA. RIST Rainfall Intensity Summarization Tool. 2015. Available online: http://www.ars.usda.gov/Research/docs.htm?docid=3251 (accessed on 4 April 2019).
- Brown, L.C.; Foster, G.R. Storm erosivity using idealized intensity distributions. Trans. ASAE 1987, 30, 379–386. [Google Scholar] [CrossRef]
- Renard, K.G.; Foster, G.R.; Weesies, G.A.; McCool, D.K.; Yoder, D.C. Predicting Soil Erosion by Water: A Guide to Conservation Planning with the Revised Universal Soil Loss Equation (RUSLE); US Department of Agriculture Agricultural Handbook No.703; USDA: Washington, DC, USA, 1997.
- Raffelli, G.; Previati, M.; Canone, D.; Gisolo, G.; Bevilacqua, I.; Capello, G.; Biddoccu, M.; Cavallo, E.; Deiana, R.; Cassiani, G.; et al. Local- and Plot-Scale Measurements of Soil Moisture: Time and Spatially Resolved Field Techniques in Plain, Hill and Mountain Sites. Water 2017, 9, 706. [Google Scholar] [CrossRef]
- Ampoorter, E.; Goris, R.; Cornelis, W.; Verheyen, K. Impact of mechanized logging on compaction status of sandy forest soils. For. Ecol. Manag. 2007, 241, 162–174. [Google Scholar] [CrossRef]
- Proctor, R. Fundamental principles of soil compaction. Eng. News Rec. 1933, 111, 245–248, 286–289, 348–351. [Google Scholar]
- Herrick, J.E.; Jones, T.L. A dynamic cone penetrometer for measuring soil penetration resistance. Soil Sci. Soc. Am. J. 2002, 66, 1320–1324. [Google Scholar] [CrossRef]
- Halliday, D.; Resnick, R. Physics, for Students of Science and Engineering, combined edition; John Wiley & Sons: Hoboken, NJ, USA, 1963. [Google Scholar]
- Busscher, W.J.; Bauer, P.J.; Camp, C.R.; Sojka, R.E. Correction of cone index for soil water content differences in a coastal plain soil. Soil Tillage Res. Amst. 1997, 43, 205–217. [Google Scholar] [CrossRef]
- Busscher, W.J. Adjustment of flat-tipped penetrometer resistance data to a common water content. Trans. ASAE 1990, 33, 519–524. [Google Scholar] [CrossRef]
- Vaz, C.M.P.; Manieri, J.M.; de Maria, I.C.; Tuller, M. Modeling and correction of soil penetration resistance for varying soil water content. Geoderma 2011, 166, 92–101. [Google Scholar] [CrossRef]
- Jakobsen, B.F.; Dexter, A.R. Effect of soil structure on wheat root growth, water uptake and grain yield. A computer simulation model. Soil Tillage Res. 1987, 10, 331–345. [Google Scholar] [CrossRef]
- Bodhinayake, W.; Si, B.C.; Noborio, K. Determination of hydraulic properties in sloping landscapes from tension and double-ring infiltrometers. Vadose Zone J. 2004, 3, 964–970. [Google Scholar] [CrossRef]
- Warrick, A.W. Environmental Soil Physics; Hillel, D., Ed.; Academic Press: San Diego, CA, USA, 1998; pp. 665–675. [Google Scholar]
- Bagarello, V.; Sgroi, A. Using the simplified falling head technique to detect temporal changes in field-saturated hydraulic conductivity at the surface of a sandy loam soil. Soil Tillage Res. 2007, 94, 283–294. [Google Scholar] [CrossRef]
- Snedecor, G.W. Statistical Methods Applied to Experiments in Agriculture and Biology; Iowa State College Press: Ames, IA, USA, 1957. [Google Scholar]
- Whalley, W.R.; To, J.; Kay, B.D.; Whitmore, A.P. Prediction of the penetrometer resistance of soils with models with few parameters. Geoderma 2007, 137, 370–377. [Google Scholar] [CrossRef]
- Capello, G.; Biddoccu, M.; Ferraris, S.; Pitacco, A.; Cavallo, E. Effects of Soil Management and Traffic on Water and Soil Conservation in Agriculture: A Case Study in Piedmont. In Proceedings of the 15th Biennial Conference Euromediterranean Network of Experimental and Representative Basins, At Coimbra, Portugal, 9–13 September 2014. [Google Scholar]
- Alagna, V.; Bagarello, V.; Di Prima, S.; Guaitoli, F.; Iovino, M.; Cerdà, A. Using Beerkan experiments to estimate hydraulic conductivity of a crusted loamy soil in a Mediterranean vineyard. J. Hydrol. Hydromech. 2019, 67, 191–200. [Google Scholar] [CrossRef] [Green Version]
- Barik, K.; Aksakal, E.L.; Islam, K.R.; Sari, S.; Angin, I. Spatial variability in soil compaction properties associated with field traffic operations. Catena 2014, 120, 122–133. [Google Scholar] [CrossRef]
- Bogunovic, I.; Bilandzija, D.; Andabaka, Z.; Stupic, D.; Comino, J.R.; Cacic, M.; Brezinscak, L.; Maletic, E.; Pereira, P. Soil compaction under different management practices in a Croatian vineyard. Arab. J. Geosci. 2017, 10, 340. [Google Scholar] [CrossRef]
- O’Keefe, S. The Recovery of Soils after Compaction: A Laboratory Investigation into the Effect of Wet/Dry Cycles on Bulk Density and Soil Hydraulic Functions. Ph.D. Thesis, Cranfield University at Silsoe, National Soil Resources Institute, Cranfield, UK, 2009. [Google Scholar]
- Gómez, J.A.; Llewellyn, C.; Basch, G.; Sutton, P.B.; Dyson, J.S.; Jones, C.A. The effects of cover crops and conventional tillage on soil and runoff loss in vineyards and olive groves in several Mediterranean countries. Soil Use Manag. 2011, 27, 502–514. [Google Scholar] [CrossRef] [Green Version]
- Marques, M.J.; García-Muñoz, S.; Muñoz-Organero, G.; Bienes, R. Soil conservation beneath grass cover in hillside vineyards under mediterranean climatic conditions (Madrid, Spain). Land Degrad. Dev. 2010, 21, 122–131. [Google Scholar] [CrossRef]
- Capello, G.; Biddoccu, M.; Cavallo, E. Seasonal Variability and Effect of Tractor Passes on Soil Compaction, Field-Saturated Hydraulic Conductivity, Runoff and Soil Erosion in Tilled and Grassed Vineyards. In Proceedings of the Sixth International Congress on Mountain and Steep Slope Viticulture, San Cristobal de la Laguna (Isla de Tenerife), Spain, 26–28 April 2018; ISBN 978-88-902330-5-0. [Google Scholar]
- Jiang, X.; Liu, X.; Wang, E.; Li, X.G.; Sun, R.; Shi, W. Effects of tillage pan on soil water distribution in alfalfa-corn crop rotation systems using a dye tracer and geostatistical methods. Soil Tillage Res. 2015, 150, 68–77. [Google Scholar] [CrossRef]
Figure 1.
Location of the Tenuta Cannona Experimental Vine and Wine Centre of Agrion Foundation. Photos show the two soil managements.
Figure 1.
Location of the Tenuta Cannona Experimental Vine and Wine Centre of Agrion Foundation. Photos show the two soil managements.

Figure 2.
Precipitation (top), CT (middle) and GC (bottom) volumetric soil water content in Year 1 (left side) and Year 2 (right side).
Figure 2.
Precipitation (top), CT (middle) and GC (bottom) volumetric soil water content in Year 1 (left side) and Year 2 (right side).

Figure 3.
Standard Proctor compaction test: Year 1 (a) and Year 2 (b).

Figure 4.
Mean bulk density (BD) (g m−3) measured along the period of observation at three depths in track (T) and no-track (NT) positions in the two vineyard plots ((a) GC = with grassed inter-rows and (b) CT = with tilled inter-rows). The “b” letters indicate significant difference with the corresponding reference values (“a” are omitted), obtained with t-test (p = 0.05). Number in brackets after the date indicates the number of tractor passages occurred with respect to reference soil conditions (minimum BD for GC and after tillage for CT).


Figure 5.
Values of soil penetration resistance (PR) in different positions of each treatment, for depth intervals 0–10, 10–20, and 20–30 cm, with corresponding mean SWC, and values of corresponding normalized penetration resistance, corrected for value set at SWCcorr = 0.300 m3 m−3.
Figure 5.
Values of soil penetration resistance (PR) in different positions of each treatment, for depth intervals 0–10, 10–20, and 20–30 cm, with corresponding mean SWC, and values of corresponding normalized penetration resistance, corrected for value set at SWCcorr = 0.300 m3 m−3.

Figure 6.
Mean values of the field-saturated hydraulic conductivity (Kfs) measured in the plots. Letters indicate significant difference between series, obtained with t-test (p = 0.05).
Figure 6.
Mean values of the field-saturated hydraulic conductivity (Kfs) measured in the plots. Letters indicate significant difference between series, obtained with t-test (p = 0.05).

Figure 7.
Monthly precipitation (P) and mean precipitation in 2000–2018 period (P mean), runoff (RO), and soil loss (SL) in CT and GC.
Figure 7.
Monthly precipitation (P) and mean precipitation in 2000–2018 period (P mean), runoff (RO), and soil loss (SL) in CT and GC.


Table 1.
Tractors’ characteristics.
| Model | New Holland TN95FA | New Holland TK80A |
|---|---|---|
| Engine power (CV/kW) | 95/67.9 | 80/57.4 |
| Front tyres | PIRELLI TM 700, 280/70 R18 | Iron track |
| Rear tyres | PIRELLI TM 700, 420/70 R24 | Iron track |
| Inflation pressure, front tyre (kPa) | 150 | - |
| Inflation pressure, rear tyre (kPa) | 150 | - |
| Total mass (kg) | 2760 | 4280 |
| Front mass (kg) | 1000 | - |
| Rear mass (kg) | 1760 | - |
| Max additional equipment mass (kg) | 600 | 900 |
Table 2.
Dates in bold indicate field measurements: values of soil water content (SWC, m3 m−3) measured in the conventional tillage plot (CT) and in the controlled grass (GC) treatments in track (T) and no-track (NT) positions are indicated. Other dates indicate the passage of tractors in vineyard (the number of passages and if passages were tyred or tracked) and dates of execution of field operations (ripping and/or mulching).
| Date | GC | CT | ||||
|---|---|---|---|---|---|---|
| dd/mm/yyyy | Passes N | SWC NT (m3 m−3) | SWC T (m3 m−3) | Passes N | SWC NT (m3 m−3) | SWC T (m3 m−3) |
| 11/10/2016 | - | ripped | ||||
| 05/12/2016 | 0.374 | 0.387 | 0.300 | 0.357 | ||
| 05/12/2016 | 1 × tyred | 1 × tyred | ||||
| 07/12/2016 | 0.365 | 0.404 | 0.304 | 0.385 | ||
| 20/02/2017 | 0.349 | 0.381 | 0.308 | 0.369 | ||
| 21/02/2017 | 1 x tyred | 1 × tyred | ||||
| 23/02/2017 | 0.378 | 0.395 | 0.346 | 0.389 | ||
| 09/05/2017 | 1 × tyred | 1 × tyred | ||||
| 10/05/2017 | 0.337 | 0.380 | 0.286 | 0.374 | ||
| 11/05/2017 | 1 × tracked (mulched) | ripped | ||||
| 25/05/2017 | 1 × tyred | 1 × tyred | ||||
| 31/05/2017 | 0.179 | 0.175 | 0.188 | 0.162 | ||
| 01/06/2017 | 1 × tracked | 1 × tracked | ||||
| 08/06/2017 | 0.133 | 0.149 | 0.082 | 0.167 | ||
| 09/06/2017 | 1 × tyres | 1 × tyred | ||||
| 16/06/2017 | 1 × tracked | 1 × tracked | ||||
| 23/06/2017 | 2 × tracked | 2 × tracked | ||||
| 26/06/2017 | 1 × tyred | 1 × tyred | ||||
| 04/07/2017 | 1 × tyred | 1 × tyred | ||||
| 12/07/2017 | 1 × tyred | 1 × tyred | ||||
| 25/07/2017 | 1 × tyred | 1 × tyred | ||||
| 26/07/2017 | 0.081 | 0.100 | 0.078 | 0.091 | ||
| 02/08/2017 | 3 × tyred | 3 × tyred | ||||
| 10/08/2017 | 1 × tyred | 1 × tyred | ||||
| 28/08/2017 | 0.060 | 0.119 | 0.048 | 0.042 | ||
| 12/09/2017 | 1 × tracked | 1 × tracked | ||||
| 13/09/2017 | 1 × tracked | 1 × tracked | ||||
| 27/09/2017 | 0.120 | 0.192 | 0.092 | 0.113 | ||
| 28/09/2017 | - | ripped | ||||
| TOT YEAR 1 | 18 | 17 | ||||
| 26/03/2018 | 1 × tracked | 1 × tracked | ||||
| 28/03/2018 | 1 × tyred | 1 × tyred | ||||
| 26/04/2018 | 0.237 | 0.219 | 0.278 | 0.356 | ||
| 27/04/2018 | 1 × tracked (mulched) | ripped | ||||
| 08/05/2018 | 1 × tyres | 1 × tyred | ||||
| 16/05/2018 | 1 × tyres | 1 × tyres | ||||
| 17/05/2018 | - | - | (no passes) | 0.247 | 0.247 | |
| 17/05/2018 | 0.322 | 0.377 | 0.266 | 0.342 | ||
| 25/05/2018 | 1 × tyres | 1 × tyred | ||||
| 28/05/2018 | 2 × tracked | 2 × tracked | ||||
| 01/06/2018 | 1 × tyred | 1 × tyred | ||||
| 10/06/2018 | 1 × tyred | 1 × tyred | ||||
| 11/06/2018 | 0.261 | 0.318 | 0.150 | 0.299 | ||
| 13/06/2018 | 2 × tracked | 2 × tracked | ||||
| 18/06/2018 | 1 × tracked | 1 × tracked | ||||
| 18/06/2018 | 1 × tyred | 1 × tyred | ||||
| 19/06/2018 | 1 × tyred | 1 × tyred | ||||
| 29/06/2018 | 1 × tyred | 1 × tyred | ||||
| 03/07/2018 | 1 × tyred | 1 × tyred | ||||
| 04/07/2018 | - | 0.257 | 0.258 | 0.293 | ||
| 09/07/2018 | 1 × tyred | 1 × tyred | ||||
| 13/07/2018 | 1 × tyred | 1 × tyred | ||||
| 19/07/2018 | 1 × tyred | 1 × tyred | ||||
| 27/07/2018 | 1 × tyred | 1 × tyred | ||||
| 30/07/2018 | 0.196 | 0.253 | 0.115 | 0.138 | ||
| 07/08/2018 | 1 × tyred | 1 × tyred | ||||
| 11/09/2018 | 0.167 | 0.256 | 0.156 | 0.170 | ||
| 26/09/2018 | 1 × tracked | 1 × tracked | ||||
| 27/09/2018 | 1 × tracked | 1 × tracked | ||||
| 10/10/2018 | 0.256 | 0.293 | 0.258 | 0.275 | ||
| 25/10/2018 | 1 × tyred | 1 × tyred | ||||
| - | ripped | |||||
| TOT YEAR 2 | 25 | 22 | ||||
Table 3.
Classification of rainfall events recorded in the two years of observation, with indication, for each class, of number of events, average rainfall depth (mm) and duration (h), average 15 min maximum intensity (mm h−1), average rainfall erosivity (MJ ha−1), cumulated (total for each class) rainfall (mm), erosivity (MJ mm ha−1 h−1), and runoff (mm) in the two monitored plots.
| Year 1 | Rainfall Events Category | Number of Events | Av. Rainfall Depth (mm) | Av. Duration (h) | Av. Max 15 | Av. Rainfall Erosivity EI30 | Cumulated Rainfall | Cumulated Rainfall Erosivity EI30 | cum RO CT | cum RO GC |
| 1–10 | 28 | 3.8 | 6.2 | 6.3 | 3.3 | 106.4 | 91.4 | 0.1 | 0.0 | |
| 10–50 | 12 | 27.1 | 27.1 | 9.7 | 31.0 | 325.6 | 371.5 | 5.1 | 2.9 | |
| 50–100 | 0 | |||||||||
| 100–200 | 1 | 127.2 | 70.2 | 8.4 | 117.2 | 127.2 | 117.2 | 0.5 | 0.8 | |
| >200 | 0 | |||||||||
| 41 | 559.2 | 580.1 | ||||||||
| Total P (mm) | 569 | 76% | ||||||||
| Year 2 | Rainfall Events Category | Number of Events | Av. Rainfall Depth (mm) | Av. Duration (h) | Av. Max 15 | Av. Rainfall Erosivity EI30 | Cumulated Rainfall | Cumulated Rainfall Erosivity EI30 | cum RO CT | cum RO GC |
| 1–10 | 29 | 3.6 | 10.8 | 4.1 | 1.6 | 104.2 | 47.3 | 0.1 | 0.1 | |
| 10–50 | 18 | 27.1 | 25.6 | 16.9 | 62.8 | 488.2 | 1130.7 | 14.4 | 2.8 | |
| 50–100 | 3 | 65.1 | 56.0 | 36.5 | 430.3 | 195.4 | 1291.0 | 8.7 | 2.9 | |
| 100–200 | 1 | 101.4 | 105.3 | 7.2 | 64.2 | 101.4 | 64.2 | 27.1 | 2.6 | |
| >200 | 1 | 217.4 | 57.2 | 45.8 | 1602.0 | 217.4 | 1602.0 | 40.5 | 11.2 | |
| 52 | 1106.6 | 4135.2 | ||||||||
| Total P (mm) | 1125 | 53% |
Table 4.
Values of SWC, BD, and Kfs measured in the topsoil in each plot and position in the two years in selected dates, which represent similar conditions with respect to the tillage operations and traffic with tractors, and total values of runoff and soil losses measured in the two vineyard plots in the two monitored years. Bold values indicate significant differences (according to t-test, p = 0.05) between the values measured in the same date and same position, but different plot (i.e., CT-T vs. GC-T). Italic values indicate significant differences (according to t-test, p = 0.05) observed in the same plot and position between corresponding surveys in the two observed periods (i.e., differences in CT-T after 1–2 passages in Year 1 and in Year 2). Dates in italic indicates tillage and mowing operations.
| Year 1 (2016–2017) | CT-T | CT-NT | CT All | GC-T | GC-NT | GC All | ||||||||||||
| Date | NP | SWC10 m3 m−3 | BD10 g m−3 | Kfs mm h−1 | SWC10 m3 m−3 | BD10 g m−3 | Kfs mm h−1 | Runoff mm | SL kg ha−1 | SWC10 m3 m−3 | BD10 g m−3 | Kfs mm h−1 | SWC10 m3 m−3 | BD10 g m−3 | Kfs mm h−1 | Runoff mm | SL kg ha−1 | |
| Autumn tillage/mowing | 11/10/2016 | |||||||||||||||||
| After 1st passage | 07/12/2016 | 1–1 | 0.357 | 1.42 | 1 | 0.300 | 1.20 | 1297 | 0.387 | 1.18 | 49 | 0.374 | 1.25 | 242 | ||||
| After 2–3 passages (tyred) | 10/05/2017 | 3–3 | 0.374 | 1.45 | 3 | 0.286 | 1.32 | 599 | 0.380 | 1.26 | 53 | 0.337 | 1.31 | 145 | ||||
| Spring tillage/mowing | 11/05/2017 | |||||||||||||||||
| After 1–2 passages (tyred) | 31/05/2017 | 1–5 | 0.162 | 1.28 | 26 | 0.188 | 1.18 | 219 | 0.175 | 1.38 | 86 | 0.179 | 1.24 | 1484 | ||||
| After more than 10 passages | 26/07/2017 | 10–14 | 0.091 | 1.34 | 5 | 0.078 | 1.24 | 430 | 0.100 | 1.50 | na | 0.081 | 1.34 | na | ||||
| Before harvest | 28/08/2017 | 14–18 | 0.042 | 1.16 | 23 | 0.048 | 1.19 | 33 | 0.119 | 1.24 | 57 | 0.060 | 1.29 | 99 | ||||
| End of season (after harvest) | 27/09/2017 | 16–20 | 0.113 | 1.34 | 16 | 0.092 | 1.15 | 68 | 0.192 | 1.48 | 527 | 0.120 | 1.30 | 52 | ||||
| Total | 5.62 | 5.8 | 3.67 | 3.3 | ||||||||||||||
| Year 2 (2017–2018) | CT-T | CT-NT | CT all | GC-T | GC-NT | GC all | ||||||||||||
| Date | NP | SWC10 m3 m−3 | BD10 g m−3 | Kfs mm h−1 | SWC10 m3 m−3 | BD10 g m−3 | Kfs mm h−1 | Runoff mm | SL kg ha−1 | SWC10 m3 m−3 | BD10 g m−3 | Kfs mm h−1 | SWC10 m3 m−3 | BD10 g m−3 | Kfs mm h−1 | Runoff mm | SL kg ha−1 | |
| Autumn tillage/mowing | 28/09/2017 | |||||||||||||||||
| After 1st passage | na | |||||||||||||||||
| After 2–3 passages (tyred) | 26/04/2018 | 2–2 | 0.356 | 1.49 | 2 | 0.278 | 1.35 | 576 | 0.219 | 1.28 | 99 | 0.237 | 1.31 | 440 | ||||
| Spring tillage/mowing | 27/04/2018 | |||||||||||||||||
| After 1–2 passages (tyred) | 17/05/2018 | 2–5 | 0.342 | 1.50 | 3 | 0.266 | 1.21 | 2642 | 0.377 | 1.44 | 45 | 0.322 | 1.44 | 173 | ||||
| After more than 10 passages | 04/07/2018 | 14–17 | 0.293 | 1.59 | 4 | 0.258 | 1.3 | 120 | 0.257 | 1.42 | 371 | na | na | 151 | ||||
| Before harvest | 11/09/2018 | 21–24 | 0.170 | 1.52 | 4 | 0.156 | 1.38 | 35 | 0.256 | 1.39 | 12 | 0.167 | 1.24 | 32 | ||||
| End of season (after harvest) | 10/10/2018 | 23–26 | 0.275 | 1.50 | 7 | 0.258 | 1.43 | 46 | 0.293 | 1.43 | 190 | 0.256 | 1.32 | 450 | ||||
| Total | 90.78 | 3089.3 | 19.55 | 524.0 | ||||||||||||||
© 2019 by the authors. Licensee MDPI, Basel, Switzerland. This article is an open access article distributed under the terms and conditions of the Creative Commons Attribution (CC BY) license (http://creativecommons.org/licenses/by/4.0/).
Share and Cite
MDPI and ACS Style
Capello, G.; Biddoccu, M.; Ferraris, S.; Cavallo, E. Effects of Tractor Passes on Hydrological and Soil Erosion Processes in Tilled and Grassed Vineyards. Water 2019, 11, 2118. https://doi.org/10.3390/w11102118
AMA Style
Capello G, Biddoccu M, Ferraris S, Cavallo E. Effects of Tractor Passes on Hydrological and Soil Erosion Processes in Tilled and Grassed Vineyards. Water. 2019; 11(10):2118. https://doi.org/10.3390/w11102118
Chicago/Turabian StyleCapello, Giorgio, Marcella Biddoccu, Stefano Ferraris, and Eugenio Cavallo. 2019. "Effects of Tractor Passes on Hydrological and Soil Erosion Processes in Tilled and Grassed Vineyards" Water 11, no. 10: 2118. https://doi.org/10.3390/w11102118
Note that from the first issue of 2016, this journal uses article numbers instead of page numbers. See further details here.