Effects of Irrigation Water Salinity on Maize (Zea may L.) Emergence, Growth, Yield, Quality, and Soil Salt


1
College of Water Conservancy and Hydropower Engineering, Hohai University, Nanjing 210098, China
2
College of Agricultural Engineering, Hohai University, Nanjing 210098, China
3
Institute of Agricultural Resources and Environment, Ningxia Academy of Agricultural and Forestry Sciences, Yinchuan 750002, China
4
State Key Laboratory of Simulation and Regulation of Water Cycle in River Basin, Department of Irrigation and Drainage, China Institute of Water Resources and Hydropower Research, Beijing 100048, China
5
Ningxia Institute of Water Resources Research, Yinchuan 750021, China
*
Authors to whom correspondence should be addressed.
Water 2019, 11(10), 2095; https://doi.org/10.3390/w11102095
Submission received: 1 September 2019
/
Revised: 1 October 2019
/
Accepted: 4 October 2019
/
Published: 8 October 2019
(This article belongs to the Section Water Use and Scarcity)
Abstract
:Freshwater shortage is becoming one of the major limiting factors for the sustainable development of agriculture in arid and semi-arid areas of north China. A two-year field experiment about mulched drip irrigation on maize was conducted in Hetao Irrigation District with five irrigation water salinity levels (total dissolved solids; 1, 2, 3, 4, and 5 g·L−1). The effects of irrigation water salinity on maize emergence, growth, yield, grain quality, and soil salt were determined. The results indicated that with the soil matric potential of −20 kPa and irrigation quota for each application of 22.5 mm, the irrigation water salinity showed negative influence on maize emergence and maize morphological characteristics (plant height, leaf area index, stem diameter, and dry matter), as irrigation water salt concentrations exceeded 3 g·L−1. The water use efficiency decreased linearly with the irrigation water salinity raised from 1 g·L−1 to 5 g·L−1, while maize grain protein increased and starch content decreased with the increase of irrigation water salt contents. Additionally, both the vertical radius and horizontal radius of salt isoline by mulched drip irrigation reduced with the irrigation water salt concentrations, when the irrigation water salinity was above 3 g·L−1. Summarily, irrigation water salinity of 3 g·L−1 was recommended for maize mulched drip irrigation in this study.
1. Introduction
The HID (Hetao Irrigation District) is located in the alluvial plain of the middle Yellow River, western Inner Mongolia Autonomous region, China. Due to the lack of precipitation (about 160 mm annually) and high evaporative potential [1], the traditional surface irrigation water in the HID is mainly drawn from the Yellow River by channels, having an annual average of 0.505 g TDS (total dissolved solids) L−1 [2,3]. However, the allocated Yellow River water for agricultural irrigation in the HID has been reduced 20% per year for the consideration of the sustained and harmonious development of the Yellow River Basin, according to a document announced by the Yellow River Water Conservancy Commission, which has aggravated the shortage of fresh water for agriculture and consequently threatened the health of local agriculture ecological environment. In order to achieve the sustainable development of agriculture in the HID, a series of water-saving irrigation technology and unconventional water resources is urgently needed [4].
As an important unconventional irrigation water, the exploitable amount of shallow groundwater with salinity of 2–5 g·L−1 is 721 million m3 in the HID [5]. The rational utilization of saline water for agricultural irrigation can not only alleviate the freshwater shortage effectively, but also contributes to the refresh of shallow groundwater, which may result in the reduction of accumulated soil salt during dry seasons and soil desalination during humid seasons. Consequently, the reasonable utilization of saline water is of great significance to improve the local agroecological environment.
Due to the typical characteristic of high salt content, saline water irrigation not only increases the soil moisture in crop root zone, but also provides trace elements for crops growth. Meanwhile, improper irrigation usually results in the increase of salt content in the root zone and the decrease of soil matric potential (SMP), which inhibits the water absorption of the crop and leads to soil salinization in the cultivated layer [6,7,8]. Therefore, the appropriate irrigation water salinity and irrigation schedule should be determined reasonably for saline water exploitation.
The studies about the effects of saline water irrigation on crops mainly focused on various plant growth parameters and grain yield. Song et al. showed that the salinity of saline water at 2 g·L−1 would promote the accumulation of cotton dry matter, but the accumulation of dry matter decreased with the increasing of irrigation water salinity when the salinity was above 4 g·L−1 [9]. Kang et al. performed an experiment about the impact of saline water irrigation on waxy maize and found that the irrigation water with salt concentrations lower than 10.9 dS/m had no significant effect on the emergence of waxy maize. However, the seeding biomass decreased with the increase of irrigation water salinity. Moreover, the growth rate of maize dry matter and plant height for every 1 dS/m increase in salinity of irrigation water was about 2% [10]. Wang et al. examined the influence of irrigation water salinity and volume on winter wheat yield and soil salt distribution. The results indicated that irrigation with brackish water at salt concentrations below 3 g·L−1 would decrease the winter wheat yield by no more than 10%, compared with fresh water irrigation, while long-term brackish water irrigation would lead to significant yield losses, even for irrigation water with low salinity [11]. Additionally, Wang et al. found that the use of saline water with salt concentrations less than 3 g·L−1 during maize growth period had no significant effects on grain yield [12]. While, Kang et al. found that the decline rate of the fresh ear yield for every 1 dS·m−1 increase in the salinity of irrigation water was about 0.4–3.3% [10]. Xue et al. estimated maize yield and water productivity under combined irrigation of saline water and non-saline water with the SWAP-WOFOST agro-hydrological model. The results showed that the annual average yield and water productivity increased by 5.3% and 2.6%, respectively, which was compared with non-saline water irrigation [13]. Wang et al. indicated that maize yield decreases by 622 kg g·ha−1 for every 1 g·L−1 increase in the irrigation water salinity. Moreover, they used the SWAP model to simulate the spring maize yield over 10 consecutive years under saline water irrigation, and found that, compared with the grain yield for irrigation water salinity of 3 g·L−1, 6 g·L−1 and 9 g·L−1, the corresponding yield after 10 years would decline by 8%, 33% and 52%, respectively [12]. Zheng et al. studied the effects of drip irrigation with different water salinity on the growth of sunflower through plot experiments and found that the grain quality of sunflower was significantly improved when the salinity ranges from 2 g·L−1 to 3.5 g·L−1 [14]. Cucci et al. conducted a four-year crop rotation experiment in southern Italy and found that, compared with freshwater irrigation, the kernel protein content of maize for brackish water irrigation increased by 6.9%, while the grain moisture reduced by 9.3% [15].
With saline water irrigation, soil salinity used to be one of the major considerations. The influence of saline water irrigation on soil salinity has mainly concentrated on soil salt accumulation/desalinization. Large numbers of studies have shown that soil desalinization tends to reduce efficiency, while soil salinity tends to increase with the increasing salt concentrations [16,17,18]. However, some field studies on soil salinity under long-term saline water drip irrigation indicated that there was little or no salt accumulation in the root zone throughout the crop growth period with appropriate irrigation schedule, suitable leaching, drainage systems, and proper irrigation water salinity [8,12].
Extensive studies have indicated that the measurement of SMP at a depth of 20 cm immediately under the emitter of surface mulched drip irrigation can be used as an indicator for crop drip irrigation scheduling [19,20,21]. Moreover, Kang et al. indicated that soil moisture and salinity condition can be well-maintained if the SMP of mulched-drip irrigation with saline water was kept higher than −20 kPa [19], while the SMP that measured 20 cm depth was recommended to controlled above −20 kPa when saline water drip irrigation was applied in northwest China [22]. Meanwhile, Li et al. conducted a two-year field experiment and suggested that the SMP threshold higher than −30 kPa can be used to trigger maize mulched-drip irrigation with shallow saline groundwater in the HID [23].
As one of the most widely consumed cereals, maize is classified as a mild salt-tolerant crop [24], whose planting area accounts for more than 30% of the total tillage in the HID [1]. There are many studies about the influence of irrigation water salinity on maize plant height, leaf area, dry matter, yield characteristics, and water use efficiency [10,12,13,17,18,23,25,26,27], while few studies have focused on the impacts of irrigation water salinity on maize emergence and grain quality.
The present field experiment was performed for maize planting under mulched drip irrigation with different levels of irrigation water salinity to study: (1) The effects of irrigation water salt concentrations on maize emergence and growth traits; (2) the impacts of irrigation water salinity on maize yield and grain quality; and (3) the effects of irrigation water salt contents on soil salt distribution and accumulation. The present research was carried out with the aim of contributing to the fight against the processes of land salinization and achieving the sustainable goals for development of the United Nations.
2. Materials and Methods
2.1. Experimental Site
The field experiment was conducted from 2016 to 2017 at the Jiuzhuang Experimental Station (longitude: 107°18′ E, latitude: 40°41′ N, 1042 m a.s.l.) in the HID of China. The area is characterized by a multiyear average sunshine time of 3229.9 h and an average annual frostless period of 130 d [28]. Meteorological data, containing wind speed, daily rainfall, maximum temperature, minimum temperature, photosynthetically active radiation, etc. were collected from an automatic weather station (YM-03A, Hebei Handan Co.) which was installed 50 m away from the field experiment site, and the record interval was settled at 0.5 h. The meteorological statistical values are shown in Table 1.
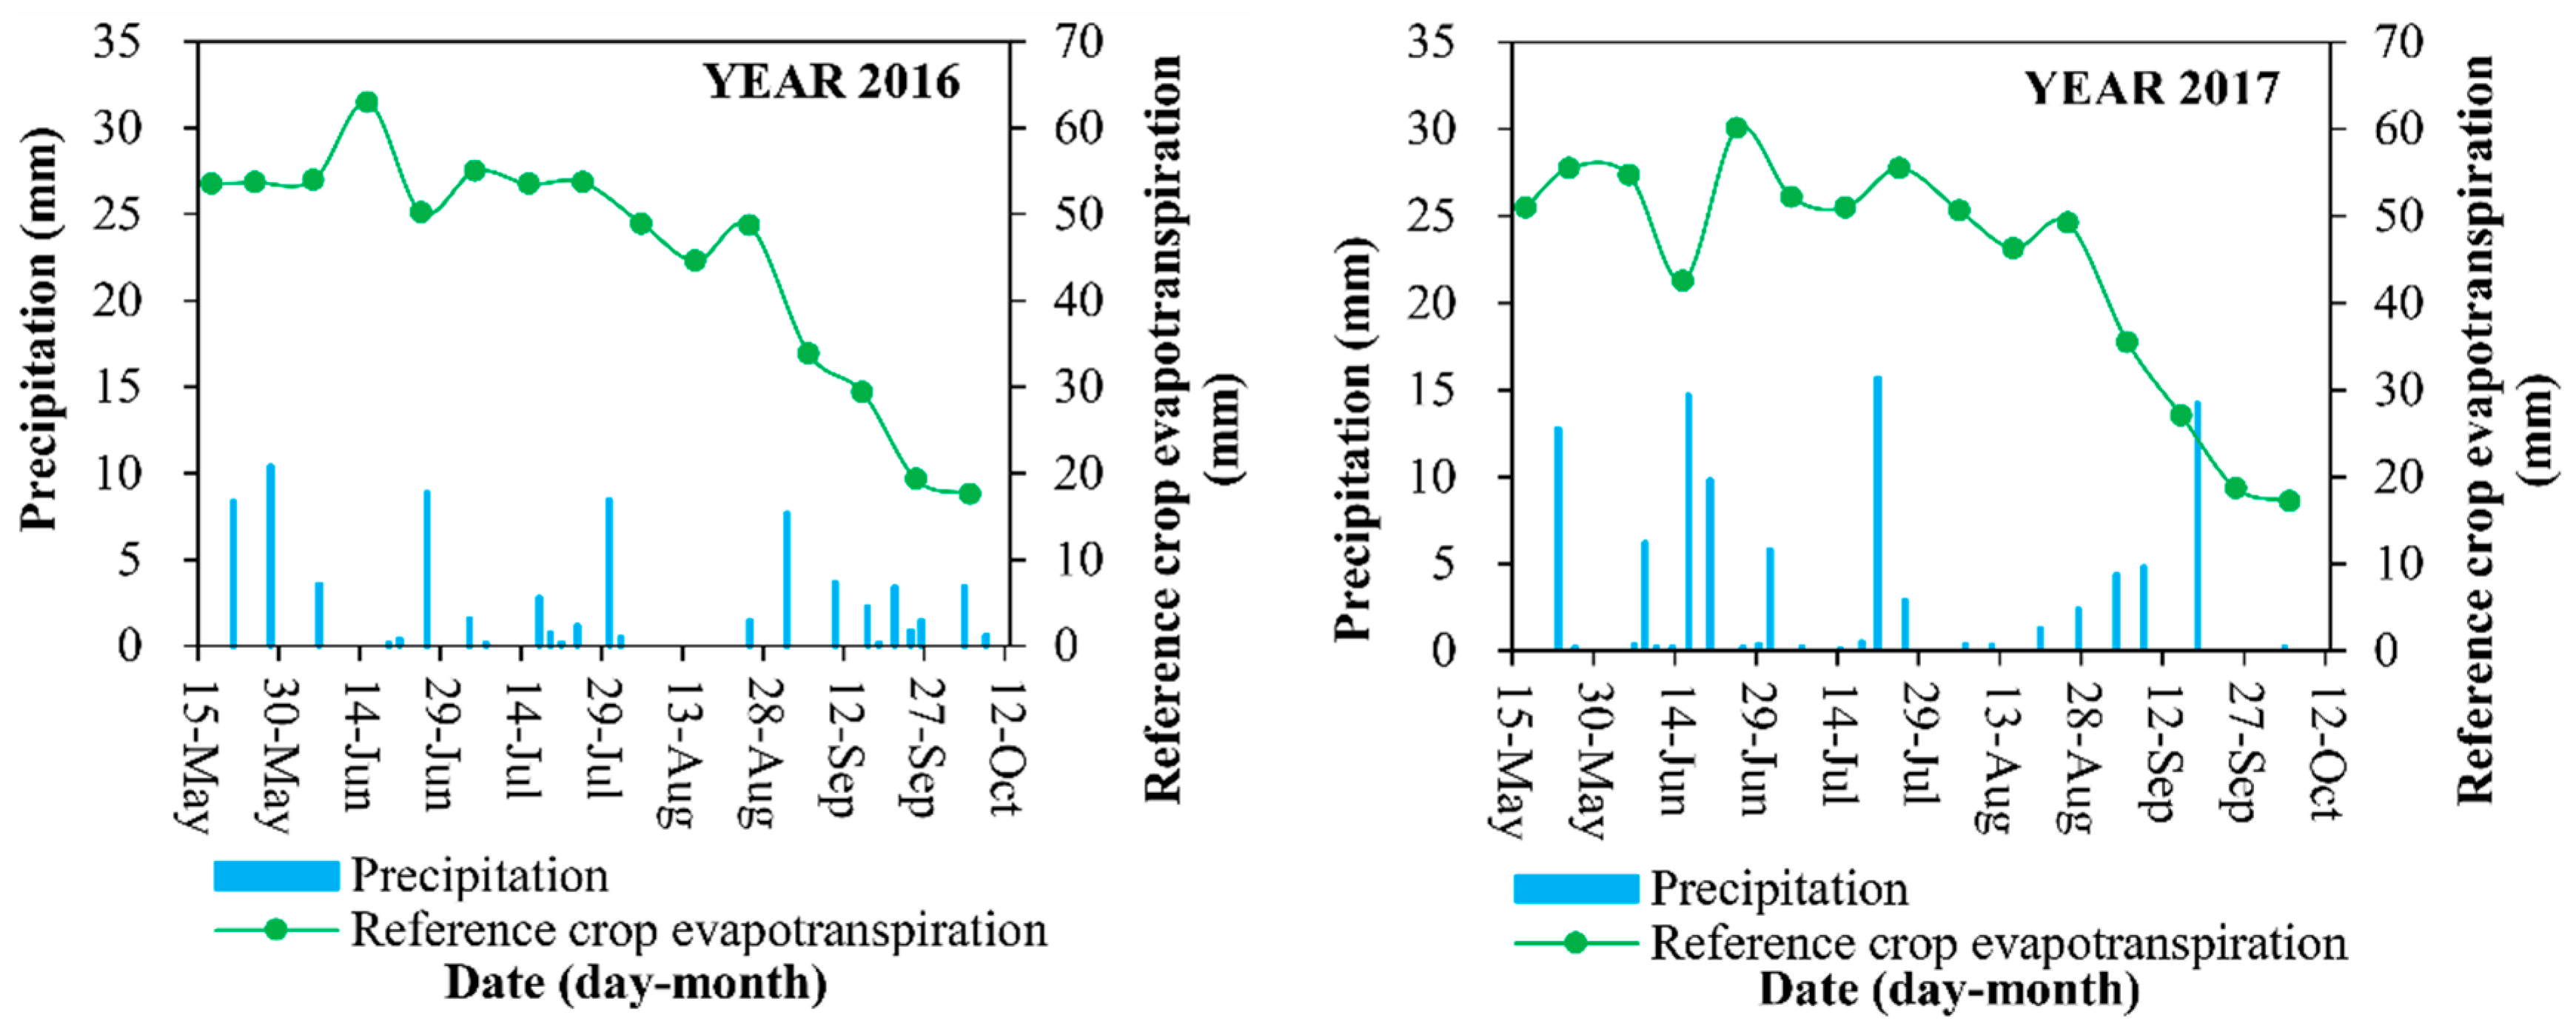
The accumulated precipitation during maize growth period was 73 mm and 98.3 mm in 2016 and 2017, respectively. Additionally, the reference crop evapotranspiration was calculated by the FAO Penman-Monteith equation [29]. The results of reference crop evapotranspiration and precipitation during maize growing period are shown in Figure 1.
Before maize sowing, 15 sampling locations were selected randomly in the experimental plot and all soil samples were taken at each location in 20 cm increments down to a depth of 100 cm. The bulk density and porosity were measured by gravimetric method, while the soil particle size for seven layers was determined by the particle size analyzer (Bbckm-conl-trels-230, INESA Analytical Instrument Co., LTD, No. 88, Xutang Road, Songjiang district, Shanghai, China), and the results are shown in Table 2. The total nitrogen was monitored by the Kjeldahl distillation method [30], the available phosphorus was determined by the NH4F-extraction method [30], and the available potassium was determined by the NH4OAC-extraction method [30]. The ammonium nitrogen was monitored following extraction with 2 mol/L KCl and indophenol-blue colorimetry [31], while the nitrate nitrogen was measured by phenol disulfonic acid spectrophotometric method [31]. The total phosphorus was measured following dry combustion at 550 °C for 2 h and extraction with 0.5 M H2SO4 [32] and the organic matter was measured by the Walkley Black method [33]. The chemical characteristics of soil layers are presented in Table 3. According to the soil water retention curve, the SMP of −20 kPa at a depth of 20 cm corresponded to 85% of the field capacity.
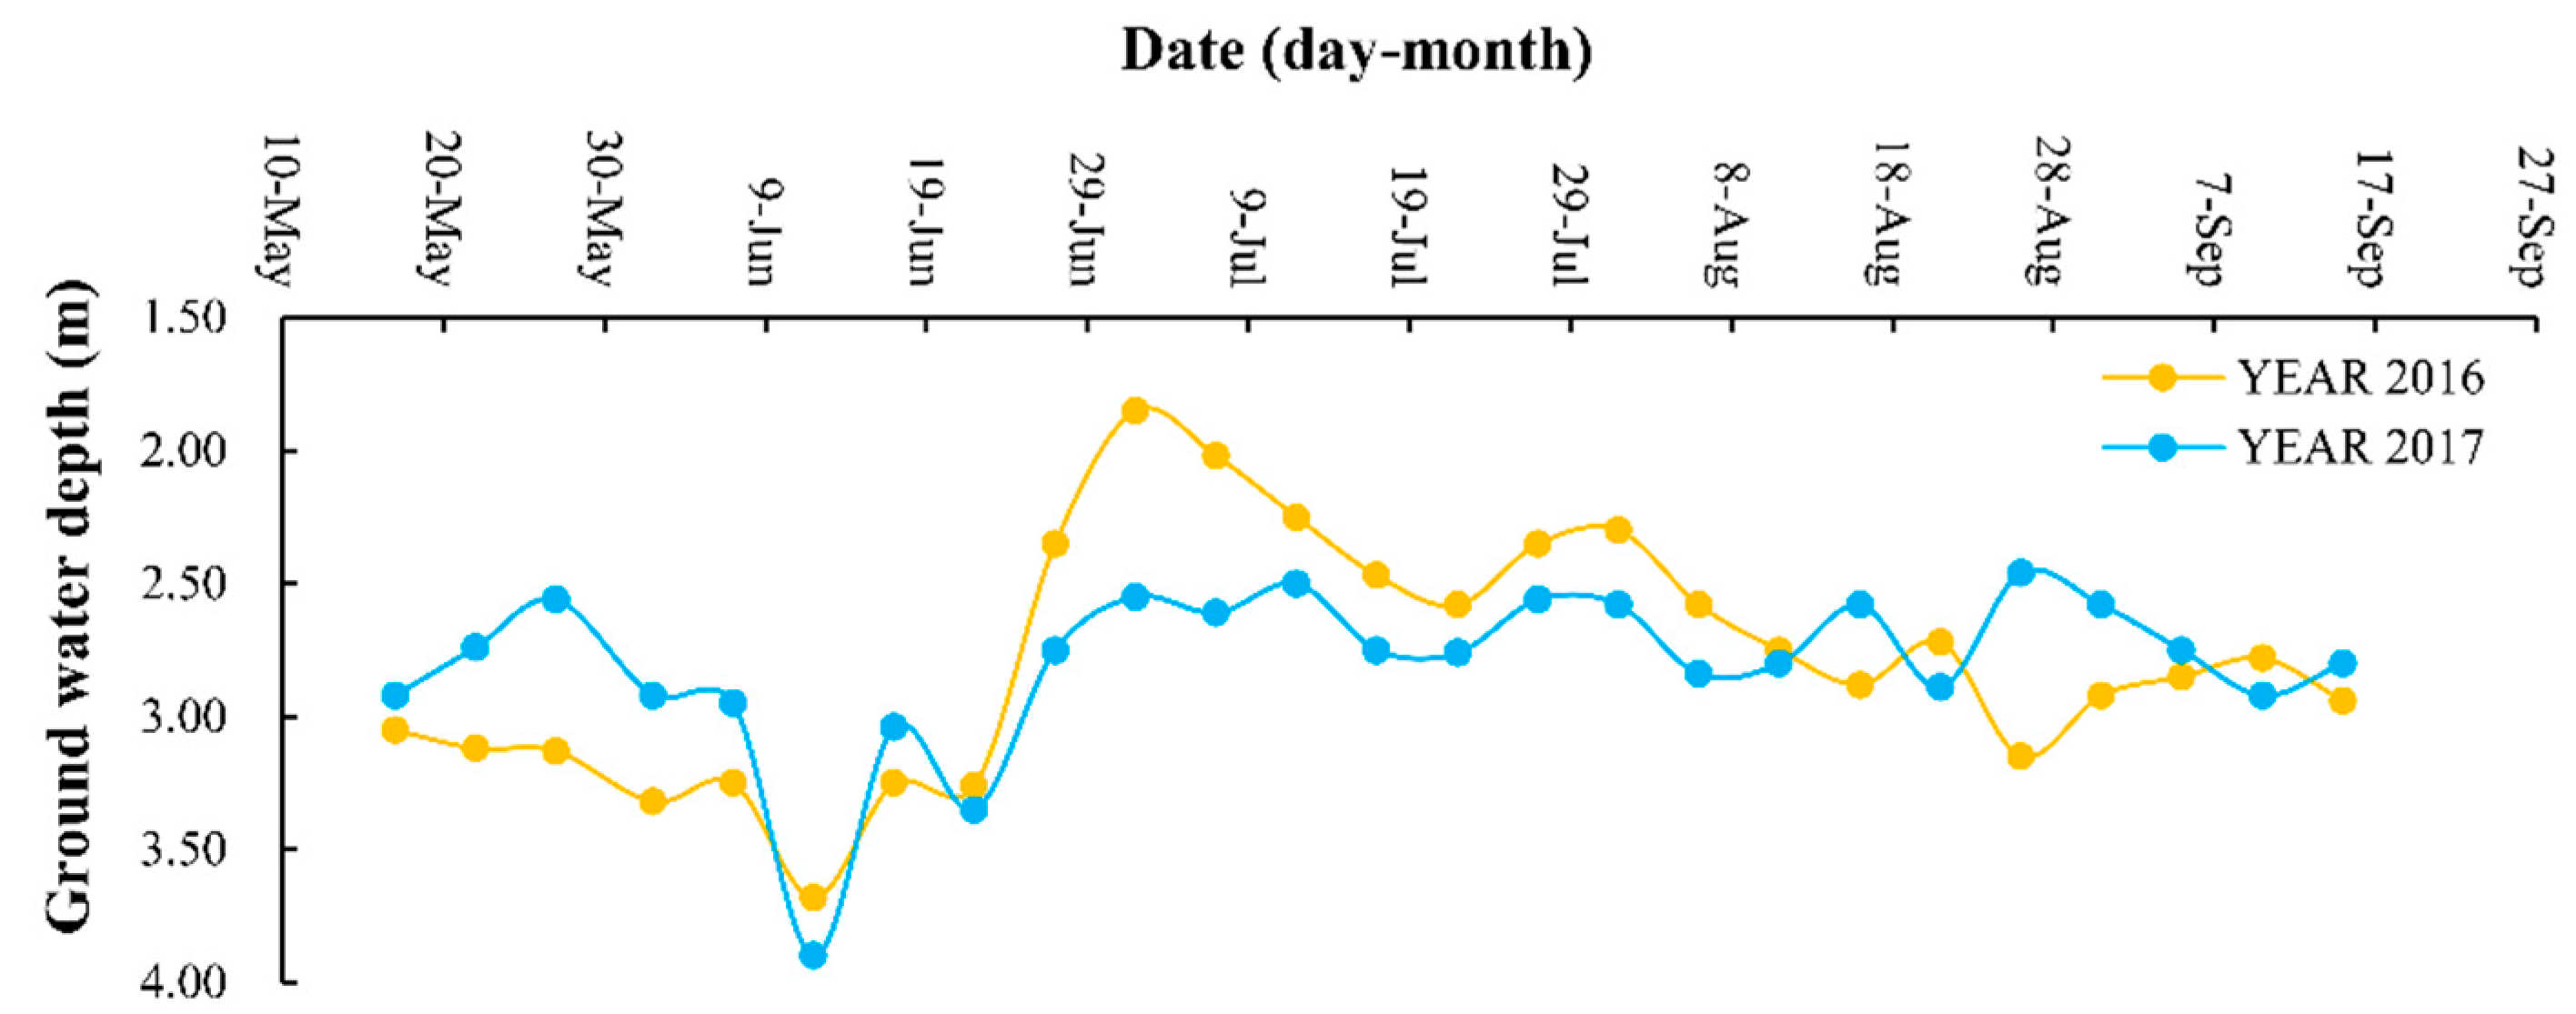
The groundwater depth in the area varies from 1.85 m to 3.68 m below the soil surface during maize growth period, which is shown in Figure 2. The maximum value and the minimum value of groundwater buried depth occurs in mid-June and early July, respectively, and the average groundwater depth during the growth period of maize in 2016 and 2017 was 2.79 m and 2.80 m, respectively. The average annual salt concentration of shallow groundwater in the experimental area is 1.007 g·L−1, which is feasible for agricultural irrigation according to the composition analysis of shallow groundwater. After maize sowing, six water samples were taken from the irrigation canals and irrigation wells beside the experimental field at seven-day intervals. The content of Ca2+ and Mg2+ were measured by an atomic absorption spectrophotometer (Varian spectra AA55, Australia), while K+ and Na+ contents were determined by a flame emission spectrophotometer (Model 410 Flame photometer, UK) [34]. The Cl− was monitored by the method of silver nitrate titration, while the SO42− was determined by EDTA Titration method. Meanwhile, the soil HCO3− was measured by the neutralization titration method. The pH was measured by a pH meter (FE20, METTLER TOLEDO, Shanghai, China), while the total dissolved solids (TDS) were monitored by the weighing method. The averages value of the Yellow River and shallow groundwater are shown in Table 4.
2.2. Experimental Design
The field experiment was performed with five irrigation water salinity levels (measured in TDS) of 1 g·L−1 (S1), 2 g·L−1 (S2), 3 g·L−1 (S3), 4 g·L−1 (S4), and 5 g·L−1 (S5), respectively, and the treatments were laid out in a randomized complete block design. According to the salt segregation ratio of shallow groundwater in the experimental area, the water with different levels of salt concentrations were prepared by dissolving compounds (CaCl2, MgSO4, K2SO4, NaHCO3, MgCl2) into the local shallow groundwater. The detailed dosage of the compounds is listed in Table 5.
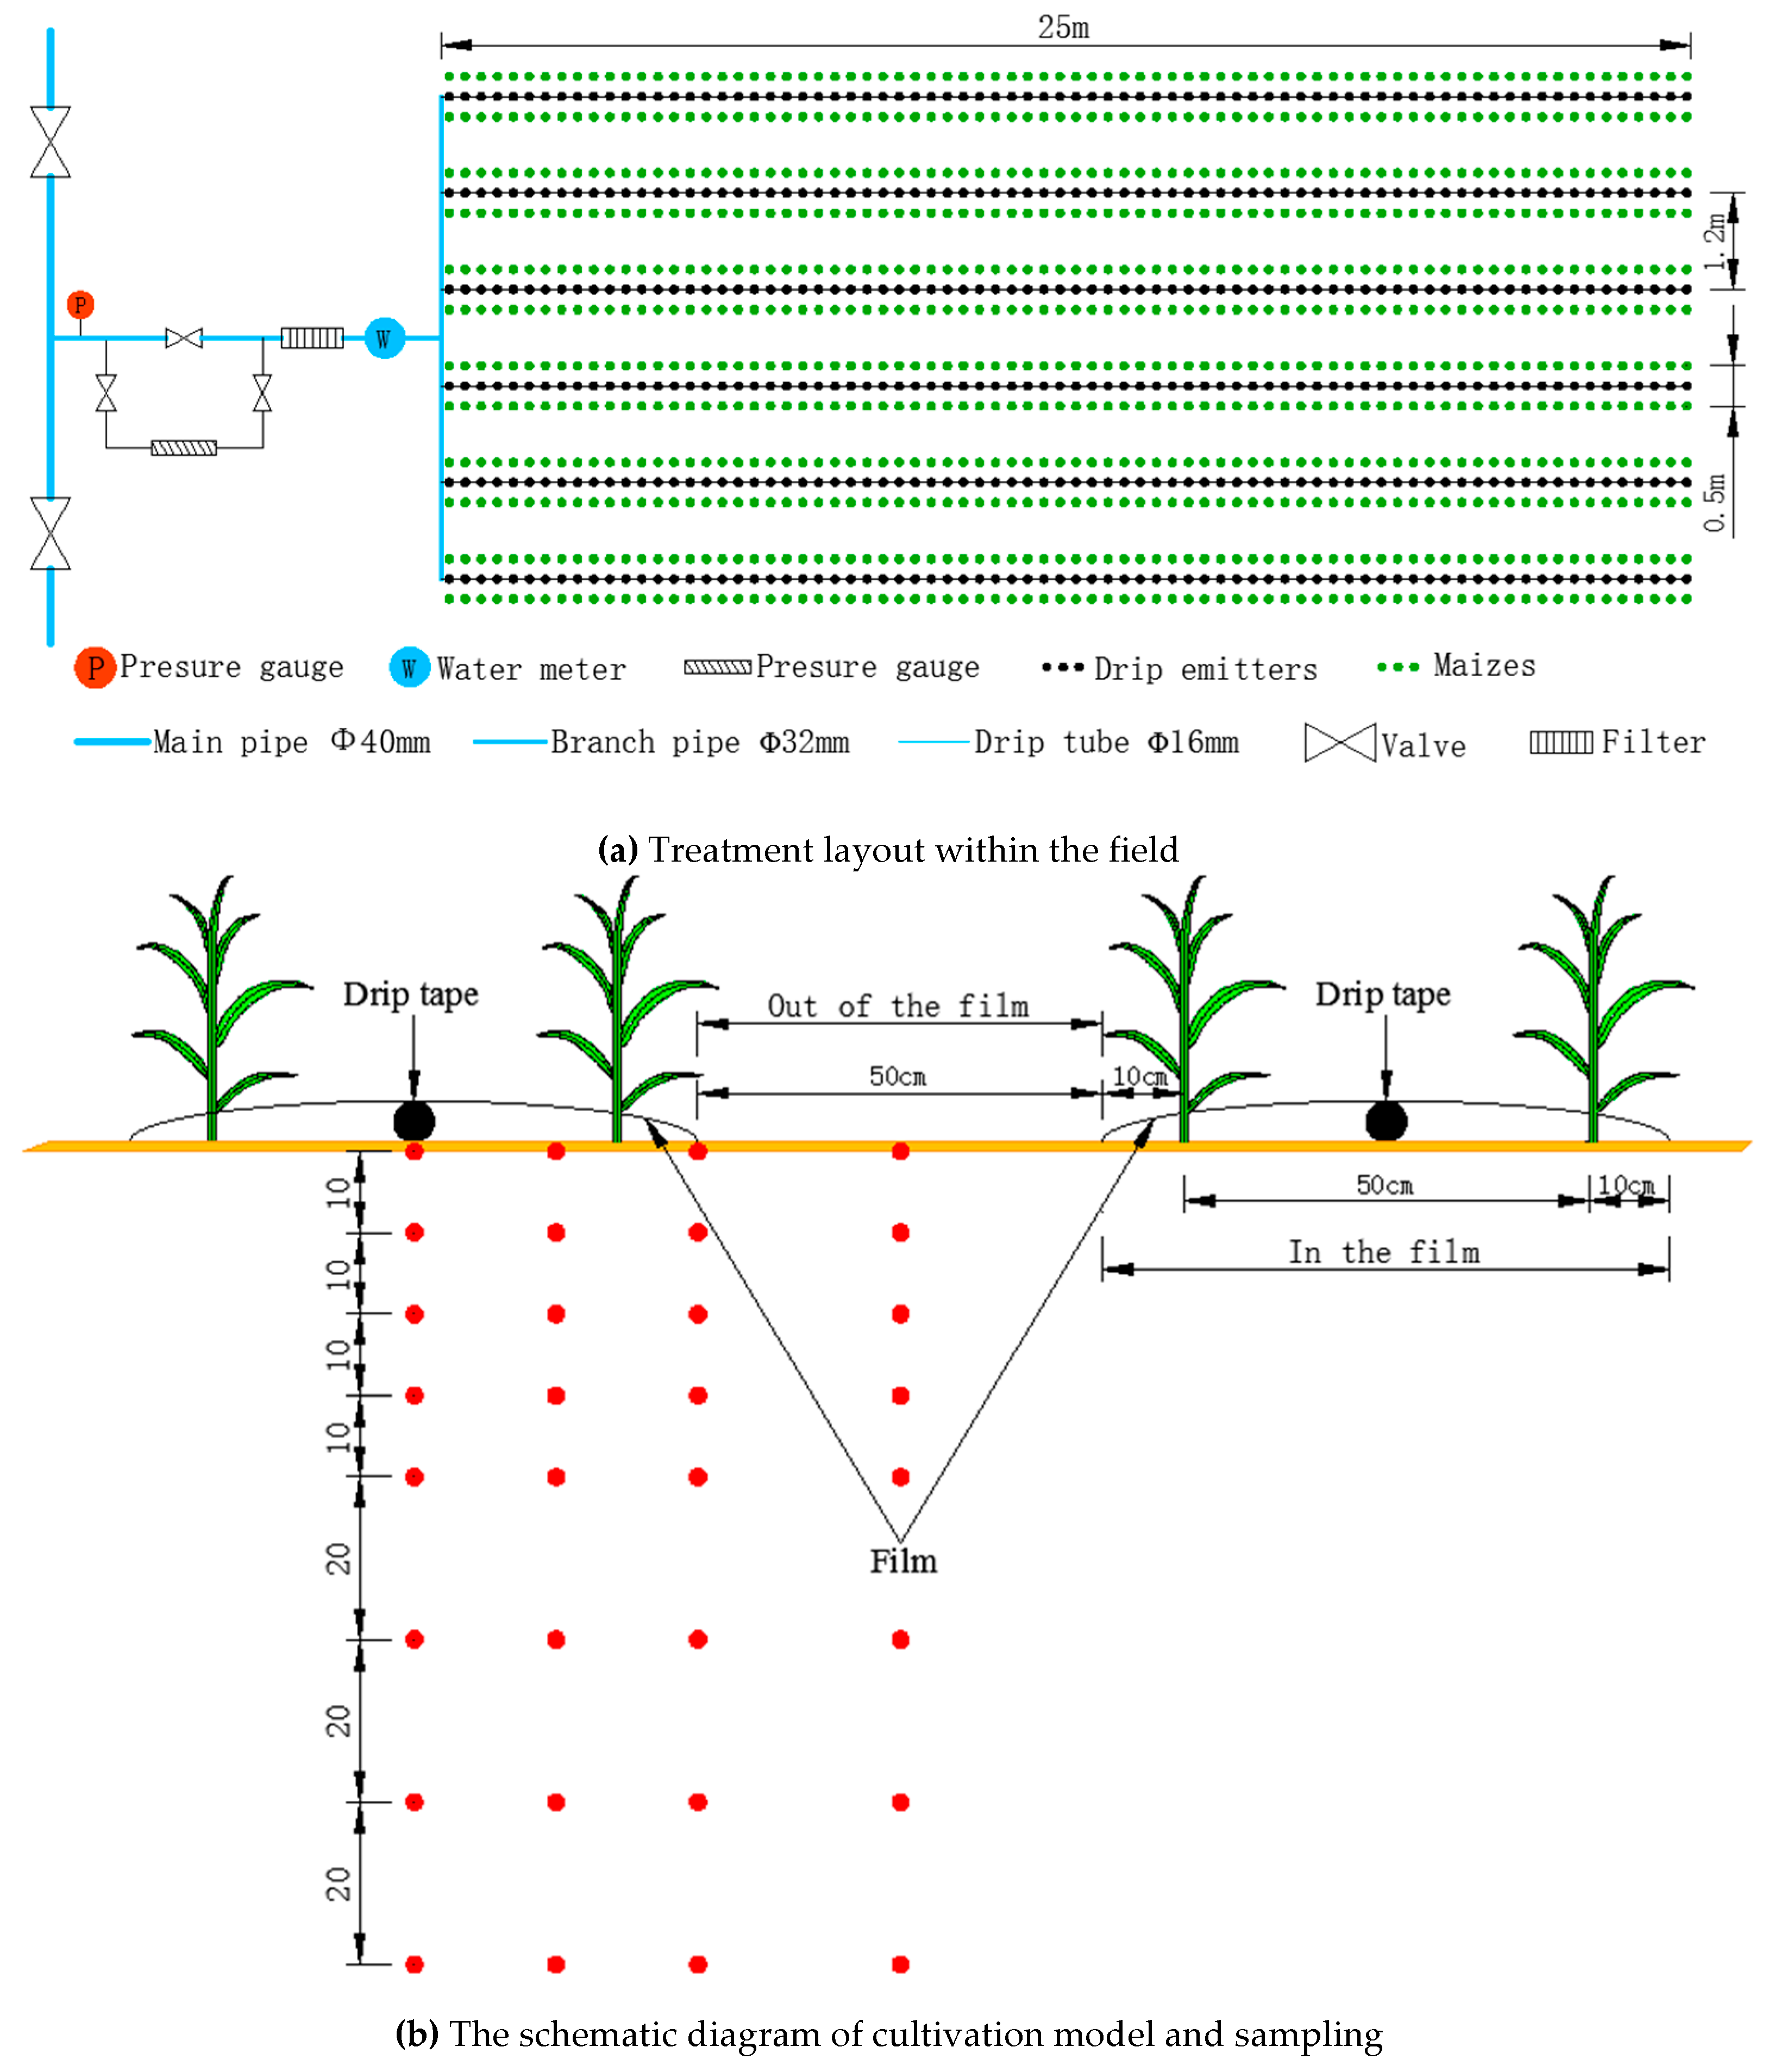
Thirty beds were divided into five plots for each treatment. Each plot was a drip submain unit composed of six beds which occupied an area of 180 m2 (width 7.2 m × length 25 m). The amount of irrigated water was determined by a water meter installed at the inlet of the submain, and the drip tubes, with 0.3 m emitter intervals, were located in the center of each bed (Figure 3a). All plots were placed on the same site both in 2016 and 2017.
Zea mays (Neidan 314) was selected as the test crop in the present study and was planted by the typical planting pattern as shown in Figure 3b, which was a single mulched drip irrigation tube. Corn was planted in two rows on the ridge of the raised bed, with a seed spacing of 0.3 m and row spacing of 0.5 m on 1 May, 2016 and 4 May, 2017, respectively. Maize was harvested on 1 October, 2016 and 8 October, 2017, respectively.
2.3. Irrigation and Fertilization
The traditional maize cultivation was generally planted by film covering, while the surface flood irrigation was applied four times with 6750 m3·ha−1 in total during the maize growth period. Additionally, the supplementary irrigation with Yellow River water (irrigation amount of 1500 m3·ha−1) was applied for soil salt leaching in November of the previous year. Meanwhile, base fertilizers, including diammonium phosphate (DAP: 18%N, 46%P, 0%K) of 600 kg·ha−1 and potassium sulfate (including K2SO4, 45%) of 90 kg·ha−1, were uniformly applied to the field before sowing, and urea (46.2%N) of 900 kg·ha−1 was used as dressing fertilization.
The mulched drip irrigation, with the respective water salinity amount of 225 m3·ha−1, was applied for each plot two days before sowing. Then, irrigation water with the respective water salinity was applied as soon as the value of tensiometers lower than the target SMP value (−20 kPa) for all treatments. The irrigation depth for each application was controlled at 22.5 mm. Additionally, fresh water (Yellow River water) with an amount of 1500 m3·ha−1 was applied for supplementary irrigation to leach soil salt in November of the previous year. Considering the traditional fertilization schedule, diammonium phosphate at a rate of 450 kg·ha−1 and potassium sulphate at a rate of 90 kg·ha−1 were uniformly applied as base fertilization to all plots. The dressing was supplied with urea (46.2%N) of 450 kg·ha−1 by mixing it with irrigation water at a concentration of 30% (w/w).
2.4. Observation and Equipment
2.4.1. SMP Measurement
Three vacuum gauge tensiometers were installed at a depth of 20 cm underneath the emitter for SMP monitoring in each treatment. The tensiometers were observed and recorded three times every day at 8:00, 14:00, and 18:00 during the growth period of maize.
2.4.2. Evapotranspiration
The actual crop evapotranspiration (ETa) for the five treatments was calculated via the soil water balance equation [35]:
where I is the irrigation depth (mm); P is the effective precipitation (mm), which was 73.0 in 2016 and 79.2 in 2017; U is the upward capillary flow into the root zone, which was measured by negative pressure meter and Darcy’s equation [36,37,38]; R is the runoff, which was zero in the current experiment as watering was carefully controlled; D is the downward drainage out of the root zone, which was zero in the current experiment as no water drained out of the root zone; and ΔW is the change of soil moisture storage in the root zone between the two soil water measurements at begin and end of maize growth seasons. The values of irrigation quota and evapotranspiration are listed in Table 6.
2.4.3. Seeding Emergence and Plant Growth
The number of seedings was counted and recorded at two-day intervals for each treatment from six to fourteen days after sowing.
After germinating accomplished, five representative plants were randomly selected and marked in each treatment for height, stem diameter, and leaf area measurement at seven-day intervals during maize growth period. Plant height was measured by a steel tape from ground level to the top, while the stem diameter was determined by a Vernier caliper. Leaf area index (LAI) was estimated by the method described by Malash et al. [39]. Five other representative plants were randomly selected and sampled for the dry matter weight after harvest for each treatment. The plants were cut into small pieces after being sun-dried, and then the biomass were oven-dried at 70 °C until a constant weight was reached.
2.4.4. Maize Yield, WUE, and Irrigation Water Use Efficiency (IWUE)
In late September 2016 and 2017, a harvest area of 12 m2 (length 5.0 m × width 2.4 m) was randomly selected in each plot and the corresponding grain yield and biomass were measured. The yield and biomass for each treatment were estimated with the following equations:
where Y is the estimated maize yield (kg·ha−1), y is the measured maize yield in the selected area (kg), B is the estimated biomass (kg·ha−1), and b is the measured biomass in the selected area (kg).
WUE (kg·m−3) and IWUE (kg·m−3) were calculated by the following equations:
where Y is maize yield (kg·ha−1), ETa is the actual crop evapotranspiration (mm), and I is the irrigation amount during the maize growth stages (mm).
2.4.5. Grain Quality
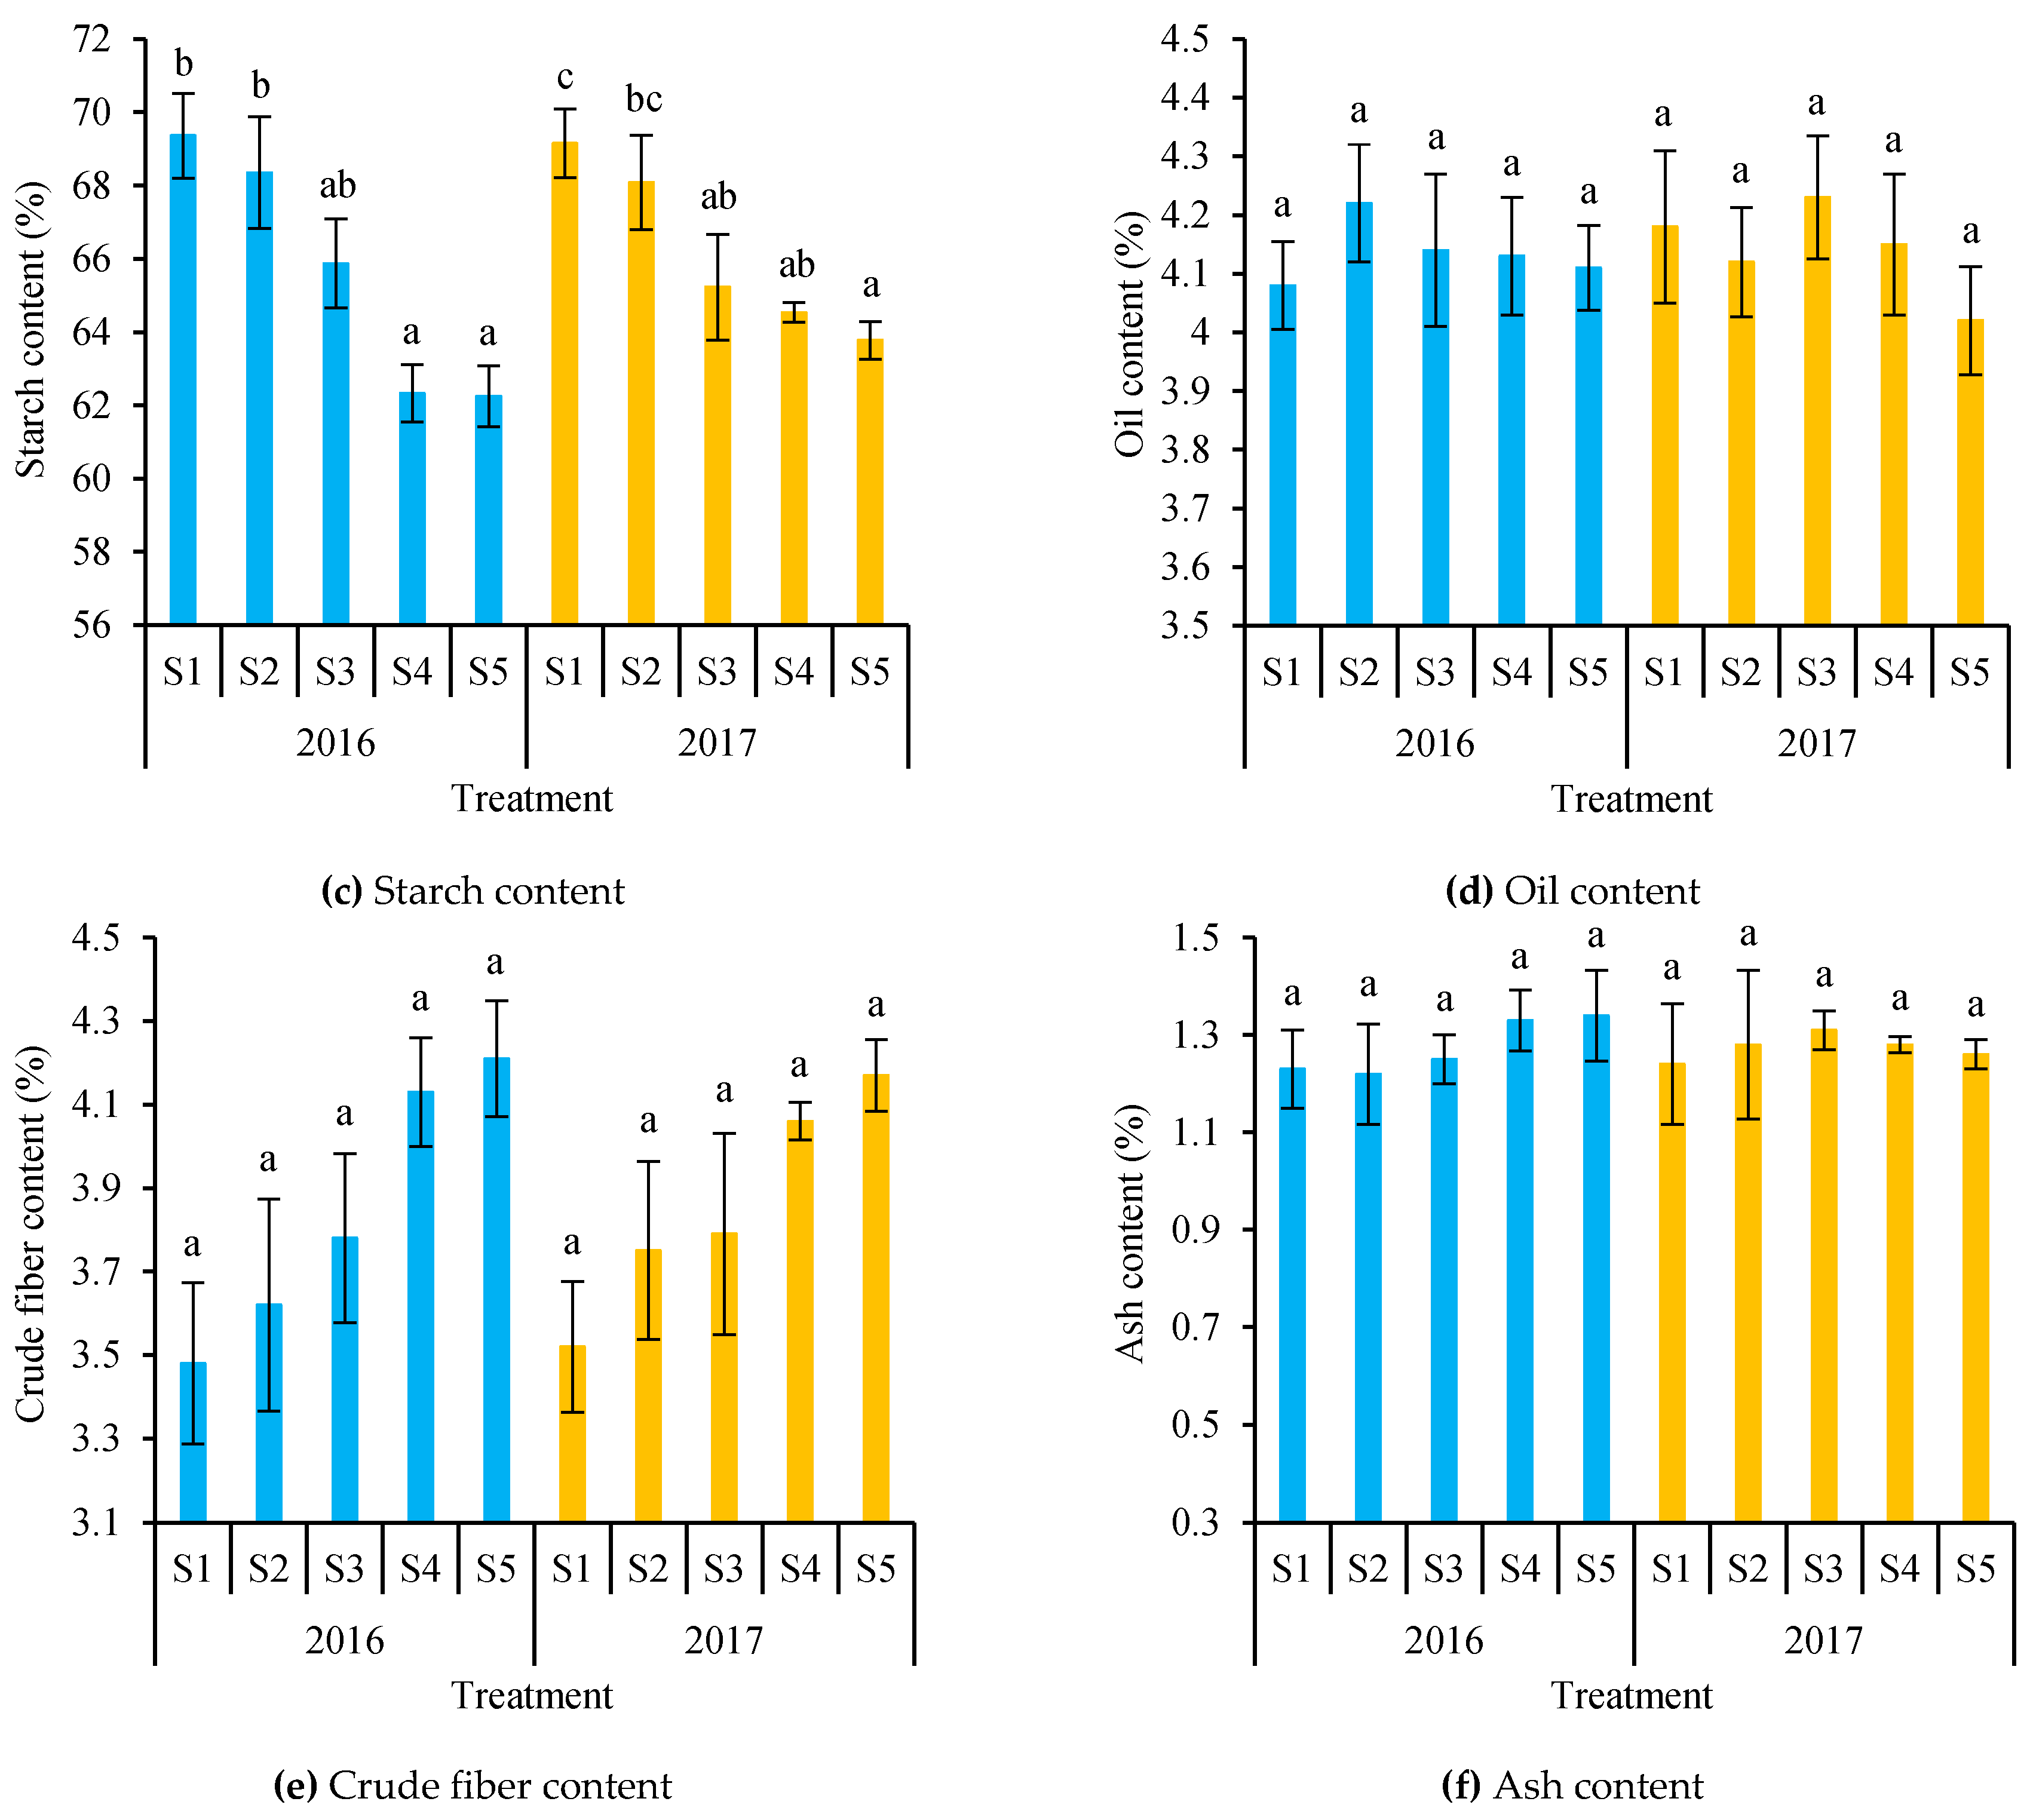
After the maize harvest, 1.0 kg of fresh maize kernel was collected in each plot for the analysis of grain quality. The content of moisture, protein, starch, oil, crude fiber, and ash were measured with the methods described by the Association of Official Analytical Chemists (AOAC) [40].
2.4.6. Soil Salinity
The dynamic balance for soil salinity is one of the most important targets to evaluate the suitability of irrigation water salinity. Thus, soil samples were taken for soil salinity measuring with an auger at each growth stage for all treatments at depths of 0–10 cm, 10–20 cm, 20–30 cm, 30–40 cm, 40–60 cm, 60–80 cm, and 80–100cm. Each layer was sampled at four locations, with distances from the drip tube distributed as 0 cm, 17.5 cm, 35 cm, and 60 cm (Figure 3b). All soil samples were naturally air-dried and ground well to pass through a 1 mm sieve. The soil leachates were prepared at soil to water ratio of 1:5. The electrical conductivity EC1:5 was determined with a conductivity meter (DDSJ-308A, REX, Shanghai). The soil salt concentration was estimated by EC1:5 via the following equation [2]:
where S is the mass salt content (%) and EC1:5 is the soil electrical conductivity (dS·m−1).
The soil salinity for each soil layer in the film was estimated by the soil salinity of the corresponding soil layer at 0 cm, 17.5 cm, and 35 cm away from the dripper, while the average soil salt content for each layer outside the film was represented by that at the position of 60 cm away from the dripper. A simultaneous irrigation for all treatments at maize jointing stage was selected to indicate the soil salt distribution before and after irrigation.
As the maize main roots were distributed 10–30 cm away from the drip tape horizontally and 0–40 cm underneath the surface, the soil salinity in the main root zone (0–40 cm soil layer in the film) and the secondary root zone (40–100 cm soil layer in the film) before sowing and after harvesting was analyzed, as well as 0–40 cm and 40–100 cm soil layer outside the mulch.
2.5. Statistical Analysis
The evapotranspiration, emergence rate, plant growth parameters, maize yield, grain quality, and salt accumulation were analyzed with Excel 2016 and SPSS 20.0. The soil salt distribution was analyzed by Surfer 12.2.705. The single-factor analysis of variance (ANOVA) and multiple comparisons were done for significant effect among treatments with the least-significant difference (LSD) test at α = 0.05 level of significance.
3. Results
3.1. Irrigation
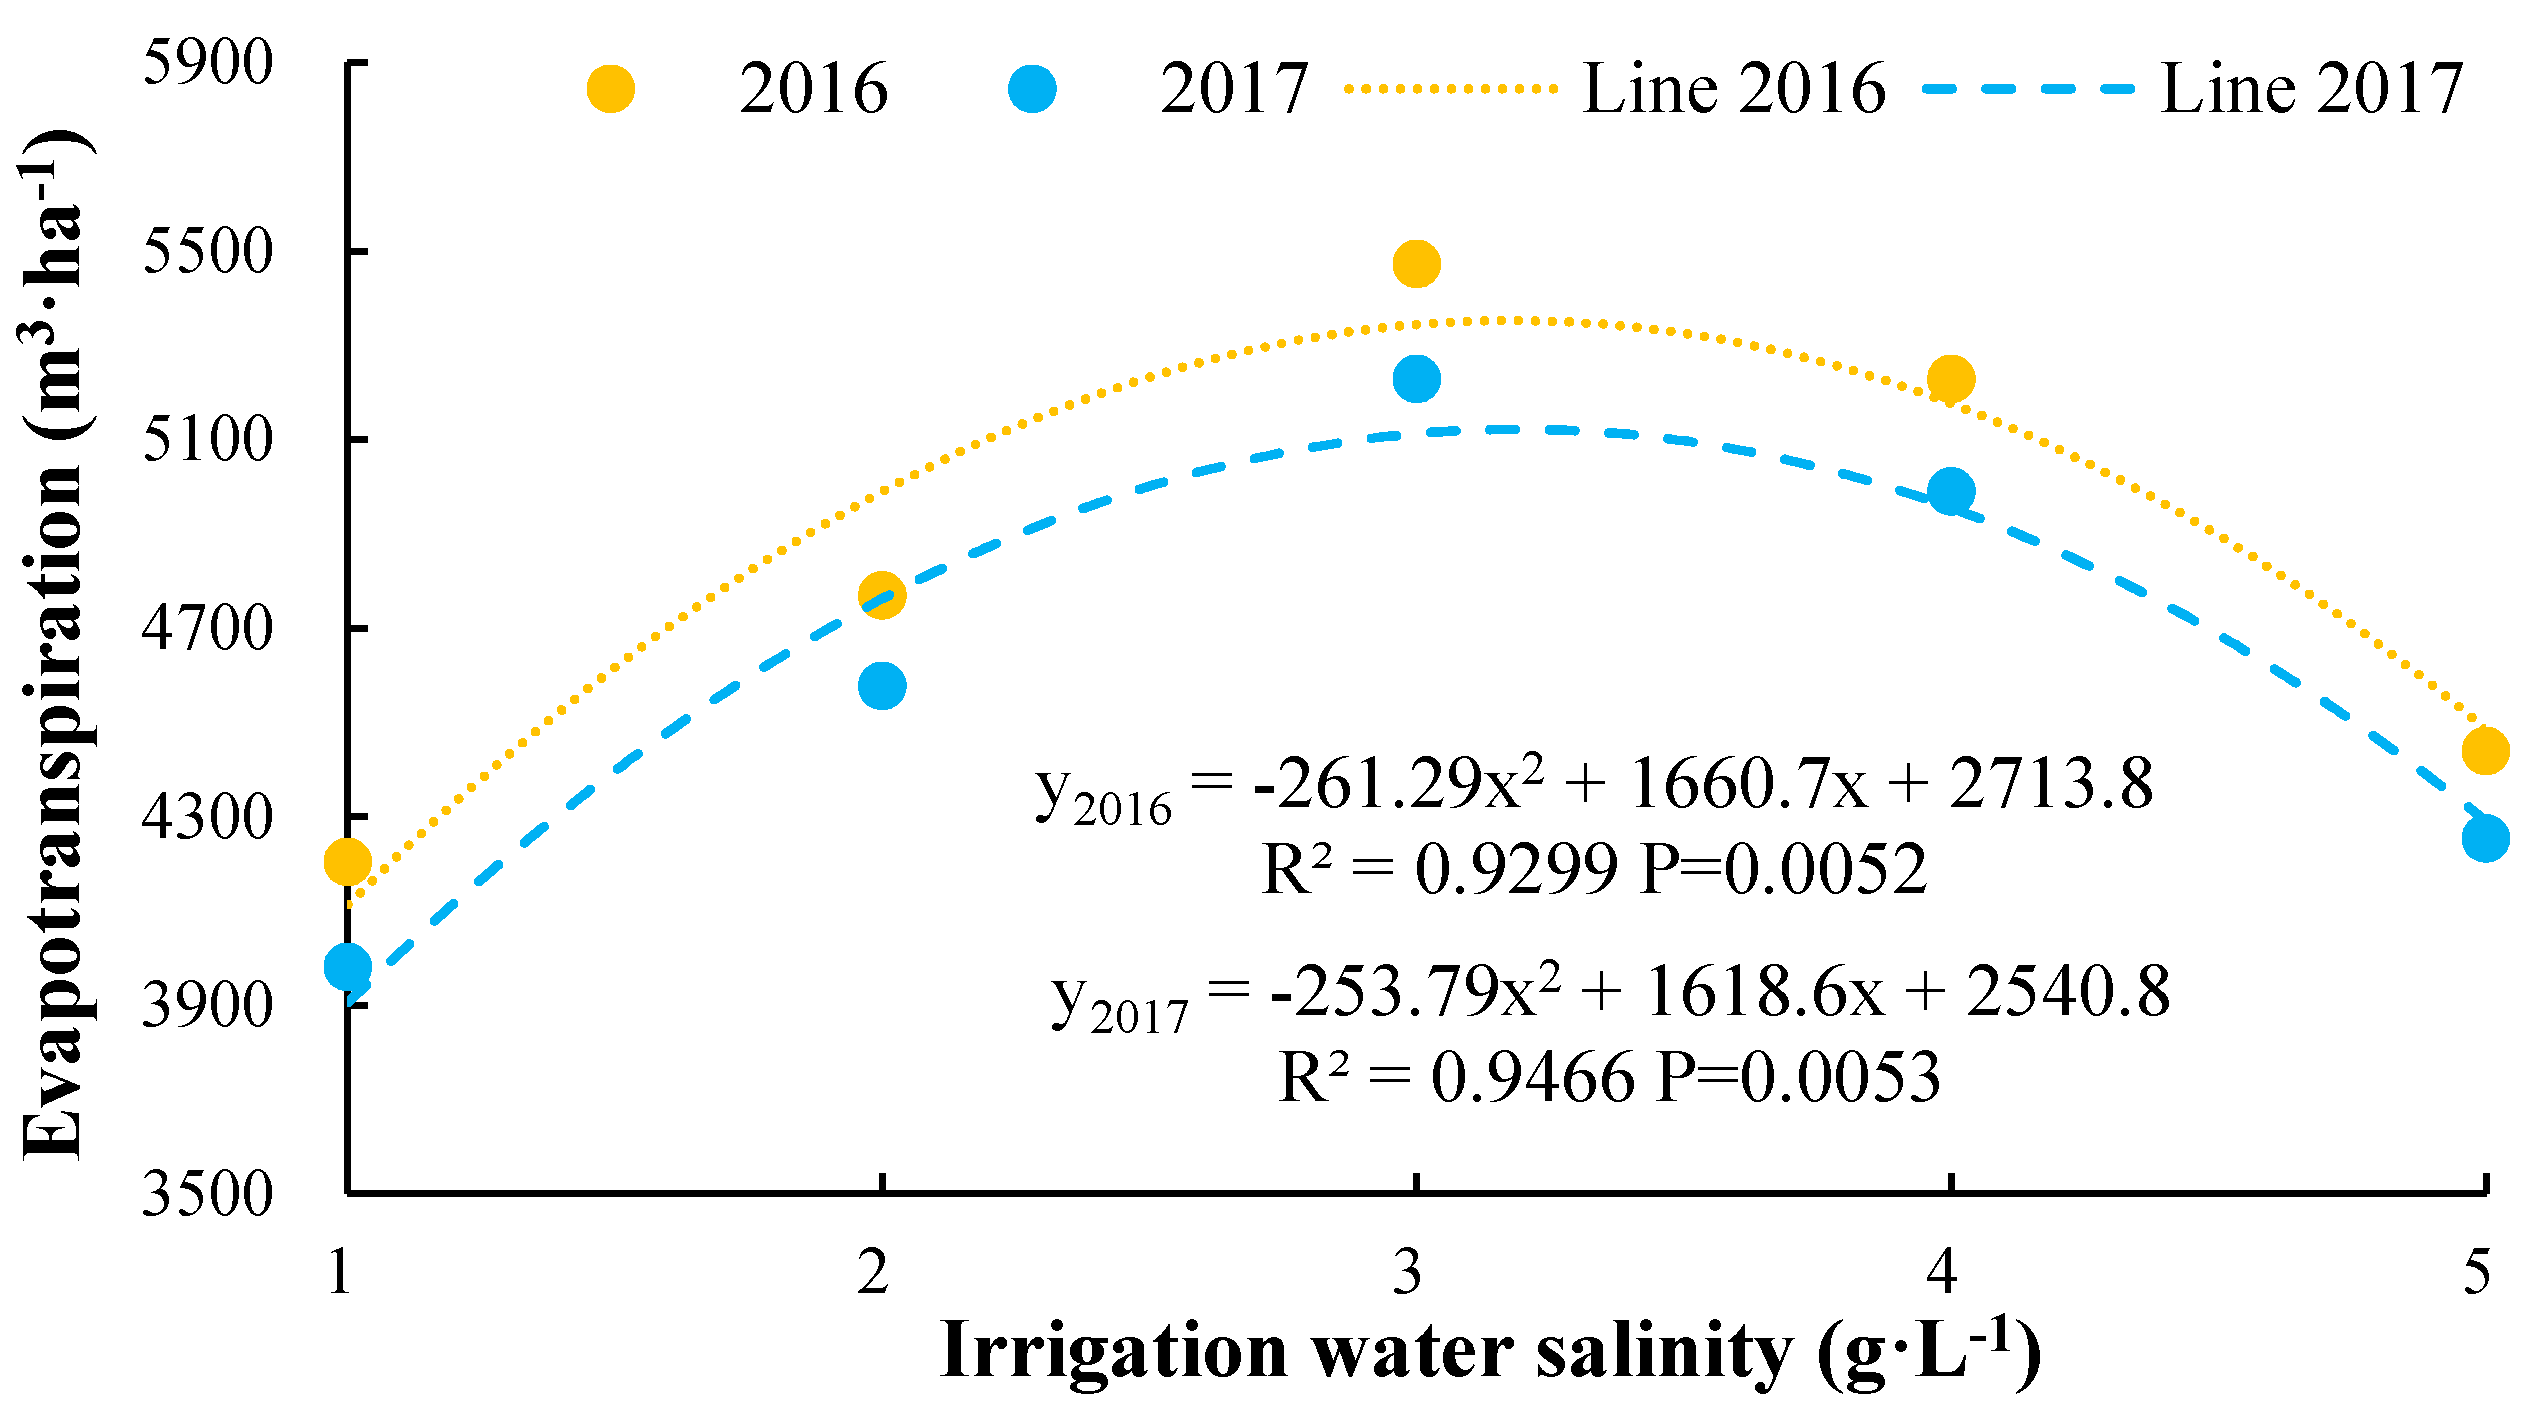
The soil matric potential usually varies with the irrigation water salt concentrations, which consequently leads to the difference of irrigation frequency. The variation of evapotranspiration with irrigation water salinity is shown in Figure 4.
As shown in Figure 4, the salt concentrations of irrigation water had significant impacts on maize mulched drip irrigation quota, and the evapotranspiration and irrigation quota had similar trends with levels of irrigation water salinity. With the soil matric potential of 20 cm underneath the emitter was controlled at −20 kPa, the relationship between evapotranspiration and irrigation water salinity showed a quadratic polynomial pattern, in which the evapotranspiration amount increased with the increase of irrigation water salinity at first, and reached the maximum value as irrigation water salt concentration reached 3 g·L−1. Then, the evapotranspiration decreased with the increase of water salinity, which indicated that the salinity of irrigation water shows dual influence on maize evapotranspiration. On one hand, the high irrigation water salinity usually leads to the low SMP, which results in a SMP close to the target value (−20 kPa). Thus, the increase in evapotranspiration increased corresponded to the increase of irrigation frequency. On the other hand, when the salinity of the irrigation water reached 5 g·L−1, maize showed difficulty in absorbing water due to the salt stress, which resulted in the decline of crop water consumption.
3.2. Seeding Emergence
Seed germination is one of the key factors for maize yield. The emergence rate of maize for treatments with time is shown in Table 7.
According to Table 7, the seeding emergence rate for S1, S2, S3, and S4 treatments increased sharply with the time first and then tended to be steady on 12 days after sowing. The emergence rate for the S5 treatment increased sharply first and then declined slowly, reaching the maximum at 12 days after sowing. Compared with S1, S2, and S3 treatments, S4 and S5 treatments showed a two-day delay of the emergence. At 12 days after sowing, the seeding emergence tended to be stable. The emergence rate for S1, S2, and S3 treatments reached 93%–97% in 2016 and 93%–98% in 2017, respectively, while the emergence rate for S4 and S5 treatments reached 78%–81% in 2016 and 2017, respectively. At 14 days after sowing, the emergence rate for S1, S2, and S3 treatments reached 94%–99%, while the emergence rate for the S4 treatment reached 81%–84%. However, the emergence rate for the S5 treatment decreased slowly, and reached 77% in 2016 and 76% in 2017, respectively.
3.3. Maize Vegetative Growth Characteristics
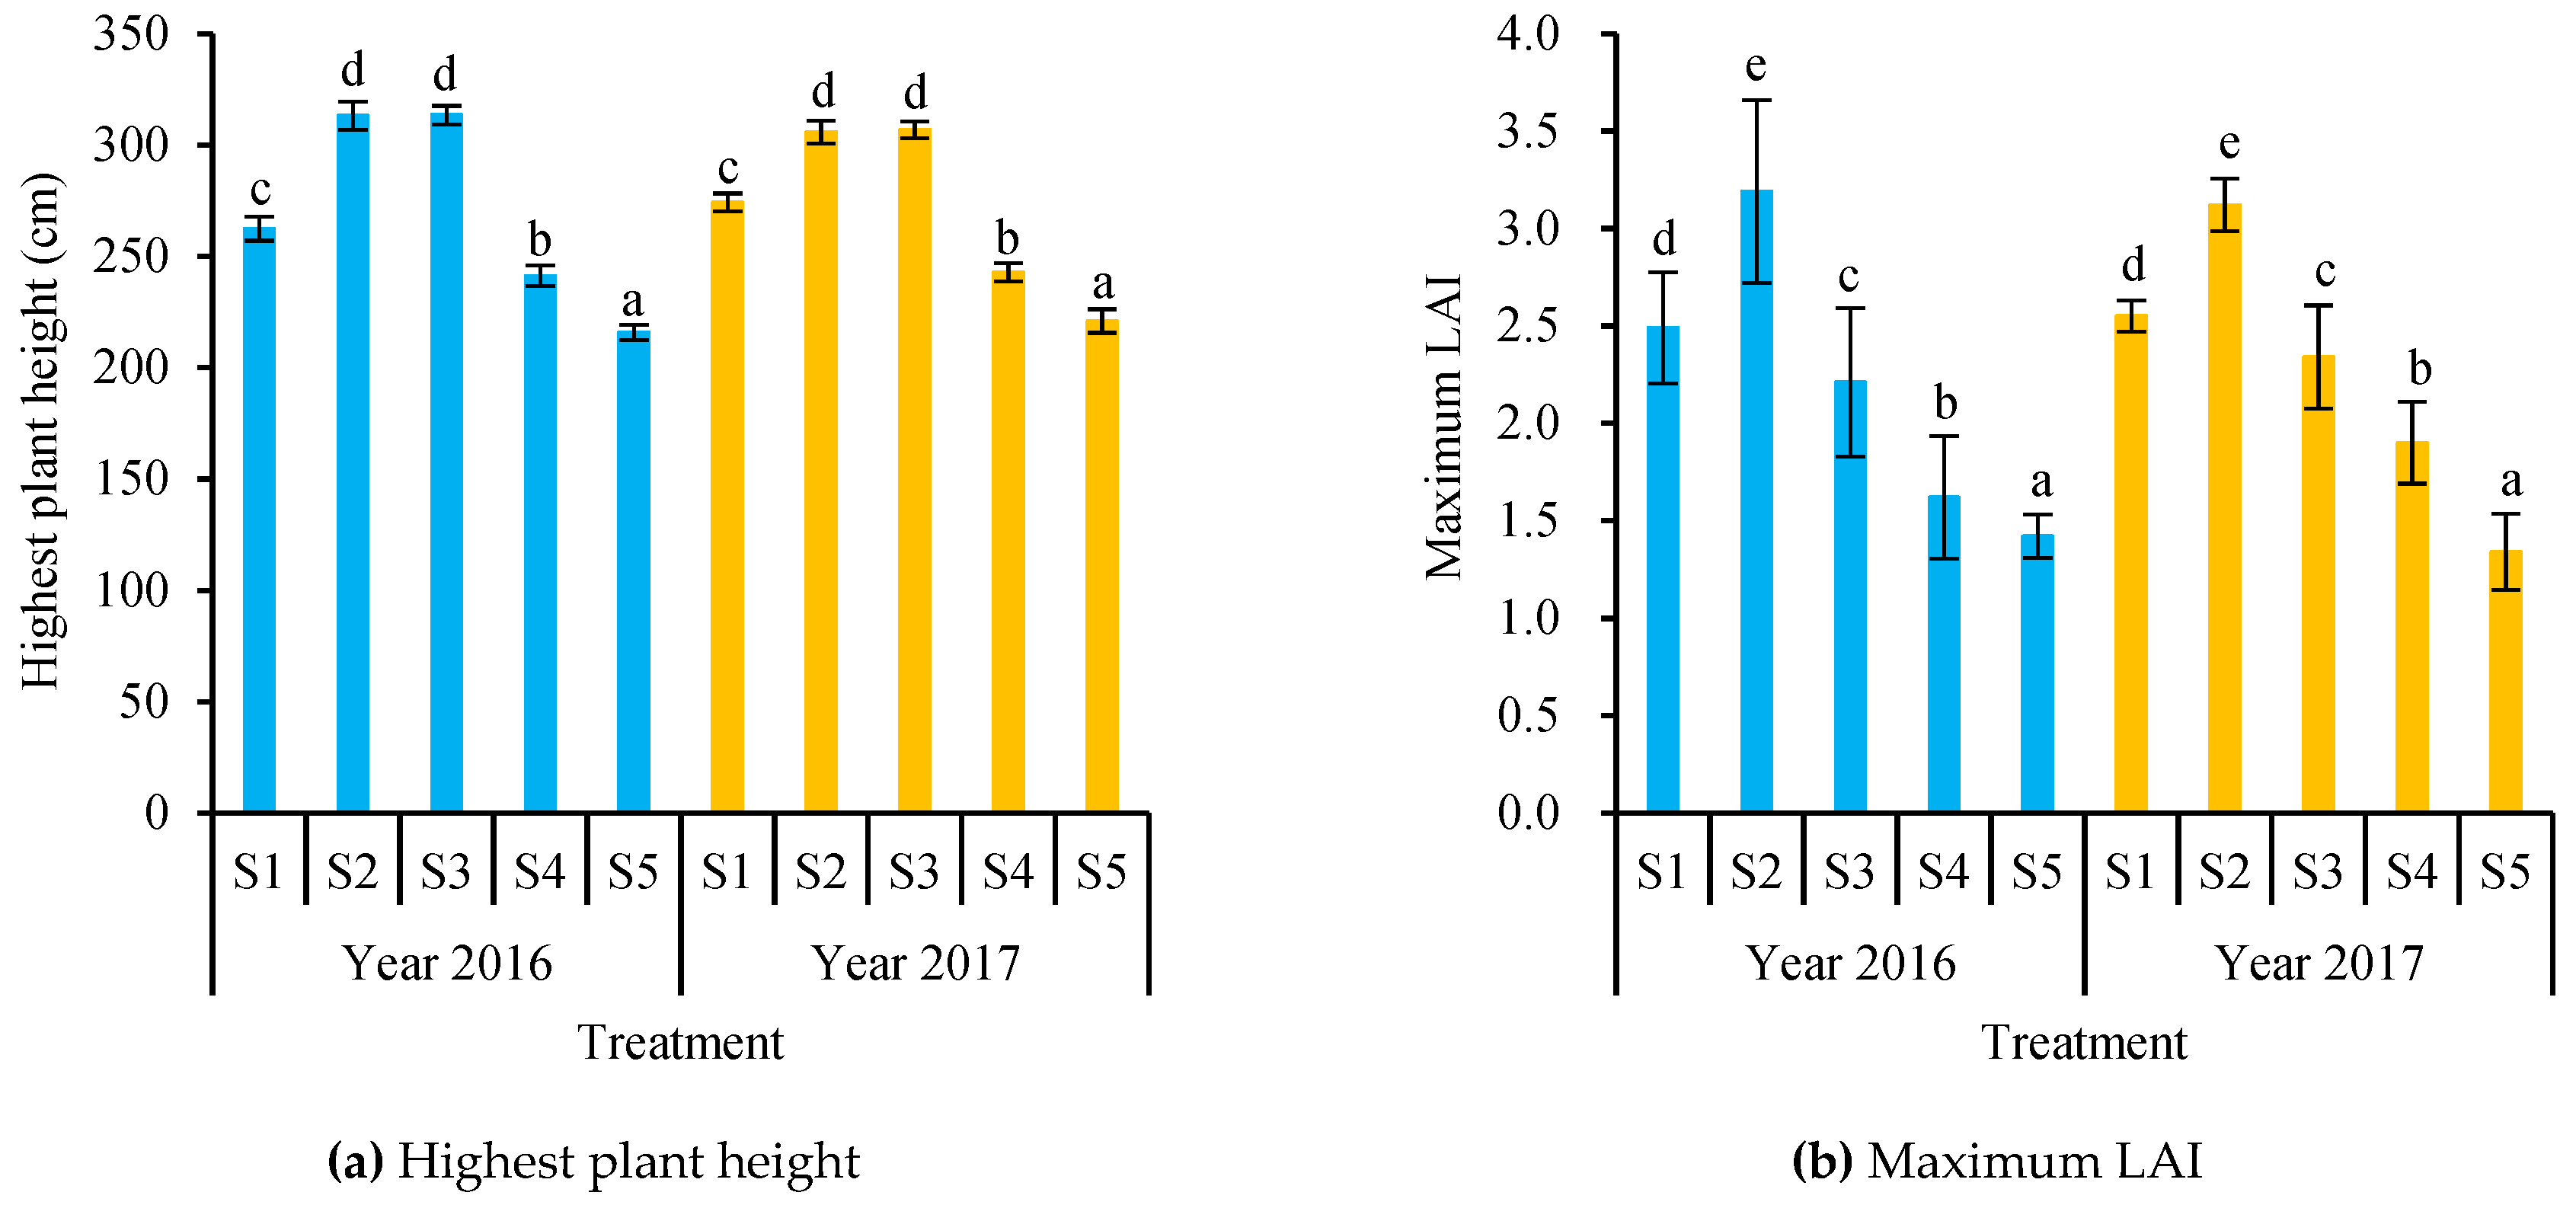
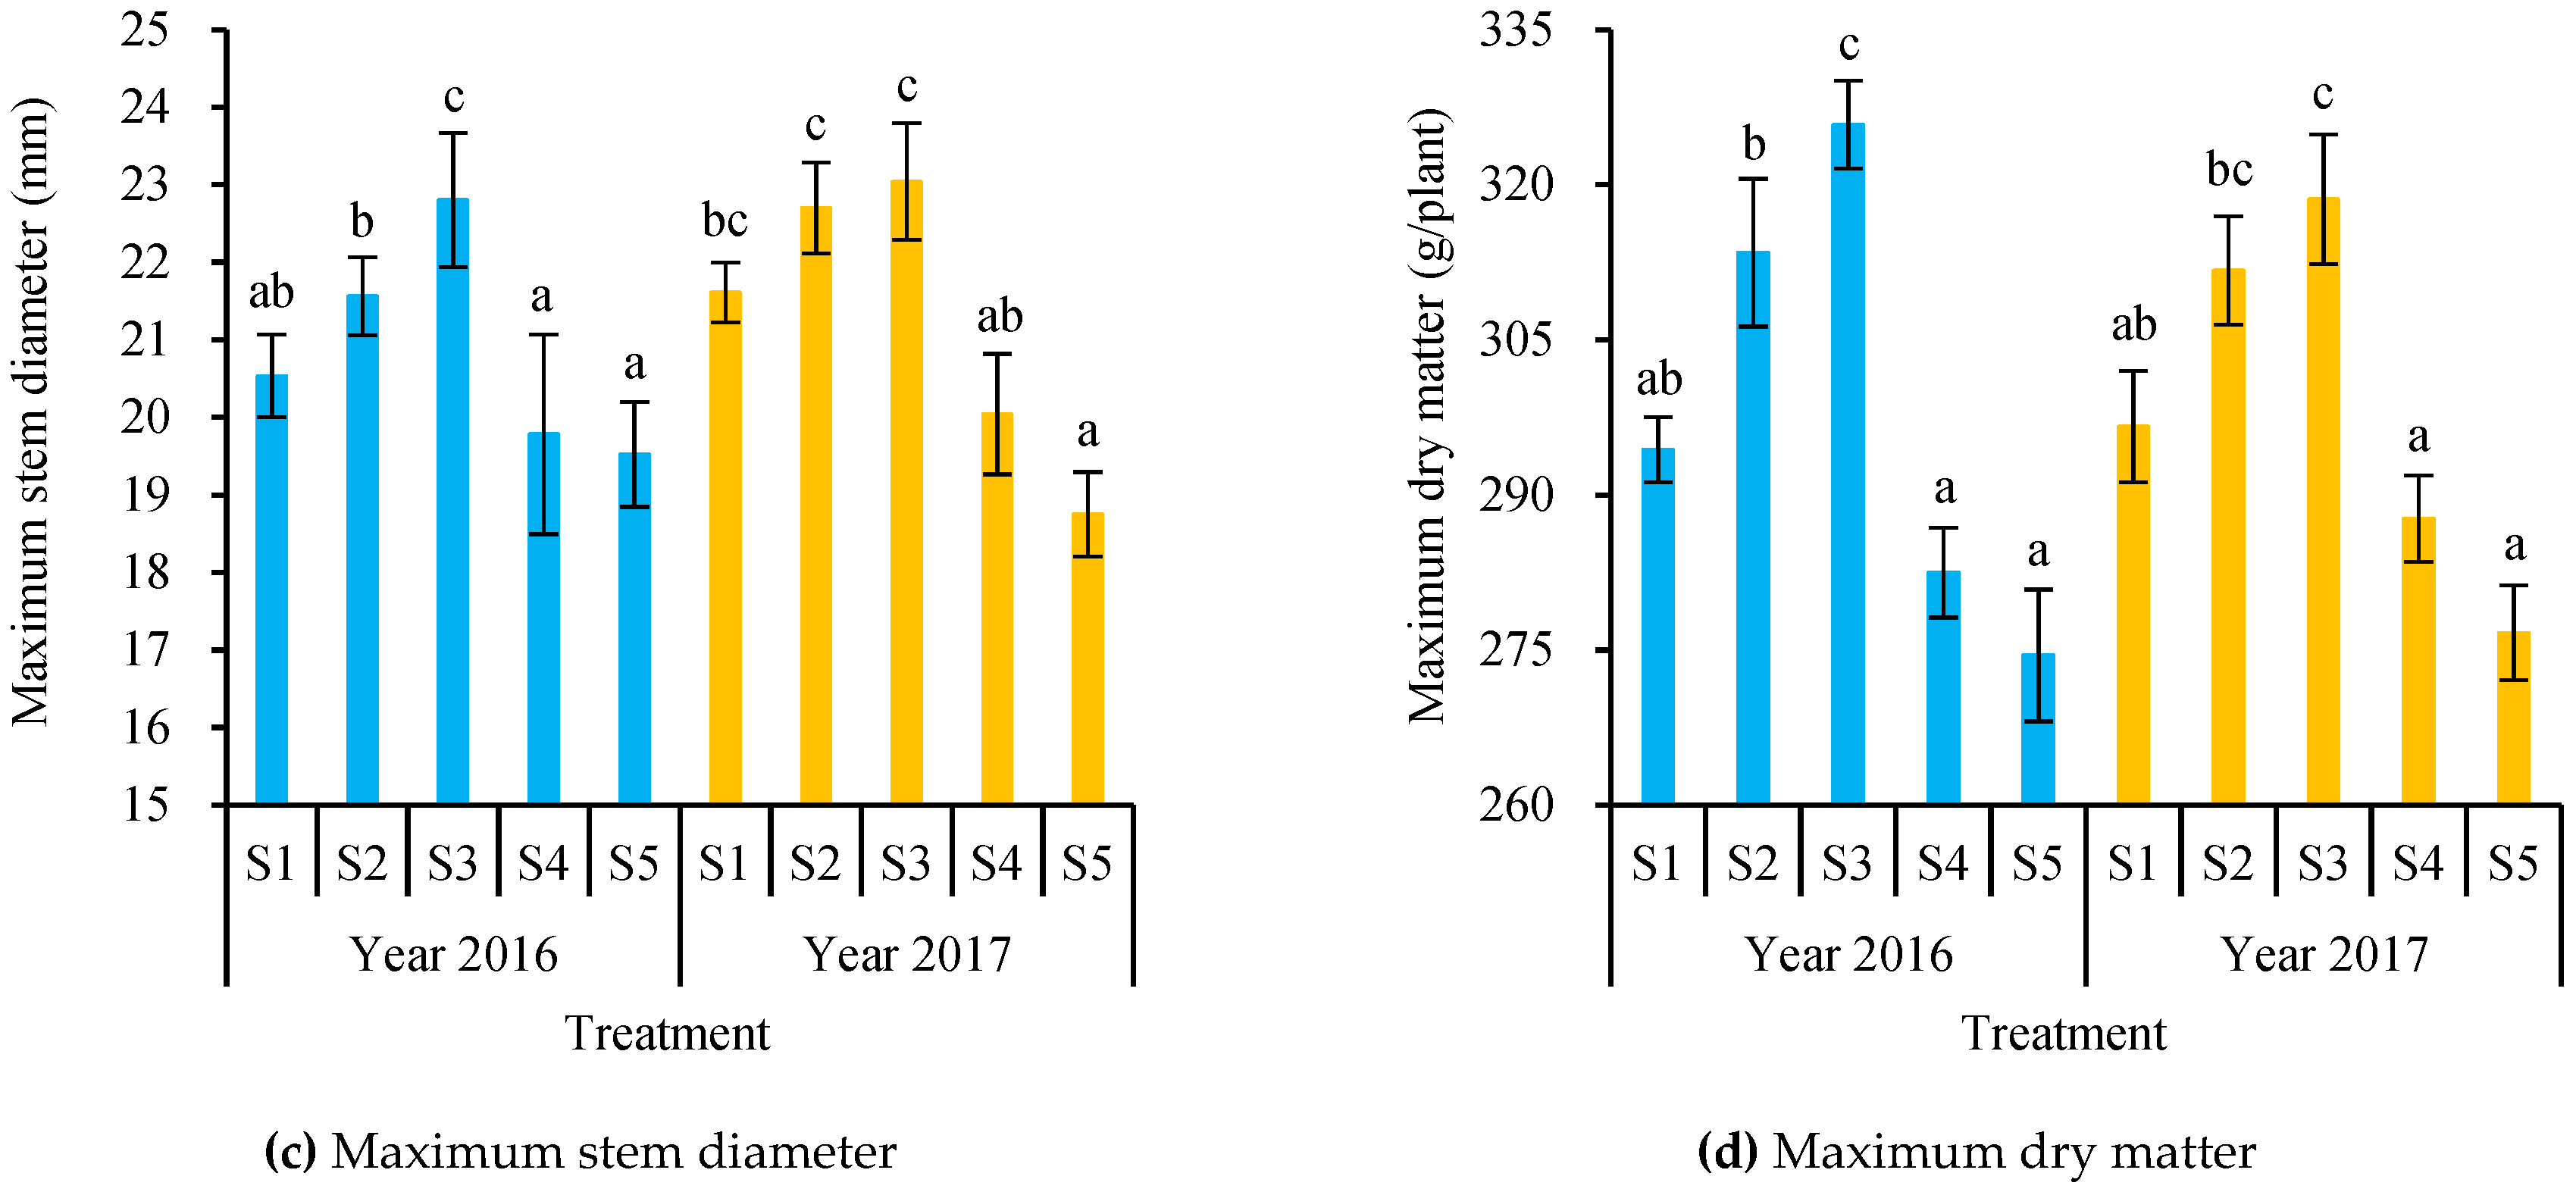
Morphological characteristics, such as plant height, stem diameter, and LAI, are important growth indexes for crops, which can reflect the crop growth visually. As maize vegetative growth indexes usually reached the maximum value at mature stage, the growth parameters at mature stage are shown in Figure 5.
As shown in Figure 5, the irrigation water salinity had significant influence on maize growth indexes, which increased with the increasing water salt concentrations at first, reached the maximum at 2 g·L−1 and 3 g·L−1, and then decreased with the increase of water salinity. Maize growth indexes reached the minimum value when the salinity of irrigation water was 5 g·L−1, while the stem diameter and dry matter weight reached the maximum value as the water salinity reached 3 g·L−1. Meanwhile, the LAI reached the maximum value when the irrigation water salt concentration reached 2 g·L−1. The response of maize growth indexes to the irrigation water salinity showed a similar pattern in 2016 and 2017. Compared with the S1 treatment, the maximum plant height stem diameter and dry matter weight for the S3 treatment increased by 19.44%, 11.06%, and 10.68% in 2016 and 11.93%, 6.62%, and 7.42% in 2017, respectively, while the LAI for S3 treatment decreased by 11.25% in 2016 and 8.24% in 2017, respectively. Meanwhile, compared with the S1 treatment, the plant height, LAI, stem diameter, and dry matter weight for the S5 treatment decreased by 17.79%, 42.97%, 4.92%, and 6.76% in 2016 and 19.43%, 47.45%, 13.23%, and 6.72% in 2017, respectively.
3.4. Yield and Water Use Efficiency
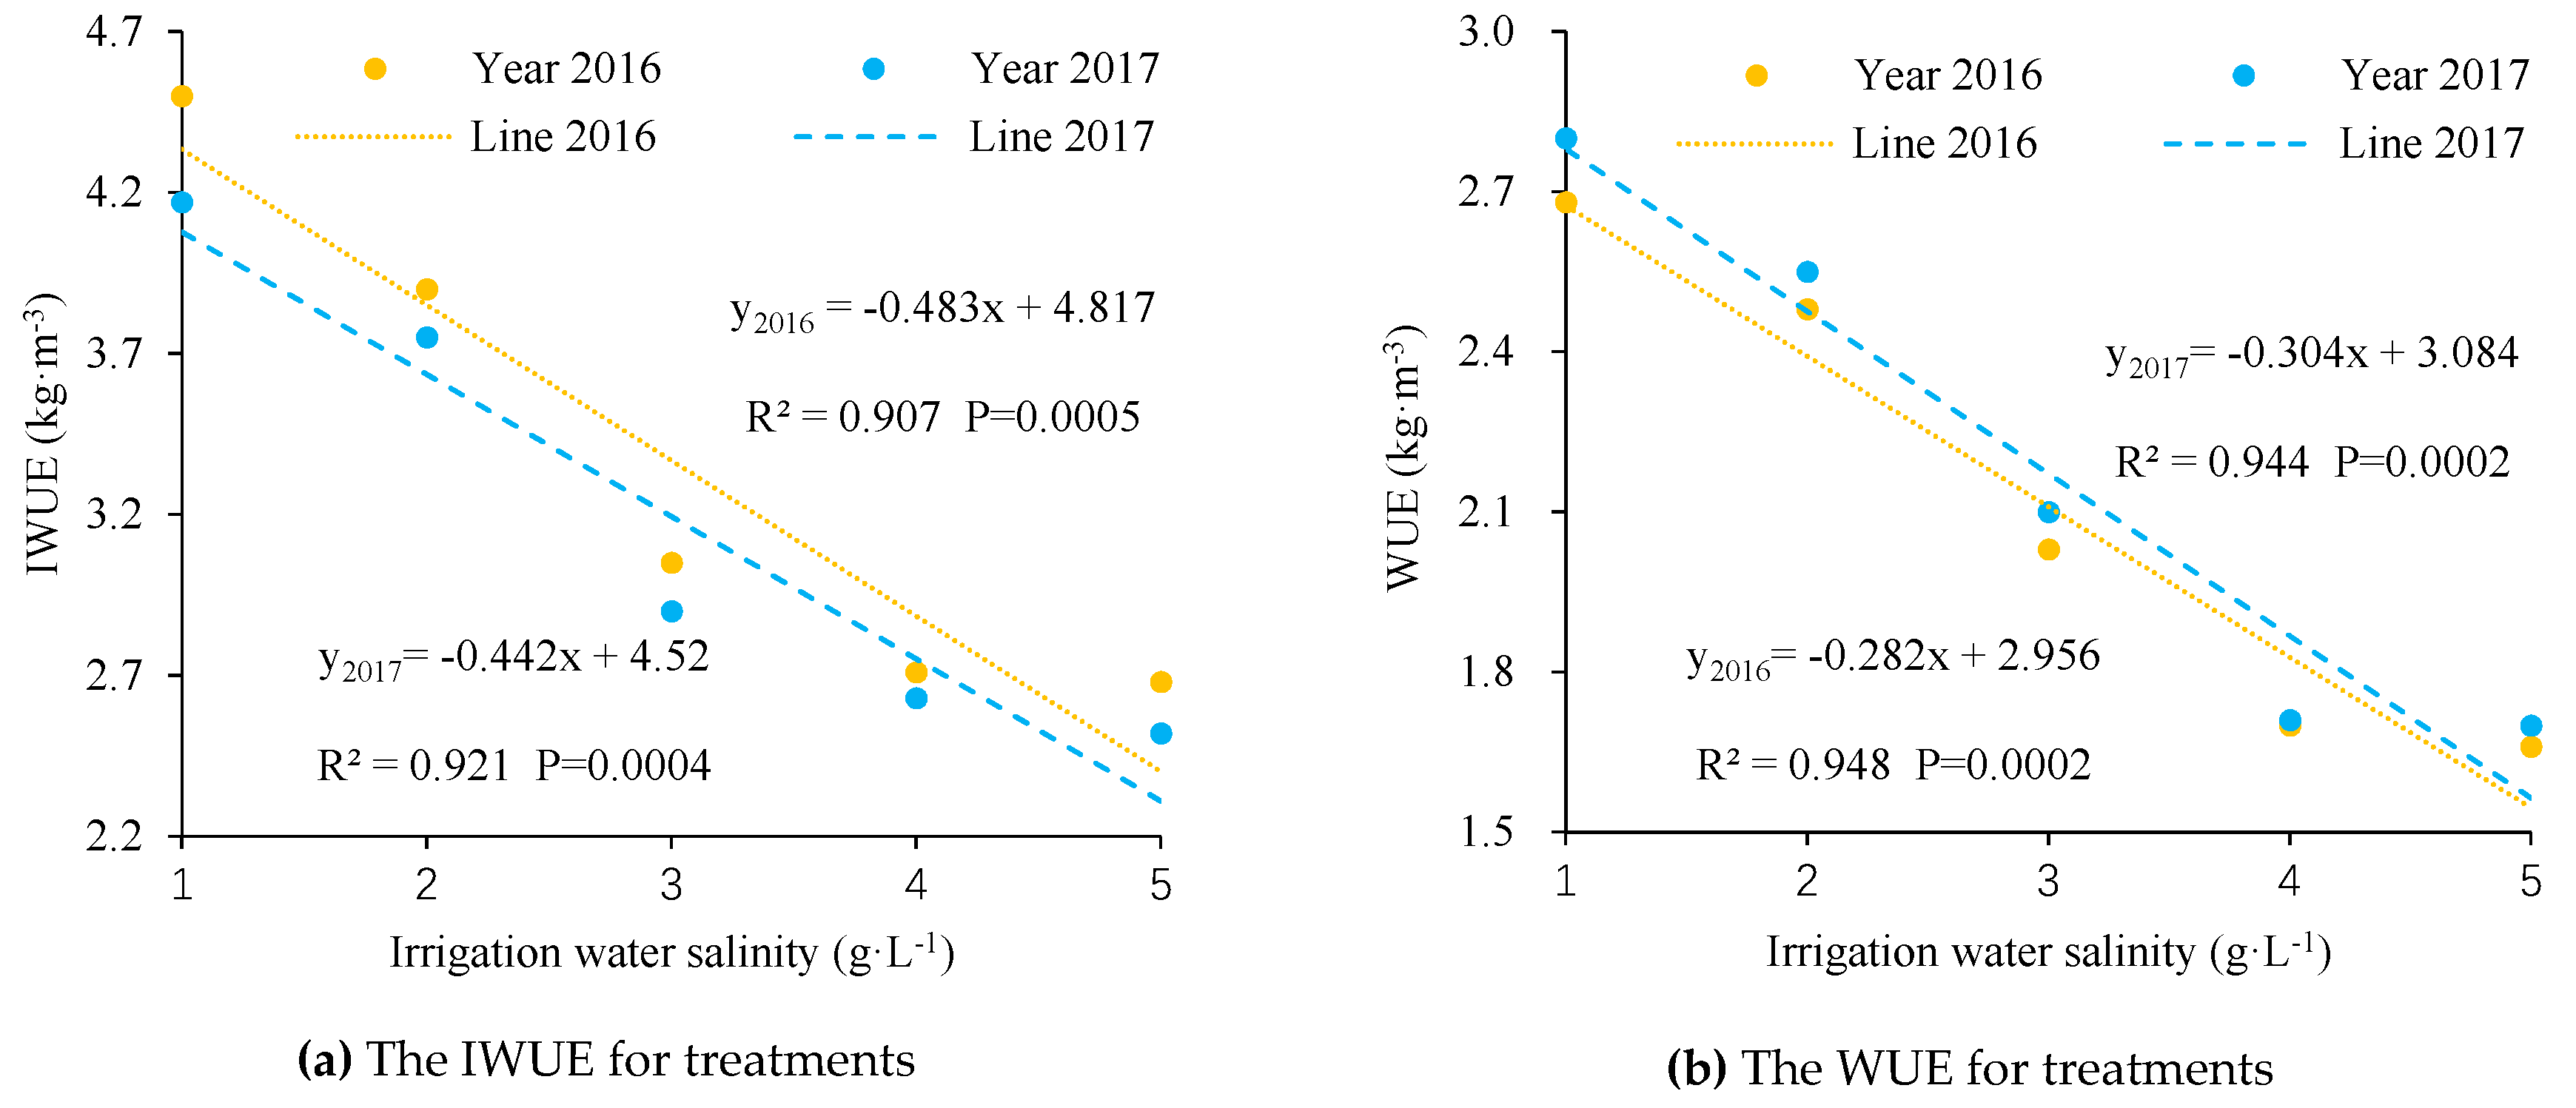
IWUE is usually the critical parameter for effective planning irrigation schedule in arid and semiarid areas [41,42]. The grain yield and maize biomass are listed in Table 8, while the IWUE and WUE are shown in Figure 6. Both the grain yield and biomass increased first and then decreased sharply with the increase of irrigation water salinity (Table 8). Compared with maize yield at irrigation water salinity of 1 g·L−1, maize yield at irrigation water concentration of 2 g·L−1 increased by 4.9% both in 2016 and 2017, while the grain yield for the S3 treatment decreased by 1.6% in 2016 and 1.4% in 2017. Meanwhile, the maize yield for S4 and S5 treatments decreased by 21.2% and 34.5% in 2016 and 23.4% and 35.6% in 2017. Moreover, compared with maize biomass at irrigation water salinity of 1 g·L−1, the maize biomass for S2 and S3 treatments increased by 8.4% and 9.6% in 2016 and 3.9% and 9.3% in 2017, while the maize biomass for S4 and S5 treatments decreased by 18.6% and 27.5% in 2016 and 20.6% and 28.4% in 2017. As shown in Figure 6, the WUE and IWUE decreased linearly with the irrigation water salinity raised from 1 g·L−1 to 5 g·L−1, and the IWUE and WUE decreased by 0.282–0.304 kg·m−3 and 0.442–0.483 kg·m−3 for every 1 g·L−1 increase in salinity level of irrigation water, respectively.
3.5. Grain Quality
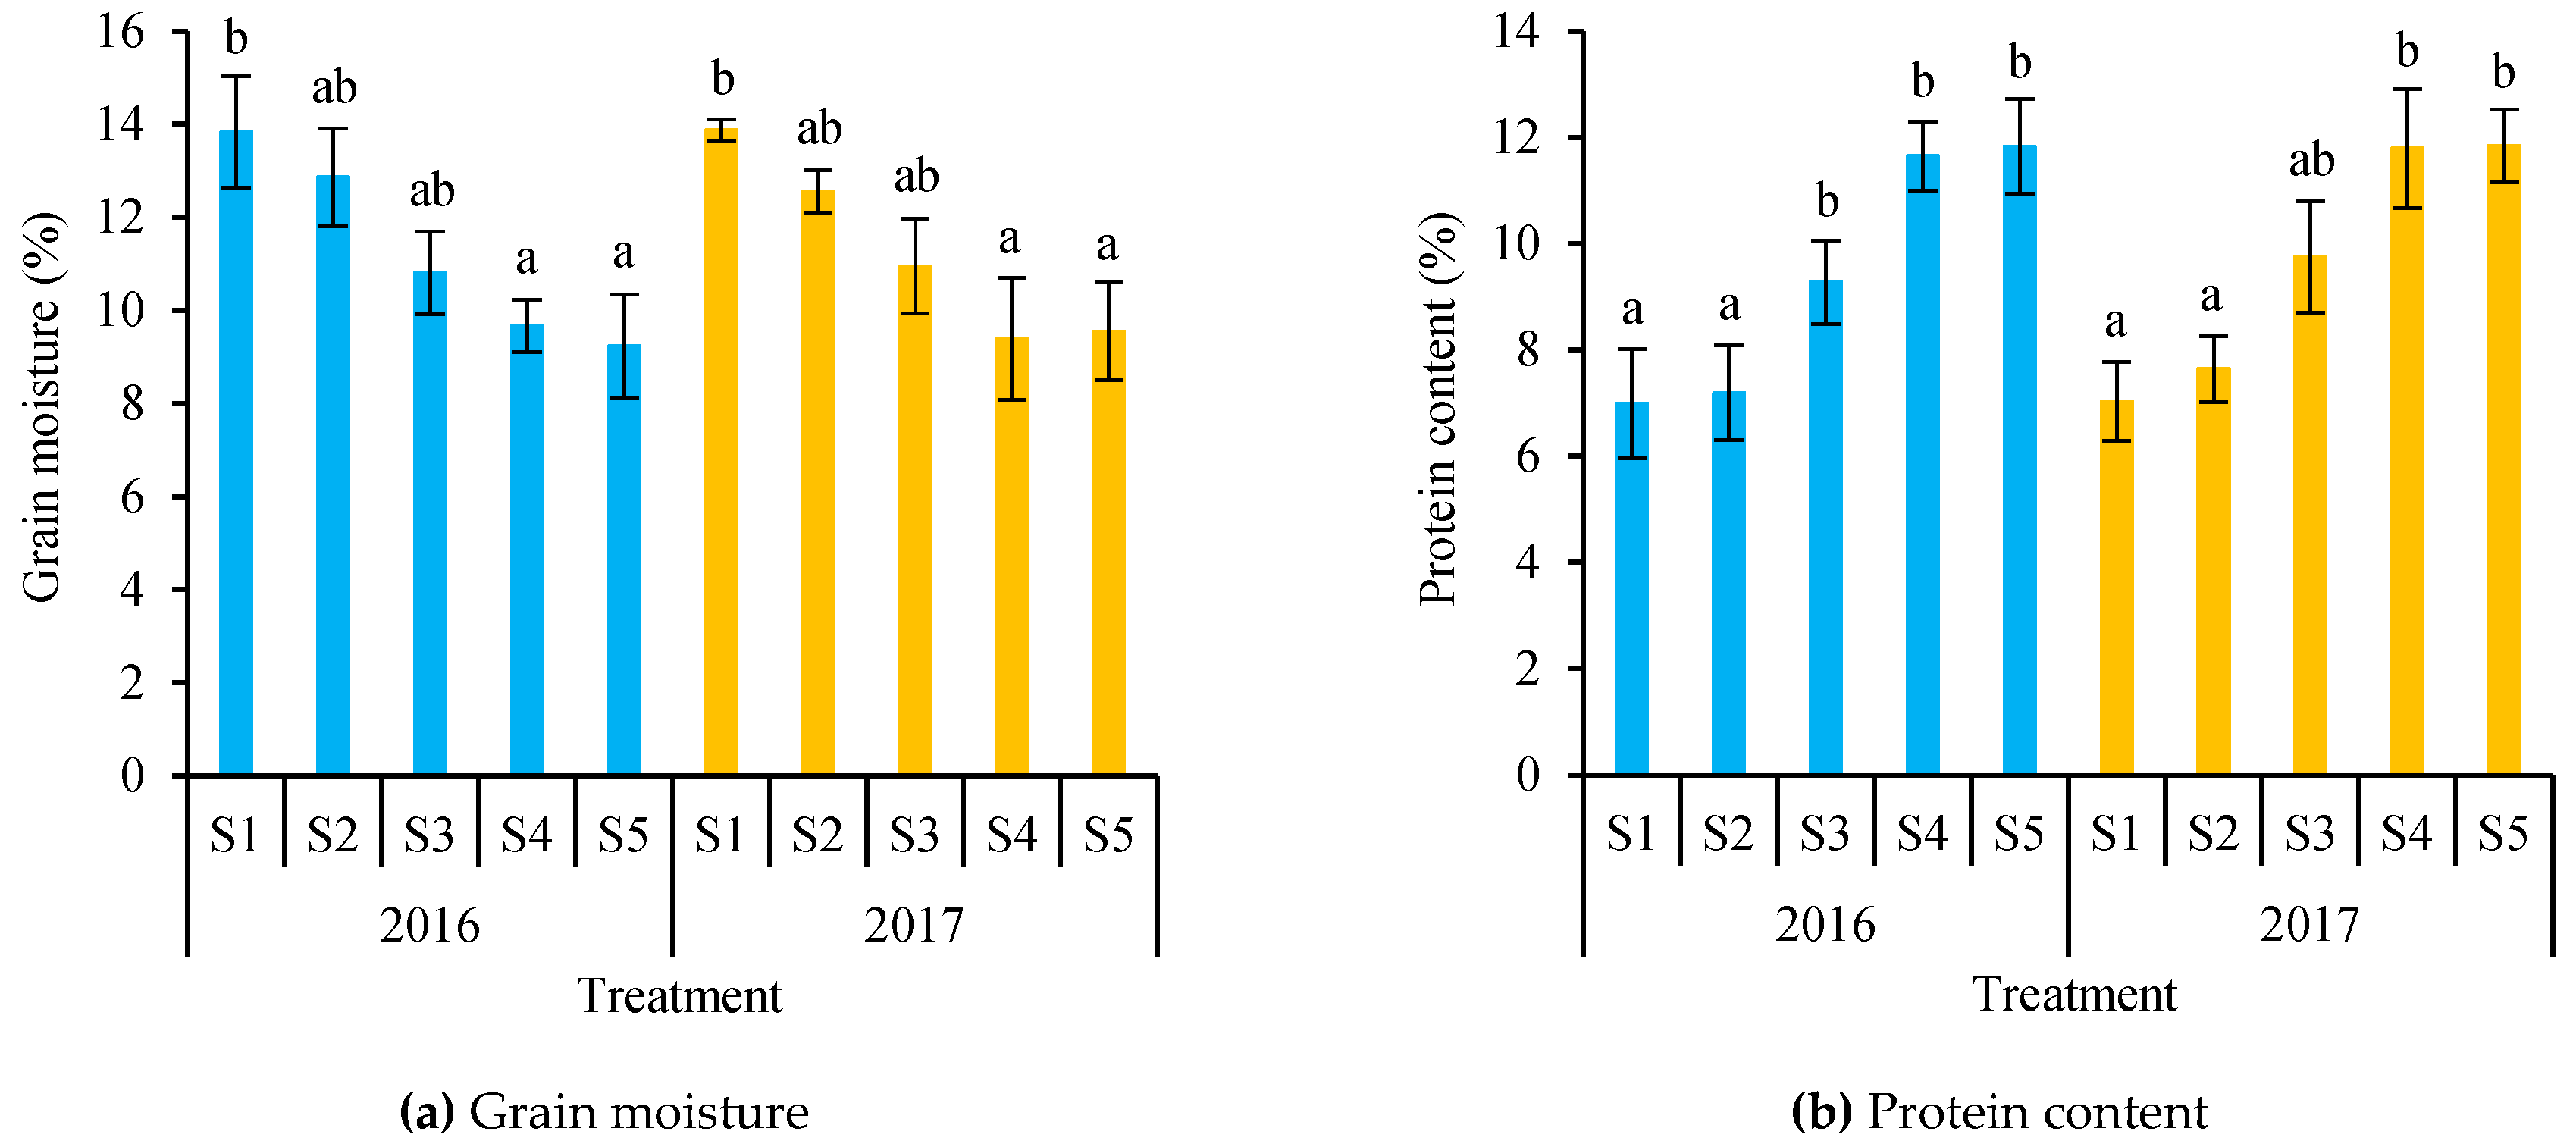
The effects of irrigation water salinity on maize grain quality are shown in Figure 7. There was no significant difference between treatments for the grain content of oil, crude fiber, and ash, while there was a significant difference between S1 and S2 treatments and S4 and S5 treatments for grain moisture, protein content, and starch content. Moreover, the grain moisture and starch content decreased with the increase of irrigation water salinity, while the protein content raised with the increase of irrigation water salt concentrations. Maize grain reached the maximum protein content when irrigation water salinity reached 5 g·L−1, while the kernel achieved the maximum starch content as irrigation water salt concentrations controlled at 1 g·L−1. Compared with the S1 treatment, the grain moisture and starch content for the S3 treatment decreased by 21.84% and 5.03% in 2016 and 21.05% and 5.67% in 2017, respectively. Meanwhile, the protein content increased from 6.99% to 9.27% in 2016 and 7.03% to 9.75% in 2017, respectively.
3.6. Effects of Irrigation Water Salinity on Soil Salt Distribution and Accumulation
3.6.1. Soil Salt Distribution
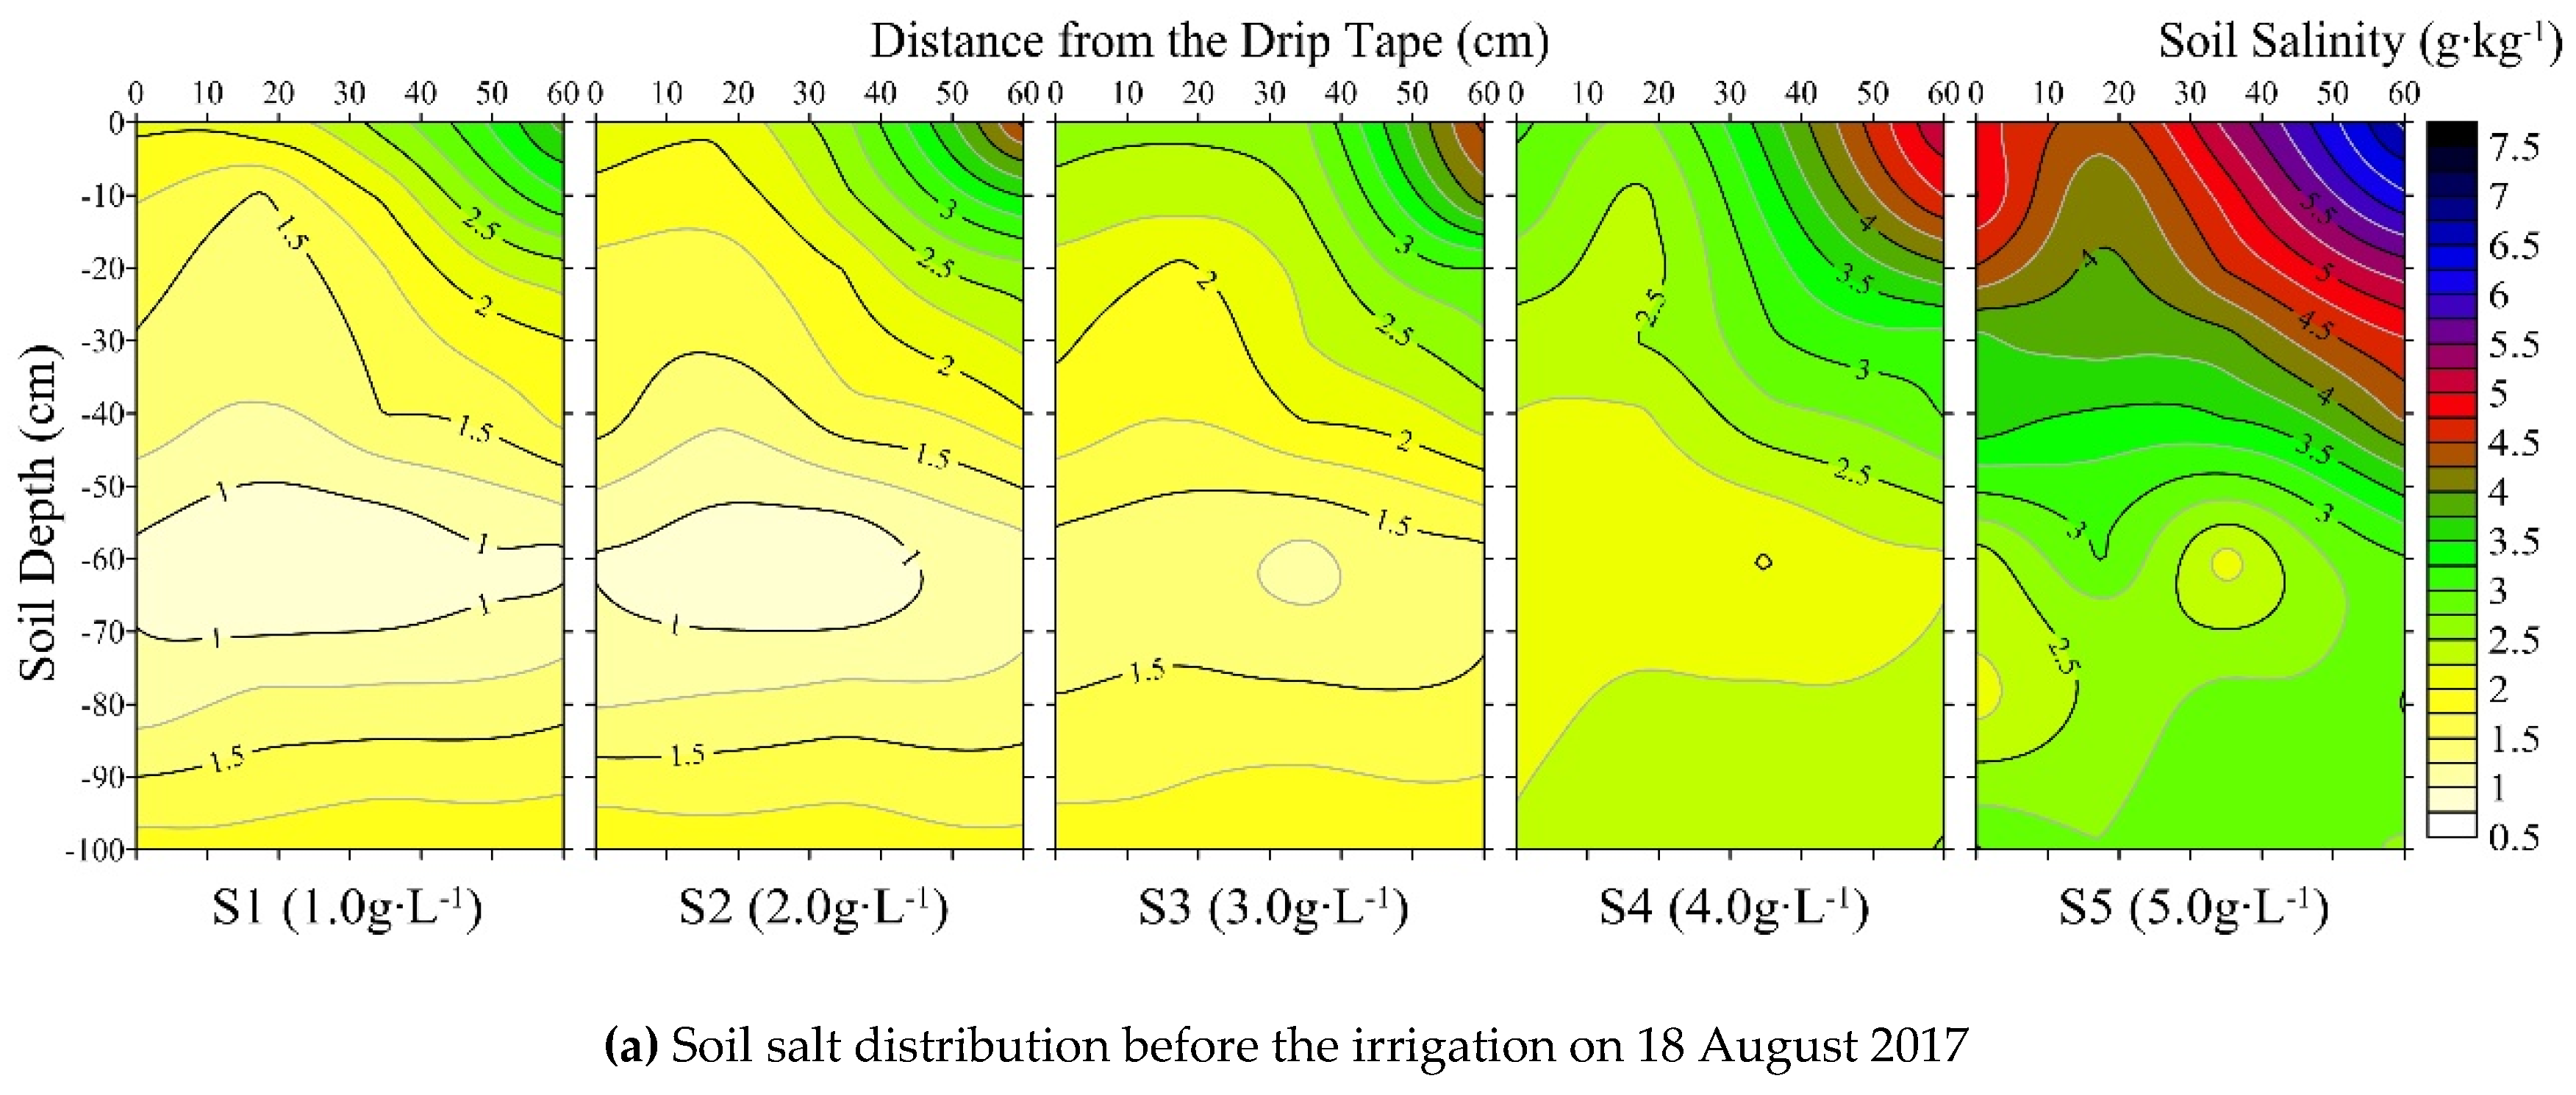
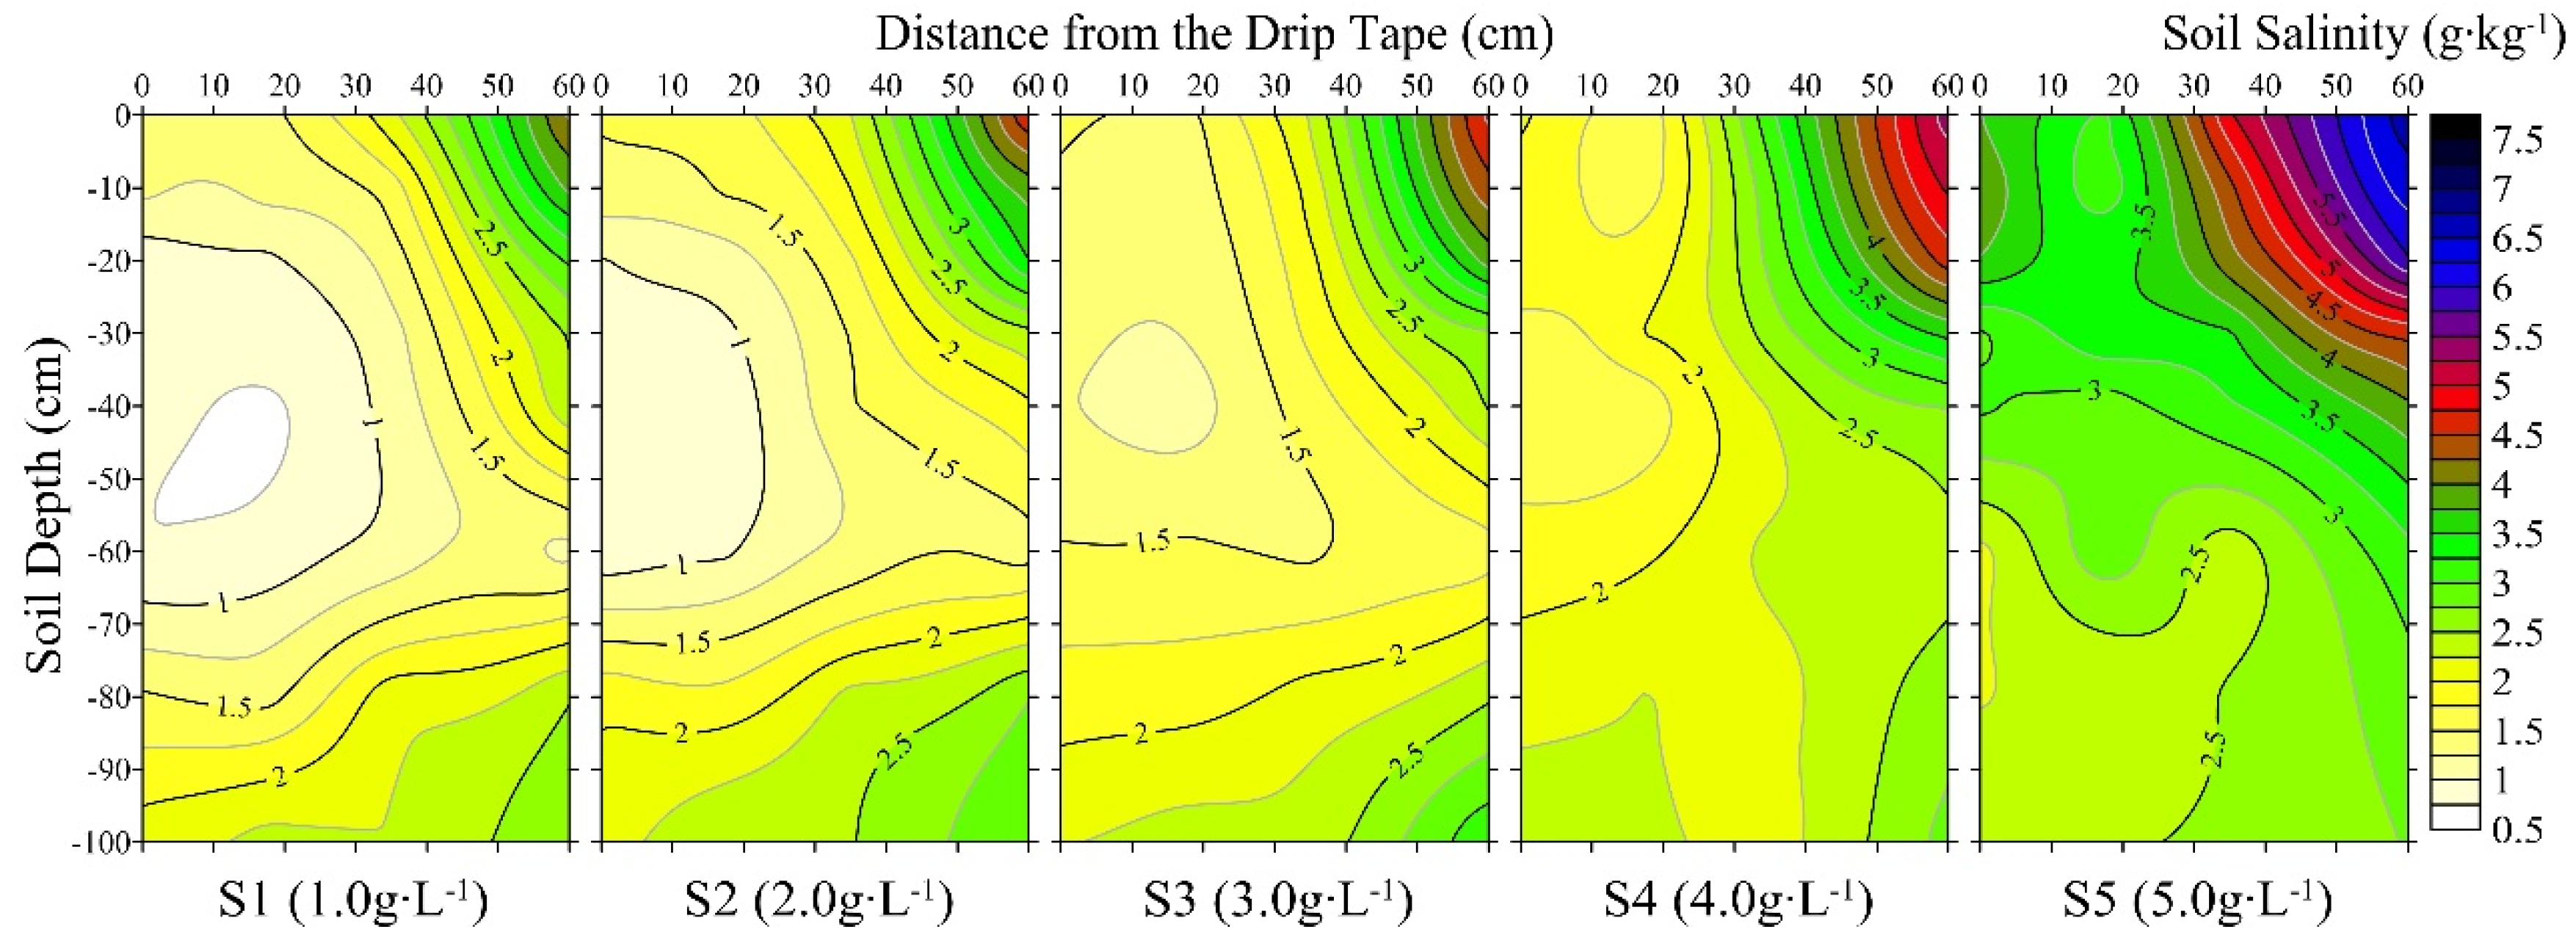
The salt distribution before and after irrigation in the soil profile perpendicular to the drip tape was basically identical for all treatments. Thus, the simultaneous irrigation (on 18 August, 2017) for all treatments at maize jointing stage was selected to indicate the soil salt distribution. Soil samples were taken before the irrigation (on 18 August, 2017) and after the irrigation (on 21 August, 2017) to measure the soil salt. The results of the soil salt isoline are shown in Figure 8.
As shown in Figure 8, soil salinity at the same position increased with the increase of irrigation water salt concentrations, and the salt isoline approximately formed as a one-quarter ellipse with emitters as the focus, while the vertical and horizontal radius decreased with the increase of the irrigation water salt concentrations. As the salt ions in the irrigation water generated both physical and chemical effects with the original soil salt ions, an aquitard emerged and the infiltration of irrigation water reduced. There was a low-salt zone in 0–30 cm from the drip tape horizontally and 0–40 cm underground vertically, which formed a suitable water–salt environment for maize growth. Meanwhile, at 40–60 cm away from the drip tape horizontally, there was a high-salt zone formed as a semicircle with the core between adjacent films as the center in the soil profile. Affected by the ground water recharge, there were no significant effects on the soil salinity of 60–100 cm underground. After the single irrigation, the soil salinity of the 0–40 cm layer reduced in the film, and the soil salt content of the 0–20 cm layer outside the mulch increased. Before and after irrigation, the variation of soil salinity was inconspicuous as irrigation water salinity below 3 g·L−1. However, the difference of soil salt content was significant, as irrigation water salinity was above 3 g·L−1. The results indicated that with the SMP of −20 kPa, there was a critical value (3 g·L−1) of irrigation water salt concentrations for maize mulched drip irrigation with saline water. When the irrigation water salinity was higher than the critical value, soil salt accumulated significantly.
3.6.2. Variation of the Soil Salt inside the Film
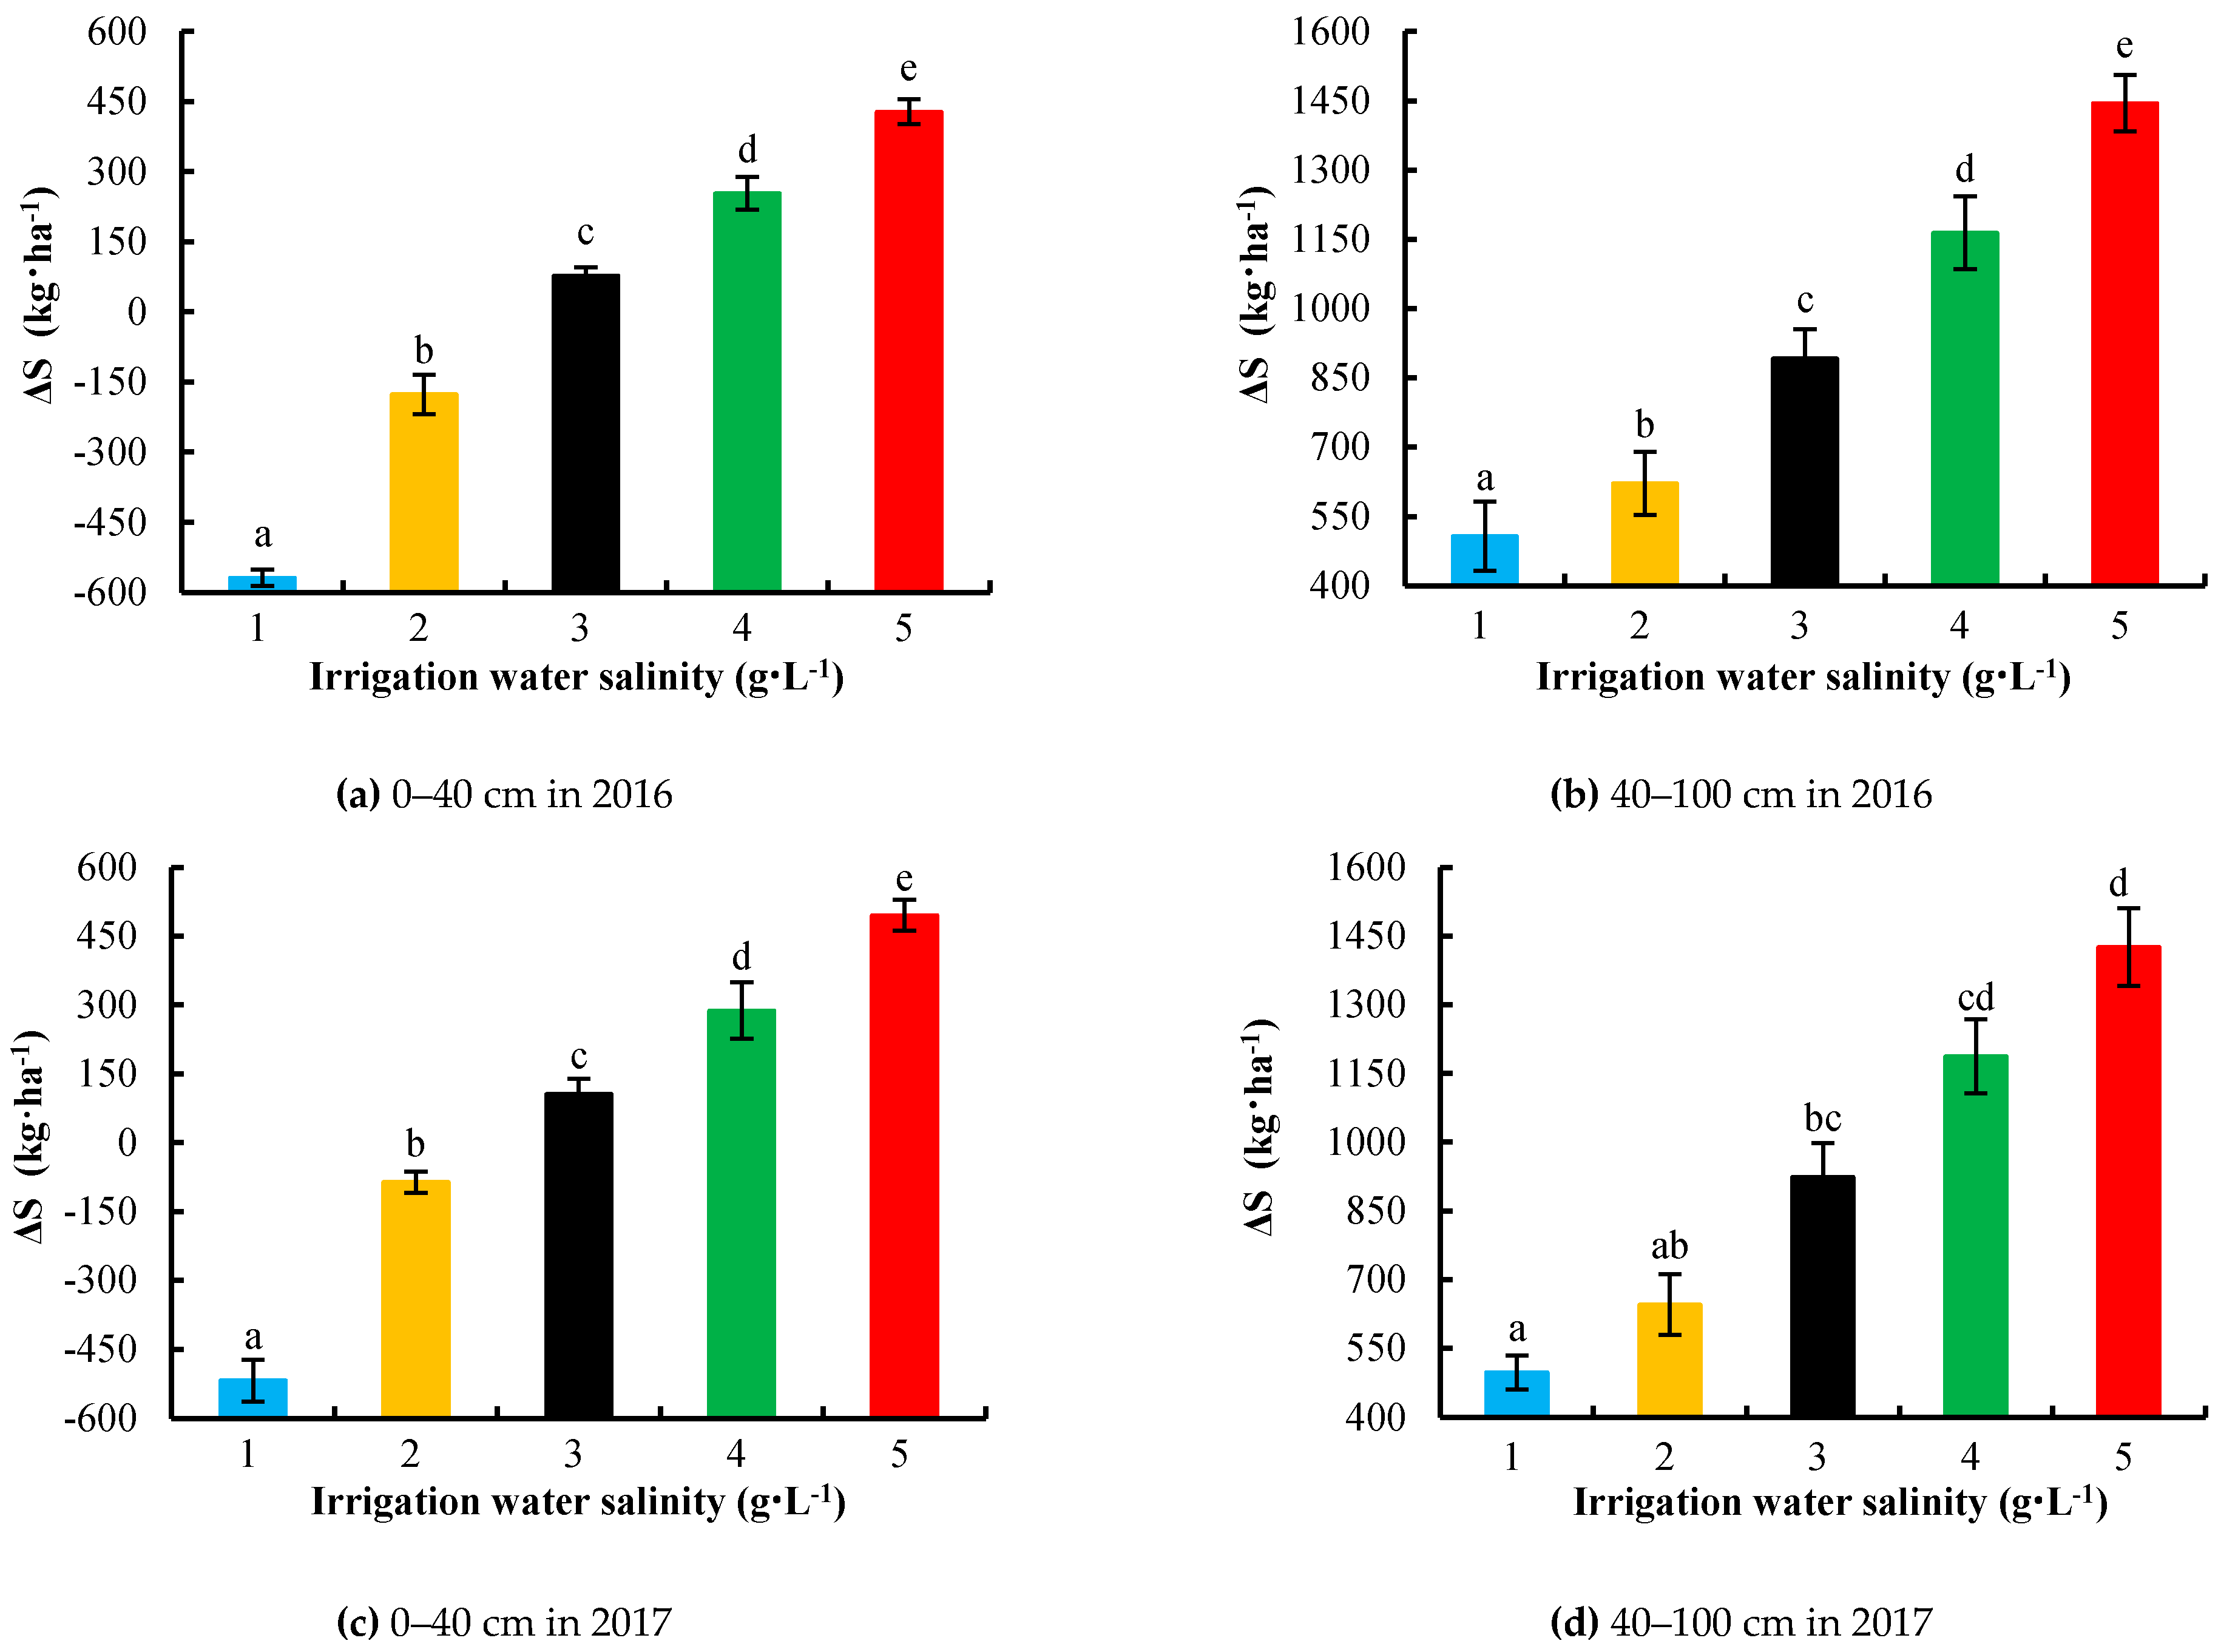
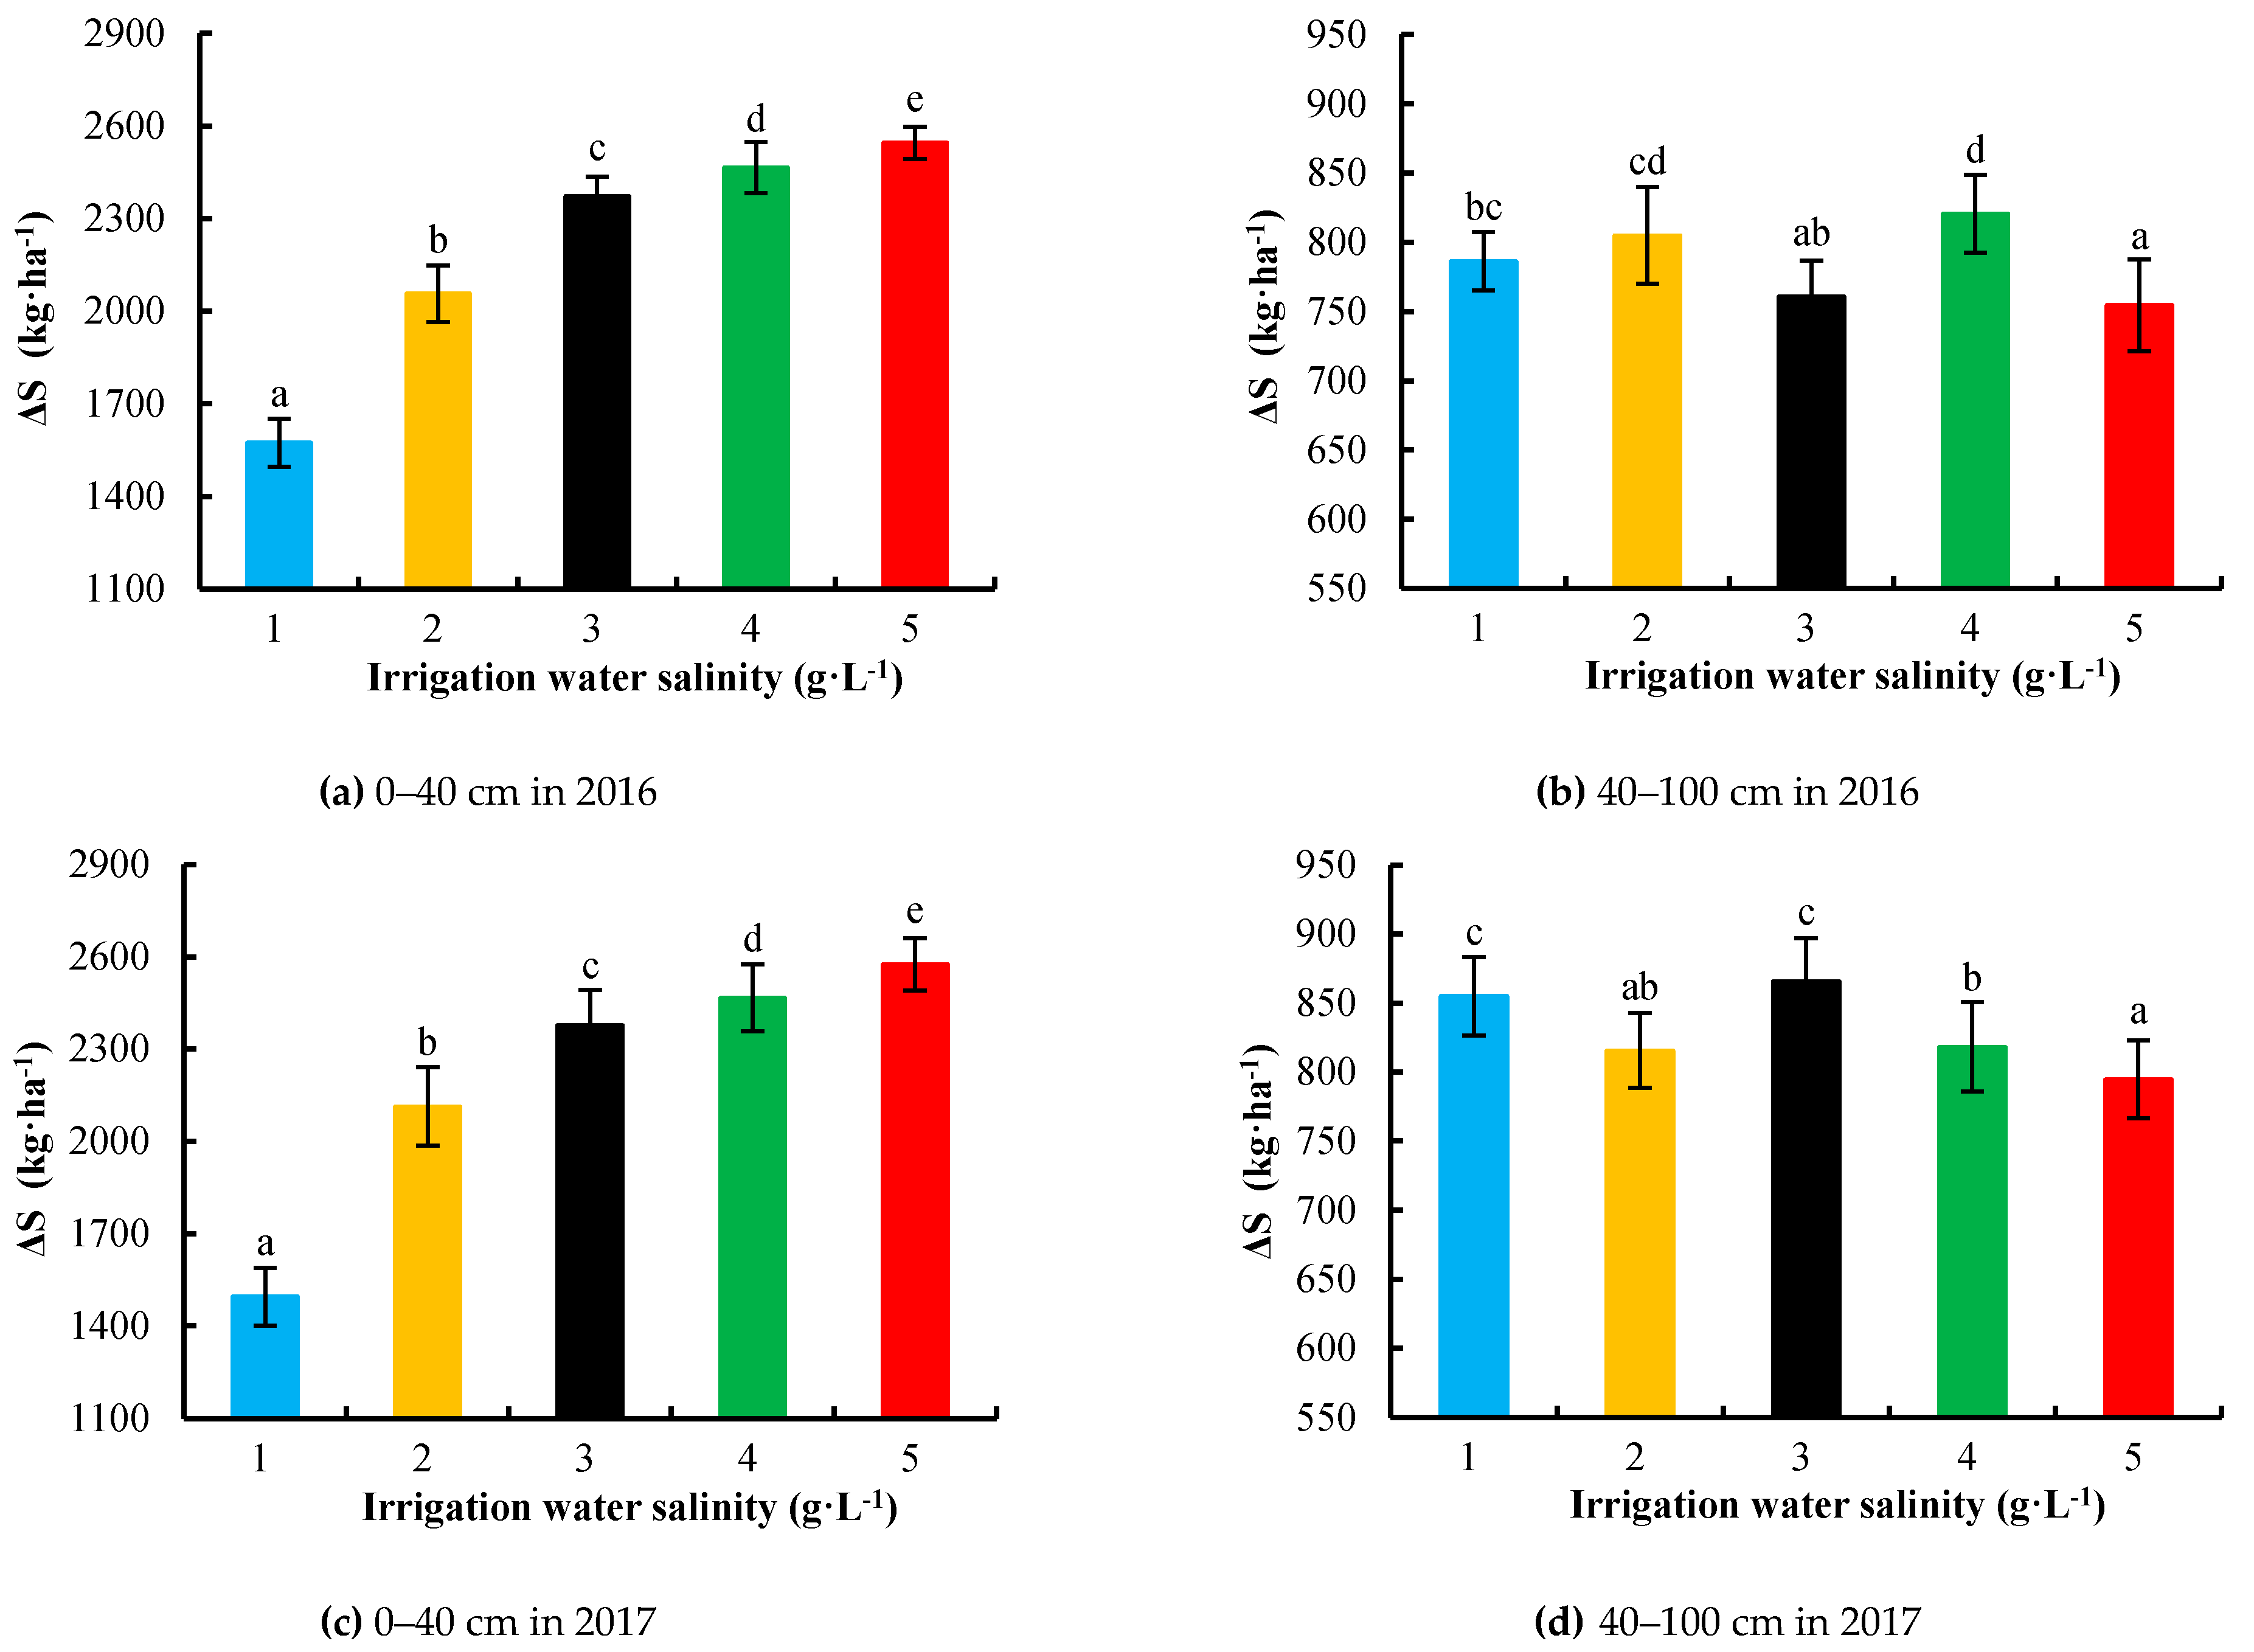
The soil salinity of the main root zone can affect maize growth and grain yield directly, while irrigation generally results in the dual effect on soil salt inside the plastic film. On one hand, the soil salinity reduced by the leaching of irrigation water. On the other hand, the soil salinity increased due to the salt residue accompany with irrigation water infiltration. Thus, the variation of soil salinity during maize growth period is shown in Figure 9.
The response of soil salinity inside the film to the variation of irrigation water salinity in 2016 was similar to that in 2017. When the irrigation water salinity was lower than 2 g·L−1, the soil salt desalinized in the main root zone and the desalinization radius reduced with the increasing water salt contents. When the irrigation water salt concentrations was higher than 2 g·L−1, the soil salt accumulated in the main root zone, while the increasing scope decreased with the increase of irrigation water salinity (Figure 9a,c). The soil salt accumulated in the secondary root zone for all treatments and the accumulated salt increased with the increasing irrigation water salt concentrations (Figure 9b,d).
The results indicated that when the irrigation water salinity was lower than 2 g·L−1, the leaching effect on soil salt of the main root zone inside the film was stronger than the corresponding accumulating influence. However, with the irrigation water salt concentrations was higher than 2 g·L−1, the leaching effect of irrigation water on soil salt was weaker than the corresponding accumulating effect.
3.6.3. Variation of Soil Salt Outside the Film
The soil salt content of 0–40 cm and 40–100 cm layer before sowing and after harvesting were estimated, and the variation of soil salinity during maize growth period is shown in Figure 10. The response for the variation of soil salinity between the adjacent films to the irrigation water salinity in 2016 was similar to that in 2017. Soil salt accumulated in the 0–40cm soil layer for all treatments, and the accumulated soil salt increased with the increasing water salt concentrations (Figure 10a,c). Moreover, soil salt accumulated in 40–100 cm layer for all treatments. However, there were no significant differences for the five treatments (Figure 10b,d).
Summarily, the results indicated that the soil salt of the deep soil layers between the adjacent films moved upward to the topsoil accompany with soil moisture when influenced by the capillary power. Affected by the infiltration of irrigation water, soil salt in the main root zone moved toward the wetting front and eventually accumulated in the surface zone, which is located outside the mulch. Moreover, with tensiometers installed at the depth of 0.2 m underneath the drip emitters to trigger maize mulched drip irrigation (SMP = −20 kPa), accumulated soil salt increased with the increase of irrigation water salinity. Thus, additional measures should be taken to reduce the soil salt accumulation, such as flood irrigation with Yellow River water during the nonfertility period of the crop.
4. Discussion
Considering maize evapotranspiration, seedings emergence rate, and growth indexes, an irrigation water salinity of 1–3 g∙L−1 was recommended in this paper. The results of maize evapotranspiration indicated that TDS of 3 g·L−1 tends to be the upper limit of irrigation water salinity for maize normal transpiration. This result was in accord with the research of Wang et al. [12]. Compared with the emergence rate for irrigation water salinity of 1–3 g·L−1, the emergence rate for irrigation water salt concentrations of 4–5 g·L−1 was significantly reduced. Moreover, S4 and S5 treatments showed a two-day delay of the emergence compared to S1, S2, and S3 treatments. The results may ascribe to the little salt tolerance of maize seedings during germination stage [43]. Mass et al. and Kang et al. have indicated that there was little effect of irrigation water salinity on seeding emergence [10,44], which was inconsistent with the results of the present research. However, in the studies conducted by Kang et al. and Mass et al., there were two to three effective precipitation events in 2007–2009 during the maize emergence period, which had positive effects on seeding emergence, while there were no effective rainfalls in the present study during maize germination stage. The increasing of maize growth indexes slowed down as the irrigation water salinity exceeded 3 g·L−1, which indicated that irrigation water salinity of 3 g·L−1 tends to be the critical concentration for maize growth, the result was consistent with the results of Li et al., who conducted a field experiment and indicated that crops have the capacity of absorbing some soluble soil salt ions with the applicable concentration of saline water. There was no adverse effects on crop growth and yield, and even some promotions on crop growth were found at a certain extend. However, irrigation with high salinity water tends to inhibit crop growth [45].
Taking maize seed production into consideration, irrigation water salinity of 2 g·L−1 was more proper than other water salt concentrations. When taking account of the IWUE and WUE, irrigation water salt concentration of 1 g·L−1 was more appropriate than other water salinity. The maize yield for the S2 treatment was the highest, while the grain yield for the S5 treatment was the lowest, which was mainly attributed to the significant difference of seeding emergence rate between the S2 treatment and S5 treatment. Compared with the maize yield for the S1 treatment, the maize yield for S3, S4, and S5 treatments only decreased by 1.43%–35.13%, which indicated that irrigation water salinity levels have negative effects on maize yield when irrigation water salt concentrations were above 2 g·L−1. The results were in accordance with the researches conducted by Kang et al. and Feng et al., who found the significant negative impacts of irrigation water salinity on maize yield [10,17]. Moreover, Kang et al. implied that the decline rate of grain yield for every 1 dS·m−1 increase in the irrigation water salinity was about 0.4–3.3% [10]. The maize biomass for irrigation water salinity of 2 g·L−1 and 3 g·L−1 increased by 3.9%–8.4% and 9.3%–.6% compared to the biomass for irrigation water salt content of 1 g·L−1, while the biomass for 4 g·L−1 and 5 g·L−1 were lower than that for 1 g·L−1. This result indicated that irrigation water salt concentrations lower than 4 g·L−1 may promote the vegetative growth of maize, which was in accordance with the results of maize evapotranspiration. The IWUE and WUE decreased by 0.282–0.304 kg·m−3 and 0.442–0.483 kg·m−3 for every 1 g·L−1 increase in salt concentrations of irrigation water, respectively. This result was consistent with the results of Wang et al., who foun that the WUE of spring maize decreased rapidly as irrigation water salinity ranges from 2 g·L−1 to 4 g·L−1 [12]. Additionally, both the IWUE and WUE fitting equations implied that the IWUE and WUE were close to zero as the irrigation water salinity reached 10 g·L−1, which indicated that applying irrigation water with salinity higher than 10 g·L−1 will result in a complete loss of the harvest. Thus, sustainable salt concentrations of irrigation water are the preconditions of high crop production.
In view of the grain quality, irrigation water salinity of 5 g·L−1 was better than other water salinity levels. Though there was no significant difference was found between treatments for the contents of oil, crude fiber, and ash in grains, a significant difference was found between S1 and S2 treatments and S4 and S5 treatments for grain moisture, protein content, and starch content. Moreover, the grain moisture and starch content decreased with the increase of irrigation water salinity, while the protein content raised with the increase of irrigation water salt concentrations. However, the result was inconsistent with the research of Cucci et al., who indicated that there was no significant difference for the content of kernel moisture, starch, protein, and oil [15]. As starch and protein are the main nutrients of maize kernels, the higher of the starch and protein content, the better quality of the maize grain. Meanwhile, according to Weinberg et al., low grain moisture content was better for maize storage, as the low grain moisture usually results in less susceptible to fungal pathogens, which leads to kernels far away from the risk of mycotoxin contamination [46].
Under mulched drip irrigation, soil salt of the main root zone was discharged into the secondary root zone and surface zone outside the films. Hence, a low-salinity zone was exactly formed for crop roots. This result was consistent with the studies of Guo et al., who indicated that under the mulched drip irrigation, salt was transported by water to the periphery of the root zone or deep soil layers, and a salt accumulated zone was formed result from the upward or horizontal movement of soil water [47]. Both the vertical radius and horizontal radius of salt isoline were reduced with the irrigation water salinity, which was consistent with the research of Zhang et al., who indicated that the soil salt desalination radius decreased with the increase of irrigation water salinity [48]. Under the drip irrigation triggered by the designed soil matric potential of −20 kPa, there was a critical value of irrigation water concentration (3 g·L−1) for mulched drip irrigation. When the salt concentration of irrigation water was higher than the critical value, the soil salinity was aggregated significantly in the 40–60 cm layer inside the mulch and 0–60 cm layer outside the films.
With the SMP controlled at −20 kPa, when the salt concentration of irrigation water was lower than 2 g·L−1, the leaching effect of irrigation water for main root zone was higher than the impact of salt introducing by irrigation water. However, applying irrigation with water salinity higher than 1 g·L−1 can hardly leach the soil salt of 0–100 cm soil layer in the films effectively. Precipitation during the maize growth period is not sufficient to leach soil salts in the HID, as the soil outside the mulch is usually severely salted after harvest. Thus, in order to avoid the further deterioration of the cultivated soil and reduce the damage caused by the salts supplied by irrigation, effective measures, such as extra fresh water irrigation in no-crop growth period, straw mulching on the top soil [49], and the application of chemical modifiers for optimizing soil structure [50], are required to maintain the interannual balance of soil salt.
The current experiment was only carried out over two consecutive years, and the present study only cared for the variation of soil salinity in the 0–40cm and 40–100cm layers during the maize growth period. In order to evaluate the long-term effect of irrigation water salinity on soil salt accumulation, long-term continuous measurements for the soil salt accumulation in different soil layers are required in future studies.
5. Conclusions
From the field experiment in the HID, it can be concluded that irrigation water with salinity of 3 g·L−1 tends to be the appropriate upper threshold of irrigation water salt concentrations for maize water consumption. Irrigation water salinity showed negative effects on maize emergence and morphological characteristics (plant height, LAI, stem diameter, and dry matter) when irrigation water salt contents were above 3 g·L−1. The maize yield for irrigation water with a salt concentration of 3 g·L−1 declined by no more than 1.5% compared with irrigation water with salinity of 1 g·L−1, while the biomass increased by 9.5%. Meanwhile, both the IWUE and WUE decreased linearly with the irrigation water salinity increasing from 1 g·L−1 to 5 g·L−1, and the decline rate of IWUE and WUE for every 1 g·L−1 increase was 0.442–0.483 kg·m−3 and 0.282–0.304 kg·m−3, respectively. Additionally, maize grain protein and starch content increased with the increase of irrigation water salinity significantly, while maize grain moisture decreased with the increasing salt concentrations of irrigation water. Moreover, the impacts of irrigation water salt concentrations on the contents of grain oil, crude fiber, and ash were not significant. With the SMP of −20 kPa and irrigation quota for each application of 22.5 mm, both the vertical radius and horizontal radius of salt isoline reduced with the irrigation water salt concentrations as the irrigation water salinity was above 3 g·L−1. Taking seeding emergence, maize yield, grain quality, maize biomass, IWUE, WUE, soil salt content, and freshwater saving into consideration, irrigation water with a salinity of 3 g·L−1 was recommended in this paper. Moreover, as the rainfall and irrigation water cannot leach the accumulated soil salt efficiently during maize growth period, effective desalting measures are required to avoid soil degradation.
Although the average annual salinity of shallow ground water in the experimental area is 1.007 g·L−1, groundwater with a salinity of 1–5 g·L−1 accounts for more than 80% of the shallow groundwater allowable for withdrawal in the HID. The results of the present paper will contribute to the sustainable use of shallow groundwater for maize irrigation in the HID. Additionally, the appropriate utilization of groun water will contribute to promote groundwater renewal and lessen soil salt accumulation, which are helpful to fight against the processes of land salinization.
Author Contributions
Conceptualization, J.L. and J.C.; methodology, J.C.; software, J.L.; validation, J.L., J.C. and J.J.; formal analysis, J.L.; investigation, J.J.; resources, J.L.; data curation, J.C. and S.W.; writing—original draft preparation, J.L.; writing—review and editing, J.C.; visualization, B.D.; supervision, B.D.; project administration, S.W.; funding acquisition, J.C.
Funding
This research was funded by “Major Project in Key Research and Development Program of the Ningxia Hui Autonomous Region”, grant number “2018BBF02022”; “Key Research and Development Program of the Ningxia Hui Autonomous Region”, grant number “2018BBF02018”.
Acknowledgments
We are especially grateful to Zhongyi Qu for his kind help on the experiments.
Conflicts of Interest
The authors declare no conflict of interest.
References
- Ren, D.Y.; Xu, X.; Hao, Y.Y.; Huang, G.H. Modeling and assessing field irrigation water use in a canal system of Hetao, upper Yellow River basin: Application to maize, sunflower and watermelon. J. Hydrol. 2016, 532, 122–139. [Google Scholar] [CrossRef]
- Sun, G.F.; Qu, Z.Y.; Du, B.; Ren, Z.S.; Liu, A.Q. Water-heat-salt effects of mulched drip irrigation maize with different irrigation scheduling in Hetao Irrigation District. Trans. Chin. Soc. Agric. Eng. 2017, 33, 144–152. (In Chinese) [Google Scholar] [CrossRef]
- Peng, Z.Y.; Wu, J.W.; Huang, J.S. Water and salt movement under partial irrigation in Hetao Irrigation District, Inner Mongolia. J. Hydraul. Eng. 2016, 47, 110–118. (In Chinese) [Google Scholar] [CrossRef]
- Zhangzhong, L.L.; Yang, P.L.; Zheng, W.G.; Wang, C.Y.; Zhang, C.; Niu, M.L. Effects of Drip Irrigation Models on Chemical Clogging under Saline Water Use in Hetao District, China. Water 2018, 10, 345. [Google Scholar] [CrossRef]
- Li, J.G.; Qu, Z.Y.; Huang, Y.P.; Ren, Z.S.; Wang, F. Effects of Control Lower Limit of Saline Water Mulched Drip Irrigation on Water Salt Movement and Yield in Saline Soil. J. Soil Water Conserv. 2017, 31, 217–223. (In Chinese) [Google Scholar] [CrossRef]
- Chu, L.L.; Kang, Y.H.; Wan, S.Q. Effect of different water application intensity and irrigation amount treatments of microirrigation on soil-leaching coastal saline soils of North China. J. Integr. Agric. 2016, 15, 2123–2131. [Google Scholar] [CrossRef] [Green Version]
- Liu, X.W.; Feike, T.; Chen, S.Y.; Shao, L.W.; Sun, H.Y.; Zhang, X.Y. Effects of saline irrigation on soil salt accumulation and grain yield in the winter wheat-summer maize double cropping system in the low plain of North China. J. Integr. Agric. 2016, 15, 2886–2898. [Google Scholar] [CrossRef]
- Kiremit, M.S.; Arslan, H. Effects of irrigation water salinity on drainage water salinity, evapotranspiration and other leek (Allium porrum L.) plant parameters. Sci. Hortic. 2016, 201, 211–217. [Google Scholar] [CrossRef]
- Song, Y.X.; An, J.Q.; He, A.R.; Chen, L.J. Effect of Mulched Drip Irrigation with Saline Water on Cotton Growth and Yield. Res. Soil Water Conserv. 2016, 23, 128–132. (In Chinese) [Google Scholar] [CrossRef]
- Kang, Y.H.; Chen, M.; Wan, S.Q. Effects of drip irrigation with saline water on waxy maize (Zea mays L. var. ceratina Kulesh) in North China Plain. Agric. Water Manag. 2010, 97, 1303–1309. [Google Scholar] [CrossRef]
- Wang, X.P.; Yang, J.S.; Liu, G.M.; Yao, R.J.; Yu, S.P. Impact of irrigation volume and water salinity on winter wheat productivity and soil salinity distribution. Agric. Water Manag. 2015, 149, 44–54. [Google Scholar] [CrossRef]
- Wang, Q.M.; Huo, Z.L.; Zhang, L.D.; Wang, J.H.; Zhao, Y. Impact of saline water irrigation on water use efficiency and soil salt accumulation for spring maize in arid regions of China. Agric. Water Manag. 2016, 163, 125–138. [Google Scholar] [CrossRef]
- Xue, J.; Ren, L. Conjunctive use of saline and non-saline water in an irrigation district of Yellow River Basin. Irrig. Drainge 2017, 66, 147–162. [Google Scholar] [CrossRef]
- Zheng, F.J.; Yang, P.L.; Ren, S.M.; He, X.; Jiang, G.Y. Research on the effects of brackish water irrigation on edible sunflower growth and the critical salinity concentration. J. Irrig. Drain. 2015, 34, 19–23. (In Chinese) [Google Scholar] [CrossRef]
- Cucci, G.; Lacolla, G.; Boari, F.; Mastro, M.A.; Cantore, V. Effect of water salinity and irrigation regime on maize (Zea mays L.) cultivated on clay loam soil and irrigated by furrow in Southern Italy. Agric. Water Manag. 2019, 222, 118–124. [Google Scholar] [CrossRef]
- Li, X.B. Salt leaching and Iris germanica L. growth in two coastal saline soils under drip irrigation with saline water. Sci. Hortic. 2018, 237, 164–168. [Google Scholar] [CrossRef]
- Feng, G.X.; Zhang, Z.Y.; Wan, C.Y.; Lu, P.R.; Bakour, A. Effects of saline water irrigation on soil salinity and yield of summer maize (Zea mays L.) in subsurface drainage system. Agric. Water Manag. 2017, 193, 205–213. [Google Scholar] [CrossRef]
- Yuan, C.F.; Feng, S.Y.; Huo, Z.L.; Ji, Q.Y. Effects of deficit irrigation with saline water on soil water-salt distribution and water use efficiency of maize for seed production in arid Northwest China. Agric. Water Manag. 2019, 212, 424–432. [Google Scholar] [CrossRef]
- Kang, Y.H.; Wan, S.Q. Effect of soil water potential on radish (Raphanus sativus L.) growth and water use under drip irrigation. Sci. Hortic. 2005, 106, 275–292. [Google Scholar] [CrossRef]
- Sun, J.X.; Kang, Y.H.; Wan, S.Q.; Hu, W.; Jiang, S.F.; Zhang, T.B. Soil salinity management with drip irrigation and its effects on soil hydraulic properties in north China coastal saline soils. Agric. Water Manag. 2012, 115, 10–19. [Google Scholar] [CrossRef]
- Wang, R.S.; Wan, S.Q.; Sun, J.X.; Xiao, H.J. Soil salinity, sodicity and cotton yield parameters under different drip irrigation regimes during saline wasteland reclamation. Agric. Water Manag. 2018, 209, 20–31. [Google Scholar] [CrossRef]
- Kang, Y.H.; Wang, R.S.; Wan, S.Q.; Hu, W.; Jiang, S.F.; Liu, S.P. Effects of different water levels on cotton growth and water use through drip irrigation in an arid region with saline ground water of northwest China. Agric. Water Manag. 2012, 109, 117–126. [Google Scholar] [CrossRef]
- Li, J.G.; Qu, Z.Y.; Chen, J.; Wang, F.; Jin, Q. Effect of Different Thresholds of Drip Irrigation Using Saline Water on Soil Salt Transportation and Maize Yield. Water 2018, 10, 1855. [Google Scholar] [CrossRef]
- Flagella, Z.; Cantore, V.; Giuliani, M.M.; Tarantino, E.; De Caro, A. Crop salt tolerance: Physiological, yield and quality aspects. In Recent Resources for Development of Plant Biology 2; Pandalai, S.G., Ed.; 2002; pp. 155–186. ISBN 81-7736-149-X. [Google Scholar]
- Katerji, N.; van Hoorn, J.W.; Hamdy, A.; Karam, F.; Mastrorilli, M. Effect of salinity on water stress, growth, and yield of maize and sunflower. Agric. Water Manag. 1996, 30, 237–249. [Google Scholar] [CrossRef]
- Wan, S.Q.; Jiao, Y.P.; Kang, Y.H.; Wei, H.; Jiang, S.F.; Tan, J.L.; Liu, W. Drip irrigation of waxy corn (Zea mays L. var. ceratina Kulesh) for production in highly saline conditions. Agric. Water Manag. 2012, 104, 210–220. [Google Scholar] [CrossRef]
- Amer, K.H. Corn crop response under managing different irrigation and salinity levels. Agric. Water Manag. 2010, 97, 1553–1563. [Google Scholar] [CrossRef]
- Ding, Y.H.; Gao, X.Y.; Qu, Z.Y.; Jia, Y.L.; Hu, M.; Li, C.J. Effects of biochar application and irrigation methods on soil temperature in farmland. Water 2019, 11, 449. [Google Scholar] [CrossRef]
- AOAC. Official Methods of Analysis, 18th ed.; Association of Analytical Chemists: Washington, DC, USA, 2005. [Google Scholar]
- Sparks, D.L.; Page, A.L.; Helmke, P.A.; Loeppert, R.H. Front Matter. Methods of Soil Analysis Part 3—Chemical Properties Methods; Soil Science Society of America Inc.: Madison, WI, USA, 1996; pp. 869–919. [Google Scholar] [CrossRef]
- Walkley, A.; Black, I. Armstrong. An examination of the Degtjareff method for determination of soil organic matter and a proposed modification of the chromic acid titration method. Soil Sci. 1934, 37, 29–38. [Google Scholar] [CrossRef]
- Wei, L.G.; Li, J.G.; Shu, Q.P.; Liu, G.R.; Fan, F.; Chen, X.; Zhou, R.J. The method of leaching and vibrating—Atom absorbing spectrum to determine the exchangeable calcium and magnesium in soil. Anal. Test. Technol. Instrum. 2006, 12, 249–252. [Google Scholar]
- Allen, R.G.; Pereira, L.S.; Raes, D.; Smith, M. Crop Evaporation: Guidelines for Computing Crop Water Requirements; Irrigation and Drainage Paper No. 56; FAO: Rome, Italy, 1998; p. 300. [Google Scholar]
- Malash, N.; Flowers, T.J.; Ragab, R. Effect of irrigation systems and water management practices using saline and non-saline water on tomato production. Agric. Water Manag. 2005, 78, 25–38. [Google Scholar] [CrossRef]
- Hillel, D. Applications of Soil Physics; Academic Press, Inc.: New York, NY, USA, 1980; p. 385. [Google Scholar]
- Ma, Y.; Feng, S.Y.; Huo, Z.L.; Song, X.F. Application of the SWAP model to simulate the field water cycle under deficit irrigation in Beijing, China. Math. Comput. Model. 2011, 54, 1044–1052. [Google Scholar] [CrossRef]
- Liu, H.J.; Wang, X.M.; Zhang, X.; Zhang, L.W.; Li, Y.; Huang, G.H. Evaluation on the responses of maize (Zea mays L.) growth: Yield and water use efficiency to drip irrigation water under mulch condition in the Hetao irrigation District of China. Agric. Water Manag. 2017, 179, 144–157. [Google Scholar] [CrossRef]
- Dong, Q.G.; Yang, Y.C.; Zhang, T.B.; Zhou, L.F.; He, J.Q.; Chau, H.W.; Zou, Y.F.; Hao, F. Impacts of ridge with plastic mulch-furrow irrigation on soil salinity, spring maize yield and water use efficiency in an arid saline area. Agric. Water Manag. 2018, 201, 268–277. [Google Scholar] [CrossRef]
- Jackson, M.L. Soil Chemical Analysis; Prentice Hall of India Pvt. Ltd.: New Delhi, India, 1973. [Google Scholar]
- Xiao, S.M. Determination Technology of Soil, 1st ed.; Chemical Industry Press: Beijing, China, 2012; pp. 92–115. [Google Scholar]
- Dehghanisanij, H.; Nakhjavani, M.M.; Tahiri, A.Z.; Anyoji, H. Assessment of wheat and maize water productivities and production function for cropping system decisions in arid and semiarid regions. Irrig. Drain. 2009, 58, 105–115. [Google Scholar] [CrossRef]
- Qureshi, A.S.; Oweis, T.; Karimi, P.; Porehemmat, J. Water productivity of irrigated wheat and maize in the Karkheh river basin of Iran. Irrig. Drain. 2010, 59, 64–276. [Google Scholar] [CrossRef]
- Zheng, J.H.; Feng, Y.J.; Yu, K.Q.; Han, B. Effect of salt water on the germination and emergence of maize and cotton. J. Shandong Agric. Univ. (Nat. Sci.) 2002, 33, 158–161. [Google Scholar]
- Mass, E.V.; Hoffman, G.J.; Chaba, G.D.; Poss, J.A.; Shannon, M.C. Salt sensitivity of corn at various growth stages. Irrig. Sci. 1983, 4, 45–57. [Google Scholar] [CrossRef]
- Li, K.J.; Ma, J.Y.; Cao, C.Y.; Zheng, C.L.; Zhang, C.G.; Niu, Y.J. Effect of irrigation water salt content on cotton growth and yield. Chin. J. Eco-Agric. 2011, 19, 312–317. (In Chinese) [Google Scholar] [CrossRef]
- Weinberg, Z.G.; Yan, Y.; Chen, Y.; Finkelman, S.; Ashbell, G.; Navarro, S. The effect of moisture level on high-moisture maize (Zea mays L.) under hermetic storage conditions-in vitro studies. J. Stored Prod. Res. 2008, 44, 136–144. [Google Scholar] [CrossRef]
- Guo, R.S.; Lin, T.; Xu, H.J.; Cui, J.P.; Ma, J.; Liu, Z.Q.; Tian, L.W. Effect of saline water drip irrigation on water and salt transport features and cotton yield of oasis cotton field. J. Soil Water Conserv. 2017, 31, 211–216. (In Chinese) [Google Scholar] [CrossRef]
- Zhang, K.M.; Niu, W.Q.; Wang, Y.K.; Xue, W.L.; Zhang, Z.Z. Characteristics of Water and Salt Movement in Soil under Moisture-irrigation with Brackish Water. Trans. Chin. Soc. Agric. Mach. 2017, 48, 175–182. (In Chinese) [Google Scholar] [CrossRef]
- Liu, T.; Wang, B.T.; Xiao, H.J.; Wang, R.S.; Yang, B.M.; Cao, Q.Q.; Cao, Y.B. Differentially improved soil microenvironment and seedling growth of Amorpha fruticosa by plastic, sand and straw mulching in a saline wasteland in northwest China. Ecol. Eng. 2018, 122, 126–134. [Google Scholar] [CrossRef]
- Liu, Y.; Feng, Y.Z.; Huang, J.; Wang, X.Y.; Qi, T.; Meng, A.J. Effects of modifiers on saline soil salt distribution under brackish water irrigation conditions. Agric. Res. Arid Areas 2015, 33, 146–152. (In Chinese) [Google Scholar] [CrossRef]
Figure 1.
The reference crop evapotranspiration and precipitation during the growing period of maize in 2016 and 2017.
Figure 1.
The reference crop evapotranspiration and precipitation during the growing period of maize in 2016 and 2017.

Figure 2.
Groundwater depth in maize growth period.

Figure 3.
The schematic diagram of cultivation model, sampling and treatment layout.

Figure 4.
Evapotranspiration for different levels of irrigation water salinity.

Figure 5.
Main maize vegetative growth characteristics for the different salinity irrigation water treatments in 2016 and 2017. Note: The same letter above the error bars in same year represents no significantly different at p ≤ 0.05.
Figure 5.
Main maize vegetative growth characteristics for the different salinity irrigation water treatments in 2016 and 2017. Note: The same letter above the error bars in same year represents no significantly different at p ≤ 0.05.


Figure 6.
The irrigation water use efficiency (IWUE) and water use efficiency (WUE) for different levels of irrigation water salinity.
Figure 6.
The irrigation water use efficiency (IWUE) and water use efficiency (WUE) for different levels of irrigation water salinity.

Figure 7.
The grain quality of maize in 2016 and 2017. Note: The same letter above the error bars in same year represents no significantly different at p ≤ 0.05.
Figure 7.
The grain quality of maize in 2016 and 2017. Note: The same letter above the error bars in same year represents no significantly different at p ≤ 0.05.


Figure 8.
Soil salt distribution for different irrigation water salinity.


Figure 9.
Variation of soil salinity during the growth period of maize for different treatments inside the film. Note: The same letter above the error bars represents no significantly different at p ≤ 0.05.
Figure 9.
Variation of soil salinity during the growth period of maize for different treatments inside the film. Note: The same letter above the error bars represents no significantly different at p ≤ 0.05.

Figure 10.
Variation of soil salinity during the growing period of maize for different treatments outside the film. Note: The same letter above the error bars represents no significantly different at p ≤ 0.05.
Figure 10.
Variation of soil salinity during the growing period of maize for different treatments outside the film. Note: The same letter above the error bars represents no significantly different at p ≤ 0.05.


Table 1.
Meteorological statistical values in 2016 and 2017.
| Year | Average Annual Temperature (°C) | Accumulative Precipitation (mm) | Average Wind Speed (m·s−1) | Yearly Maximum Wind Speed (m·s−1) |
|---|---|---|---|---|
| 2016 | 6.94 | 146 | 3.1 | 25.0 |
| 2017 | 6.89 | 138 | 3.2 | 33.0 |
Table 2.
Soil physical characteristics in the experimental area.
| Soil Depth (cm) | Texture Class | Bulk Density (g·cm−3) | Field Capacity (%) | Porosity (%) | Silt (%) | Sand (%) | Clay (%) |
|---|---|---|---|---|---|---|---|
| 0–20 | Sandy loam | 1.39 | 23.7 | 48.03 | 24.31 | 62.09 | 13.6 |
| 20–40 | Sandy loam | 1.42 | 23.3 | 44.32 | 25.64 | 60.25 | 14.11 |
| 40–60 | Sandy loam | 1.37 | 25.4 | 46.54 | 18.65 | 61.18 | 20.17 |
| 60–80 | Sand | 1.54 | 14.9 | 36.45 | 87.78 | 11.16 | 1.06 |
| 80–100 | Middle loam | 1.43 | 19.2 | 42.84 | 32.57 | 51.28 | 16.15 |
Table 3.
Soil chemical characteristics in the experimental area.
| Soil Depth (cm) | Organic Matter (g·kg−1) | Soil Salinity (g·kg−1) | Total Nutrient Contents (g·kg−1) | Available Nutrient Contents (mg·kg−1) | |||||
|---|---|---|---|---|---|---|---|---|---|
| Total N | Total P | Total K | Ammonium N | Nitrate N | Available P | Available K | |||
| 0–20 | 16.505 | 1.317 | 1.169 | 0.913 | 17.115 | 74.615 | 113.250 | 12.625 | 291.250 |
| 20–40 | 13.894 | 0.868 | 0.963 | 0.818 | 18.490 | 51.925 | 16.885 | 9.800 | 318.500 |
| 40–60 | 10.354 | 0.744 | 0.861 | 0.668 | 19.590 | 76.930 | 12.960 | 4.025 | 186.000 |
| 60–80 | 7.744 | 1.263 | 0.477 | 0.595 | 16.150 | 40.120 | 7.850 | 3.350 | 123.500 |
| 80–100 | 1.594 | 1.845 | 0.368 | 0.577 | 13.740 | 30.860 | 3.120 | 5.800 | 100.500 |
Table 4.
The features average value of Yellow River and shallow groundwater.
| Parameter | Shallow Groundwater | Yellow River Water | ||
|---|---|---|---|---|
| Average Value | Range | Average Value | Range | |
| Ca2+ (mg·L−1) | 70.10 | 45.60–93.20 | 50.00 | 32.20–64.10 |
| Mg2+ (mg·L−1) | 72.90 | 51.30–78.50 | 26.00 | 11.00–55.10 |
| K++Na+ (mg·L−1) | 150.00 | 88.70–201.30 | 108.10 | 72.50–184.20 |
| HCO3− (mg·L−1) | 396.60 | 311.30–452.90 | 330.40 | 246.70–382.30 |
| CO32− (mg·L-1) | 0.00 | 0.00–0.00 | 0.00 | 0.00–0.00 |
| Cl− (mg·L−1) | 159.50 | 100.40–254.20 | 138.45 | 86.40–185.40 |
| SO42− (mg·L−1) | 216.10 | 173.50–284.60 | 79.20 | 48.20–124.10 |
| TDS (g·L−1) | 1.01 | 0.96–1.81 | 0.50 | 0.48–0.54 |
| pH | 7.46 | 7.32–7.85 | 7.38 | 7.23–7.51 |
Table 5.
Compounds dosage for different water salinity levels.
| Treatment | Compounds Dosage (g·m−3) | ||||
|---|---|---|---|---|---|
| CaCl2 | MgSO4 | K2SO4 | NaHCO3 | MgCl2 | |
| S1 | 0.00 | 0.00 | 0.00 | 0.00 | 0.00 |
| S2 | 170.71 | 236.43 | 0.91 | 479.28 | 41.18 |
| S3 | 353.33 | 489.36 | 1.87 | 991.99 | 85.24 |
| S4 | 536.07 | 742.59 | 2.84 | 1505.44 | 129.35 |
| S5 | 724.50 | 1002.60 | 3.86 | 2018.70 | 174.50 |
Table 6.
Irrigation quota and evapotranspiration.
| Treatment | Year 2016 | Year 2017 | ||
|---|---|---|---|---|
| Irrigation Quota (mm) | Evapotranspiration (mm) | Irrigation Quota (mm) | Evapotranspiration (mm) | |
| S1 | 270.0 | 420.3 | 247.5 | 398.0 |
| S2 | 315.0 | 476.8 | 292.5 | 457.6 |
| S3 | 382.5 | 547.2 | 360.0 | 522.7 |
| S4 | 337.5 | 522.8 | 315.0 | 498.9 |
| S5 | 292.5 | 443.8 | 270.0 | 425.3 |
Table 7.
Seeding emergence for different treatments.
| Year | Treatment | Emergence Rate of Maize | ||||
|---|---|---|---|---|---|---|
| 6 Days after Sowing | 8 Days after Sowing | 10 Days after Sowing | 12 Days after Sowing | 14 Days after Sowing | ||
| 2016 | S1 | 28%d | 58%b | 82%b | 97%b | 99%d |
| S2 | 17%c | 49%b | 79%b | 97%b | 98%d | |
| S3 | 11%b | 34%a | 68%a | 93%b | 94%c | |
| S4 | 0%a | 28%a | 61%a | 81%a | 84%b | |
| S5 | 0%a | 27%a | 61%a | 78%a | 77%a | |
| 2017 | S1 | 30%d | 62%b | 85%d | 98%c | 99%d |
| S2 | 19%c | 51%b | 81%cd | 95%bc | 97%cd | |
| S3 | 12%b | 35%a | 73%bc | 93%b | 95%c | |
| S4 | 0a | 27%a | 64%ab | 80%a | 81%b | |
| S5 | 0a | 25%a | 62%a | 78%a | 76%a | |
Note: Values in a column followed by the same letter in the same year are not significantly different at p ≤ 0.05.
Table 8.
Irrigation water salinity effects on grain yield and maize biomass.
| Year | Production | S1 | S2 | S3 | S4 | S5 |
|---|---|---|---|---|---|---|
| 2016 | Grain yield (kg·ha−1) | 11259.81 ± 265c | 11816.01 ± 213c | 11078.57 ± 265c | 8876.03 ± 184b | 7378.92 ± 127a |
| Biomass (kg·ha−1) | 14571.43 ± 164c | 15790.59 ± 118d | 15964.82 ± 127d | 11864.68 ± 115b | 10567.56 ± 107a | |
| 2017 | Grain yield (kg·ha−1) | 11135.21 ± 223c | 11675.75 ± 247c | 10975.93 ± 244c | 8530.56 ± 195b | 7223.98 ± 122a |
| Biomass (kg·ha−1) | 14681.82 ± 187c | 15247.36 ± 126c | 16052.72 ± 134d | 11651.95 ± 116b | 10513.54 ± 97a |
Note: Values in a row followed by the same letter are not significantly different at p ≤ 0.05.
© 2019 by the authors. Licensee MDPI, Basel, Switzerland. This article is an open access article distributed under the terms and conditions of the Creative Commons Attribution (CC BY) license (http://creativecommons.org/licenses/by/4.0/).
Share and Cite
MDPI and ACS Style
Li, J.; Chen, J.; Jin, J.; Wang, S.; Du, B. Effects of Irrigation Water Salinity on Maize (Zea may L.) Emergence, Growth, Yield, Quality, and Soil Salt. Water 2019, 11, 2095. https://doi.org/10.3390/w11102095
AMA Style
Li J, Chen J, Jin J, Wang S, Du B. Effects of Irrigation Water Salinity on Maize (Zea may L.) Emergence, Growth, Yield, Quality, and Soil Salt. Water. 2019; 11(10):2095. https://doi.org/10.3390/w11102095
Chicago/Turabian StyleLi, Jingang, Jing Chen, Jianxin Jin, Shaoli Wang, and Bin Du. 2019. "Effects of Irrigation Water Salinity on Maize (Zea may L.) Emergence, Growth, Yield, Quality, and Soil Salt" Water 11, no. 10: 2095. https://doi.org/10.3390/w11102095
Note that from the first issue of 2016, this journal uses article numbers instead of page numbers. See further details here.