Evolution of Turbulent Horseshoe Vortex System in Front of a Vertical Circular Cylinder in Open Channel


School of Civil Engineering, Beijing Jiaotong University, Beijing 100044, China
*
Author to whom correspondence should be addressed.
Water 2019, 11(10), 2079; https://doi.org/10.3390/w11102079
Submission received: 9 August 2019
/
Revised: 27 September 2019
/
Accepted: 1 October 2019
/
Published: 5 October 2019
(This article belongs to the Special Issue Bridge Hydraulics: Current State of the Knowledge and Perspectives)
Abstract
:A turbulent horseshoe vortex (HV) system around a wall-mounted cylinder in open channel is characterized by random variations in vortex features and an abundance of vortex interactions. The turbulent HV system is responsible for initiating the local scour process in front of the cylinder. The evolution of the turbulent HV system is investigated statistically and quantitatively with time-resolved particle image velocimetry. The cylinder Reynolds numbers of the flow are 8600, 10,200, and 13,600, respectively. A novel vortex tracking method was proposed to obtain the variations in position, size, and strength of the primary HV (PHV) which dominates the system most of the time. Relationships between the various features of the PHV during its evolutionary process were obtained through correlation analyses. Results show that the dimensionless mean lifespan of the PHV is about 5.0. Statistically, the downstream movement of the PHV toward the cylinder is accompanied with its bed-approaching movement and decreasing in size, and the opposite is true. The circulation strength of the PHV decreases and increases dramatically in the region downstream of its time-averaged position when the PHV approaches and departs from the cylinder, respectively. Meanwhile, mechanisms responsible for the generation, movement, variation, and disappearance of the PHV are re-investigated and enriched based on its interactions with vortices in the separation region and structures in the incoming flow. The obtained change trends of the features of the PHV and the underlying mechanisms for its evolution are valuable for predicting and controlling the initial stage of the local scour in front of cylinders.
1. Introduction
Flows around a wall-mounted circular cylinder appear in a large number of technical and environmental applications, such as river flows past bridge piers and pile foundations [1,2,3]. When the natural wall-bounded flow encounters a vertical cylinder, horseshoe vortices (HVs) are formed in the junction region between the bed and the cylinder [4,5,6]. The HVs are a system of necklace structures wrapping around the front and flanks of the cylinder. Depending on the regime of the approaching flow at the location of the cylinder, the horseshoe vortex (HV) system appears as a laminar or turbulent system, respectively [7]. The turbulent HV system oscillates randomly in front of the cylinder, inducing highly elevated means and fluctuations in bed shear stress [8]. Therefore, a full understanding of the evolution of the turbulent HV system is necessary for understanding, predicting, and controlling the initial stage of the local scour in front of cylinders.
Due to the highly dynamical nature of the turbulent HV system, many investigations have focused on interpreting its underlying dynamics with models of low complexity [9,10,11,12,13].
The evolution of the instantaneous turbulent HV system, however, has received less attention, partly due to its complexity manifesting as aperiodic interactions and variations in number, position, size, and strength. Dargahi [14] made one of the earliest descriptions on the evolutionary process of the turbulent HV system based on experimental observations conducted with flow visualization method. Results showed the HV closest to the cylinder oscillates upstream and downstream along the bed. When the HV moves downstream toward the cylinder, it approaches the bed, and its cross-section area and circulation strength decreases. Latter, Agui and Andreopoulos [15] visualized the flow structures around a circular cylinder for cylinder Reynolds numbers, ReD, of 1.0 × 10⁵ and 2.2 × 10⁵. They observed that the flow field upstream of the cylinder is always dominated by a much more stable and larger primary HV (PHV). They also concluded the PHV wanders mostly in the streamwise direction under the action of large-scale structures in the incoming flow.
More detailed descriptions on the evolution of the turbulent HV system were not available until eddy-resolving numerical simulations were applied. Kirkil et al. [16] performed one of the earliest large eddy simulations (LES) on flow around a circular cylinder at a Reynolds number of 18.000. They found the junction region is not always dominated by a large relatively stable PHV. The PHV can generate through growing of a small vortex or merging of several vortices with the same rotation sense. Moreover, some of the vortices are separated from the attached boundary layer on the upstream cylinder face instead of the upstream separation region. During its lifetime, the PHV gains or loses vorticity due to interaction with co-rotating or counter-rotating vortices, respectively. In some cases, the PHV was split or practically destroyed. Later, Paik et al. [10] carried out detached eddy simulations (DES) for flow around a wing mounted on a flat bed at ReD = 1.15 × 10⁵. They found the flow is dominated by a coherent PHV. However, for flows around a circular cylinder with lower Reynolds number, the DESs carried out by Escauriaza and Sotiropoulos [11] showed some differences on the evolution of the turbulent HV system. For the flow at ReD = 39,000, the system was found to be dominated by two primary horseshoe vortices (PHVs). These two HVs move upstream and downstream, respectively. On the other hand, the HV system at ReD = 20,000 is composed of four or five PHVs at all times, which move only in the downstream direction.
Recently, Kirkil and Constantinescu [17] adopted the LES and DES approaches to study flows around a circular cylinder with ReD = 16,000 and 500,000, respectively. In both cases, the turbulent HV system was found to dominate by one PHV. The main mechanism for increasing the coherence of PHV is the merging and extraction of vorticity of the same sign from vortices originating in either the down-flow or the separation region. Meanwhile, the core of the PHV is larger when it is located away from the cylinder.
Quantitative experimental studies on the evolution of the turbulent HV system upstream of a circular cylinder were reported recently by several groups. Apsilidis et al. [12] reported the influence of cylinder Reynolds number on the dynamics of the turbulent HV system by using time-resolved PIV. For the case with ReD = 29,000, the flow upstream of the cylinder is not dominated by a PHV sometimes. However, the flows upstream of the cylinder with ReD = 47,000 and 123,000 are always dominated by a PHV. The PHV can maintain its coherence by merging vortices originating in the incoming flow, the down-flow along the cylinder face, or the upstream separation region. Schanderl et al. [18] obtained the flow fields in front of a circular cylinder on a flat bed with ReD = 39,000 by using PIV. The turbulent HV system was found to be dominated by a PHV.
The PHV undergoes relatively large streamwise displacements, and the closer to the cylinder it locates the more coherent it would be. Recently, Li et al. [19] observed part of the evolutionary process of turbulent HV in front of a circular cylinder with ReD = 9400 and 13,500 by using time-resolved PIV. The strength and size of the PHV were found to decrease gradually when it retreats back to the cylinder.
To summarize, despite many valuable contributions by using flow visualization methods, eddy-resolving simulations, and quantitative measurements, the evolutionary process of the turbulent HV system is far to be well understood. On one hand, existing observations based on different methods, especially numerical simulations, have shown some discordances. On the other hand, many existing investigations on the evolution of turbulent HV system have been based merely on the observations of instantaneous velocity fields, which is insufficient for building a statistically reliable description on the evolutionary process of the turbulent HV system. Therefore, the present study uses quantitative and statistical methods to investigate the evolution of the turbulent HV system. It expands upon the previously published work by Chen et al [13]. Especially, relationships between the various features of the PHV dominating the turbulent HV system during its evolution were investigated. Meanwhile, the underlying mechanisms responsible for the generation, disappearance, large-scale streamwise movements, and strength variations of the PHV were re-investigated.
2. Datasets and Methodology
2.1. Datasets
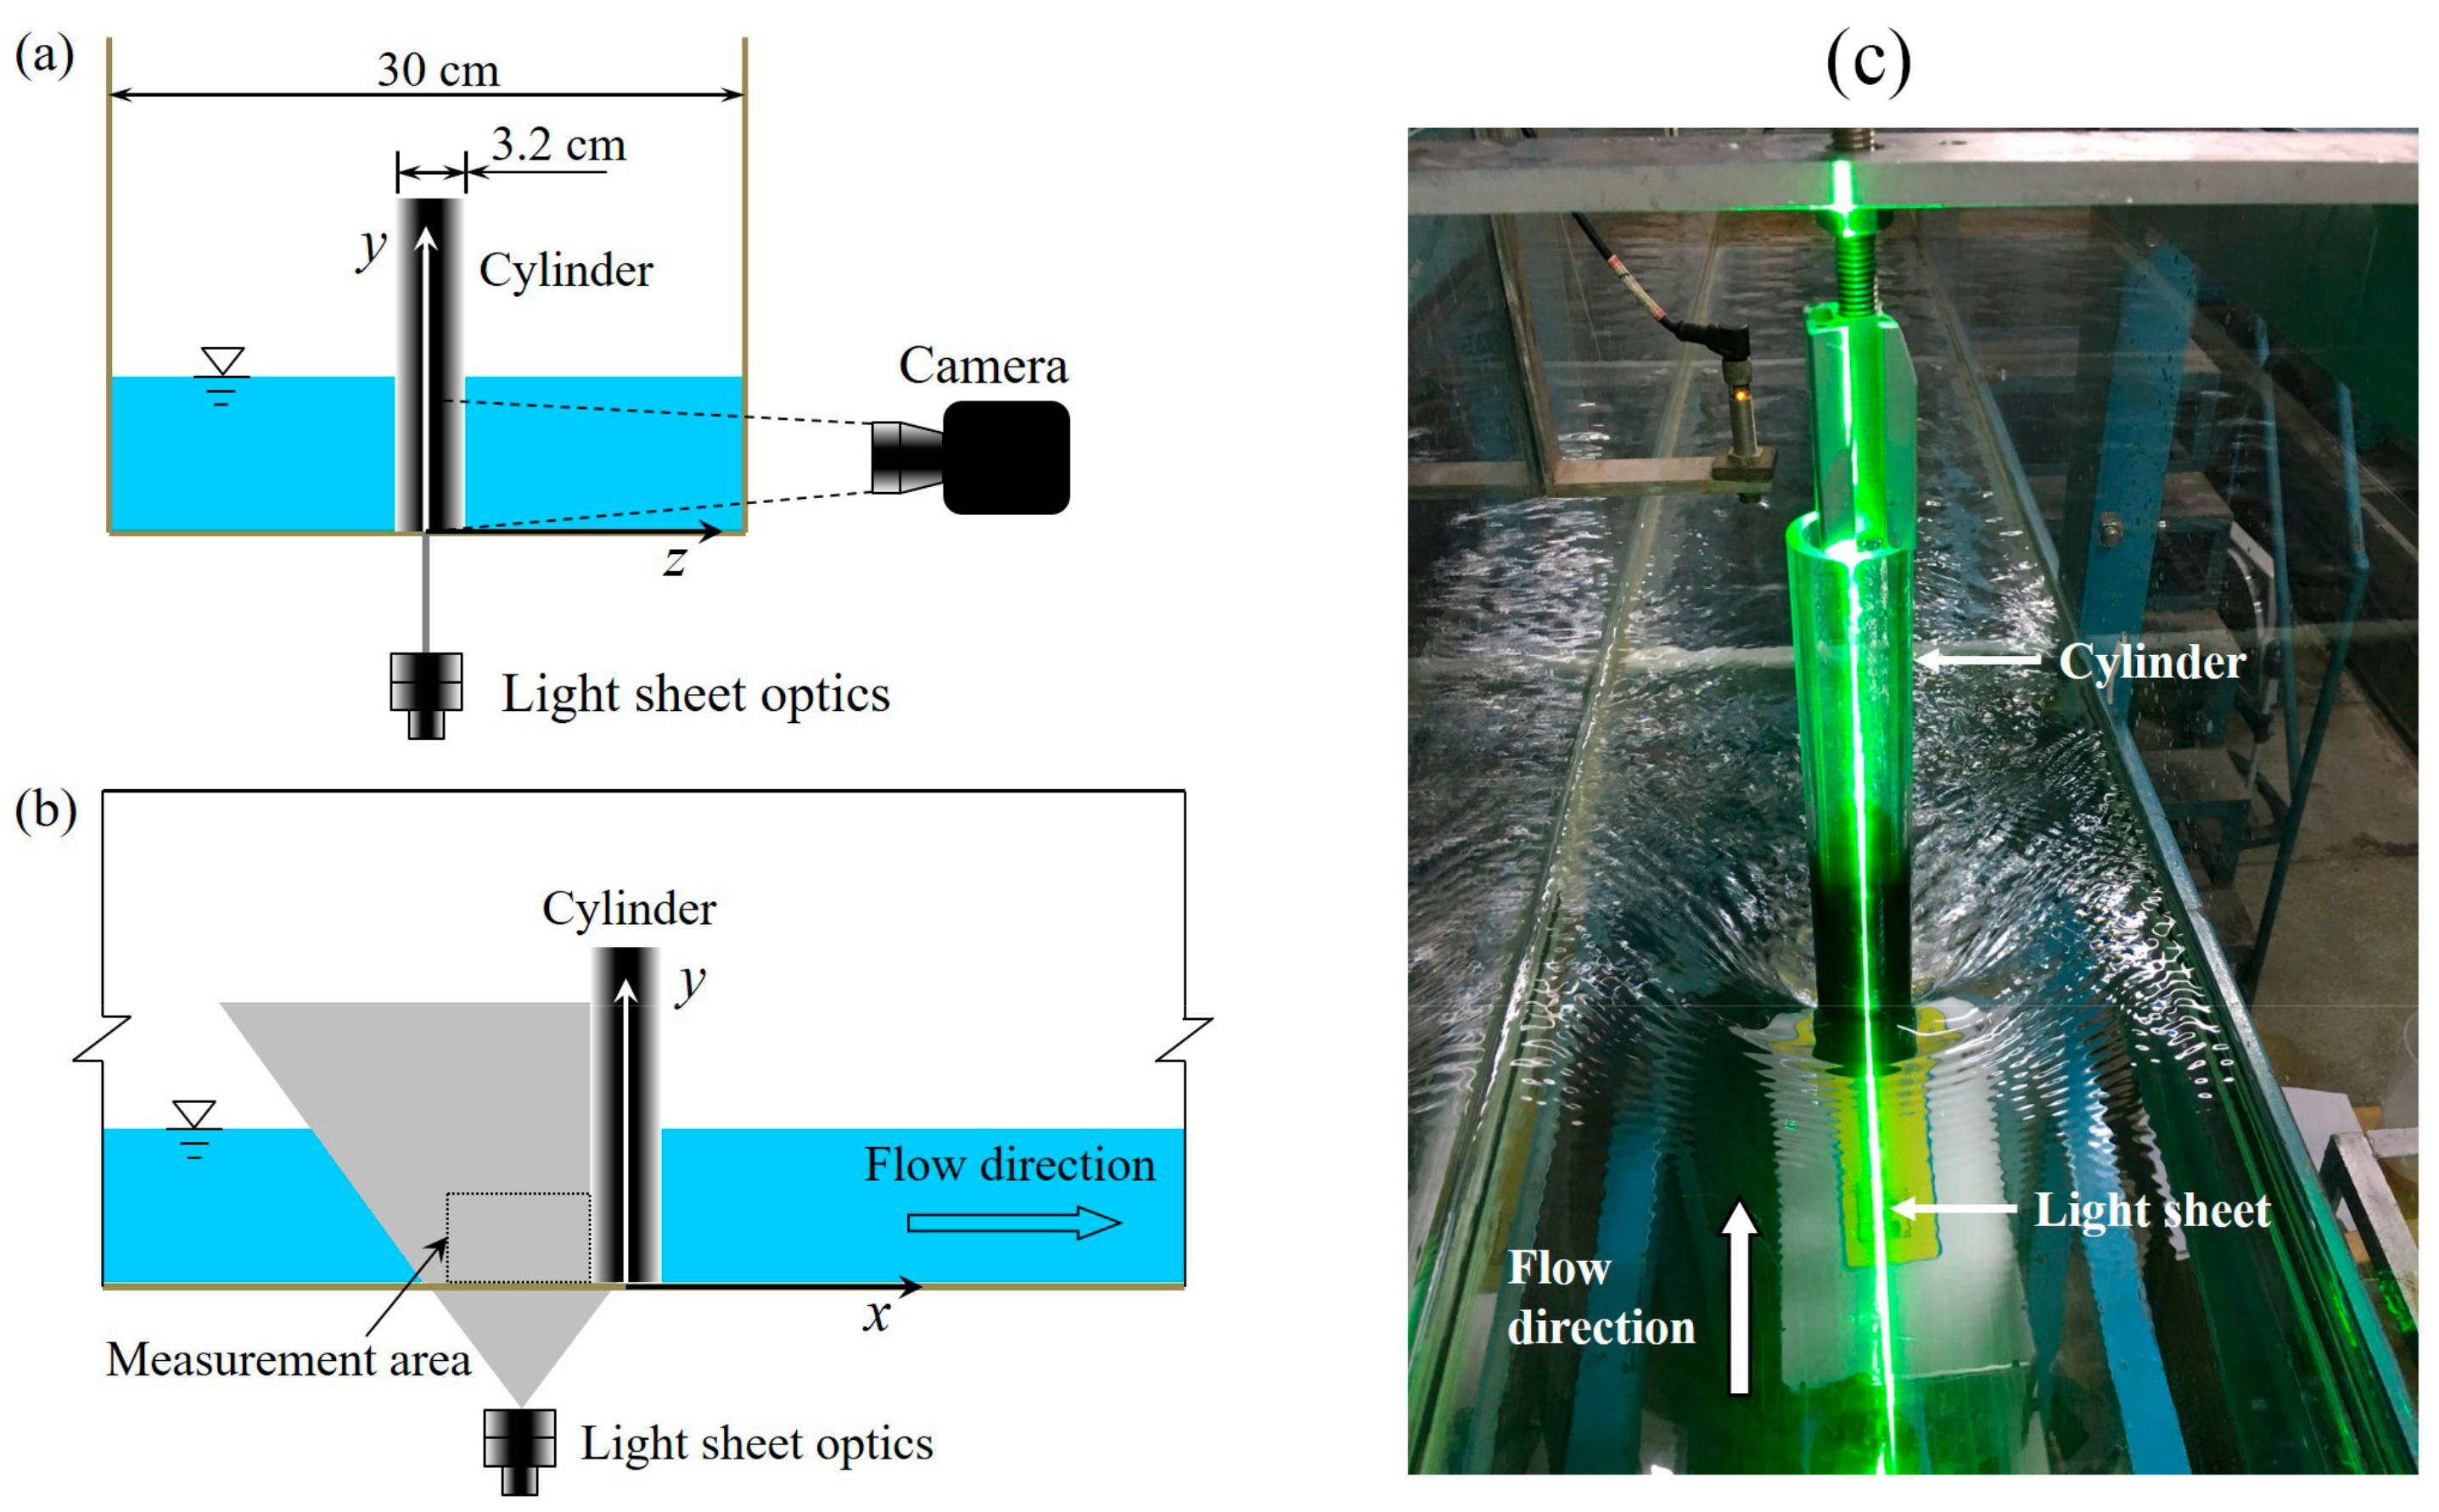
Three experimental datasets were used for the present investigation. The experiments were carried out in a recirculating tilting water flume that was 20 m long and 0.3 m wide. Figure 1 shows two diagrams and a photograph of the experimental setup. A circular cylinder with a diameter of 3.2 cm was mounted vertically on the flat bed of the flume. The length of the cylinder is larger than the water depth to avoid submergence. The distance between the axis of the cylinder and the entrance of the flume is 12 m to ensure a fully developed turbulent open channel flow. The cylinder Reynolds number ReD, defined with the diameter of the cylinder, D, and the bulk mean velocity, Um, was 8600, 10,200, and 13,900, respectively. The detailed flow characteristics for each experimental case are summarized in Table 1. For the sake of distinction, each case is named by its cylinder Reynolds number preceded by the letter “C”. According to the results of Wei et al. [7], the HV systems in the minimum and maximum ReD cases considered here are intermittently and fully turbulent, respectively. The 2D instantaneous velocity fields in the symmetry plane upstream of the cylinder were measured using a time-resolved PIV system. For each flow condition, two or three sequences of continuous velocity fields were measured with a frequency larger than 500 Hz. The total numbers of velocity fields for each case are 21,000, 21,000, and 24,000, respectively. More details about the experimental setup, PIV system, and the validation of the experiment data can be found in Chen et al. [13].
As shown in Figure 1, the origin of the coordinate system used to describe the results is defined to lie at the center of the cylinder on its bottom surface. The x axis is oriented along the main flow and parallel to the flume bed. The y axis is normal to the bed and coincides with the central axis of the cylinder. The transverse z axis is normal to the side walls of the flume. The instantaneous velocity components in the x, y, and z directions are denoted by U, V, and W, respectively.
2.2. Vortex Identification and Characterization Methods
The turbulent HVs are usually identified as closed or spiral streamlines. However, this method fails when the convection velocity of a vortex becomes non-ignorable [20]. Meanwhile, quantitative features of vortices can hardly be read out from the streamline patterns. Therefore, a number of recent investigations used kinematics implied by the velocity gradient tensor as the indicators of HVs. For instance, Paik et al. [10], Kirkil and Constantinescu [17], and Apsilidis et al. [12] adopted the Q criterion to visualize vortices within the HV system.
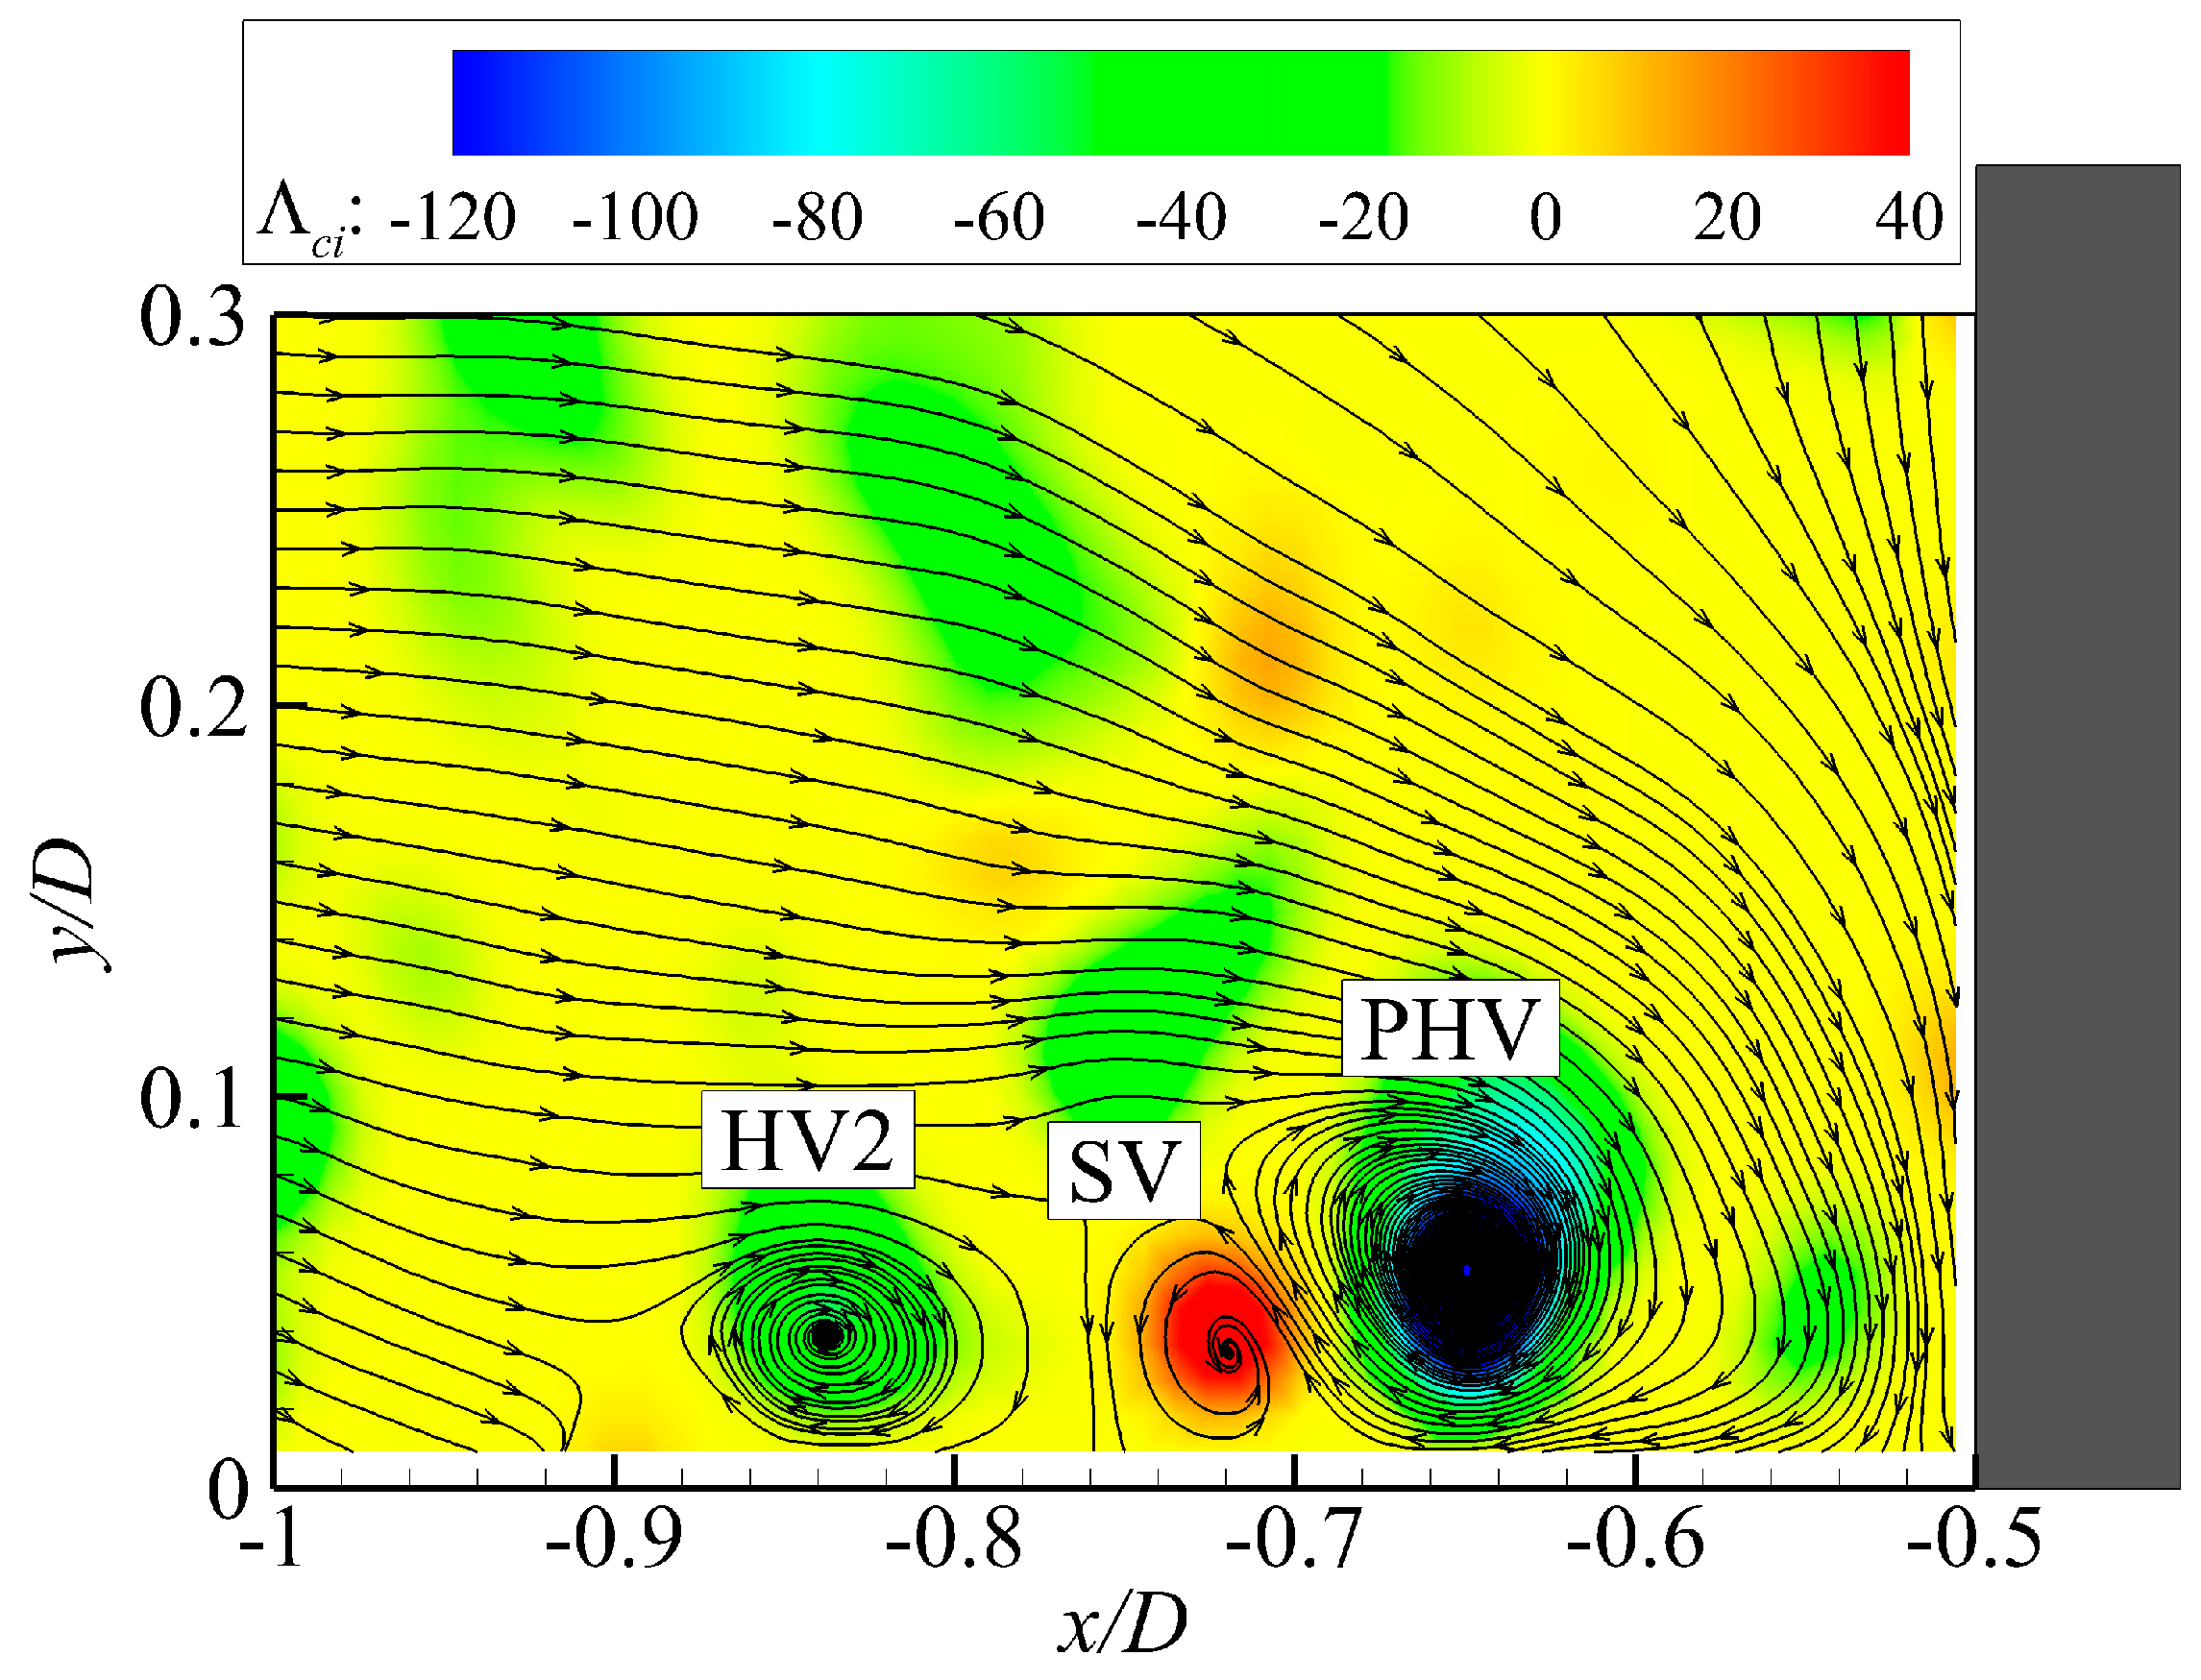
The present investigation uses the swirling strength criterion to identify HVs. The criterion adopts the imaginary part of the eigenvalues of the velocity gradient tensor (termed swirling strength and denoted by λci) as the vortex indicator [21]. When λci is non-zero at a point, the local streamline around the point is swirling, and the strength of the local swirling motion is represented by its value. For real vortices in turbulent flows, the strength of swirling motion shows maximum value at the center and decreases monotonously along the radius. Therefore, vortices are detected as non-zero clusters around the peaks of λci [22]. Since the imaginary part of the eigenvalues is always positive, we define Λci = λci∙sign(ωz) to distinguish between vortices rotating in the clockwise and counterclockwise sense, where ωz is the spanwise vorticity. The peak position of each cluster of Λci indicates the center of each vortex, and the peak value, Λv, denotes the coherence of each vortex. Figure 2 presents the streamlines and contours of Λci in an instantaneous velocity field in front of the cylinder for case C8600. According to the streamline patterns, two HVs and one secondary vortex (SV) are observed in the junction region. The swirling strength criterion correctly identifies these vortices.
The swirling strength criterion can determine the center and coherence of each vortex, but methods are still required to determine their core size and circulation strength. Traditionally, two categories of methods were widely used. The first kind of methods define the boundary of a vortex as an isoline of vortex indicators, of which the value equals to a given threshold [22]. The circulation strength of the vortex is then calculated by integrating the vorticity within the vortex core. These methods are simple and intuitive, but the results depend on the selected threshold. The second kind of methods extract the features of a vortex by fitting the local velocity field with a standard vortex model [23]. By properly selecting the model, results of this kind of method would be more objective. However, it is computationally intense and may lose its superiority in treating instantaneous vortices.
We adopted a revised version of the threshold method to determine the size and circulation strength of instantaneous HVs. Instead of selecting a universal and constant threshold for all vortices, we defined the threshold for each vortex based on its own coherence as
where Λv is the swirling strength at the center of each vortex. The threshold is selected based on the following relation holding for a standard Oseen vortex [24]
2.3. Vortex Tracking Method
In order to quantitatively investigate the evolution of turbulent HV system, vortices comprising the system should be tracked. However, as shown in Figure 2, the instantaneous turbulent HV system is usually composed of more than one vortex with different size and strength, making it impractical to track all these vortices. According to existing investigations, most of the time the turbulent HV system is dominated by a primary vortex which relates tightly with the dynamics of the system. Therefore, only the PHV is selected as the representative vortex in the turbulent HV system and tracked. Nevertheless, one difficulty still exists, as no clear and universal definition for the PHV is available even though it is commonly used. In a laminar HV system, the PHV is typically the standing HV closest to the cylinder base [7]. For the turbulent HV system, however, the most coherent HV seems a more intuitively accepted definition for the PHV. Therefore, we chose the HV with the highest peak of Λci in a given velocity field as the PHV.
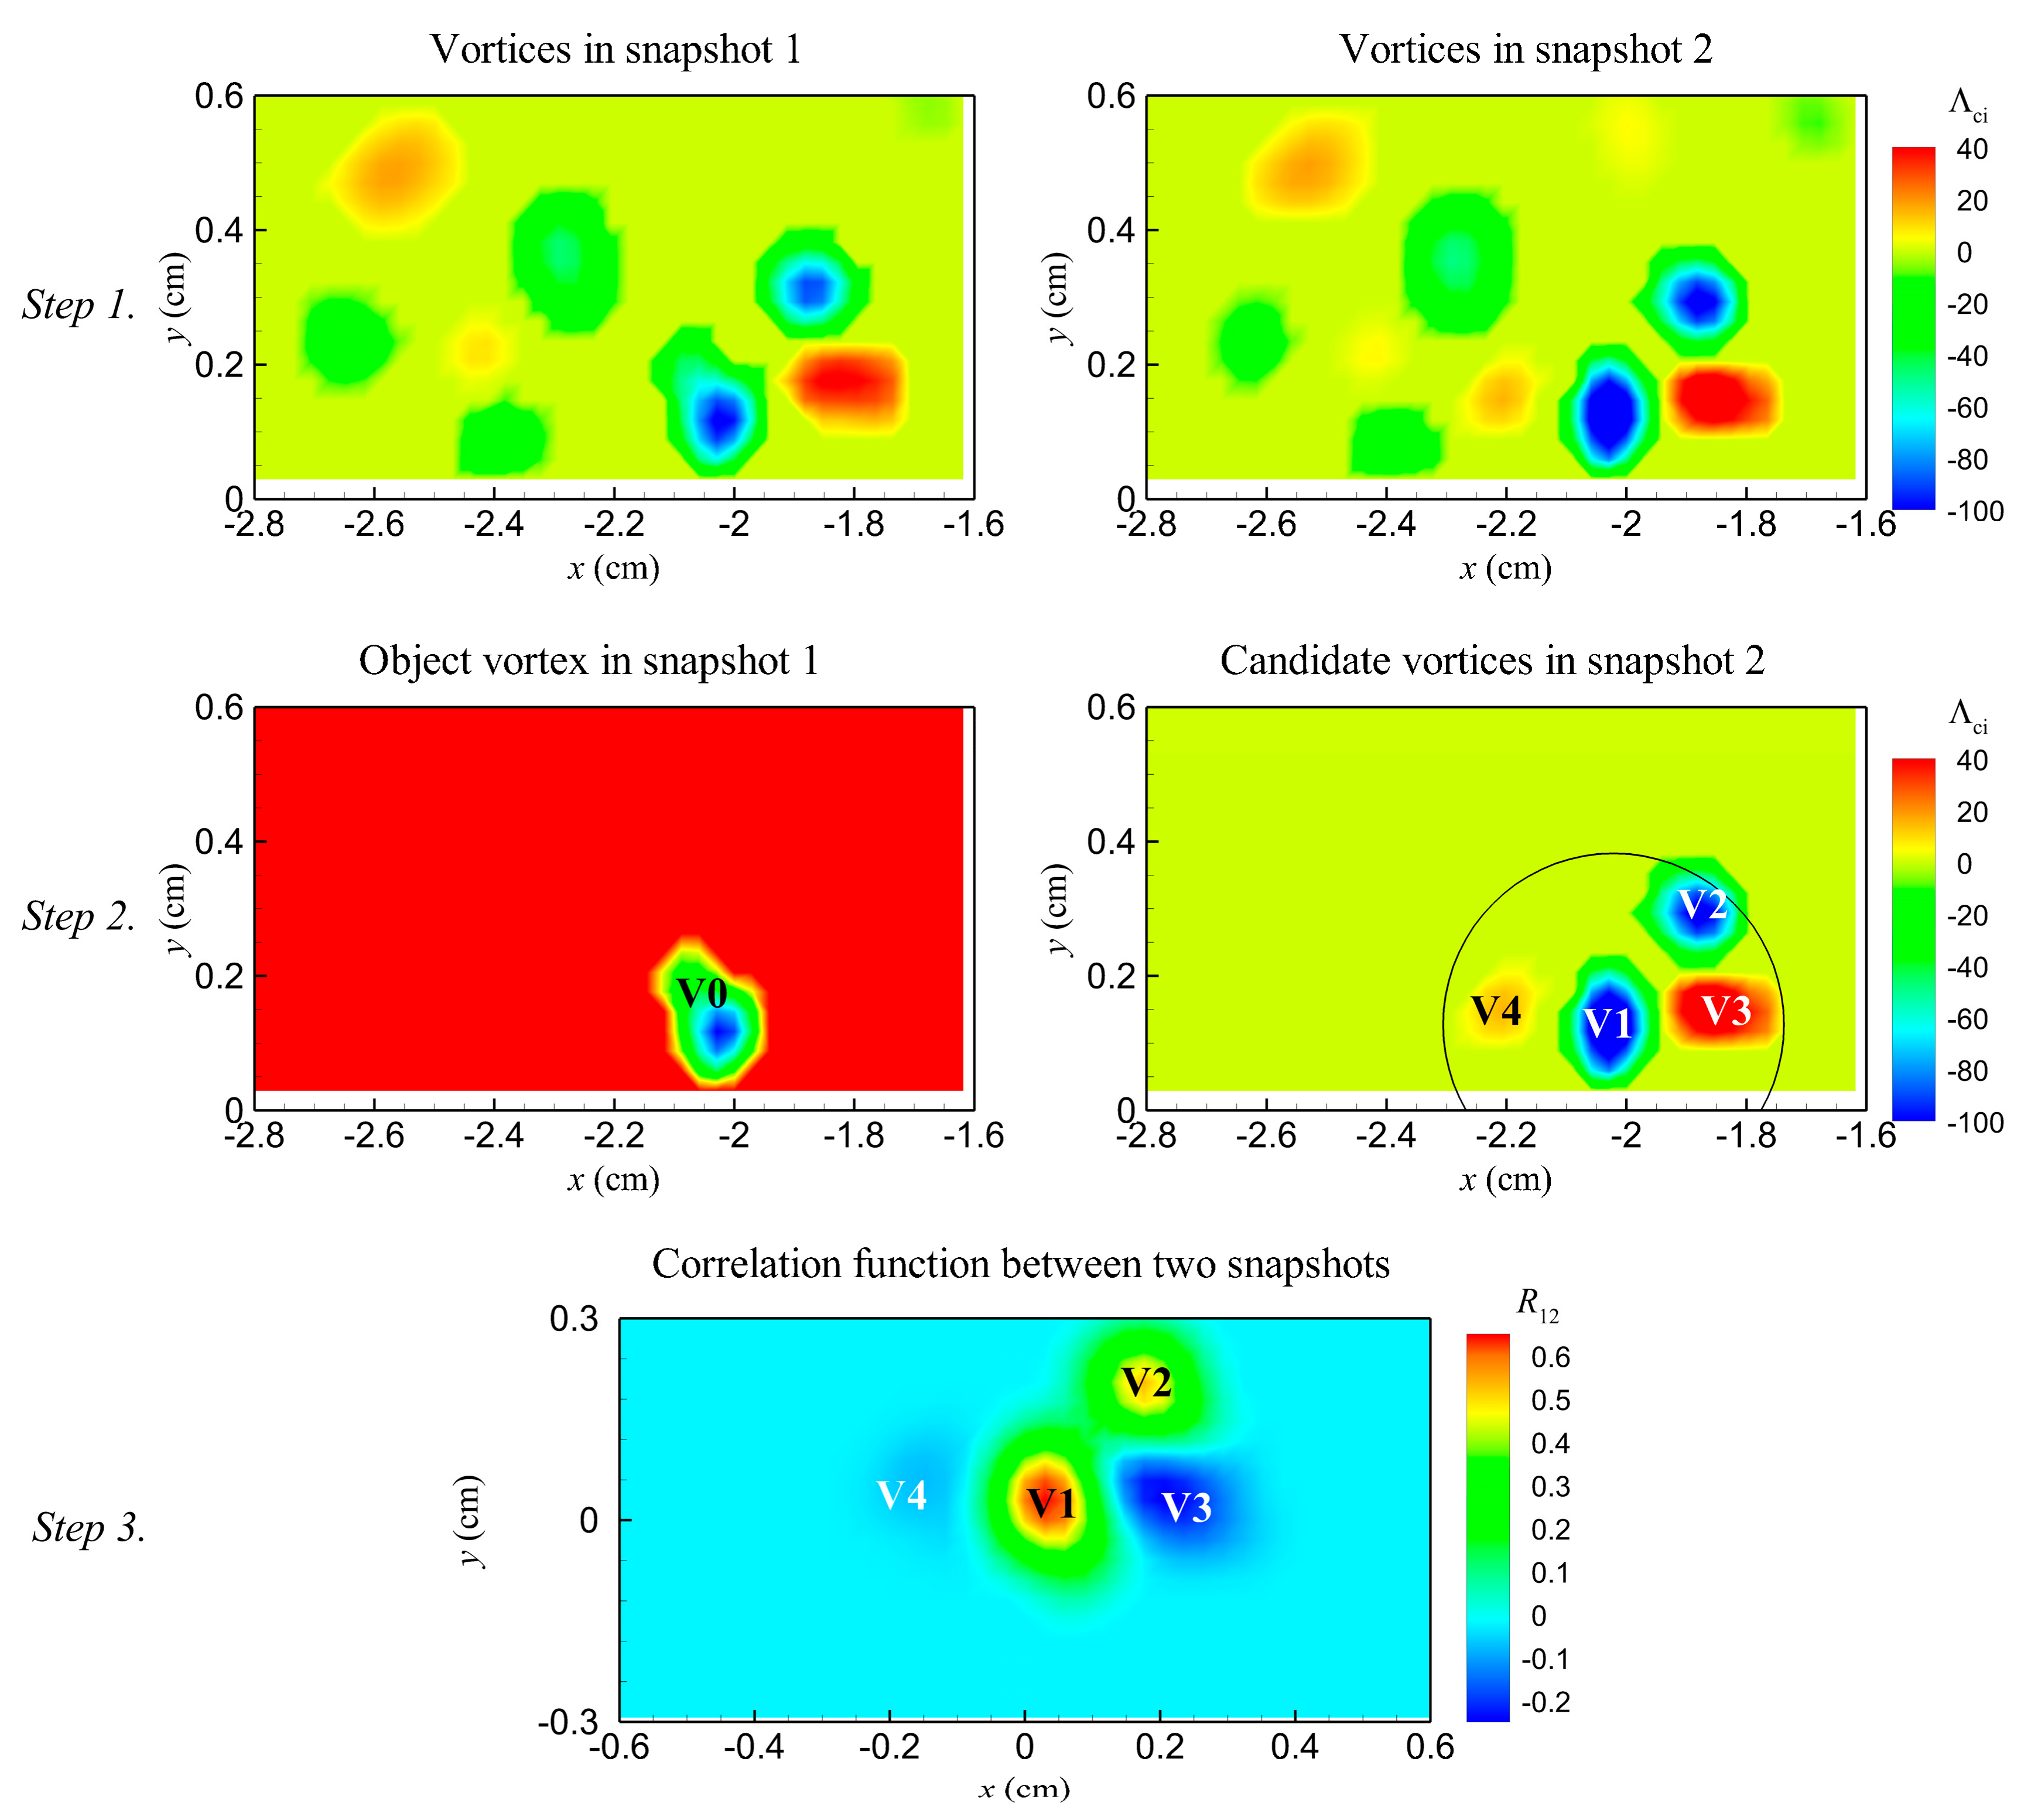
To track a PHV in successive velocity fields, we treated the spatial distribution of Λci within its vortex core as the gray-level intensity of a particle image. Following some basic ideas of the particle tracking velocimetry technique, the method for tracking vortex contains the following steps, as illustrated in Figure 3.
Step 1. Vortices in all instantaneous velocity fields of a sequence are identified with the swirling strength criterion. The core of each vortex is represented by the contours of swirling strength within its boundary, defined by Equation (1).
Step 2. The PHV in the first snapshot (V0) is selected as the tracking object and candidates of this vortex in the next snapshot (V1–V4) are determined by a displacement threshold (denoted by a circle). The threshold is defined as
where Vc is the convective velocity of the vortex V0 defined as the instantaneous velocity at its center; Δt is the time interval between two successive velocity fields; Rv is the radius of the vortex V0. The introduction of Rv is based on the observation that the center of HV can vary dramatically within its core.
Step 3. Counterpart of the object vortex in the second snapshot is detected by a cross-correlation analysis. The cross-correlation analysis is performed between the swirling strength distribution of snapshot one and that of snapshot two. In the resulted correlation map, the maximum peak represents the correlation coefficient between the object vortex and its counterpart, and its coordinate represents the displacement of the object vortex during Δt.
After obtaining the displacement of the object vortex, the position of its counterpart in the second snapshot (V1) is determined. The detected counterpart is defined as the new object vortex in the next step.
Step 4. Steps 2 and 3 are conducted repeatedly until the correlation coefficient between the object vortex and its counterpart is smaller than 0.5. The threshold of 0.5 has been selected based on pre-conducted sensitive analysis. Such a circumstance means that the old PHV disappears. Then a new PHV is defined in the next snapshot and the tracking process restarts.
Step 5. The tracking results for each velocity field sequence are double checked manually to avoid possible mismatch. The image of streamlines and contours of Λci in each instantaneous velocity field is converted into a frame of a video animation. By replaying the videos, incorrect tracking results are identified and revised. Meanwhile, the videos are used to assist analyzing the evolution behaviors of the PHV.
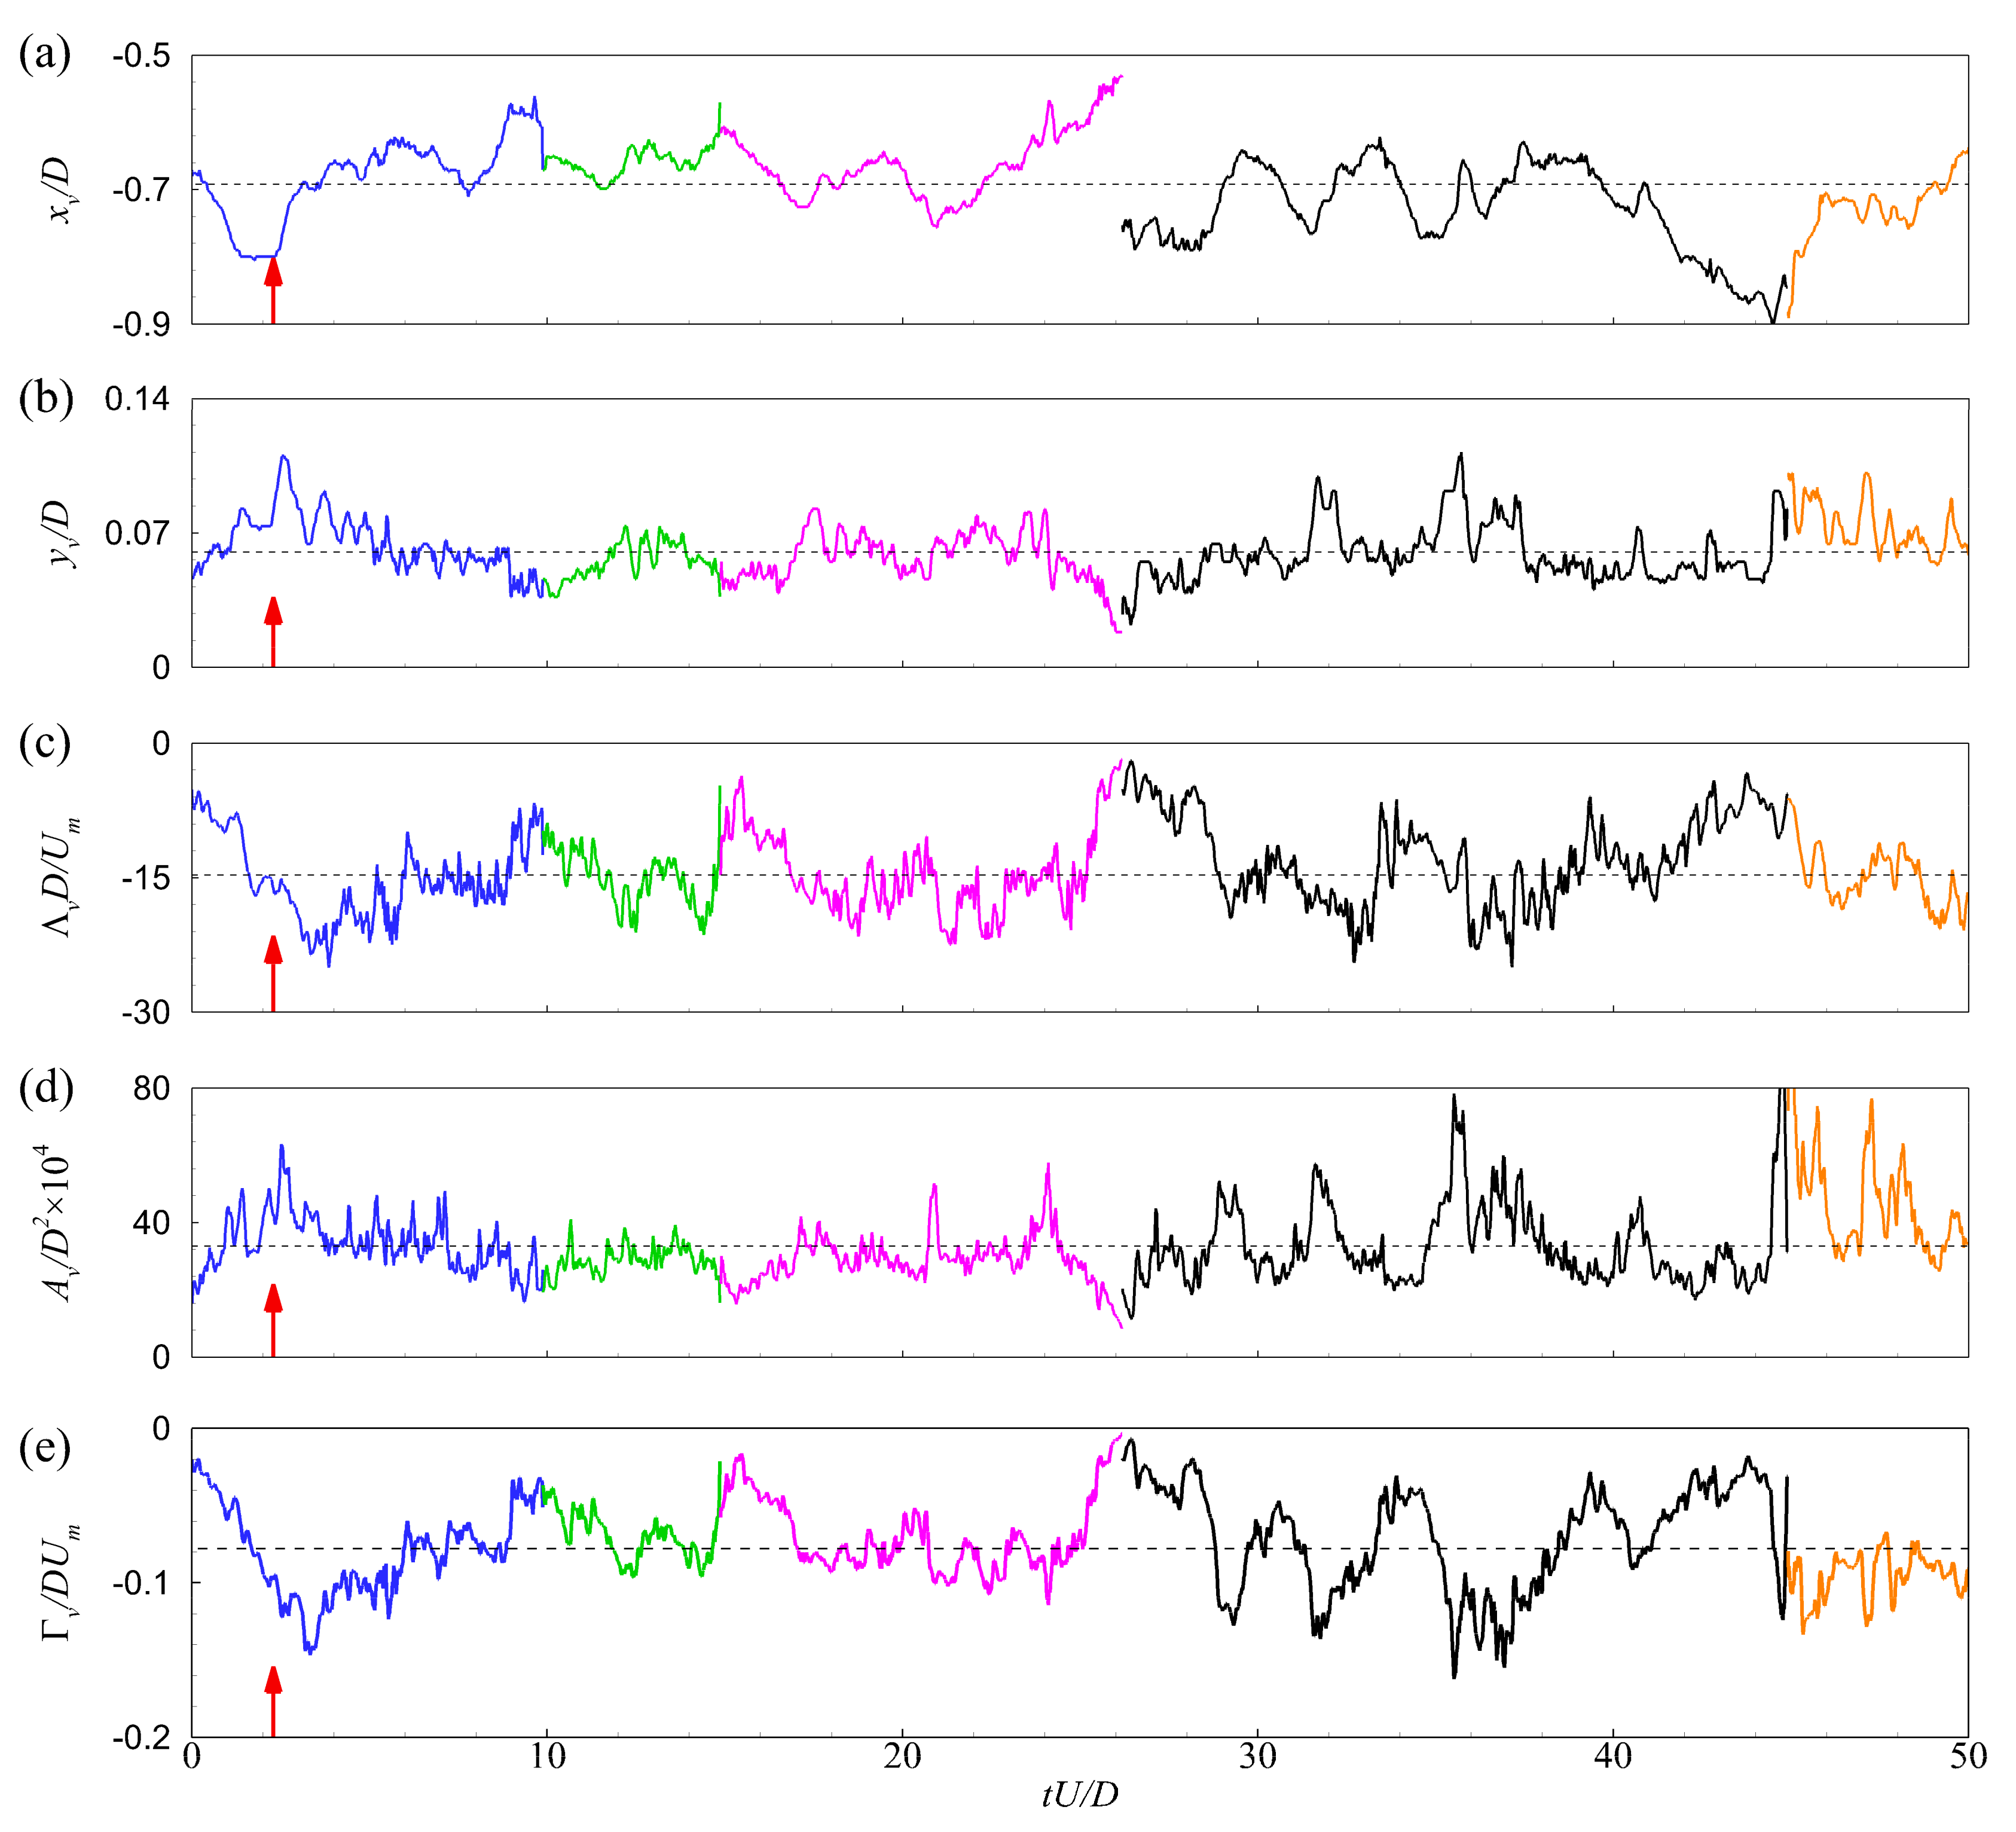
Figure 4 presents the time histories of the streamwise position, xv, vertical position, yv, coherence, Λv, core area, Av, and circulation strength, Γv, of several PHVs that appeared one after another in case C13900. A color change on the time histories indicates the disappearance of an old PHV and the generation of a new PHV. The horizontal dashed line indicates the time-averaged value of the corresponding feature. Figure 4a,b reveal the aperiodic oscillation, both streamwise and vertical, of the PHV. The streamwise position of the PHV changes from −0.91D to −0.53D with a mean value of about −0.7D. The vertical position lies in the range of 0.02D to 0.13D, with a mean value of about 0.06D. The instantaneous and mean positions of the PHV obtained by vortex tracking are in accordance with previous observations [12,18,25]. These agreements validate the reasonableness of the current definition of PHV and the reliability of the tracking results. In Figure 4c–e, the size, coherence, and circulation strength of the PHV also show chaotic variations with time. These features indicate that the investigated HV system is fully turbulent, at least in the case of C13900. The mean diameter and circulation strength are 0.033D and −0.08DUm, respectively.
2.4. Correlation Analysis Between the Features of PHV
Despite their chaotic variations, a scrutiny of Figure 4 reveals that the variations of different features are quasi-synchronous with each other. For example, the moment indicated by the arrows corresponds to local minima in the streamwise position, coherence, and circulations strength, and local maxima in the vertical position and core area, respectively. To explore the inter-relationships among these features, temporal cross-correlation analyses were conducted between the streamwise position and the other features of the PHV. As an example, the temporal cross-correlation function between the streamwise and vertical positions is calculated as follows:
Here, N is the sample number of velocity fields and the overbar represents time-averaging. For the sake of interpretation, absolute value of the coherence (swirling strength) and the circulation strength, which were negative by definition, were used to calculate the correlation functions.
3. Results and Discussion
3.1. Generation of PHV
Instantaneous velocity fields show that although the junction region between the bed and the cylinder is dominated by a PHV most of the time, there are instants where no typical HV is observed for all cases in the present study. Therefore, each PHV undergoes a complete evolutionary process consisted of generation, life, and disappearance stages. The occasional absence of a PHV in the junction region was also observed by Kirkil et al. [16] at a Reynolds number of ReD = 18,000 and by Apsilidis et al. [12] at ReD = 29,000. For cases with higher Reynolds number, both experimental and numerical results showed the persistent existence of the PHV [11,12,18].
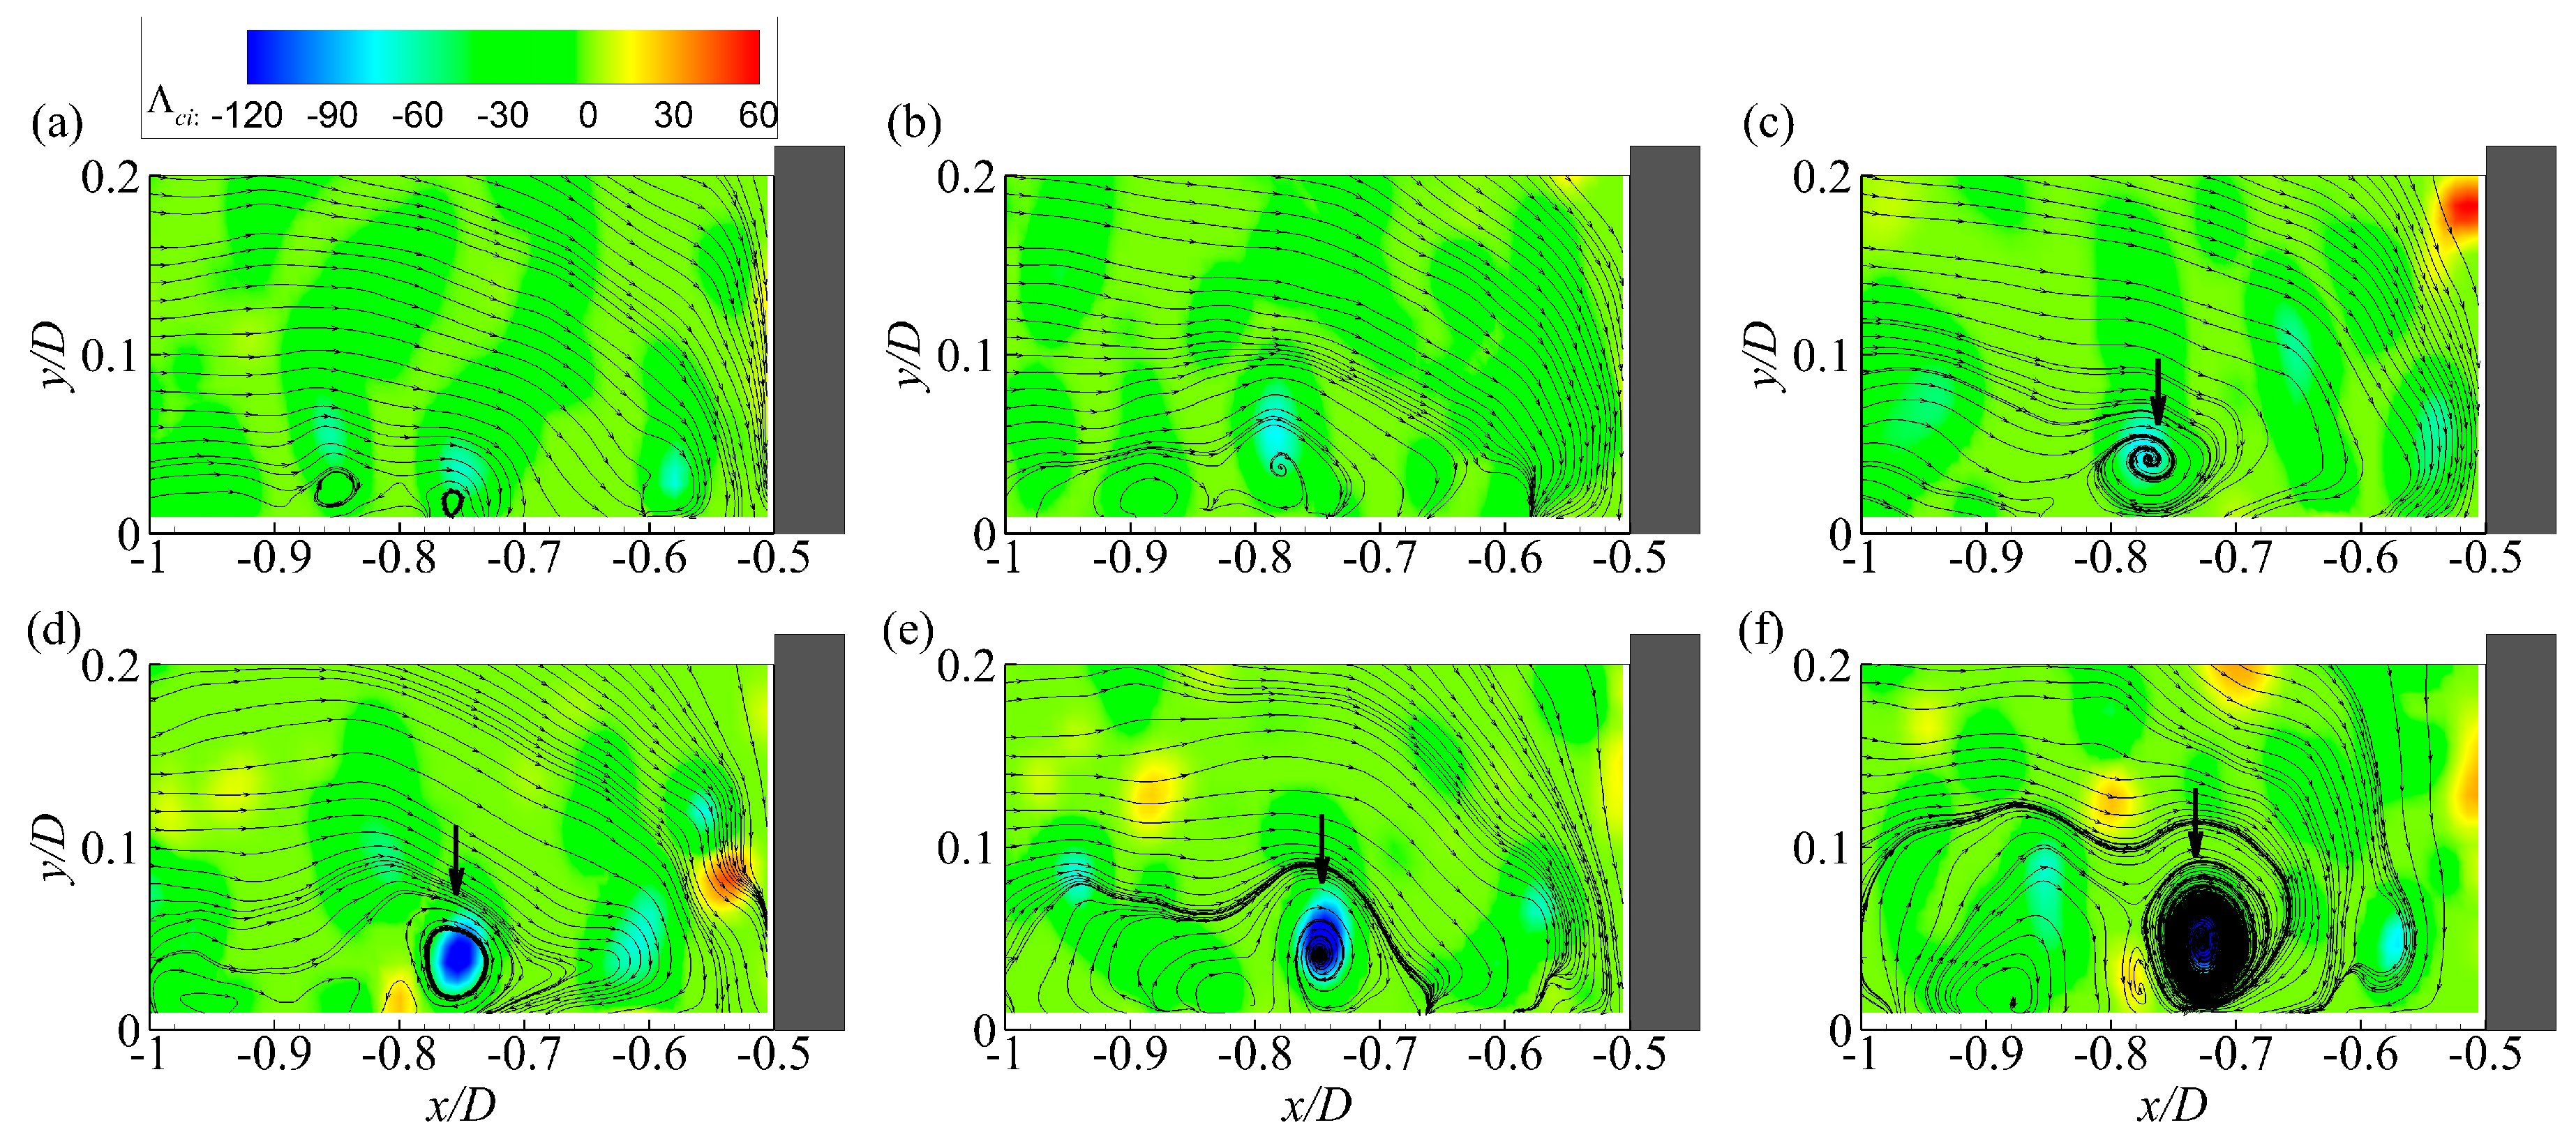
The sequence of instantaneous velocity fields in Figure 5 shows the most frequently observed mechanisms for the generation of the PHV. In Figure 5a,b, no coherent HV is observed in the junction region. Then a weak HV, as indicated by the black arrow, is generated in the separation region in Figure 5c. This vortex increases in size and strength while moving downstream slowly. Finally, it grows up into a PHV dominating the junction region in Figure 5d. The growth of a HV shedding from the separation region into a PHV is natural and well-accepted since all PHVs are generated in the separation region for a laminar HV system [26].
Figure 6 presents another less frequently observed mechanism for the generation of the PHV. In Figure 6a, no PHV is observed in the junction region. Instead, a newly generated HV (HV1) is shedding away from the separation region, and a relatively weak prograde vortex (PV1, vortex with negative vorticity) originating in the incoming flow is convected toward the junction region by the down-flow in front of the cylinder. The vortex PV1 becomes stronger while approaching the bed. At the same time, a second HV (HV2) is generated in the separation region in Figure 6b. Instead of growing up into PHVs, the vortex HV1 dissipates gradually, and the vortex HV2 is partly engulfed by the vortex PV1 in Figure 6c,d. Meanwhile, another prograde vortex (PV2) convected by the down-flow is engulfed by the vortex PV1 in Figure 6e. After merging with vortices HV1 and PV2, the vortex PV1 becomes a relatively large and coherent PHV in Figure 6f. The generation of a PHV through the merging of several prograde vortices originating in the incoming flow and the down-flow is observed in all experimental cases of the present study. Very occasionally, even a single prograde vortex is observed to grow up into a PHV. A similar mechanism for the generation of a PHV was also observed by Kirkil et al. [16] in their LES investigation at ReD = 16,000. However, it is unclear whether such a mechanism exists for junction flows with larger cylinder Reynolds number.
3.2. Lifespan of PHV
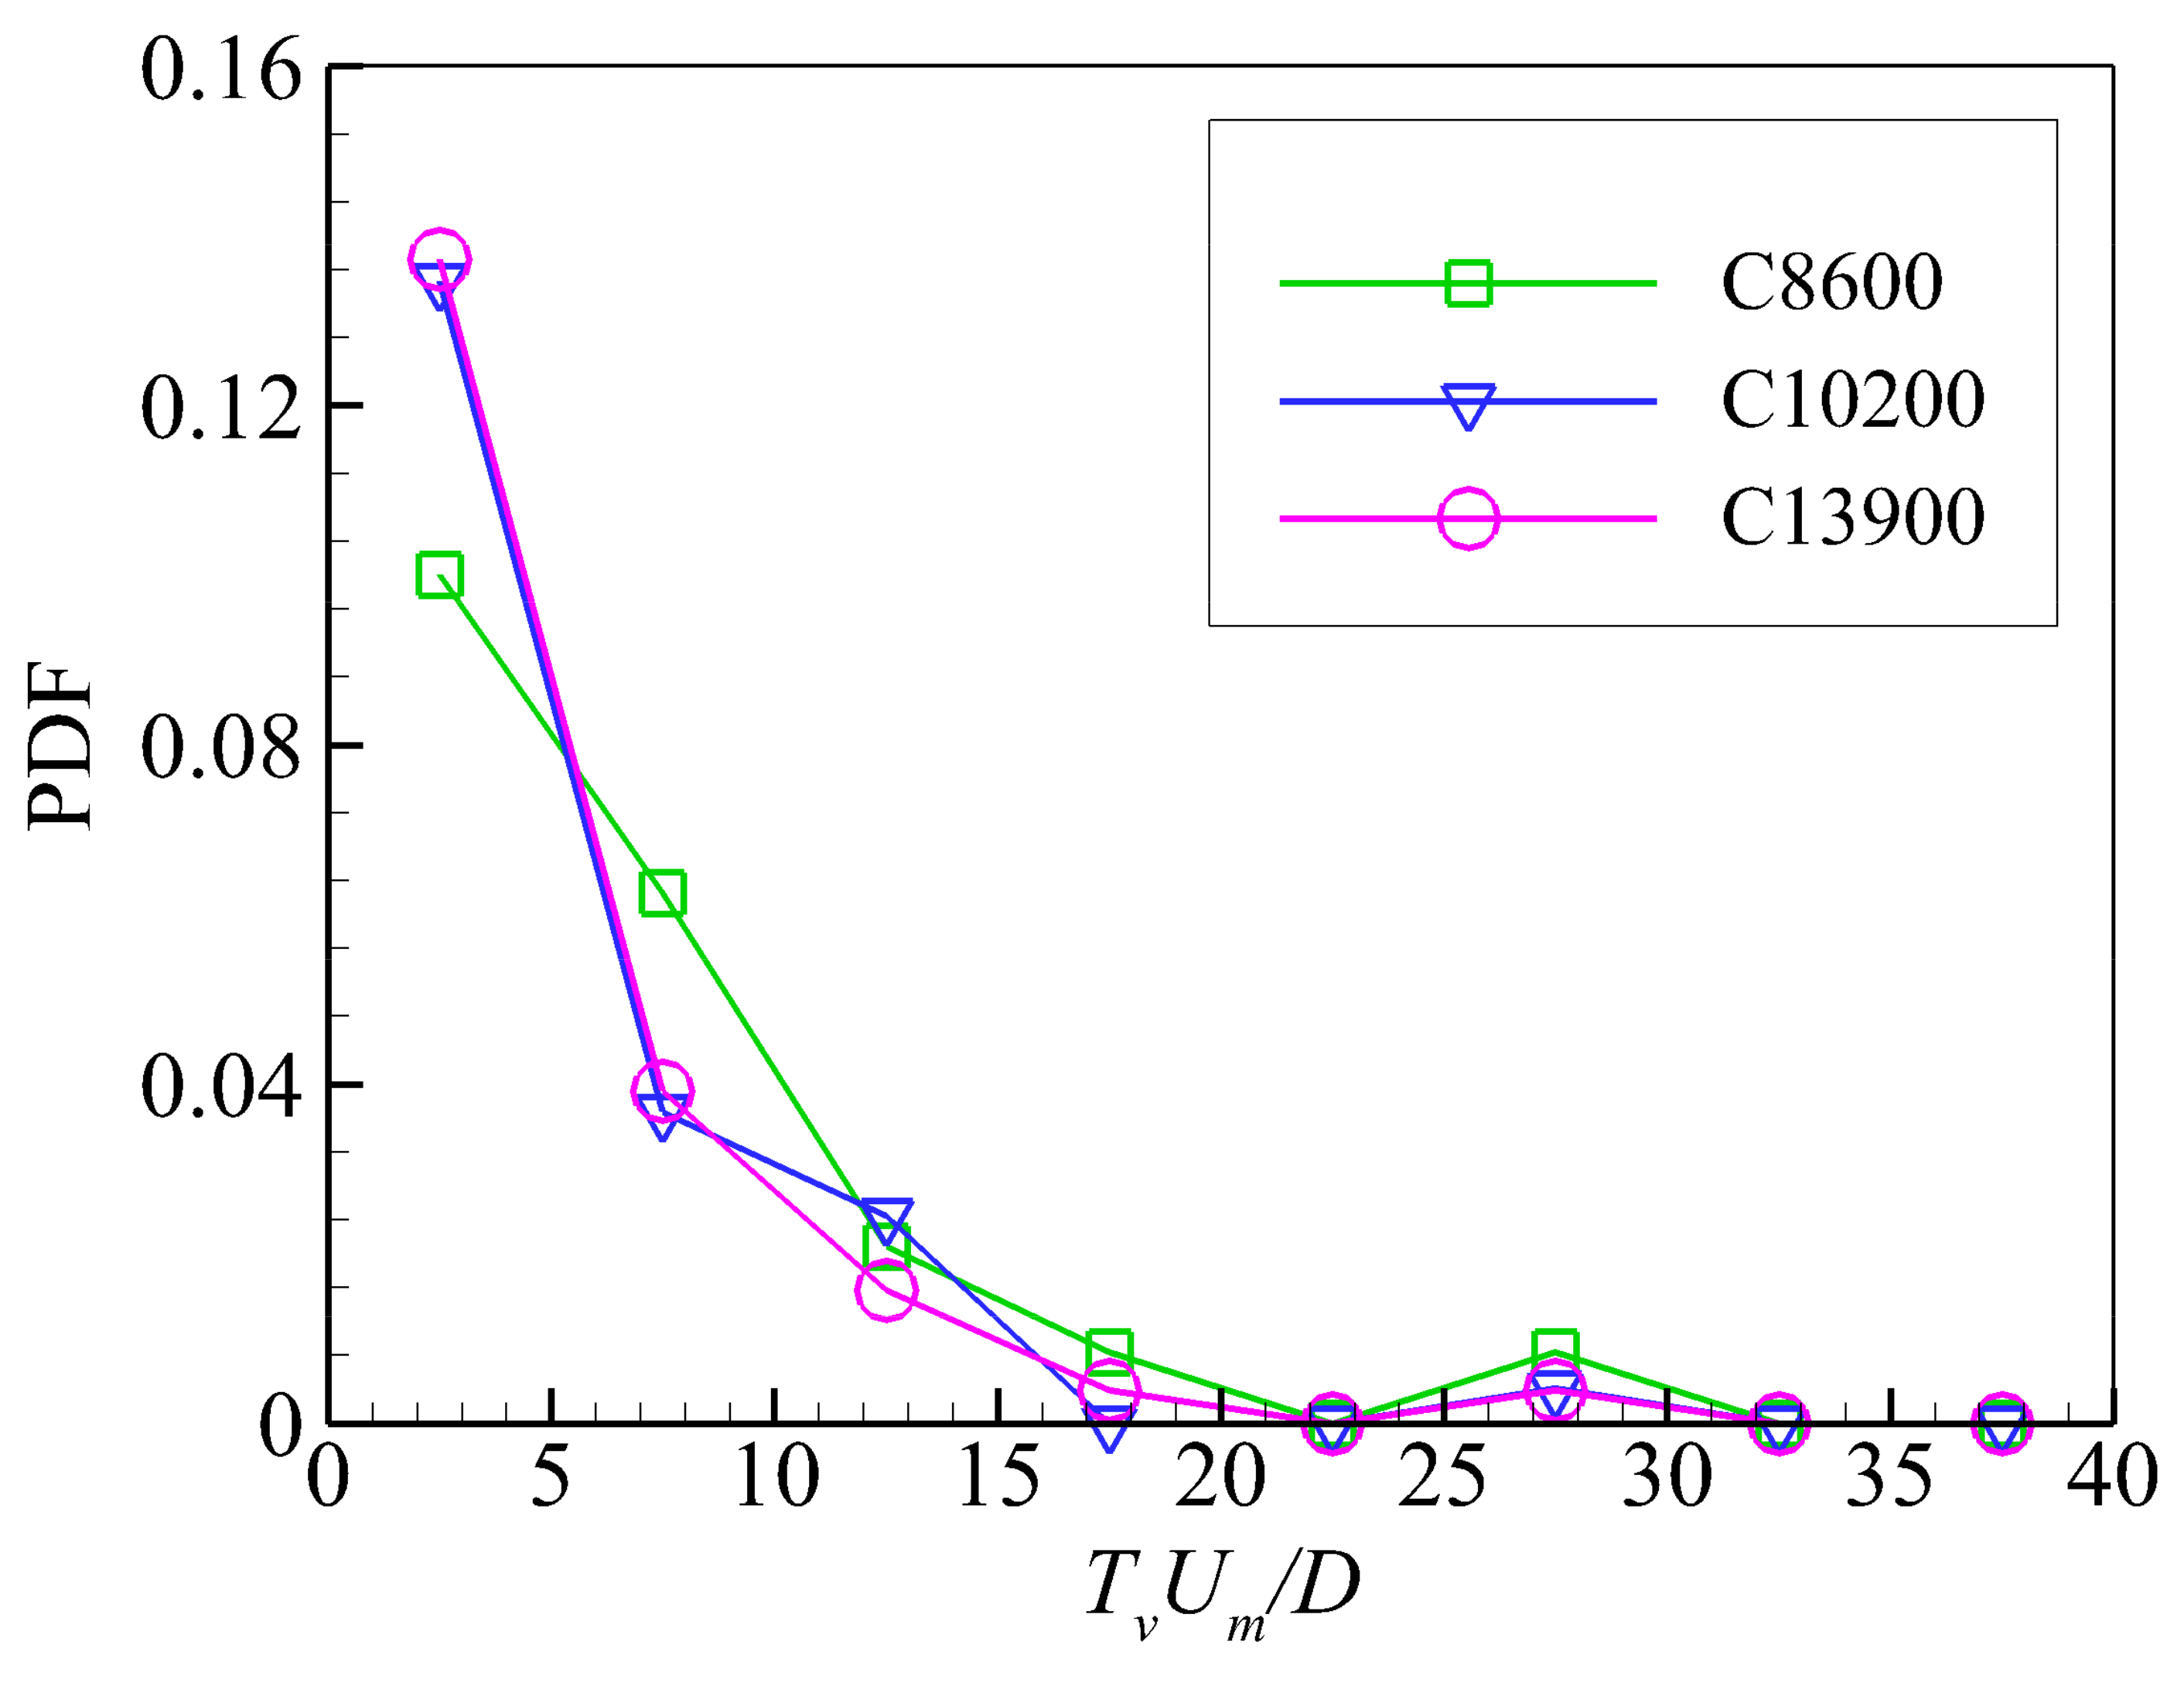
The lifespan of each PHV can be obtained directly from the vortex tracking method. However, due to the finite number of PHVs measured in each experimental case, only the probability density function (PDF) of the lifespan of PHVs is presented in Figure 7. The result shows the lifespan of PHVs varies in quite a large range. No obvious Reynolds number dependence of the lifespan is observed. Although not converged yet, the calculated mean lifespans of PHVs are 6.04D/Um, 4.81D/Um, and 4.64D/Um for case C8600, C10900, and C13900, respectively. Even though the mean lifespan of PHVs was not reported directly, Kirkil and Constantinescu [17] showed the mean period of a full transition among flow modes of the turbulent HV system is about 5.32D/Um at ReD = 16.000. Since the PHV is usually found to lose coherence strongly when the HV system transits from the backflow mode to the zero-flow mode [10], it is reasonable to conjecture that the disappearance of PHVs happens mainly after the mode transition. Therefore, the mean period of the transition could be a reasonable estimation of the mean lifespan of PHVs. To this end, the calculated mean lifespans are not inconsistent with existing findings. Meanwhile, as a preliminary estimation, the value of 5.0D/Um seems a reasonable approximation of the mean lifespan of PHVs.
3.3. Oscillation of PHV
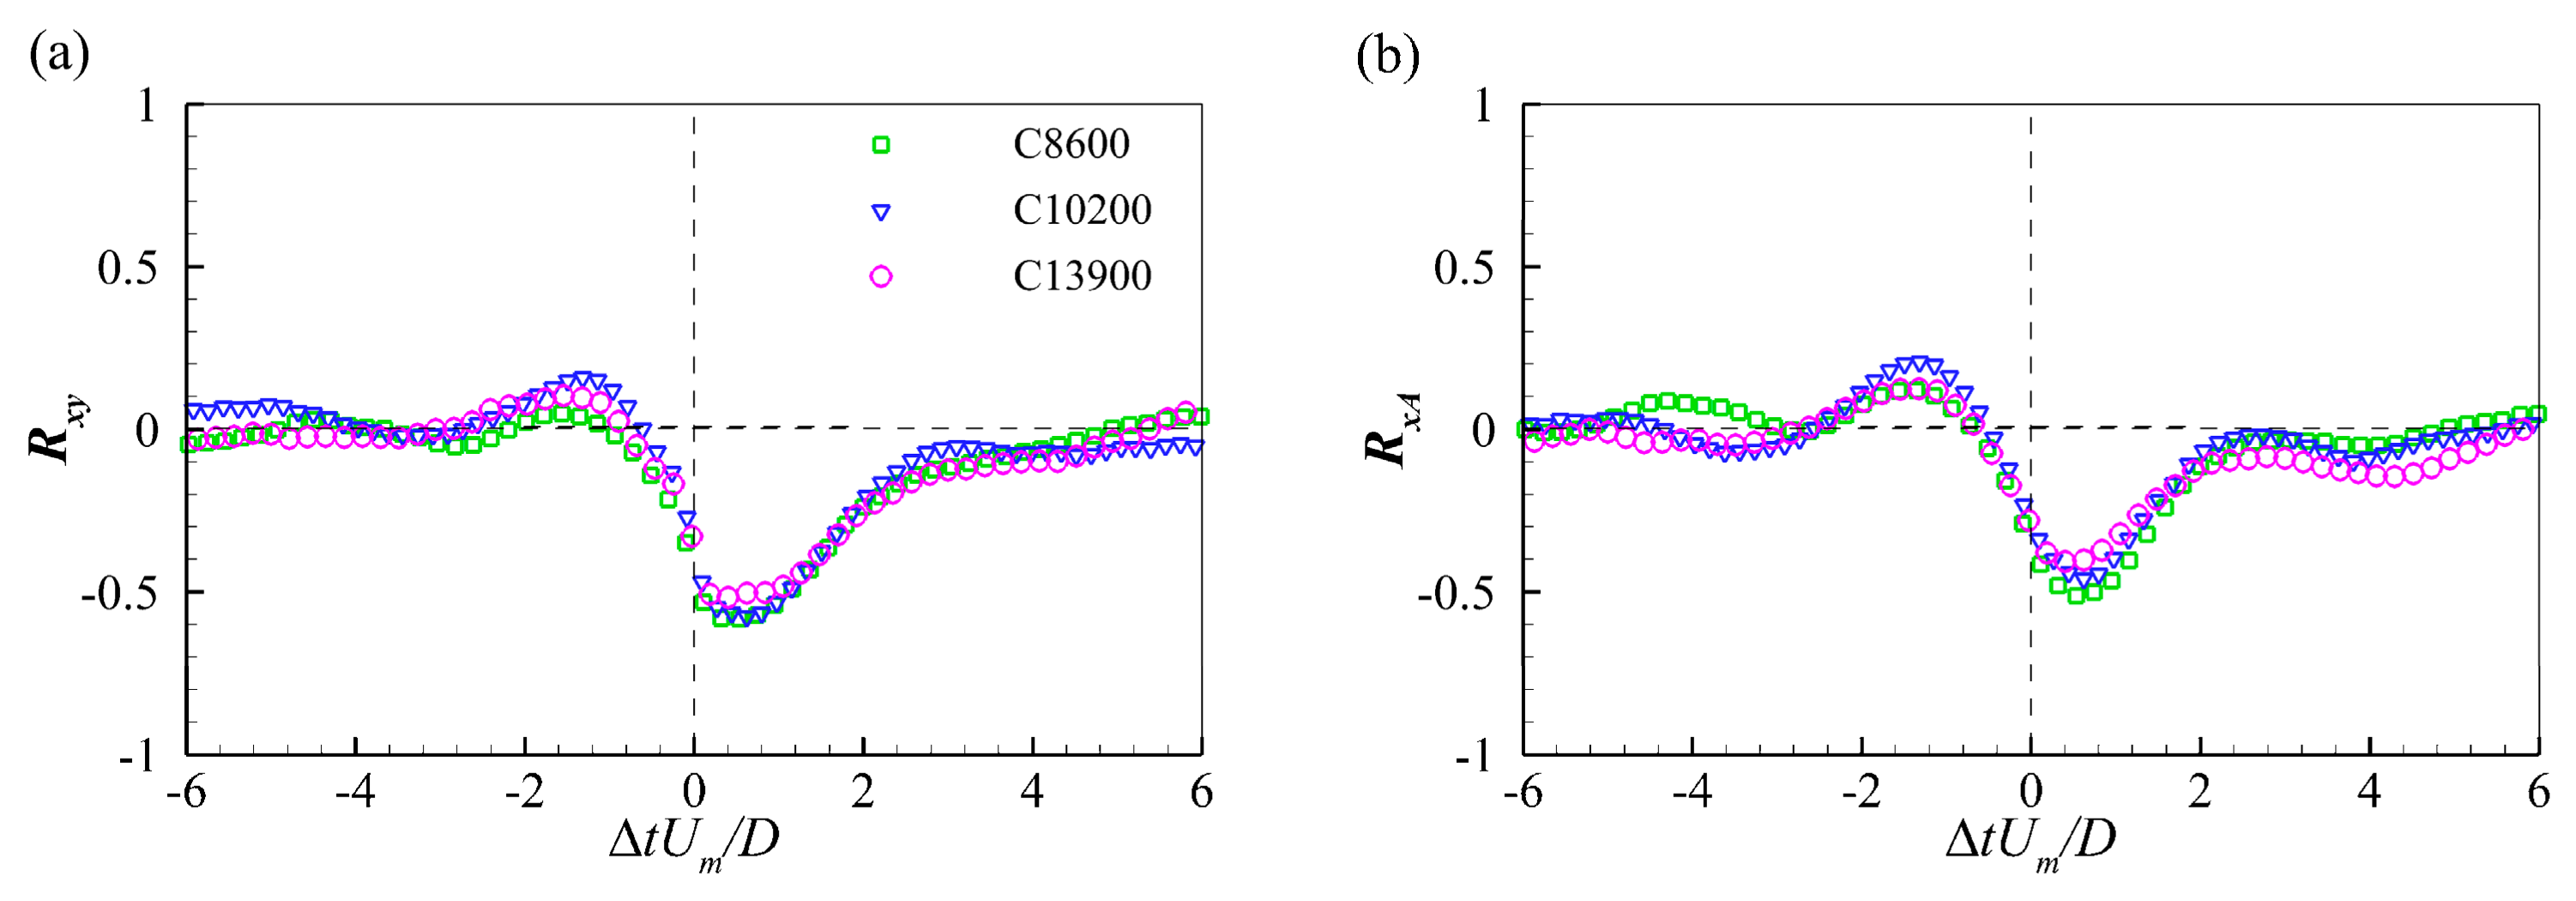
During their lifetimes, the PHVs undergo oscillations in both the streamwise and vertical directions. Meanwhile, the core size of PHVs was observed to change with their streamwise position. Figure 8 presents the temporal cross-correlation functions of the streamwise position and the vertical position, Rxy, and of the streamwise position and the core area, RxA. In Figure 8a, the correlation function, Rxy, exhibits a distinct negative peak on the right-hand side of the origin. It means that the PHV tends to approach the bed while moving toward the cylinder and the opposite is true. This movement trend agrees with the evolution model proposed by Dargahi [14]. In Figure 8b, the correlation function, RxA, also exhibits a distinct negative peak on the right-hand side of the origin. It means that the PHV decreases in size while approaching the cylinder and the opposite is also true. The statistical result supports the observations by Dargahi [14], Kirkil and Constantinescu [17], and Li et al. [19] in instantaneous velocity fields. The positions of the peaks indicate that the variations in vertical position and core size occur slightly later than the corresponding variation in streamwise position. Therefore, it is conjectured that the streamwise movement induces the variations in the vertical position and size of the PHV.
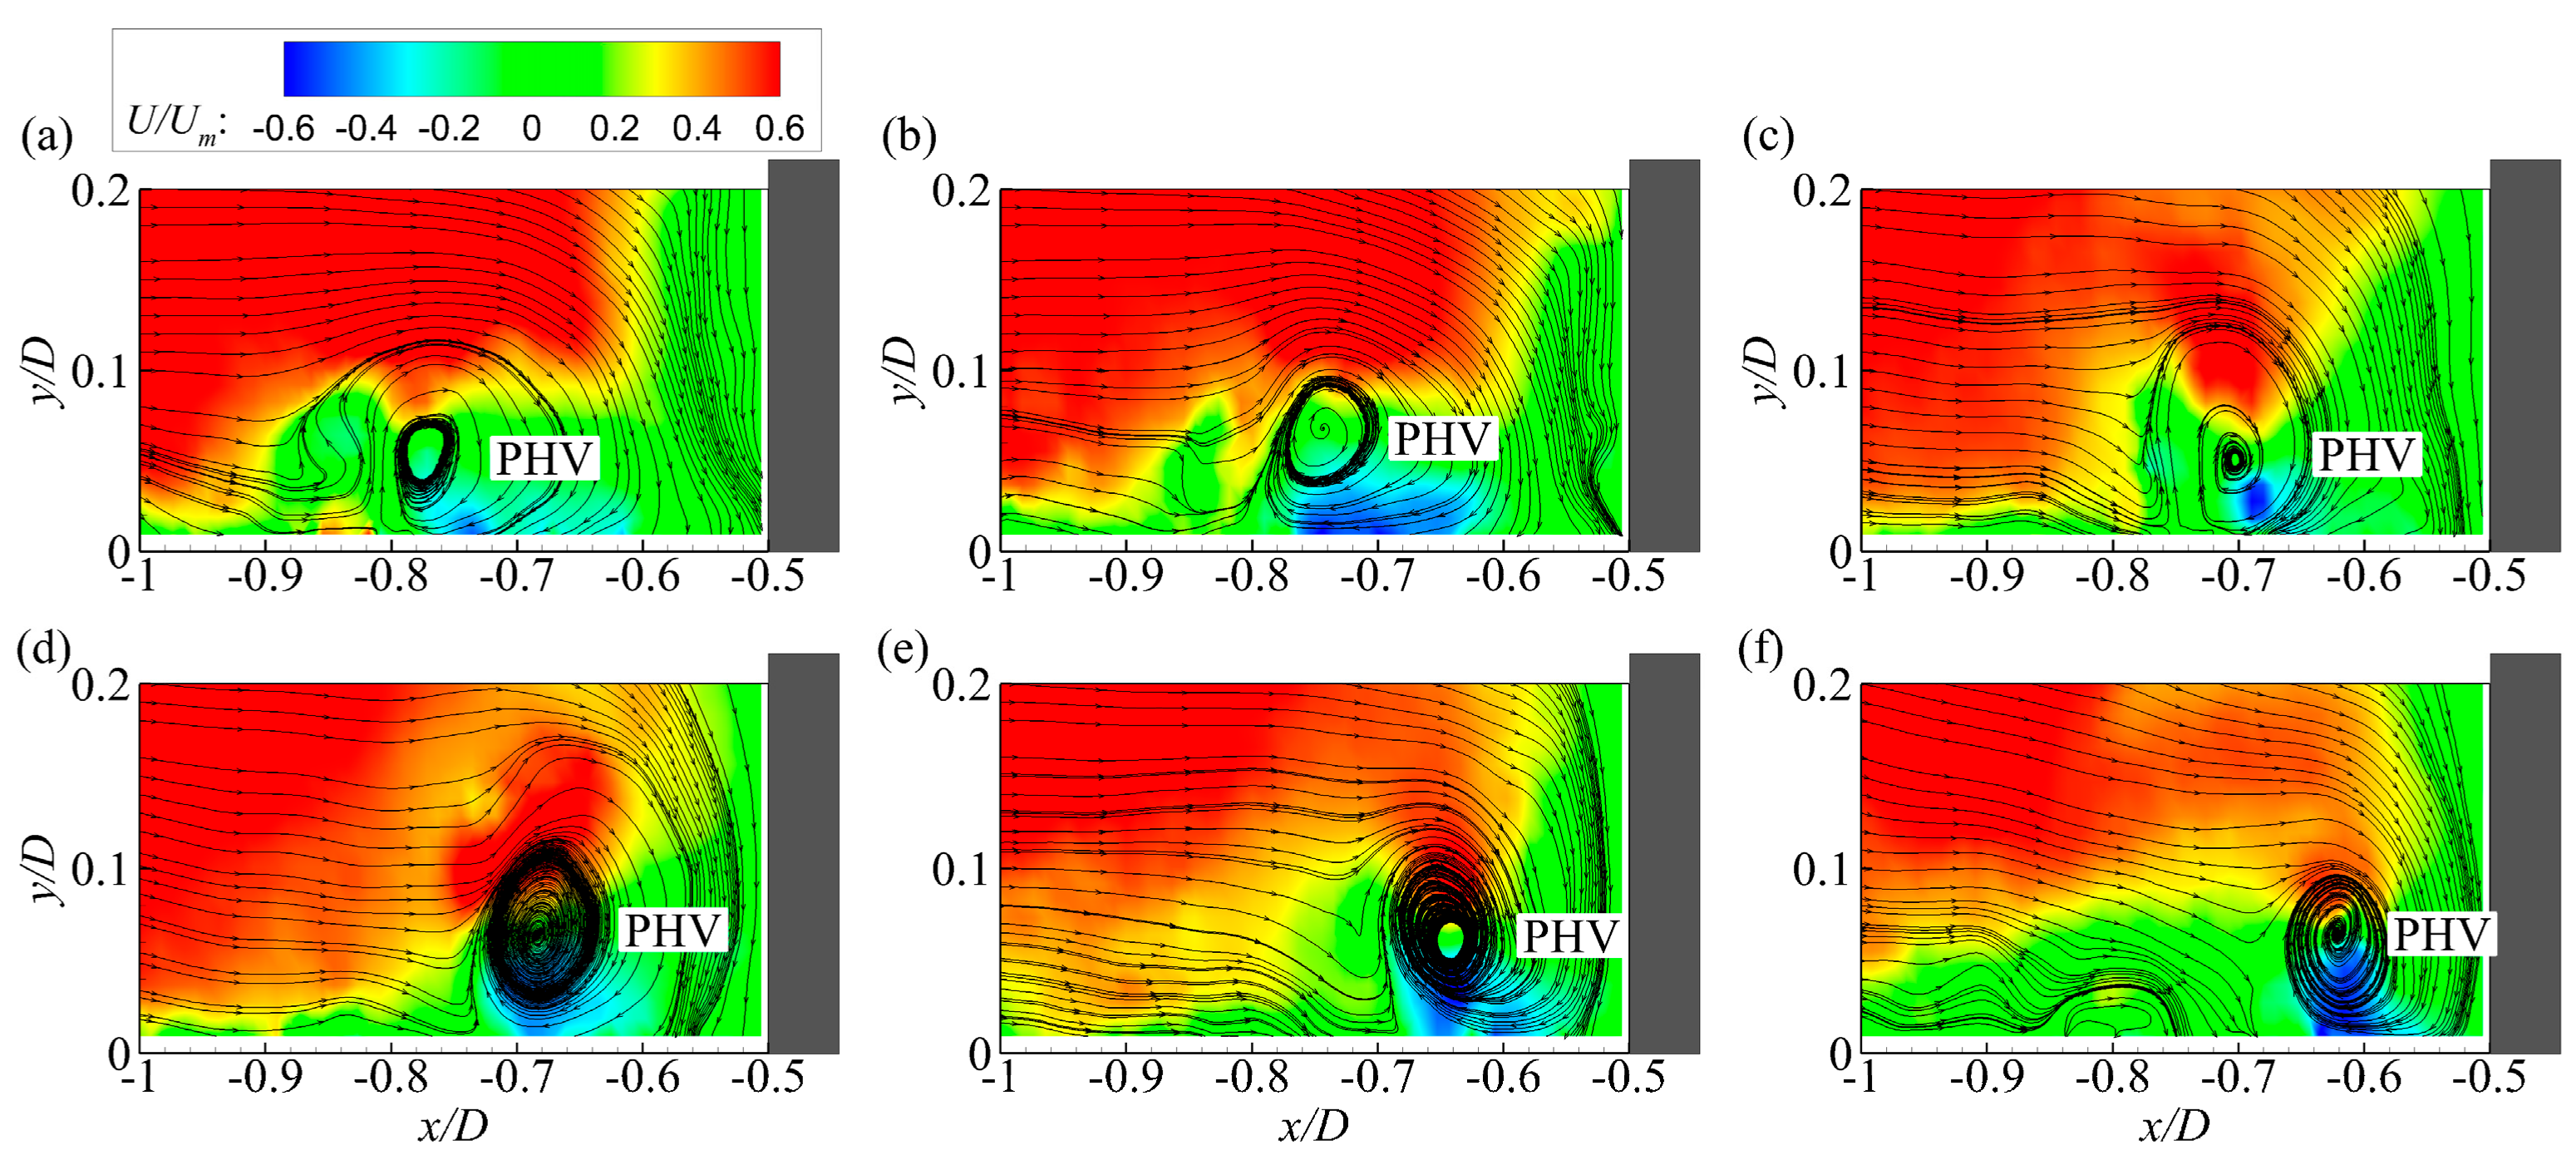
The mechanism for the streamwise oscillation is complicated. However, observations of instantaneous velocity fields indicate that the large-amplitude streamwise movements relate tightly with the incoming flow. Figure 9 presents the downstream movement of a PHV during a time interval of about 1.6D/Um. Both streamlines and contours of the instantaneous streamwise velocity are plotted for better interpretation. At the beginning of this process, the PHV locates at about x/D = −0.78 in Figure 9a. Then it moves unidirectionally downstream toward the cylinder in Figure 9b–e. In Figure 9f, the PHV arrives at about x/D = −0.61 and dissipates quickly.
One notable observation is that the forward movement of the PHV is accompanied by an inrush of high-momentum fluid from the incoming flow down to the bed upstream of it. The downwards inclined streamlines and the relatively large streamwise velocity upstream of the PHV in Figure 9 indicate clearly such an inrush structure. The inrush fluid penetrates the near-wall separation region and pushes the PHV forward to the cylinder.
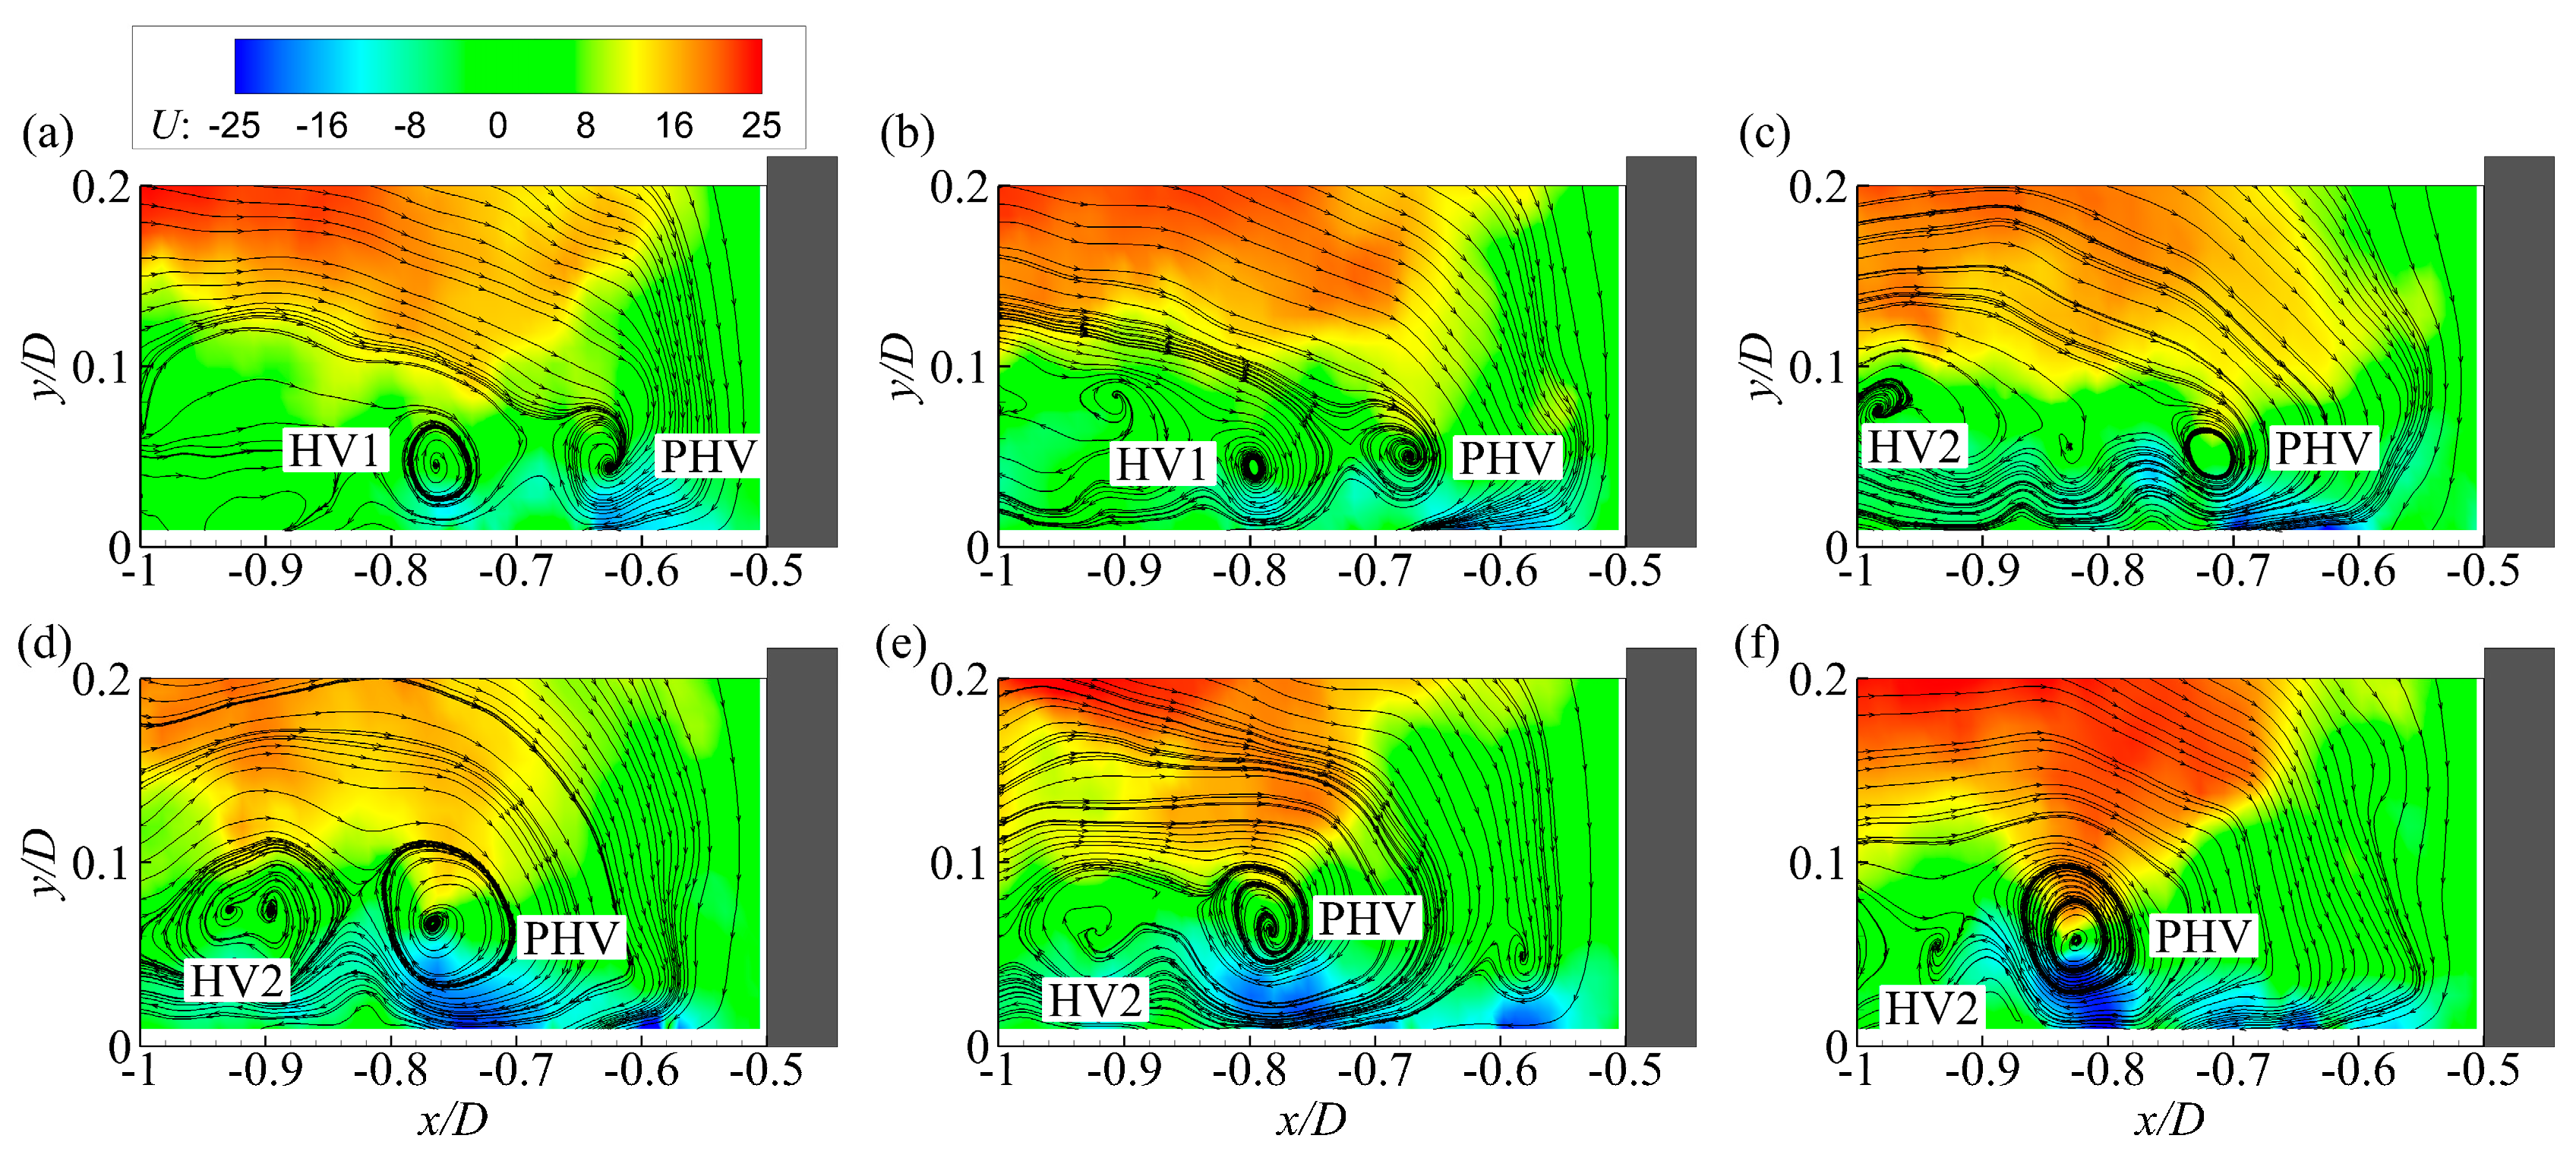
Compared to the downstream movements, the large-amplitude upstream movements of PHVs are less frequently observed. Figure 10 presents the upstream movement of a PHV during a time interval of about 1.75D/Um. In Figure 10a, the HV system contains a relatively weak PHV at about x/D = −0.62 and a stronger HV (HV1) at about x/D = −0.77. Then the PHV moves gradually upstream and arrives at x/D = −0.83 in Figure 10f. During the movement process, another HV (HV2) is shedding from the separation region in Figure 10c,d. However, due to the obstacle of the secondary vortex upstream of the PHV, vortices HV1 and HV2 fail to merge with the PHV before their disappearances. The engine of the upstream movement is hard to be recognized. However, two exclusive features are observed during the movement. Firstly, no inrush of high-momentum fluid from the incoming flow down to the bed upstream of the PHV is observed. Secondly, the PHV is fed vertically by a patch of high-momentum fluid from the incoming flow above it. However, such a feed is unnecessary for PHVs undergoing downstream movements.
The influence of the incoming flow on the streamwise movements of the PHV was firstly reported by Agui and Andreopoulos [15]. They found the streamwise oscillation of the PHV is forced by large scale structures originating in the incoming flow.
Later, Praisner and Smith [27] observed in their flow visualization and PIV measurement results that the erupting of counter-rotating secondary vortex upstream of the PHV is followed by an inrush of fluid from the incoming flow. During this eruptive process, the PHV is characterized by obvious streamwise motions. On the other hand, Apsilidis et al. [12] observed in their high-Reynolds-number experimental case (ReD = 123,000) that the rapid upstream motion of the PHV is originated from an influx of high-momentum fluid from the incoming boundary layer feeding it directly. Our present investigation shows that a similar mechanism exists in flows with relatively low Reynolds numbers as well. In general, it can be confidently concluded that the large-amplitude streamwise movements of the PHV are related with large-scale and high-momentum structures in the incoming flow.
The streamlines in Figure 9 and Figure 10 also show that the vertical positions of PHVs are lower when they locate closer to the cylinder. The mechanism for this trend should be the strengthening of the down-flow which pushes the PHV toward the wall while approaching the cylinder. Meanwhile, the core sizes of PHVs decrease gradually while approaching the cylinder. The decreasing in size of the PHV should be attributed to the enhanced stretching along its axis.
3.4. Strength Variation of PHV
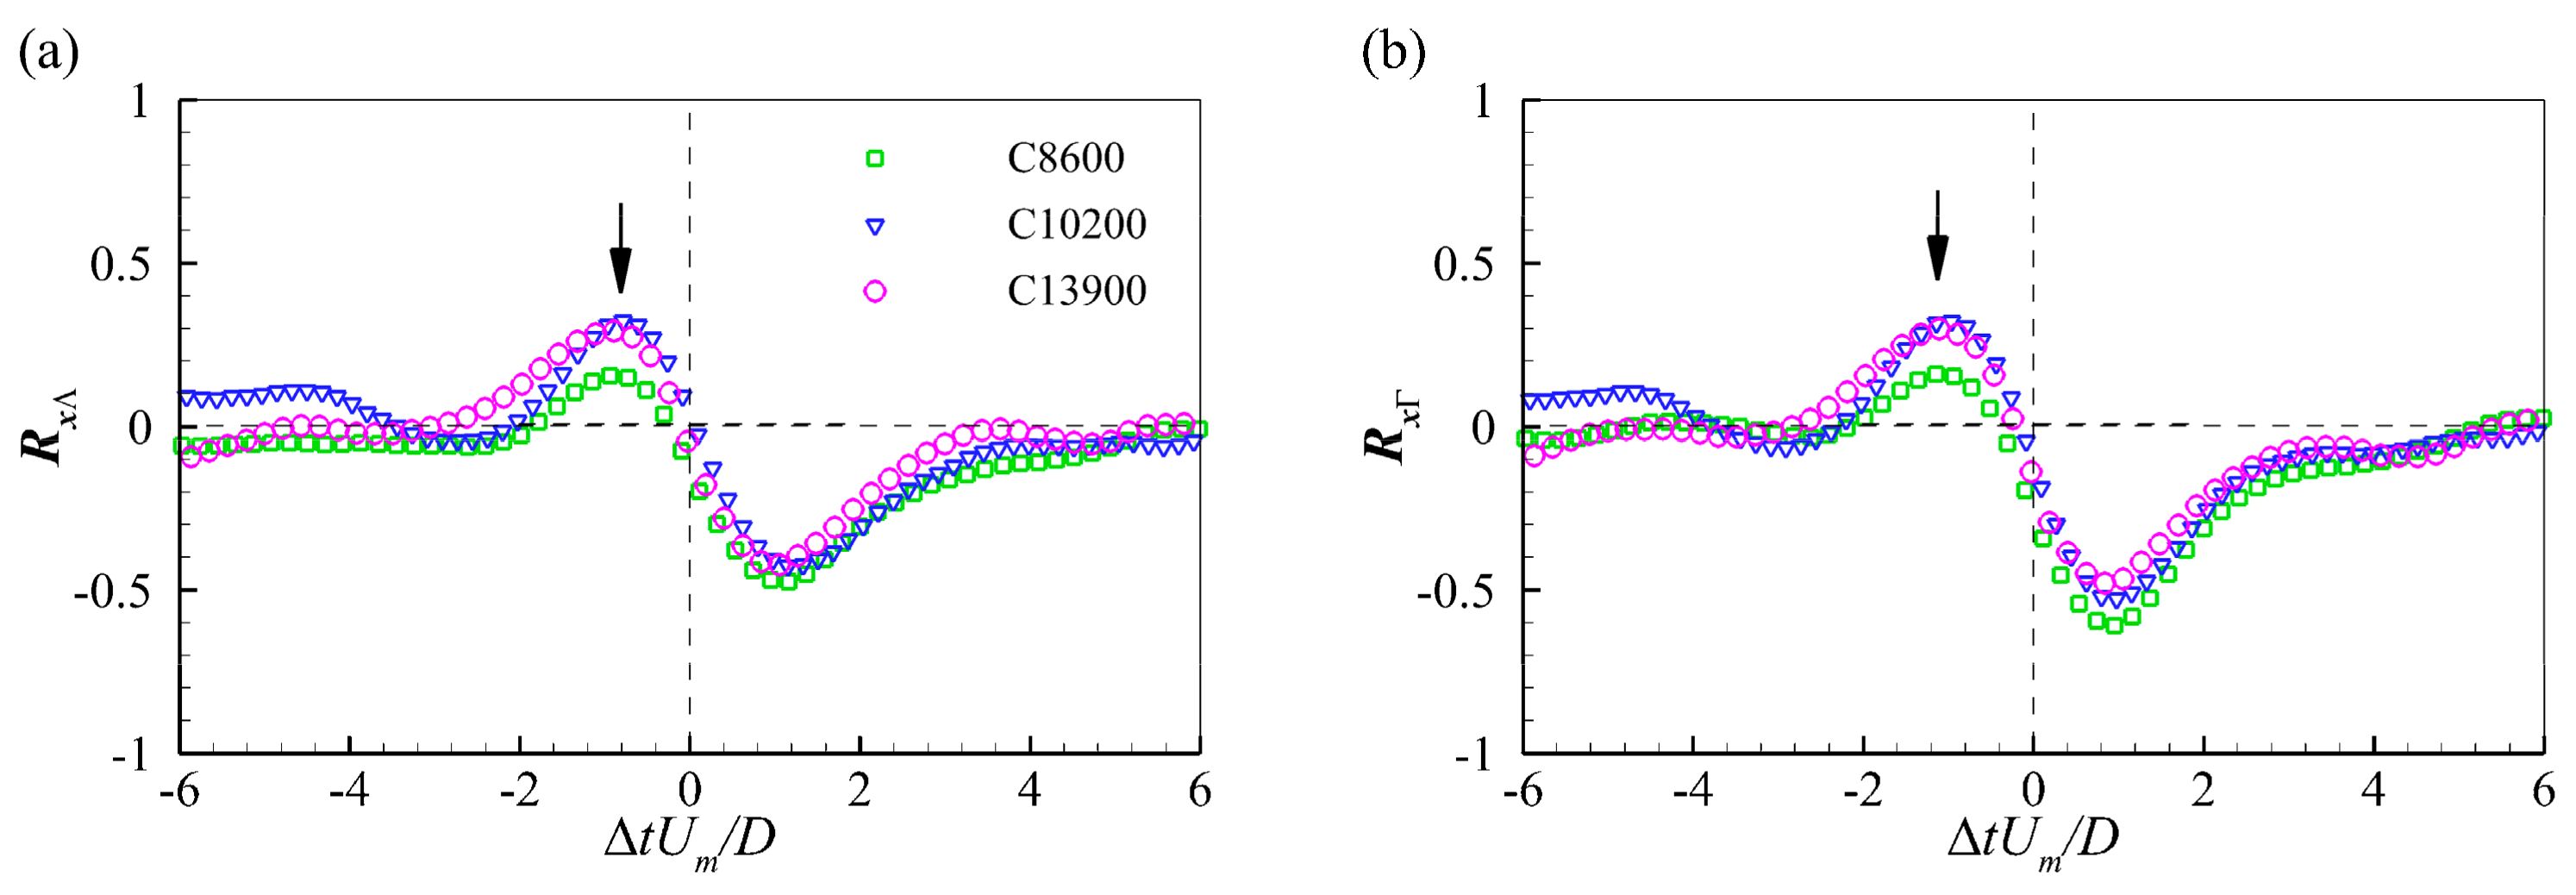
Figure 11a,b present the temporal correlation functions of the streamwise position and swirling strength, RxΛ, and of the streamwise position and circulation strength, RxΓ, respectively. Both functions contain peaks on both sides of the origin, and the correlation peaks on the right-hand side are stronger than those on the left-hand side. The bimodal correlations indicate that a PHV might undergo two different variation trends in strength with the variation of streamwise position. Therefore, conditional cross-correlation analyses between the streamwise position and swirling strength and between the streamwise position and circulation strength were conducted based on the streamwise positions of HVs. Specifically, the correlation function defined in Equation (4) was calculated separately for the instances when PHVs locate at the upstream and downstream of their time-averaged streamwise position, xvavg. The region downstream of the time-averaged streamwise position is termed the near-cylinder region hereafter.
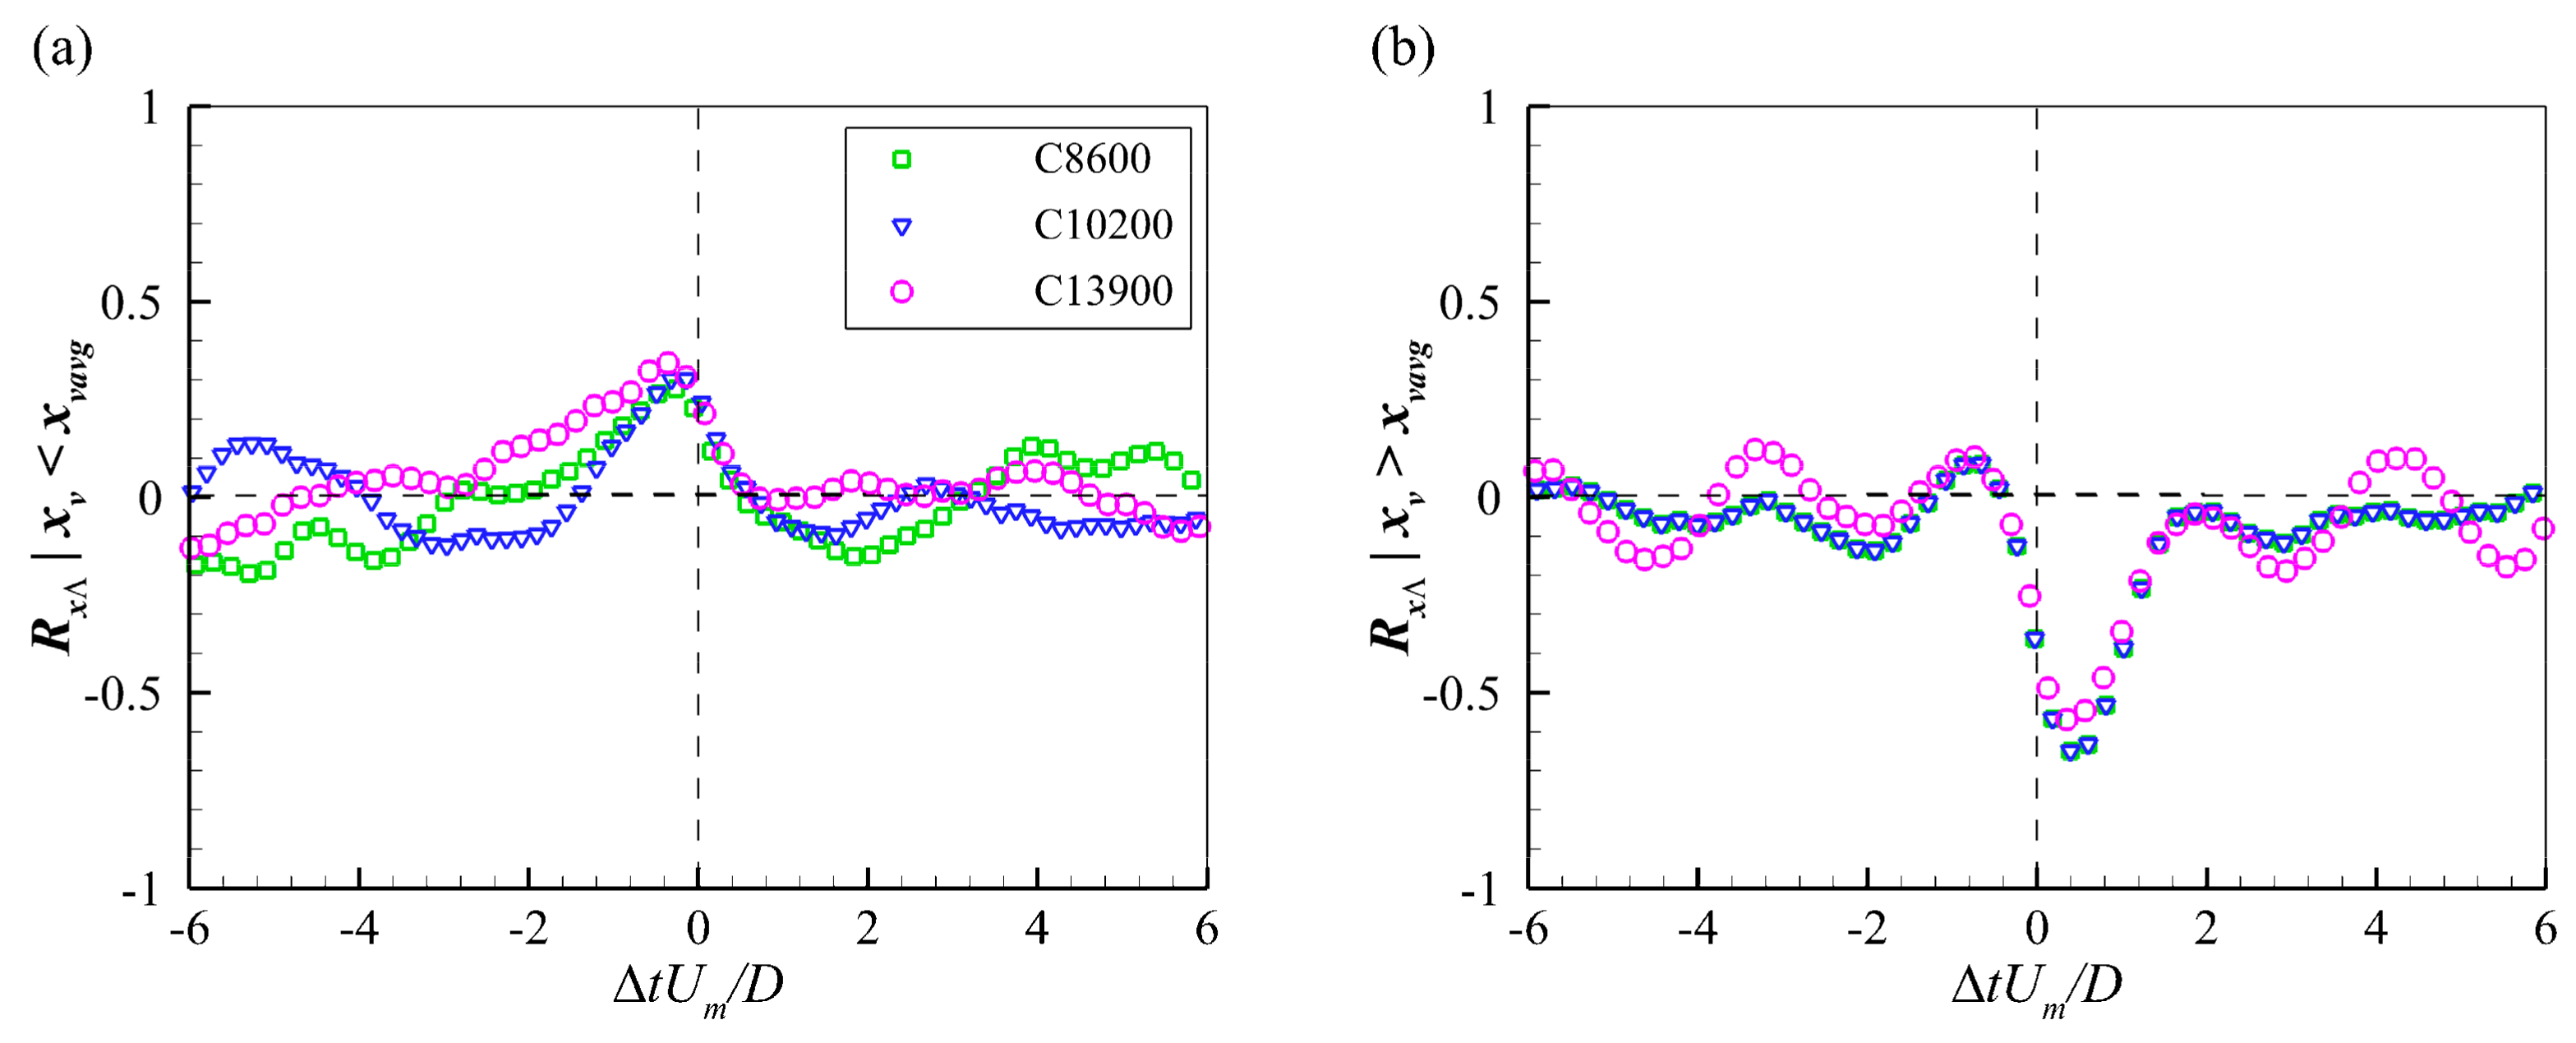
Figure 12 shows the conditional cross-correlation functions between the streamwise position and swirling strength of PHVs. In Figure 12a, the correlation functions exhibit a weak positive peak on the left-hand side of the origin. It implies that for PHVs locating upstream of the time-averaged position, increasing in coherence is necessary, at least partly, for their downstream movements. On the other hand, typical negative peaks are observed on the right-hand side of the origin in Figure 12b. It suggests that for PHVs locating in the near cylinder region, the downstream movements cause PHVs to lose coherence. The magnitude difference of the peaks indicates that the change of coherence with the streamwise position is more pronounced when PHVs appear in the near-cylinder region.
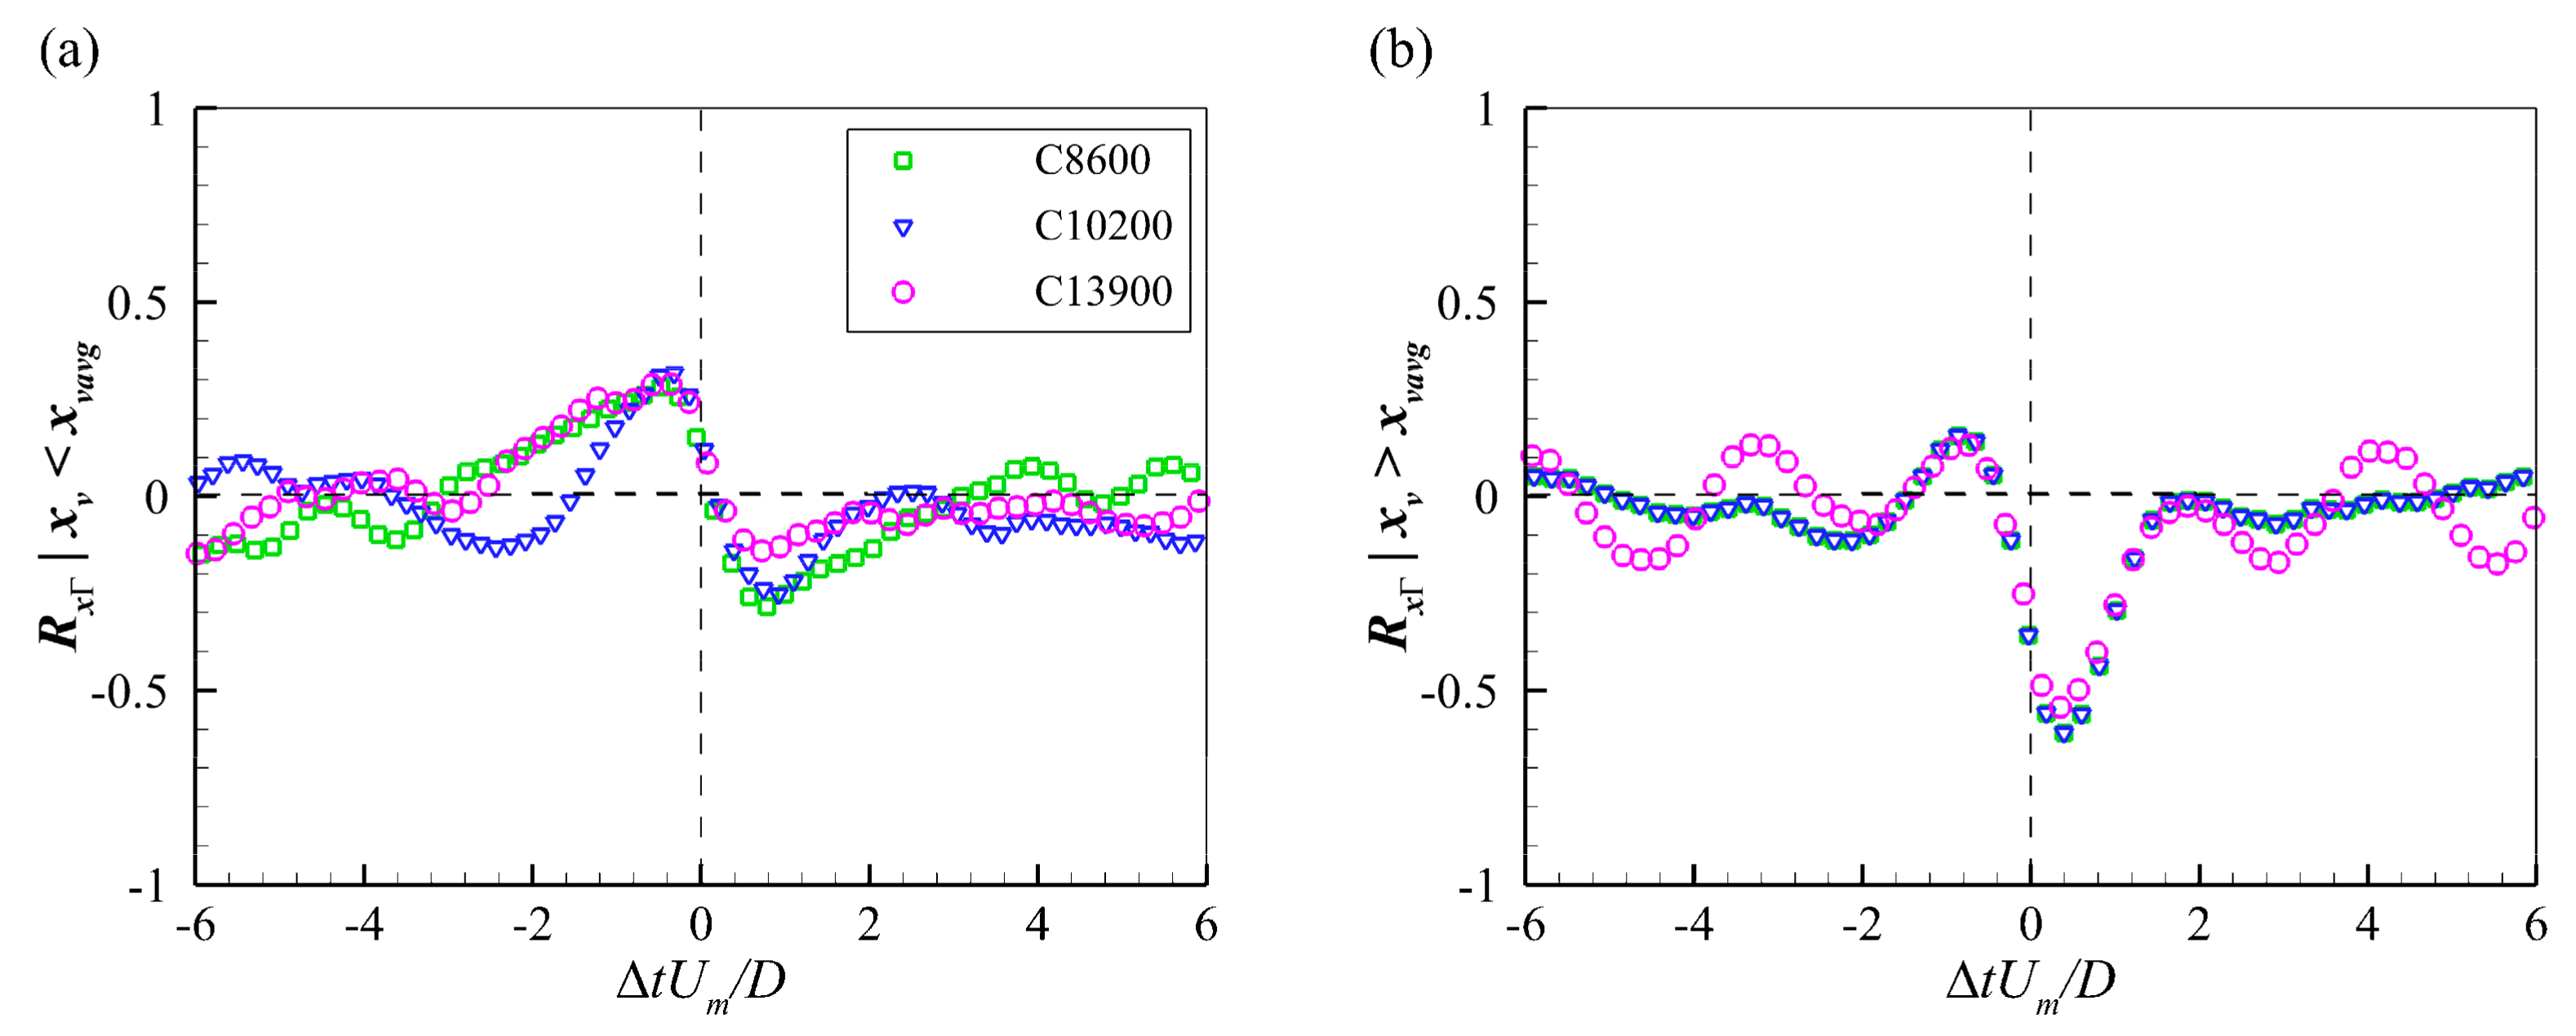
Figure 13 presents the conditional cross-correlation functions between the streamwise position and circulation strength of PHVs. In Figure 13a, the peaks on both sides of the origin are comparable, indicating no dominant variation trend of the circulation strength with the streamwise position. This is reasonable, as the coherence and size of PHVs vary differently with the changing of the streamwise position in the region upstream of the time-averaged stream position. On the other hand, typical negative peaks are observed on the right-hand side of the origin in Figure 13b, indicating the weakening of PHVs while they move downstream in the near-cylinder region. Such a tendency agrees with the results that both the size and coherence of PHVs decrease when they are moving downstream in the near-cylinder region. Meanwhile, the statistical results support the evolution model proposed by Dargahi [14] and the observations of Li et al. [19].
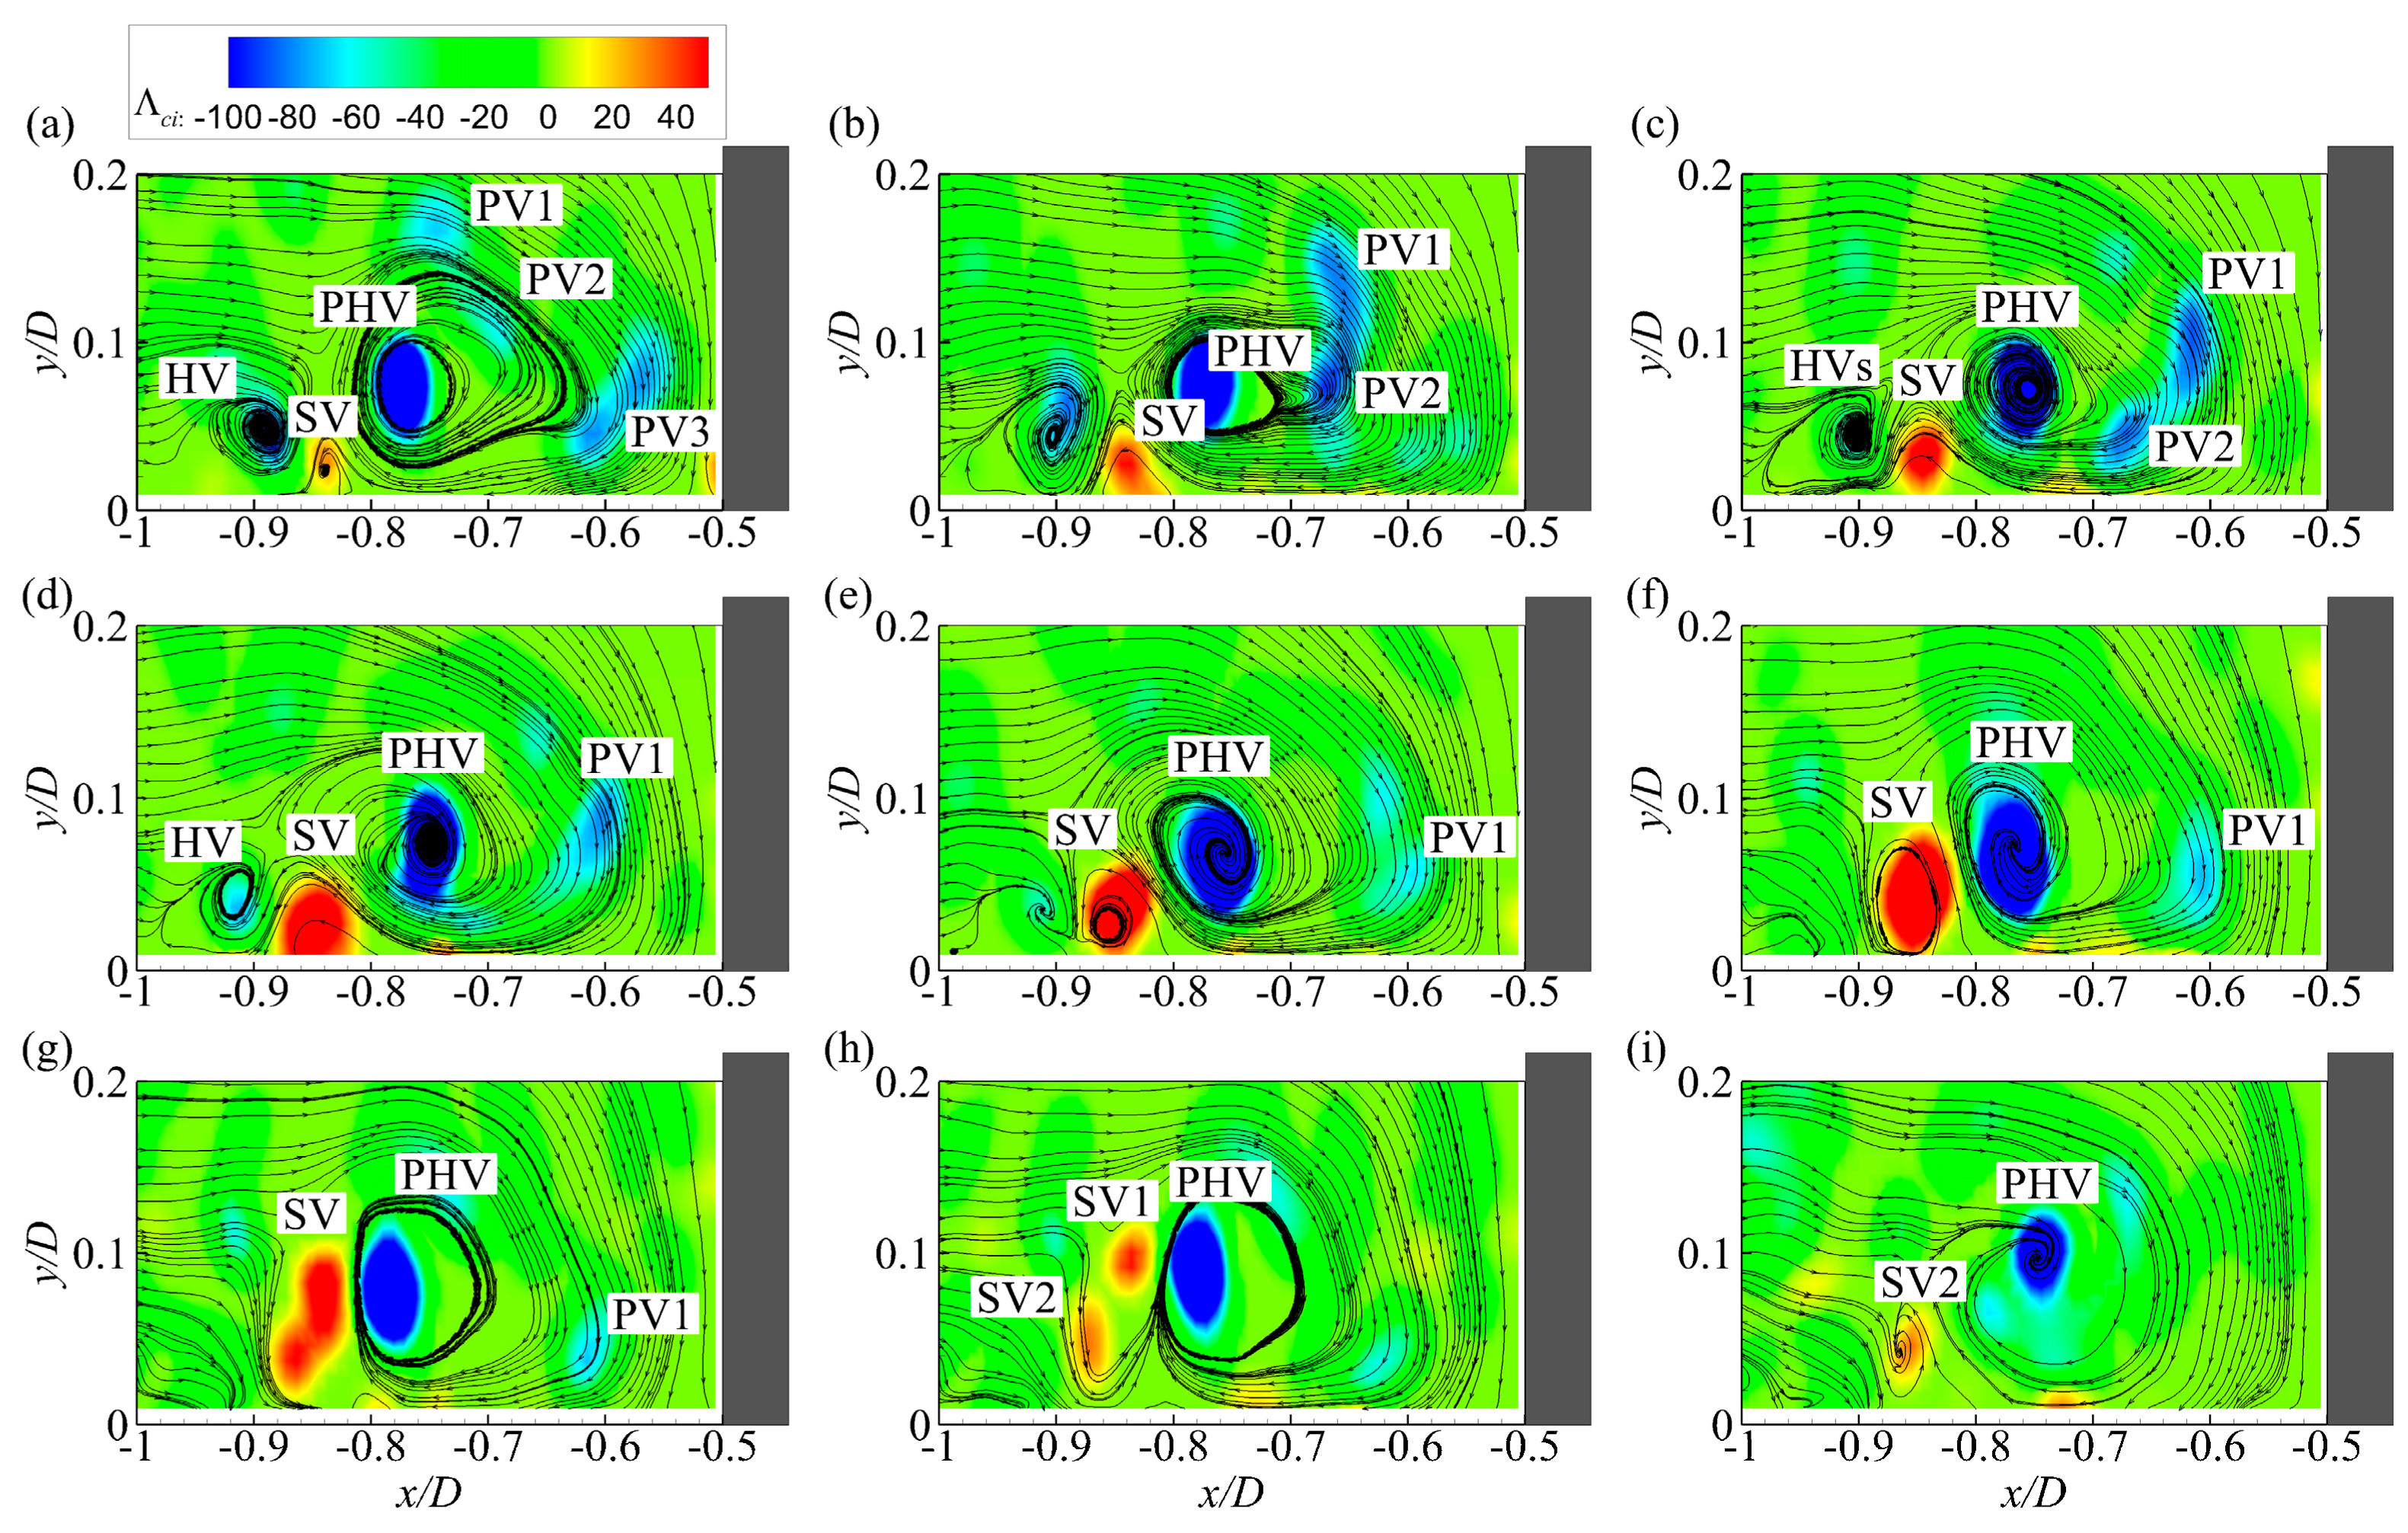
The mutual interactions between the PHV and other vortices are found to be one of the major mechanisms responsible for its variation in strength. The sequence of instantaneous velocity fields in Figure 14 shows typical examples of such interactions. In Figure 14a, the turbulent HV system consists of a PHV, an upstream HV (HV1), and a wall-attached secondary vortex (SC) with opposite rotation sense between the two HVs. Meanwhile, several prograde vortices (PV1, PV2, and PV3) are convected toward the junction region by the incoming flow and the down-flow in front of the cylinder. These prograde vortices are engulfed partly or entirely by the PHV in Figure 14b–d, causing the PHV to become larger and stronger. At the same time, the secondary vortex (SC) grows and strengthens gradually. Finally, it is lifted off the wall in Figure 14f and interacts with the PHV, causing the PHV becoming smaller and weaker.
Except for the wall-attached secondary vortex, video animations show that the PHV also interacts with retrograde vortices originating in the incoming flow and the down-flow.
The merging of the PHV with other co-rotating vortices has been widely reported in previous research [12,14,15,16,17,18,19]. However, one notable observation is that with the increasing of Reynolds number, more vortices being engulfed by the PHV are originating in the incoming flow and the down-flow instead of in the separation region. One observed mechanism is that the HVs shedding from the separation region become relatively weaker than the counter-rotating secondary vortex appearing upstream of the PHV with the increasing of Reynolds number. Accordingly, it becomes more difficult for the HVs to overcome the interactions with the secondary vortex in flows with higher Reynolds number. Therefore, the secondary vortex works like a barrier and prevents the merging of these HVs with the PHV. For example, the HV that appears in Figure 14a fails to merge with the PHV until it is dissipated in Figure 14e. The experimental results of Apsilidis et al. [12] also showed a similar mechanism. Meanwhile, previous research [28] has shown that the population of prograde vortices in the incoming turbulent open channel flow changes with the Reynolds number. Therefore, the evolution and dynamics of the turbulent HV system are anticipated to be influenced by the Reynolds number, as indicated by previous investigations [12,17]. Another noteworthy feature presented in Figure 14e–h is that the turbulent HV system is at the zero-flow mode when the secondary vortex is lifted off the wall. This feature agrees well with previous research on the multi-mode dynamics of the turbulent HV system [10,11,12,13]. However, two findings different from previous suggestions in the literature on the back-flow mode can be read out in these figures. Firstly, the zero-flow mode does not have preferential locations. It can take place at locations far away from the cylinder. Similar conclusions were also given recently by Apsilidis et al. [12] and Chen et al. [13]. Secondly, the PHV does not always retreat downstream toward the cylinder during the interaction with the lifted secondary vortex, as is observed by Paik et al. [10] and Escauriaza and Sotiropoulos [11]. As an example, the streamwise position of the PHV in Figure 14 is nearly unchanged during the whole interaction process.
In addition to the interactions with counter-rotating vortices, interaction with the bed plays an important role in the weakening processes of PHVs. As indicated in Figure 8a, PHVs get closer to the bed while moving downstream.
The shortening in distance intensifies the interactions between the PHV and the bed, causing the weakening of the PHV. Therefore, for PHVs locating in the near-cylinder region, losing strength is due to the dominance of interactions with counter-rotating vortices and the bed when they approach closer to the cylinder.
3.5. Disappearance of PHV
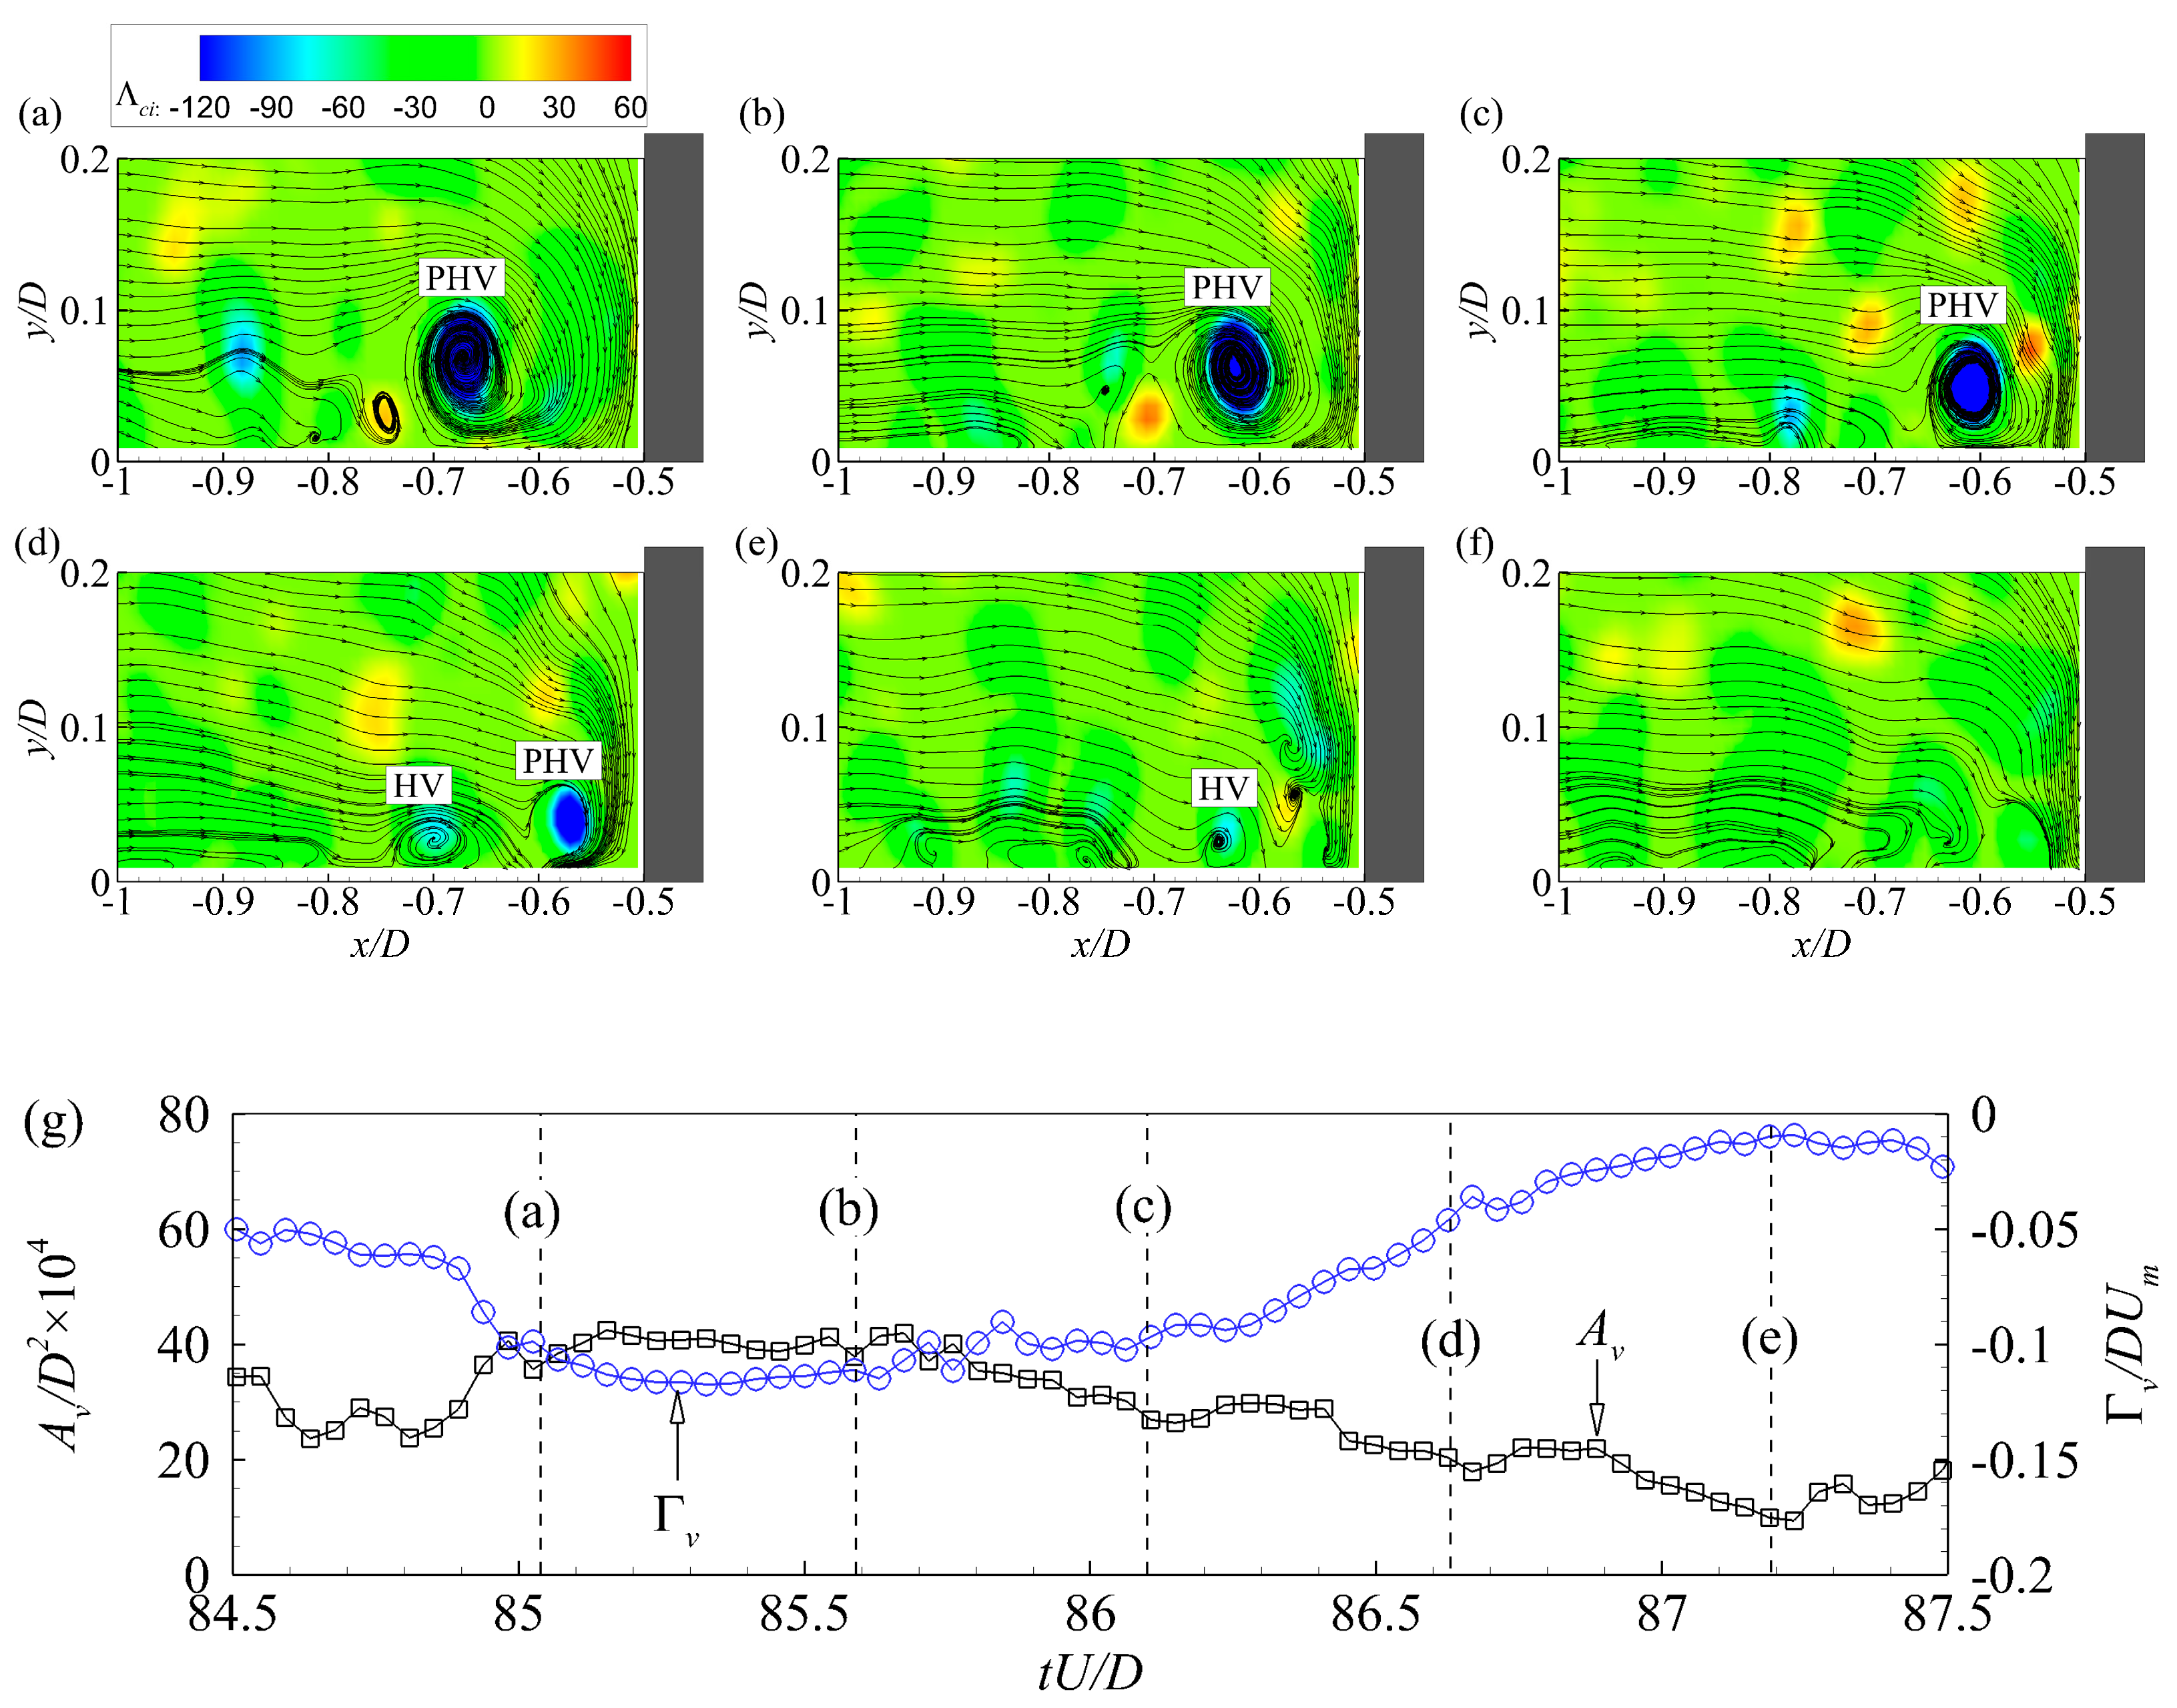
Due to the enhanced stretching and bed interaction, PHVs become smaller and weaker while approaching the cylinder. Therefore, the disappearances of PHVs are observed to take place mainly in the near-cylinder region. Figure 15a–f presents a process by which a PHV disappears, and Figure 15g shows the variations of the strength and size of the PHV during this process. In Figure 15a, the PHV locates at about x/D = −0.68. Then it moves gradually toward the cylinder through Figure 15b–d. The time histories of the circulation strength and core area of the PHV indicate that its strength and size decrease significantly during the forward moving process. In Figure 15d, a weak HV generates in the separation region upstream of the PHV. However, the PHV fails to merge with this vortex and dissipates continually until its disappearance in Figure 15e.
Several other mechanisms for the disappearance of the PHV were also reported in previous research. Paik et al. [10] found that after being ground up by hairpin vortices originating underneath it, the remnant of the PHV retreats downstream closer to the cylinder and is dissipated here. Apsilidis et al. [12] observed that the disappearance of the PHV is preceded by the collision of it with a fluid patch originating from the down-flow. Even though the proposed mechanisms for it show some differences, all observations agree the disappearance of the PHV mainly occurs in the region very close to the cylinder surface.
The turbulent HV system triggers the local scour process in front of vertical piers on a flat loose bed by significantly amplifying the bed shear stress in this region [6,8,14]. The amplification of the bed shear stress is tightly related to the vertical position, size, and strength of the HVs as its magnitude is determined directly by the wall-normal gradient of the streamwise velocity, ∂U/∂y, induced by the HVs at the bed surface. The present investigation shows that the vertical position, size, and strength of the PHV vary regularly with its streamwise position. These change trends are valuable for understanding and predicting the spatial distribution of the bed shear stress in front of the cylinder. For instance, when other features of a PHV remain unchanged, the downward movement and the weakening in circulation strength result in an increase and decrease in the bed shear stress, respectively. Therefore, the peak value of the time-averaged bed shear stress is anticipated to occur around the time-averaged streamwise position of PHVs, as has been reported in previous investigations [5]. Meanwhile, both the present and many existing investigations indicate that the evolution of turbulent HV system is strongly influenced by structures in the incoming flow and the down-flow. The underlying mechanisms provide possible ways of controlling the local scour around piers indirectly through manipulating the coherent structures in the incoming flow and the down-flow. Nevertheless, due to the relatively low cylinder Reynolds number of flows investigated here, experiments with much higher cylinder Reynolds number are needed for completing our understanding on the evolution of turbulent HV system in practical flows.
4. Conclusions
The evolution of the turbulent HV system around a circular cylinder mounted on the flat bed of an open channel was investigated quantitatively and statistically with time-resolve PIV measurements. The cylinder Reynolds numbers of the flows were 8600, 10.600, and 13.600, respectively. Among vortices comprising the turbulent HV system, the PHV was selected as the representative vortex, and was tracked continuously in successive velocity fields with a novel method to obtain the time histories of its position, size, coherence, and circulation strength. These histories were cross-correlated to investigate the evolution trends of the PHV. Meanwhile, mechanisms underlying the evolutionary process of the turbulent HV system were re-investigated and enriched by using the time-resolved instantaneous velocity fields.
The PHV undergoes a complete evolutionary process composed of generation, life, and disappearance stages. The generation of the PHV originates either from the growth of a HV shedding from the separation region or the merging of several vortices from the incoming flow or the down-flow. The dissipation of the PHV takes place mainly in the region very close to the cylinder due to the enhanced interactions with counter-rotating vortices and the bed. The mean lifespan of the PHV is estimated to be about 5.0D/Um. During its lifetime, the PHV undergoes large-amplitude streamwise oscillation due to the action of large-scale and high-momentum structures from the incoming flow. Meanwhile, the size and strength of the PHV varies dramatically due to frequent interactions with vortices and the bed. The interaction of the PHV with secondary vortices lifted off the wall is responsible for triggering the zero-flow mode. However, such interactions neither have preferential locations nor always result in the downstream movement of the PHV. These mechanisms imply that the evolution of the turbulent HV can be controlled indirectly through manipulating coherent structures in the incoming flow and the down-flow.
The statistical relationships between the features of the PHV during its evolutionary process were obtained. When a PHV moves downstream from the separation region toward the cylinder, it approaches the bed and decreases in size. Its coherence first increases slightly and then decreases quickly. Consequently, the circulation strength of the PHV shows no tendency variation and decreases dramatically in the region upstream and downstream of its time-averaged position, respectively. The opposite is true when the PHV moves upstream from the region very close to the cylinder. The change trends of the vertical position, size, and circulation strength can correctly interpret and predict the spatial distribution of the time-averaged bed shear stress in front of a vertical cylinder.
Author Contributions
Q.C. conducted the experiment, proposed the methods, and wrote the initial paper. Q.C. and Z.Y. completed the data analysis; H.W. helped with review and editing of the manuscript.
Funding
This research was funded by the Fundamental Research Funds for the Central Universities (2016RC033) and the National Natural Science Foundation of China (51609002).
Acknowledgments
The authors thank Danxun Li and Qiang Zhong for their constructive suggestions for preparing the paper.
Conflicts of Interest
The authors declare no conflict of interest.
References
- Ettema, R.; Constantinescu, G.; Melville, B.W. Flow-Field Complexity and Design Estimation of Pier-Scour Depth: Sixty Years since Laursen and Toch. J. Hydraul. Eng. 2017, 143, 03117006. [Google Scholar] [CrossRef]
- Heidari, M.; Balachandar, R.; Roussinova, V.; Barron, R.M. Characteristics of flow past a slender, emergent cylinder in shallow open channels. Phy. Fluids 2017, 29, 065111. [Google Scholar] [CrossRef]
- Ouro, P.; Wilson, C.A.M.E.; Evans, P.; Angeloudis, A. Large-eddy simulation of shallow turbulent wakes behind a conical island. Phy. Fluids 2017, 29, 126601. [Google Scholar] [CrossRef]
- Simpson, R.L. Junction flows. Annu Rev. Fluid Mech. 2001, 33, 415–443. [Google Scholar] [CrossRef]
- Roulund, A.; Sumer, B.M.; Fredsoe, J.; Michelsen, J. Numerical and experimental investigation of flow and scour around a circular pile. J. Fluid Mech. 2005, 534, 351–401. [Google Scholar] [CrossRef]
- Baker, C.J. The turbulent horseshoe vortex. J. Wind Eng. Ind. Aerod. 1980, 6, 9–23. [Google Scholar] [CrossRef]
- Wei, Q.D.; Chen, G.; Du, X.D. An experimental study on the structure of juncture flows. J. Visual. 2001, 3, 341–348. [Google Scholar] [CrossRef]
- Théberge, M.-A.; Ekmekci, A. Effects of an upstream triangular plate on the wing-body junction flow. Phy. Fluids 2017, 29, 097105. [Google Scholar] [CrossRef]
- Devenport, W.J.; Simpson, R.L. Time-dependent and time-averaged turbulence structure near the nose of a wing-body junction. J. Fluid Mech. 1990, 210, 23–55. [Google Scholar] [CrossRef]
- Paik, J.; Escauriaza, C.; Sotiropoulos, F. On the bimodal dynamics of the turbulent horseshoe vortex system in a wing-body junction. Phy. Fluids 2007, 19, 045107. [Google Scholar] [CrossRef]
- Escauriaza, C.; Sotiropoulos, F. Reynolds Number Effects on the Coherent Dynamics of the Turbulent Horseshoe Vortex System. Flow Turbul. Combust. 2011, 86, 231–262. [Google Scholar] [CrossRef]
- Apsilidis, N.; Diplas, P.; Dancey, C.L.; Bouratsis, P. Time-resolved flow dynamics and Reynolds number effects at a wall–cylinder junction. J. Fluid Mech. 2015, 776, 475–511. [Google Scholar] [CrossRef]
- Chen, Q.; Qi, M.; Zhong, Q.; Li, D. Experimental study on the multimodal dynamics of the turbulent horseshoe vortex system around a circular cylinder. Phy. Fluids 2017, 29, 015106. [Google Scholar] [CrossRef]
- Dargahi, B. The turbulent flow field around a circular cylinder. Exp. Fluids 1989, 8, 1–12. [Google Scholar] [CrossRef]
- Agui, J.H.; Andreopoulos, J. Experimental investigation of a three-dimensional boundary layer flow in the vicinity of an upright wall mounted cylinder. J. Fluids Eng. 1992, 114, 566–576. [Google Scholar] [CrossRef]
- Kirkil, G.; Constantinescu, G.; Ettema, R. The horseshoe vortex system around a circular bridge pier on a flat bed. In Proceedings of the XXXIst International Association Hydraulic Research Congress, Seoul, Korea, September 2005. [Google Scholar]
- Kirkil, G.; Constantinescu, G. Effects of cylinder Reynolds number on the turbulent horseshoe vortex system and near wake of a surface-mounted circular cylinder. Phy. Fluids 2015, 27, 075102. [Google Scholar] [CrossRef]
- Schanderl, W.; Jenssen, U.; Strobl, C.; Manhart, M. The structure and budget of turbulent kinetic energy in front of a wall-mounted cylinder. J. Fluid Mech. 2017, 827, 285–321. [Google Scholar] [CrossRef]
- Li, J.; Qi, M.; Fuhrman, D.R.; Chen, Q. Influence of turbulent horseshoe vortex and associated bed shear stress on sediment transport in front of a cylinder. Exp. Therm. Fluid Sci. 2018, 97, 444–457. [Google Scholar] [CrossRef]
- Perry, A.E.; Chong, M.S. A Description of Eddying Motions and Flow Patterns using Critical-Point Concepts. Annu. Rev. Fluid Mech. 1987, 19, 125–155. [Google Scholar] [CrossRef]
- Zhou, J.; Adrian, R.J.; Balachandar, S.; Kendall, T. Mechanisms for generating coherent packets of hairpin vortices in channel flow. J. Fluid Mech. 1999, 387, 353–396. [Google Scholar] [CrossRef]
- Chen, Q.; Zhong, Q.; Qi, M.; Wang, X. Comparison of vortex identification criteria for planar velocity fields in wall turbulence. Phy. Fluids 2015, 27, 085101. [Google Scholar] [CrossRef]
- Carlier, J.; Stanislas, M. Experimental study of eddy structures in a turbulent boundary layer using particle image velocimetry. J. Fluid Mech. 2005, 535, 143–188. [Google Scholar] [CrossRef]
- Wu, J.-Z.; Ma, H.-Y.; Zhou, M.-D. Vorticity and Vortex Dynamics; Springer: Berlin/Heidelberg, Germany, 2006; pp. 260–263. [Google Scholar]
- Ballio, F.; Bettoni, C.; Franzetti, S. A Survey of Time-Averaged Characteristics of Laminar and Turbulent Horseshoe Vortices. J. Fluids Eng. 1998, 120, 233–242. [Google Scholar] [CrossRef]
- Kirkil, G.; Constantinescu, G. A numerical study of the laminar necklace vortex system and its effect on the wake for a circular cylinder. Phys. Fluids 2012, 24, 073602. [Google Scholar] [CrossRef]
- Praisner, T.J.; Smith, C.R. The Dynamics of the Horseshoe Vortex and Associated Endwall Heat Transfer—Part I: Temporal Behavior. J. Turbomach. 2006, 128, 747–754. [Google Scholar] [CrossRef]
- Chen, Q.; Adrian, R.J.; Zhong, Q.; Li, D.; Wang, X. Experimental study on the role of spanwise vorticity and vortex filaments in the outer region of open-channel flow. J. Hydraul. Res. 2014, 52, 476–489. [Google Scholar] [CrossRef]
Figure 1.
(a) Cross section, (b) side view, and (c) a photograph of the experimental setup.

Figure 2.
Streamlines and contours of swirling strength in an instantaneous flow field in front of the cylinder for case 8600.
Figure 2.
Streamlines and contours of swirling strength in an instantaneous flow field in front of the cylinder for case 8600.

Figure 3.
Major steps of the method for tracking a vortex in successive velocity fields.

Figure 4.
Time histories of (a) streamwise position, (b) vertical position, (c) coherence, (d) core area, and (e) circulation strength of several primary horseshoe vortices for case C13900.
Figure 4.
Time histories of (a) streamwise position, (b) vertical position, (c) coherence, (d) core area, and (e) circulation strength of several primary horseshoe vortices for case C13900.

Figure 5.
Sequence of instantaneous velocity fields illustrating the generation of a PHV for case C13900. (a) t = 0; (b) t = 0.29D/Um; (c) t = 0.58D/Um; (d) t = 0.87D/Um; (e) t = 1.13D/Um; (f) t = 1.40D/Um.
Figure 5.
Sequence of instantaneous velocity fields illustrating the generation of a PHV for case C13900. (a) t = 0; (b) t = 0.29D/Um; (c) t = 0.58D/Um; (d) t = 0.87D/Um; (e) t = 1.13D/Um; (f) t = 1.40D/Um.

Figure 6.
Sequence of instantaneous velocity fields illustrating the generation of a PHV for case C13900. (a) t = 0; (b) t = 0.40D/Um; (c) t = 0.60D/Um; (d) t = 0.81D/Um; (e) t = 1.01D/Um; (f) t = 1.22D/Um.
Figure 6.
Sequence of instantaneous velocity fields illustrating the generation of a PHV for case C13900. (a) t = 0; (b) t = 0.40D/Um; (c) t = 0.60D/Um; (d) t = 0.81D/Um; (e) t = 1.01D/Um; (f) t = 1.22D/Um.

Figure 7.
Probability density function (PDF) of the lifespan of PHVs.

Figure 8.
Correlation functions of (a) streamwise and vertical positions, (b) streamwise position and core area.
Figure 8.
Correlation functions of (a) streamwise and vertical positions, (b) streamwise position and core area.

Figure 9.
Sequence of instantaneous velocity fields illustrating the large-amplitude downstream motion of a PHV for case C13900. (a) t = 0; (b) t = 0.32D/Um; (c) t = 0.65D/Um; (d) t = 0.96D/Um; (e) t = 1.29D/Um; (f) t = 1.60D/Um.
Figure 9.
Sequence of instantaneous velocity fields illustrating the large-amplitude downstream motion of a PHV for case C13900. (a) t = 0; (b) t = 0.32D/Um; (c) t = 0.65D/Um; (d) t = 0.96D/Um; (e) t = 1.29D/Um; (f) t = 1.60D/Um.

Figure 10.
Sequence of instantaneous velocity fields illustrating the large-amplitude upstream motion of a PHV for case C13900. (a) t = 0; (b) t = 0.35D/Um; (c) t = 0.70D/Um; (d) t = 1.04D/Um; (e) t = 1.75D/Um; (f) t = 2.08D/Um.
Figure 10.
Sequence of instantaneous velocity fields illustrating the large-amplitude upstream motion of a PHV for case C13900. (a) t = 0; (b) t = 0.35D/Um; (c) t = 0.70D/Um; (d) t = 1.04D/Um; (e) t = 1.75D/Um; (f) t = 2.08D/Um.

Figure 11.
Correlation functions of (a) streamwise position and swirling strength, and (b) streamwise position and circulation.
Figure 11.
Correlation functions of (a) streamwise position and swirling strength, and (b) streamwise position and circulation.

Figure 12.
Conditional correlation functions between the streamwise position and swirling strength of PHVs locating at (a) upstream and (b) downstream of their time-averaged streamwise position.
Figure 12.
Conditional correlation functions between the streamwise position and swirling strength of PHVs locating at (a) upstream and (b) downstream of their time-averaged streamwise position.

Figure 13.
Conditional correlation functions between streamwise position and circulation strength of PHVs locating at (a) upstream and (b) downstream of their time-averaged streamwise position.
Figure 13.
Conditional correlation functions between streamwise position and circulation strength of PHVs locating at (a) upstream and (b) downstream of their time-averaged streamwise position.

Figure 14.
Sequence of instantaneous velocity fields illustrating the interactions between a PHV and other vortices for case C13900. (a) t = 0; (b) t = 0.17D/Um; (c) t = 0.34D/Um; (d) t = 0.51D/Um; (e) t = 0.68D/Um; (f) t = 0.84D/Um; (g) t = 1.02D/Um; (h) t = 1.18D/Um; (i) t = 1.35D/Um.
Figure 14.
Sequence of instantaneous velocity fields illustrating the interactions between a PHV and other vortices for case C13900. (a) t = 0; (b) t = 0.17D/Um; (c) t = 0.34D/Um; (d) t = 0.51D/Um; (e) t = 0.68D/Um; (f) t = 0.84D/Um; (g) t = 1.02D/Um; (h) t = 1.18D/Um; (i) t = 1.35D/Um.

Figure 15.
(a–f) Sequence of instantaneous velocity fields illustrating a PHV dissipating in the junction region, and (g) variations of the core area and circulation strength during the dissipation process for case C13900. Each dashed line in (g) indicates the time of the flow field labelled by the letter.


Table 1.
Details of the bed and flow characteristics: S, bed slope; H, water depth; Um, bulk mean velocity; Re, Reynolds number.
Table 1.
Details of the bed and flow characteristics: S, bed slope; H, water depth; Um, bulk mean velocity; Re, Reynolds number.
| Case | S (‰) | H (cm) | Um (cm/s) | Re | ReD | Fr |
|---|---|---|---|---|---|---|
| C8600 | 0.5 | 3.0 | 22.4 | 8100 | 8600 | 0.41 |
| C10200 | 0.5 | 4.0 | 26.4 | 12,700 | 10,200 | 0.42 |
| C13900 | 1.5 | 3.5 | 36.9 | 15,200 | 13,900 | 0.63 |
ReD, cylinder Reynolds number; Fr, Froude number.
© 2019 by the authors. Licensee MDPI, Basel, Switzerland. This article is an open access article distributed under the terms and conditions of the Creative Commons Attribution (CC BY) license (http://creativecommons.org/licenses/by/4.0/).
Share and Cite
MDPI and ACS Style
Chen, Q.; Yang, Z.; Wu, H. Evolution of Turbulent Horseshoe Vortex System in Front of a Vertical Circular Cylinder in Open Channel. Water 2019, 11, 2079. https://doi.org/10.3390/w11102079
AMA Style
Chen Q, Yang Z, Wu H. Evolution of Turbulent Horseshoe Vortex System in Front of a Vertical Circular Cylinder in Open Channel. Water. 2019; 11(10):2079. https://doi.org/10.3390/w11102079
Chicago/Turabian StyleChen, Qigang, Zuolei Yang, and Haojie Wu. 2019. "Evolution of Turbulent Horseshoe Vortex System in Front of a Vertical Circular Cylinder in Open Channel" Water 11, no. 10: 2079. https://doi.org/10.3390/w11102079
Note that from the first issue of 2016, this journal uses article numbers instead of page numbers. See further details here.