Incidence of Subsidies in Residential Public Services in Mexico: The Case of the Water Sector

1
The World Bank, 1818 H street NW, Washington, DC 20433, USA
2
Johns Hopkins Bloomberg School of Public Health, 2024 E Monument St., Baltimore, MD 21205, USA
*
Author to whom correspondence should be addressed.
Water 2019, 11(10), 2078; https://doi.org/10.3390/w11102078
Submission received: 20 August 2019
/
Revised: 29 September 2019
/
Accepted: 30 September 2019
/
Published: 5 October 2019
(This article belongs to the Section Urban Water Management)
Abstract
:Access to safe water has tremendous direct and indirect impacts on poverty-related outcomes. In Mexico, economies of scale in water provision justify bulk provision of water, such that it is collectively rational to invest heavily in capital for infrastructure development. This is compounded by the fact that water utilities are highly capital-intensive. We analyze two distinct types of subsidies prevalent in the residential water sector. We exploit a household socio-economic module with detailed water services information from the 2014 National Income and Expenditure Survey in Mexico. We combined this data with a unique dataset from water operators in Mexico (PIGOO). We estimate economic (considering operating costs) and direct (considering household’s water payments) subsidies targeted to residential water tariff subsidies. Large heterogeneity in the direct subsidy incidence is found, which partly explains the distortions and wide differences in tariffs and total amount paid for water among different segments of the income distribution. The Omega Indicators (Ω), defined as the proportion of the subsidies received by the poor divided by the proportion of households in the total population in poverty, is less than one, implying that wealthy populations benefit more from water subsidies (economic and direct) than the poor.
1. Introduction
Access to safe drinking water has been recognized internationally as a basic human need. In Mexico, subsidies for residential water services are aimed at increasing coverage and achieving universal access for the poorest [1]. The rationale behind water subsidies in Mexico is to improve the social welfare of the poor by facilitating their access to and use of water services, as well as to redistribute resources to increase their ability to afford water tariffs. The arguments in favor of water subsidies are countered by two main concerns: such subsidies are frequently seen as causing resource-use inefficiencies, as well as financial weakness in service providers, all of which hamper efforts to improve and expand services [2,3,4]. Those adverse consequences have repeatedly been used to argue against charging consumers less than the cost of service. The impact of subsidies on both counts has been the subject of much controversy and discussion. At present, and in light of the Sustainable Development Goals (SDGs), the debate has gained renewed importance as governments strive to ensure access to minimal levels of such services for all citizens, while seeking to recover a larger share of the costs of service provider operations to produce the resources required to sustain service and improve quality.
This paper tackles a pressing issue that has been dragging on in Mexico for at least the last two decades—the large and growing subsidies to residential consumers in the water and sanitation sector. Moreover, it seeks to provide an overview of the subsidy incidence within the water sector in Mexico by looking at its organization, regulation, and institutions; an understanding of its tariff structure and investments in the sector, an assessment of the current subsidy system and the difficulties in assessing them, and an innovative exercise to estimate water subsidies at the residential level.
For this, the paper aims to answer four central questions:
- Are existing subsidies effective at ensuring affordability for the poorest in society?
- What is the proportion of subsidies reaching the poor?
- Do the poor tend to pay a higher/lower price than the rich for water?
- What are the key determinants of targeting performance (access and subsidy design factors)?
To answer these questions and contribute to the systematic study of subsidy incidence and targeting performance in Latin America, this paper presents a distinct analysis of two types of subsidies drawn for the residential water sector in Mexico. We perform our own analysis and estimation of subsidies using a combination of the Household Income and Expenditure National Survey (Encuesta Nacional de Ingreso y Gasto de los Hogares, ENIG) database and the Program of Indicators of Management of Operating Organizations (Programa de Indicadores de Gestión de Organismos Operadores, PIGOO) database. We estimate an economic subsidy (considering operating costs) and a direct subsidy (considering household’s water payments) targeted at residential water tariff subsidies.
Results show large heterogeneity in the direct subsidy, which partly explains the distortions and wide differences in tariffs and total amount paid for water among different segments of the income distribution. A general finding of this research is that quantity-based consumption subsidies (increasing block tariffs, IBTs) do not perform well in Mexico and are significantly regressive. The Omega Indicators (Ω) (defined as the proportion of the subsidies received by the poor, divided by the proportion of households in the total population in poverty) is less than one, implying that wealthy populations benefit more from water subsidies (economic and direct) than the poor.
The paper is organized as follows: Section 2 offers a brief literature review of the research that most influenced this study and gives a general overview of the water sector in Mexico, briefly discussing relevant topics in the institutional and tariffs structures, as well as in investment and management in the sector. Section 3 discusses the methods of the incidence analysis of water subsidies in Mexico. Section 4 introduces the results of the subsidy performance, the beneficiary incidence, and the overall impact of the subsidy. Section 5 presents an abridged discussion on the four central questions raised above and summarizes the main findings of the paper.
2. Literature Review
While consumer utility subsidies are prevalent in several sectors that provide residential public services, their effectiveness in reaching and distributing resources to the poor is the subject of much debate in the literature. Komives et al. [2] published a seminal study—"Water, Electricity, and the Poor: Who Benefits from Utility Subsidies?”—which attempted to elucidate who the real beneficiaries of utility subsides in the water and electricity sector were. In the study, they used empirical evidence on subsidy performance across a wide range of countries, among them Mexico. The study details the prevalence of consumer subsidies, provides a typology of the many variants of consumer utility subsidy found in the developing world, and presents several indicators useful in evaluating the degree to which such subsidies benefit the poor, focusing on three key concepts: beneficiary incidence, benefit incidence, and materiality. Komives et al. [2] find that achieving a full-cost recovery in water and electricity services has proved elusive even in those countries that have had the political will to pursue this goal. Subsidies are, the authors argue, likely to remain an important component of utility service pricing over the medium-term. They conclude that the pertinent policy questions thus concern how to improve the performance of utility subsidies, keep them as small as practically possible, limit the extent to which they undermine the performance of the sector, and decide when there may be other (perhaps more effective) means of achieving policy objectives.
One year later, the same authors published a paper titled “The Distributional Incidence of Residential Water and Electricity Subsidies”. In it, Komives et al. [3] state that subsidies for residential utility customers are seen as a way to help make utility service affordable for poor households and as an alternative mechanism for income redistribution. However, these arguments in favor of subsidies are opposed by serious concerns about their adverse effects on consumer behavior, utility operations, and the financial health of utilities. The authors contend that both the affordability and redistributive arguments for subsidies are based on the assumption that poor households benefit disproportionately from water and electricity subsidies by being well-targeted to the poor.
Komives et al. [3] test this assumption by examining the extent to which the poor benefit from consumption and connection subsidies for water and electricity services. After analyzing a wide range of subsidy models from around the developing world, they conclude that the most common form of utility subsidy—quantity-based subsidies delivered through the tariff structure (e.g., increasing block tariff (IBT) or volume-differentiated tariff (VDT)—are highly regressive. They also conclude that geographically-targeted or means-tested subsidies do better, and in many cases have a progressive incidence, though large numbers of poor households remain excluded. Additionally, they state that alternative forms of targeting can contribute to an improvement in targeting performance, whether they are used as the sole targeting mechanism or used in combination with quantity targeting. However, while these alternatives improve targeting, they do nothing to address the underlying access differential between the poor and non-poor. Therefore, there is a limit on the extent to which targeting performance of consumption subsidies can be improved through such approaches [3]. Moreover, they find that low levels of coverage and metering significantly limit the effectiveness of consumption subsidy schemes to reach the poor. By performing simulations, the authors suggest that connection subsidies are an appealing alternative for low coverage areas, but only if utilities have the means and motivation to extend network access to poor households and only if those households choose to connect.
With respect to the Latin American region, some works have looked at the incidence of the federal subsidies to residential public services. This body of research has found that although subsidies can be a tool to protect the poor, a large share have been absorbed by upper classes and non-residential consumers in Argentina [5], and that depending on the targeting strategy, the effectiveness of the subsidy at reaching poor households might be moderate as described by Contreras, Gomez-Lobo, and Palma [6] in Chile and Colombia [7], or even decrease the proportion of poor households receiving benefits as mentioned by Barde and Lehmann [8] for the case of Peru. For the special case of Mexico City, Morales-Novelo et al. [9] have shown that residential water subsidies have a regressive structure benefiting wealthier households more heavily than poorer families in the city.
As described above, residential utility subsidies are one mechanism to secure accessibility and affordability of WASH services among low-income families. However, policy makers should be aware of the unintended consequences that subsidies might have on utilization and the sustainability of the water sector, when designing these benefits. For example, Quadri de la Torre [10] affirms that water subsidies have a direct effect on consumption patterns, and that they might increase waste among households and other productive sectors. Similarly, water subsidies might induce budget insufficiencies that prevent not only the creation of new infrastructure, but also the proper maintenance of the existing one resulting in significant environment losses. Water subsidies in urban areas hinder investment and operation of wastewater treatment plants, resulting in the contamination of rivers, continental bodies, and coastal waters [10]. These negative effects of subsidies on infrastructure have also been observed in Argentina, where energy and transport subsidies have weakened the country’s fiscal capacity while becoming a fiscal burden [5], and in Central America, where implicit generalized subsidies have produce a decapitalization of the water sector [11].
Improving access through new infrastructure has an important effect of the efficiency of water subsidies [12]. Thus, water tariffs and their subsidies should be defined carefully to secure accessibility among the poor, but without affecting the viability of the sector by reflecting the true opportunity cost of water and the recovery of investments and operating costs in the entire public service cycle from supply, sewerage and drainage, and treatment [13].
Nauges and Whittington [14] and Whittington et al. [15] show that IBTs perform poorly in targeting subsidies to the poor. These tariff schemes also introduce price distortions that create economic efficiency losses, though welfare losses are relatively low. Barde and Lehmann [8] show that means-tested tariffs distribute more income to the poor than increasing block tariffs, but without also adding volumetric targeting the share of poor consumers benefiting from water subsidies would still be lower than it is with only means-tested tariffs. The means-tested tariffs clearly outperform IBTs in terms of excluding non-poor customers from being subsidized, which improves the distributional impacts of subsidies. Molinos and Donoso [16] propose a water subsidized rate that incentivizes water use sustainability and equity among consumers.
Finally, Angeles-Castro, Arriola-Barcenas, and Baeza-Almaraz [1] discuss the determinants of water utility’s efficiency. They do a panel data analysis across 368 water utilities in Mexico over the period 2010–2014. Results show that small and medium water utilities are more efficient than large providers, and that increasing production is associated with less efficiency. Small firms do not require metering consumption by service to increase efficiency, while medium and large firms do require it. Billing, income collection, and profitability are relevant factors for improving efficiency. From the analysis, the authors draw a set of policy recommendations which is summarized as follows: water utilities in small cities should implement a fixed tariffs scheme, while in medium and large cities, they should implement a large coverage of meters. Moreover, the authors argue that large cities should not adopt a single water utility scheme because the disaggregation of the service among several providers can lead to more efficiency. They also consider it relevant to undertake methods to guaranty the collection of the billing and the reduction of water losses. Furthermore, given that the profitability of water utilities is critical for efficiency, utilities require more management autonomy and empowerment [17] to set fair tariff systems that guaranty enough resources to cover the costs and encourage further investment and efficiency. Most importantly, this autonomy should also involve the possibility of allocating funds to innovative activities rather than transferring scarce funds to subsidize water distribution [18].
2.1. Sectoral Framework and Background of Water Tariffs in Mexico
In Mexico, the urban public water supply represents 15 percent of the total national consumption, agricultural use represents 76 percent, and self-supplied industry (e.g., outside the distribution networks in cities, including thermoelectric plants) is 9 percent (Figure 1). By law, the provision of drinking-water, sewerage and water treatment services are the responsibility of municipalities, according to Article 115 of the Mexican Constitution. Thus, the provision of these services rests with approximately 2517 municipalities [19]. In the aftermath of the crash of the Mexican economy in 1982, the government of Miguel de la Madrid entrusted municipalities with the provision of water supply and sanitation services under a general decentralization framework. Moreover, state governments were made responsible for technical and financial assistance. They were also authorized to decide a municipality’s capacity for providing the services. In most cases, municipalities did not received the necessary financial resources, nor the technical assistance to fulfill their new responsibilities [20]. Moreover, some of the 32 federal states provide these services through state-owned water companies that act on behalf of the municipalities. Some states also have established state water supply agencies that play different roles depending on the state, such as technical assistance to service providers, support in investment planning, and channeling of federal subsidies. In some cases, state agencies provide water and sanitation services directly. In rural areas, the Water Boards (Juntas de Agua) are responsible for supplying water and sanitation services.
The National Water Commission (Comisión Nacional del Agua, CONAGUA) sets the federal policies for water and sanitation. It was created in 1989 and became a well-established autonomous entity under the Ministry of Environment and Natural Resources. CONAGUA [21] plays a key role in the sector’s financial allocation. Besides water supply and sanitation, it is also responsible for water resources management, irrigation, flood protection, and personnel services.
At the regional level, responsibility for water supply and sanitation vary among the 32 Mexican states. Most of them have created State Water Commissions (Comisión Estatal de Agua, CEA), which are autonomous agencies that are usually under the authority of the State Ministry of Public Works. Their attributions differ widely among states. Most of them provide technical assistance to municipalities and some operate water distribution systems. Some also monitor data on the performance of service providers, but rarely are these data aggregated into a comprehensive information system. The CEAs are not regulators, since they do not approve tariffs, which are set at the municipal level or in some cases by State Congresses [20].
2.2. Residential Water Tariffs and Investment
Given that the municipalities are responsible for the provision of drinking-water, sewerage, and water treatment services, drinking-water tariffs are set differently in each municipality, depending on what is established by the legislation of each state. In some states, tariffs are approved by the local congress, while in others they are approved by the governing body/management board of the water agency of the municipality or city, or by the State Water Commission (CEA) [23]. Because the costs in the provision of services vary from one place to another, depending on the processes of supply, purification, distribution, collection, and sewage treatment, there is not a single methodology for setting the tariffs that could be used in all cases [23].
This results in a wide fluctuation of levels and tariff structures, from service providers that fully recover all costs to those that do not even cover their operating costs [23]. The sector, as a whole, fails to generate enough revenue to cover all costs [20,23]. On average, only 72 percent of bills are paid. Moreover, 31 percent of water customers are not metered and instead, are charged a flat rate regardless of consumption volume. Generally, commercial and industrial users are charged tariffs close to full the cost of recovery, while residential users are cross-subsidized. Sanitation is normally charged as a small percentage share of the water bill. [20]. About 69 percent of connections are metered and charged through IBTs (in an increasing-block tariff (IBT) scheme, consumers face a low volumetric per-unit price up to a specified quantity (or block), and then for any additional consumption above this quantity, they pay a higher price up to the limit of the second block, and so on [20] that charge reduced rates to low-volume users, but also large volumes of subsidized water to upper-income users [20,23]. More recent data gathered by the CONAGUA shows that, for a sample of 51 water utilities across the country, only 57 percent of domestic or household connections have micro-meters; ranging from 99 percent of domestic connections with micro-meters installed in places like Ensenada, Queretaro, or Saltillo to zero percent of domestic connections with micro-meters in places like Matamoros, Tlaxcala, or Chilpancingo [23].
Tariffs are determined by type of consumption: domestic, commercial, and industrial. This paper will center on domestic consumption tariffs. On some cases, within this division, there are: (i) water and sanitation tariffs for domestic use of residential type and; and (ii) water and sanitation tariffs for domestic use of popular type. The difference between the first and the second is that the second classification—the so-called ‘popular’ or ‘middle’ type tariffs—are tariffs with different types of subsidies granted or authorized by the water and sanitation service provider. Therefore, this type of ‘popular’ or ‘middle’ tariffs tend to be smaller than the ‘residential’ type. However, all service providers do not always apply this domestic tariff differentiation. This paper shows below some data with these two types of tariffs to illustrate the complexity of the tariff system in Mexico (Figure 2 and Figure 3).
In Mexico the most common domestic water tariffs are the increasing tariffs—either continuous or tiered (IBTs)—in which there is a fixed charge and a variable charge that changes depending on the per cubic meter consumption; in cases of high consumption this variable charge may significantly increase. The fixed charge is the payment that the user must make regardless of the consumption level and in theory allows to cover the costs of measurement, billing, collection, and administrative expenses for providing the services [23].
Figure 2 shows in red the fixed charges (or starting charges) in selected cities; these charges show a very variable dispersion, from non-collection—registered in almost a quarter of the cities presented—to the highest fixed charge in Tijuana and Ensenada cities. Likewise, they can be seen in gray the tariffs of drinking-water applied to a consumption of 30 cubic meters per month for domestic consumption in high (level) residential areas. The highest tariffs in this consumption range are registered in the cities of León, Querétaro, and Pachuca.
In the same Figure, sewage and sanitation tariffs are shown in green. In some cases, these fees are similar to the drinking-water tariff structures in the sense that they increase as the volume increases. In other cases, they represent a percentage of the charge for drinking-water consumption; this percentage may vary according to what is stated in each legal system of the providers of water services. There are also cases in which these (sewage and sanitation) services are not charged, or at least not explicitly charged as they are integrated into the drinking-water tariff, as in the cases of Aguascalientes, Campeche, Mexico City, Ensenada, León, Mexicali, Mérida, Tijuana and Zacatecas [23]. When comparing tariffs it is important to include all services provided (as shown in the Figure 2 and Figure 3). Otherwise, one might yield the wrong results, as in some cases the cost of additional services such as sewerage collection and sanitation fees might exceed the cost of only water as is the case of Puebla and Pachuca.
In addition, Figure 3 shows the tariffs for domestic use of popular type or its equivalent. As mentioned earlier, there are also domestic ranges denominated ‘middle’ or ‘popular’—where different segments/percentages of the population are found—to which different types of subsidies are granted that are authorized by each provider of water services. Therefore, it is important to bear in mind this difference to correctly interpret the information presented.
2.3. Investment in the Water and Sanitation Sector
Significant investments are needed to maintain the required infrastructure to sustain the provision of water and sanitation services. In 2016, the total investments made in the water and sanitation sector were for 34,799 million pesos. Of these, 67 percent were financed by federal resources; 12 percent by state resources; 10 percent by municipal resources; and 11 percent by other sources, including state commissions’ investments, credits, and private sector (Figure 4) [23]. As mentioned earlier, private investment in the drinking water and sanitation sector is very limited and is mainly limited to construction-operation-transfer schemes for sewage treatment plants [23]. Hence, Mexico ranks the lowest in terms of water pricing for residential consumption against the OECD countries.
Table 1 shows the change on investment levels by origin of resources from 2002 to 2016. The table reveals that the federal government has increases its investments in water and sanitation 10-fold. Municipal governments have a 5-fold increased their investment in the sector. The total investment in the sector has increased more than 3-fold since 2002 [23].
Federal subsidies are channeled through various programs, including specific programs for the sector managed by CONAGUA and the Social Infrastructure Support Fund (Fondo de Apoyo a la Infraestructura Social, FAIS), which transfers to the municipalities certain fiscal revenues that can be used at the discretion of these in different infrastructure sectors [20].
2.4. Residential and Urban Water Subsidies
Subsidies on water services for residential urban use are common in Mexico. Subsidies are granted to domestic users by local governments through their water operating utilities; unlike industrial and services/commercial sectors who pay relatively high fees for the provision of water services. In Mexico, water subsidies have a direct effect on consumption patterns, as well as on the technologies used (e.g., in irrigation), and on the rehabilitation and modernization capacities of public service networks and systems, which results in considerable losses and inefficiencies. Water subsidies in urban residential areas also hinder the financing of investment and operation of wastewater treatment plants, which largely explains the pollution of rivers, continental bodies and coastal waters [10]. Thus, the adverse effects of residential water subsidies range from waste of water to budget insufficiencies that prevent operating companies from offering a high quality service [10].
It should be noted that their aggregate estimate is very complex. Part of such complexity has to do with the opacity and lack of homogeneous operational and accounting data in many municipalities of the country and in the National Water Commission (CONAGUA), which in principle should act as a regulatory and data reporting entity. In addition, other difficulties for their estimation arise from the different physiographic conditions that impose cost specificities per cubic meter of water and that make comparisons difficult; from the great variability in the quality and coverage of services; from the differences in physical and administrative efficiency of the operating agencies; from the costs of wastewater treatment in cities that have this practice and that therefore impact their expenditures; and, from the discrimination of tariffs between users and the existence of cross subsidies, among others [10].
Quadri de la Torre [10] offers a simple method for approximating the subsidies to urban residential water by looking at the difference between revenues and operating expenses of water utilities in some of the most important cities in the country, which all together comprise about 40 percent of the population of the country. To this end, Quadri de la Torre used data generated by the Water Advisory Council (Consejo Consultivo del Agua) for its evaluation exercise of Water Management in the Cities of Mexico [24]. The last version of this exercise was carried out in 2011. The Water Advisory Council has not produced new estimates ever since. This data has been gathered from surveys with the water utilities themselves, and with data available on transparency pages in the internet. It is worth noticing that the problem of transparency and availability of data is prevalent among operating agencies and the National Water Commission itself. Given this information gap, it is very difficult to make an approximation of the actual magnitude of the subsidies. The cities included (50 in total) in the following tables are capitals of federal states (Table 2) or, if not capitals, cities with a population of more than 300,000 inhabitants (Table 3). Some of them do not offer data in all the variables used in this exercise. However, it is useful to keep them on the list to compare them with their peers who, in some way or another, are open to public scrutiny [10].
The previous table shows that that the estimate of the total subsidy in the 50 cities considered would be 2146 million pesos in 2010 (around US$172 million of 2010) [10,24]. Using the 2010 average exchange rate of 1US$ = 12.5 Mexican pesos. This number is obtained through net balances of cities in deficit and in surplus. In absolute terms, the Federal District (Mexico City) grants the largest volume of subsidies to urban residential water in Mexico, and that, according to the method used for the estimation, amounts to more than 1600 million pesos annually (US$128 million of 2010). However, a scale comparison between cities is necessary, which is attained with the coefficient of revenue and expenditure (annual operating result) (Figure 5). When this coefficient is less than one, it could be said that there is an implicit (or potential) subsidy to water for urban residential use in the terms of this analysis [10,24].
It is necessary to warn of a potential distortion, particularly in cases where the operating result is favorable (revenue over expenses) because of poor coverage, poor quality of services, and the absence of wastewater treatment systems. In other words, there are water utilities that may have a favorable operating result not because of their well-earned revenues, but because they are not spending efficiently on what is required (e.g., Ecatepec de Morelos and Cd. Nezahualcóyotl). Examples of this are the cities of Ecatepec de Morelos and Cd. Nezahualcóyotl. Their coefficients are of 7.53 and 4.78, respectively. However, these numbers do not correspond to the reality faced by the operating agencies in these two municipalities. In contrast, the water utility of the city of Leon (SAPAL) has a coefficient of 1.46 SAPAL has been recognized as the best-performing water operating agency in the country by the Water Advisory Council, CONAGUA, and ANEAS. At the same time, this water company has received numerous awards for its achievements in financial efficiency, transparency, and quality of service. Nevertheless, it is worth recognizing that recent studies have identified other factors that determine water utilities’ efficiency and that poor performance may be a consequence of other important factors such as informal water connections and water thefts, particularly in fast-growing cities. Angeles-Castro et al. [17], for instance, found that also utilities’ size and billing rates explain also the levels of service efficiency and performance.
Thus, among the cities with the best operating results (lower implicit net subsidies) are those that generally stand out for good water management, such as León, Mexicali, Cancún, Guadalajara, Saltillo, Tijuana, and Aguascalientes. It should be noted that the only three private operators in Mexico (Cancun, Saltillo, and Aguascalientes) stand out among those that have the best results [10]. As can be seen, the estimation of water subsidies in Mexico is a complex issue. However, the next section presents an original attempt to estimate such subsidies and, in that way, answer the fourth original questions set out in the opening section regarding affordability, incidence, and targeting.
3. Methods
3.1. Incidence Analysis
The main method is to determine the incidence analysis of water tariff subsidies in Mexico at the residential level. The characteristics of the households in Mexico are shown, to understand better the importance and incidence of water subsidies at the residential level. The following table (Table 4) presents some of the socioeconomic characteristics of the population by income deciles. In addition to the important difference in total household income, notice that there are also important differences in access to WASH services by income deciles. For example, according to the table, 81 percent of households in the poorest income decile have access to piped water, while the coverage rate among the richest decile is of about 98 percent, similarly with access to sanitation facilities and public sewerage. These differences should be pondered carefully when considering the incidence of water subsidies, as it is only those households with access to WASH services the ones benefiting from any subsidy. At the same time, any calculations about subsidy distribution within the population should consider that most of the richest households will benefit from the subsidy, and not all of the poorest households will.
Remember that, in terms of increasing and providing access to WASH services, affordability is a key factor to consider. It is usually accepted that for water to be considered as affordable, it should represent no more than three percent of the household expenditure. We later show that among all deciles of income, the average Mexican household with access to piped water within the property spends less than 2 percent of their total income in water services. The following table (Table 5) presents a household average expenditure in water, energy, food, housing, education, and health services by income decile. Notice that in terms of water expenditure the richest households spend about five more times as much as households in the poorest decile, yet in terms of income the richest households make as much as 18 times the quarterly income of the poorest ones. Figure 6 presents the data reported in Table 6 in graphic form.
In addition to the data presented above, it is also useful to examine what percentage of a household income is spent in some of these categories. The following graph (Figure 7) presents the average household expenditure in water, housing, and electricity by income decile. Notice from the graph that although housing expenditure varies greatly by decile, water expenditure seems to be decreasing but overall lower than 4 percent of total income.
3.2. Residential Water Subsidies
Now that we know the differences in terms of water expenditure across households with different income levels, we are going to explore the incidence of residential water subsidies by household. In order to estimate the subsidy, we need to compute a household’s water consumption, the cost of providing water.
In order to compute a household’s water consumption, we used data about the characteristics of the dwelling from Mexico’s National Survey of Household Income and Expenditure (ENIGH) [25]. This data provided information about a household’s reported number of bathrooms (differentiating between full bathrooms, showers, and only WCs), number of washing machines, sinks, and washing sinks. Using this information, we calculated a household’s water consumption by multiplying each one of the above items by its monthly average consumption obtained from USGS [26]. For example: a washing machines uses on average, 10 m3 of water per month, so a household with two washing machines consumes 20 m3 of water per month. In addition, we also included in our calculations a two liter per day/member of household drinking water consumption.
We recognize that our water consumption estimates are limited to the extent that they assume the same water use per facility across households of all deciles. By assuming the same water requirements for all households, our water consumption estimates would be downward biased for households in the richest deciles and upward biased for those households in the poorest deciles. Despite these limitations, our conclusions about the regressive nature of the subsidies stand stronger, as the actual differences between the estimated cost of water and households’ expenditures might be larger than our calculations, which would mean that actual subsidies would be smaller for the poorest households and larger for the wealthiest ones. One potential solution to this issue would be to incorporate an analysis using standard deviations of water consumption. However, this approach may not fully eliminate the bias due to the wide variation of water consumption within and between income deciles. In addition, there are outliers in low- and high-water consumption brackets.
Because water is always not necessarily available to all households, we multiply this estimated water consumption of a household by a water availability index. This availability index takes the value of 1 if the household reported to have access to water at all times; of 0.50 if access was reported only every other day; of 0.28 if water was accessible only twice a week: and of 0.14 if the household reported to have access to water only once a week.
To estimate the production cost of water we obtained information from two sources. The first source is Mexico’s PIGOO [27] (Programa de Indicadores de Gestión de Organismos Operadores. This organization oversees and evaluates the performance of local organizations in charge of providing water to the population). This data provides information about the total expenditure realized by water provider/management organizations in a year and the total volume of water produced by the same provider/organization. With this information the operating water cost is calculated by dividing total expenditure ($) over the total water produces (m3) at the state level.
The second source of information comes from a recent research by Macroconsulting [28]. In their research, the authors define the efficient cost of providing a service as the cost that would cover all inputs used in the provision of the service at efficient levels. In other words, this cost includes operation, maintenance, and capital costs. According to their estimations, the efficient cost of a m3 of water in Mexico ascends to US $1.92 ($1.71, as the efficient tariff, plus $0.21 from average water inefficiencies differential).
It is a reality that the poorest households in our study sample are more likely to reside in isolated areas, with poorest infrastructure and thus, with higher efficient costs. We acknowledge the limitations arising from using a single efficient cost per m3 of water to all households, as we might be underestimating the subsidy received by families in the poorest deciles. However, a more detailed analysis is not possible due to data limitations pertaining the availability efficient cost estimates. Future research should examine this issue by adjusting the efficient cost to different type of geographic regions.
With this information we define economic and direct subsidies as follows: we define as economic subsidy, , the difference between the efficient cost, , and the water operating cost, .
Similarly, we defined direct subsidy, as the difference between the operating cost and what a household pays for the service, .
The following Graph (Figure 8) compare the average household expenditure in water with (1) the estimated average economic water subsidy (economic subsidy refers to the implicit subsidy as described previously) and (2) the estimated average direct water subsidy, all by income deciles. Notice from the graph that the estimated subsidies are increasing with respect to a household’s income decile, which implies that both subsidies are highly regressive. Also notice that these results correspond only to households with reported access to piped water within their property, meaning that they underestimate how much they benefit rich over poor households, as households in higher income deciles are more likely to have access to piped water than less wealthy households.
4. Results
4.1. Subsidy Performance
Now that we have established the distribution of residential water subsidies by income level and geographic location, it is important for our analysis to evaluate the performance of the water subsidy as described by Komives et al. [2]. Following this approach, we are going to evaluate the performance of the subsidy in three dimensions: benefit incidence, beneficiary incidence, and material impact of the subsidy. To evaluate targeting, we are going to use the targeting performance indicator Ω. As explained by Komives et al. [2], this indicator reflects the proportion of the subsidies received by the poor, divided by the proportion of households in the total population in poverty. An index equal to one, known as a neutral distribution, means that the proportion of the subsidy going to the poor equals their share of the population. Values higher than one are evidence of a progressive subsidy that destines a higher proportion of the subsidy to the poor, while values lower than one suggest a regressive subsidy that benefits wealthier households more heavily.
We estimate the indicator Ω as described by Komives et al. [2]. According to the authors, the equation for Ω is given by the following equation
where, is the share of all subsidies received by the poor, and represent the proportion of households living in poverty as a proportion of the whole population. For calculation purposes and following Komives et al. [2] we consider all households in the bottom 40 percent of income distribution as the poor population.
According to our estimates the value for Ω associated with the economic subsidy equals 0.9270, while the Ω associated with the direct subsidy equals 0.9602. According to these values, wealthy populations benefit more from both subsidies than the poor. This is particularly true for the case of economic subsidies.
4.2. Beneficiary Incidence
The objective of this performance measure is to evaluate how well the subsidies target beneficiaries. Beneficiary incidence is intended to assess what proportion of poor households does not benefit from the subsidy, also known as error of exclusion, as well as the distribution of beneficiaries by income distribution. Errors of exclusion arise when poor households fail to receive the subsidy. The error is defined as the proportion of poor households that do not receive any subsidy.
The error of exclusion is defined as
where is the proportion of poor households with access to the public water network, . is the proportion of poor households that are actually connected to the network (i.e., that reported having access to piped water within the property, conditional on having access to the public water network), and is the proportion of connected poor households that actually receive some subsidy. Just as with the previous measure, we consider all households in the bottom 40 percent of income distribution as the poor population. Finally, we assume that a household has access to the public water network if the household reported having access to piped water within the property or if the household reported having access to piped water from a neighbor or from a public pipe.
Our estimates suggest that the error of exclusion associated with the economic subsidy equals 19 percent, while the error of exclusion for the direct subsidy equals 30.46 percent. This measure suggests that the economic subsidy happens to be better at targeting poor households, when compared to the case of direct substitutes.
The following graph (Figure 9) presents the distribution of beneficiaries by type of subsidies across income deciles, consistent with the error of exclusions presented before.
4.3. Impact of the Subsidy
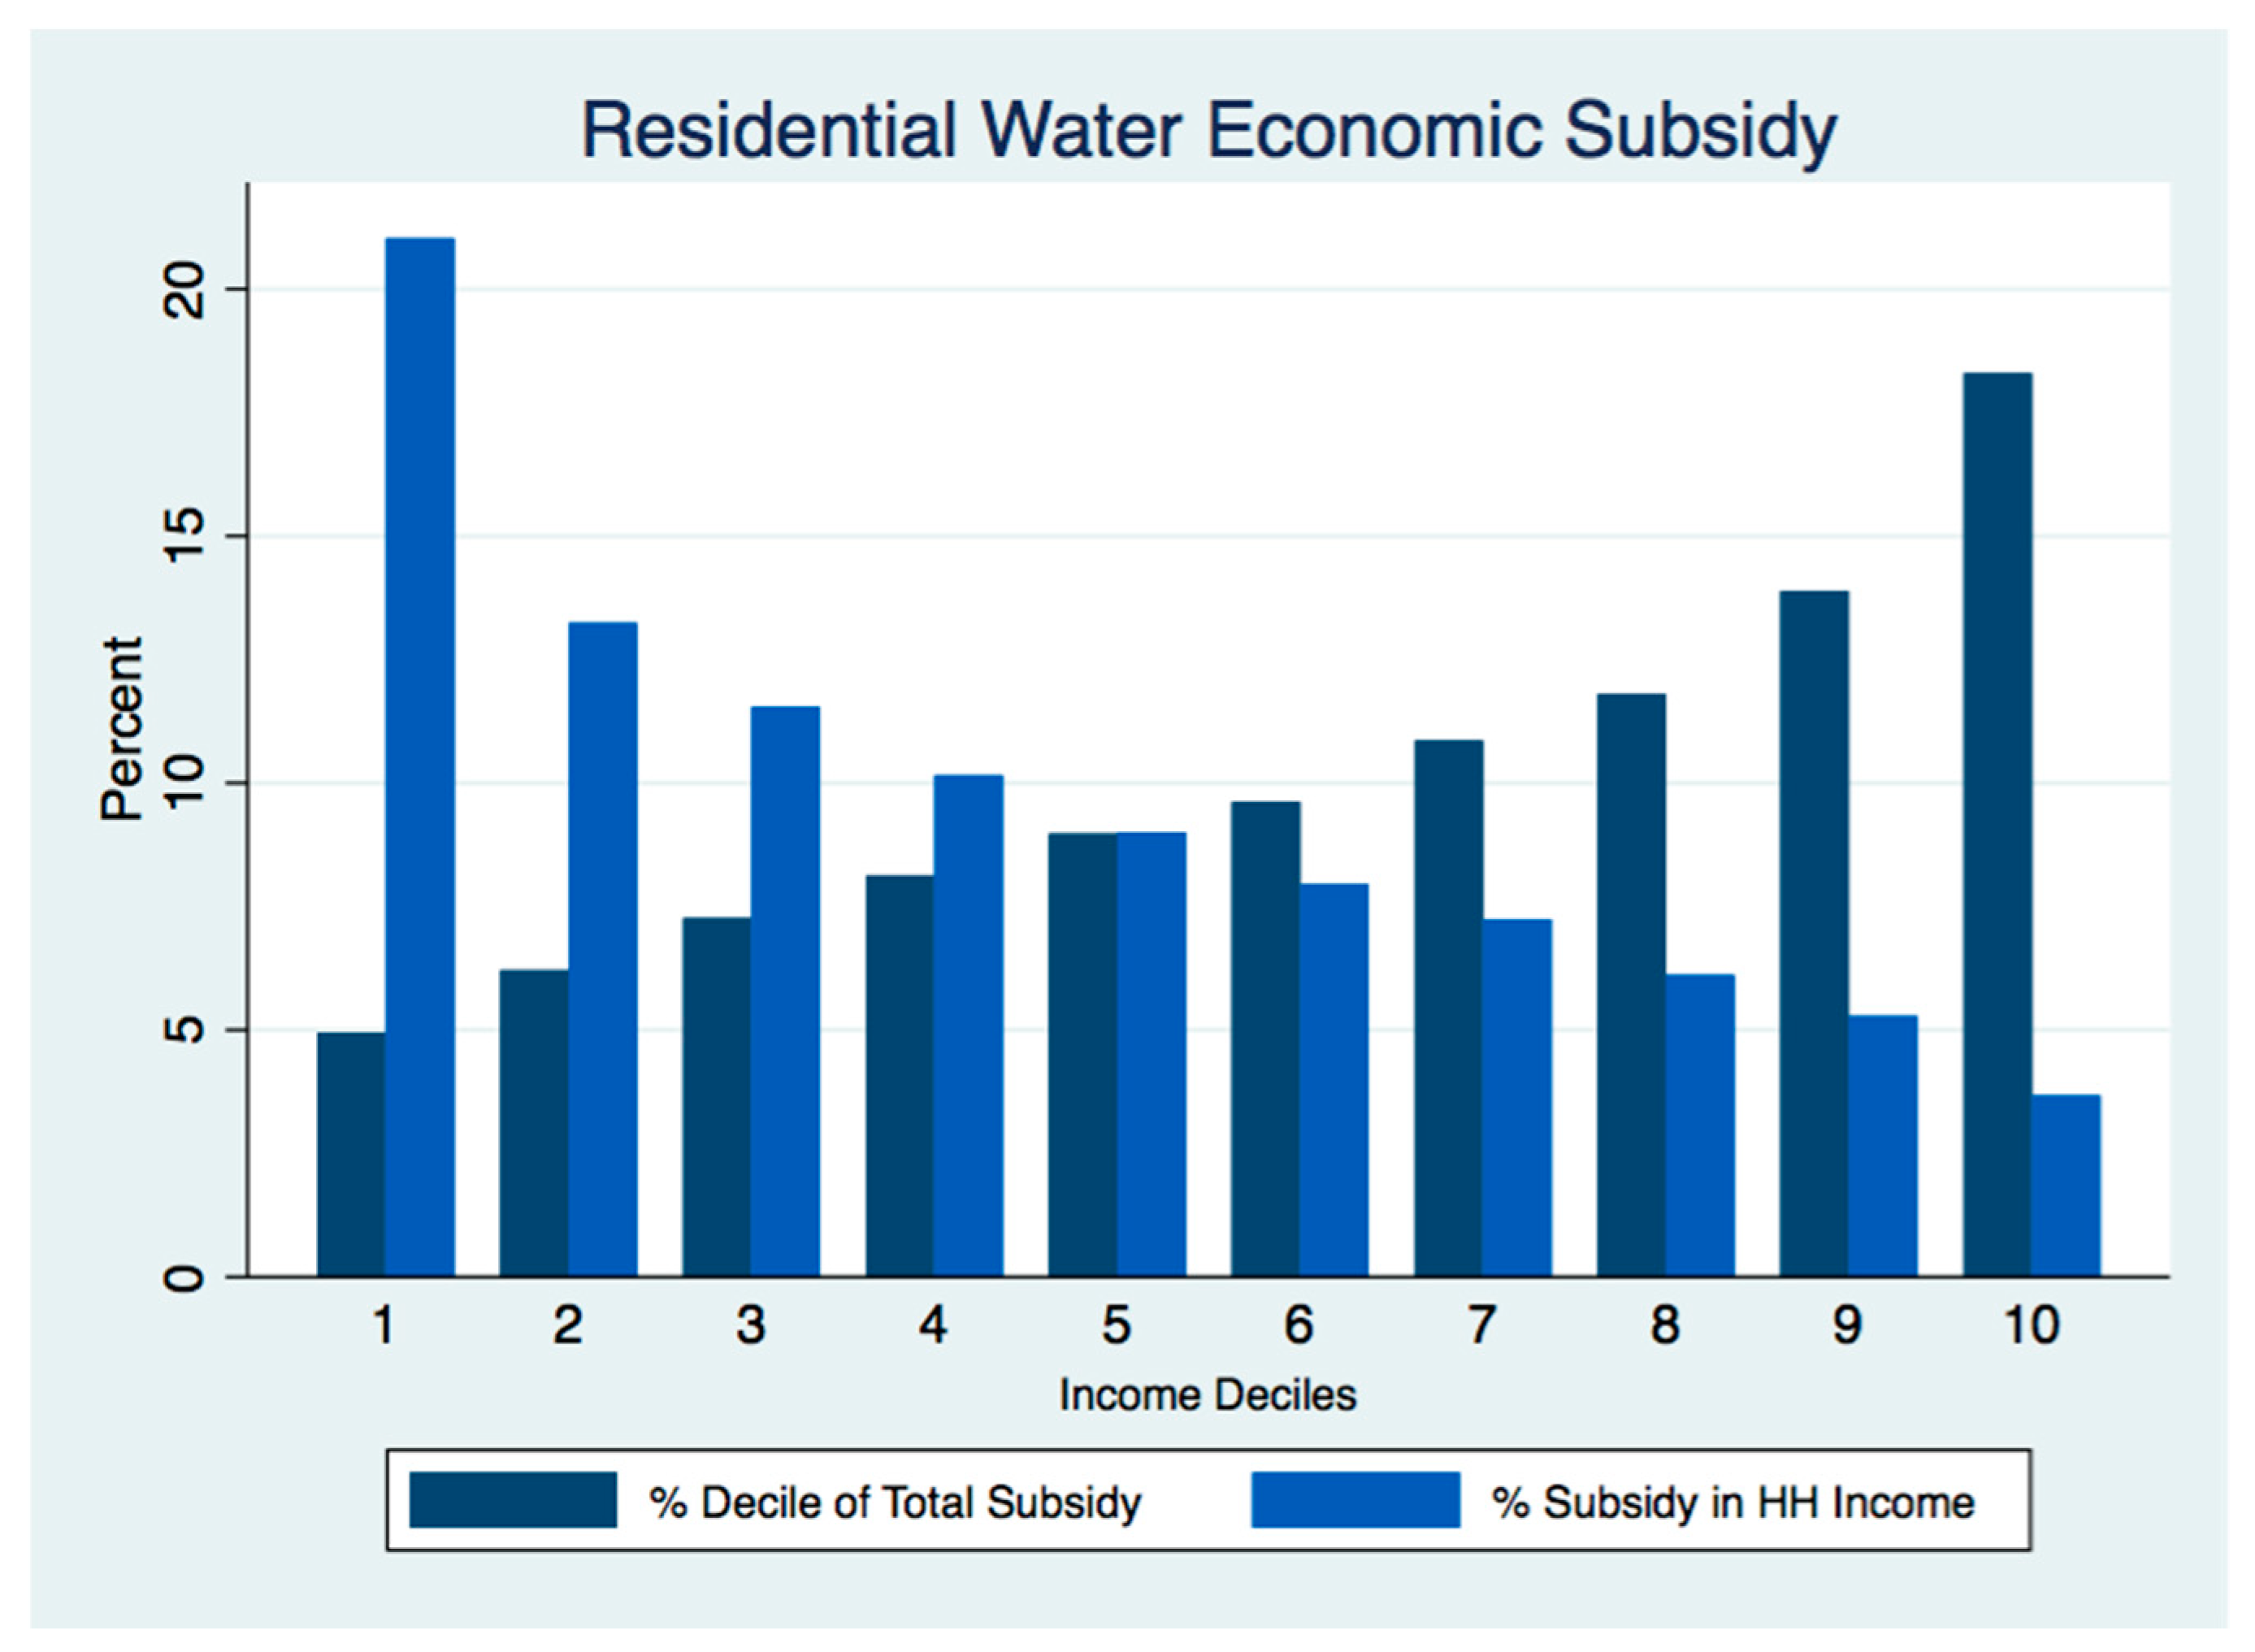
This dimension is aimed at evaluating how important is the value of the subsidy as a proportion of the household’s income. The following graphs (Figure 10 and Figure 11) compare the proportion of the total subsidy going to households in each income decile, with the average value of each subsidy as a proportion of the average household income. Notice from the graphs that the distribution of the subsidy across income deciles is skewed towards the right, meaning that a higher proportion of the total subsidy is directed towards the wealthiest populations, both for the case of the economic and the direct subsidy.
In terms of the material impact of the subsidy, notice that among the poorest decile, the direct subsidy (Figure 10) represents about 4 percent of the average household income, while it seems to represent about 1 percent that of the richest deciles. In terms of the economic water subsidy (Figure 11), these differences seem to become more significant as the average economic subsidy represents about 20 percent of the poorest household’s average total income, while it seems to be only about 4 percent for the case of the richest households.
The Table 7 below presents the subsidy performance by state. Notice that although at a national level, our estimates suggested that both types of subsidies were regressive, at the state level our estimates are somewhat different. Notice that according to the table some states are better at targeting the subsidy to the poor than others.
For example, one can observe that in Quintana Roo, the direct subsidy appears to be progressive and to benefit poor households more heavily. However, the data also suggest that the state exhibits a large error of exclusion, just as with the case of Guerrero. According to the estimated Economic subsidy, Guerrero presents one of the most progressive economic subsidies. On the contrary, Quintana Roo is estimated to have a regressive subsidy system under this measure.
To this point, we have been able to provide an analysis of the residential water subsidies and their targeting performance, especially regarding the population they serve and how good they are reaching poor households. However, we consider that the above analysis somehow neglects those households without piped water within the property. From Table 8, one can observe that among the poorest deciles of income, around 19 percent of the population lack access to piped water within the property; 80 percent of these households are located in rural areas (which lack piped water infrastructure) and have a head of household with no more than an elementary school education.
5. Conclusions
This section presents a brief discussion of the answers to the four central questions we asked at the outset of the paper, followed by the main findings of the analysis.
5.1. Discussion
1. Are existing subsidies effective at ensuring affordability for the poorest in society?
It is usually accepted that for water service to be considered ‘affordable’ for household consumers, it should represent no more than 3 percent of household expenditure. In the case of Mexico, our estimates show that this premise is fulfilled, even in the lowest income decile (Table 6). However, our analysis only included population with access to piped water and therefore neglects a segment of the population without access to piped water. In the poorest decile of the income distribution, for example, there is a 19 percent of households without access to piped water (Table 5). Therefore, one cannot talk about effective affordability when a considerable segment of poor households does not have access to the service.
2. What is the proportion of subsidies that accrue to people at different income levels?
The analysis suggests that water subsidies in Mexico are regressive. Because households in higher income deciles are more likely to have access to piped water than households in the poorest deciles, a higher proportion of the subsidy goes to the wealthiest members of the population. Table 7 and Figure 8, Figure 9, Figure 10 and Figure 11 illustrate how subsidies accrue to the different income levels and their proportion in the household’s income. Our calculations show that most of the benefits accrue to the non-poor.
3. Do the poor tend to pay a higher/lower price than the rich for water?
The analysis suggests that although the rich deciles tend to pay a nominally higher price than the poor deciles for the water service, proportionally (that is, as a proportion of their household total income), the poor deciles spend a larger portion of their income when compared to the rich ones. Tariffs for water services vary significantly across cities in Mexico. A bathtub of water in high-tariff cities can cost 8–10 times more than in low-tariff cities in Mexico, while some middle-class households pay no direct fees for water (Figure 2 and Figure 3).
The importance of redesigning subsidies from the public finance perspective is essential in reducing investment gaps in the sector. In many developing countries increasing investment in water and sanitation infrastructure is a priority (it has been estimated that worldwide, about 2.2 billion people do not have access to safely managed drinking water services and that about 4.2 billion people lack access to safely managed sanitation services [29]. Closing the gaps in the accessibility, quality, and availability of water and sanitation services should be at the core of government funding and planning strategies. Increasing annual investments in the sector would reduce the share of people without access to these basic needs. This could also be the case of Mexico if investment needs in the sector can be reached and the release of public sector funds to this end can contribute to enabling access to these essential services to the poorest.
4. What are the key determinants of targeting performance (access and subsidy design factors)?
In explaining the targeting performance, this paper reviewed the importance of different access factors (e.g., access to the network and connection uptake rate) and subsidy design factors (e.g., targeting of beneficiaries, rate of subsidization, and consumption level). Table 9 presents a summary framework of the determinants of the various subsidy performance indicators for consumption subsidies.
5.2. Main Findings
Subsidies provided to residential water utility customers are well liked by some politicians, utility administrators, and utility service customers. Utility subsidies are perceived to help make utility services affordable for poor households. They are also seen to keep service affordable while governments seek to increase average prices to improve the financial viability of utilities and scale back the heavy fiscal transfers many utilities receive [2,3,4]. They are also a social policy instrument, as they act as a tool for income redistribution. However, large, growing, and long-lasting subsidies provided to residential consumers in the water and sanitation sector in Mexico are having adverse consequences in terms of allocative and productive efficiency, financial sustainability, and equity. Moreover, there is a concern that they are not well-targeted to the poor.
The findings of our analysis indicate that the most common forms of residential water utility subsidies in Mexico—quantity-based consumption subsidies—are highly regressive. A large segment of poor households is excluded from these subsidies, and most benefits accrue to the non-poor. Prospects for achieving a progressive incidence of subsidies are potentially better with other targeting mechanisms, such as means-testing or geographic targeting mechanisms. However, low coverage and metering levels—prevalent among the poorest income deciles—seriously jeopardize the chance that any consumption subsidy scheme will reach the poor.
In places where coverage of WASH services is low, subsidies targeted to low-level consumption or subsidies intended to foster public network connections are better alternatives. However, the actual performance of these subsides will depend on the response of poor households. Targeted subsidies may not reach poor households whenever price is not the principal barrier to connection or if demand for alternative services (such as public taps) is low [3]. Having said that, it is worth noting that for some consumption subsidies, the ‘metering rate’ is another subsidy design factor that also determines who the beneficiaries of the subsidy will be.
In Mexico, due to the complexity of the legal framework and the way in which water services are organized, there is not a system of targeting that comes naturally. This paper and several other studies (the most recent Morales-Novelo et al. [9]) confirm that quantity-based consumption subsidies—specifically increasing block tariffs (IBTs)—are decidedly regressive and do not perform well in Mexico. To find the best alternative in the case of Mexico, alternative forms of targeting—whether they focus solely on better identifying families in need or whether they also involve quantity mechanisms—should be considered carefully. Two examples that come to mind are Chile (that uses means testing as a targeting method) and Colombia (that uses geographic targeting).
While different mechanisms could improve subsidy targeting, they may do very little to address the underlying access differential between the poor and non-poor, as only households with access to water services are potential beneficiaries of the subsidy. As such, we might want to think about water subsidies as something that can benefit only certain households and look to other policy interventions for ways to deal with income inequality and access to WASH services.
Finally, it is worth noting that the distributional incidence of consumer utility subsidies allows only a partial look at the performance of utility subsidies. There are several purposes at work in the design of tariffs for water services, only one of which is a genuine concern for providing subsidies and affordable service to the poor. Thus, the goal of this paper is to draw together empirical evidence to address a long-standing question in the ongoing debate about the design of water utility tariffs and subsidies: to what extent do consumer utility subsidies benefit the poor? Approximating an answer to this question may be more valuable than making specific recommendations about the best approach for charging for or subsidizing water utility services.
Author Contributions
Conceptualization, C.B.-V.; Methodology, J.A.G.; Software E.E.G.M.; Validation, C.B.-V., J.A.G., and E.E.G.M.; Formal analysis, C.B.-V.; Investigation, J.A.G.; Data curation, E.E.G.M.; Writing—original draft preparation, C.B.-V., J.A.G., and E.E.G.M.; Writing—review and editing, C.B.-V., J.A.G., and E.E.G.M.; Visualization, C.B.-V., J.A.G., and E.E.G.M.; Supervision, C.B.-V., J.A.G., and E.E.G.M.
Funding
This research received no external funding.
Conflicts of Interest
The authors declare no conflict of interest.
References
- Angeles-Castro, G.; Arriola-Barcenas, L.J.; Baeza-Almaraz, C.B. Determinants of total efficiency in water utilities in Mexico. Appl. Econ. Lett. 2018, 25, 1531–1534. [Google Scholar] [CrossRef]
- Komives, K.; Foster, V.; Halpern, J.; Wodon, Q. Who Benefits from Utility Subsidies? In Water, Electricity and the Poor; World Bank Directions in Development Series: Washington, DC, USA, 2005; Available online: http://documents.worldbank.org/curated/en/606521468136796984/pdf/343340REPLACEM10082136342501PUBLIC1.pdf (accessed on 6 August 2018).
- Komives, K.; Halpern, J.; Foster, V.; Wodon, Q.T.; Abdullah, R. The distributional incidence of residential water and electricity subsidies. In World Bank Policy Research Working Paper 3878; The World Bank: Washington, DC, USA, 2006; Available online: https://openknowledge.worldbank.org/bitstream/handle/10986/8731/wps38780rev0pdf.pdf?sequence=1&isAllowed=y (accessed on 6 August 2018).
- Komives, K.; Johnson, T.M.; Halpern, J.D.; Aburto, J.L.; Scott, J.R. Residential Electricity Subsidies in Mexico: Exploring Options for Reform and for Enhancing the Impact on the Poor; World Bank Publications: Washington, DC, USA, 2009; Volume 160, Available online: http://documents.worldbank.org/curated/en/813021468045081649/Residential-electricity-subsidies-in-Mexico-exploring-options-for-reform-and-for-enhancing-the-impact-on-the-poor (accessed on 7 August 2018).
- Lakner, C.; Lugo, M.A.; Puig, J.; Salinardi, L.; Viveros, M. The incidence of subsidies to residential public services in Argentina: The subsidy system in 2014 and some alternatives. In Documentos de Trabajo No. 201, CEDLAS; World Bank: Washington, DC, USA, 2016; Available online: https://www.econstor.eu/handle/10419/157951 (accessed on 7 August 2018).
- Contreras, D.; Gomez-Lobo, A.; Palma, I. Revisiting the distributional impacts of water subsidy policy in Chile: A historical analysis from 1998–2015. Water Policy 2018, 20, 1208–1226. [Google Scholar] [CrossRef]
- Gómez-Lobo, A.; Contreras, D. Water subsidy policies: A comparison of the Chilean and Colombian Schemes. World Bank Econ. Rev. 2003, 17, 391–407. [Google Scholar] [CrossRef]
- Barde, J.A.; Lehmann, P. Distributional effects of water tariff reforms–An empirical study for Lima, Peru. Water Resour. Econ. 2014, 6, 30–57. [Google Scholar] [CrossRef]
- Morales-Novelo, J.; Rodríguez-Tapia, L.; Revollo-Fernández, D. Inequality in access to drinking water and subsidies between low and high income households in Mexico City. Water 2018, 10, 1023. [Google Scholar] [CrossRef]
- Quadri de la Torre, G. Subsidios vs medio ambiente en México: El absurdo y las oportunidades. In Serie El Uso y Abuso de los Recursos Públicos, Cuaderno de Debate No. 7; Centro de Investigación y Docencia Económica (CIDE): Mexico City, Mexico, 2011; Available online: http://repositoriodigital.cide.edu/bitstream/handle/11651/142/subsidios_vs_medio_ambiente_GQ.pdf?sequence=7 (accessed on 30 July 2018).
- Halpern, J.; Walker, I.; Ordoñez, F.; Serrano, P. Pricing, Subsidies, and the Poor: Demand for Improved Water Services in Central America; The World Bank: Washington, DC, USA, 1999. [Google Scholar]
- Angel-Urdinola, D.F.; Wodon, Q. Does increasing access to infrastructure services improve the targeting performance of water subsidies? J. Int. Dev. 2012, 24, 88–101. [Google Scholar] [CrossRef]
- Pinto, F.S.; Marques, R.C. Tariff suitability framework for water supply services. Water Resour. Manag. 2016, 30, 2037–2053. [Google Scholar] [CrossRef]
- Nauges, C.; Whittington, D. Evaluating the performance of alternative municipal water tariff designs: Quantifying the tradeoffs between equity, economic efficiency, and cost recovery. World Dev. 2017, 91, 125–143. [Google Scholar] [CrossRef]
- Whittington, D.; Nauges, C.; Fuente, D.; Wu, X. A diagnostic tool for estimating the incidence of subsidies delivered by water utilities in low-and medium-income countries, with illustrative simulations. Util. Policy 2015, 34, 70–81. [Google Scholar] [CrossRef]
- Molinos-Senante, M.; Donoso, G. Water scarcity and affordability in urban water pricing: A case study of Chile. Util. Policy 2016, 43, 107–116. [Google Scholar] [CrossRef]
- Angeles-Castro, G. Improving the water service: The case for replicating Manila in Mexico. Envirogeochim. Acta 2014, 6, 403–410. [Google Scholar]
- Marques, R.C.; Berg, S.; Yane, S. Non-parametric benchmarking of Japanese water utilities: Institutional and environmental factors affecting efficiency. J. Water Resour. Plan. Manag. 2014, 140, 562–571. [Google Scholar] [CrossRef]
- INEGI. Panorama Censal de los Organismos Operadores de Agua en México; Censos Económicos. Instituto Nacional de Estadística y Geografía (INEGI): Aguascalientes, México, 2009; Available online: http://www.inegi.org.mx/est/contenidos/espanol/proyectos/censos/ce2009/pdf/Mono_Orgs_operadores_agua.pdf (accessed on 8 August 2018).
- World Bank. Infrastructure Public Expenditure Review (IPER); The World Bank: Washington, DC, USA, 2005; Available online: http://documents.worldbank.org/curated/en/490211468279849608/pdf/3348310MX.pdf (accessed on 15 July 2018).
- Comisión Nacional del Agua (CONAGUA). El Agua en México; Subdirección General de Programación: México City, México, 2006. Available online: http://www.conagua.gob.mx/CONAGUA07/Publicaciones/Publicaciones/EL-AGUA-EN-MEXICO.pdf (accessed on 4 September 2018).
- Comisión Nacional del Agua (CONAGUA). Estadísticas del Agua en México, 2016 ed.; Secretaría de Medio Ambiente y Recursos Naturales: México City, México, 2016. Available online: http://files.conagua.gob.mx/conagua/publicaciones/Publicaciones/EAM2016.pdf (accessed on 4 September 2018).
- Comisión Nacional del Agua (CONAGUA). Situación del Subsector Agua Potable, Alcantarillado y Saneamiento, 2017 ed.; Secretaría de Medio Ambiente y Recursos Naturales: México City, México, 2017. Available online: http://files.conagua.gob.mx/conagua/publicaciones/Publicaciones/SGAPDS-4-17.pdf (accessed on 4 September 2018).
- Concejo Consultivo del Agua (CCA). La Gestión del Agua en las Ciudades de México: Indicadores de Desempeño de los Sistemas de Agua Potable, Alcantarillado y Saneamiento; Concejo Consultivo del Agua A.C., Segundo Reporte: México City, México, 2011; Available online: http://www.aguas.org.mx/sitio/publicaciones/gestionDelAgua2011/gestion-del-agua-en-las-ciudades-de-mexico-reporte2011.html#p=2 (accessed on 6 September 2018).
- INEGI. Encuesta Nacional de Ingreso y Gasto de los Hogares; Instituto Nacional de Estadística y Geografía (INEGI): Aguascalientes, México, 2014. [Google Scholar]
- USGS. How Much Water Does the Average Person Use at Home Per Day? 2018. Available online: https://water.usgs.gov/edu/qa-home-percapita.html (accessed on 18 August 2018).
- Instituto Mexicano de Tecnología del Agua (IMTA). Programa de Indicadores de Gestión de Organismos Operadores; IMTA: Progreso, Mexico, 2018. Available online: http://www.pigoo.gob.mx/Estado (accessed on 1 June 2018).
- Macroconsulting. Estimating the Economic Cost of Water and Sanitation; Working Paper; Macroconsulting: Mexico City, Mexico, 2018. [Google Scholar]
- World Health Organization and UNICEF. Progress on Drinking Water, Sanitation and Hygiene: Update and SDG Baselines; New York, NY, USA, 2017. [Google Scholar]
Figure 1.
Percentage of Water Use in Agriculture, Industry and Public Supply, 2016. Source: Authors’ elaboration using data from CONAGUA [22], 2016.
Figure 1.
Percentage of Water Use in Agriculture, Industry and Public Supply, 2016. Source: Authors’ elaboration using data from CONAGUA [22], 2016.

Figure 2.
Drinking-water and sanitation tariffs for domestic use of residential type (or equivalent) in selected cities in Mexico, 2016 ($MX per cubic meter). Source: Authors’ elaboration with data from CONAGUA [23]; Note: Tariffs for a consumption of m3 per month.
Figure 2.
Drinking-water and sanitation tariffs for domestic use of residential type (or equivalent) in selected cities in Mexico, 2016 ($MX per cubic meter). Source: Authors’ elaboration with data from CONAGUA [23]; Note: Tariffs for a consumption of m3 per month.

Figure 3.
Drinking-water and sanitation tariffs for domestic use of popular type (or equivalent) in selected cities in Mexico, 2016 ($MX per cubic meter). Source: Authors’ elaboration with data from CONAGUA [23]; Note: Tariffs for a consumption of m3 per month.
Figure 3.
Drinking-water and sanitation tariffs for domestic use of popular type (or equivalent) in selected cities in Mexico, 2016 ($MX per cubic meter). Source: Authors’ elaboration with data from CONAGUA [23]; Note: Tariffs for a consumption of m3 per month.

Figure 4.
Investments by origin of resources in Mexico (left panel) and Unit price of water and sanitation services to households incl. taxes and subsidies (USD/m3) (right panel). Source: Authors’ elaborating using data from CONAGUA [23]; and OECD, 2010.
Figure 4.
Investments by origin of resources in Mexico (left panel) and Unit price of water and sanitation services to households incl. taxes and subsidies (USD/m3) (right panel). Source: Authors’ elaborating using data from CONAGUA [23]; and OECD, 2010.

Figure 5.
Coefficient (ratio) revenues/expenditure in water utilities, selected cities. Source: CCA [24]; Quadri de la Torre [10]. Note: The cities of Ecatepec de Morelos and Cd. Nezahualcóyotl have been left out if this graph as their coefficient numbers are outliers which cannot be properly explained.

Figure 6.
Household expenditure, selected categories. Source: Authors’ elaboration using data from ENIGH [25].
Figure 6.
Household expenditure, selected categories. Source: Authors’ elaboration using data from ENIGH [25].

Figure 7.
Expenditure in selected categories as percentage of household’s total income. Source: Authors’ elaboration using data from ENIGH [25].
Figure 7.
Expenditure in selected categories as percentage of household’s total income. Source: Authors’ elaboration using data from ENIGH [25].

Figure 8.
Residential water subsidies, 2014. Note: Implicit subsidy is accounted as the economic subsidy. Source: Own Calculations with data from ENIGH [25]; and PIGOO [27].

Figure 9.
Distribution of subsidy beneficiaries by income decile, 2014. Source: own calculations with data from ENIGH [25]; and PIGOO [27].

Figure 10.
Residential water subsidies, 2014. Source: Own calculations with data from ENIGH [25]; and PIGOO [27].

Figure 11.
Residential water subsidies, 2014. Source: Own calculations with data from ENIGH [25]; and PIGOO [27].


Table 1.
Total investments by sector of origin of the resource, 2002 to 2016 a (in Millions, $MX of 2016).
Table 1.
Total investments by sector of origin of the resource, 2002 to 2016 a (in Millions, $MX of 2016).
| Year | Federal | State | Municipal | Other Sources b | Total |
|---|---|---|---|---|---|
| 2002 | 4479.0 | 2238.5 | 1357.6 | 12,276.7 | 20,351.7 |
| 2003 | 7956.2 | 4031.9 | 3617.5 | 7738.1 | 23,343.8 |
| 2004 | 7080.3 | 5278.7 | 2411.2 | 8688.2 | 23,458.5 |
| 2005 | 11,638.0 | 8193.7 | 4792.6 | 10,867.0 | 35,491.1 |
| 2006 | 8910.5 | 4167.3 | 4349.8 | 6855.7 | 24,283.3 |
| 2007 | 13,766.1 | 6042.6 | 3961.2 | 7633.1 | 31,403.0 |
| 2008 | 16,933.0 | 8631.2 | 4449.8 | 6164.6 | 36,178.5 |
| 2009 | 19,591.3 | 7400.4 | 4816.9 | 8189.2 | 39,997.8 |
| 2010 | 21,459.9 | 6726.8 | 4717.0 | 6941.4 | 39,845.0 |
| 2011 | 24,137.5 | 8589.7 | 4750.7 | 7306.8 | 44,784.6 |
| 2012 | 28,320.5 | 7880.0 | 3346.0 | 6964.9 | 46,511.3 |
| 2013 | 25,996.8 | 6651.2 | 3728.1 | 5601.0 | 41,977.2 |
| 2014 | 22,218.0 | 6087.6 | 3518.5 | 5226.3 | 37,050.5 |
| 2015 | 25,283.5 | 4476.3 | 3231.8 | 3999.6 | 36,991.3 |
| 2016 | 23,406.6 | 4074.6 | 3643.6 | 3674.8 | 34,799.6 |
a Total Investment the water subsector, including the programs in charge of the CONAGUA in addition to those carried out by Sedesol, CDI, Banobras, state agencies, credits, and private sector. b Investments of the state commissions, credits, and private sector. Source: CONAGUA [23].
Table 2.
Water management in capital cities of Mexican states
| City | Inhabitants (Thousands) | Utility Revenue (Millions) | Utility Operating Expenses (Millions) | Balance a (Millions) |
|---|---|---|---|---|
| Aguascalientes | 1065 | 500.75 | 439.22 | −61.53 |
| Campeche | 239 | 12.15 | 52.37 | 40.22 |
| Chetumal | 125 | 239.50 | 329.27 | 89.77 |
| Chihuahua | 407 | 461.12 | 530.97 | 69.85 |
| Chilpancingo | 214 | 25.35 | 47.21 | 21.86 |
| Ciudad Victoria | 322 | 161.52 | 249.36 | 87.85 |
| Colima | 124 | 49.76 | 181.78 | 132.02 |
| Cuernavaca | 365 | 152.56 | 220.47 | 67.92 |
| Culiacán | 605 | 417.38 | 489.22 | 71.84 |
| Distrito Federal | 8721 | 3572.86 | 5230.90 | 1658.04 |
| Durango | 464 | 144.22 | 132.02 | −12.19 |
| Guadalajara | 1601 | 1087.12 | 922.62 | −164.50 |
| Guanajuato | 141 | 71.73 | 83.40 | 11.67 |
| Hermosillo | 642 | 491.72 | 546.82 | 55.11 |
| La Paz | 189 | 178.25 | 196.02 | 17.77 |
| Mérida | 734 | 224.03 | 224.03 | 0.00 |
| Mexicali | 936 | 814.97 | 655.65 | −159.32 |
| Monterrey | 3738 | 2723.61 | 2607.88 | −115.73 |
| Morelia | 608 | 332.08 | 488.84 | 156.76 |
| Oaxaca | 504 | – | 124.47 | – |
| Pachuca | 117 | 280.67 | 245.90 | −34.77 |
| Puebla | 1486 | 1232.10 | 1126.88 | −105.23 |
| Querétaro | 732 | 1106.17 | 1036.69 | −69.48 |
| Saltillo | 709 | 248.11 | 213.13 | −34.98 |
| San Luis Potosí | 1041 | 419.37 | 370.73 | −48.64 |
| Tepic | 429 | 56.80 | 187.50 | 130.70 |
| Tlaxcala | 16 | 22.17 | 32.82 | 10.65 |
| Toluca | 1847 | 116.30 | 120.52 | 4.22 |
| Tuxtla Gutiérrez | 568 | 190.69 | 345.01 | 154.32 |
| Villahermosa | 559 | 25.94 | 285.58 | 259.64 |
| Xalapa | 458 | 195.79 | 435.05 | 239.26 |
| Zacatecas | 132 | 106.57 | 171.48 | 64.90 |
Table 3.
Water management in selected cities
| City | Inhabitants (Thousands) | Utility Revenue (Millions) | Utility Operating Expenses (Millions) | Balance a (Millions) |
|---|---|---|---|---|
| Cancún-I. Mujeres | 526.70 | 489.46 | 411.41 | 78.06 |
| Tampico | 303.92 | 245.42 | 216.52 | 28.90 |
| Tijuana | 1410.70 | 1955.00 | 1756.00 | 199.00 |
| Veracruz | 552.11 | 438.72 | 448.90 | −10.18 |
| Acapulco | 717.77 | 319.82 | 447.26 | −127,44 |
| Celaya | 415.41 | – | – | – |
| Chimalhuacán | 525.39 | – | – | – |
| Ciudad Juárez | 1313.34 | 995.89 | 984.01 | 11.87 |
| Cd.Nezahualcóyotl | 1109.36 | 151.75 | 31.73 | 120.00 |
| Cuautitlán-Izcalli | 498.02 | 127.03 | 358.96 | −231.93 |
| Ecatepec de Morelos | 1688.26 | 225.84 | 30.00 | −195.84 |
| Ixtapaluca | 645.03 | – | – | – |
| León | 1278.09 | 914.03 | 624.93 | 289.09 |
| Naucalpan | 821.44 | 373.56 | 477.45 | −103.89 |
| Reynosa | 508.0 | 213.97 | 329.43 | −115.46 |
| Tlalnepantla de Baz | 683.81 | 447.41 | 389.48 | 57.93 |
| Torreón | 548.72 | 404.40 | 404.16 | 0.25 |
| Tultitlán | 432.41 | – | – | – |
| Total (50 cities) | 43,815.05 | 22,963.62 | 25,234.04 | −2145.95 |
Table 4.
Socioeconomic characteristics of Mexican households, 2014.
| Decile | Total Income | % with Piped Water in Property | % with a WC in the HH | % with Access to Public Sewerage | % with at Most Elementary Education | % Female Head of HH | % Rural | % with Income from Agriculture |
|---|---|---|---|---|---|---|---|---|
| 1 | 7831.69 | 81.01 | 90.35 | 77.93 | 74.28 | 33.42 | 56.98 | 23.51 |
| 2 | 12,766.34 | 86.55 | 93.79 | 88.91 | 63.60 | 27.98 | 43.99 | 13.66 |
| 3 | 16,689.21 | 87.89 | 95.84 | 91.27 | 53.18 | 27.00 | 35.57 | 8.42 |
| 4 | 20,688.55 | 89.63 | 96.56 | 92.40 | 49.74 | 24.02 | 31.83 | 8.01 |
| 5 | 24,909.56 | 92.09 | 97.64 | 94.35 | 43.58 | 25.00 | 25.87 | 4.88 |
| 6 | 29,973.88 | 92.25 | 98.56 | 95.94 | 40.40 | 25.51 | 22.13 | 5.03 |
| 7 | 36,342.69 | 94.25 | 98.67 | 97.07 | 35.11 | 24.64 | 17.71 | 4.57 |
| 8 | 45,646.12 | 95.94 | 99.49 | 97.69 | 32.29 | 23.72 | 16.27 | 3.13 |
| 9 | 62,070.84 | 96.41 | 99.54 | 98.87 | 25.15 | 22.28 | 11.65 | 3.23 |
| 10 | 143,031.00 | 97.95 | 99.95 | 99.79 | 12.48 | 21.11 | 7.55 | 1.85 |
Notes: The reported values correspond to the average quarterly expenditure per households and are reported in pesos of 2014. We counted rural communities as those with less than 2500 inhabitants. Percentage with income from agriculture are those households that reported to receive any amount of income from agricultural activities, excluding fishing, livestock, and forest activities. Source: ENIGH [25].
Table 5.
Household average expenditure in selected categories per decile of income.
| Decile | Income | Water | Energy | Food | Housing | Education | Health |
|---|---|---|---|---|---|---|---|
| 1 | 7831.69 | 100.44 | 460.04 | 4089.48 | 815.32 | 376.58 | 163.15 |
| 2 | 12,766.34 | 129.56 | 686.68 | 5379.75 | 1251.95 | 617.86 | 285.21 |
| 3 | 16,689.21 | 158.33 | 812.00 | 6195.27 | 1560.76 | 866.29 | 284.25 |
| 4 | 20,688.55 | 211.58 | 919.61 | 6899.69 | 1634.26 | 1217.80 | 266.48 |
| 5 | 24,909.56 | 230.55 | 1005.64 | 7663.01 | 2028.15 | 1457.85 | 342.02 |
| 6 | 29,973.88 | 249.64 | 1102.91 | 8533.51 | 2011.88 | 1675.31 | 424.89 |
| 7 | 36,342.69 | 288.48 | 1230.90 | 9286.99 | 2411.53 | 2072.91 | 449.70 |
| 8 | 45,646.12 | 341.24 | 1412.55 | 10,570.17 | 2875.00 | 2607.54 | 617.03 |
| 9 | 62,070.84 | 383.35 | 1664.57 | 12,448.27 | 3392.05 | 3722.13 | 882.26 |
| 10 | 143,031.00 | 531.44 | 2568.81 | 16,808.05 | 6560.54 | 8146.90 | 2498.90 |
Notes: The reported values correspond to the average quarterly expenditure per households and are reported in pesos of 2014. Source: ENIGH [25].
Table 6.
Estimated average residential subsidies 2014.
| Decile | Water Cons. m3 | Efficient Cost | Op. Cost | HH Exp. | Direct Subsidy | Economic Subsidy |
|---|---|---|---|---|---|---|
| 1 | 66.4 | 1765.0 | 411.7 | 118.9 | 289.3 | 1353.2 |
| 2 | 78.4 | 2082.0 | 497.6 | 144.2 | 350.8 | 1584.5 |
| 3 | 91.5 | 2431.4 | 603.2 | 173.6 | 428.5 | 1828.2 |
| 4 | 100.9 | 2679.9 | 653.1 | 225.6 | 425.8 | 2026.8 |
| 5 | 111.5 | 2962.5 | 744.9 | 243.4 | 499.0 | 2217.6 |
| 6 | 114.9 | 3052.7 | 759.7 | 264.5 | 494.0 | 2293.0 |
| 7 | 131.6 | 3495.7 | 864.5 | 300.4 | 562.3 | 2631.2 |
| 8 | 136.1 | 3616.5 | 897.4 | 349.9 | 547.0 | 2719.1 |
| 9 | 161.4 | 4289.1 | 1067.6 | 389.4 | 678.0 | 3221.4 |
| 10 | 213.9 | 5683.3 | 1429.2 | 539.1 | 889.9 | 4254.2 |
Notes: The reported values correspond to the average quarterly expenditure per households. Monetary values are reported in pesos of 2014. Exchange rate $13.84 MX per USD. Estimates representative for 29,386,735 households with access to piped water within the property. The direct subsidy is not necessarily the exact difference between Op. Cost—HH Exp because of other indirect subsidies and transfers in place. Source: Own Calculations with data from ENIGH [25] and PIGOO [27].
Table 7.
Subsidy performance by state.
| State | Direct Subsidy | Economic Subsidy | ||||
|---|---|---|---|---|---|---|
| Avg. Subsidy | Ω | Error Exclusion | Avg. Subsidy | Ω | Error Exclusion | |
| Aguascalientes | 379.06 | 1.09 | 0.25 | 3713.97 | 0.89 | 0.14 |
| Baja California | 1005.13 | 0.90 | 0.25 | 2680.81 | 0.92 | 0.18 |
| BCS | 524.54 | 1.05 | 0.25 | 1478.18 | 1.10 | 0.17 |
| Campeche | 870.53 | 0.85 | 0.24 | 2113.84 | 0.95 | 0.18 |
| CDMX | 757.55 | 0.76 | 0.25 | 3068.01 | 0.85 | 0.17 |
| Chiapas | 594.16 | 0.90 | 0.23 | 3059.51 | 0.87 | 0.15 |
| Chihuahua | 844.86 | 0.82 | 0.22 | 2851.97 | 0.87 | 0.14 |
| Coahuila | 182.71 | 1.05 | 0.35 | 1181.37 | 1.02 | 0.26 |
| Colima | 502.63 | 1.07 | 0.25 | 3195.42 | 0.91 | 0.18 |
| Durango | 283.79 | 0.94 | 0.24 | 3265.76 | 0.88 | 0.16 |
| Guanajuato | 592.64 | 0.98 | 0.29 | 2511.74 | 0.97 | 0.17 |
| Guerrero | 114.86 | 1.36 | 0.41 | 852.75 | 1.38 | 0.33 |
| Hidalgo | 359.95 | 0.99 | 0.31 | 1865.88 | 0.97 | 0.20 |
| Jalisco | 500.07 | 0.88 | 0.24 | 3407.53 | 0.86 | 0.16 |
| Mexico | 691.04 | 0.85 | 0.24 | 2099.17 | 0.92 | 0.16 |
| Michoacán | 159.98 | 1.03 | 0.32 | 2185.51 | 0.94 | 0.14 |
| Morelos | 245.22 | 1.03 | 0.32 | 1897.95 | 0.95 | 0.19 |
| Nayarit | 80.06 | 1.02 | 0.31 | 2466.33 | 0.91 | 0.18 |
| Nuevo Leon | 1241.96 | 0.83 | 0.24 | 3066.22 | 0.88 | 0.17 |
| Oaxaca | 126.56 | 1.07 | 0.37 | 1062.52 | 1.06 | 0.28 |
| Puebla | 204.84 | 1.03 | 0.27 | 1305.60 | 1.06 | 0.18 |
| Queretaro | 878.62 | 0.97 | 0.28 | 2443.14 | 0.97 | 0.19 |
| Quintana Roo | −15.10 | 1.46 | 0.32 | 3642.06 | 0.89 | 0.15 |
| San Luis Potosi | 376.47 | 0.94 | 0.30 | 2280.72 | 0.94 | 0.22 |
| Sinaloa | 537.48 | 0.92 | 0.27 | 3259.02 | 0.89 | 0.19 |
| Sonora | 499.61 | 1.00 | 0.24 | 3254.84 | 0.90 | 0.15 |
| Tabasco | 428.70 | 0.84 | 0.29 | 2841.97 | 0.93 | 0.23 |
| Tamaulipas | 582.57 | 0.97 | 0.21 | 3001.42 | 0.90 | 0.13 |
| Tlaxcala | 8.88 | 1.08 | 0.34 | 1927.54 | 0.95 | 0.13 |
| Veracruz | 551.06 | 0.90 | 0.24 | 2038.75 | 0.94 | 0.17 |
| Yucatan | 214.26 | 0.94 | 0.28 | 3758.02 | 0.89 | 0.21 |
| Zacatecas | 456.84 | 0.97 | 0.26 | 2180.37 | 0.95 | 0.18 |
Table 8.
Socioeconomic characteristics of Mexican households, 2014.
| Decile | % of Total HHs | Total Income | Water Exp. | % with a WC in the HH | % with Access to Public Sewerage | % with at Most Elem. Educ. | % Female Head of HH | % Rural |
|---|---|---|---|---|---|---|---|---|
| 1 | 18.99 | 7335.57 | 11.27 | 76.22 | 53.51 | 79.19 | 25.41 | 81.35 |
| 2 | 13.45 | 12,799.52 | 15.93 | 80.92 | 72.52 | 70.61 | 25.95 | 69.85 |
| 3 | 12.11 | 16,752.78 | 17.20 | 88.56 | 77.54 | 65.68 | 25.00 | 69.49 |
| 4 | 10.37 | 20,599.44 | 41.44 | 87.13 | 77.23 | 60.40 | 23.27 | 63.86 |
| 5 | 7.91 | 24,905.85 | 24.30 | 92.86 | 79.87 | 55.84 | 14.94 | 55.84 |
| 6 | 7.75 | 29,649.83 | 17.60 | 95.36 | 81.46 | 52.98 | 21.19 | 52.32 |
| 7 | 5.75 | 36,078.45 | 46.24 | 96.43 | 85.71 | 42.86 | 19.64 | 43.75 |
| 8 | 4.06 | 44,741.21 | 41.85 | 97.47 | 88.61 | 37.97 | 17.72 | 50.63 |
| 9 | 3.59 | 61,757.31 | 109.07 | 98.57 | 94.29 | 48.57 | 17.14 | 40.00 |
| 10 | 2.05 | 108,837.80 | 15.88 | 100.00 | 97.50 | 40.00 | 25.00 | 32.50 |
Notes: The reported values correspond to the average quarterly expenditure per households and are reported in pesos of 2014. We counted rural communities as those with less than 2500 inhabitants. Percentage with income from agriculture are those households that reported to receive any amount of income from agricultural activities, excluding fishing, livestock, and forest activities. Source: ENIGH [25].
Table 9.
Determinants of consumption subsidy performance.
| Benefit Incidence | Beneficiary Incidence | Material Impact of Subsidy | |
|---|---|---|---|
| Indicator | Ω | Error of exclusion (% of poor not benefiting from subsidy) | Subsidy as a percentage of total household income or consumption (among subsidy recipients who are poor) |
| Access factors | |||
| Access ratio: Access to network in household’s neighborhood | X | X | |
| Uptake ratio: Uptake rate among households with access | X | X | |
| Subsidy design factors | |||
| Targeting ratio: Share of eligible households targeted for subsidy | X | X | |
| Subsidy rate ratio: Average rate of subsidization among beneficiary households | X | X | |
| Quantity ratio: Average quantity consumed among beneficiary households | X | X | |
| Cost: Average cost of production, transmission, and distribution | X | ||
Source: Authors’ elaboration using Komives et al. [2].
© 2019 by the authors. Licensee MDPI, Basel, Switzerland. This article is an open access article distributed under the terms and conditions of the Creative Commons Attribution (CC BY) license (http://creativecommons.org/licenses/by/4.0/).
Share and Cite
MDPI and ACS Style
Borja-Vega, C.; Garcia Morales, E.E.; Gonzalez, J.A. Incidence of Subsidies in Residential Public Services in Mexico: The Case of the Water Sector. Water 2019, 11, 2078. https://doi.org/10.3390/w11102078
AMA Style
Borja-Vega C, Garcia Morales EE, Gonzalez JA. Incidence of Subsidies in Residential Public Services in Mexico: The Case of the Water Sector. Water. 2019; 11(10):2078. https://doi.org/10.3390/w11102078
Chicago/Turabian StyleBorja-Vega, Christian, Emmanuel E. Garcia Morales, and Julio A. Gonzalez. 2019. "Incidence of Subsidies in Residential Public Services in Mexico: The Case of the Water Sector" Water 11, no. 10: 2078. https://doi.org/10.3390/w11102078
Note that from the first issue of 2016, this journal uses article numbers instead of page numbers. See further details here.