Article

Hydrogen and Oxygen Isotope Composition and Water Quality Evaluation for Different Water Bodies in the Ebinur Lake Watershed, Northwestern China

1
Key Laboratory of Oasis Ecology, Xinjiang University, Urumqi 830046, China
2
Key Laboratory of Smart City and Environmental Modeling of Higher Education Institute, College of Resources and Environment Sciences, Xinjiang University, Urumqi 830046, China
3
Engineering Research Center of Central Asia Geoinformation Development and Utilization, National Administration of Surveying, Mapping and Geoinformation, Urumqi 830002, China
4
Department of Earth Sciences, The University of Memphis, Memphis, TN 38152, USA
*
Author to whom correspondence should be addressed.
Water 2019, 11(10), 2067; https://doi.org/10.3390/w11102067
Submission received: 12 August 2019 / Revised: 28 September 2019 / Accepted: 29 September 2019 / Published: 3 October 2019
(This article belongs to the Section Water Quality and Contamination)

Abstract

:
Wetlands are sensitive indicators of climate change and have a profound impact on the supply of water resources in surrounding areas. In this study, the hydrochemical, isotopic characteristics (δ18O and δ2H) of groundwater and surface water (lake, reservoir, and river) in the Ebinur Lake Watershed, northwestern China, were investigated to reveal the relationships between various water bodies. The results suggest that the groundwater is alkaline and has pH and total dissolved solids (TDS) values less than those of surface water. Ca2+ and SO42− are the major ions in the groundwater and river water, whereas lake water and reservoir water are enriched in Na+ and SO42−. With the decrease in elevation, both groundwater and river water are affected by carbonate dissolution at high elevation and by evaporitic rock dissolution at low elevation; thus, the water surrounding Ebinur Lake is subjected to runoff affected by intense evaporation–dissolution of evaporitic rocks. The stable isotope compositions suggested that the upstream part of the river is recharged by glacial meltwater from high mountains, whereas the middle–downstream parts of the river are recharged by low-elevation precipitation. Shallow groundwater and reservoir water are mainly recharged by river water and are more enriched in the downstream part of river. Water samples were also classified according to different indices, such as chemical oxygen demand (COD), NH3-N, volatile phenol, sulfate, Zn, Co, Cu, total hardness, and Cr6+, and results showed that most groundwater is suitable for drinking and irrigation purposes. Except for Cr6+, the metal concentrations are within permissible limits. However, both groundwater and reservoir water are affected to some extent by nearby rivers from anthropogenic activity.

Graphical Abstract

1. Introduction

Decreases in water resources are one of the most important problems in arid and semi-arid regions, where rainfall is low and evaporation is high [1,2]. With rapid population growth and expanding economic activities, the need of freshwater supplies for agriculture, industry, and domestic use increased dramatically [3]. Due to this and based on the consideration of various potential sources, a detailed understanding of the recharge mechanisms and hydraulic interactions between different water sources is required for understanding the local water cycle and further guiding sustainable utilization of water resources in the Ebinur Lake Watershed, China. Stable isotopes and their potential application for detecting various and complex water system processes are becoming more important in research [4,5,6,7,8,9,10,11]. Stable isotopes are widely used in arid and semi-arid environments to determine the evaporation extent of recharge sources, recharge conditions, and mixing proportions of water [12,13].
Water quality is of vital concern, as poor water quality adversely affects plant growth and human health. For instance, some trace elements such as Fe, Cu, and Zn are needed by the human body to activate vital functions and biological processes [14]. Other toxic heavy metals, such as Cr6+ and Co, are mostly discharged in wastewater from factories and mines and cannot be metabolized by microorganisms after entering the water. Through enrichment within the food chain, these elements can gradually increase in concentration by orders of magnitude in higher organisms before being ingested by the human body. These elements are introduced to water from a variety of natural and anthropogenic sources. Due to rapid economic development in recent years, the population in the Ebinur Lake basin increased drastically. In order to meet human needs and increase economic development, a large number of high-pollution enterprises emerged near Bole city, Jinghe county, and other towns in China. Pollution caused by various industrial and mining enterprises, agricultural, animal husbandry, and fishing industry activities, and urban wastewater all led to excessive pollution of organic matter (such as total nitrogen) in the river basin. To better utilize water resources, a number of studies were conducted to assess water quality [15,16,17,18].
The study area has a dry climate and strong evaporation; glacial meltwater, surface runoff, and groundwater cannot compensate for evaporation in the Ebinur Lake Watershed. Its unique water circulation system makes it highly sensitive to climate change and the impact of human activities [19]. In recent years, with the large-scale management of soil and water resources, desertification and salinization in the watershed were significantly intensified, causing the ecosystem to deteriorate, which seriously affected the interacting biotic and abiotic functions of the watershed [20]. Therefore, maintaining the water quality of different water bodies in the watershed is an important means to maintain the health of the ecosystem in the study area. Previous studies in the Ebinur Lake Watershed mainly focused on water quality [21,22], pollution source analysis [23,24], river basin ecological service value [25], etc. However, there is no in-depth study on δ2H and δ18O isotope compositions and water chemistry characteristics of different water bodies in the Ebinur Lake Watershed.
In this study, we investigate the δ2H–δ18O isotopic and hydrochemical composition of surface water (lake, reservoir, and river) and groundwater in the Ebinur Lake Watershed. We try to answer the following three questions: (1) What are the similarities and differences in hydrochemistry and water quality between different water bodies? (2) What are the recharge sources and water pathways in the Ebinur Lake Watershed? (3) What are the mechanisms of water pollution transfer among different water bodies?

2. Study Area

The Ebinur Lake Watershed (44°05′–45°08′ north (N), 82°35′–83°16′ east (E)) is located in northwest Xinjiang, China (Figure 1). The study area is 50,621 km2. It is surrounded by mountainous (24,317 km2; Alatau Mountains) and lowland areas (26,304 km2) to the north, west, and south [26]. The area has a temperate arid continental climate characterized by drought, low precipitation, and severe temperature variation, with an annual average temperature of 6.6–7.8 °C and annual precipitation of 116.0–169.2 mm. The Statistical Yearbook of Bortala Mongol Autonomous Prefecture in 2017 showed that the total water resources in the state were 2.39 × 10⁹ m3, of which surface water and groundwater accounted for 91.80% and 8.15%, respectively. According to the analysis, the amount of groundwater was only 8.15% of the total water resources, but it supplied nearly half of the water consumption in the basin, with an increasing trend.
There are 12 tributaries in the study area. Their average annual runoff is approximately 2.026 × 10⁹ m3, but Ebinur Lake is currently fed by only two rivers (surface runoff), the Bortala River and the Jing River [27].
Ebinur Lake Watershed is surrounded by mountains on three sides, and one side is open in the shape of a trumpet and flared toward the lake. It is composed of the Bortala River basin, Jing River basin, Kuitun River basin, and Ebinur Lake area. The mountains on both sides of the Bortala River are clastic rocks containing carbonates with a medium degree of water storage capacity (Figure 2). The Kuitun and Jinghe Basins are loose rock pore water-bearing rocks with a weak degree of water storage capacity (Figure 2). The northeast side of Ebinur Lake basin has a water-bearing formation of intrusive rocks with a medium degree of water storage capacity (Figure 2). Most of the basins are quaternary deposits, whose thicknesses vary greatly due to the fluctuation of the basement rock. Generally, the depth of groundwater in the piedmont is more than 30 m, and the depth from piedmont to valley is from deep to shallow, with only a few meters near the valley (Figure 2).The mountain area in the study area is the formation area of water resources, and the annual precipitation can reach 300–500 mm. Precipitation in the mountain area is stored in reservoirs (snow and ice melt into surface water), surface runoff, and the ground (bedrock and groundwater spring).
Due to the climate and topography, the Ebinur Lake Watershed has frequent strong winds, sandstorms, and dust storms [28]. In the past 40 years, the Ebinur Lake surface area decreased to 542 km2 due to the substantial evaporation in the arid area and a significant decrease in precipitation, as well as the unbalance between water supply and demand. The intensification of desertification in the Ebinur Lake Watershed directly threatens the ecological balance and social development in the northern part of Xinjiang.

3. Materials and Methods

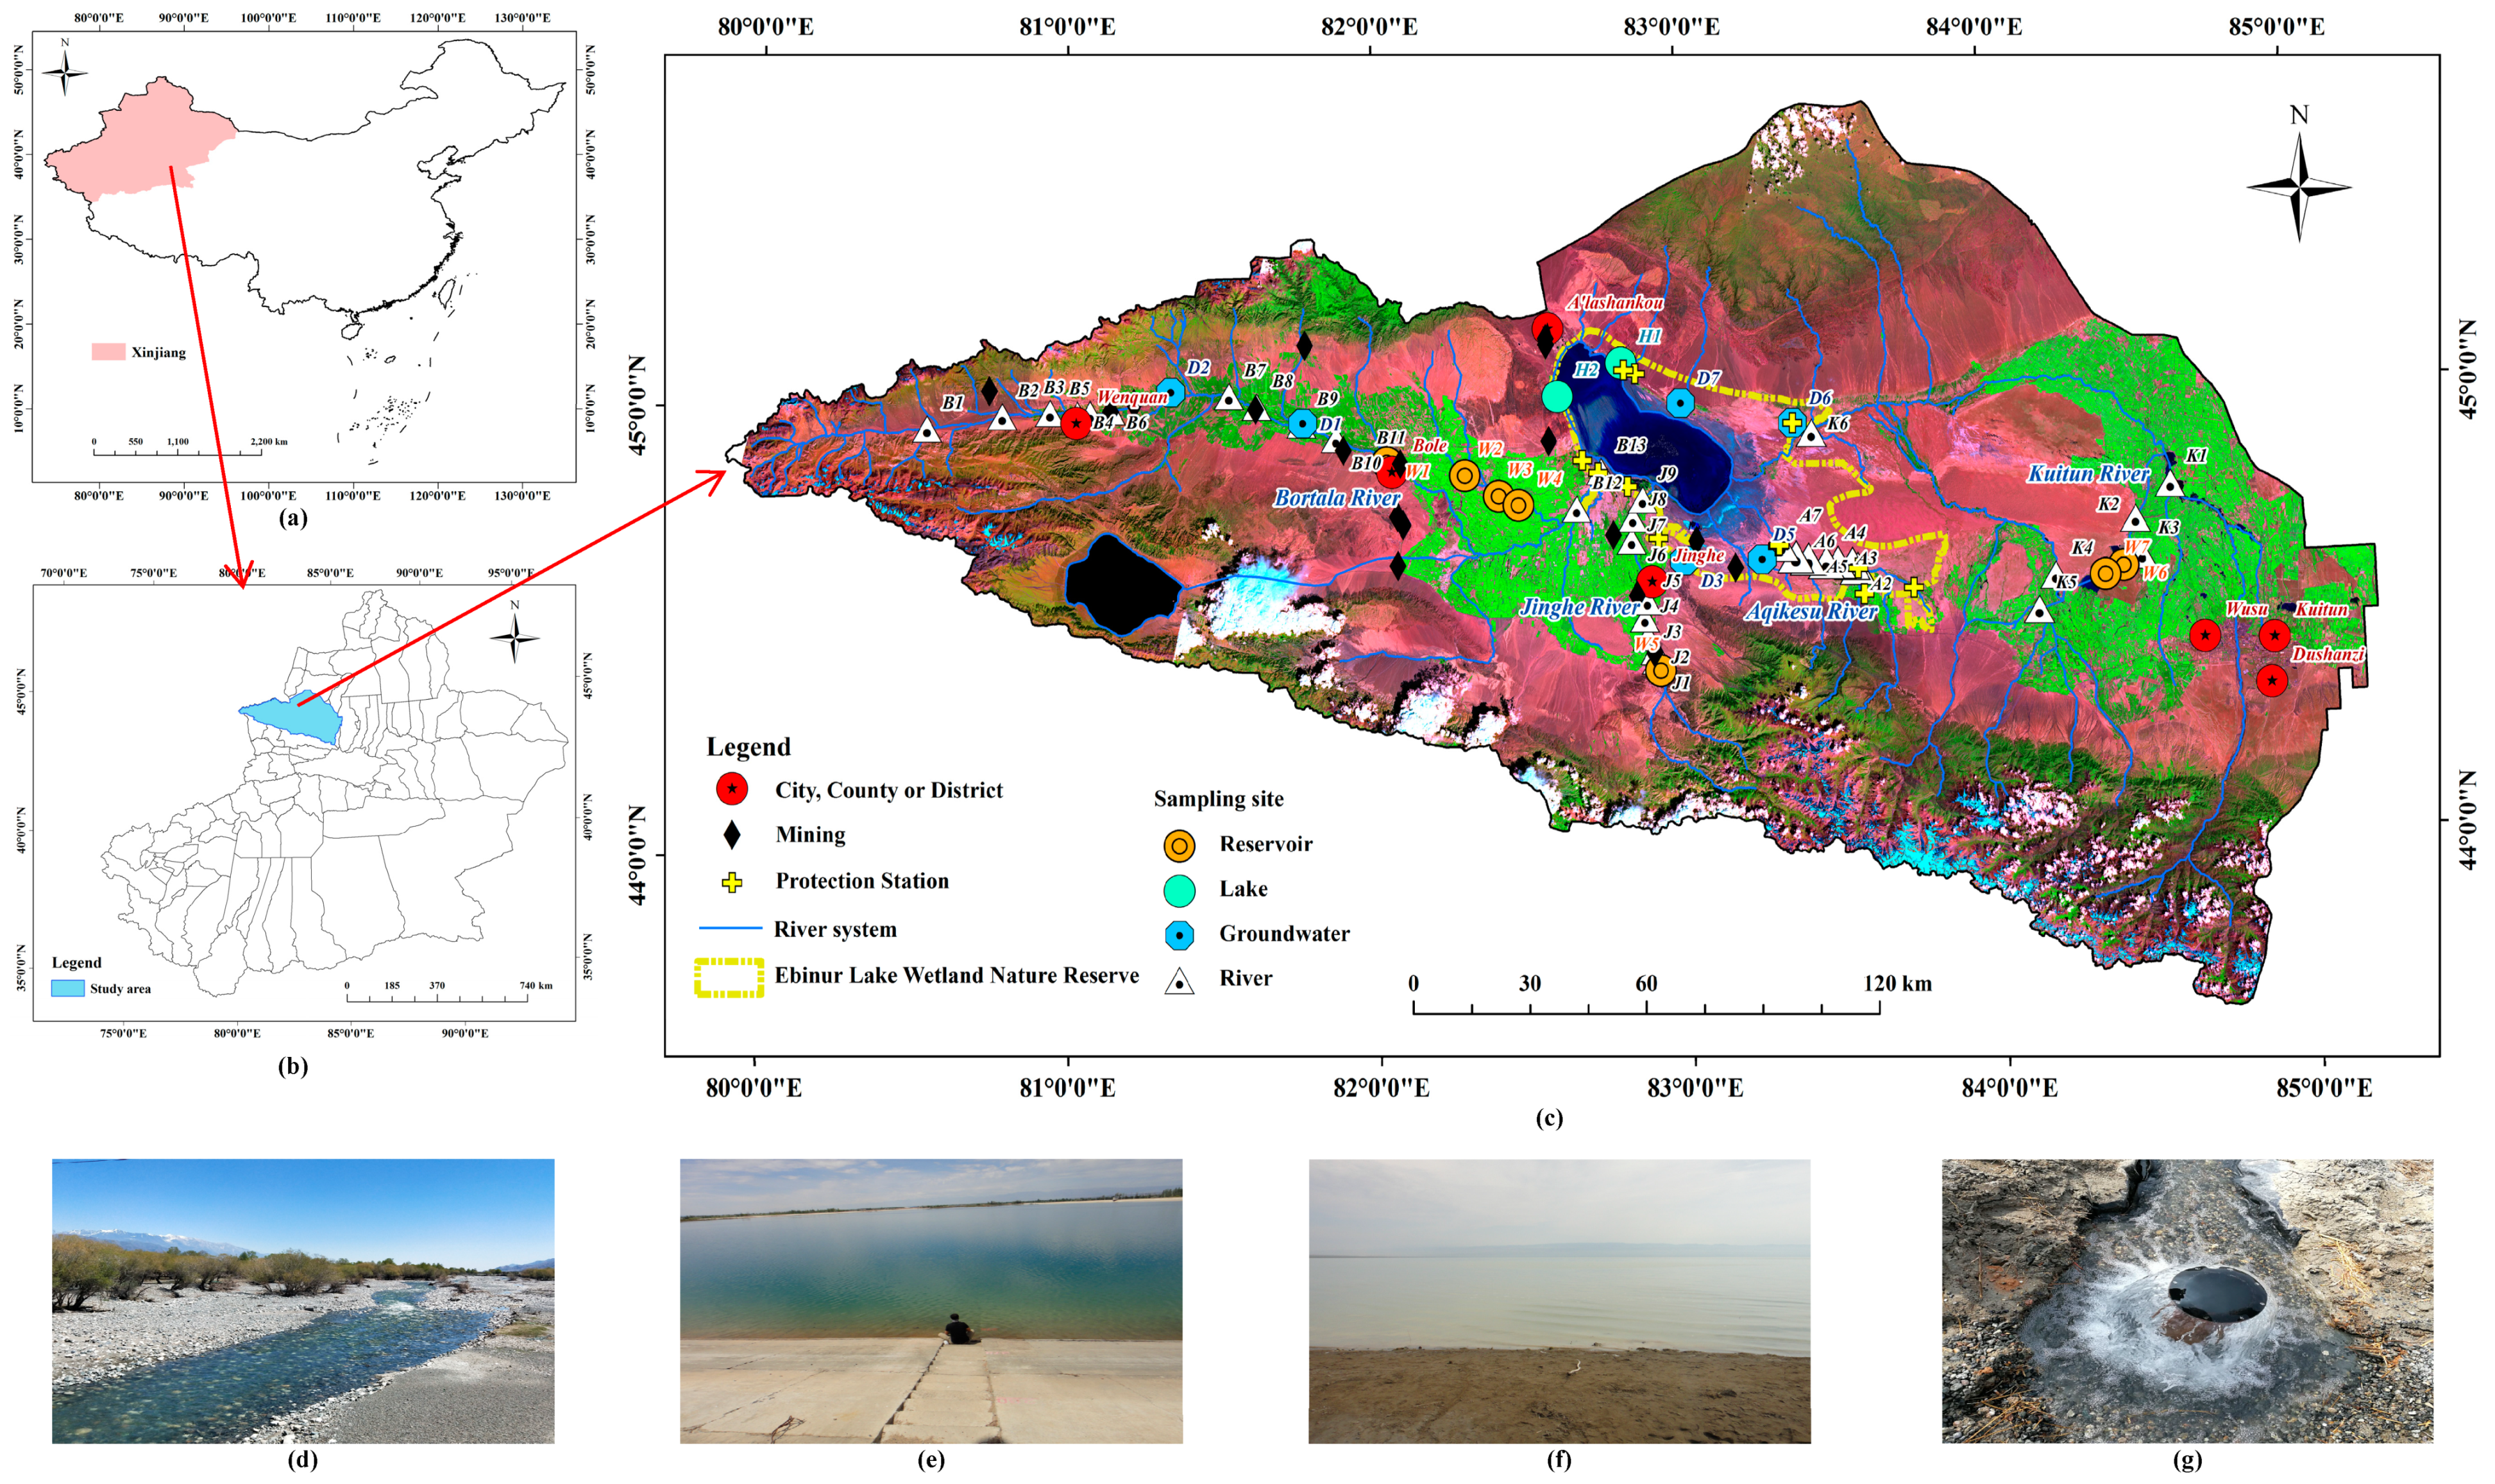
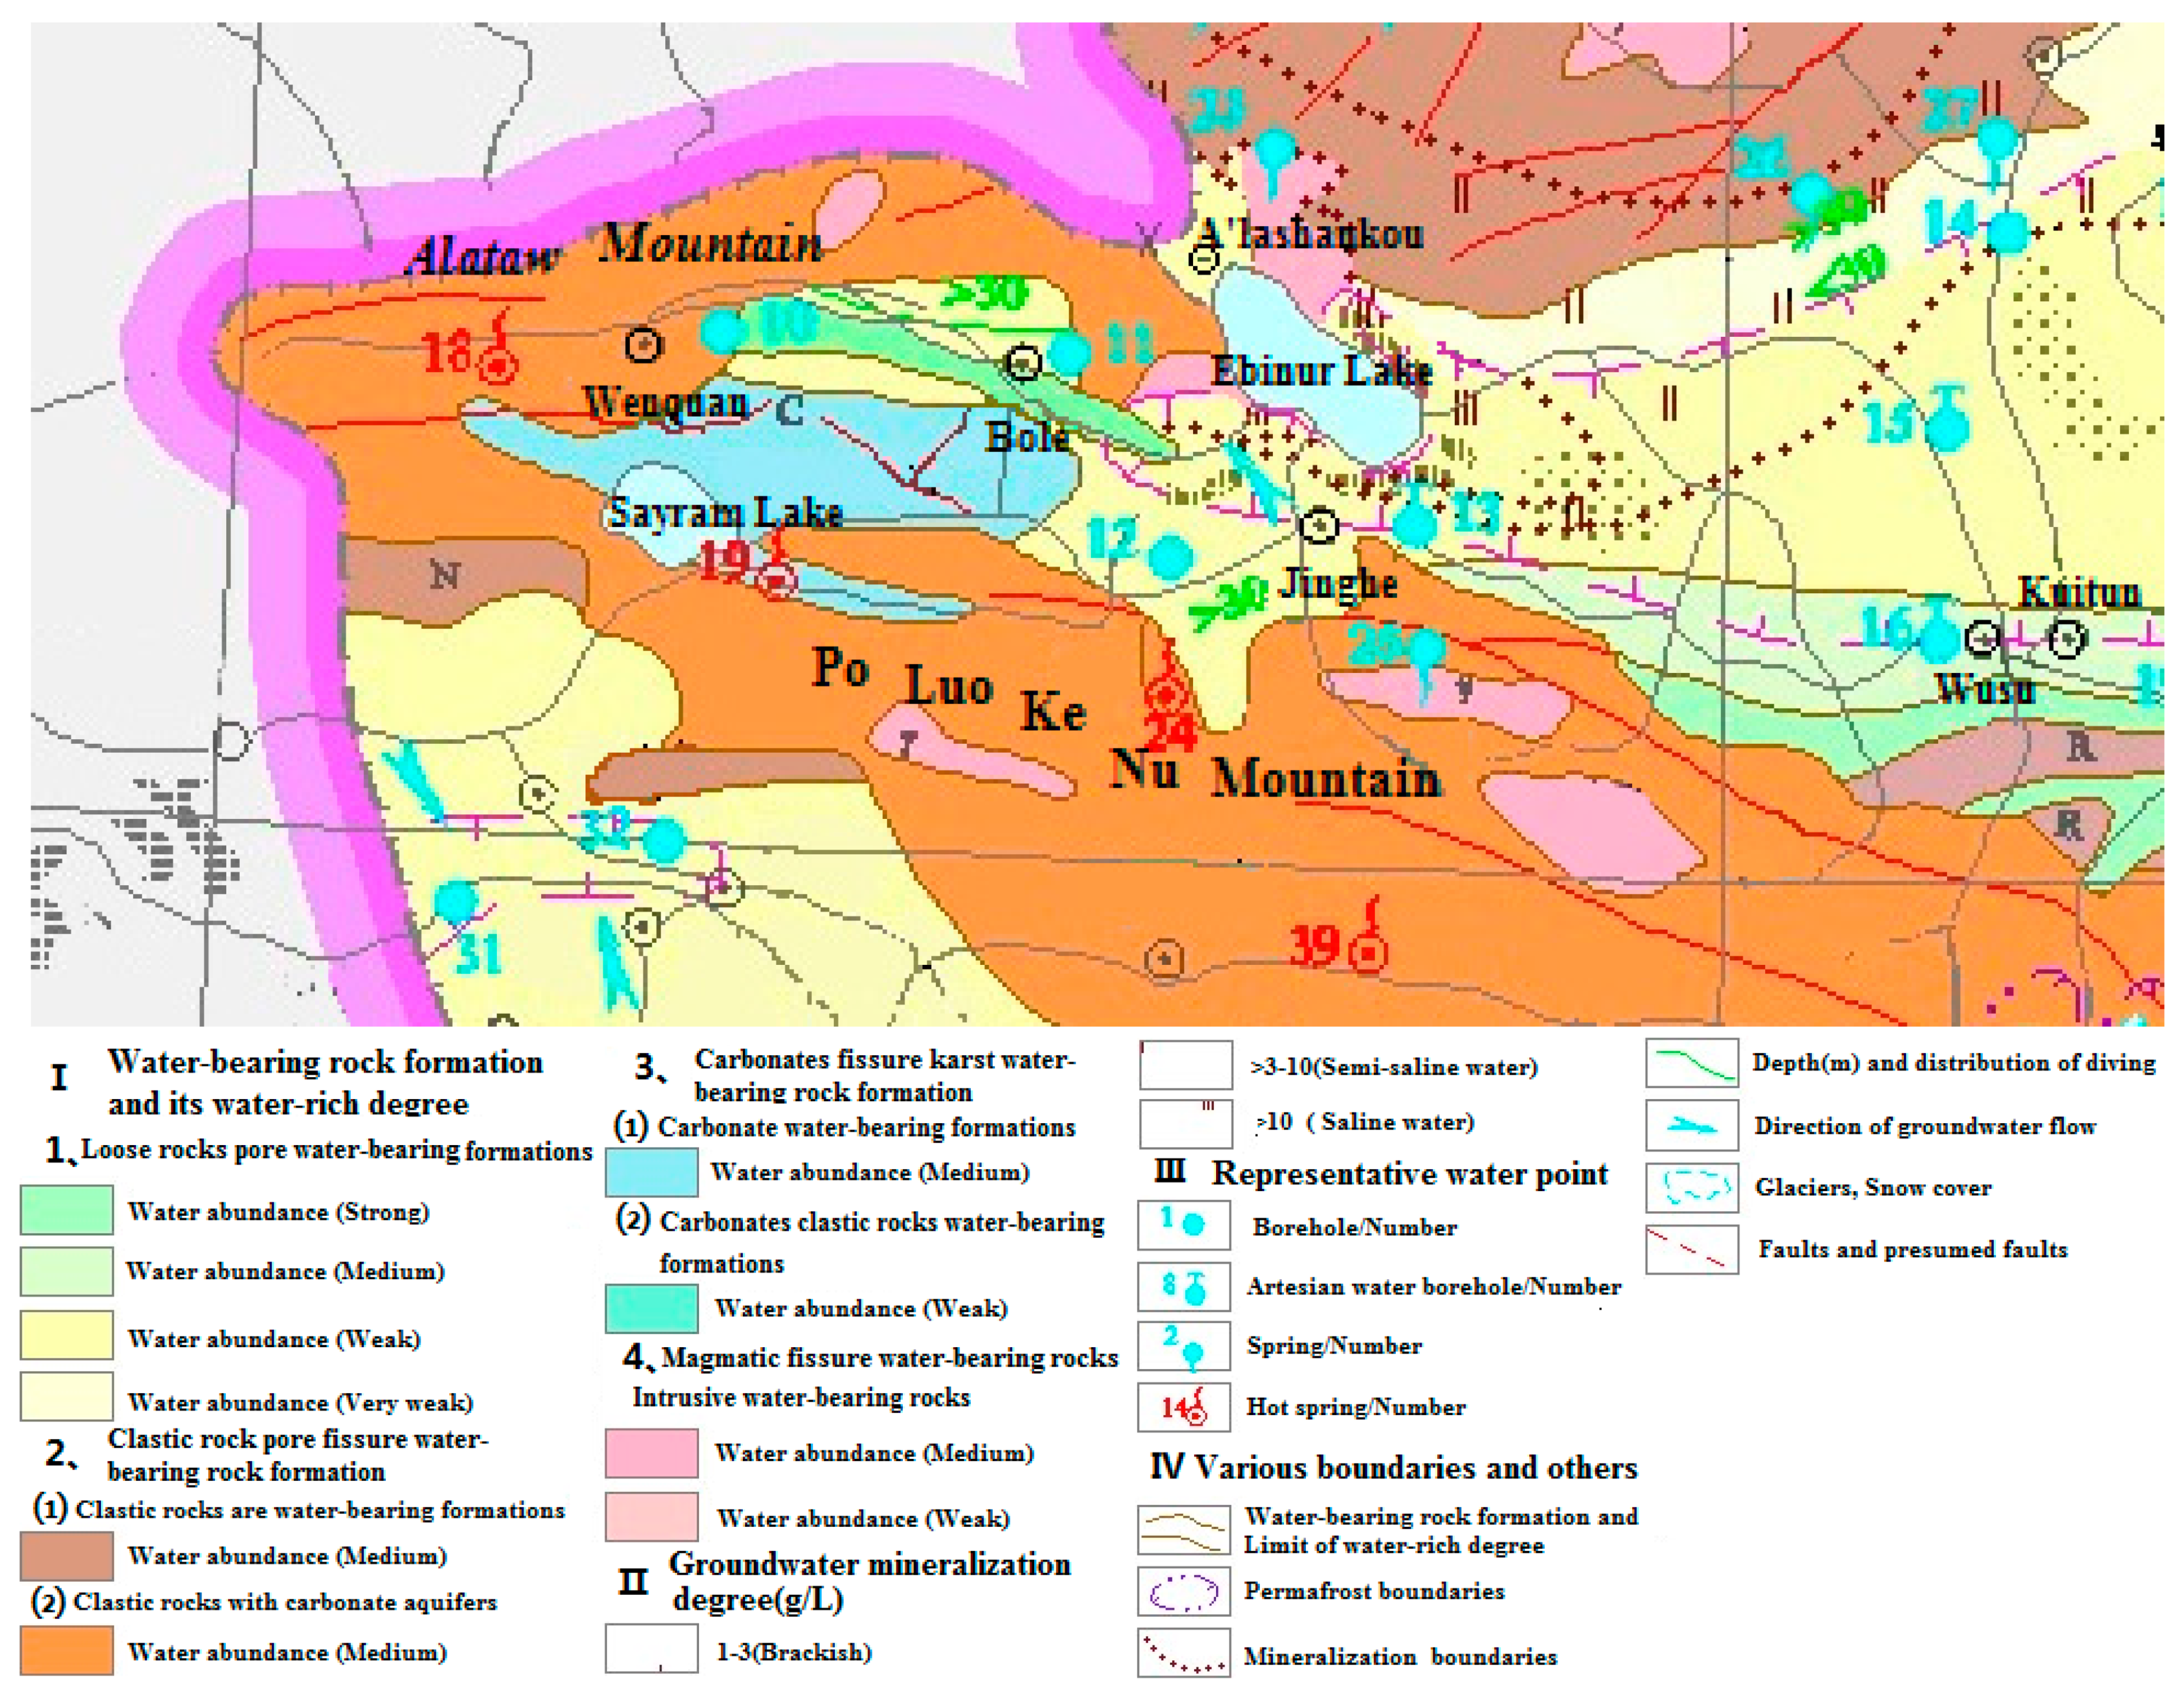
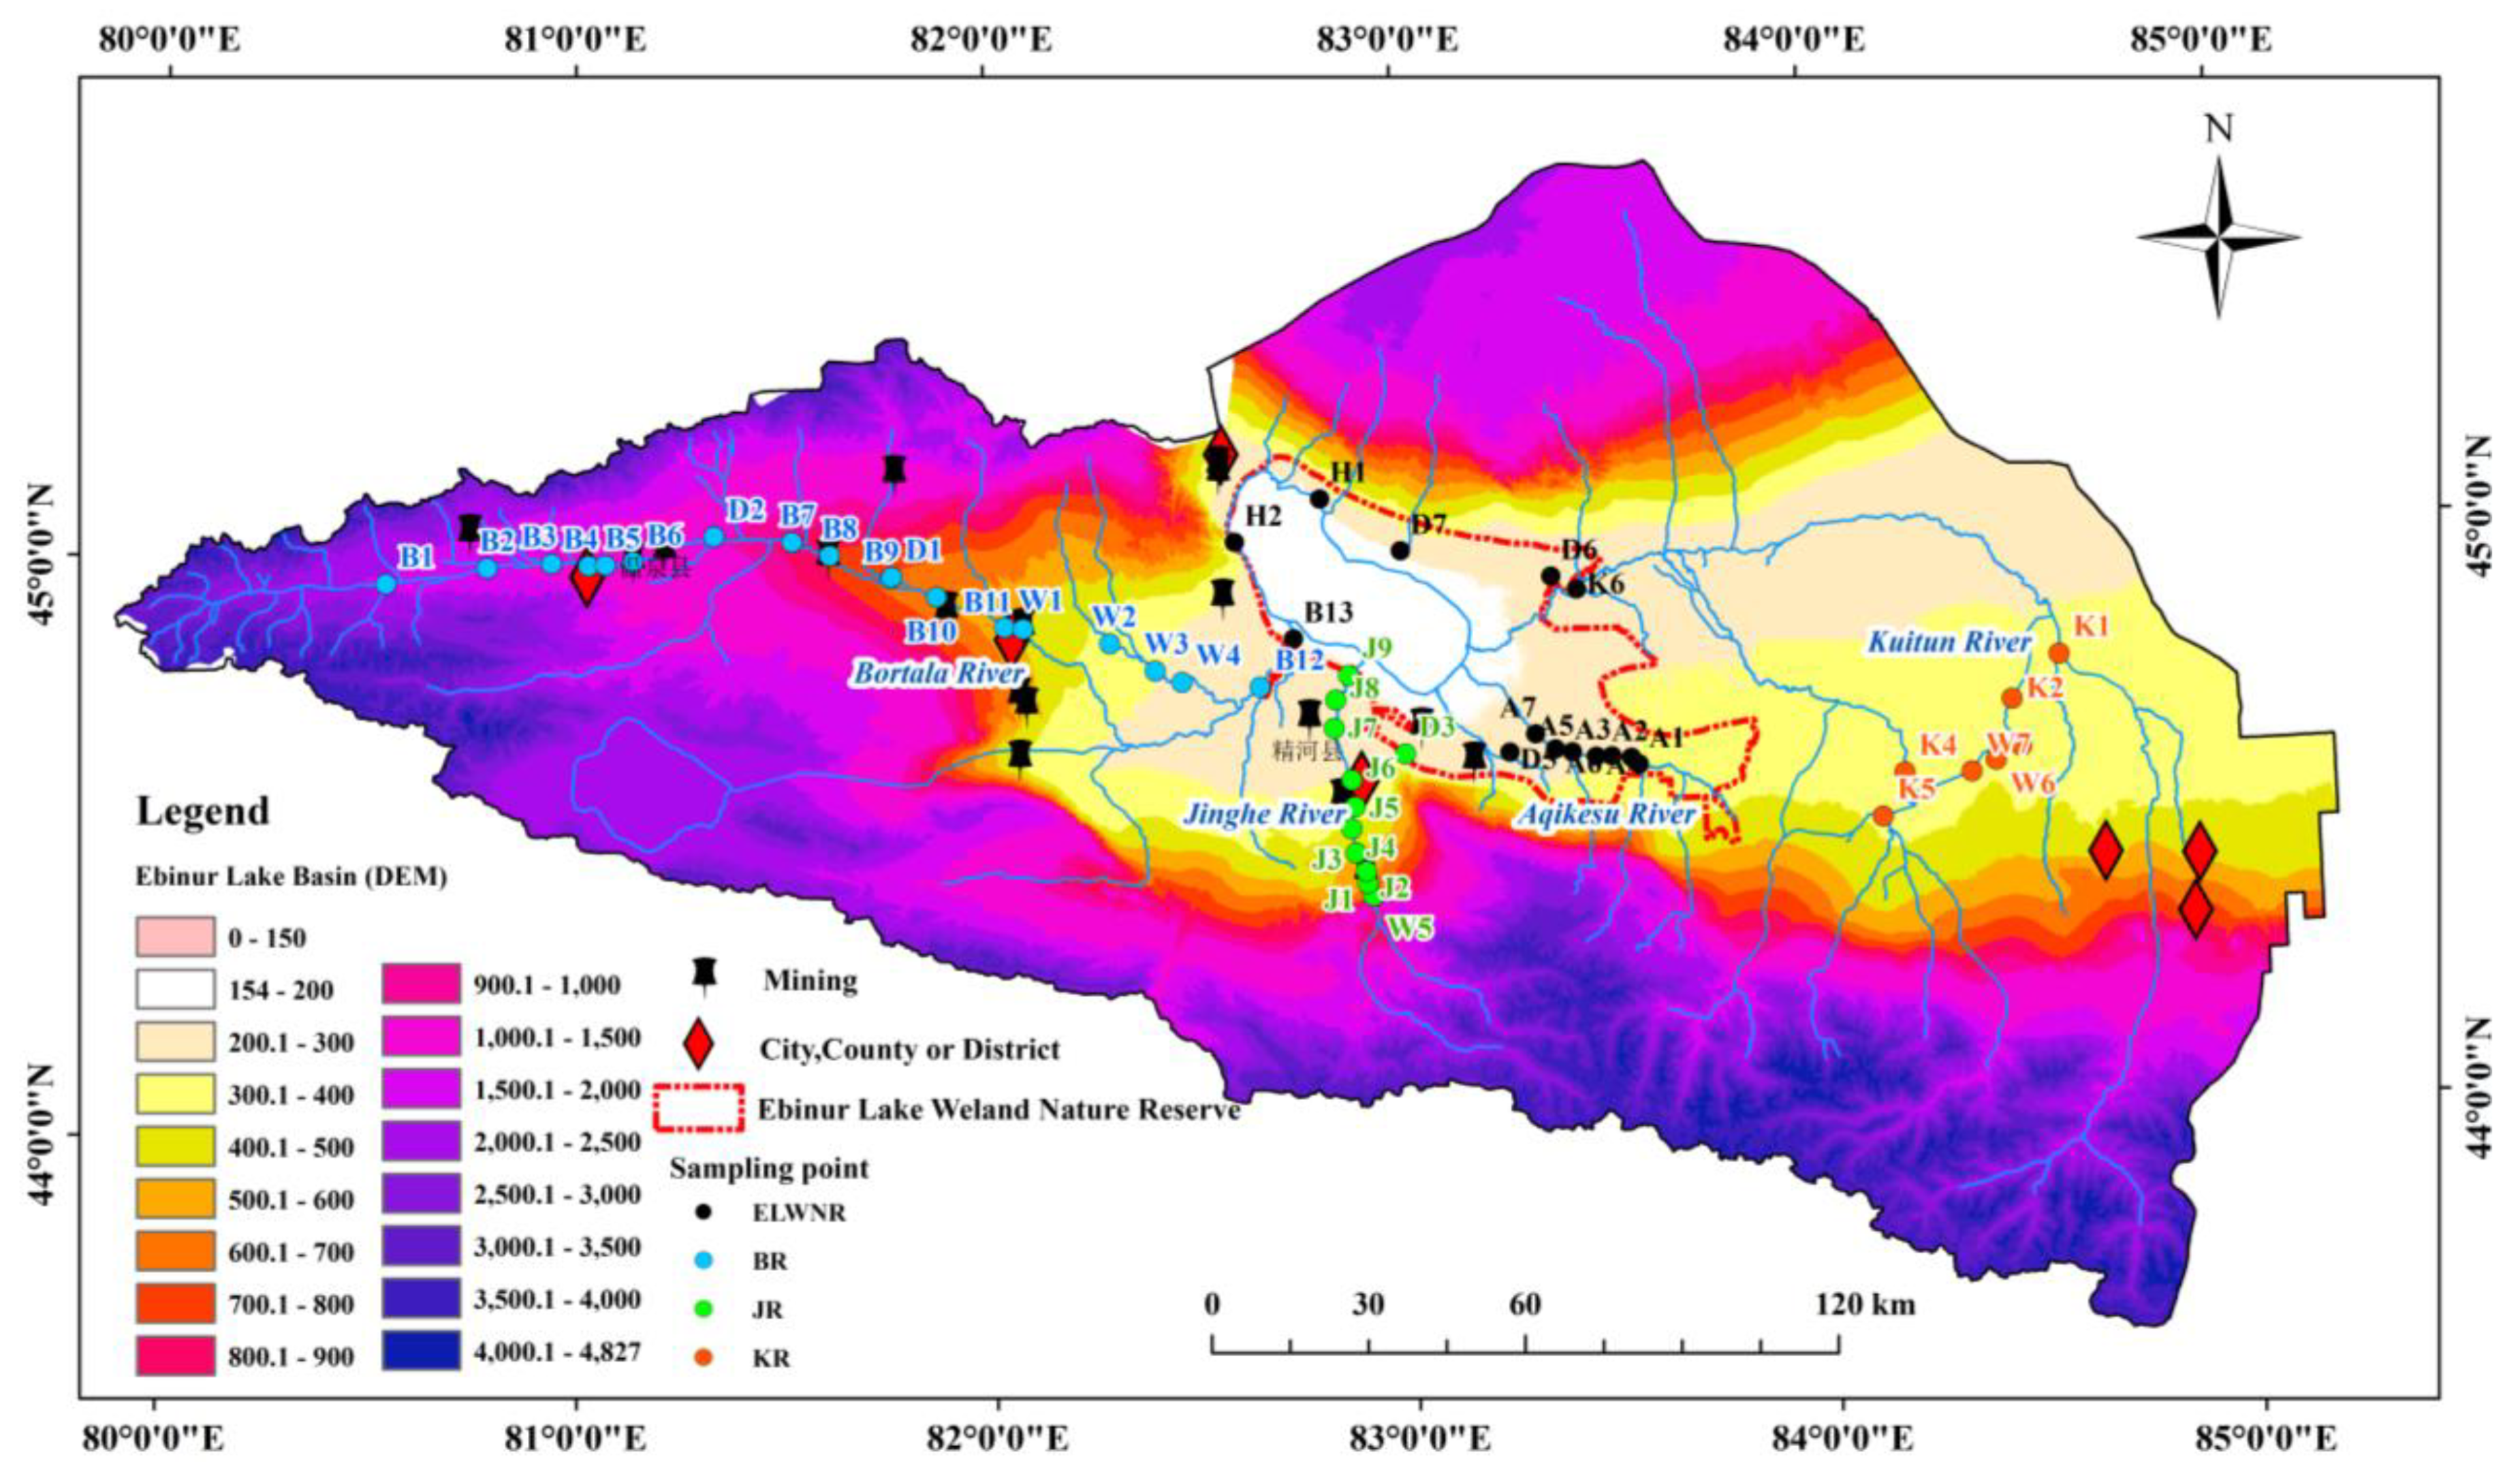
3.1. Site Description and Water Data

The geographical location of Ebinur Lake basin is representative of the water environment problems in arid areas, but there is a lack of data related to water. Therefore, our team conducted regular water sample collection and research on the surface water of this region since October 2016. Moreover, by looking into river discharges (Figure 16), chemicals and isotopes from samples carried out in May are much representative of the groundwater bodies as they were not influenced by unsaturated zones. In order to explore the relationship between different water bodies, the initial collection of different water bodies was conducted during the spring season of the research area.
Water samples from groundwater (6 samples) and surface water (44 samples) were collected in the Ebinur Watershed in May 2018 (Table 1). The sampling locations are illustrated in Figure 1. Sampling details are as follows:
Groundwater (n = 6): Along the Bortala River, groundwater samples were collected from two different wells in different villages. Samples were also collected near the Jing River, the Aqikesu River, the Kuitun River, and the Ebinur Lake Wetland.
River (n = 35): River water samples were collected from the Bortala River (13 samples), Jing River (9 samples), Kuitun River (6 samples), and Aqikesu River (7 samples).
Reservoir (n = 7): Samples were collected from five reservoirs on the Bortala River and two ponds on the Kuitun River.
Lake (n = 2): Ebinur Lake is located in a protected area of the Ebinur Lake Wetland. It is difficult to collect water samples from the lake. Hence, only two samples were collected from the Ebinur Lake.
Groundwater samples were mostly taken from depths of 5–7 m in wells in towns or protection stations in the basin. Surface water samples were taken from depths of 0.5–1.0 m under the surface of the water. All samples were filtered through 0.45-μm membrane filters and stored in 1-L polyethylene bottles. Prior to collection, the bottles were rinsed three times using distilled water. For each sampling site, two bottles of water were collected. One bottle was used for water quality indices analyses, while another bottle was used for major ions and stable isotope analyses. All samples were stored below 4 °C until they were analyzed. Total dissolved solids (TDS) and pH were measured in the field. The nine parameters of total hardness (TH), sulfate, ammonia nitrogen (NH3-N), chemical oxygen demand (COD), volatile phenol (VP), zinc (Zn), cobalt (Co), copper (Cu), and chromium (Cr6+) were all detected by a multi-parameter water quality analyzer (GDYS-201M, Jilin University Little Swan Instruments Co. Ltd., Changchun, China) within 12 hours of sample collection (see Table 2).
The other samples were analyzed for major ion and stable isotopes at the Xinjiang Institute of Ecology and Geography, Chinese Academy of Sciences. The 5-mL water samples used for stable hydrogen–oxygen isotope analyses were placed in glass bottles and sealed with Parafilm. All isotopic samples were kept at a low temperature of 2 °C two days before the analysis. Analysis occurred at the State Key Lab Desert and Oasis Ecology, Urumqi, China, using a liquid water isotope analyzer (LGR DLT-100) developed by Los Gatos Research Inc. To minimize measurement errors, each sample was measured three times and then averaged. If results were significantly different, the sample measurement was repeated three times to obtain the data with the smallest error. The results were expressed as δ (‰), defined by
δ = R S a m p l e R V S M O W R V S M O W × 1000
where δ is the isotopic deviation in ‰, RSample is the isotopic ratio (2H/1H, 18O/16O) of the sample, and RVSMOW is the isotopic ratio of the international reference. All δ values of water samples are conventionally reported relative to the international standard VSMOW (Vienna Standard Mean Ocean Water) [29]. The reproducibility measurements of δ18O and δ2H were ±0.1‰ and ±0.8‰, respectively. The deuterium excess (d-excess) is defined as the deviation from the meteoric water [30] as follows:
d-excess = δ2H − 8 × δ18O.
The d-excess is related to evaporative fractionation of isotopes and the temperature and humidity conditions during evaporation. [31]. The analytical results of the isotopic composition of water are shown in Table 1.

3.2. Software

A remote sensing image of the study area was processed in the Environment for Visualizing Images (ENVI) software (version 5.1, ITT Visual Information Solutions, Boulder, CO, USA). Major ion compositions were used to identify the water types with the help of the OriginPro software (version 9.1, OriginLab, Northampton, MA, USA). Arc GIS (version 10.3, Esri, Redlands, CA, USA) was used for mapping sample locations and showing their spatial distribution.

4. Results

4.1. Chemical Composition of Different Water Bodies in Ebinur Lake Basin

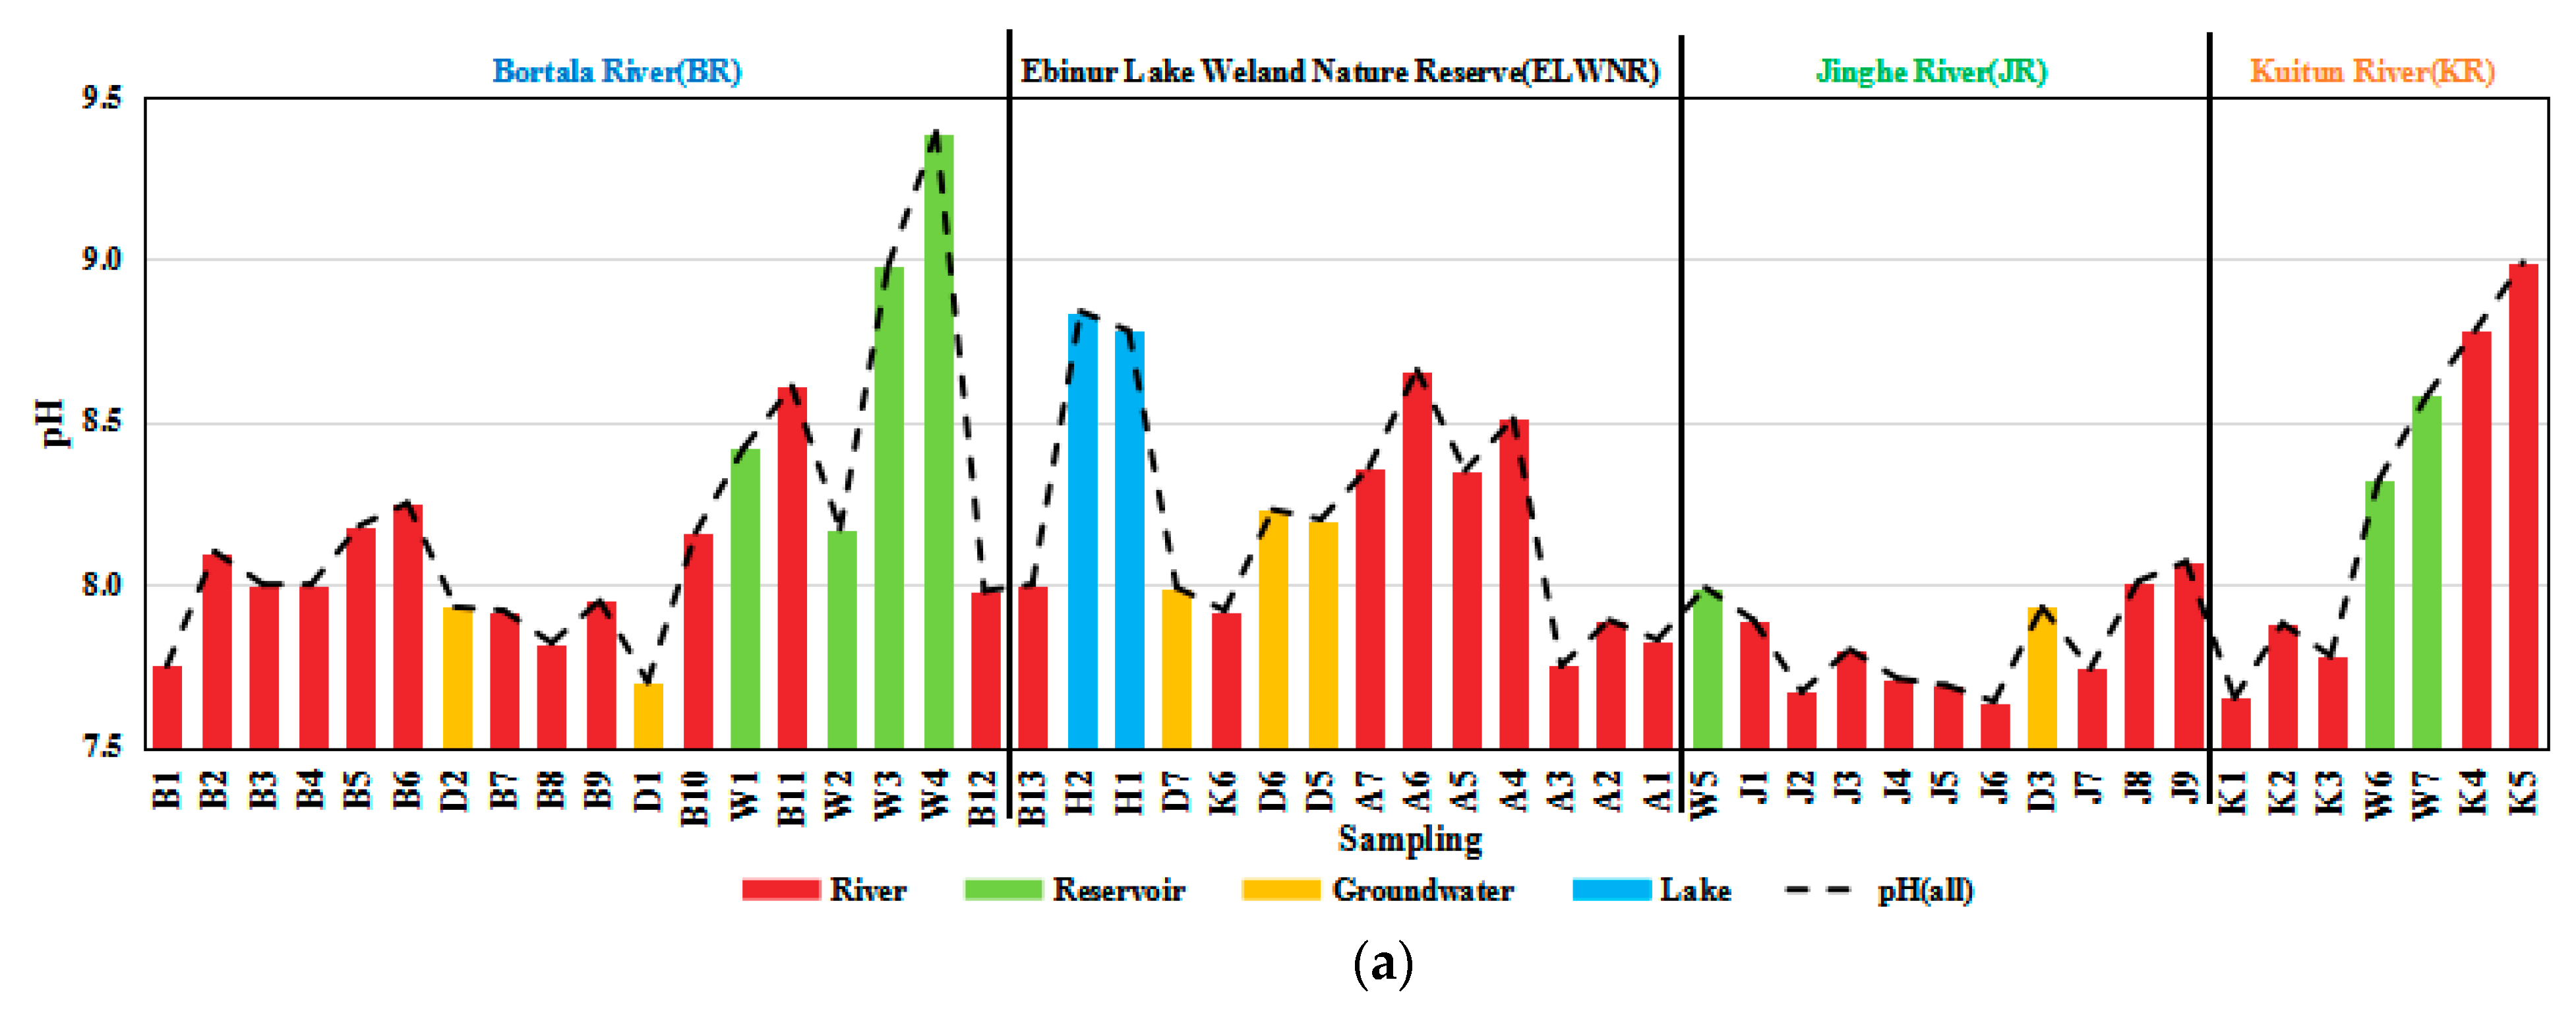
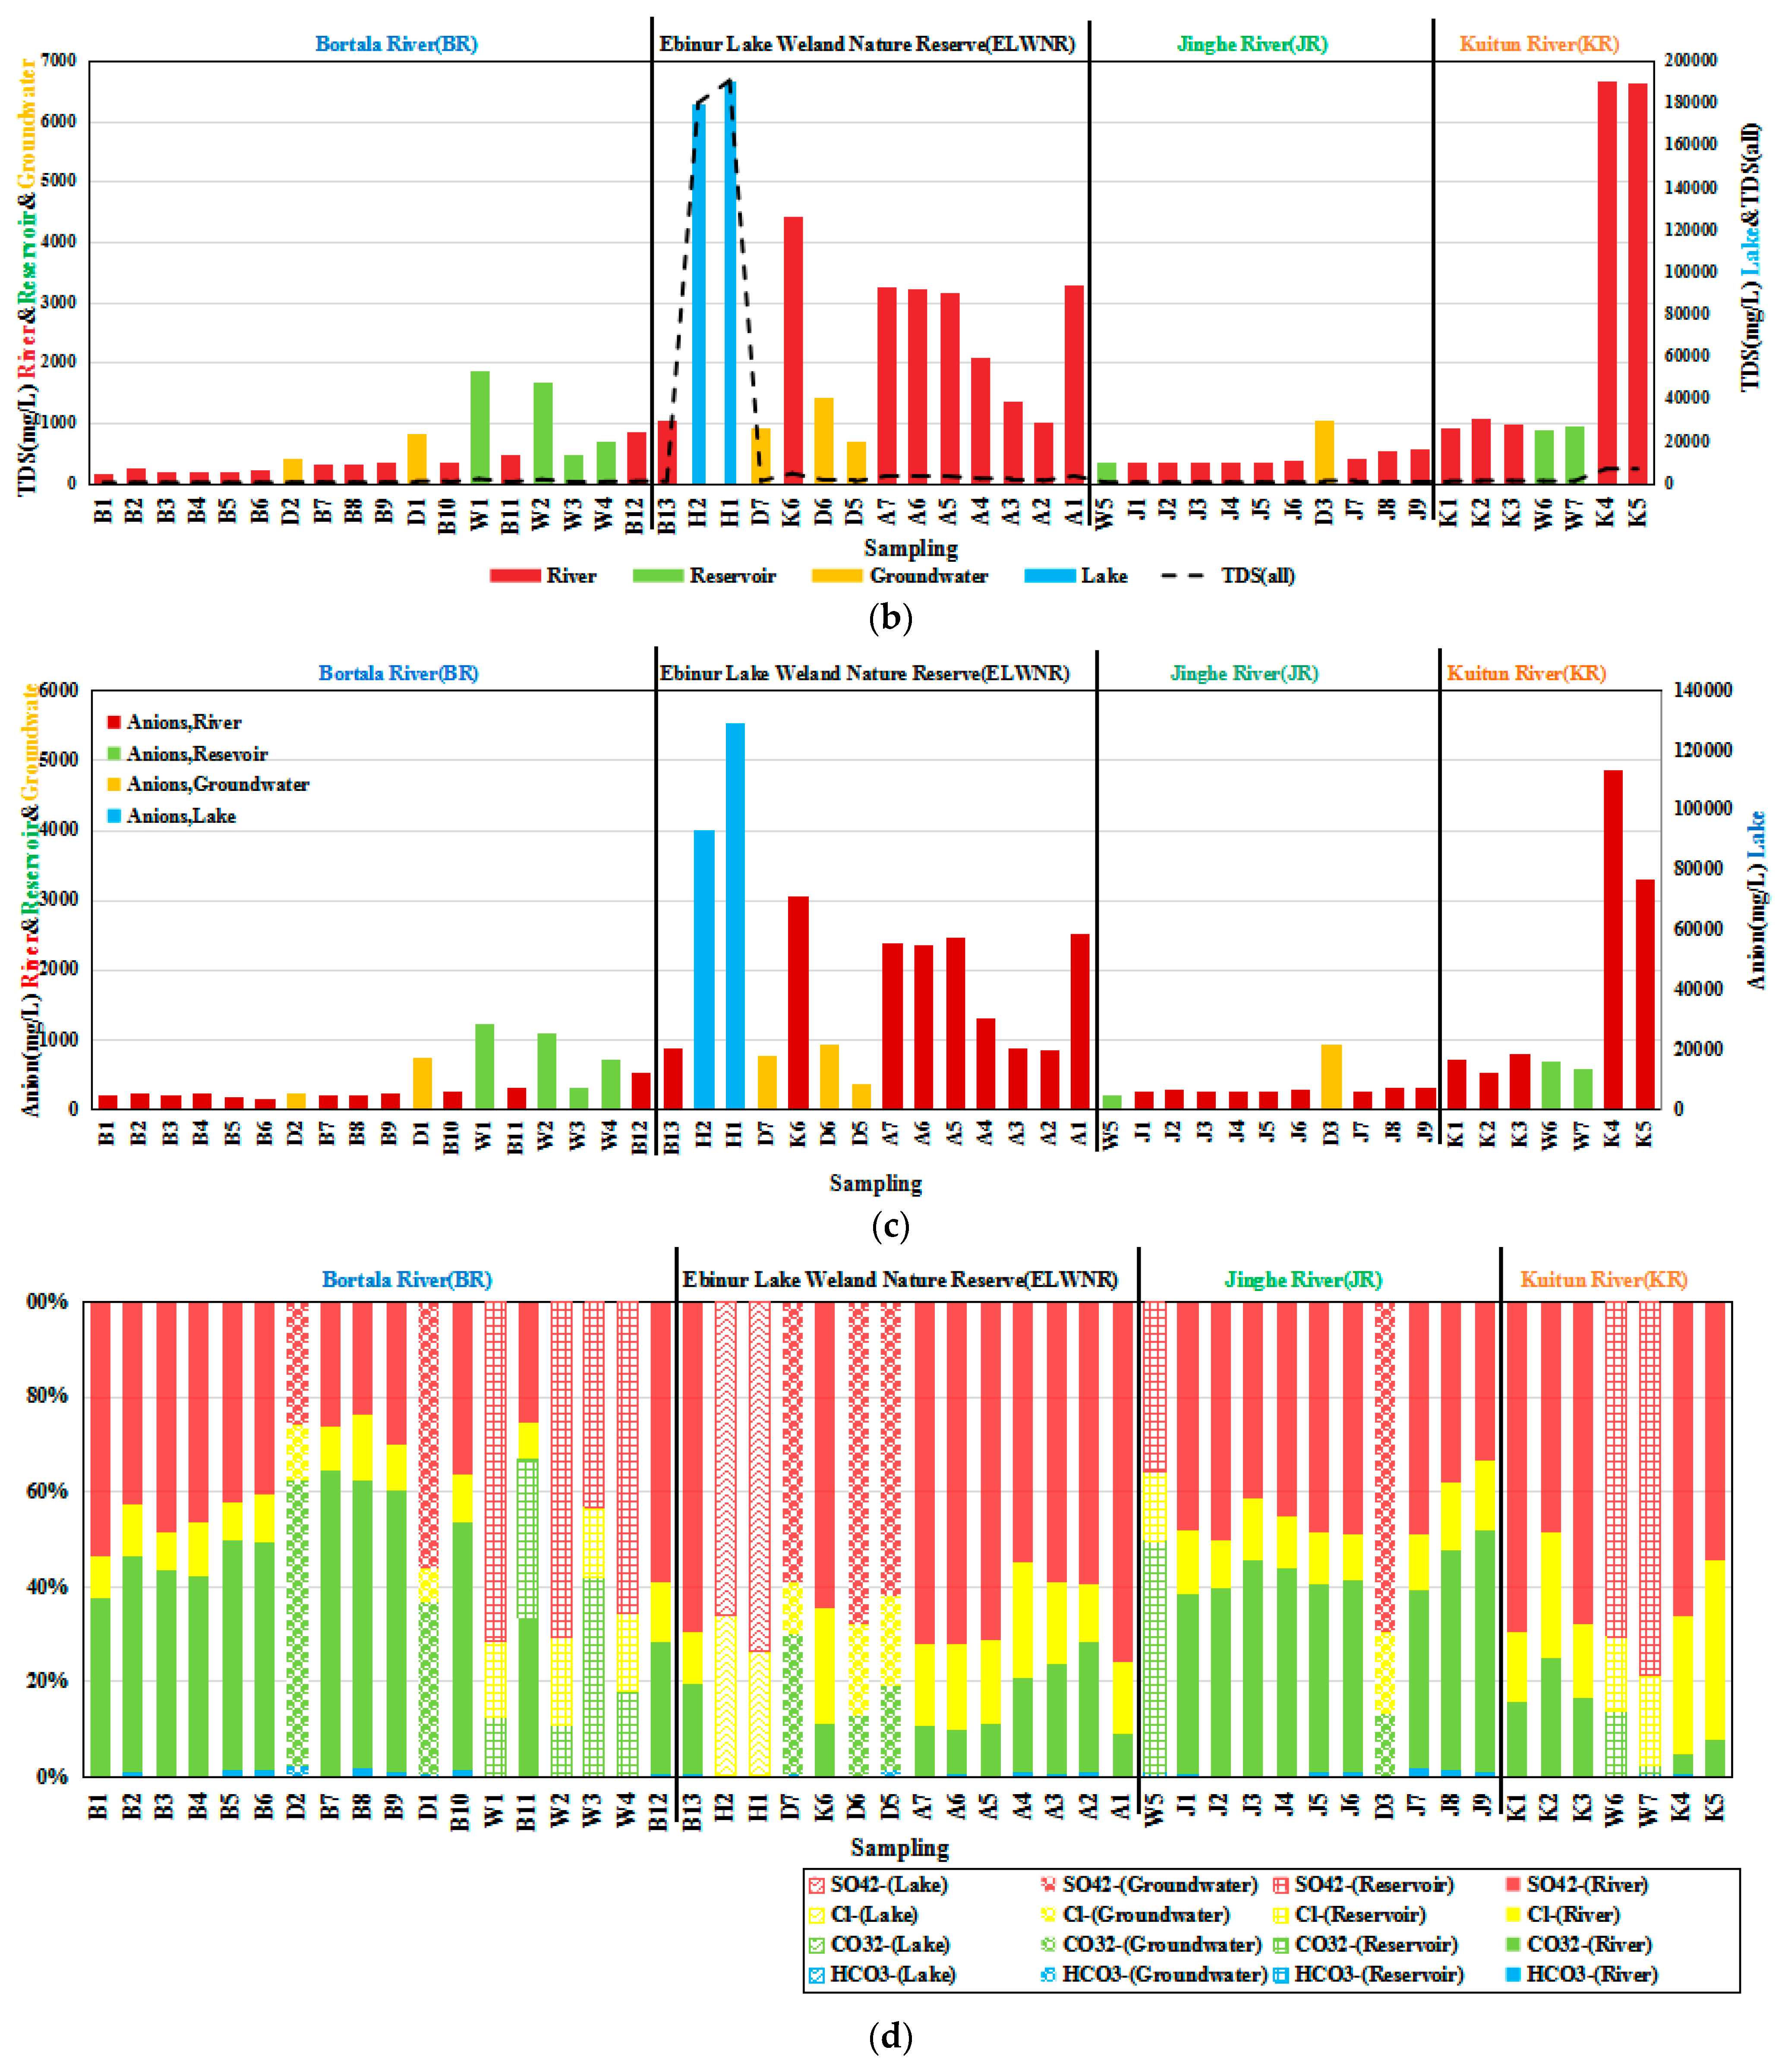
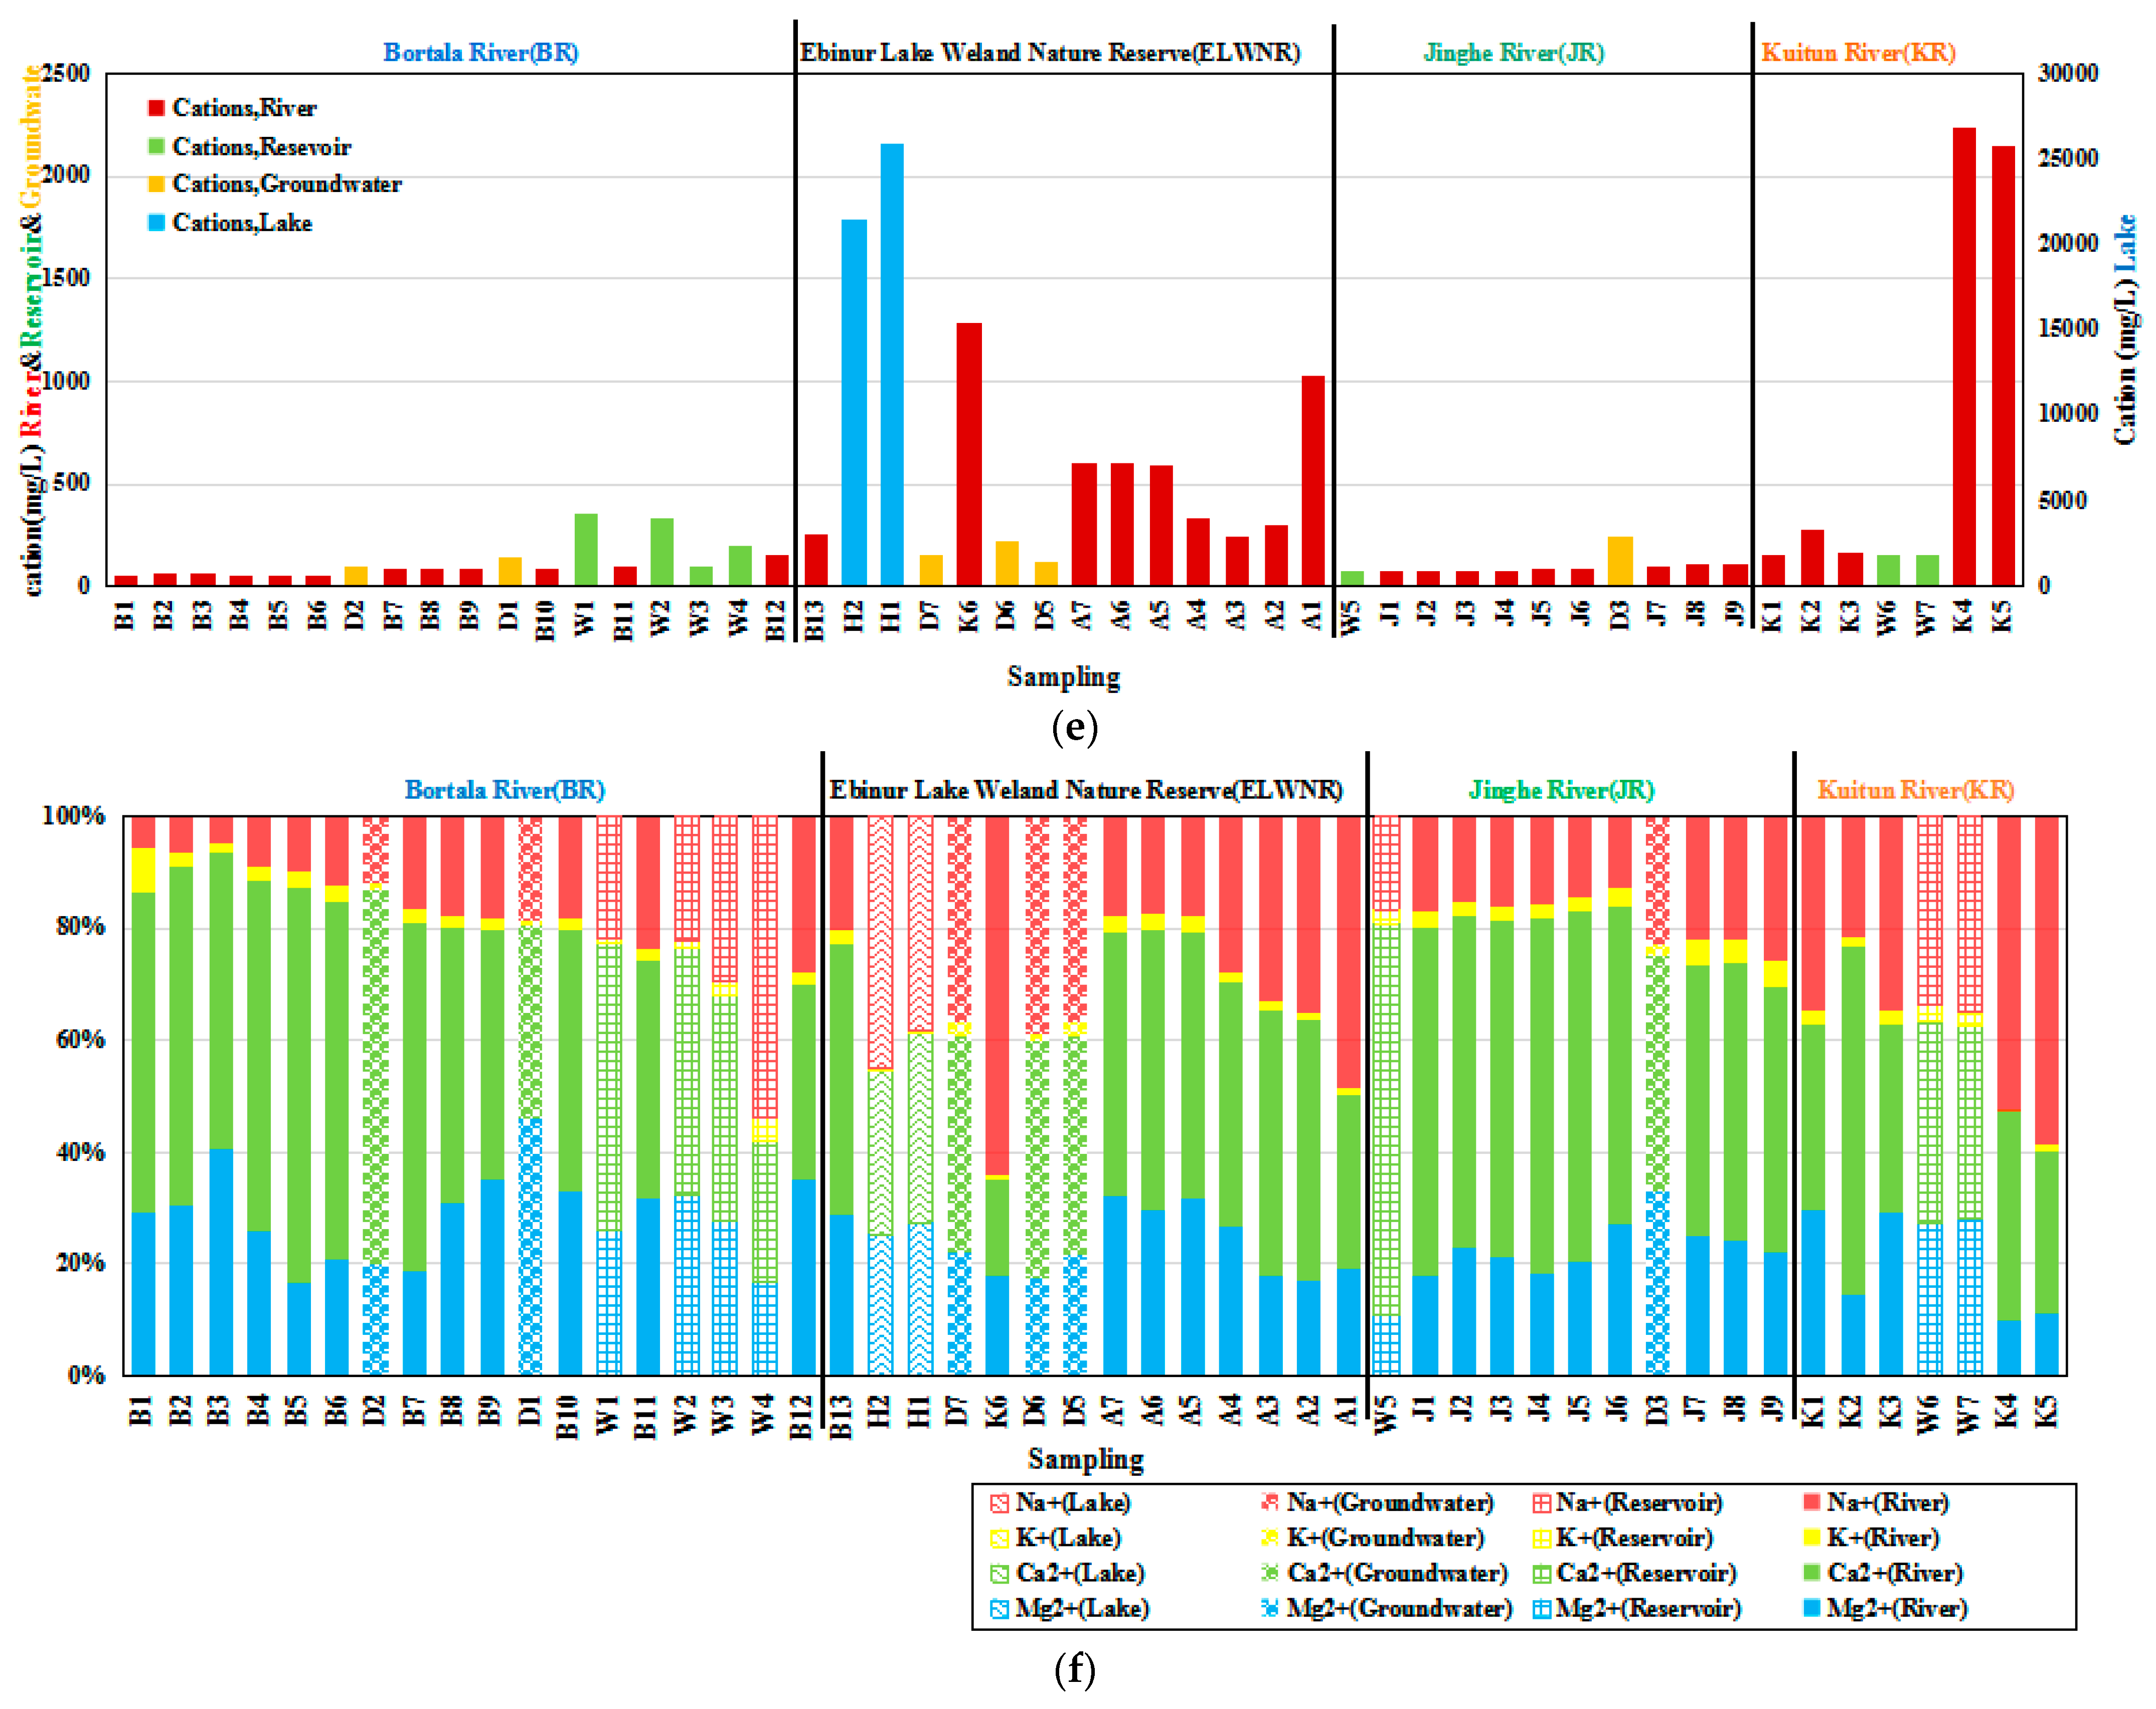
4.1.1. Spatial Distribution of Hydrochemical Characteristics of Different Water Bodies

To determine the source of lake water and the influencing water chemistry factors, the formation mechanism of the chemical components of water in different water bodies was studied. Surface water (river, lake, and reservoir) and groundwater samples were classified as shown in Table 1. According to the distribution of sampling sites, major towns, mining activities, and Ebinur Lake Wetland Nature Reserve (Figure 3), the water samples were divided into four regions (Bortala River (BR), Ebinur Lake Wetland Nature Reserve (ELWNR), Jing River (JR), and Kuitun River) to analyze the spatial variations of physicochemical parameters (Figure 4a–f).
As shown in Figure 4a, all water samples in the watershed were neutral to slightly alkaline (pH = 7.5–9.5), and the pH of Bortala River (B1, W3–4), Aqikesu River (D5–6, A4–7), Kuitun River (W6–7, K4–5), and Ebinur Lake (H1–2) was relatively high. Based on the field investigation, it was speculated that the higher pH may be related to human activities, abundant algae, or high K+ and Na+ in the water. The TDS values of river, reservoir, groundwater, and lake samples ranged from 167–6680 mg/L, 341–1869 mg/L, 399–1429 mg/L, and 180,000–190,500 mg/L, respectively (Table 1). The value of TDS increased as elevation decreased, which was highest around the lake (Figure 4b). As Ebinur Lake is a high-halide brine lake, its TDS concentrations (Table 1, 180,000 mg/L and 190,500 mg/L) were much higher than those of other water bodies. The TDS values of K4, K5, and water samples in the ELWNR area were much higher than 1000 mg/L (Figure 4b), which was much greater than the global average and values for other large rivers in China [32].
The ion percentage diagrams (Figure 4d,f) show the distribution of water chemistry across the plains, and Figure 4c,e show the amounts of anions and cations in the different water bodies, respectively. In the water samples of reservoirs (except W5), the ELWNR, and the KR, the anions were dominated by SO42−, and the abundance order was SO42− > Cl > CO32− > HCO3. However, the abundance order for the Bortala River, Jing River, and groundwater was SO42− > CO32− > Cl2− > HCO3. The main cation in most water samples was Ca2+, with an abundance order of Ca2+ > Mg2+ > Na+ > K+. However, for samples H1 to H2, K4 to K6, W4, and A1, the main cation was Na+ with an abundance order of Na+ > Ca2+ > Mg2+ > K+. The spatial variation of anions and cations mimicked that of TDS, increasing as altitude decreased. However, the ion content of the lake water was much higher than the standard (Figure 4c,e), while the ion content of the ELWNR area and K4–5 was higher than other water sample points.

4.1.2. Characteristics and Influencing Factors of Hydrochemical Composition of Different Water Bodies

The piper diagram shows scatter plots of cations (Na+ + K+, Ca2+, and Mg2+) and anions (HCO3, CO32−, Cl, and SO42−), classifying the water hydrochemical characteristics [33]. According to Figure 4 and Figure 5, four water types were identified in the Ebinur Lake Watershed. Some samples (D5, J1, and B1–6) were taken from the upper reaches of the Bortala River and Jing River, corresponding to zone 2 of the piper diagram, which represents freshwater with low hardness. A few samples (K4–6 and W5) corresponded to zone 5, which is characterized as a saline water zone. The groundwater quality of one sample (D3) around Ebinur Lake was classified as a Cl water type. The water samples W1–2, D3, B13, and lake water corresponded to zone 1. In these samples, Cl and Ca2+ concentrations were unusually high, which indicates contaminated water. The other sampling point from the central part of the plain corresponded to zone 3. In this zone, there was no dominant ion.
The major ions of natural water come from a variety of natural processes such as precipitation, evaporation, and water–rock interactions. The effects of different hydrochemical processes triggered by water–rock interactions can be distinguished by the Gibbs diagram [34]. As shown in Figure 6, the water chemical composition of the lake inlet lies in the upper-right corner of the Gibbs diagram, with the highest TDS content (>105 mg/L), a Cl/(Cl + HCO3) ratio close to one, and a Na+/(Na+ + Ca2+) ratio between 0.5 and 0.7. This shows that the chemical composition of the lake water is greatly affected by evaporation and crystallization in the dry area. Some water samples from the lower reaches of the river and around the Ebinur Lake Nature Reserve, located in the “evaporation-dominated” area, are used to illustrate that evaporation is the main process that drives surface water chemistry. The groundwater plots in the rock-dominance zone indicate that chemical weathering of rock-forming minerals and ion exchange from different water samples are the prime factors that influence the groundwater quality, ultimately suggesting the dissolution and displacement of minerals that compose the aquifer [33]. In addition, in the Ebinur Lake Watershed, the groundwater type evolves from a Ca2+–HCO3 type to a Ca2+–Mg2+–Cl type, and ultimately to a Ca2+–Cl type along the flow path (Figure 4 and Figure 5). Such an evolution would cause a shift of fresh groundwater toward the upper-right corner (zone 2 to zone 1) of the Gibbs Diagram (Figure 6). The same shift can be caused by dissolution of evaporate minerals in the aquifer matrix or by mixing with saline surface waters (seawater, coastal rivers, evaporate lakes, etc.) [35,36]. Study samples did not plot in the precipitation-dominant area, indicating a minor contribution by atmospheric input.
The molar ratios of (Na+ + K+)/SO42− were almost 1:8 (Figure 7a). The molar ratios of (Na+ + K+)/Cl were almost 1:1 and 2:1 for most of the groundwater, reservoir, and river samples (Figure 7c), suggesting the simultaneous dissolution of halite. The molar ratios of Ca2+/SO42− were mostly between 1:3 and 1:8 (Figure 7b), implying that additional SO42− came both from gypsum dissolution and mirabilite dissolution or anthropogenic contamination. Most groundwater, reservoir, and river samples lay above the 1:1 line, indicating dolomite dissolution, as seen in Figure 7d. The Ca2+/Cl and Mg2+/Cl ratios were mostly from 1:1 to 5:1 and 1:4 to 2:1 in groundwater (Figure 7e,f), showing that halite or sea salt dissolution is more significant than carbonate dissolution. Lake water had more (Na+ + K+)/Cl with lower molar ratios of Ca2+/Cl and Mg2+/Cl (approximately 1:3) relative to groundwater (Figure 7c,e,f), implying the dominance of evaporite dissolution. The Ca2+/Mg2+ ratios were 1:1 and 1:2 for water samples from the lake, most reservoirs, a few rivers, and groundwater near Ebinur Lake, whereas it was between the 4:1 and 1:5 lines in most groundwater and surface water samples from the upstream part of the river (Figure 7d). Therefore, the higher ion concentrations of water near the Ebinur Lake Protected Area compared to most groundwater and surface water in the upstream part of river can be ascribed to mineral dissolution and precipitation input, as well as surface evaporation. As a result, the recharge source of groundwater was similar to that of rivers, and both could be influenced by evaporation and carbonate dissolution.

4.2. Water Quality Analysis of Different Water Bodies

In accordance with China’s groundwater and surface water quality standards (Table 3 and Table 4), nine water quality parameters (total hardness (TH) and sulfate, Zn, Co, Cu, Cr6+, NH3-N, COD, and volatile phenol (VP)) were selected for analysis. The means and ranges of the nine water quality parameters for rivers (Bortala River, Jing River, Aqikesu River, and Kuitun River), reservoirs, lake, and groundwater are provided in Table 5. The spatial distributions of analyses for the sites are shown in Figure 8, Figure 9 and Figure 10.

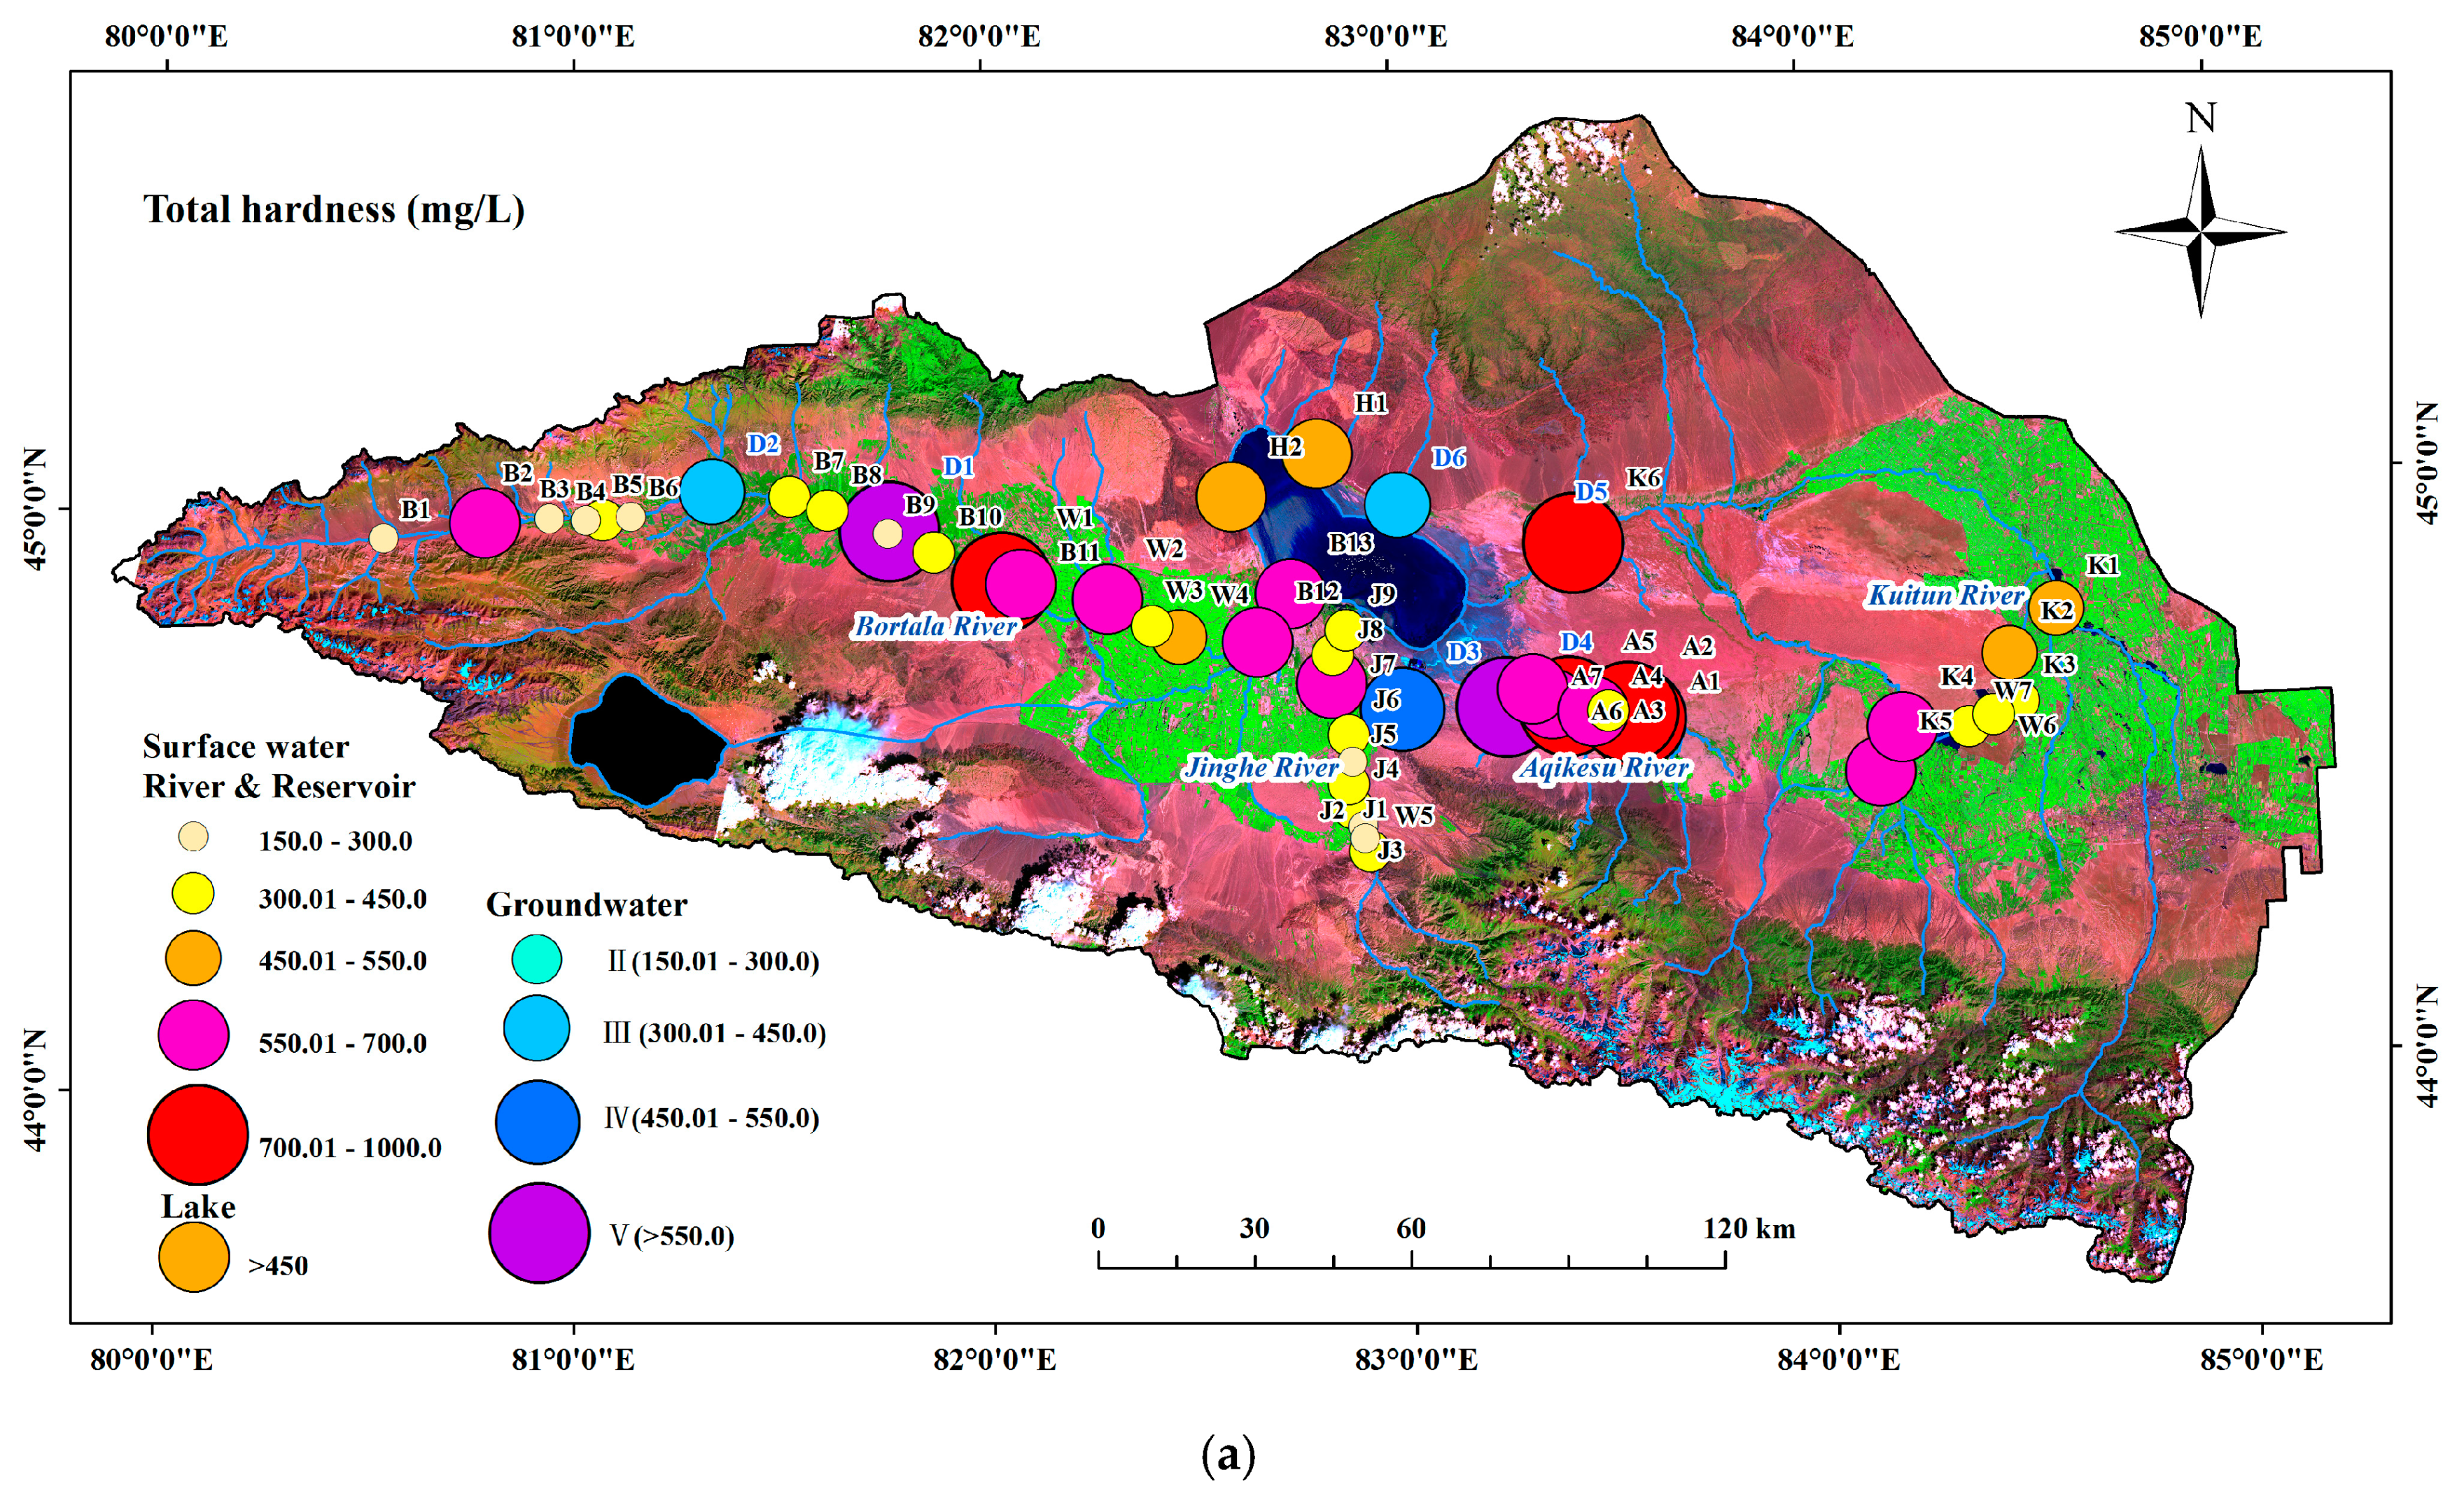
4.2.1. Total Hardness (TH) and Sulfate

Water hardness is known to be crucial in growth and reproduction processes of aquatic organisms [37]. The highest TH occurred in groundwater, and the lowest TH occurred in rivers, except for sample B2 from the downstream parts of the Kuitun and Aqikesu River, which were affected by mining activities near the Ebinur Lake Nature Reserve or other human activities near towns (Figure 8). Average TH values of surface water increased with downstream distance (BR (347 mg/L) > JR (302.4 mg/L) to BR (608.4 mg/L) > JR (455.1 mg/L), respectively) (Table 5). These results indicated that more groundwater was discharged into the surface water downstream. Samples D3, D2, and D6 are suitable for drinking, industrial, and agricultural water consumption, whereas samples D1, D4, and D5 should only be used for irrigation (Table 4 and Figure 8). Combined with field investigations, most groundwater was collected from pump wells in rural households (Table 1). The value of total hardness in most reservoirs was less than 550 mg/L, except in samples W1 and W2, which was most likely due to the presence of groundwater entering the Bortala River upstream. Sulfate values at the Aqikesu River and the lake were highest among the sample sites and were approximately two to four times higher than those at the Bortala River and Jing River water sample sites, located in the Ebinur Lake wetland reserve. This result may be due to mining activities near Ebinur Lake, such as the mining of mirabilite, magnesium sulfate (MgSO4), and barium salts. The high sulfate concentrations in most rivers were intensely influenced by human action, caused by domestic sewage, fertilizers, leather-making, and paper industry wastewater.

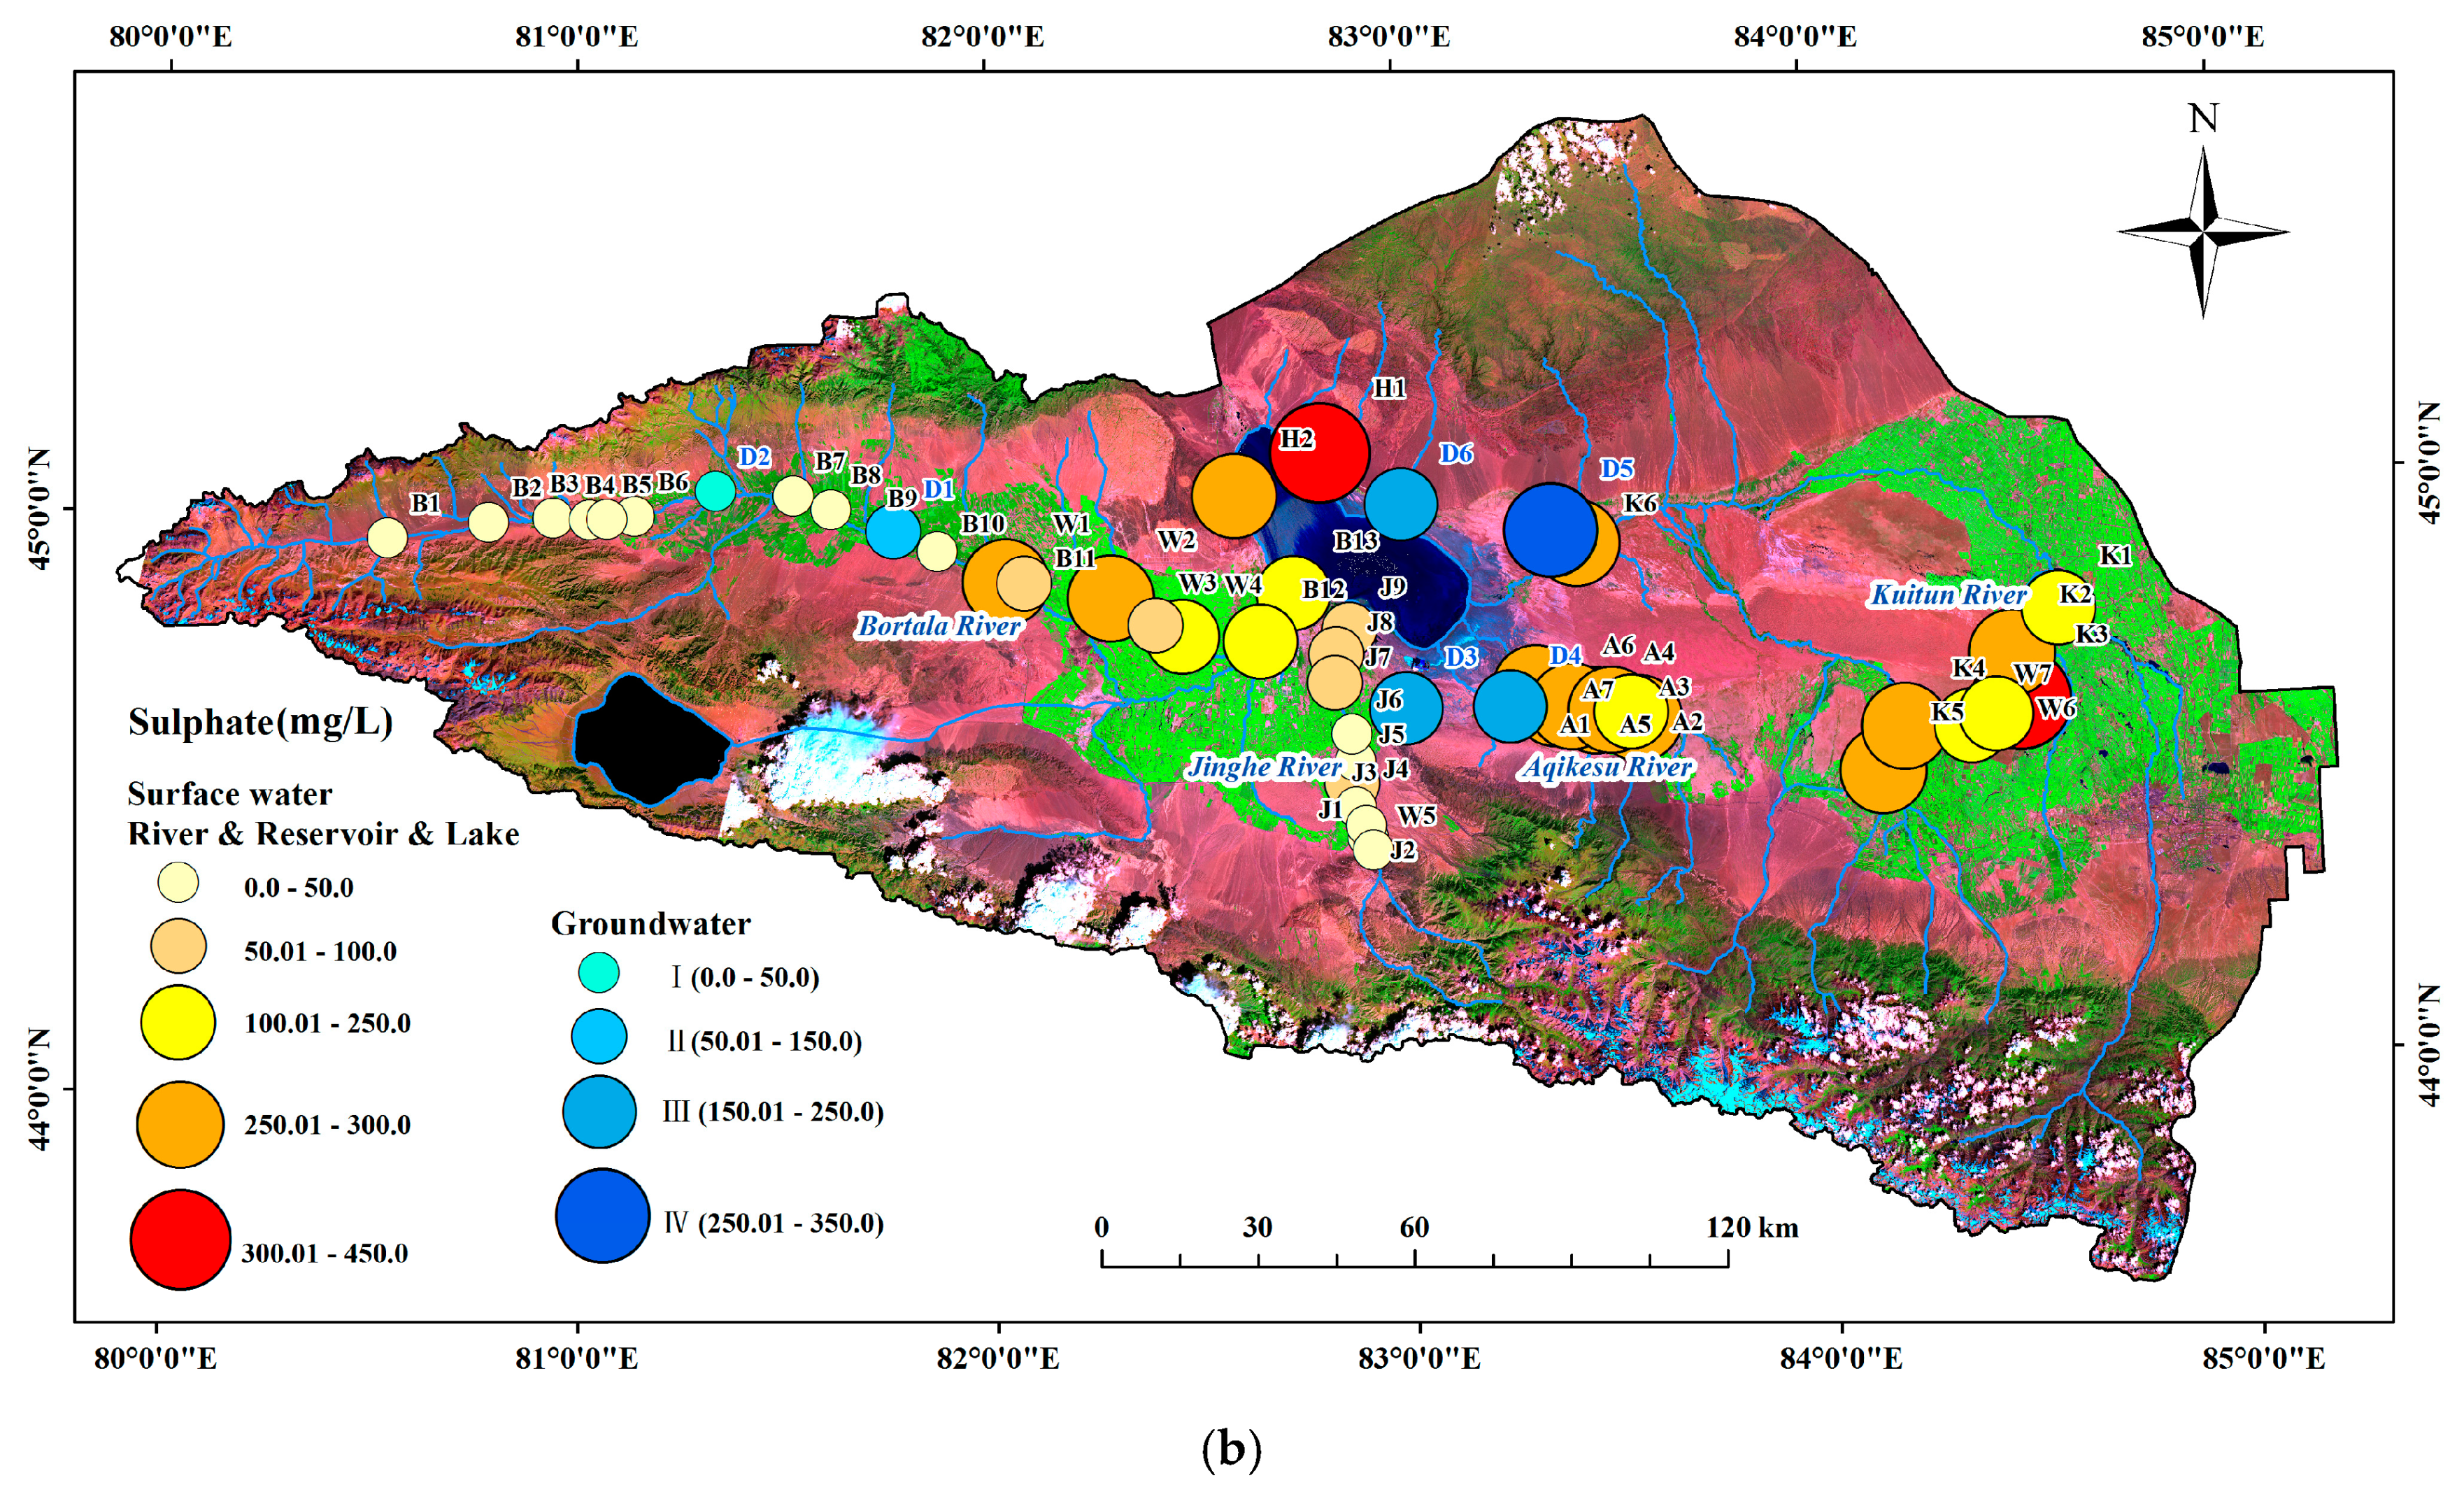
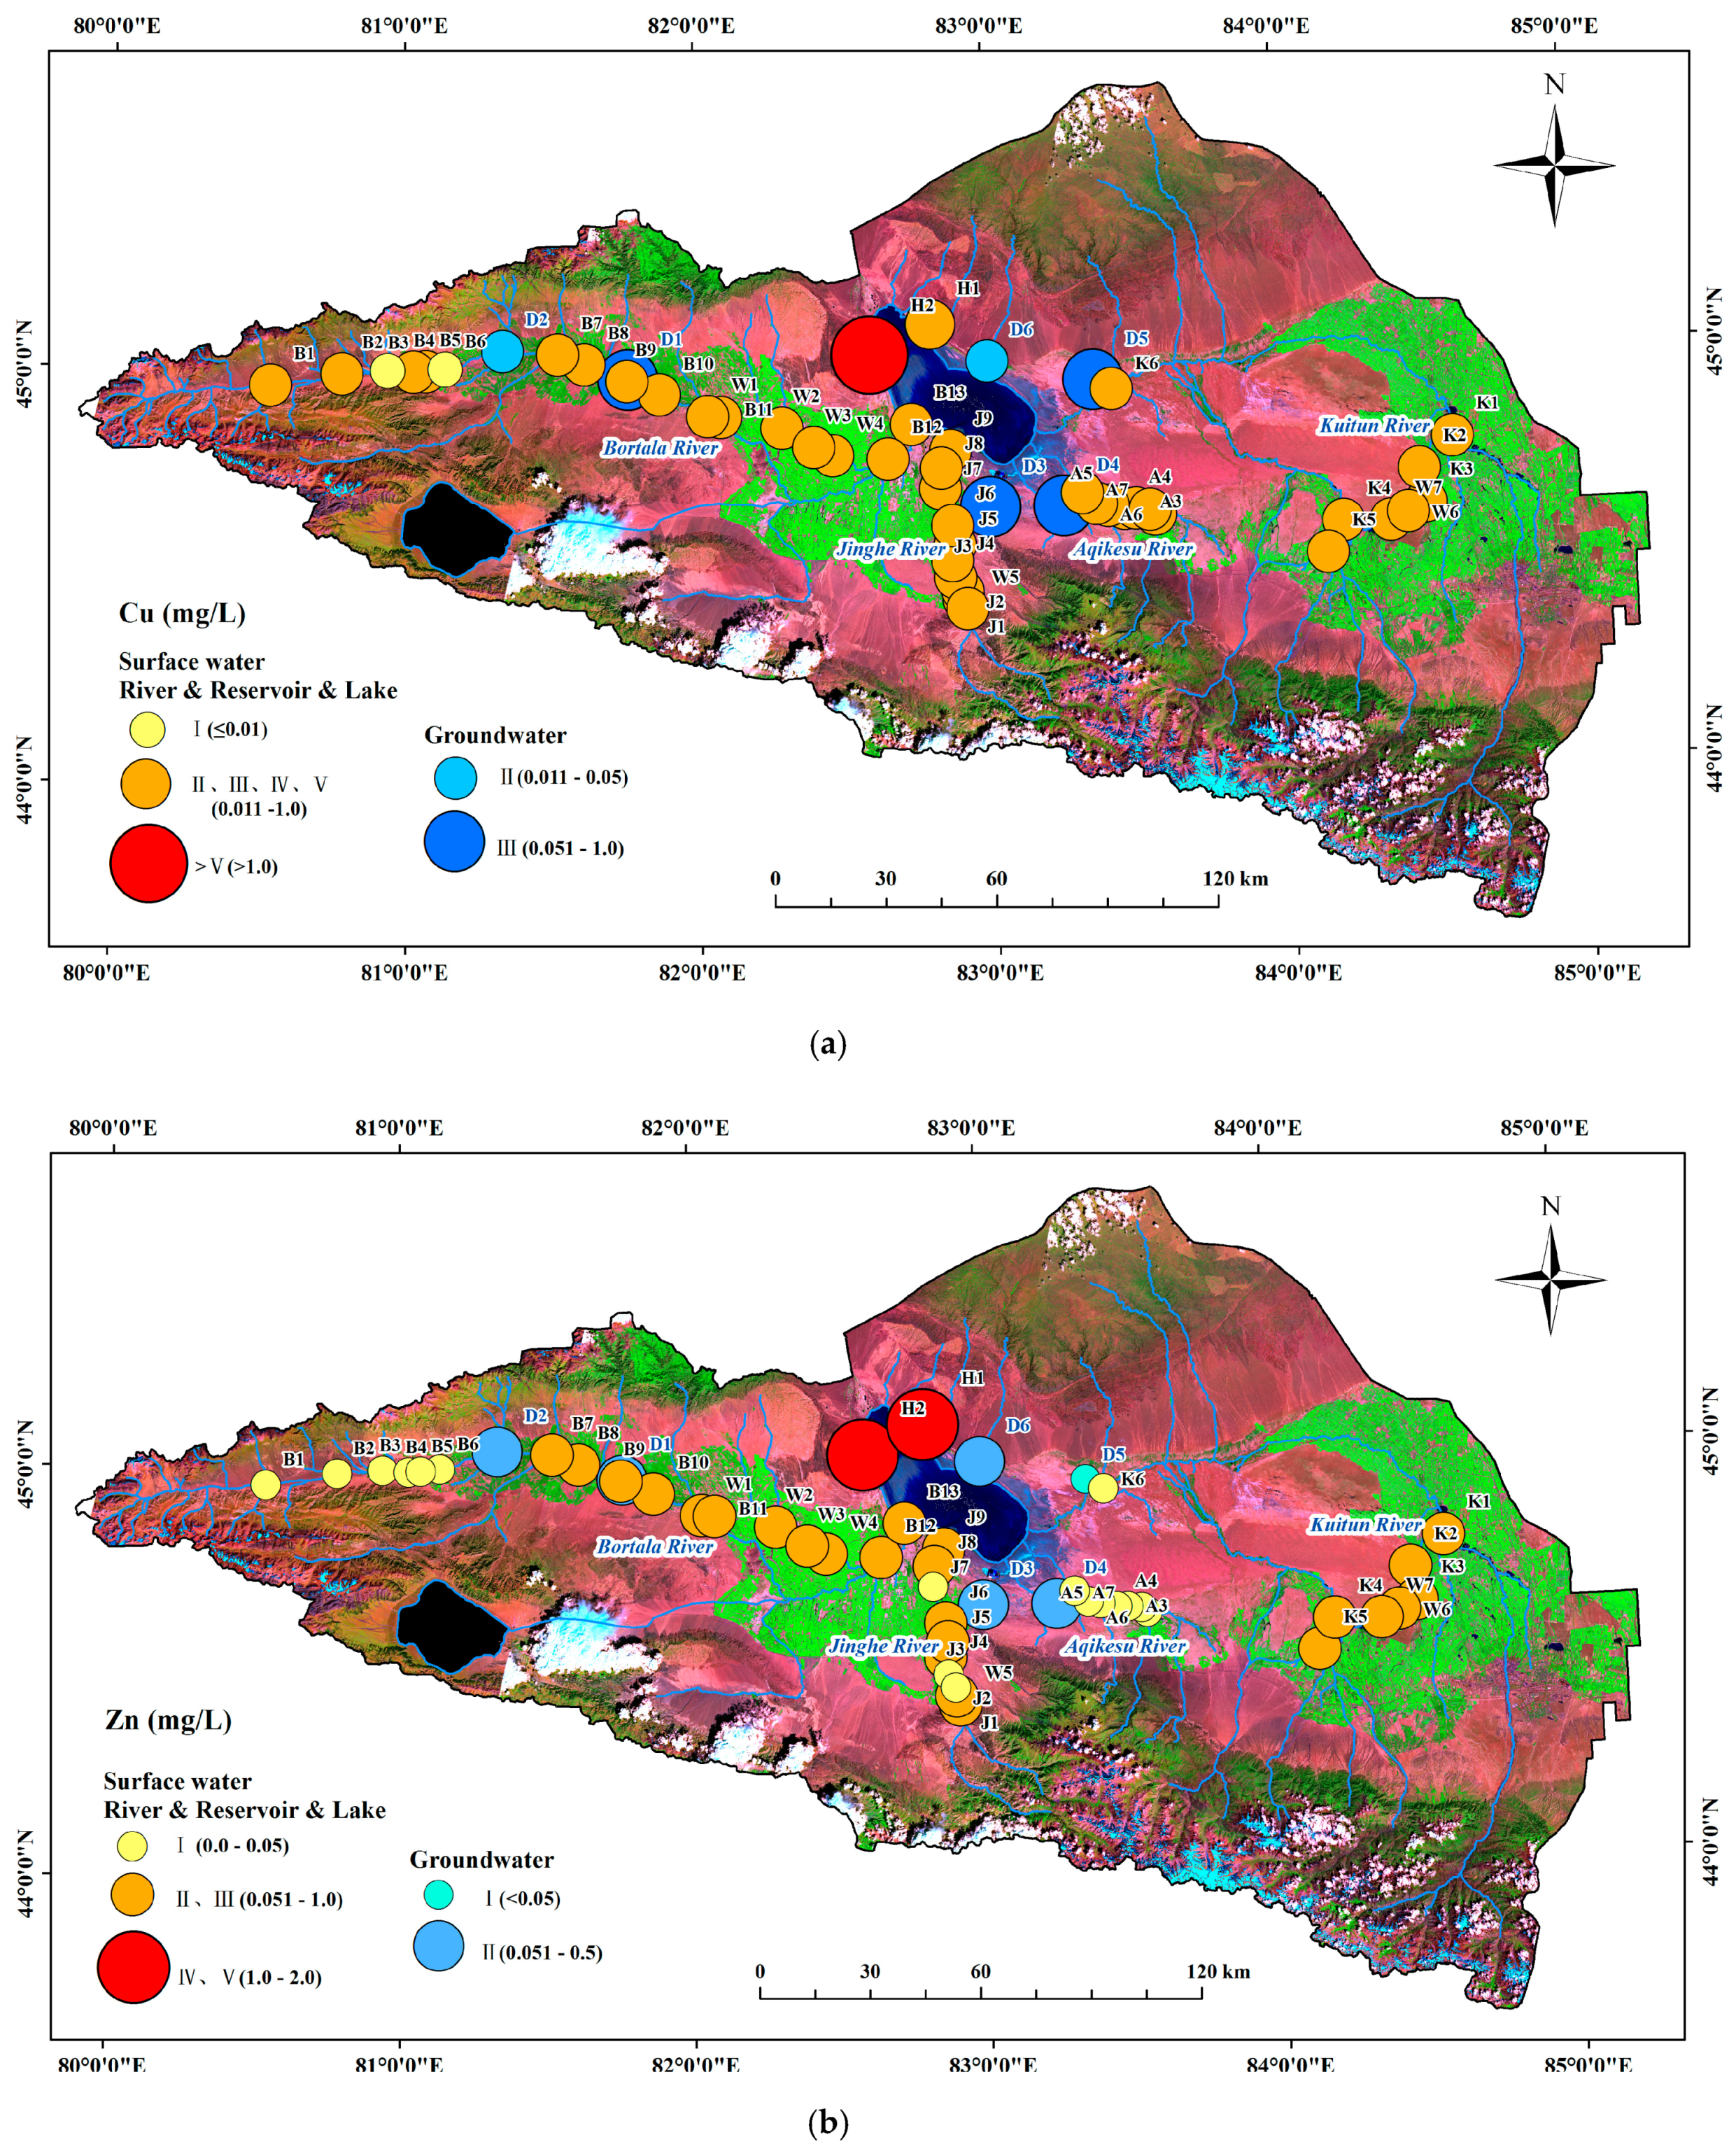
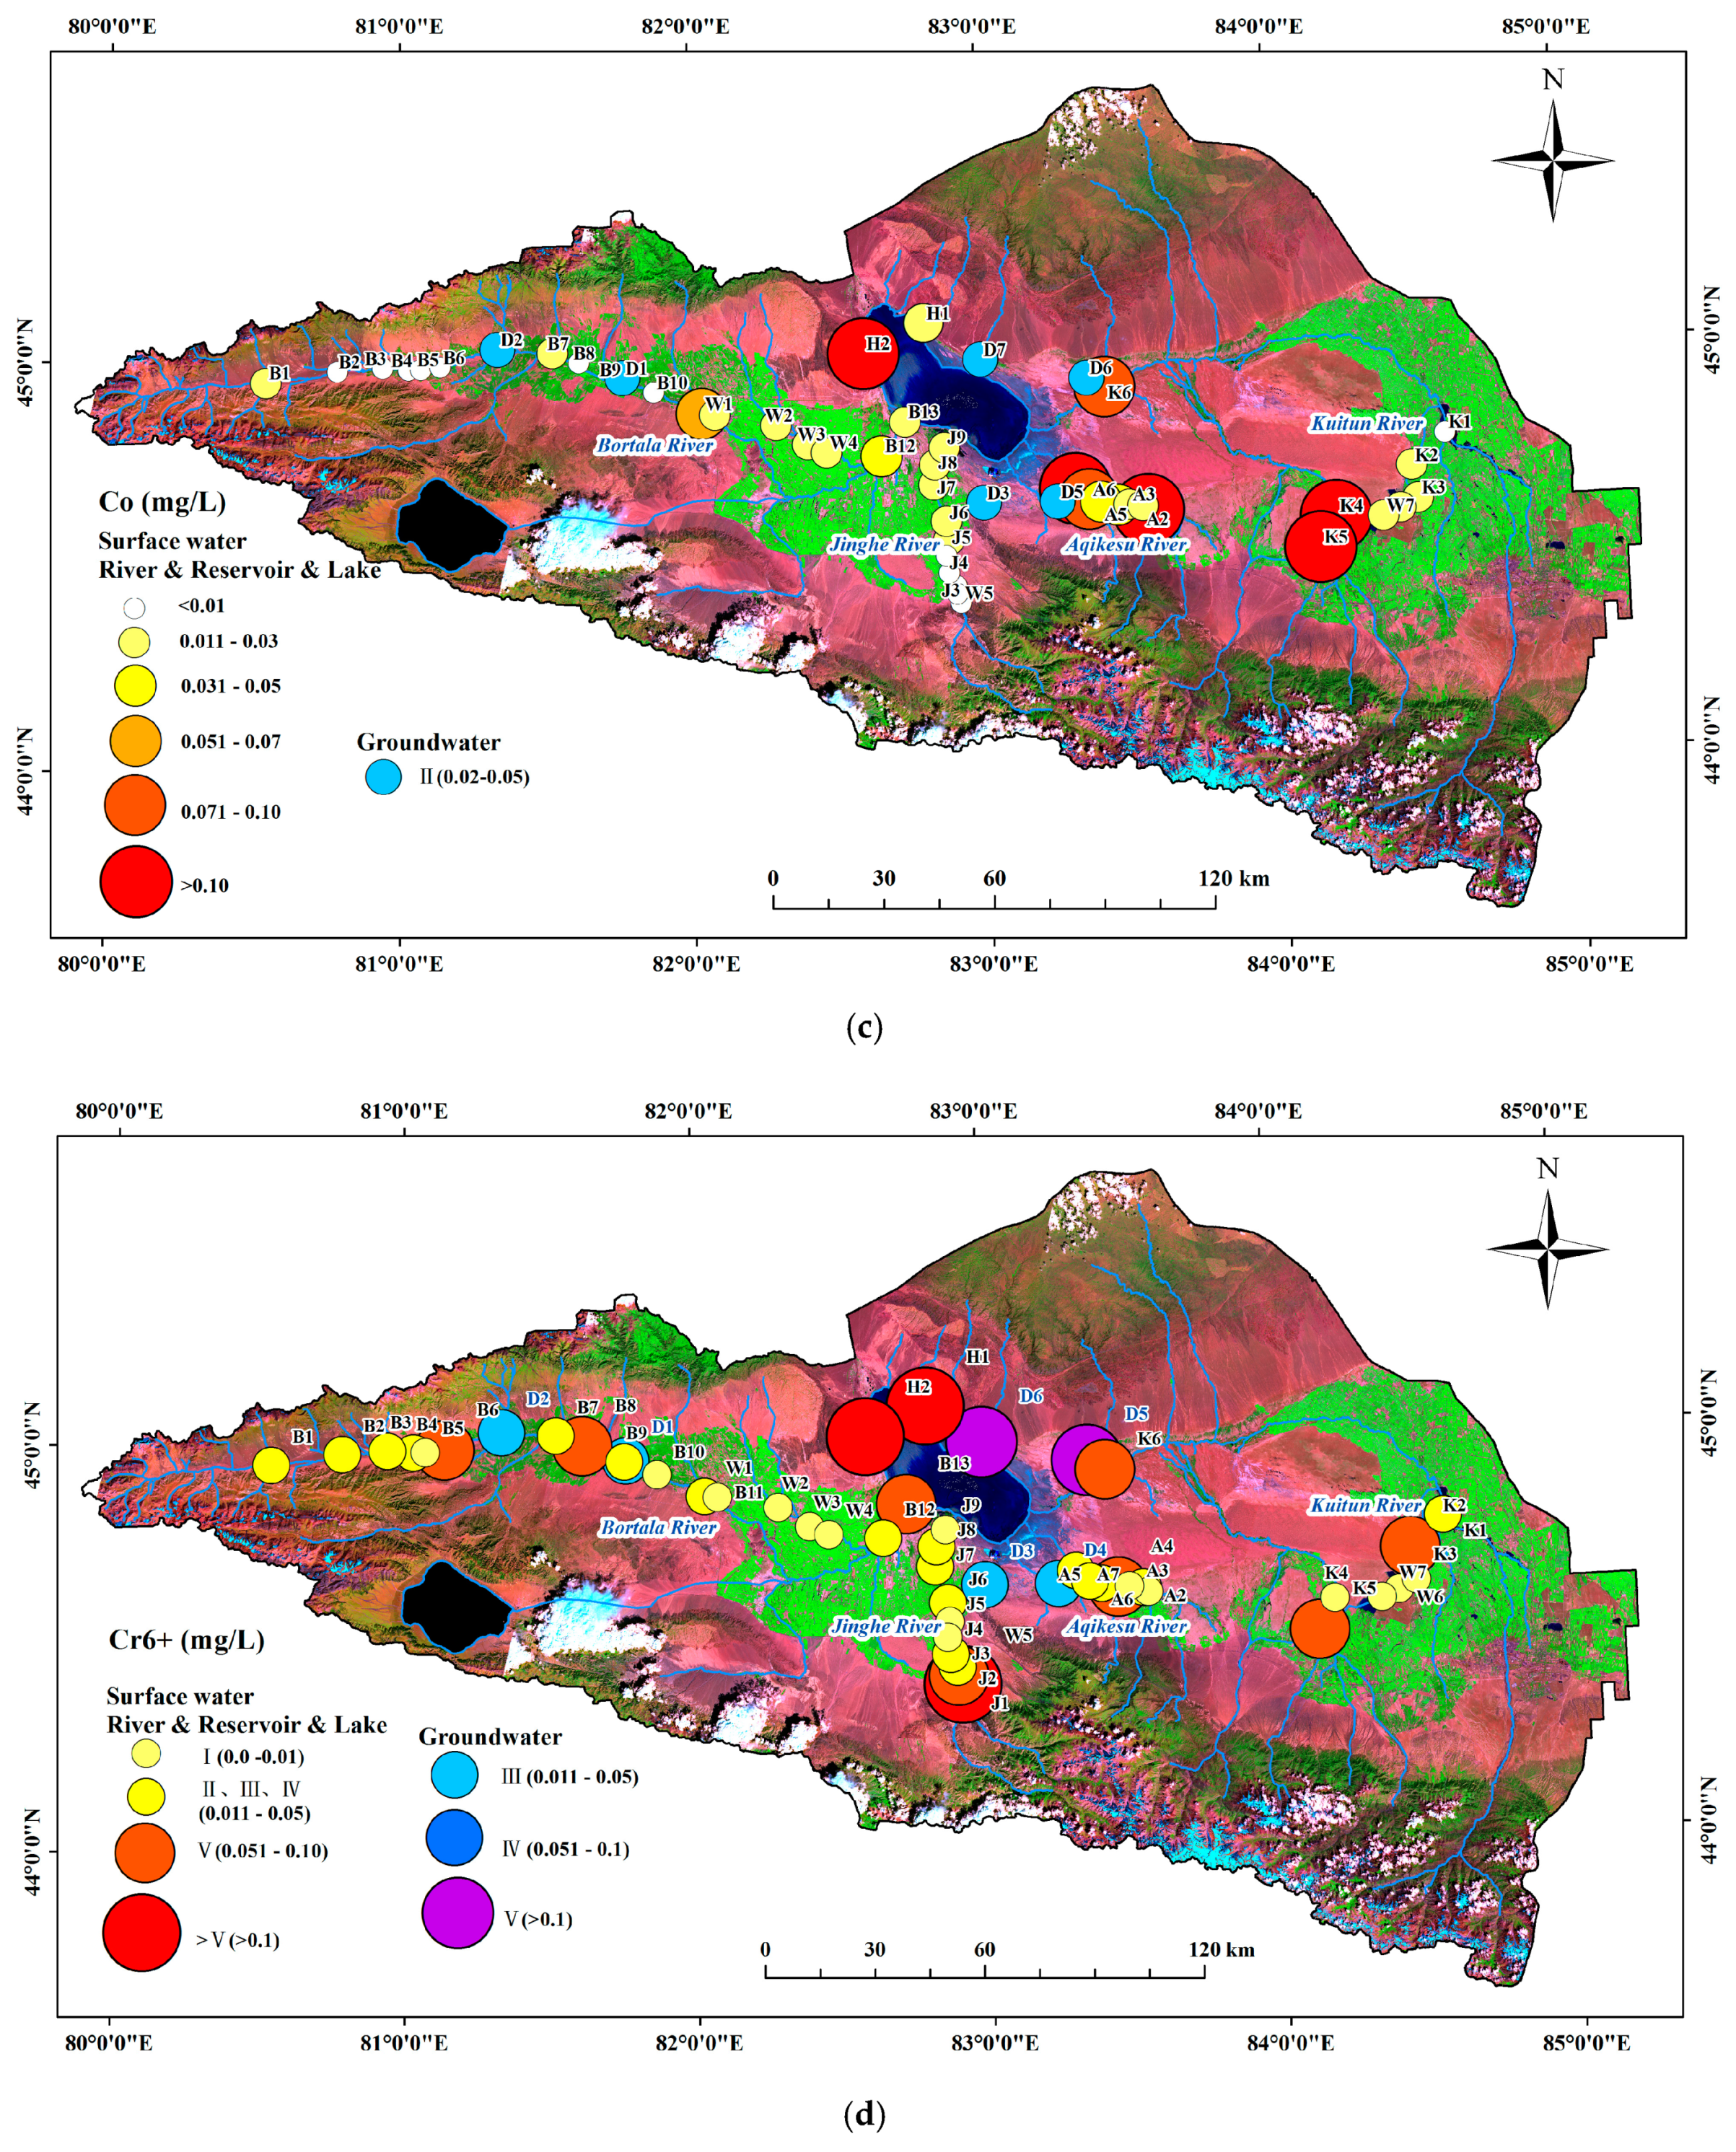
4.2.2. Metal Element Concentration

According to Table 3 and Table 4 and Figure 9a, for drinking water standards, the water category (in terms of Cu) is above the limit, and the studied value of groundwater is within the permissible limit. Except for H2 which belongs to class V of water, the range of Cu values of surface water ranged from 0.01 to 1.0 mg/L in categories II, III, and IV (Table 5 and Figure 9). The levels of Zn in groundwater were in categories I and II, with water suitable for drinking. Spatially, Zn values were high for H1 and H2 from Ebinur Lake (Figure 9), and were in categories IV and V. This water is only suitable for general landscape requirements, as well as industrial and agricultural water areas. In addition to K6 and the water sampling points in the Ebinur Lake Reserve within category I, high values of Zn were found mostly in the middle and lower reaches of rivers within categories II and III, which can be used for drinking, farming, and fishing (Figure 9). The concentration of Co in groundwater ranged from 0.02 to 0.04 mg/L with an average value of 0.03 mg/L, which is a negligible amount (Figure 9) in category II. The critical concentration of Co toxicity is 0.5 mg/L, but the value of Co in all water samples was far below the limited concentration (Table 3, Table 4 and Table 5). In addition, the high Co values mostly appeared at sampling points with higher pH values (Figure 4a and Figure 9). Chromium is a typical heavy metal contaminant that cannot be biologically transformed. This metal element often circulates through the food chain and accumulates in living organisms, causing a variety of disorders and diseases [38]. At sampling points around lake (H1, H2, D5, and D6), the concentrations of Cr6+ surpassed 0.1 mg/L, located in category V (Figure 9). Because the northwest part of Ebinur Lake is located at a strong wind gap (A’lashankou), the value of Cr6+ was exceeded by the effect of rock weathering. The concentration of Cr6+ in most rivers and reservoirs was less than 0.05 mg/L, which conforms to the content of Cr6+ under natural conditions. The high values of Cr6+ near towns were mainly affected by domestic wastewater and industrial pollution, whereas the high values of Cr6+ at W5 and J1 were mainly affected by the construction of a reservoir during the sampling period.

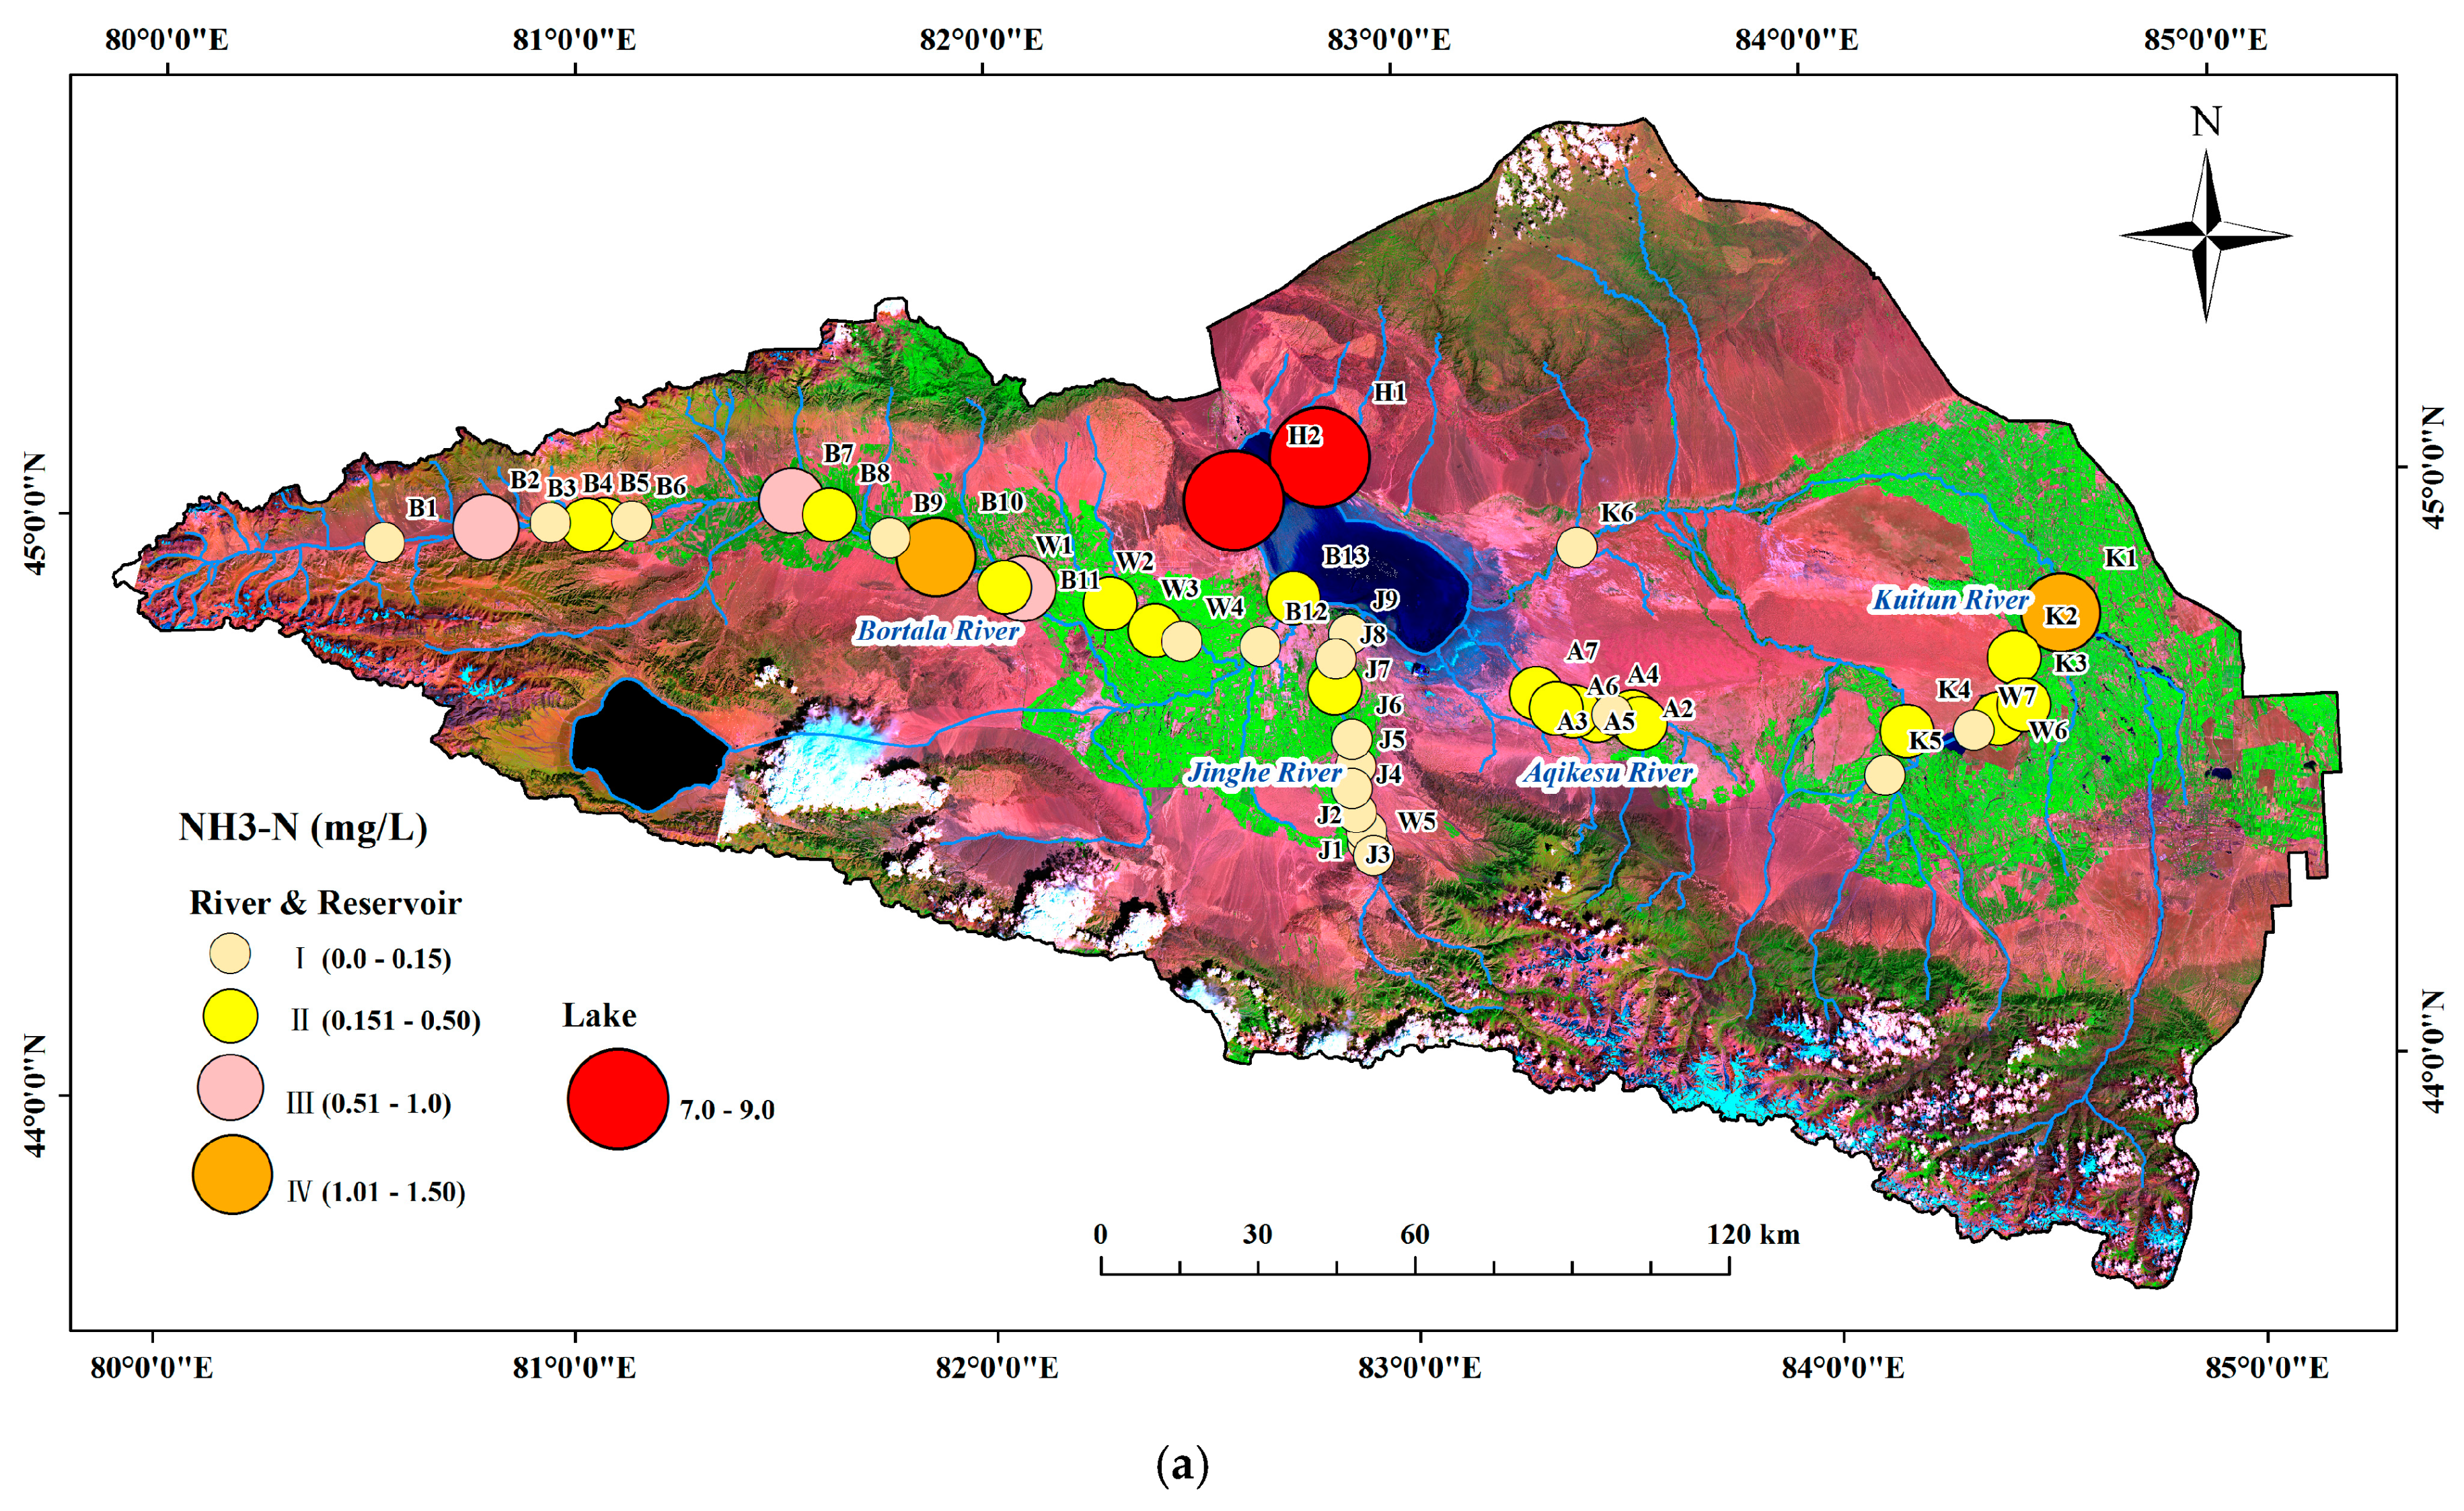
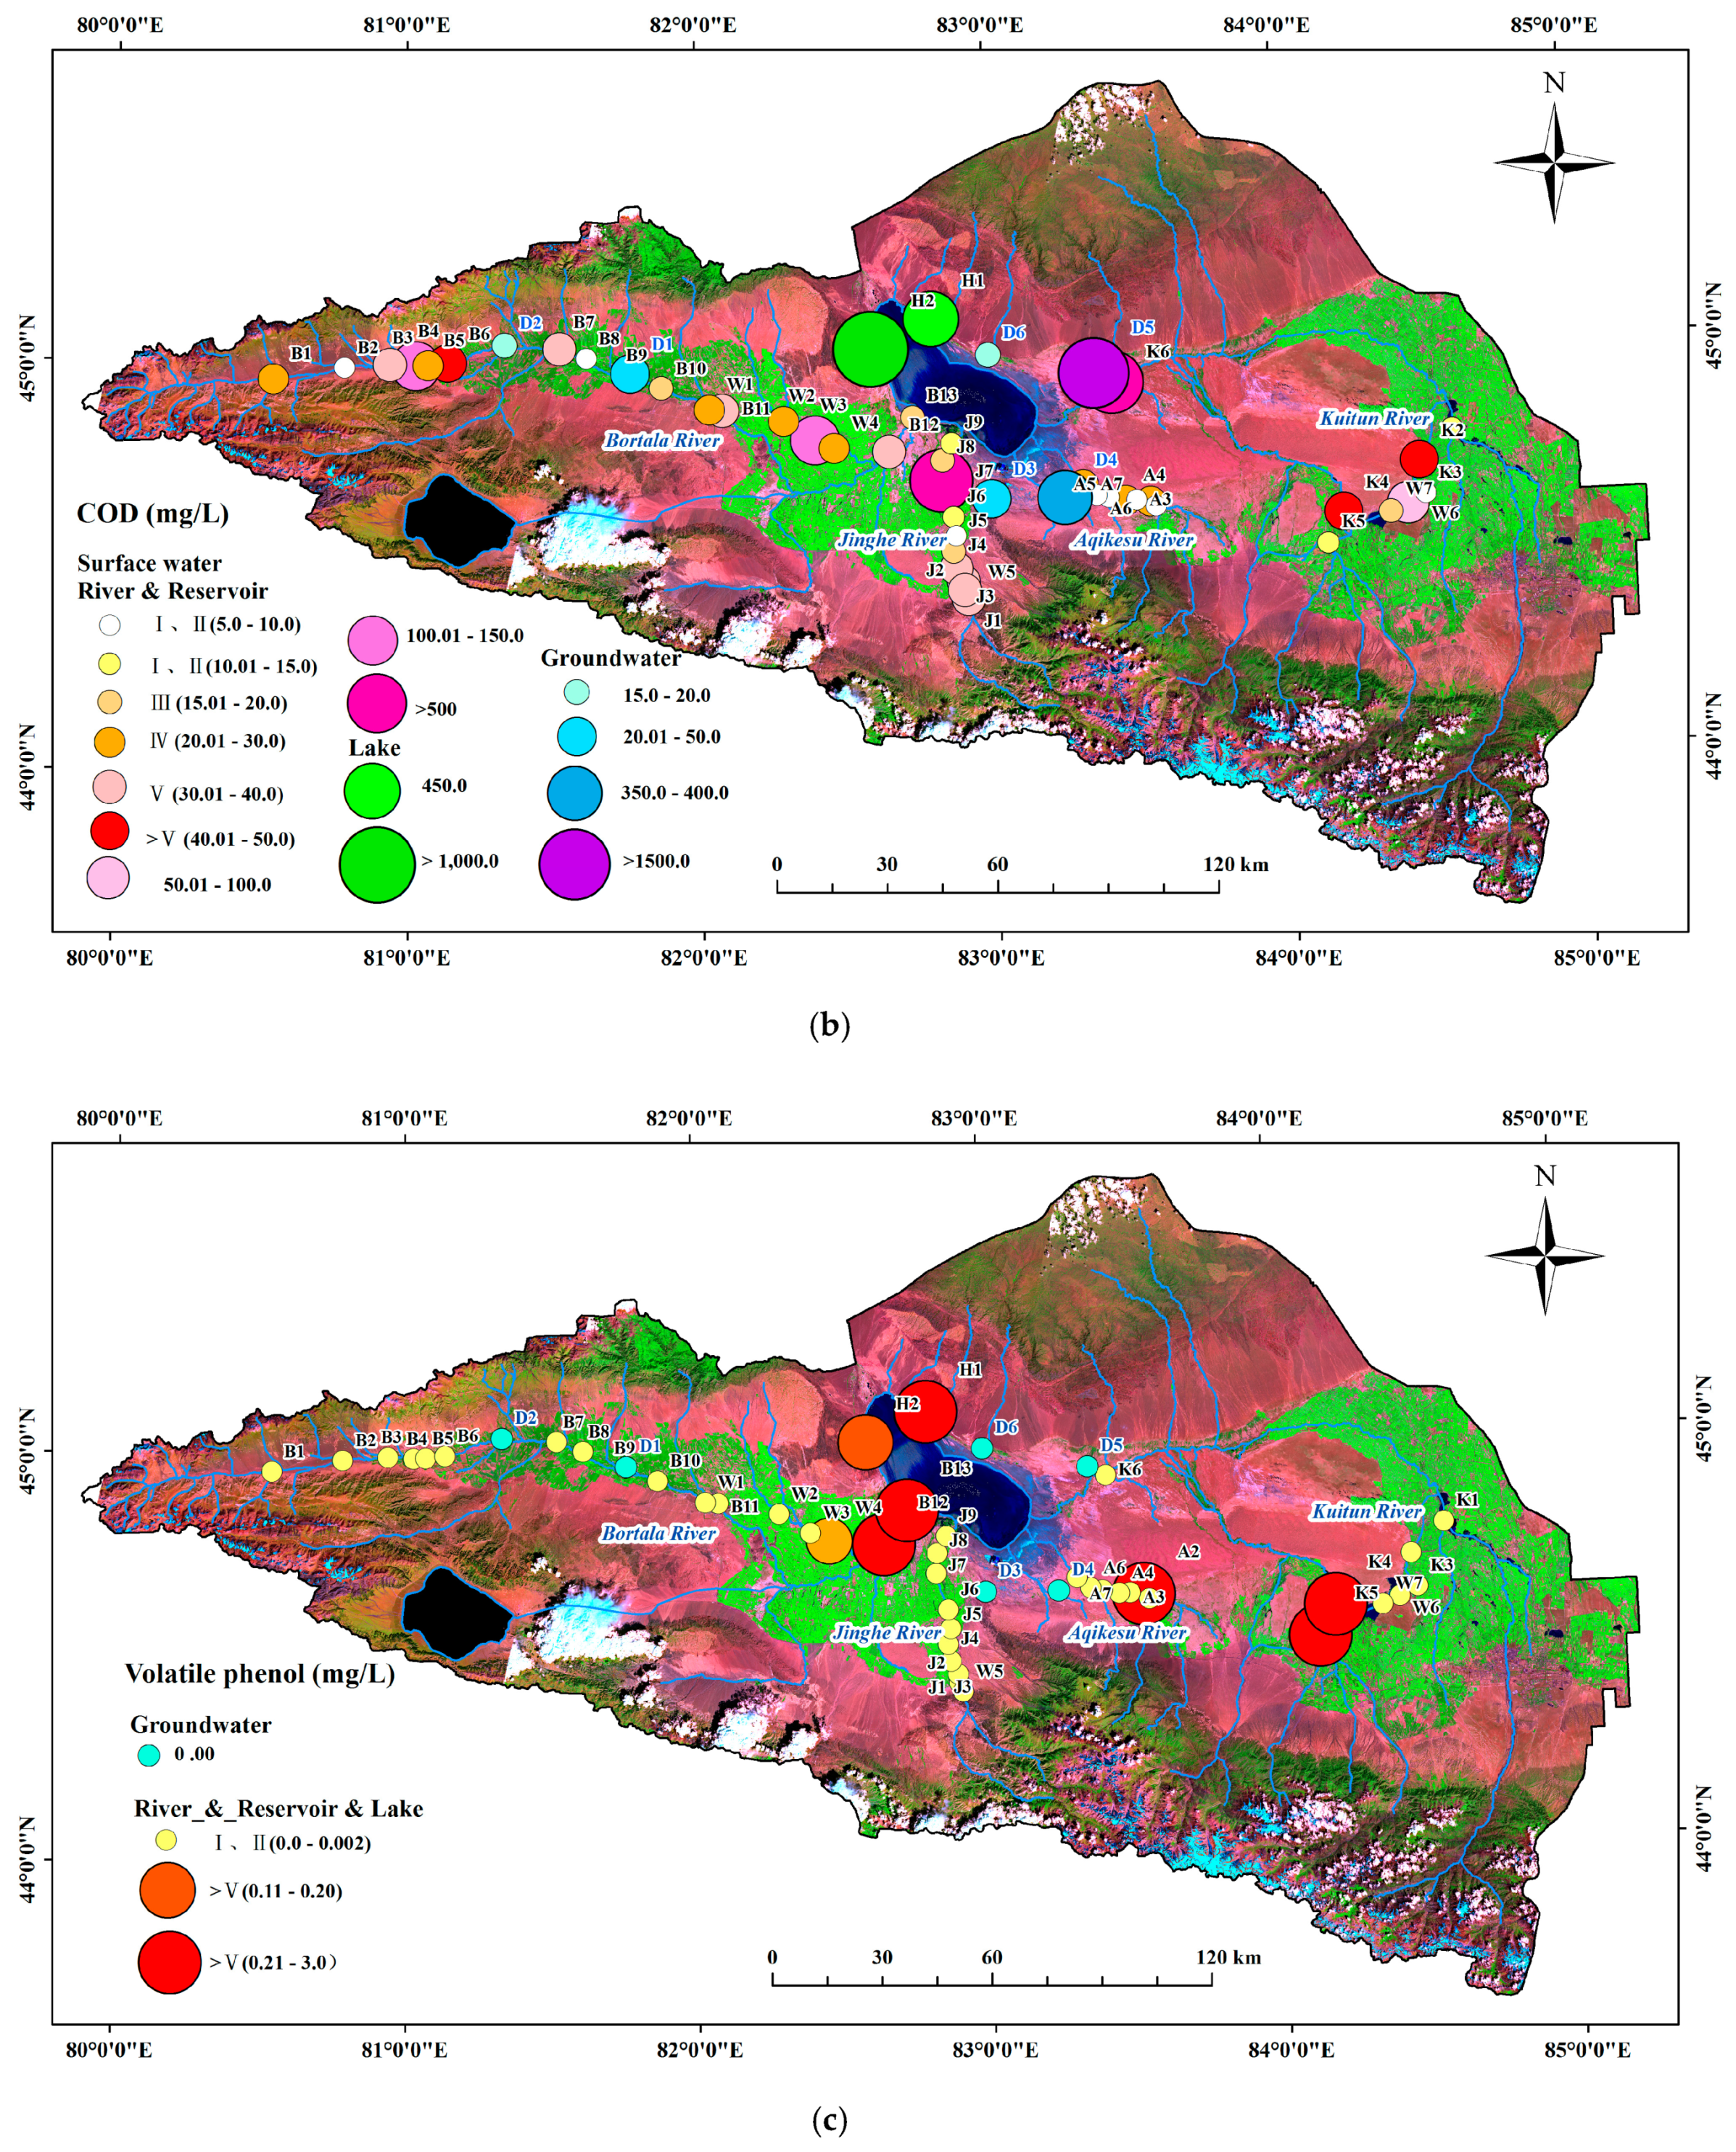
4.2.3. NH3-N, COD, and Volatile Phenol

NH3-N in groundwater was not detected in this study and, as such, Figure 8 only shows the spatial distribution of the NH3-N content in surface water. Except for concentrations of NH3-N around the lake that surpassed 7 mg/L, the average NH3-N contents in rivers and reservoirs were 0.29 mg/L and 0.26 mg/L, respectively (Table 5). The NH3-N contents ranged from 0.5 to 1.0 mg/L and 1.0 to 1.5 mg/L for water samples collected at B2, B7, B11, B10, and K1, falling into categories III and IV (Figure 10a). The COD content of the groundwater without contamination is usually 5–10 mg/L. However, the COD contents of the groundwater in the study area were all above 10 mg/L, indicating that the groundwater is influenced by nearby rivers. Abnormally high COD concentrations, up to 40–624 mg/L, were detected in rivers near cities and towns (Figure 10b). For high concentrations of NH3-N and COD, they can come from various sources, including domestic and industrial sewage, fertilizer applications, and animal waste. Volatile phenol was detected in most water bodies, but values >0.1 mg/L were measured at B12, B13, K4, K5, A2, and two stations (H1 and H2) around the lake (Figure 10c). The content of volatile phenol in water directly affects drinking and aquaculture. When the concentration of volatile phenol in water is above 0.1–0.2 mg/L, it can make the water smell bad. When the concentration is higher than 5 mg/L, fish cannot live [39]. The volatile phenol in the reservoir (W4) located in the lower reach of the Bortala River was 0.1 mg/L, which puts fish in the reservoir in danger. Although volatile phenol was not detected in the remaining reservoirs, the health of the fish in Liugou Reservoir was also found to be problematic through field investigations. In addition, water with a high phenol content should not be used for farmland irrigation, or it will cause crop damage and reduce yield. Therefore, the river water near B12, B13, K4, and K5 is not suitable for irrigation.

4.3. The Characteristics of the Watershed Water Cycle Based on Isotope Hydrology

4.3.1. Stable Isotope Compositions

The results of δ2H and δ18O isotope analyses from surface waters (river, reservoir, and lake) and groundwater are listed in Table 1. The δ2H values of groundwater varied from −75.6‰ to −74.1‰, and values varied from −73.0‰ to −72.5‰, −82.3‰ to −77.9‰, and −92.7‰ to −66.2‰ for lake, reservoir, and river samples, respectively. The δ18O values of groundwater, lake, reservoir, and river samples varied from −11.3‰ to −9.9‰, −0.2‰ to 1.1‰, −10.5‰ to −8.5‰, and −13.5‰ to −8.4‰, respectively. At present, there is no monitoring station associated with the Global Network of Isotopes in Precipitation (GNIP) in the Ebinur Lake Watershed [40]. Therefore, the local meteoric water line (LMWL) [41] at the Urumqi monitoring station was used as a reference in this paper. Most samples were distributed around the left part of the global meteoric water line (GMWL) (solid line: δ2H = 8.14 × δ18O + 10.9) [42] and local meteoric water line (LMWL) (dashed line: δ2H = 7.22 × δ18O + 3.5). Some other samples, including a few surface water (reservoir, river, and lake) samples and a groundwater (well) sample located in the area around Ebinur Lake, plotted slightly to the right of the MWLs. There was a significant linear relationship between the δ18O and δ2H of surface water, except for lake water (see Figure 11 on the right), which was correlated with the Aqikesu River (R2 = 0.94) > Bortala River (R2 = 0.93) > reservoir (R2 = 0.89) > Kuitun River (R2 = 0.72) > Jing River (R2 = 0.60). The sample distribution along the MWLs verifies that precipitation is a source to the river. However, due to drought and high temperatures in the study area, the hydrogen and oxygen isotopes of the river are greatly affected by evaporation, especially around the lake [43].
According to Figures 15 and 16, the order of average temperature, rainfall, relative humidity, and runoff in the basin in May was as follows: A’lashankou Meteorological Station (AMS, 20.7 °C) > Jinghe Meteorological Station (JMS, 20.5 °C) > Bole Meteorological Station (BMS, 18.2 °C) > Wenquan Meteorological Station (WMS, 13.5 °C); WMS (32.3 mm) > BMS (28.1 mm) > AMS (21.6 mm) > JMS (15.3 mm); WMS (52%) > BMS(45%) > JMS(40%) > AMS(35%); and Jinghe Hydrometric Station (10.8 m3/s) > Wenquan Hydrometric Station (7.5 m3/s) > Bole Hydrometric Station (7.0 m3/s). Combined with the geographical location of each weather station and hydrologic station, the upper reaches of Bortala River in May have low temperatures, high rainfall and high relative humidity. However, with the decrease in altitude, the temperature rises somewhat and both rainfall and relative humidity decrease. Since the Bortala River is long and the upper reaches are far away from Ebinur lake, while the Jing River is short and close to the lake, the changes in temperature and rainfall of the Jing River are not obvious, and the temperature in the middle and upper reaches of the Bortala River is higher than the overall temperature of the Jing River. Affected by altitude and high winds, Ebinur Lake has the highest temperature and the lowest rainfall and relative humidity. Combined with Figure 13 and the slope (Figure 11) of different water bodies in the study area, the following trend can be observed: Jing River (k = 0.83) > Kuitun River (k = 2.70) > groundwater (k = 4.60) > Aqikesu River (k = 4.96) > reservoir (k = 5.29) > Bortala River (k = 6.48), which are all lower than the slopes of the MWLs (k = 8 and 7.22). It can be seen that the upper reaches of Bortala River are supplied by ice and snow meltwater and precipitation, and the values of δ18O and δ2H are relatively negative. As the altitude decreased, river recharge decreased, temperature increased, and evaporation increased, while hydrogen and oxygen isotopes were gradually enriched in the direction of Ebinur Lake. However, for the Jing River and Kuitun River, due to the short river length, flat terrain, frequent human influence, low rainfall, high temperature, and evaporation, the δ18O and δ2H values were more positive without obvious change. H1 and H2 are located in the downdraught of A’lashankou, where the hydrogen and oxygen isotope values (H1 > H2) were much higher than other areas due to high temperature, low rainfall, and strong wind. The Aqikesu River is relatively well supplied with groundwater (according to the field investigation) and located in a protected area (with good ecological environment, more vegetation, and no interference from human activities). Despite the low rainfall and high temperature, the hydrogen and oxygen isotopes were similar to the upstream of Jing River.
The stable hydrogen and oxygen isotope signatures of the region show discrete zonal distributions in Figure 11, indicating that the water sources differ for different river sections, but the hydraulic connections between most water bodies are similar. The most depleted water samples in the lower left corner of the figure were all collected from the upstream part of the river (Figure 11, left), which is supplied by snow and meltwater that is depleted in δ2H and δ18O. Compared to most water samples, the δ18O and δ2H values of lake water were more enriched (Figure 11a). Since there are large saline alkali lands surrounding the lake, and high temperatures and high evaporation at the end of May in the watershed, the δ18O and δ2H in the water samples around the lake were higher than in other samples.
The d-excess is an important parameter for evaluating the effect of evaporation [44], and its value decreases during the evaporation process. From Figure 11, the d-excess values were in the maximum range (15‰–20‰) for water samples from reservoirs or rivers near towns. Approximately 45% of samples taken from the upstream parts of rivers and groundwater had d-excess values in the range of 10‰–15‰. Two water samples around Ebinur Lake were in the range of 5‰–10‰ and 0‰–5‰. Due to the large amount of evaporation in the lake region, the d-excess values of lake water were −19.4‰ and −25.6‰, respectively. When evaporation affects TDS of water bodies, water sample points are close to the evaporation line, whereas when mineral dissolution affects TDS, water sample points are close to the salt dissolution line (Figure 12). Water samples in the upper reaches of the river are mostly located at the intersection of salt dissolution and evaporation. The upstream at high elevation has low evaporation. Due to the flat terrain in the lower reaches of the river, the velocity is slow, and the evaporation rate is high. The TDS content of water samples in this area is greatly affected by evaporation. The sample point values (Figure 12) were close to the evaporation line. The influence of evaporation on the lake is stronger than on the samples surrounding the lake, showing high salinity and high evaporation. The smooth topography associated with the Aqikesu and Kuitun Rivers results in a slow flow rate with saline soil; thus, the water is prone to causing salt dissolution.

4.3.2. δ2H and δ18O of Different Water Bodies with Altitude Change

The basic spatial distribution of isotopes in water (Figure 13) was determined for δ2H and δ18O analyses for meteoric water (snow and rainfall) sampled at different altitudes from the plains (altitude = 190 m) to the mountains (altitude = 4827 m). To some extent, the height trend of hydrogen–oxygen isotopes reflects the elevation effect between different water bodies in the watershed, which is of great hydrogeological significance for the study of water circulation processes in the watershed. The groundwater isotopes change due to surface evaporation in the process of surface runoff or infiltration after the rain reaches the ground, and the remaining heavy isotopes are enriched. Therefore, the downstream parts of the central basin are high in isotopes, revealing a lower-altitude source of recharge, likely linked to the lower altitudes of their watershed. The isotopic composition of lake water is closely related to the type of water supply, geographical location, and natural conditions. Ebinur Lake is strongly evaporated at the lower wind gap of A’lashankou; thus, the hydrogen and oxygen isotopic values of samples H1 and H2 were higher than other water samples, and H1 was higher than H2. Due to human activities, the isotope values of K1 to K3 in the Kuitun Oasis were higher than other rivers. Except for W1 and W5, the other reservoirs were mostly located in flat areas with low flow rates and high rates of evaporation, mostly of river recharge. Isotope values were higher than the upstream parts of the same rivers. The isotopic distribution of groundwater and rivers shows that the river has a certain hydraulic relationship with groundwater (Figure 11 and Figure 13). However, the oxygen isotope exchange between water and oxygen-bearing rocks may increase the content of groundwater at high temperature; therefore, the isotopes of groundwater were more concentrated than in rivers. The evaporation process exists not only in surface water but also on the surface of the subsurface layer, and the isotope values of sample D6 were higher than other groundwater samples.
Consequently, direct rainfall infiltration in the plains seems to have a low contribution to lake and downstream parts of rivers. This could be explained by low rainfall and high evaporative demand in the plains. The recharge of the river and groundwater seems to be mainly by wadi floods or dam releases from the high mountains, which receive important precipitation in the form of rainfall or snowfall [45].

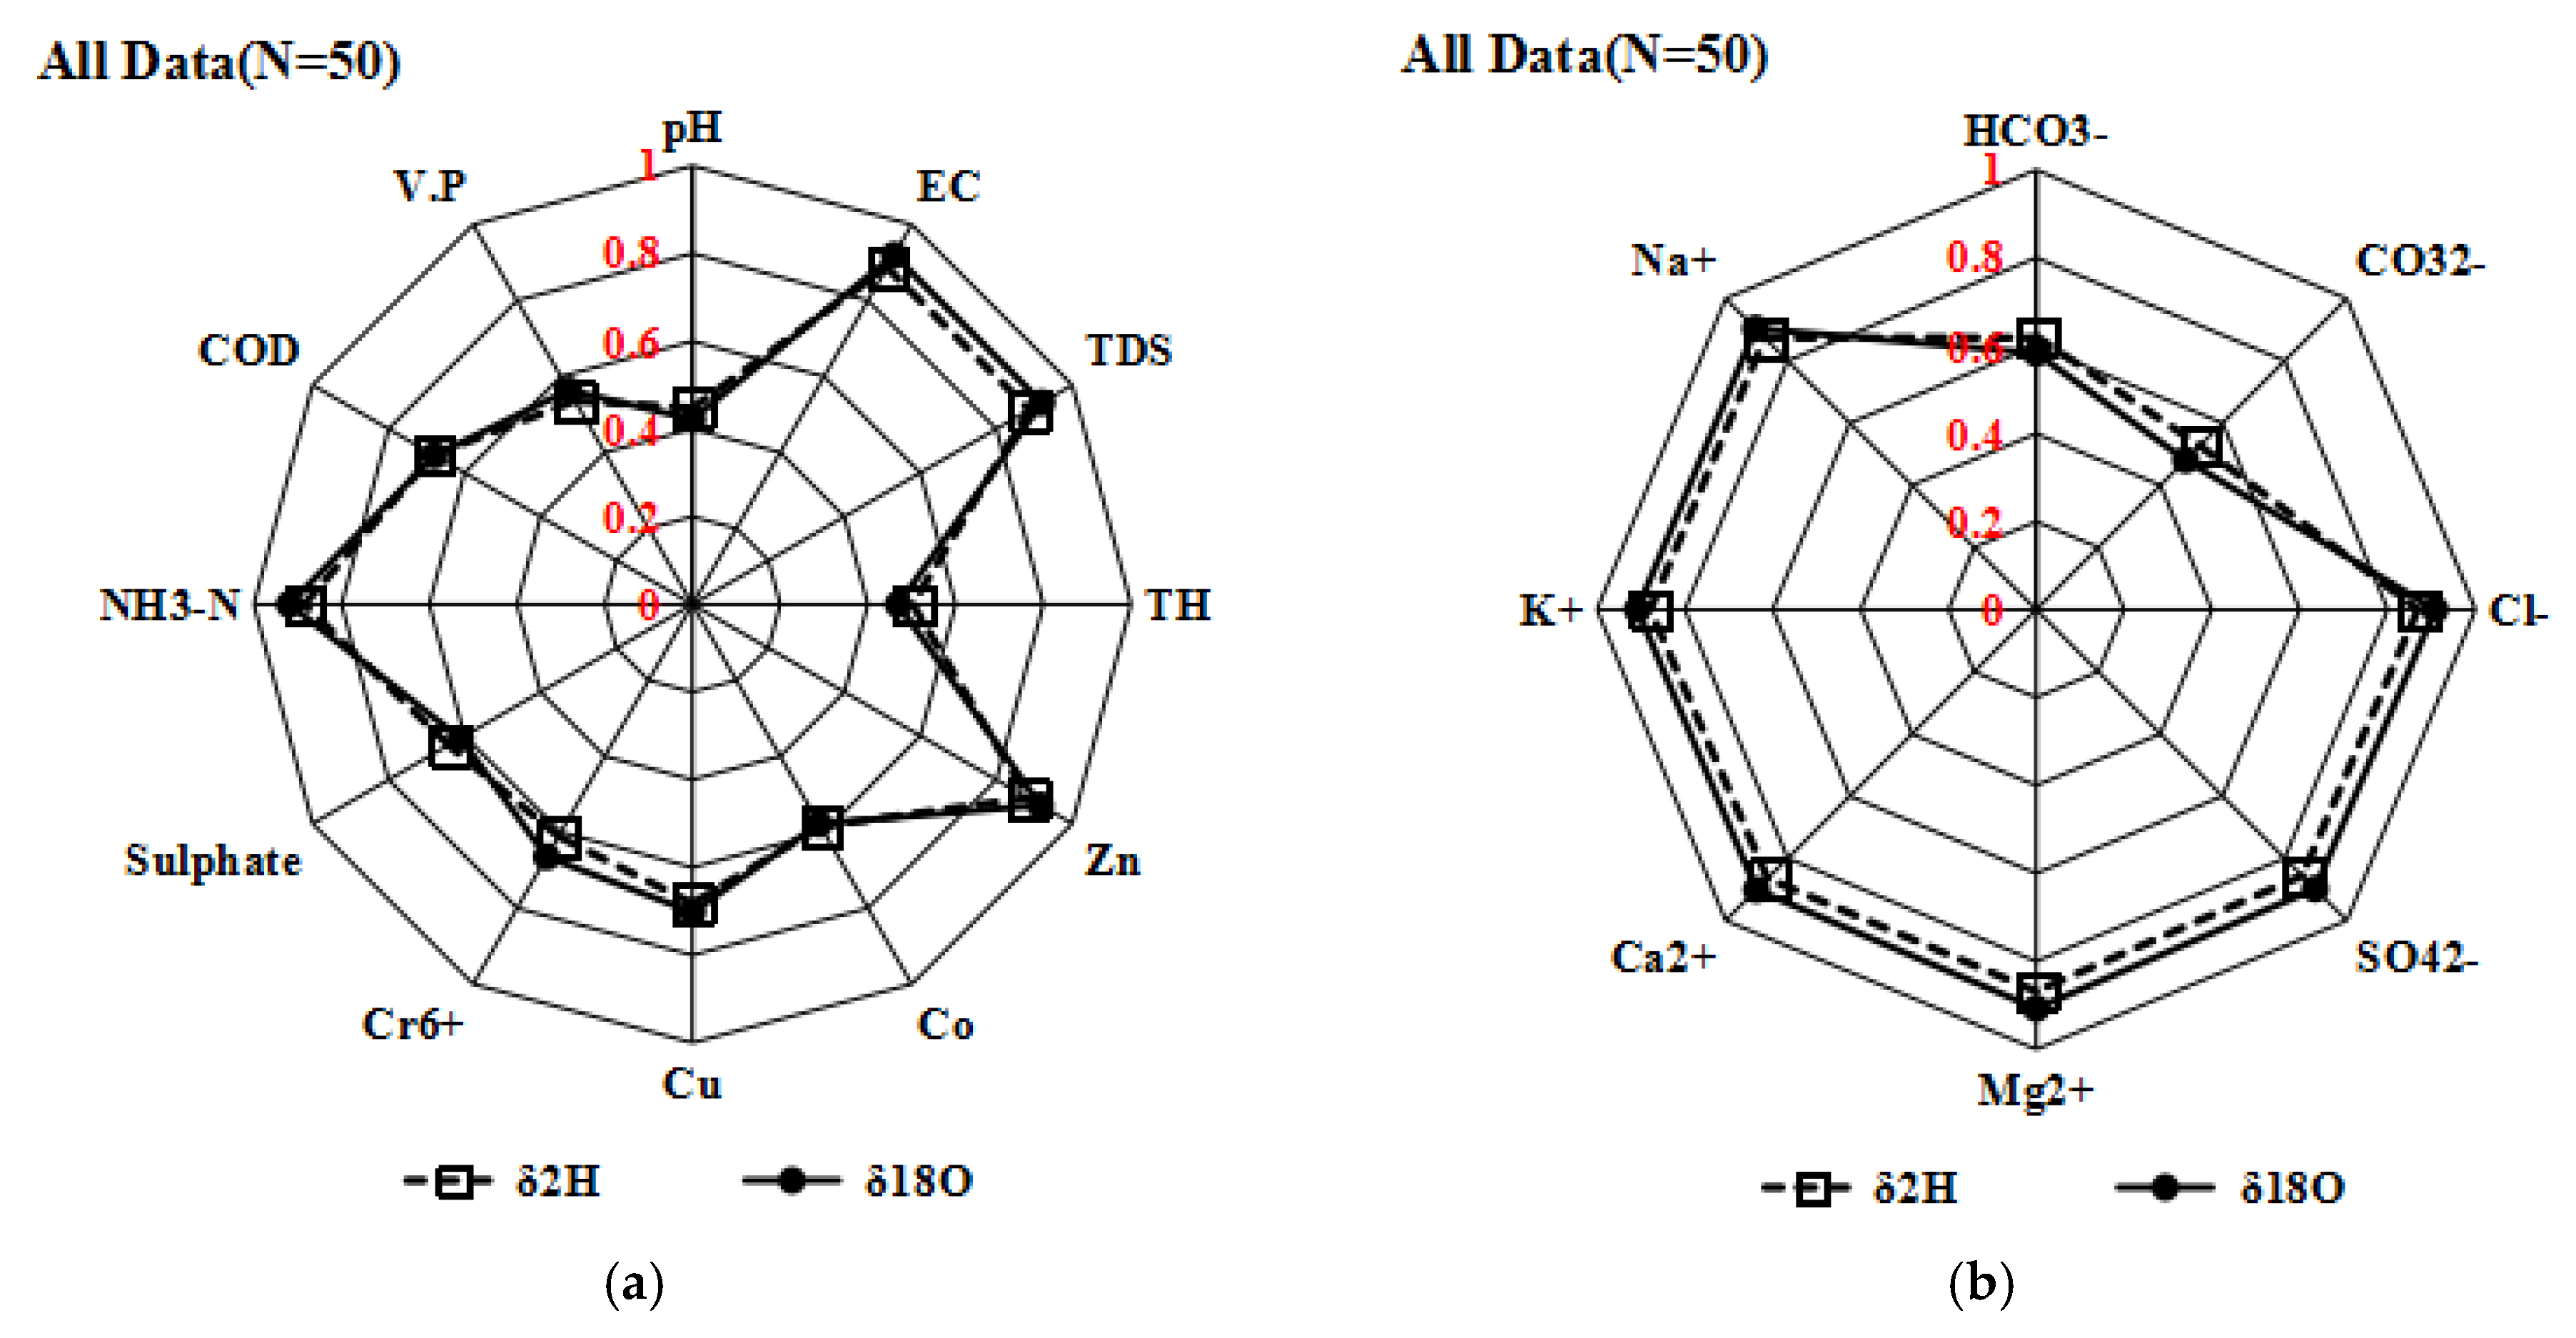
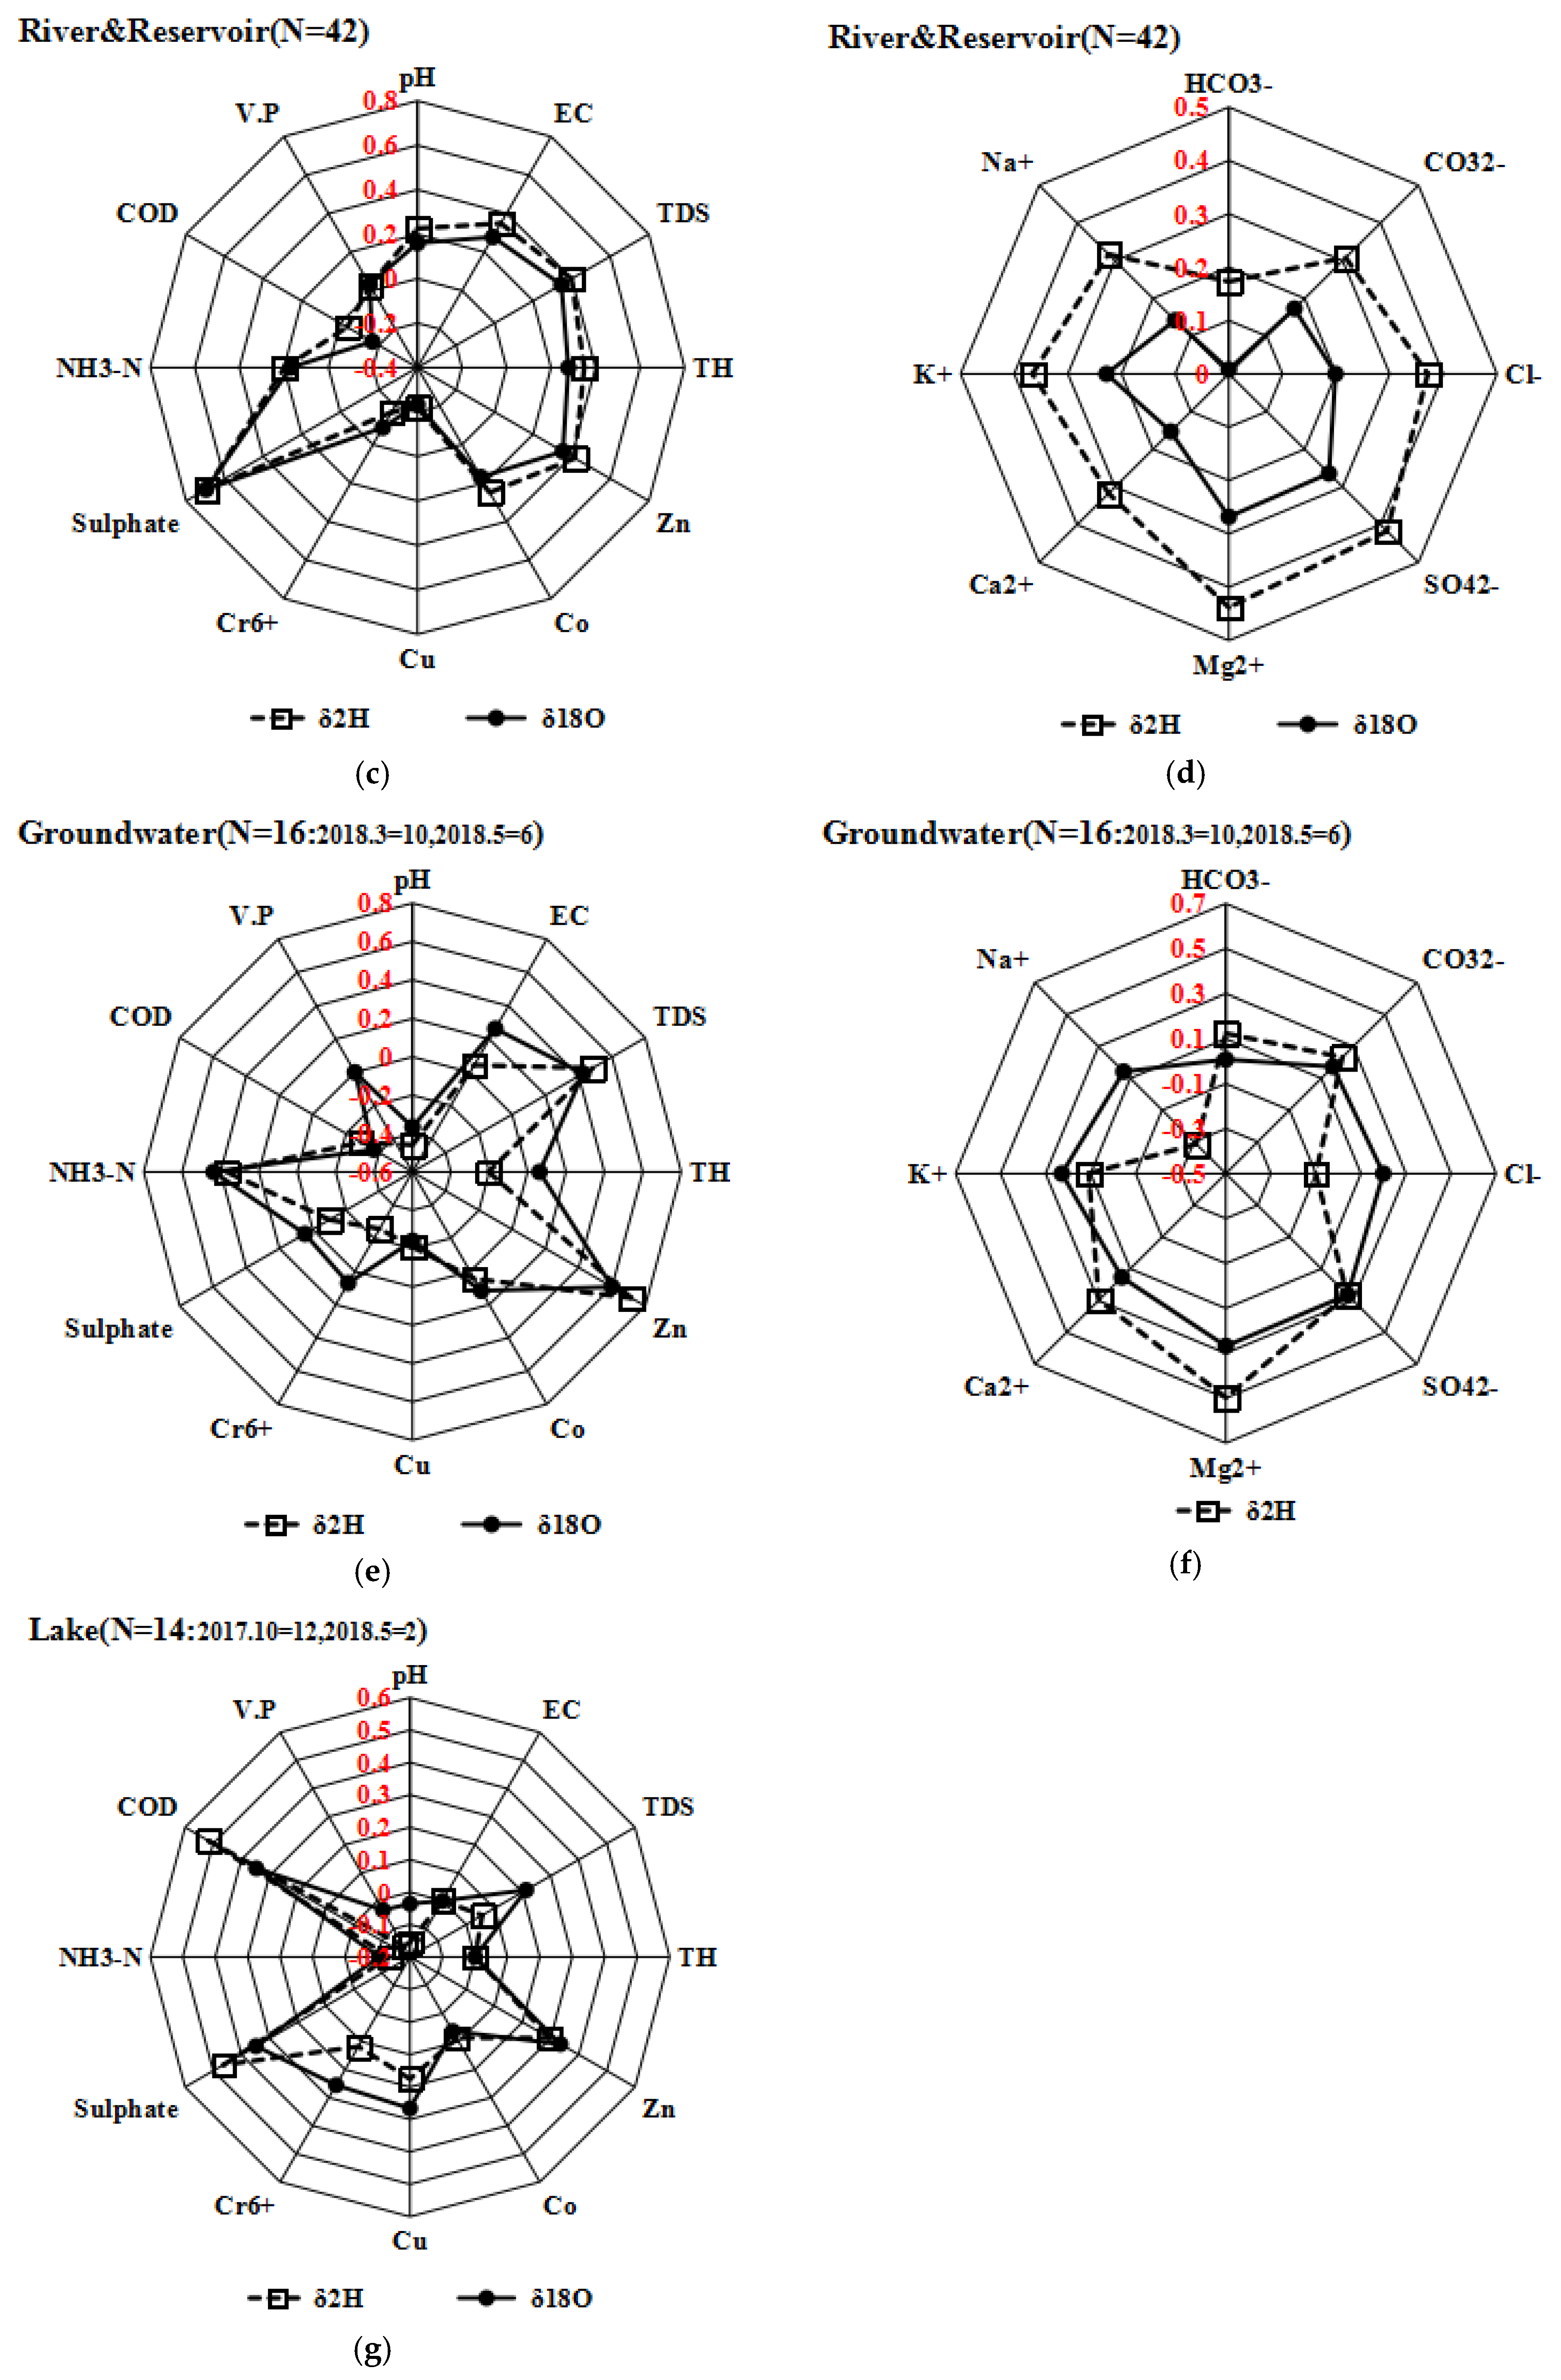
4.4. Correlation Analysis of Hydrochemical Characteristics and Hydrogen and Oxygen Isotopes

The correlation analysis of hydrochemical indices and hydrogen and oxygen isotopes of all water samples shows that hydrogen and oxygen isotopes have a significant correlation with NH3-N, EC, TDS, and Zn (R > 0.8), and a low correlation with VP, pH, and TH (R < 0.6) (Figure 14a). Therefore, it can be found that hydrogen and oxygen isotopes have a certain correlation with water quality parameters (especially metal ions and biological indicators), which may be affected by human activities. In addition, except for HCO3 and CO32− (Figure 14b), other main ions (K+, Ca2+, Na+, Mg2+, Cl, SO42−) have a great correlation with hydrogen and oxygen isotopes (R > 0.9). Most of these ions were ions contained in the main mineral resources in the basin (manganese salt and magnesium salt), indicating that hydrogen and oxygen isotopes are greatly affected by basin geology, evaporation, and water–rock interaction.
In order to explore the relationship between hydrochemical characteristics and hydrogen and oxygen isotopes of different water bodies in more detail, the water samples were divided into three parts for analysis—river and reservoir, groundwater, and lake. Due to a few groundwater and lake water samples collected in this study, the groundwater and lake water samples collected in March 2018 (groundwater, N = 10) and October 2018 (lake, N = 12) were supplemented for analysis (the non-ionic data of lake water was available for October 2017; thus, correlation analysis was only conducted with water quality parameters).
For rivers and reservoirs (Figure 14c–d), except for the high correlation between hydrogen and oxygen isotopes and sulfate (R > 0.75), the correlation for other water chemical indicators was low (R < 0.5), in which Cu, Cr6+, COD, and hydrogen and oxygen isotopes were negatively correlated, while VP was not correlated with hydrogen and oxygen isotopes. The correlation between δ2H, δ18O, and ions was similar, but the correlation between δ2H and ions was larger than that between δ18O and ions. For groundwater (Figure 14e–f), Zn had the highest correlation with δ2H (R > 0.75), followed by Mg2+ (R > 0.5), NH3-N and TDS (R > 0.4), and COD, pH, TH, Cu, Cr6+, Na+, and Cl, which had a negative correlation. On the whole, the correlation between H and each parameter was greater than that between δ18O and each parameter, and the correlation between δ18O and each ion was roughly the same as that between the rivers. For the lake water (Figure 14g), COD and δ2H had the highest correlation (R > 0.5), followed by sulfate and Zn (R > 0.4), while NH3-N, pH, and VP had a negative correlation with δ2H (R < −0.1).
In conclusion, hydrogen and oxygen isotopes had the highest correlation with all water chemical parameters of all water samples in May 2018, and the correlation δ2H with each parameter was similar to that of δ18O with each parameter. However, according to the correlation analysis of different water bodies, the correlation between various water chemical parameters and hydrogen and oxygen isotopes decreased, and the hydrochemical parameters most closely related to isotopes were also different (the correlation between hydrogen isotopes and each chemical parameter was generally greater than that between oxygen isotopes and chemical parameters). These results may be different from the sampling season of the supplementary water sample data (in previous studies, it was found that the correlation between water chemical parameters and hydrogen and oxygen isotopes of surface water in different seasons was different [46]).

5. Discussion

Water quality is always of vital concern, as poor water quality adversely affects soil nutrients, plant growth, and human health. Rivers, reservoirs, and groundwater are important sources of water for urban residents in the Ebinur Lake Watershed, for both domestic water supply and agricultural irrigation. However, in the Ebinur Lake region, groundwater exchanges are complex and responsible for the contamination of freshwater resources by activities that enhance crop damage and the deterioration of surface water quality. This study, thus, investigated the basic elements, metal element concentrations, and other water quality parameters of groundwater and surface water to assess water quality for agricultural and domestic uses. The study also evaluated the factors that regulate its quality. The groundwater collected by this research was mostly well water from villages near river water sampling points. It is apparent that the groundwater quality was greatly affected by surrounding rivers during the sampling period. However, except for the Kuitun River, the groundwater associated with the Bortala and Jing Rivers can be used for drinking water. For the sake of people’s health, the government installed water pipes for every farm household, and the water in pump wells is mainly used for irrigation. In addition, this study preliminarily attempted to introduce hydrogen and oxygen isotopes to analyze the water pollution processes between different water bodies. This rough water quality estimation of different water bodies according to the water pollution standards can provide assistance for local water environmental protection departments.
The spatiotemporal variation of hydrogen and oxygen isotopic composition in the study area is affected by topography, climate, and human activities. This study was a comprehensive evaluation of the characteristics of hydrogen and oxygen isotopes of recharge sources such as precipitation, snow meltwater, and groundwater, as well as the effects of evaporation. The curve of the monthly average temperature and monthly average precipitation of four meteorological stations in the study area from 2000 to 2016 (Figure 15) and the monthly average runoff of three hydrological stations from 1960 to 2015 (Figure 16) were added for further interpretation. Figure 15a shows the highest temperature in summer (about 20 °C—June, July, August) and the lowest temperature in winter (about −15 °C—January, February, December). Overall, A’lashankou Station had the highest monthly average temperature, followed by Jinghe Station, Bole Station, and Wenquan Station. However, in addition to the lowest relative humidity of Wenquan station in winter (about 70%), the other monthly variation rules were just opposite to the temperature (Figure 15c). Except for Bole Station in April (30 mm), October and November (20 mm) were slightly higher previous months. The other stations had relatively high rainfall in the summer (Wenquan Station had the highest average precipitation in July, >50 mm).
In conclusion, the spatiotemporal distribution rule of temperature in the study area is as follows: the temperature in the area with high altitude is low (Wenquan Station), the air temperature increases gradually with the decrease in altitude (Bole Station is higher than Jinghe Station), and the air temperature is highest near the lake basin. Generally, the seasonal change of temperature in the basin is as follows: summer (June to August) > spring (March to May) and autumn (September to November) > winter (December to February). The rainfall is basically the same as the seasonal variation, but the spatial distribution is different. The spatiotemporal variation of relative humidity is different from to that of temperature.
From Figure 16, the monthly average flow value of the Jinghe Station changes in an inverted “V” shape. The flow rate in January to April and December is small, varying between 3.37 m3/s and 4.78 m3/s. The flow rate starts to increase rapidly in May, reaches the maximum value in July, and decreases rapidly in September. The monthly average flow of Hot Spring Station shows an inverted “W” type. The monthly average flow of Hot Spring Station is close during January to May, and September to December, changing between 7.28 m3/s and 8.57 m3/s. The value of June to August increases significantly. The flow of Bole Station is an inclined long “Z” type, which is larger in winter. For example, its value is larger in January to March and December, and even as high as 21.69 m3/s in March. Therefore, it can be concluded that runoff distribution in both the Jinghe Hydrologic Station and Wenquan Hydrologic Station is of the “single-peak type”, and runoff is basically concentrated in June and August. However, the Bole Hydrologic Station shows the contrary, and the Jinghe and Wenquan stations show a “complementary” trend.
Snow melt from snow cover is an important source of water for rivers and lakes in this area [45], as well as water treatment plants. However, there are no data on snow cover in the research area at this stage; thus, we cannot discuss this aspect. Further work is required to collect stable isotopes from precipitation, snow, ice, and evaporated water to quantitatively evaluate the contribution and impact of snow, ice, and precipitation on water resources in the watershed and to better explain the evolution of hydrologic cycle, ultimately providing effective help for water resource management in the Ebinur Lake Watershed.

6. Conclusions

By combining field investigations and laboratory analyses, the hydrogen–oxygen isotope concentrations, water chemistry characteristics, and pollution sources of different water bodies in the study area were studied in depth. These data provide a scientific basis for the protection and management of lake water environments in such an arid area. The results are summarized as follows:
(1).
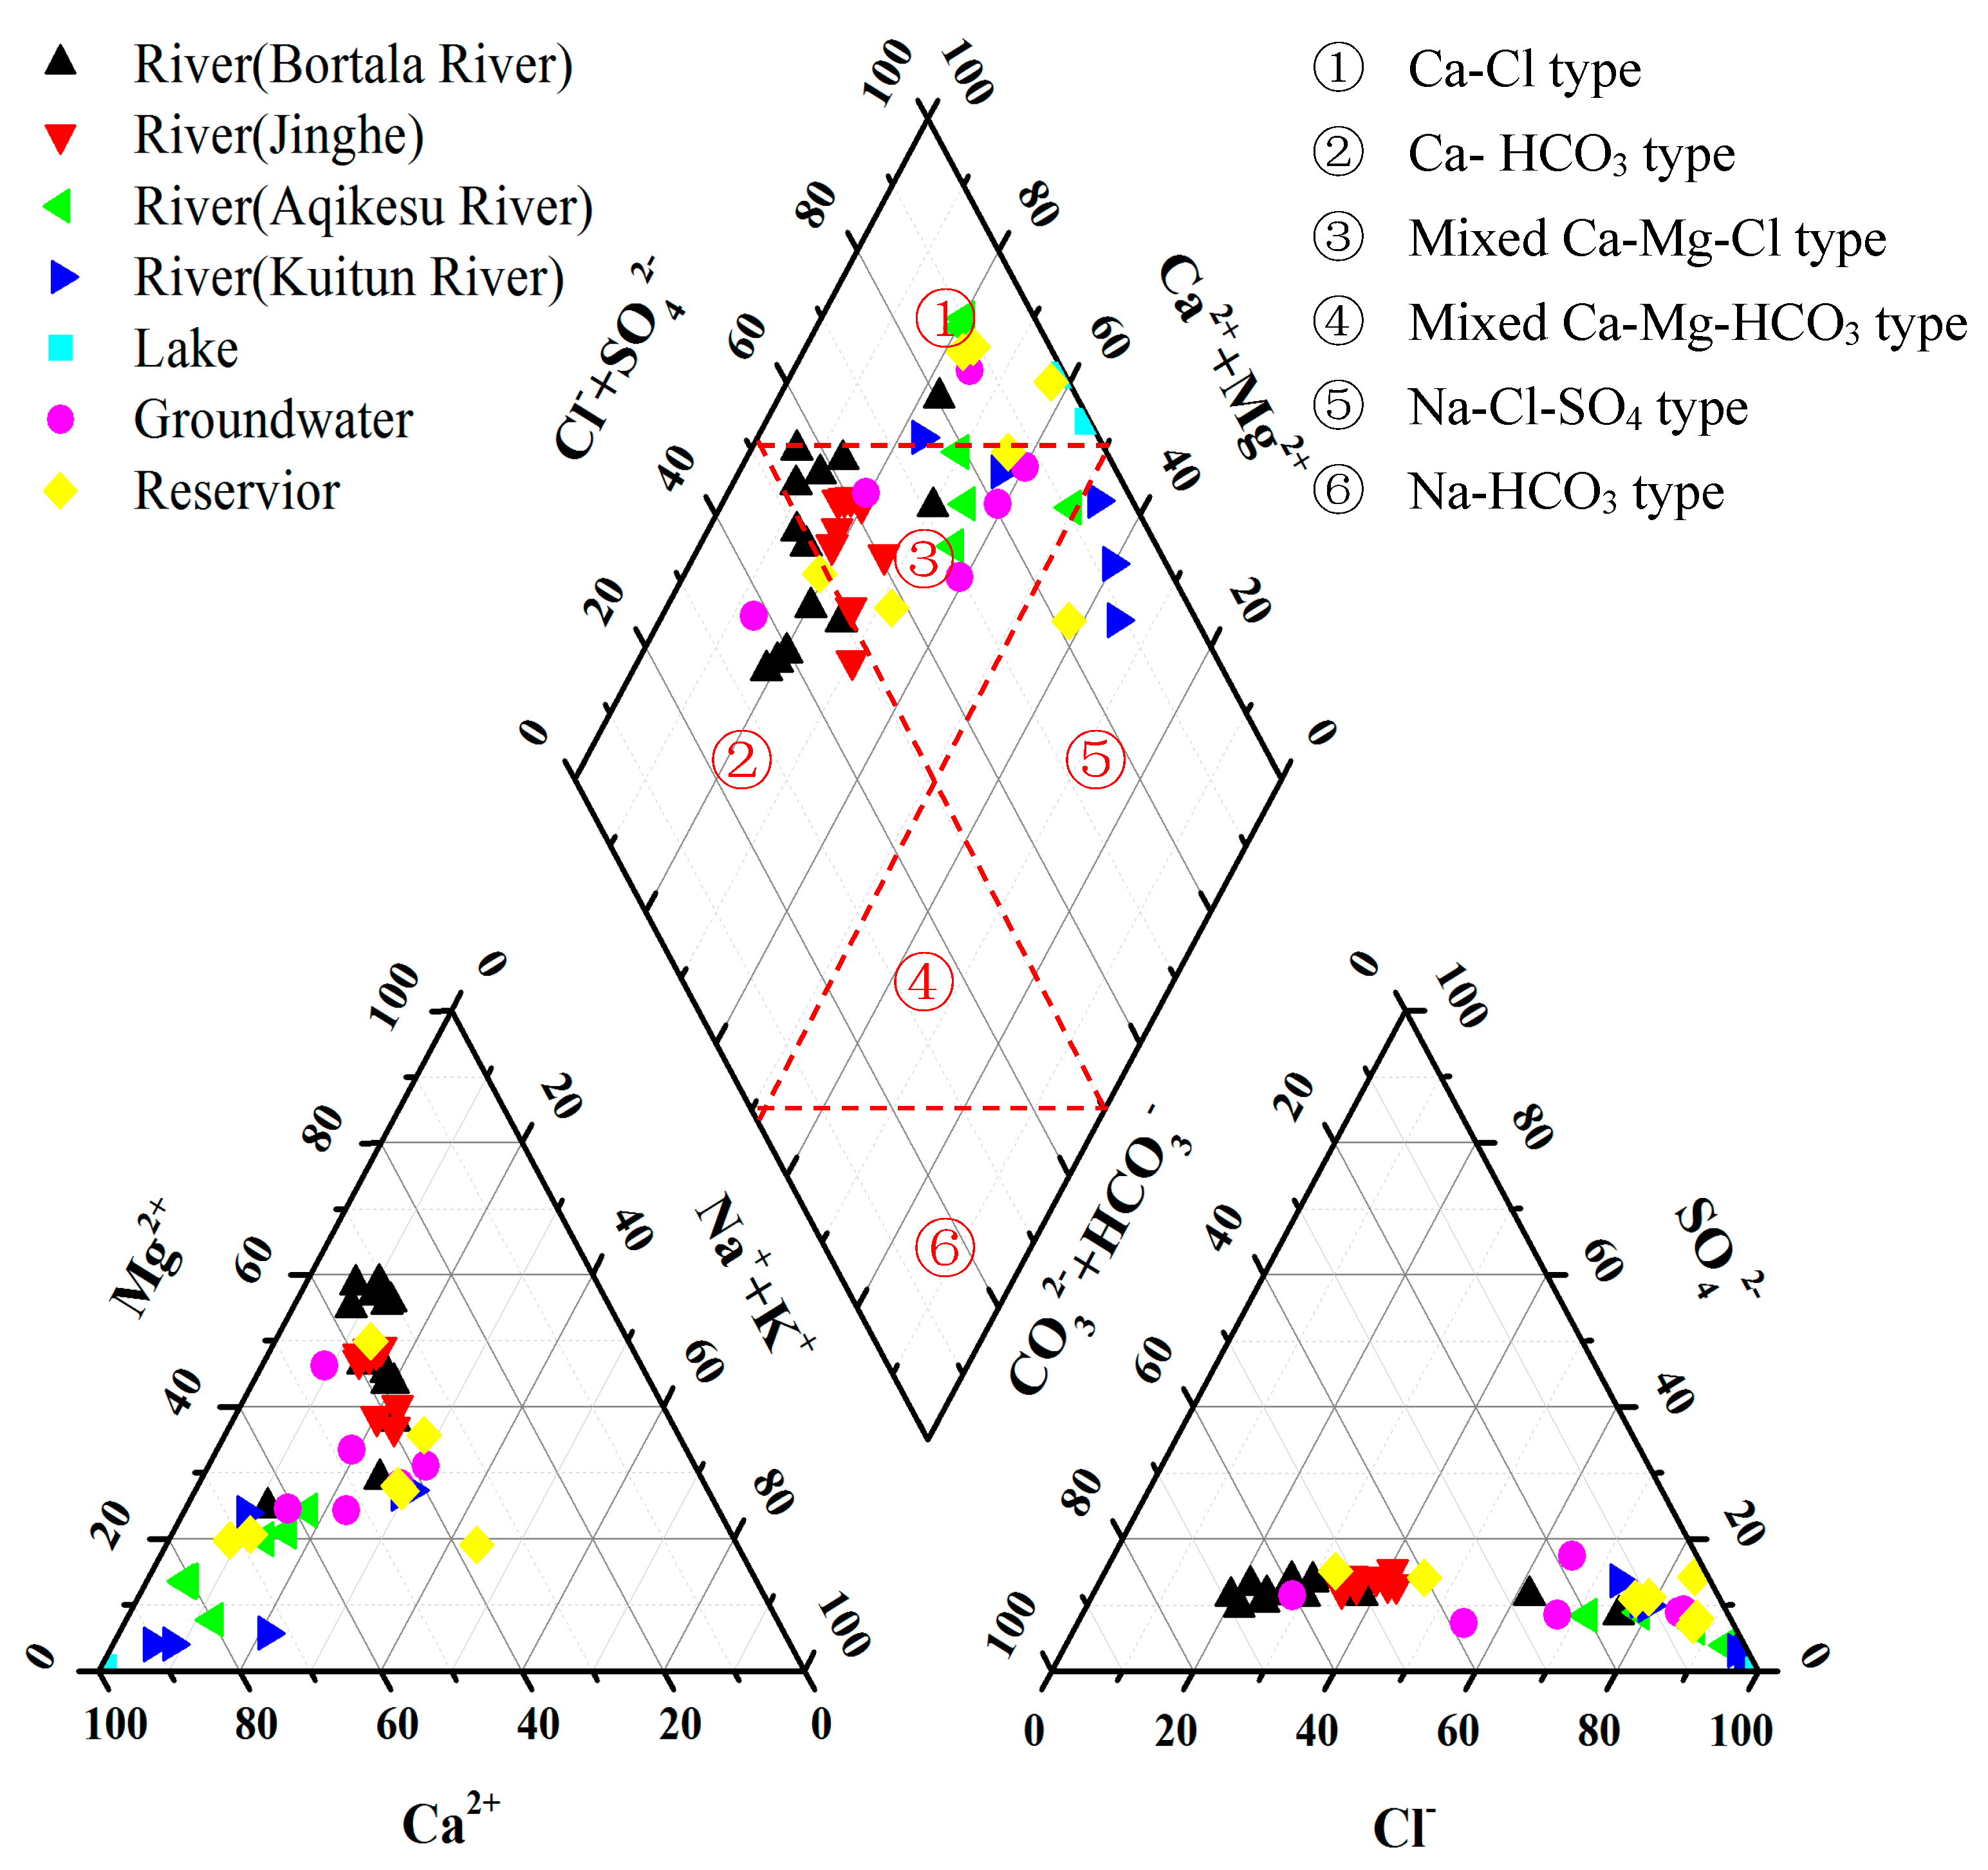
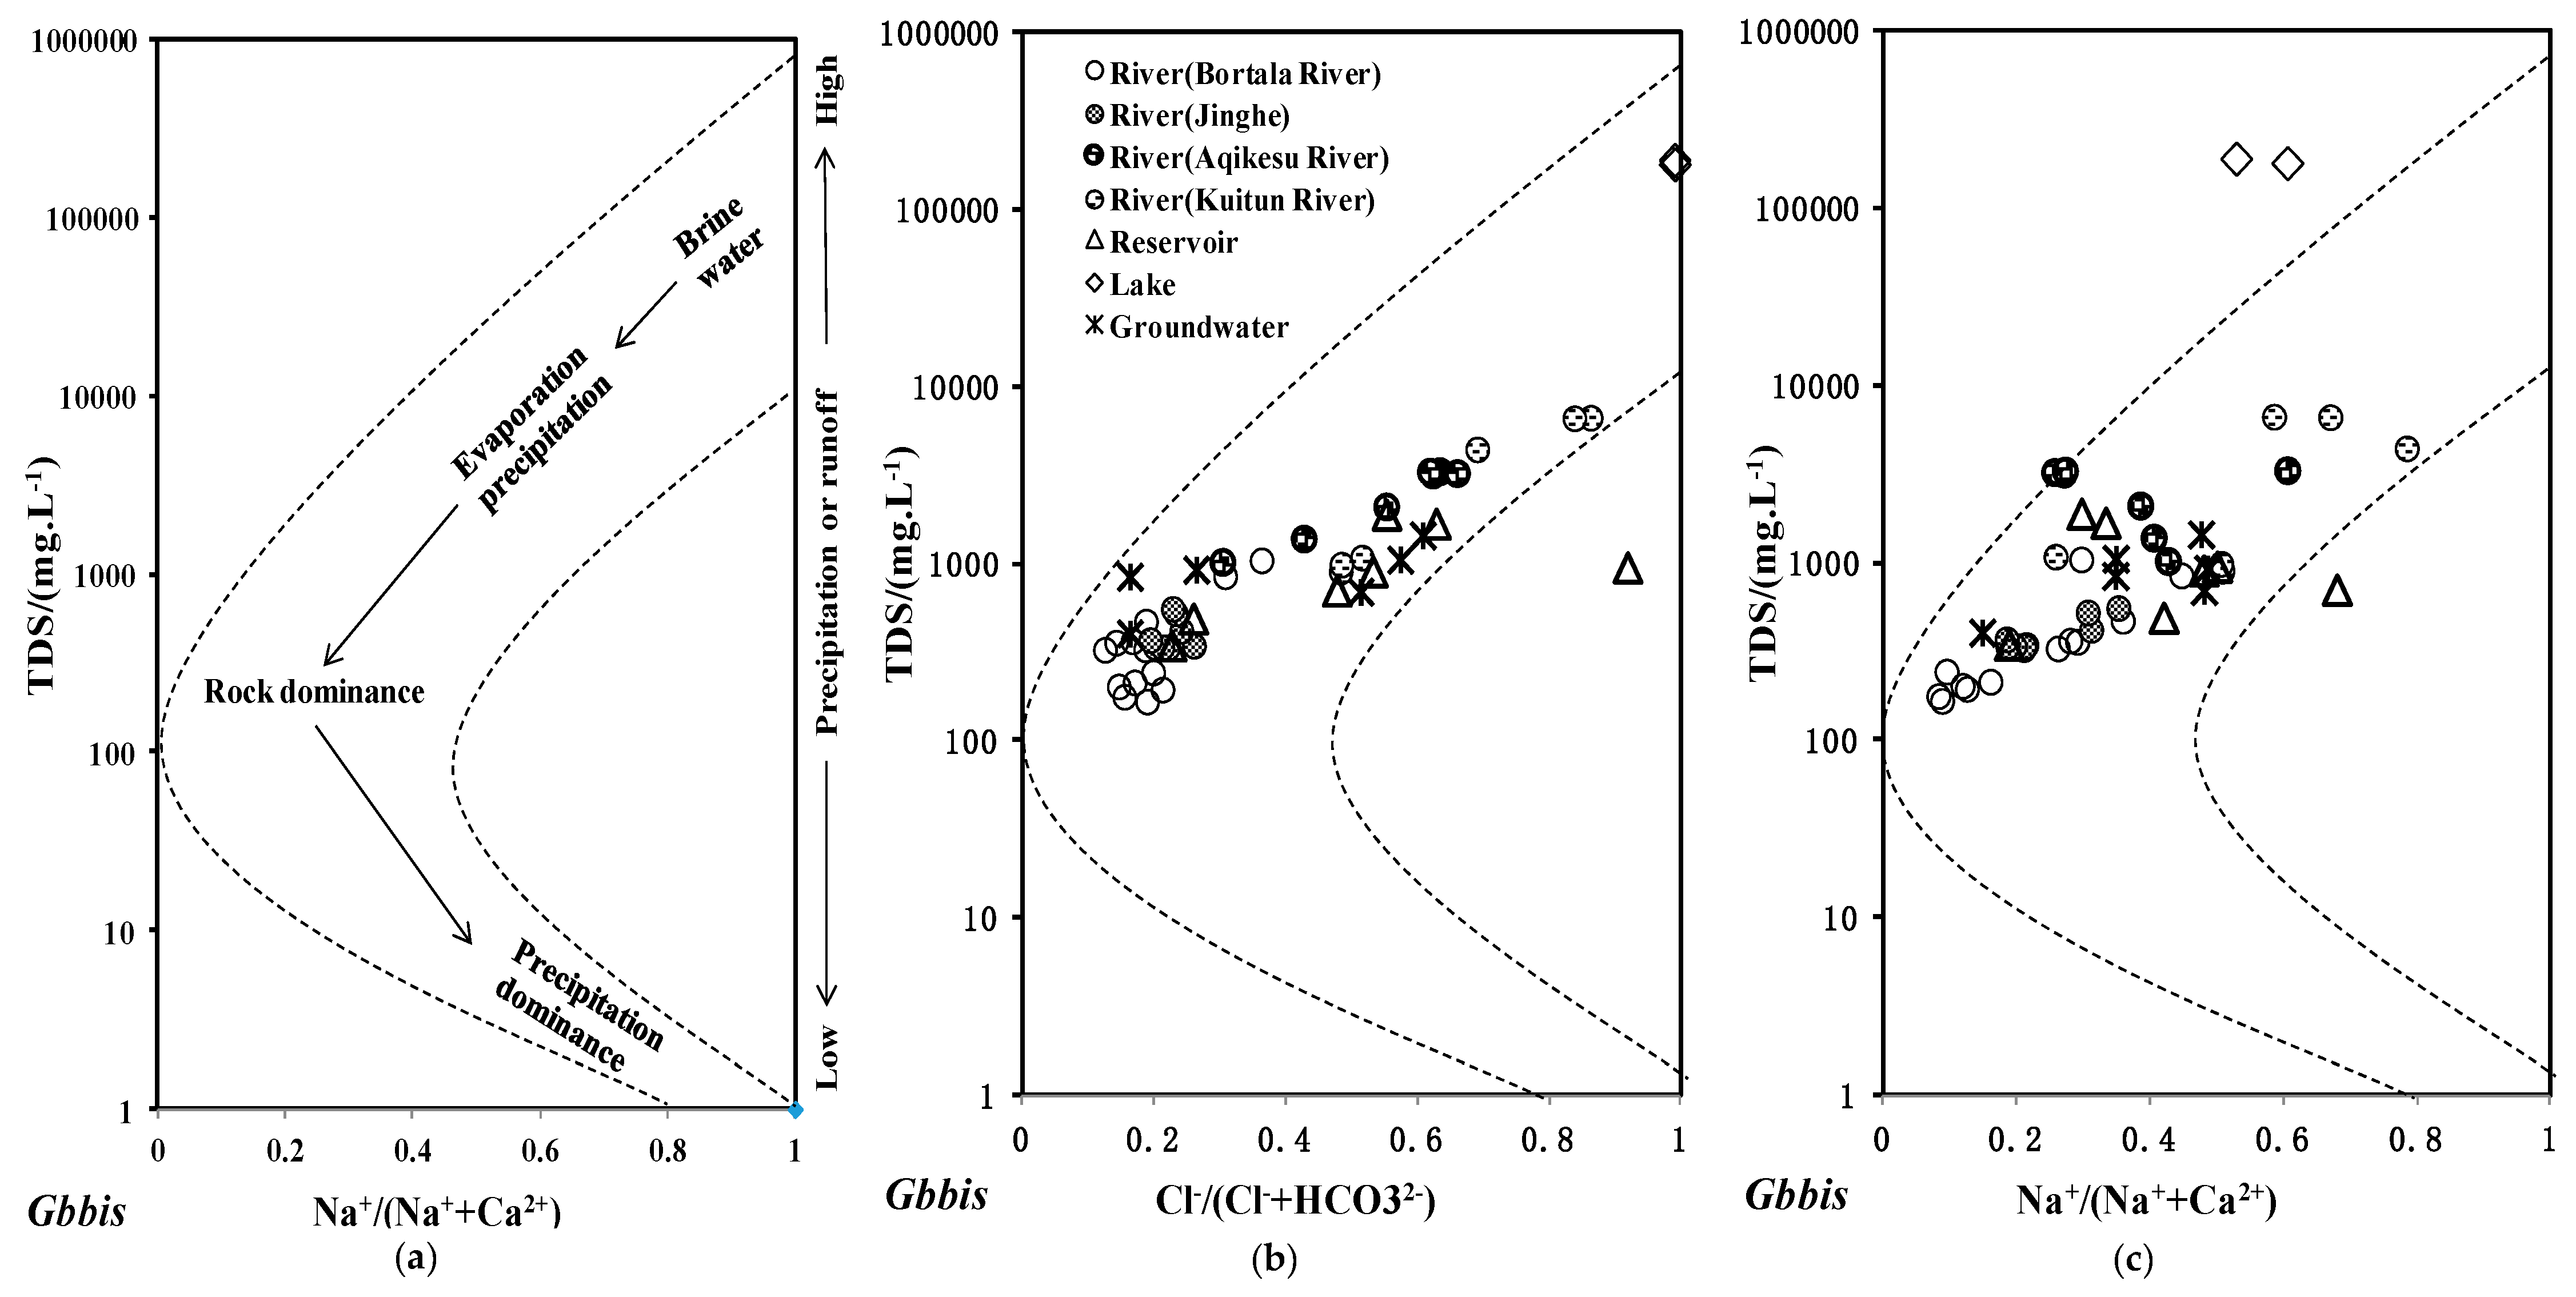
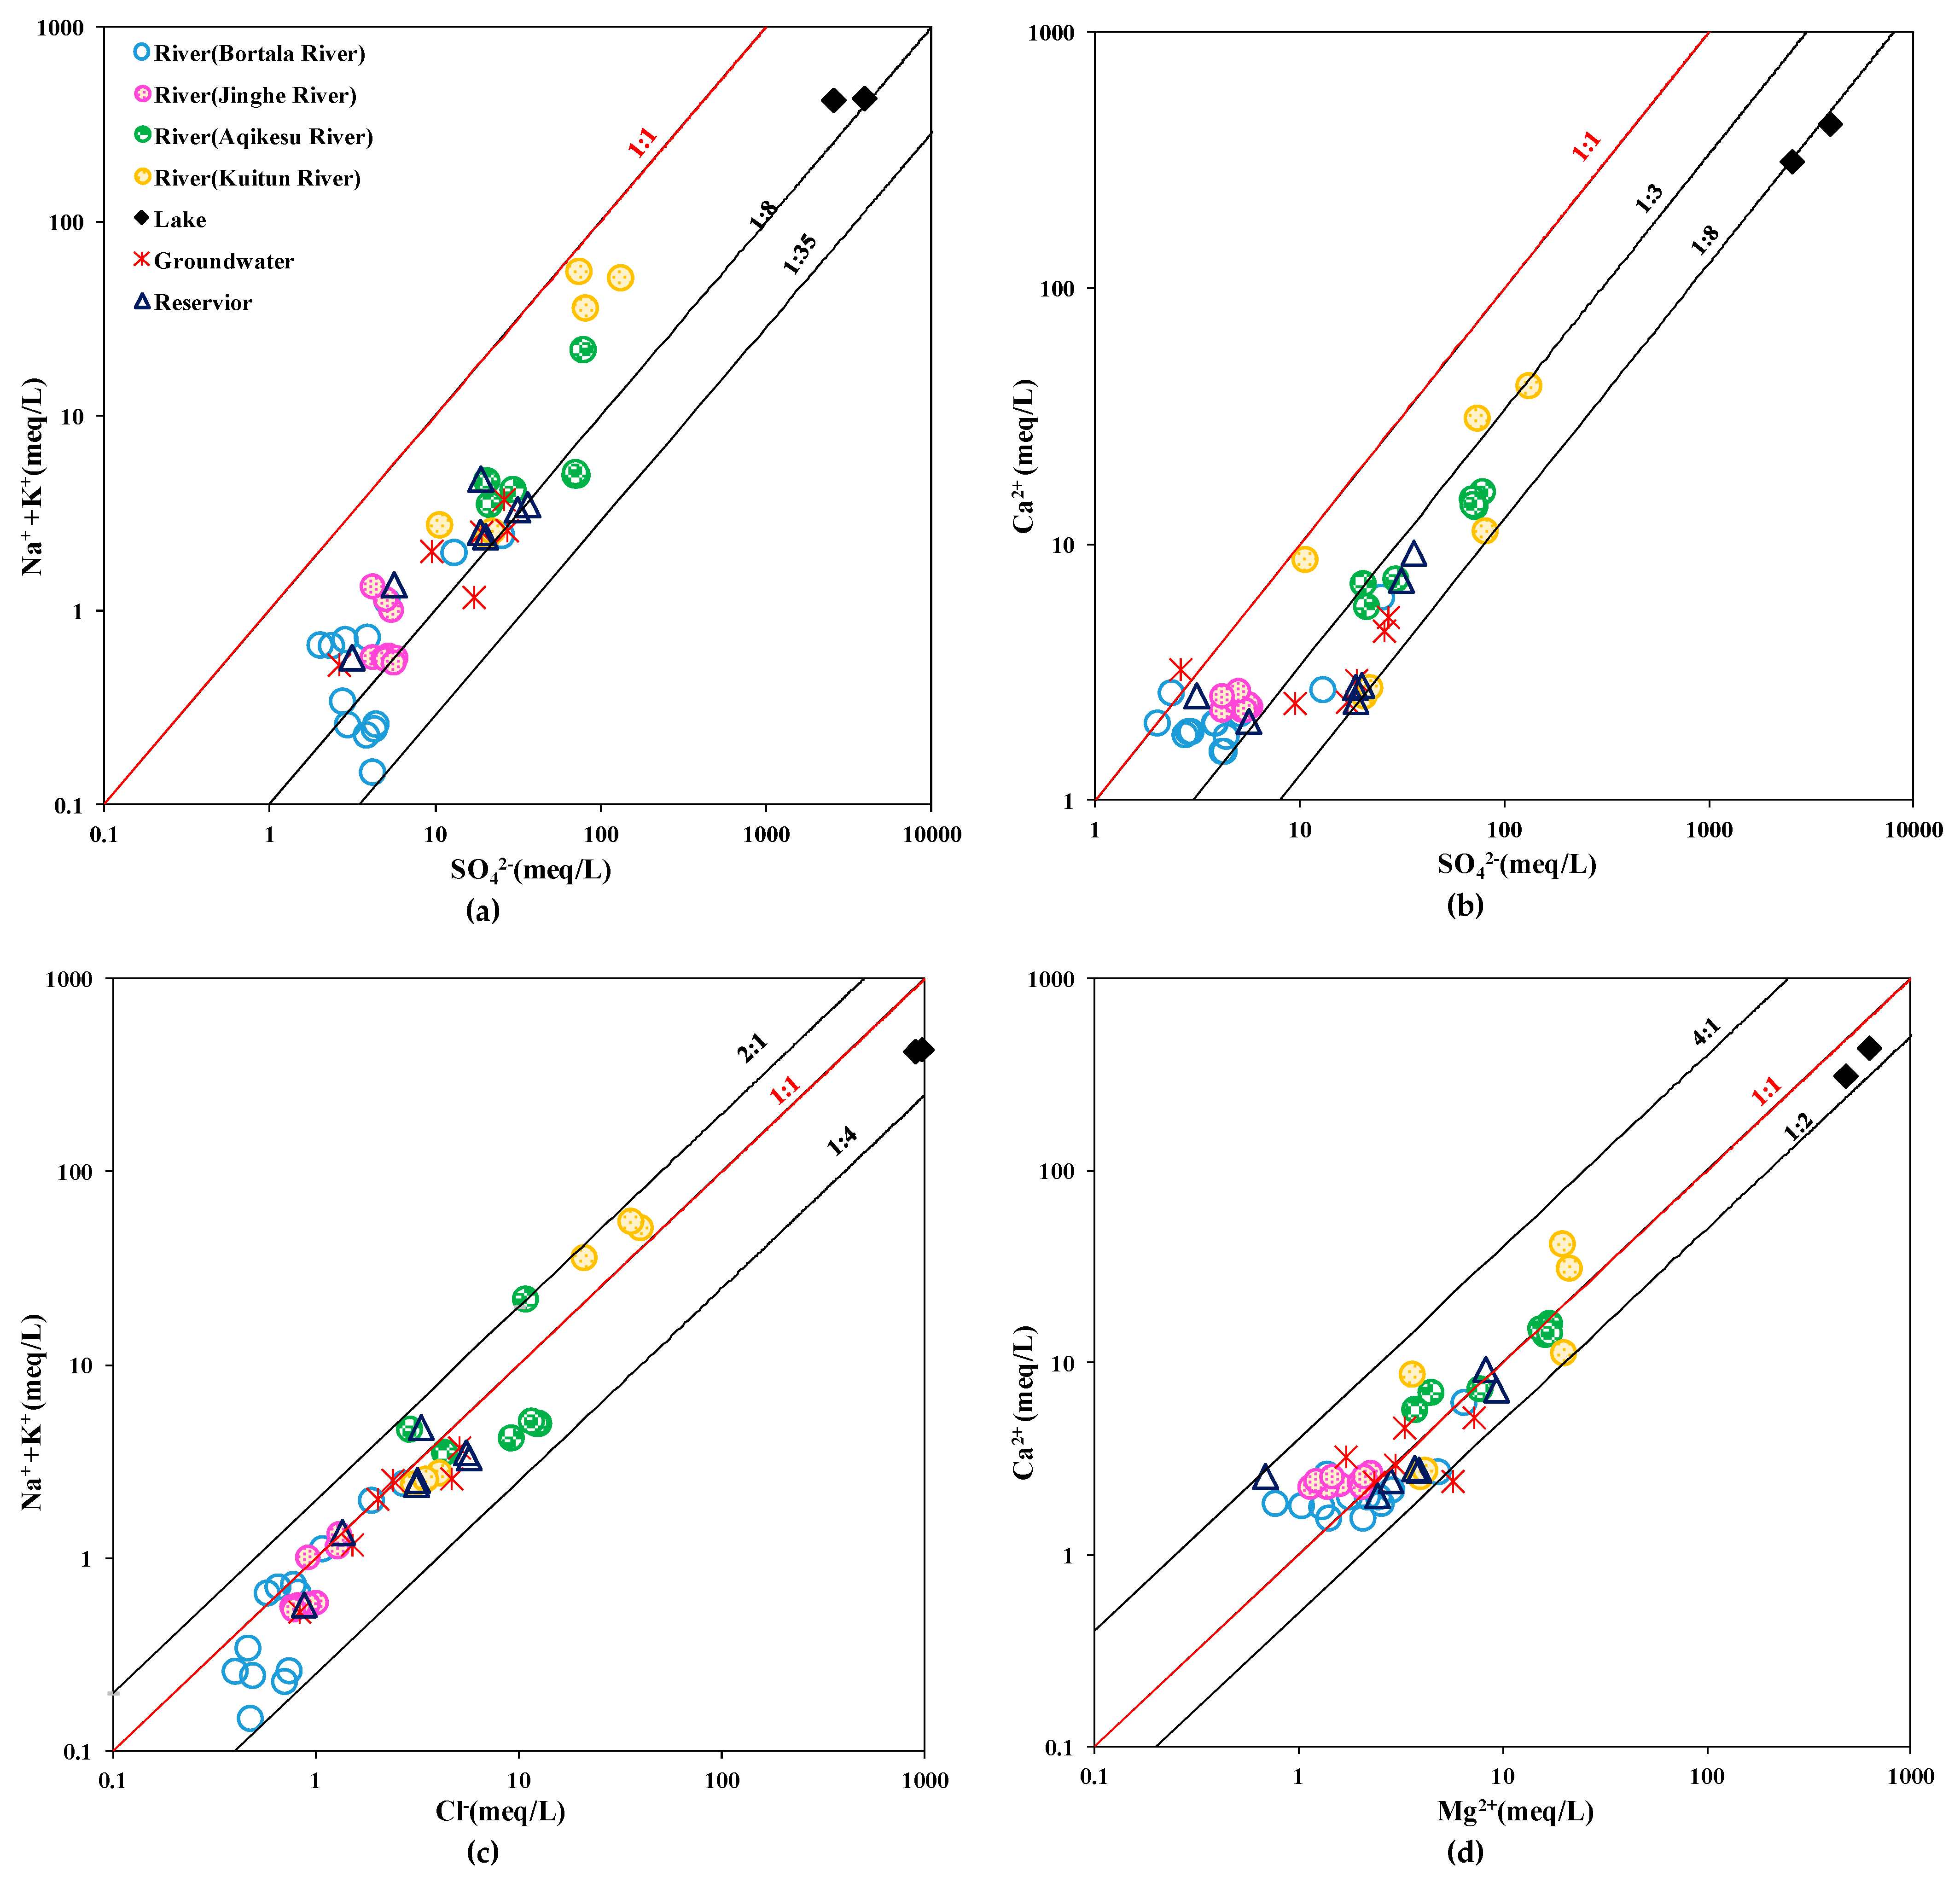
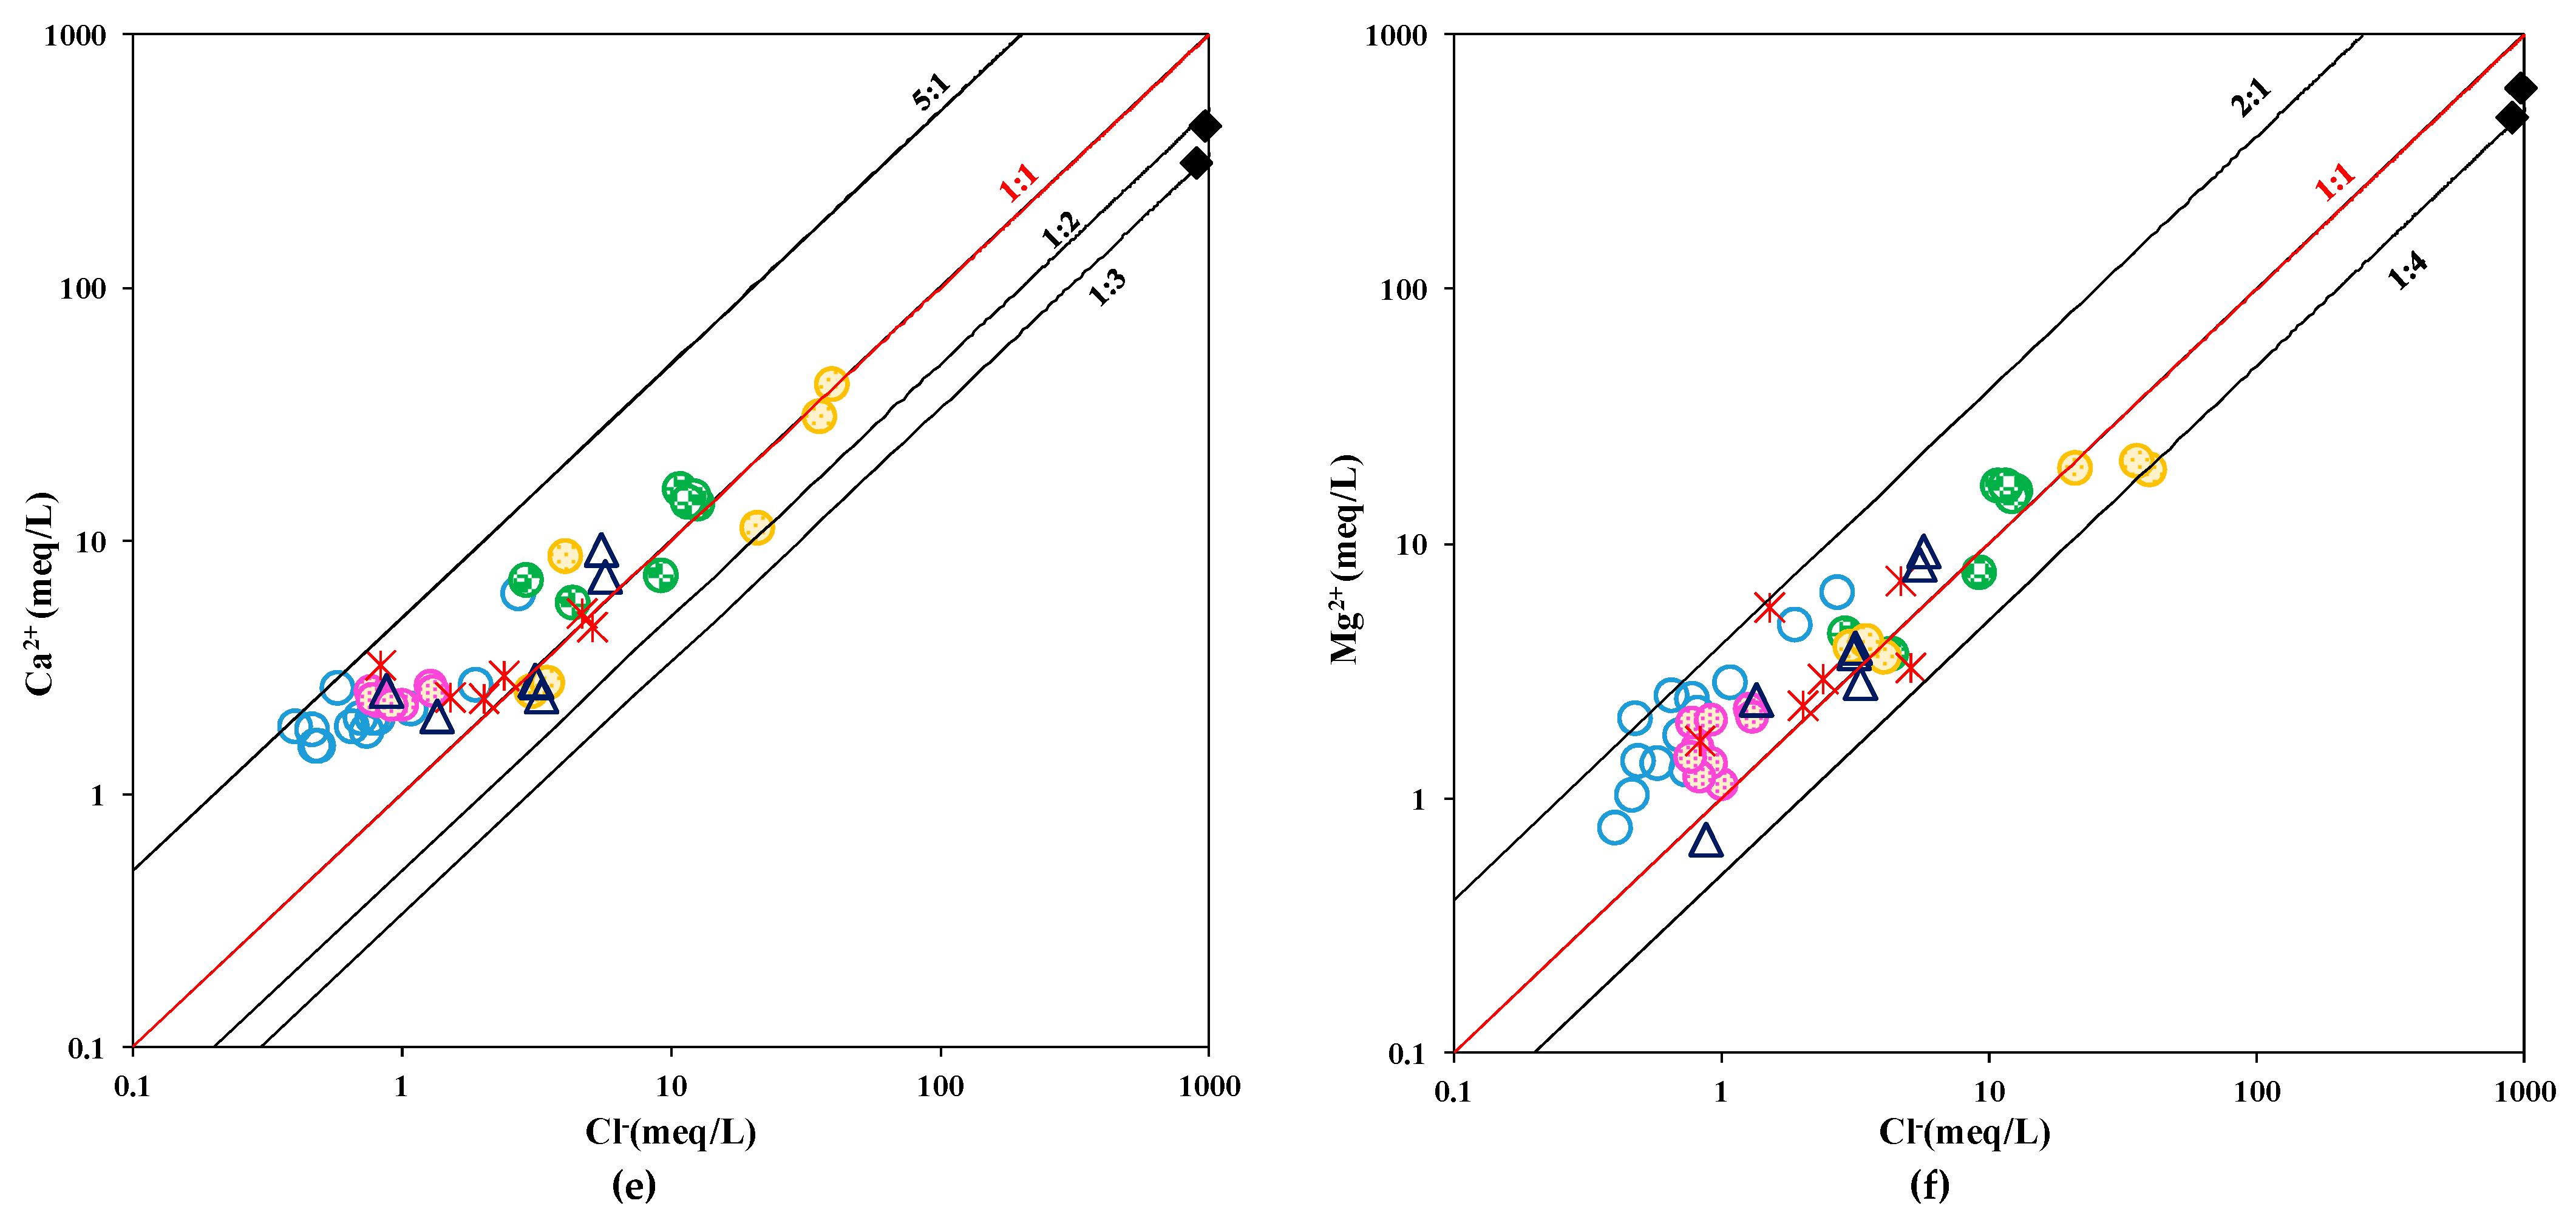
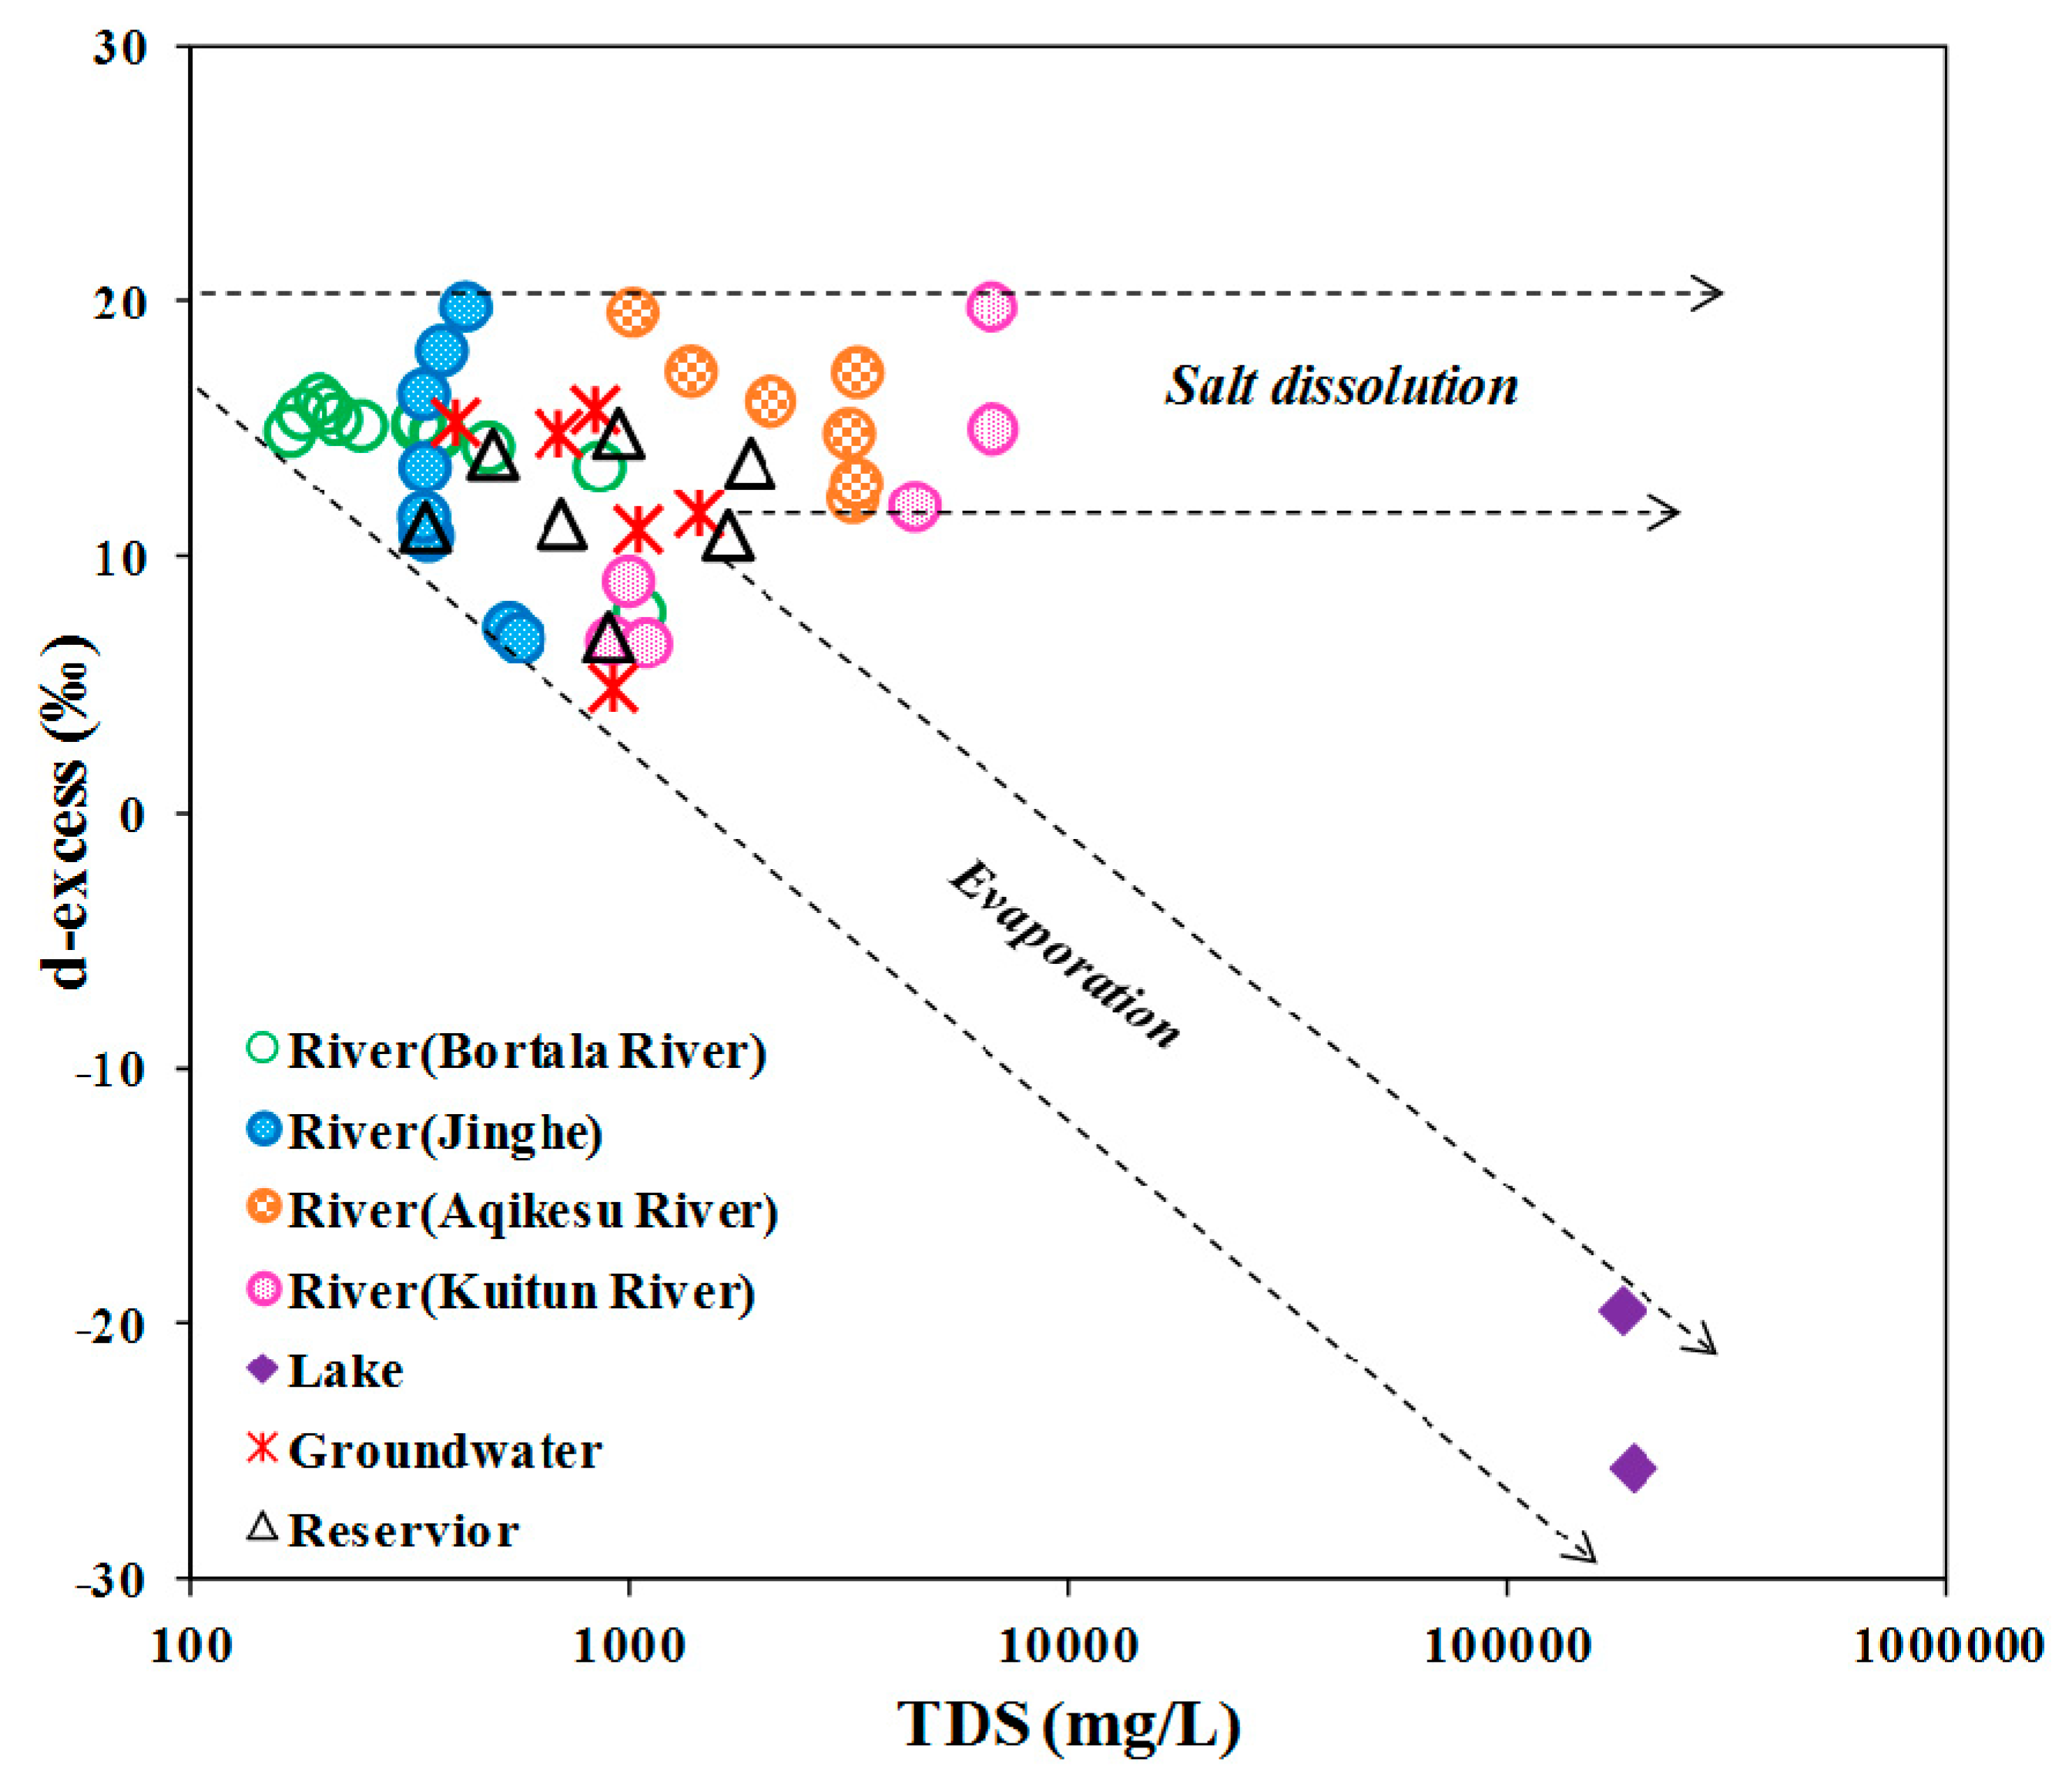
Shallow groundwater is alkaline and has pH and TDS values lower than those of surface water (river water, reservoir water, and lake water). Ca2+ and SO42− are the major ions in shallow groundwater and river water, whereas lake water and reservoir water are enriched in Na+ and SO42−. With the decrease in elevation, both groundwater and river water are affected by carbonate dissolution at high elevation and by evaporitic rock dissolution at low elevation; thus, the water surrounding Ebinur Lake is subjected to runoff affected by intense evaporation–dissolution of evaporate rocks.
(2).
According to the water quality analysis, it is apparent that most groundwater samples in the southwest part of the aquifer are of the Ca2+–HCO3 type and are suitable for domestic and irrigation use. In the eastern part of the aquifer, close to Ebinur Lake, higher concentrations of some water quality indices (sulfate, total hardness, Cr6+, and COD) were observed. Furthermore, both groundwater and reservoir water are polluted to some extent by nearby rivers. Domestic sewage, irrigation water, and mining activities in units located in the southeast part of the watershed or near towns surrounding Ebinur Lake led to a dramatic increase in water contamination.
(3).
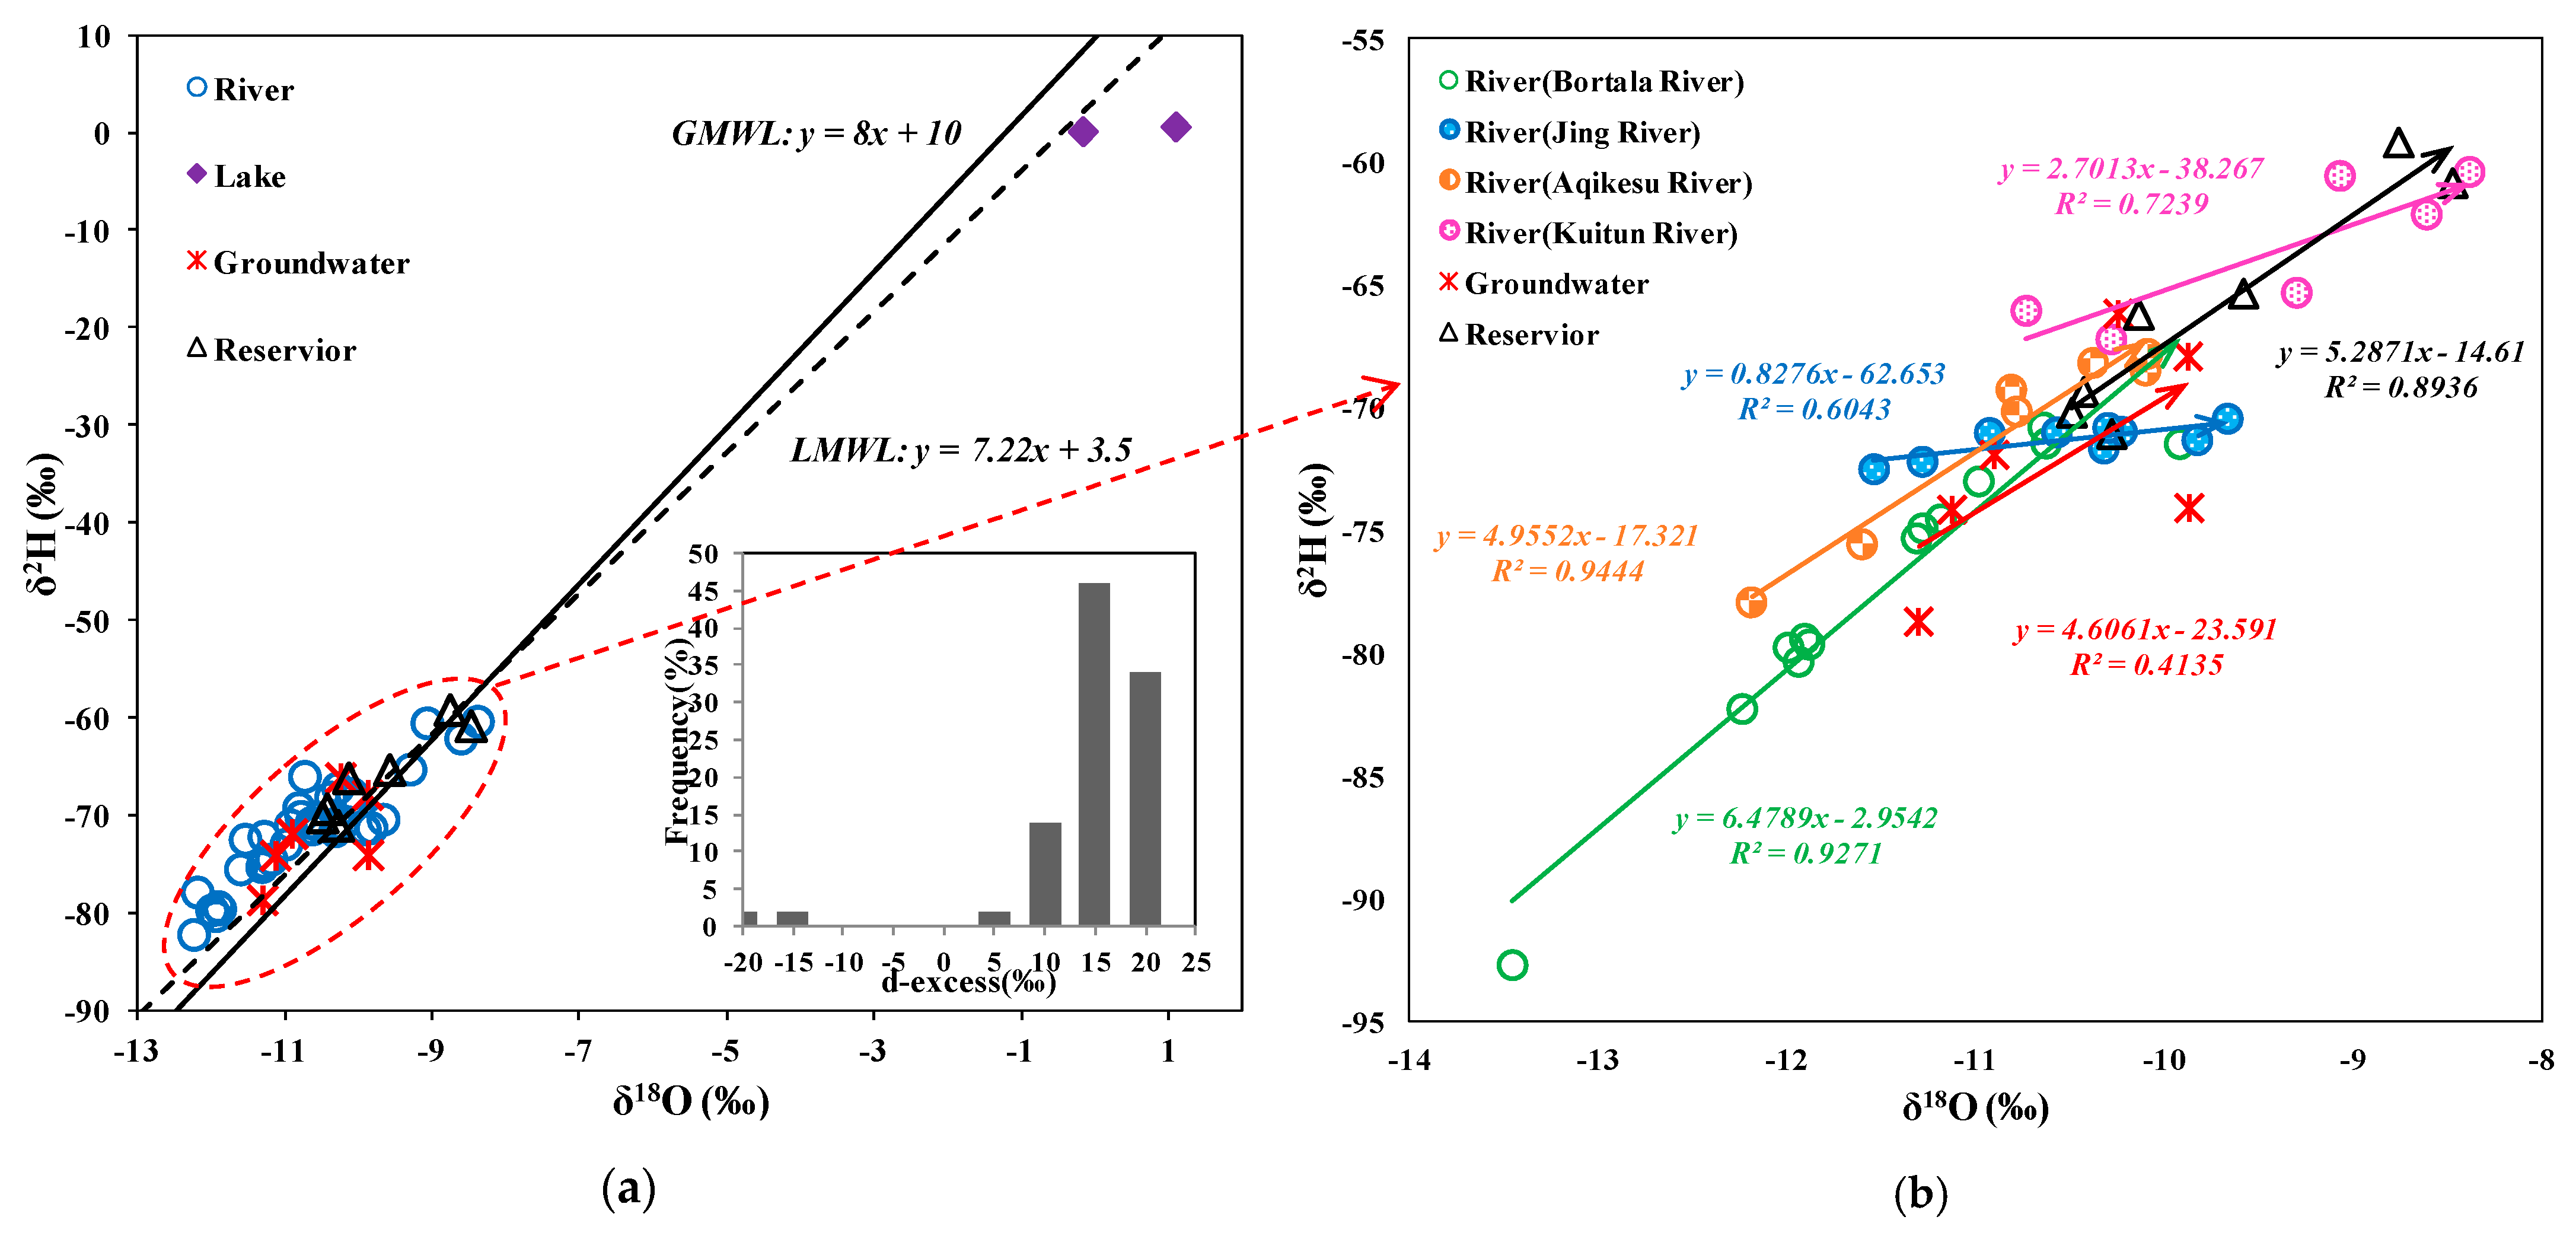
Of the different water bodies, lake water has the highest δ18O and δ2H values, while surface water (reservoir and Kuitun River) and groundwater tend to be more enriched than river water.
(4).
The upstream river water is recharged by glacial meltwater from high mountains, whereas the middle to downstream river water is recharged by low-elevation precipitation. Shallow groundwater and reservoir water are mainly recharged by river water; however, surface evaporation occurs in the process of surface runoff or infiltration after rainfall reaches the ground, which causes isotopic enrichment in the groundwater and reservoir compared to the river, as well as positive hydrogen and oxygen isotopes in the downstream area.
(5).
The correlation analysis of hydrochemical indices and hydrogen and oxygen isotopes of all water samples shows that hydrogen and oxygen isotopes have a certain correlation with water quality parameters (especially metal ions and biological indicators). However, the correlation between various parameters in different water bodies is relatively low (R < 0.75), and the correlation between and δ2H and each parameter is greater than that between δ18O and each parameter.

Author Contributions

Conceptualization, F.Z. and S.Z.; methodology, S.Z.; software, S.Z., and Z.Z.; validation, S.Z., A.Y. and Z.Z.; formal analysis, S.Z.; investigation, Z.Z. And A.Y.; resources, F.Z.; data curation, S.Z.; writing—original draft preparation, S.Z.; writing—review and editing, S.Z., H.-t.K. and F.Z.; visualization, S.Z.; supervision, F.Z.; project administration, F.Z. And Z.Z.

Funding

The research was performed with financial support from the National Natural Science Foundation of China (U1603241), the National Natural Science Foundation of China (Xinjiang Local Outstanding Young Talent Cultivation) (Grant No. U1503302), the Tianshan Talent Project of Xinjiang Uygur Autonomous Region (400070010209), and the Strategic Pioneering Science and Technology Project of the Chinese Academy of Sciences (XDA20040400).

Acknowledgments

Sincere thanks are also extended to the teachers and students of the Key Laboratory of Oasis Ecology Department of Xinjiang University for their support and help. Furthermore, a special debt of gratitude is owed to Ye Dan, Debra Leslie, and Mary Anne McCraw of the Department of Earth Sciences at the university of Memphis for their valuable advice on punctuation marks, typographical errors, grammar, and more.

Conflicts of Interest

The authors declare no conflict of interest.

Data Availability Statement

The data that support the findings of this study are available on request from the corresponding author. The data are not publicly available due to restrictions, e.g., their containing information that could compromise the privacy of research participants.

References

  1. Robertson, W.M.; Sharp, J.M., Jr. Estimates of recharge in two arid basin aquifers: A model of spatially variable net infiltration and its implications (Red Light Draw and Eagle Flats, Texas, USA). Hydrogeol. J. 2013, 21, 1853–1864. [Google Scholar] [CrossRef]
  2. Martos-Rosillo, S.; Marin-Lechado, C.; Pedrera, A.; Vadillo, I.; Motyka, J.; Luis Molina, J.; Ortiz, P.; Ramirez, J.M.M. Methodology to evaluate the renewal period of carbonate aquifers: A key tool for their management in arid and semiarid regions, with the example of Becerrero aquifer, Spain. Hydrogeol. J. 2014, 22, 679–689. [Google Scholar] [CrossRef]
  3. Ahmed, A.A.; Diab, M.S. Hydrologic analysis of the challenges facing water resources and sustainable development of Wadi Feiran basin, southern Sinai, Egypt. Hydrogeol. J. 2018, 26, 2475–2493. [Google Scholar] [CrossRef]
  4. He, S.Y.; Richards, K. Stable isotopes in monsoon precipitation and water vapour in Nagqu, Tibet, and their implications for monsoon moisture. J. Hydrol. 2016, 540, 615–622. [Google Scholar] [CrossRef]
  5. Zhang, Y.H.; Xu, M.; Li, X.; Qi, J.H.; Zhang, Q.; Guo, J.; Yu, L.L.; Zhao, R. Hydrochemical Characteristics and Multivariate Statistical Analysis of NaturalWater System: A Case Study in Kangding County, Southwestern China. Water 2018, 10, 80. [Google Scholar] [CrossRef]
  6. Kong, Y.L.; Pang, Z.H. Evaluating the sensitivity of glacier rivers to climate change based on hydrograph separation of discharge. J. Hydrol. 2012, 434, 121–129. [Google Scholar] [CrossRef]
  7. Jin, K.; Rao, W.B.; Tan, H.B.; Song, Y.X.; Yong, B.; Zheng, F.W.; Chen, T.Q.; Han, L.F. H-O isotopic and chemical characteristics of a precipitation-lake water-groundwater system in a desert area. J. Hydrol. 2018, 559, 848–860. [Google Scholar] [CrossRef]
  8. Tan, H.B.; Wen, X.W.; Rao, W.B.; Bradd, J.; Huang, J.Z. Temporal variation of stable isotopes in a precipitation-groundwater system: Implications for determining the mechanism of groundwater recharge in high mountain-hills of the Loess Plateau, China. Hydrol. Process. 2016, 30, 1491–1505. [Google Scholar] [CrossRef]
  9. Von Freyberg, J.; Studer, B.; Kirchner, J.W. A lab in the field: High-frequency analysis of water quality and stable isotopes in stream water and precipitation. Hydrol. Earth Syst. Sci. 2017, 21, 1721–1739. [Google Scholar] [CrossRef]
  10. Huang, L.; Zhang, Z.S. Stable Isotopic Analysis on Water Utilization of Two Xerophytic Shrubs in a Revegetated Desert Area, Tengger Desert, China. Water 2015, 7, 1030–1045. [Google Scholar] [CrossRef]
  11. Darling, G.W.; Bowes, M.J. A long-term study of stable isotopes as tracers of processes governing water flow and quality in a lowland river basin, the upper Thames, UK. Hydrol. Process. 2016, 30, 2178–2195. [Google Scholar] [CrossRef]
  12. Brunel, J.P.; Walker, G.R.; Kennett-Smith, A.K. Field validation of isotopic procedures for determining sources of water used by plants in a semi-arid environment. J. Hydrol. 1995, 167, 351–368. [Google Scholar] [CrossRef]
  13. Pasvanoglu, S.; Celik, M. A conceptual model for groundwater flow and geochemical evolution of thermal fluids at the Kızılcahamam geothermal area, Galatian volcanic Province. Geothermics 2018, 71, 88–107. [Google Scholar] [CrossRef]
  14. Mondal, N.C.; Singh, V.S.; Puranik, S.C.; Singh, V.P. Trace element concentration in groundwater of Pesarlanka Island, Krishna Delta, India. Environ. Monit. Assess. 2010, 163, 215–227. [Google Scholar] [CrossRef] [PubMed]
  15. Islam, S.M.D.U.; Majumder, R.K.; Uddin, M.J.; Khalil, M.I.; Alam, M.F. Hydrochemical Characteristics and Quality Assessment of Groundwater in Patuakhali District, Southern Coastal Region of Bangladesh. Expos. Health 2017, 999, 43–60. [Google Scholar] [CrossRef]
  16. Rakotondrabe, F.; Ngoupayou, J.R.N.; Mfonka, Z.; Rasolomanana, E.H.; Abolo, A.J.N.; Ako, A.A. Water quality assessment in the Betare-Oya gold mining area (East-Cameroon): Multivariate Statistical Analysis approach. Sci. Total Environ. 2018, 610, 831–844. [Google Scholar] [CrossRef] [PubMed]
  17. Kazakis, N.; Matta, C.; Pavlou, A.; Patrikaki, O.; Voudouris, K. Multivariate statistical analysis for the assessment of groundwater quality under different hydrogeological regimes. Environ. Earth Sci. 2017, 76, 349–361. [Google Scholar] [CrossRef]
  18. Haji, G.M.; Melesse, A.M.; Reddi, L. Water quality assessment and apportionment of pollution sources using APCS-MLR and PMF receptor modeling techniques in three major rivers of South Florida. Sci. Total Environ. 2016, 566, 1552–1567. [Google Scholar] [CrossRef]
  19. Yu, Z.; Ito, E.; Engstrom, D.R. Water isotopic and hydrochemical evolution of a lake chain in the northern Great Plains and its paleoclimatic implications. J. Paleolimnol. 2002, 28, 207–217. [Google Scholar] [CrossRef]
  20. Bai, X. Study on the Wetland Ecological Vulnerability and Its Driving System Ebinur Lake in Xinjiang; East China Normal University: Shanghai, China, 2010. (In Chinese) [Google Scholar]
  21. Wang, X.P.; Zhang, F.; Ding, J.L. Evaluation of water quality based on a machine learning algorithm and water quality index for the Ebinur Lake Watershed, China. Sci. Rep. 2018, 7, 12858. [Google Scholar] [CrossRef]
  22. Wang, X.P.; Zhang, F. Multi-scale analysis of the relationship between landscape patterns and a water quality index (WQI) based on a stepwise linear regression (SLR) and geographically weighted regression (GWR) in the Ebinur Lake oasis. Environ. Sci. Pollut. Res. 2018, 25, 7033–7048. [Google Scholar] [CrossRef] [PubMed]
  23. Ren, Y.; Zhang, F.; Wang, J.; Zhang, Y.; Yang, S.T.; Abduwasit, G.; Kung, H. Spatio-temporal characteristics and source identification of surface water pollutants in Lake Ebinur. J. Lake Sci. 2017, 29, 1143–1157. (In Chinese) [Google Scholar]
  24. Wang, X.P.; Zhang, F. Effects of land use/cover on surface water pollution based on remote sensing and 3D-EEM fluorescence data in the Jinghe Oasis. Sci. Rep. 2018, 8, 13099–13111. [Google Scholar] [CrossRef]
  25. Yushanjiang, A.; Zhang, F.; Li, Z. Spatial–temporal variation of ecosystem service values in Ebinur Lake Wetland National Natural Reserve from 1972 to 2016, Xinjiang, arid region of China. Environ. Earth Sci. 2018, 77, 586–599. [Google Scholar] [CrossRef]
  26. Leng, Z.X.; Ge, L.M.; Nurbey Pan, X.L. Functional district of Ebinur Lake watershed based on GIS. South North Water Transf. Water Sci. Technol. 2006, 4, 33–35. (In Chinese) [Google Scholar]
  27. Meng, X.Y.; Meng, B.C.; Wang, Y.J.; Liu, Z.H.; Ji, X.N.; Yu, D.L. Influence of climate change and human activities on water resources in Ebinur Lake in recent 60 years. J. China Hydrol. 2015, 35, 90–96. (In Chinese) [Google Scholar]
  28. Wang, Y.J.; Liu, Z.H.; Yao, J.Q.; Chahane, B. Effect of Climate and Land Use Change in Ebinur Lake Basin during the Past Five Decades on Hydrology and Water Resources. Water Resour. 2017, 44, 204–215. (In Chinese) [Google Scholar] [CrossRef]
  29. Coplen, T.B. Reporting of stable hydrogen, carbon, and oxygen isotopic abundances. Pure Appl. Chem. 1994, 66, 273–276. [Google Scholar] [CrossRef]
  30. Dansgaard, W. Stable isotopes in precipitation. Tellus 1964, 16, 436–468. [Google Scholar] [CrossRef]
  31. Scholl, M.A.; Shanley, J.B.; Murphy, S.F.; Willenbring, J.K.; Occhi, M.; Gonzalez, G. Stable-isotope and solute-chemistry approaches to flow characterization in a forested tropical watershed, Luquillo Mountains, Puerto Rico. Appl. Geochem. 2015, 63, 484–49724. [Google Scholar] [CrossRef]
  32. Xiao, J.; Zhang, F.; Jin, Z. Spatial characteristics and controlling factors of chemical weathering of loess in the dry season in the middle Loess Plateau, China. Hydrol. Process. 2016, 30, 4855–4869. [Google Scholar] [CrossRef]
  33. Piper, A.M. A graphic procedure in the geochemical interpretation of water-analyses. Eos Trans. Am. Geophys. Union 1944, 25, 914–928. [Google Scholar] [CrossRef]
  34. Gibbs, R.J. Mechanisms controlling world water chemistry. Science 1970, 170, 1088–1090. [Google Scholar] [CrossRef] [PubMed]
  35. Sarwade, D.V.; Nandakumar, M.V.; Kesari, M.P.; Mondal, N.C.; Singh, V.S.; Singh, B. Evaluation of sea water ingress into an Indian atoll. Environ. Geol. 2007, 52, 1475–1483. [Google Scholar] [CrossRef]
  36. Banks, D.; Frengstad, B. Evolution of groundwater chemical composition by plagioclase hydrolysis in Norwegian anorthosites. Geochem. Cosmochim. Acta 2006, 70, 1337–1355. [Google Scholar] [CrossRef]
  37. Loosli, F.; Coustumer, P.L.; Stoll, S. Impact of alginate concentration on the stability of agglomerates made of TiO2 engineered nanoparticles: Water hardness and pH effects. J. Nanoparticle Res. 2015, 17, 44–52. [Google Scholar] [CrossRef]
  38. Qian, Z.Z.; Qi, P.; Wang, G. Main Revisions on Chinese Pharmacopoeia (2005 Edition); Drug Stanoaros of China: Beijing, China, 2005; Volume 1. [Google Scholar]
  39. The State Environmental Protection Administration the Water and Wastewater Monitoring Analysis Method Editorial Board. Water and Wastewater Monitoring Analysis Method, 4th ed.; China Environmental Science Press: Beijing, China, 2002; pp. 38–47. (In Chinese)
  40. Wang, S.J.; Zhang, M.J.; Hughes, C.E.; Zhu, X.F.; Dong, L.; Ren, Z.G.; Chen, F.L. Factors controlling stable isotope composition of precipitation in arid conditions: An observation network in the Tianshan Mountains, central Asia. Tellus Ser. B-Chem. Phys. Meteorol. 2016, 68, 289–299. [Google Scholar] [CrossRef]
  41. Cheng, Z.S.; Zhang, Y.B. Distribution Characteristics of Precipitation Isotope Controlled by Different Moisture Sources. Site Investig. Sci. Technol. 2015, 1, 25–31. (In Chinese) [Google Scholar]
  42. Gourcy, L.L.; Groening, M.; Aggarwal, P.K. Stable Oxygen and Hydrogen Isotopes in Precipitation; Springer: Berlin, Germany, 2005; Volume 108, pp. 39–51. [Google Scholar]
  43. Xiao, K.; Shen, L.C.; Wang, P. Hydrogen and oxygen isotopes of lake water and geothermal spring water in arid area of South Tibet. Environ. Sci. 2014, 35, 2952–2958. (In Chinese) [Google Scholar]
  44. Cui, J.; Tian, L.; Biggs, T.W.; Wen, R. Deuterium-excess determination of evaporation to inflow ratios of an alpine lake: Implications for water balance and modeling. Hydrol. Process. 2017, 31, 1–13. [Google Scholar] [CrossRef]
  45. Boudhar, A.; Duchemin, B.; Hanich, L.; Jarlan, L.; Chaponniere, A.; Maisongrande, P.; Boulet, G.; Chehbouni, A. Long-term analysis of snow-covered area in the Moroccan High-Atlas through remote sensing. Int. J. Appl. Earth Observ. Geoinform. 2010, 12, 109–115. [Google Scholar] [CrossRef]
  46. Zhu, S.; Zhang, F.; Zhang, H.; Zhang, X. Seasonal variation of the isotope and hydrochemical characteristics of the main lake rivers in Lake Ebinur, Xinjiang. J. Lake Sci. 2018, 30, 1707–1721. [Google Scholar]
  47. Wang, Y. Study on the Influence of the Change of Water Resources and its Impact on Ecological Security in the Arid: An. Example of Ebinur Lake Basin in Xinjiang; Xinjiang University: Xinjiang, China, 2018. [Google Scholar]
Figure 1. (a) The location of the Xinjiang Autonomous Region in China; (b) a map of the study area; (c) a satellite map of the study area; (d) river water (sample site B1), (e) reservoir water (sample site W4), (f) lake water (sample site H2), and (g) groundwater (sample site D7) (photographed (dg) by Shidan Zhu; (map of (ac) by ArcGIS10.2.2 (http://www.esri.com/software/arcgis)).
Water 11 02067 g001
Figure 2. Hydrogeological map of the study area (this figure is modified from the hydrogeological map of Xinjiang).
Water 11 02067 g002
Figure 3. Point diagram (four areas: Bortala River (BR), Ebinur Lake Wetland Nature Reserve (ELWNR), Jing River (JR), and Kuitun River (K)).
Water 11 02067 g003
Figure 4. The spatial distribution of pH (a), total dissolved solids (TDS) (b), anions (c,d), and cations (e,f) in different water samples.
Water 11 02067 g004aWater 11 02067 g004bWater 11 02067 g004c
Figure 5. Piper plot of water samples.
Water 11 02067 g005
Figure 6. Gibbs plot: (a) comparison of natural processes that define the water chemistry of water on the Gibbs (1970) diagram; (b) TDS versus Cl/(Cl + HCO3); (c) TDS versus Na+/(Na+ + Ca2+).
Water 11 02067 g006
Figure 7. Distributions of ionic ratios in water samples: (a) Na+ + K+ versus SO42; (b) Ca2+ versus SO42; (c) Na+ + K+ versus Cl; (d) Ca2+ versus Mg2+; (e) Ca2+ versus Cl; (f) Mg2+ versus Cl.
Water 11 02067 g007aWater 11 02067 g007b
Figure 8. Spatial distribution of conventional water quality indicators (total hardness (a) and sulfate (b)).
Water 11 02067 g008aWater 11 02067 g008b
Figure 9. Spatial distribution of trace element concentrations (Cu (a), Zn (b), Co (c), and Cr6+ (d)) in different water samples.
Water 11 02067 g009aWater 11 02067 g009b
Figure 10. Spatial distribution of organic pollution parameter concentration (NH3-N (a), chemical oxygen demand (COD) (b), and volatile phenol (c)).
Water 11 02067 g010aWater 11 02067 g010b
Figure 11. Relationship between hydrogen and oxygen isotope signatures of different water samples. (a) Relationship between δ18O and δ2H of river, lake, groundwater and reservior; (b) Relationship between δ18O and δ2H of river (Bortala River, Jing River, Aqikesu River and Kuntun River), groundwater and reservior.
Water 11 02067 g011
Figure 12. Relationship between deuterium excess (d-excess) and TDS values of different water samples.
Water 11 02067 g012
Figure 13. Spatial distribution of (b) δ18O, (a) δ2H, and elevation of different water bodies.
Water 11 02067 g013
Figure 14. The correlation between hydrogen and oxygen isotopes and water quality parameters ((a): all; (c): river and reservoir; (e): groundwater; (g): lake) and eight anions ((b): all; (d): river and reservoir; (f): groundwater; lake). No data were available in October 2017.
Water 11 02067 g014aWater 11 02067 g014b
Figure 15. Monthly mean temperature (a), precipitation (b), and relative humidity ((c), RH) change based on the data of four meteorological stations across study area from 2000–2016 (Bole Station: 2009–2016).
Water 11 02067 g015
Figure 16. Average runoff distribution of Jinghe A’lashankou, Wenquan, and Bole from 1960–2015 [47].
Water 11 02067 g016
Table 1. Major ions and isotopic compositions of water samples from the Ebinur Lake Watershed. (H—height; TDS—total dissolved solids; d-excess—deuterium excess).
SampleHpHTDSHCO3CO32−ClSO42−Mg2+Ca2+K+Na+δ2Hδ18Od-excessSampling LocationSampling Time
(m) (mg/L)(mg/L)(mg/L)(mg/L)(mg/L)(mg/L)(mg/L)(mg/L)(mg/L)(‰)(‰)(‰)
River (35 samples)
B119317.8166.90.074.017.3104.516.131.14.53.0−92.7−13.514.9Upstream5.26 (9, B1–9)
B216288.1244.02.1100.124.893.720.440.11.84.2−80.4−1215.1Upstream
B314188.0177.60.091.916.8102.123.731.11.02.8−82.3−12.215.6Upstream
B413178.0195.10.096.726.1106.914.935.61.55.1−79.8−1216.1Upstream (under the bridge of Wenquan county)
B512748.2203.02.982.714.272.08.837.11.65.0−79.4−11.915.8Upstream
B612038.3214.02.479.816.467.211.836.11.66.9−79.7−11.915.4Upstream
B78627.9327.00.0142.220.457.615.852.61.914.0−75.3−11.315.1Midstream (under a bridge)
B87847.8330.03.6125.728.849.224.940.11.814.2−74.9−11.315.3Midstream
B96808.0359.02.1138.823.069.629.237.11.815.2−74.6−11.214.9Midstream (under a bridge)
B106068.2365.03.8136.927.594.928.240.11.915.6−73−1114.8Midstream (near a town)
B114968.6472.00.0164.938.1124.932.843.62.124.4−70.8−10.614.3Downstream (from an artificial river)5.25 (1, B11)
B122098.0851.04.3149.466.5317.055.354.13.343.7−71.5−10.613.5Downstream (under a bridge)5.26 (1, B12)
B131878.01047.04.3167.895.7614.874.1124.25.852.4−71.5−9.97.8Downstream (place in the Abinur Lake)5.22 (1, B13)
Bortala River-8.1380.92.0119.332.0144.227.446.42.415.9−77.4−11.514.5--
J15897.9345.01.4100.635.5127.313.145.12.012.3−71−10.210.8Upstream (surrounded by reeds and Tamarix cones)5.2 (9, J1–9)
J25507.7340.00.0111.228.8140.518.246.61.912.0−71.7−10.310.9Upstream
J34647.8338.00.0113.632.3102.115.845.11.912.1−70.9−10.311.5Upstream
J44037.7340.00.0116.129.2118.914.048.62.011.9−71−10.613.5Upstream
J53887.7338.02.1100.127.0122.516.751.12.011.7−71.1−10.916.3Midstream
J62907.6371.02.9114.127.5136.922.847.62.710.8−72.2−11.318Midstream
J72277.7420.04.8101.632.3132.123.445.14.620.4−72.5−11.519.8Downstream
J82058.0526.05.0148.945.2122.525.853.64.423.7−71.4−9.87.2Downstream
J91908.1557.03.6155.746.1102.124.051.14.727.8−70.5−9.76.8Downstream (place in the Ebinur Lake)
Jing River-7.8397.22.2118.033.8122.719.348.22.915.9−71.4−10.512.8--
A12947.83290.09.5219.1381.11909.2194.4320.614.7495.0−69.3−10.817.2Under the East Bridge5.19 (7, A1–7)
A22847.91012.08.1233.1102.4499.551.0140.32.8105.0−78−12.219.6A small spring around a pond beside the stream, surrounded by reeds and muddy soil
A32737.81370.07.1203.1152.4518.742.5114.24.278.3−75.6−11.617.2A small spring in the trees beside the stream
A42588.52080.014.3261.1324.4720.588.7146.36.692.2−70.2−10.816.1Surrounded by reeds, orchids, and muddy soil
A52368.43150.07.6266.5443.11753.1185.3280.616.0104.8−68.2−10.414.8Downstream
A62278.73210.014.5220.0429.81705.1176.2300.616.5104.5−68.5−10.112.3Downstream (the water is clear)
A72168.43270.010.0249.5407.71717.1194.4285.616.7107.6−67.8−10.112.9Downstream (Duck Bay; the water is clearer and surrounded by few reeds)
Aqikesu River-8.22483.110.2236.1320.11260.4133.2226.911.1155.3−71.1−10.915.7-
K12957.7906.00.0114.6107.2504.345.351.14.352.8−62.2−8.66.7Between two lakes5.28 (5, K1–5)
K23087.91085.00.0134.4143.1259.441.3174.34.460.7−60.4−8.46.6From an artificial river
K33287.8990.00.0130.6122.7537.947.755.13.856.5−65.4−9.39From an artificial river
K43428.86680.021.4222.41400.33218.0224.8831.77.91175.0−67.3−10.315From a canal
K53719.06640.010.5242.81258.51801.1243.0621.221.81260.0−66.1−10.719.8From a canal
K62087.94430.011.9331.3740.01969.2227.8225.59.2820.0−60.6−9.112The lower reaches of the Kuitun Bridge5.18 (1, K6)
Kuitun River 8.23455.27.3196.0628.61381.7138.3326.58.6570.8−63.7−9.411.5
Lake (2 samples)
H11888.8190,500.025.0324.033,899.194,859.37138.18767.5148.99840.0−16.91.1−25.6Around Ebinur Lake5.24 (1, H1)
H21878.8180,000.021.4292.631,461.961,838.65467.56262.5146.59620.0−20.8−0.2−19.4Around Ebinur Lake5.25 (1, H2)
Ebinur Lake 8.8185,250.023.2308.332,680.578,348.96302.87515.0147.79730.0−18.90.5−22.5
Groundwater (6 samples)
D16827.7833.05.7269.453.2415.565.048.61.626.1−66.2−10.215.7Bortala River, a pump well in Hari Morton Village5.26 (2, D1–2)
D210117.9399.05.7148.029.263.619.465.11.111.5−72−10.915.3Bortala River, a pressurized well water from Zhagan Tunge Township
D32177.91041.03.6120.9164.0658.082.6104.25.756.1−67.9−9.911Jing River, near a railway station5.19 (2, D3–4)
D42158.2686.04.866.770.9230.526.748.13.144.8−74.2−11.114.8Aqikesu River, near Ostrich Station
D52128.21429.02.4114.6179.0629.237.792.22.684.4−78.7−11.311.7Kuitun River, from a self-reared well nearby Sandakwood5.24 (1, D5)
D61978.0914.04.0232.684.2461.134.059.13.756.2−74.1−9.94.8Ebinur Lake Wetland, from Cockbotto Protection Station5.23 (1, D6)
Reservoir (7 samples)
W15208.41869.00.0156.7195.0883.894.8184.43.078.5−70.2−10.513.7Bortala River, reservoir5.25 (4, W1–4)
W23708.21662.00.0118.5201.6768.5106.9144.35.072.6−59.2−8.810.8Bortala River (Tasier Reservoir)
W33049.0484.00.0135.447.9138.127.940.62.529.6−69.4−10.414Bortala River, Gonghaquan Reservoir (No. 1)
W42719.4697.00.0127.2117.0461.132.548.68.1103.9−65.4−9.611.2Bortala River, Gonghaquan Reservoir (No. 2)
W56078.0341.02.1104.931.076.87.951.11.912.0−71.1−10.311.1Jing River, reservoir5.20 (1, W5)
W63488.3893.00.096.7110.8492.342.556.14.852.1−60.9−8.56.9Kuitun River, Liugou Reservoir (No. 2)5.28 (2, W6–7)
W73488.6940.04.89.7112.1458.744.755.13.955.5−66.2−10.114.8Kuitun River, Liugou Reservoir (No. 1)
Table 2. Water indices and experimental methods. COD—chemical oxygen demand; VP—volatile phenol; TH—total hardness.
Water Quality ParametersExperiment MethodsLight Source of GDYS-201M (nm)Detection Limit (mg/L)Measurement Range (mg/L)Precision
1CODDichromate titration (GB 11914-1989)614 (Operation parameters of A digester in standard COD (GDYS-9): 150 °C, 15 min)100.00–500±5%
2NH3-NNessler’s reagent spectrophotometry (GB/T5750.5-2006)4300.100.10–5.00±5%
3VP4-amino antipyrine spectrophotometric method (GB/T5750.4-2006)5200.100.10–5.00±5%
4SulfateBarium chromate spectrophotometric method (GB/T5750.5-2006)4305.00.0–250±5%
5Zn1-(2-pyridylazo)-2-naphthol(PAN)5380.050.00–3.00±5%
6Co5 - Br PADAP spectrophotometry595 0.00–0.50±5%
7CuCopper reagent method (HJ485-2009)4700.050.00–1.00±5%
8Cr6+Diphenylcarbazide spectrophotometry (GB/T5750.6-2006)5200.010.00–1.00±5%
9THCPPI method59512.50–450±5%
Table 3. Surface water quality index scale (GB3838-2002).
Water CategorypHZnCuCr6+NH3-NCODV.P
(mg/L) (mg/L) (mg/L) (mg/L) (mg/L) (mg/L)
ISuitable for source water and National Nature Reserves6–9≤0.05≤0.01≤0.01≤0.15≤15≤0.002
IISuitable for the first-class protection area of surface water source area of centralized drinking water, rare aquatic habitats, fish and shrimp production fields, larval and juvenile fish bait farms, etc.≤1≤1≤0.05≤0.5≤15≤0.002
IIISuitable for the secondary protection area of surface water source area of centralized drinking water, overwintering farms for fish and shrimp, aquaculture areas, and other fishery waters and swimming areas≤1≤1≤0.05≤1≤20≤0.005
IVSuitable for the general industrial water area and the recreational water area with non-direct contact with the human body≤2≤1≤0.05≤1.5≤30≤0.01
VSuitable for agricultural water areas and general landscape requirements ≤2≤1≤0.1≤2≤40≤0.1
Table 4. Groundwater quality index scale (GB/T 14848-93).
Water CategorypHTDSTHZnCoCuCr6+Sulfate
(mg/L)(mg/L)(mg/L)(mg/L)(mg/L)(mg/L)(mg/L)
ISuitable for various uses6.5–8.5≤300≤150≤0.05≤0.005≤0.01≤0.005≤50
IISuitable for various uses≤500≤300≤0.5≤0.05≤0.05≤0.01≤150
IIISuitable for a centralized drinking water source and industrial and agricultural water consumption≤1000≤450≤1.0≤0.05≤1.0≤0.05≤250
IVSuitable for agriculture and some industrial water, and can be used as drinking water after proper treatment5.5–6.5, 8.5–9≤2000≤550≤5.0≤1.0≤1.5≤0.1≤350
VUnsuitable for drinking<5.5, >9>2000>550>5.0>1.0>1.5>0.1>350
Table 5. The quality observations of surface water and groundwater. N/A—not applicable.
Water SamplesTotal Hardness (mg/L)Sulfate (mg/L)Cu (mg/L)Zn (mg/L)Co (mg/L)NH3-N (mg/L)COD (mg/L)Volatile Phenol (mg/L)Cr6+ (mg/L)
RangeMeanRangeMeanRangeMeanRangeMeanRangeMeanRangeMeanRangeMeanRangeMeanRangeMean
Bortala River
Upstream (B1–B6)242.3–644.7347.07.8–27.316.60.01–0.240.100.00–0.050.020.00–0.020.010.01–0.650.234.0–152.047.50.000.000.01–0.070.04
Midstream (B7–B10)299.7–355.8329.340.7–42.641.70.11–0.340.210.08–0.100.100.01–0.020.010.15–0.760.619.0–31.017.30.000.000.00–0.100.04
Downstream (B11–B13)550.2–648.1608.461.4–249.8179.00.04–0.210.130.10–0.400.290.02–0.040.030.08–0.840.4019.0–39.029.70–2.861.230.01–0.060.03
Total (Bortala River)256.4–648.1401.97.8–249.861.80.01–0.340.140.00–0.400.100.00·0.040.010.01–0.760.384.0–152.034.10–2.860.280.00–0.070.04
Jing River
Upstream (J1–J4)279.7–339.6302.457.4–49.449.70.03–0.060.050.03–0.100.060.00–0.010.010.08–0.120.1019.0–36.030.30.000.000.00–0.070.04
Midstream (J5–J6)298.3–353.4325.943.2–49.846.50.03–0.050.040.09–0.100.100.020.020.08–0.130.114.0–11.07.50.000.000.00–0.020.01
Downstream (J7–J9)385.2–559.5455.161.8–95.178.00.06–0.080.070.04–0.100.080.020.020.11–0.290.1811.0–624.0218.30.000.000.01–0.020.02
Total (Jing River)279.7–559.5358.543.2–95.158.40.03–0.080.050.03–0.100.070.00–0.020.010.08–0.290.134.0–624.087.90.000.000.00–0.070.03
Aqikesu River (A1–A7)427.7–800.3683.4187.7–287.0266.00.03–0.190.09--0.02–0.130.070.06–0.330.242.0–28.014.60.00–0.290.040.00–0.050.04
Kuitun River (K1–K6)426.6–722.9594.0229.7–426.0296.70.02–0.150.080.11–0.740.330.01–0.210.090.14–1.120.420.7–396.084.60.00–0.750.190.00–0.080.04
Total (River)242.3–800.3478.07.8–426.0142.10.01–0.340.100.00–0.740.140.00–0.210.040.01–1.120.290.7–624.052.70.00–2.860.150.00–0.100.03
Lake (H1–H2)630.8–701.0666.0286.6–336311.30.5–1.651.081.13–1.681.410.01–0.690.357.34–8.567.95440.0–1264.0856.50.69–3.071.880.180.18
Reservoir (W1–W7)314.4–785.8475.444.5–292.4192.60.02–0.170.080.07–0.450.190.01–0.070.030.04–0.450.2617.0–141.048.00.00–0.10.010.00–0.140.03
Groundwater (D1–D6)366.7–628.5461.637.7–251.5154.00.05–0.130.070.02–0.290.140.02–0.040.03N/AN/A17.0–1514.0330.20.000.000.02–0.170.07

