Integrated Assessment of Climate Change and Land Use Change Impacts on Hydrology in the Kathmandu Valley Watershed, Central Nepal


Department of Civil Engineering, Pulchowk Campus, Institute of Engineering, Tribhuvan University, Kirtipur 44601, Nepal
*
Author to whom correspondence should be addressed.
Water 2019, 11(10), 2059; https://doi.org/10.3390/w11102059
Submission received: 2 August 2019
/
Revised: 28 September 2019
/
Accepted: 29 September 2019
/
Published: 2 October 2019
(This article belongs to the Section Hydrology)
Abstract
:The population growth and urbanization are rapidly increasing in both central and peripheral areas of the Kathmandu Valley (KV) watershed. Land use/cover (LULC) change and climate variability/change are exacerbating the hydrological cycle in the KV. This study aims to evaluate the extent of changes in hydrology due to changes in climate, LULC and integrated change considering both factors, with KV watershed in central Nepal as a case study. Historical LULC data were extracted from satellite image and future LULC are projected in decadal scale (2020 to 2050) using CLUE-S (the Conversion of Land Use and its Effects at Small regional contest) model. Future climate is projected based on three regional climate models (RCMs) and two representative concentration pathways (RCPs) scenarios, namely, RCP4.5 and RCP8.5. A hydrological model in soil and water assessment tool (SWAT) was developed to simulate hydrology and analyze impacts in hydrology under various scenarios. The modeling results show that the river runoff for RCP4.5 scenarios is projected to increase by 37%, 21%, and 12%, respectively, for climate change only, LULC only, and integrated changes of both. LULC change resulted in an increase in average annual flow, however, a decrease in base-flow. Furthermore, the impacts of integrated changes in both LULC and climate is not a simple superposition of individual changes.
1. Introduction
Urbanization has increased significantly across the globe over the last two centuries. More than 50% of the world’s population lived in urban areas in 2008 and that population is expected to increase to 75% by 2030 [1]. Currently many regions of the world have clearly experienced the significant land use/cover (LULC) change and this is already creating environmental, social and economic problems [2]. Hydrological impacts of LULC changes (e.g., [3]) as well as climate change (e.g., [4]) are evident in different parts of the globe. Many studies have assessed impacts of climate change and LULC changes separately, however, very few (e.g., [5]) have attempted to assess integrated impacts of both climate and LULC changes on hydrology. Therefore, there is a need to enrich the literature in this area with evidence from watersheds in different regions of the world.
The LULC change is becoming a common problem for developing countries that have economies basically dependent on agriculture [6]. Conversion of the LULC type due to urbanization has affected sustainable management of water resources [7]. The urbanization process is transforming permeable land surfaces into impervious surfaces and ultimately changing regional hydrological characteristics [3]. Furthermore, LULC plays a significant role in the hydrological process by directly influencing the surface runoff, infiltration, groundwater flow, and interflow. These hydrological phenomena affect the hydrology of the river in terms of runoff volume, flood frequency, and base flow [8]. Various techniques have been developed over the years and applied in various parts of the world for assessing LULC change impacts on hydrology. There are various models available to project LULC. Some examples include Conversion of Land Use and its Effects at Small regional contest (CLUE-S) [9], Dinamica EGO [10], GEOMOD [11], Landuse Sim [12], and Land Change Modeler (LCM) [13], among others. The land use projection models are usually combined with hydrological models to evaluate LULC changes on hydrology. For example, CLUE-S and WetSpa models were used to evaluate LULC change impacts on river hydrology of Baghsalian watershed in the north of Iran [7]. Nowadays, the hydrological models are coupled with ArcGIS for better spatial analysis of hydro-climatic variability in a basin [6]. The soil water assessment tool (SWAT), a semi-distributed hydrological model, has been widely used in previous studies to simulate hydrology and evaluate impacts [14,15,16]. Wang et al. [17] applied the SWAT and geographically weighted regression (GWR) models in the Xitiaoxi river basin to evaluate impacts of LULC change on the spatial hydrological responses. Change in climatic parameters such as temperature and precipitation alter the river discharge, regional and local water availability, and water supply [4]. As per the IPCC [18], the average temperature and precipitation in Asia by the end of the century is projected to increasefrom1.8 °C to 3.9 °C and from 1% to 12%, respectively. In the case of the Hindu Kush Himalayan region, (Indus, Ganges, and Brahmaputra river basins), the mean temperature is projected to rise up to 3.5 °C and 6.3 °C for representative concentration pathway (RCP) 4.5 and RCP8.5 scenarios, respectively [19] and precipitation is projected to change from 3% to 37% under the RCP4.5 and RCP8.5 scenarios, but with a higher level of uncertainty. Earlier studies have reported that future precipitation is projected to increase in the wet season but decline in the dry season, which causes the arid area to be further drier in dry season (see e.g., [7,15,19,20]).
Most of the previous studies have focused either on impacts of LULC or climate change on hydrology/water resources. However, limited studies (e.g., [5,19,21]) have assessed impacts of both LULC and climate change. Other than Shrestha et al. [5], none of the studies have used projected future LULC data for assessing the impacts of both LULC and climate change. A study carried out by Shi et al. [21] in the Heihe river basin in northwest China showed that climate change, LULC change, and combined changes result in a change in river discharge by 107%, 7.3% and 3.2%, respectively. As the more realistic scenario is the one where both changes happen simultaneously, it is imperative to evaluate impacts of separate as well as combined impacts on hydrology.
Climate change impacts have been observed in several sectors in Nepal and the water resources sector is not an exception. Sharma and Shakya [20] studied the climate change impact in the Bagmati river basin and concluded that monsoon flood magnitude has a negative trend, but that the duration and frequency have a positive trend. Similarly, a study by Pokhrel [6] has assessed impacts of LULC change on sediment concentration in the Bagmati basin. However, there are no such studies in Nepali basins, which assess the impacts of both LULC and climate change (CC) on river basin hydrology. Even though LULC and CC affects the water balance in a river basin [22] and provides better evidence for policy and practice, integrated quantitative assessment of projected changes in future LULC and climate and their hydrological impacts is still an area that is less explored in many watersheds across the world. The objectives of this study, therefore, is to project future climate and LULC, and assess current and future hydrology and water balance under separate and combined scenarios of both LULC and climate changes in the Bagmati river basin, central Nepal. The basin has an irrigation project (i.e., Bagmati Irrigation Project with a command area of 122,000 ha) and a hydropower plant (i.e., Bagmati Hydropower Project with 22 MW capacity) in the downstream. Furthermore, the government has also planned for a Bagmati high dam as a multi-purpose project in the same basin. Therefore, creating a knowledgebase in the area of hydrology, and the impacts of LULC and climate change, is useful for better water resources planning, development and management in the basin.
2. Basin Description and Database
2.1. Study Area
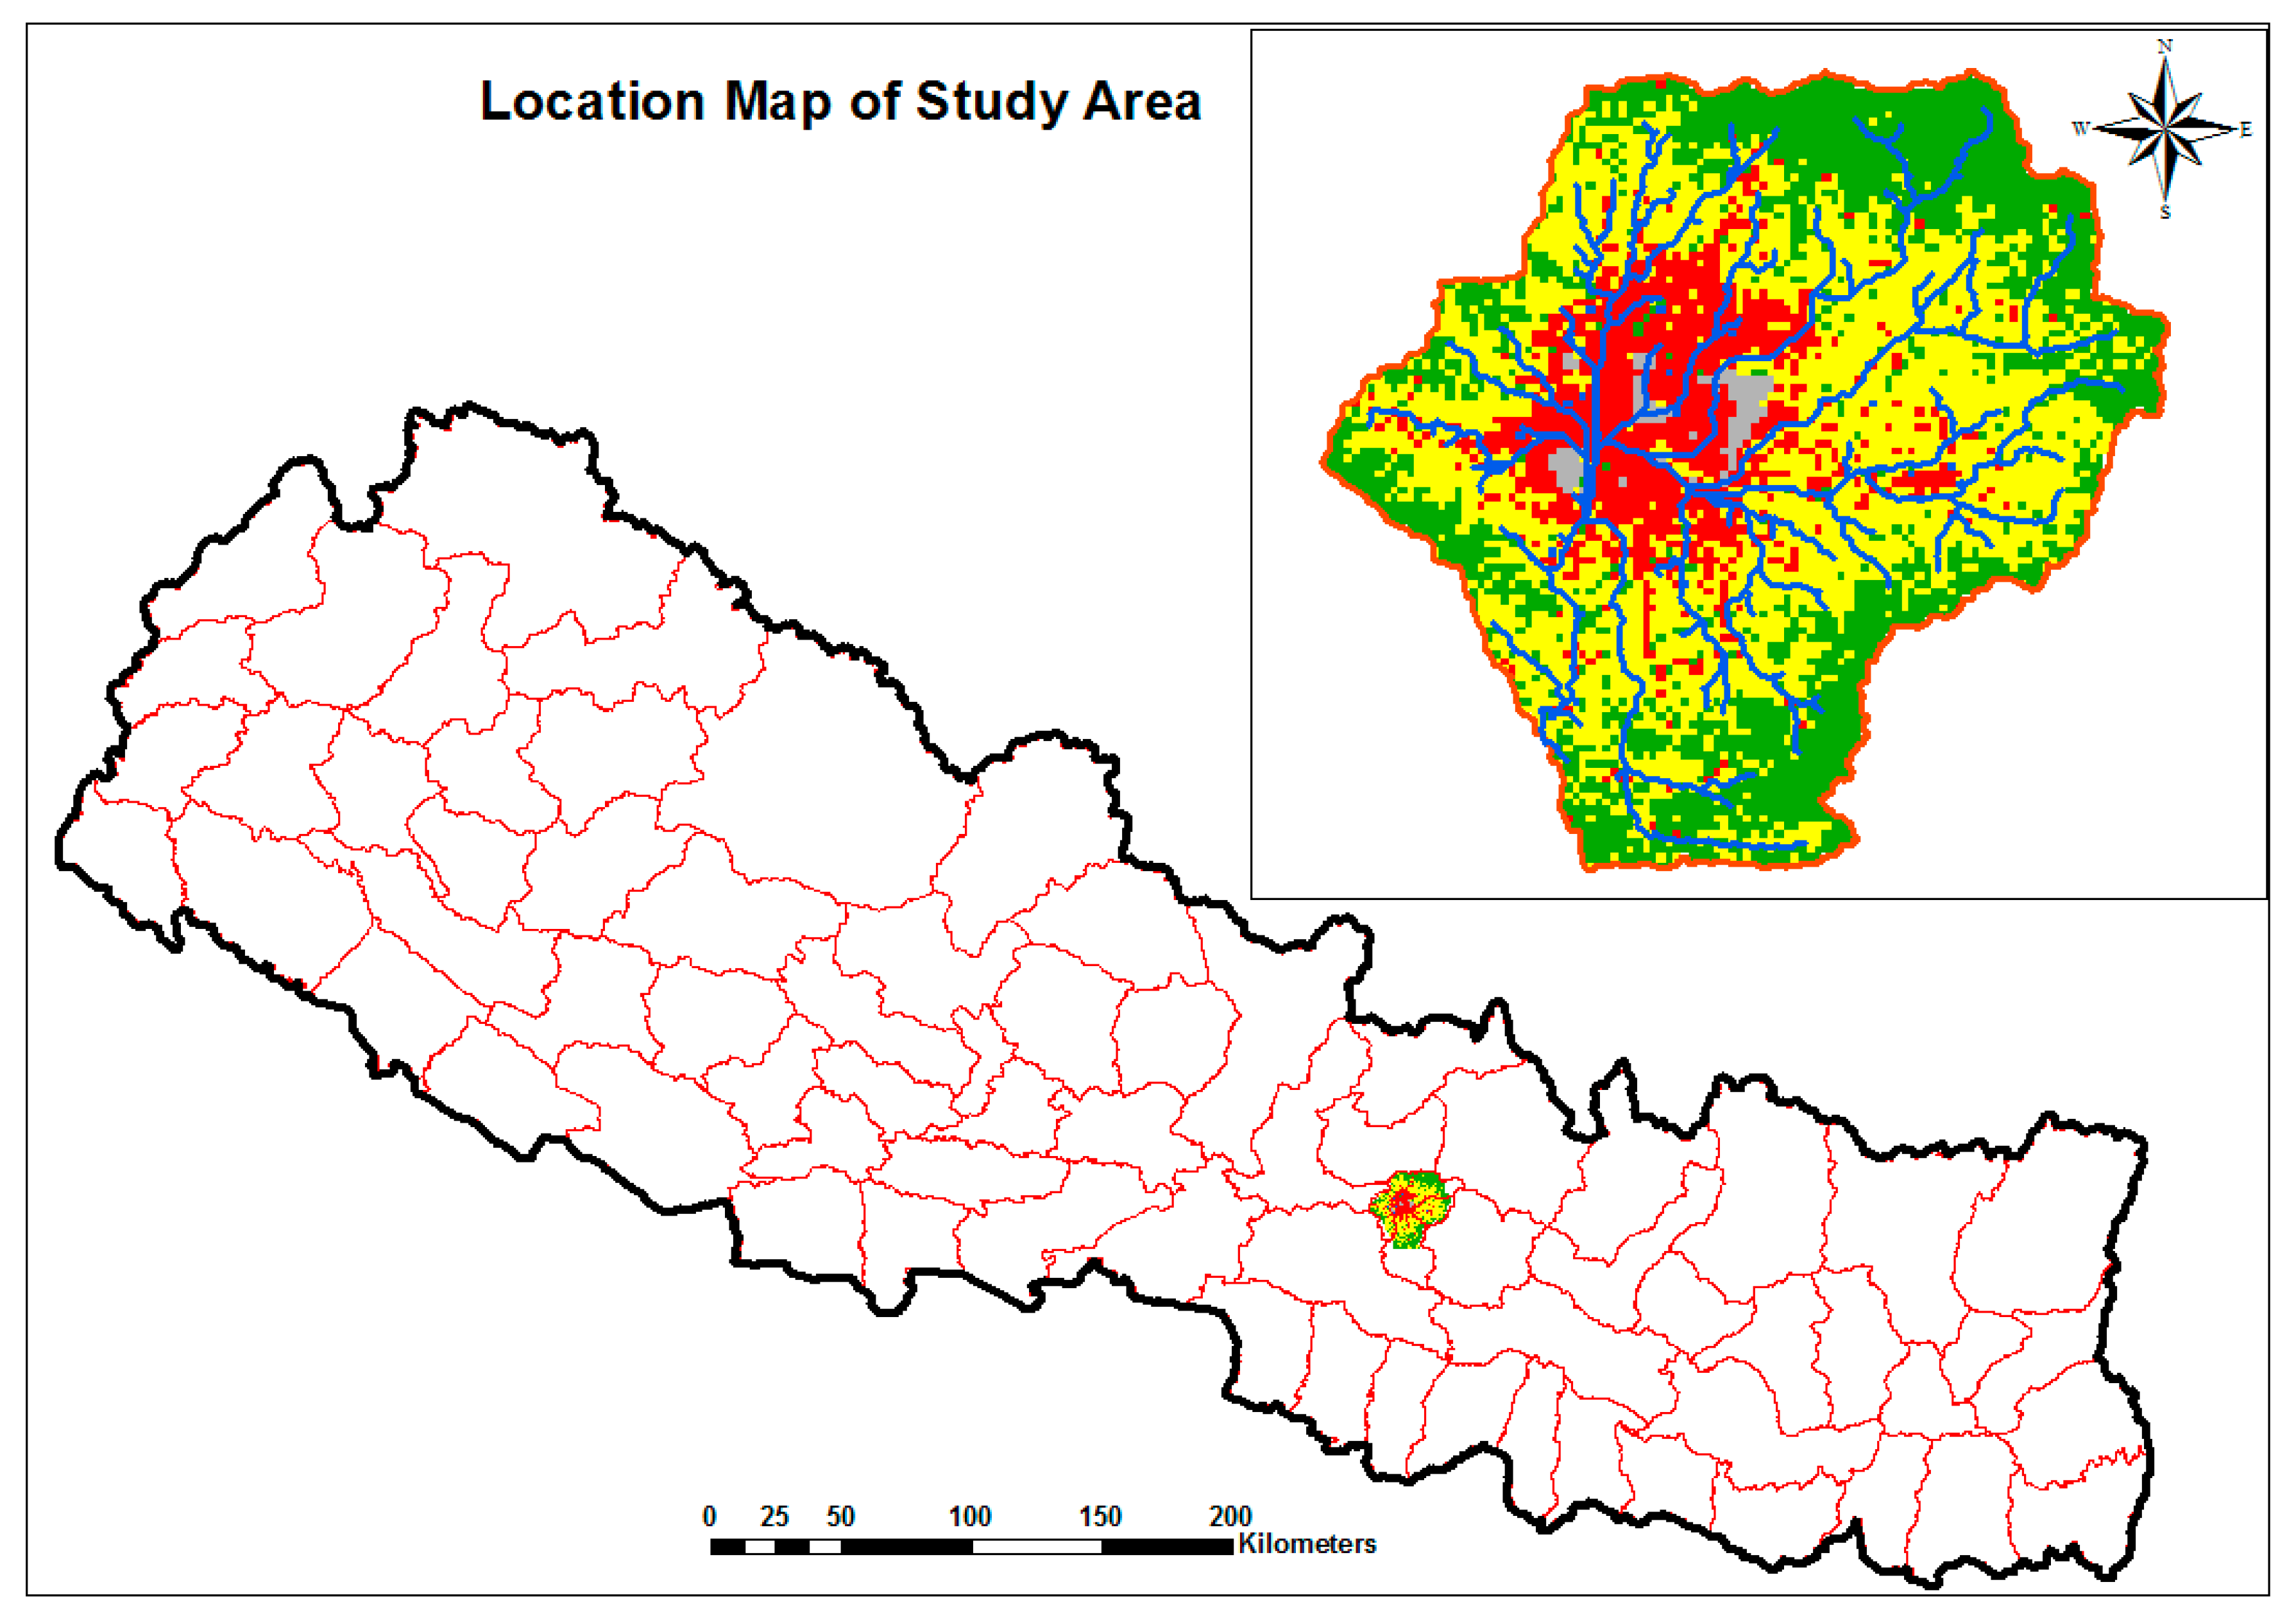
Kathmandu is the capital city of Nepal, which is situated in the central part of the country. The Kathmandu Valley is bowel shaped, and it covers most parts of Kathmandu, Lalitpur and Bhaktapur districts. The Bagmati River is the only one drainage network in the valley, whichoriginates from the range of Mahabharat hill of Shivapuri at an altitude of 2722 m asl and is shown in Figure 1. It is the spring-fed river and the flow mostly increases in the monsoon period due to rainfall. Bishnumati, Manohara, Nakhhu, Balkhu, and Tukuche are the major tributaries of the Bagmati River. The study area of the Kathmandu Valley (Bagmati basin) is situated at the latitude 27°37′44′′ and longitude 85°17′41′′ with the total catchment area 613 km2 at the outlet point of the Katuwal Daha. Average yearly maximum, minimum and average temperature of the basin lies in between 24.2 °C, 12.4 °C and 18.2 °C, respectively [23]. Similarly, the average annual rainfall depth of the basin is around 1516 mm. The Bagmati river basin’s climate varies from alpine in the northern part to sub-tropical in the river bank of the southern part. Basically, river basin precipitation is divided into three seasons, namely pre-monsoon (January–May), monsoon (June–September), and post-monsoon (October–December) for the analysis [6]. An average 10 km horizontal north–south distance creates the 1500 m level difference, so it has a diversified climatic character, topography and runoff pattern within the basin.
In the last three decades, the urbanization pattern of KV has increased enormously [24]. The urban growth rate of the peripheral area of the valley is radically higher than the core urban area, due to lack of open space and unplanned land management [25]. Several studies have covered the population and rapid urban growth scenario of KV (e.g., [6,15,26,27,28]). Due to rapid population growth and expansion of the urbanized area, a remarkable change in landscape can be observed in KV. Ishtiaque et al. [25] estimated the urban growth rate from 2010 to 2015 in KV to be about 3.94%. From the analysis of LULC in the period of 1978 to 2000, by using geographical information system (GIS), around 45% of the urban area has been increased [28]. If a similar trend follows, there will be adverse effects in agricultural production and water resources management.
2.2. Data Collection
For the analysis of the study, which includes the physical (digital elevation model (DEM), geology and land use), climatic (GCM climate change data), socio-economic (population, household, settlements) and hydro-meteorological (precipitation, temperature, solar, wind speed, runoff) parameters, recorded data were used. In this study, 30×30 m ASTER GDEM data were used. The geological data were collected from the Department of Mines and Geology, and soil data were collected from the soil and terrain (SOTER) database. Similarly, land use data were generated from Land-sat images. The overall database and sources are presented in Table 1.
3. Methodology
3.1. Watershed Delineation
The outlet of the Bagmati basin was considered to be at Katuwal daha, so as to incorporate all of the urban and peri-urban areas of KV. Watershed boundary of the KV was delineated using ASTER DEM, considering all of the demographics in the area of the valley. The entire basin land was divided into five categories as agriculture, built up, forest, water body, and restricted areas (such as airport, park, administrative office area, cultural area, etc.).
3.2. Modeling Approach
In this research, the hydrological response of the river basin due to LULC change and climatic variation in the basin were perceived by the combination of LULC and hydrological models.
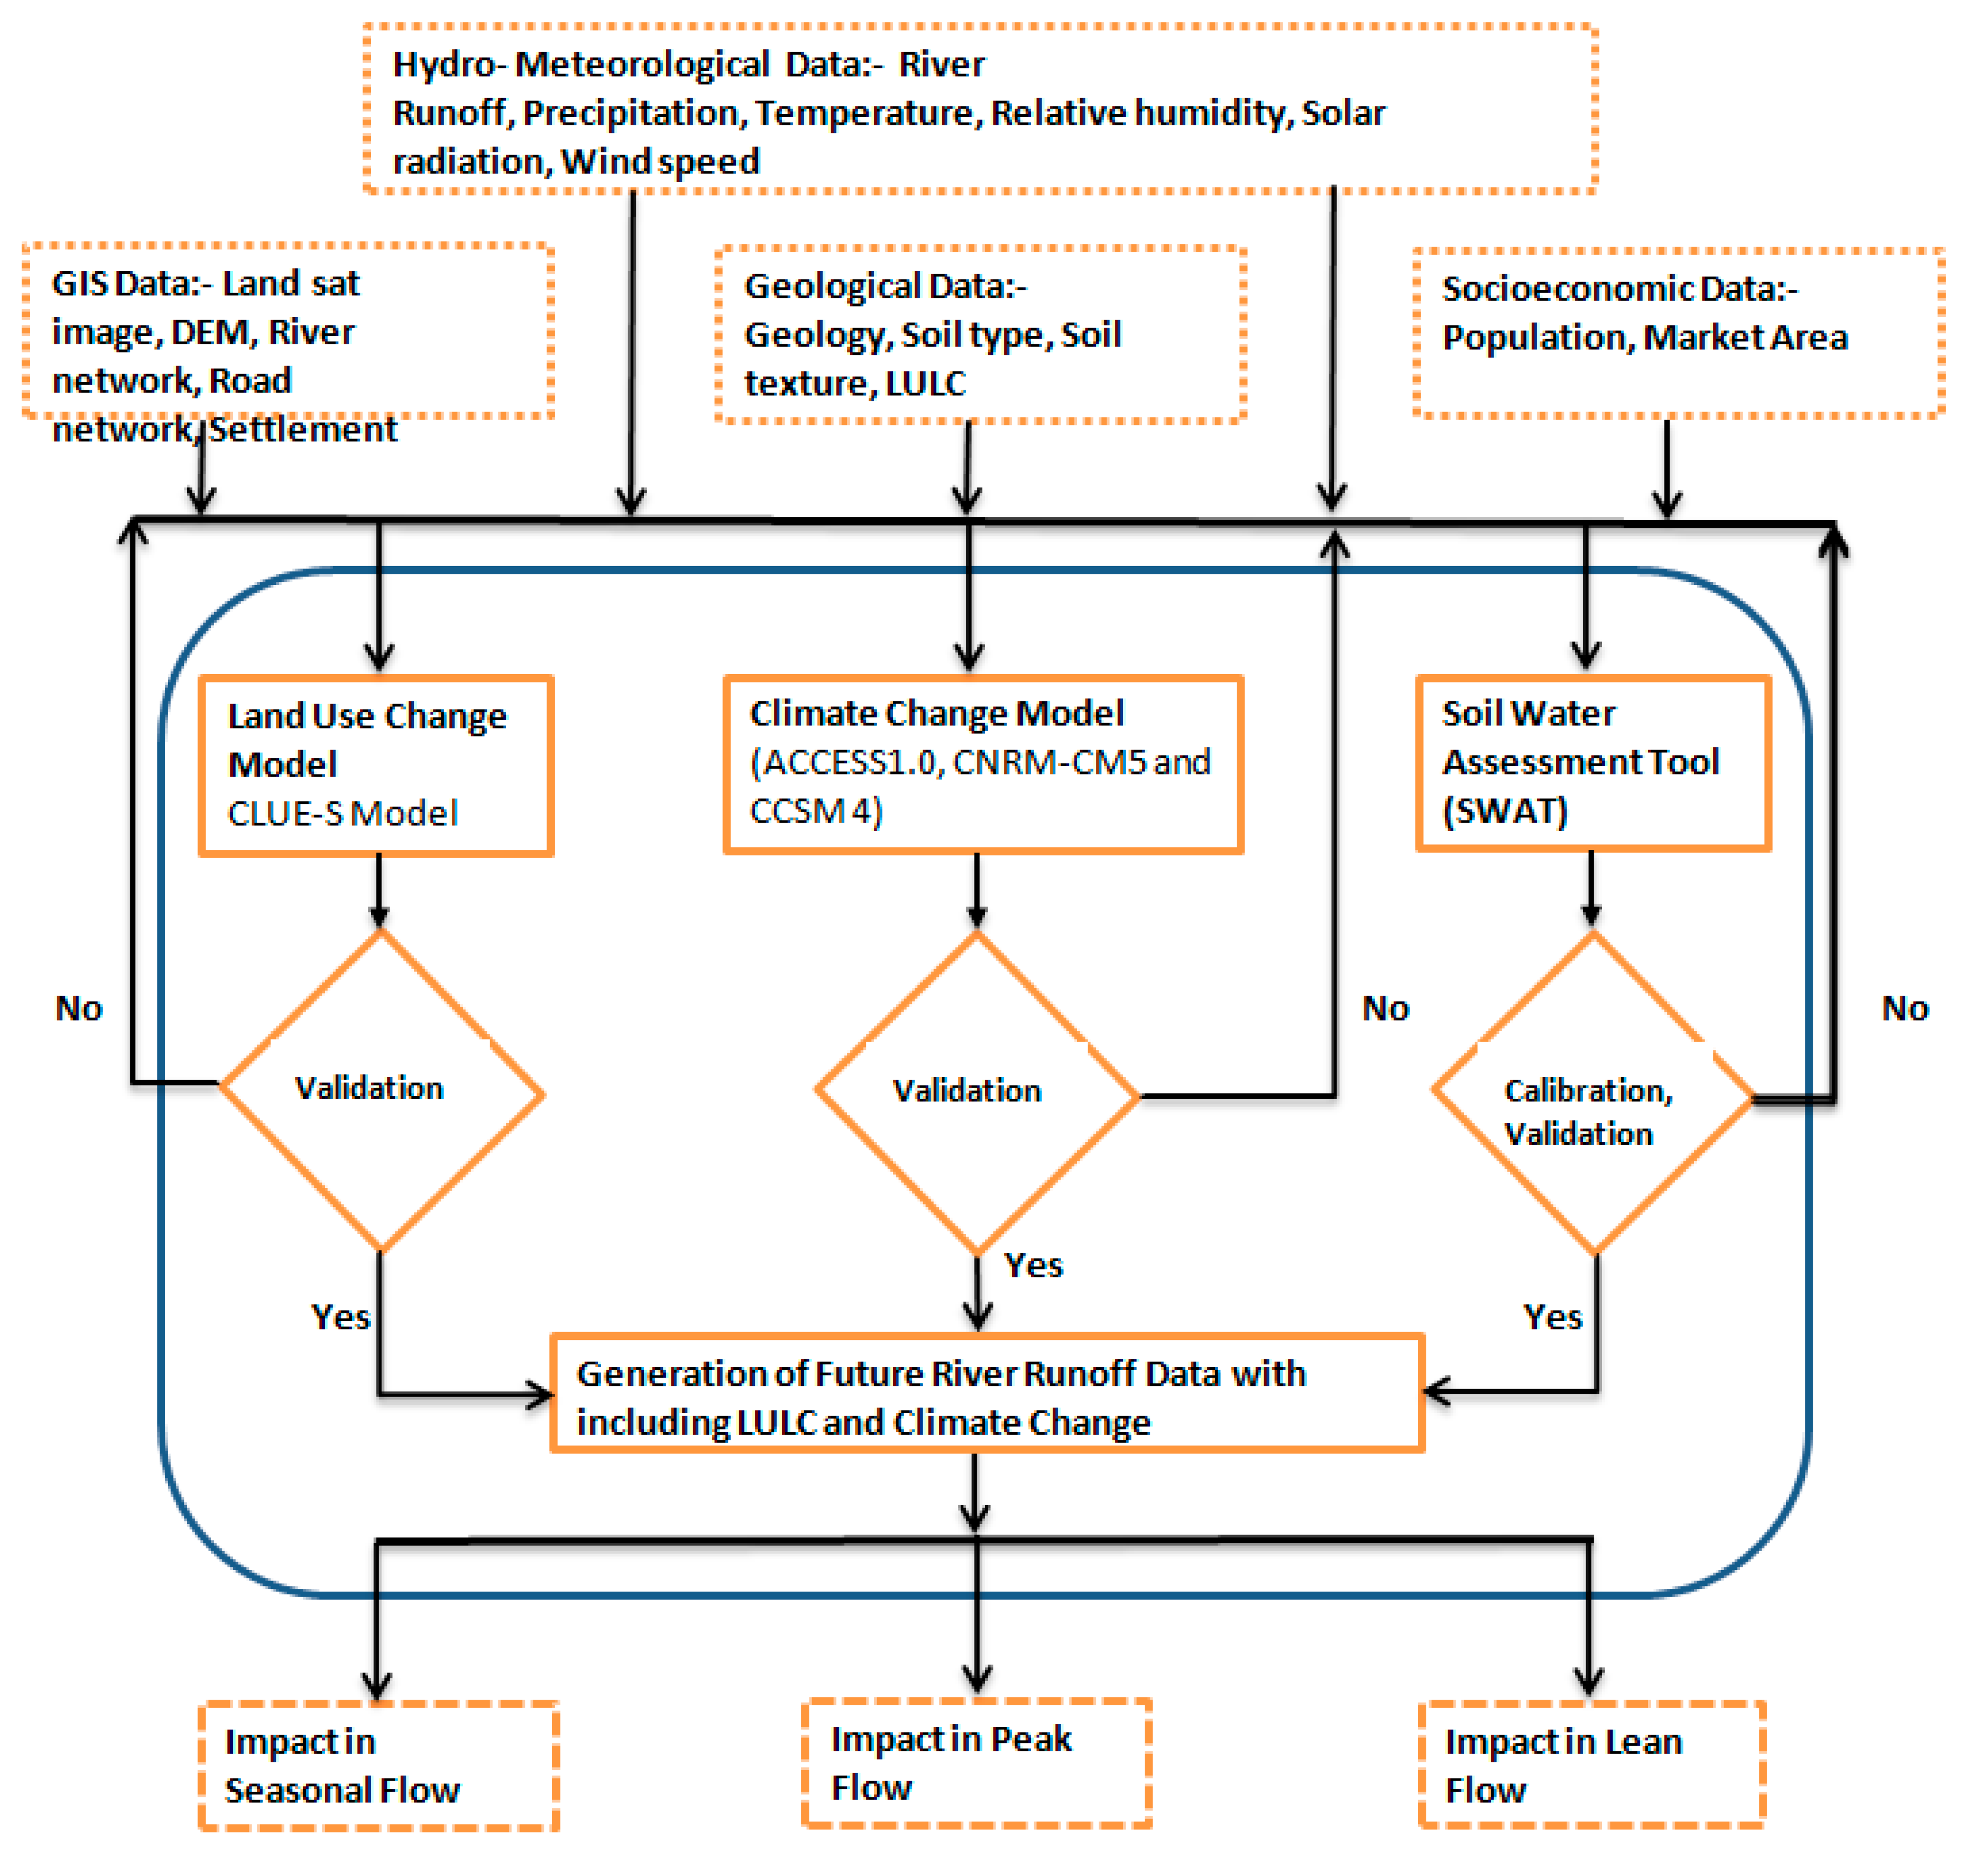
Firstly, the spatial land use change was obtained from 2010 to 2018 and was projected for future land use change scenario up to 2050. Secondly, the climate change pattern was observed from 2000 to 2014 and climatic data were generated by different climate models with RCP4.5 (medium) and RCP8.5 (high) scenarios. The combined spatial and temporal effects of the hydrological response of the river basin were found by coupling of the semi-distributed hydrological model (SWAT) with the land use change effects. Finally, the individual and combined impacts of LULC and climate change for the Bagmati river basin were evaluated for every decade (2020, 2030, 2040 and 2050) and season (summer/winter, pre-monsoon/monsoon/post-monsoon) through different scenarios. The overall methodological framework is demonstrated in Figure 2. Watershed was delineated using the ArcSWAT ver10.2. The delineation process also generated sub watersheds, river network, slope length and width of the river.
3.2.1. Future LULC Projection
Projected values of future LULC were taken from Lamichhane and Shakya [29]. That study used the CLUE-S model (see [9] for the model description) to project future LULC in the Bagmati river basin. The CLUE-S is specifically developed for the spatially explicit simulation of LULC change based on an empirical analysis of location suitability combined with the dynamic simulation of competition and interactions between the spatial and temporal dynamics of land use systems [30]. It simulates future LULC based on a logistic regression model. The logistic regression model of the probability of the suitability of the land use was analyzed using the SPSS tools, and goodness of fit of the analysis was checked by the area under the curve of receiver operating characteristic (ROC) curve [31]. The model has separated modules in two parts: one is the non-spatial demand module, and the other is the spatially explicit allocation module. The demand module examines the demand for various land use through past land use trends or scenario-based land use and then translates the demand for land use for application by the spatial allocation module [32]. The CLUE-S model was modified in a way that it can be applied for a small extent of the area as well.
3.2.2. Climate Change Projection
The future climate in the study area was projected based on following three regional climate models (RCMs): ACCESS-CSIRO-CCAM, CNRM-CM5 and CCSM4. The selection was made as per the recommendations by Aryal et al. [16]; they suggest that these data are quite reliable in the context of alpine and sub-tropical climate. Daily precipitation and temperature (maximum and minimum) data of the region were downloaded from South Asia Cordex and analyzed for the period of 2000 to 2005 under RCP4.5 and RCP8.5 scenarios. All climate model projected future climate data in the same location and period (2006 to 2054) were used in the analysis. Daily and monthly average temperature and precipitation of RCMs were evaluated from the historical data. Root mean square (RMS), mean and standard deviation (SD) techniques were used for the statistical validation before and after bias correction. In the regional scale, the RCMs give a better preference rather than the basin level. So, some bias corrections were required while using the down-scaled data [33].
Linear scaling and quantile mapping methods were used to correct biases in the RCM projections. Further details regarding linear scaling and quantile mapping methods are reported elsewhere (see e.g., [14,16,34]).For three RCMs, two RCPs, and two bias correction techniques, 12 scenarios were created. Observed daily temperature and precipitation data at several stations were processed to estimate basin-average values, using the Thiessen Polygon approach. The basin-average values were then used as observed data for bias-correction of RCM ouputs. Based on the evaluation of statistical parameters, two scenarios, one for each RCP4.5 and RCP8.5, that fit best with observed data were selected for further analysis.
3.2.3. Hydrological Modeling
(i) Description of the model
In this study, the SWAT [35] model was used for the simulation of the past and future discharge of the Bagmati river basin with both LULC and climate change scenarios. The analysis of the study was based on the simulated discharge of the SWAT hydrological model. The SWAT model is a conceptual, semi-distributed, process-based river basin hydrological model. All parameters of the model were calibrated and validated through observed river discharge at the Khokana station (station number 550.5) [23]. Spatial data (such as DEM, land use, soil type) and temporal data (precipitation, temperature, solar radiation, wind speed, relative humidity) are the major input data of the model and the analysis of the model is based on water balance equation as shown in Equation (1).
where, is the final soil water content in mm, is the initial soil water content in mm, is the amount of precipitation in a day in mm, is the amount of surface runoff in a day in mm, is the amount of evapo-transpiration in the day in mm, is the amount of water entering the vadose zone in a day in mm and is the amount of return flow in the day in mm. The river basin of the model is divided into the sub-basins, and each basin has own outlets. Sub-basin was generated by different number of hydrological response units (HRU). HRU is the smallest unit of the model that is formed by the combination of unique features of soil, land use and slope class with its own identity. The model is simulated within the basin of all HRU units and the aggregate outputs at the sub-basin to river reach. GIS-based SWAT model (ArcSWATver.10.2) is the composite assemble of the GIS tools with SWAT that can easily model the spatial variation and hydrological response of the basin, such as river runoff, evapo-transpiration, percolation, lateral flow, groundwater flow etc.
(ii) Model setup, calibration, and validation
The reliability of the output of the model depends upon the level of calibration of the model parameter and mostly correlates with the observed data used in the calibration and validation process. The outlet was generated above the junction of the river network based on the given threshold area either manually or automatically. In this research, 149 sub-basins and 486 HRUs were generated. From the observed spatial and the temporal data, the obtained results were calibrated and validated.
In this study, the hydrological model was calibrated and validated at the Khokana station. Overall river flow data from 2000 to 2014 were collected and used, meanwhile flow data between 2000 to 2010 were used to calibrate the model parameters, and remaining data from 2011 to 2014 were used for model validation. To better analyze and reduce the uncertainty of the river runoff, a two-year warm-up period was considered. All the calibration of the model parameters was done manually and the base value of the parameters were taken from the previous studies [5,6,15,16,34]. The model performance was evaluated based on widely used statistical parameters such as Nash–Sutcliffe simulation efficiency (NSE), percentage bias (PBIAS), coefficient of determination (R2), and the ratio of root mean square error (RMSE) to standard deviation ratio (RSR). Details on those parameters are described elsewhere (see e.g., [36,37]).
3.2.4. LULC and Climate Change Impact Assessment
Inputs to the properly calibrated and validated SWAT model were determined based on projected LULC and climate; first separately, and then collectively. Future hydrology was simulated under all three scenarios. Then, change in future hydrology (annual as well as seasonal) as compared to the baseline was analyzed.
4. Results and Discussion
4.1. Projected Change in LULC
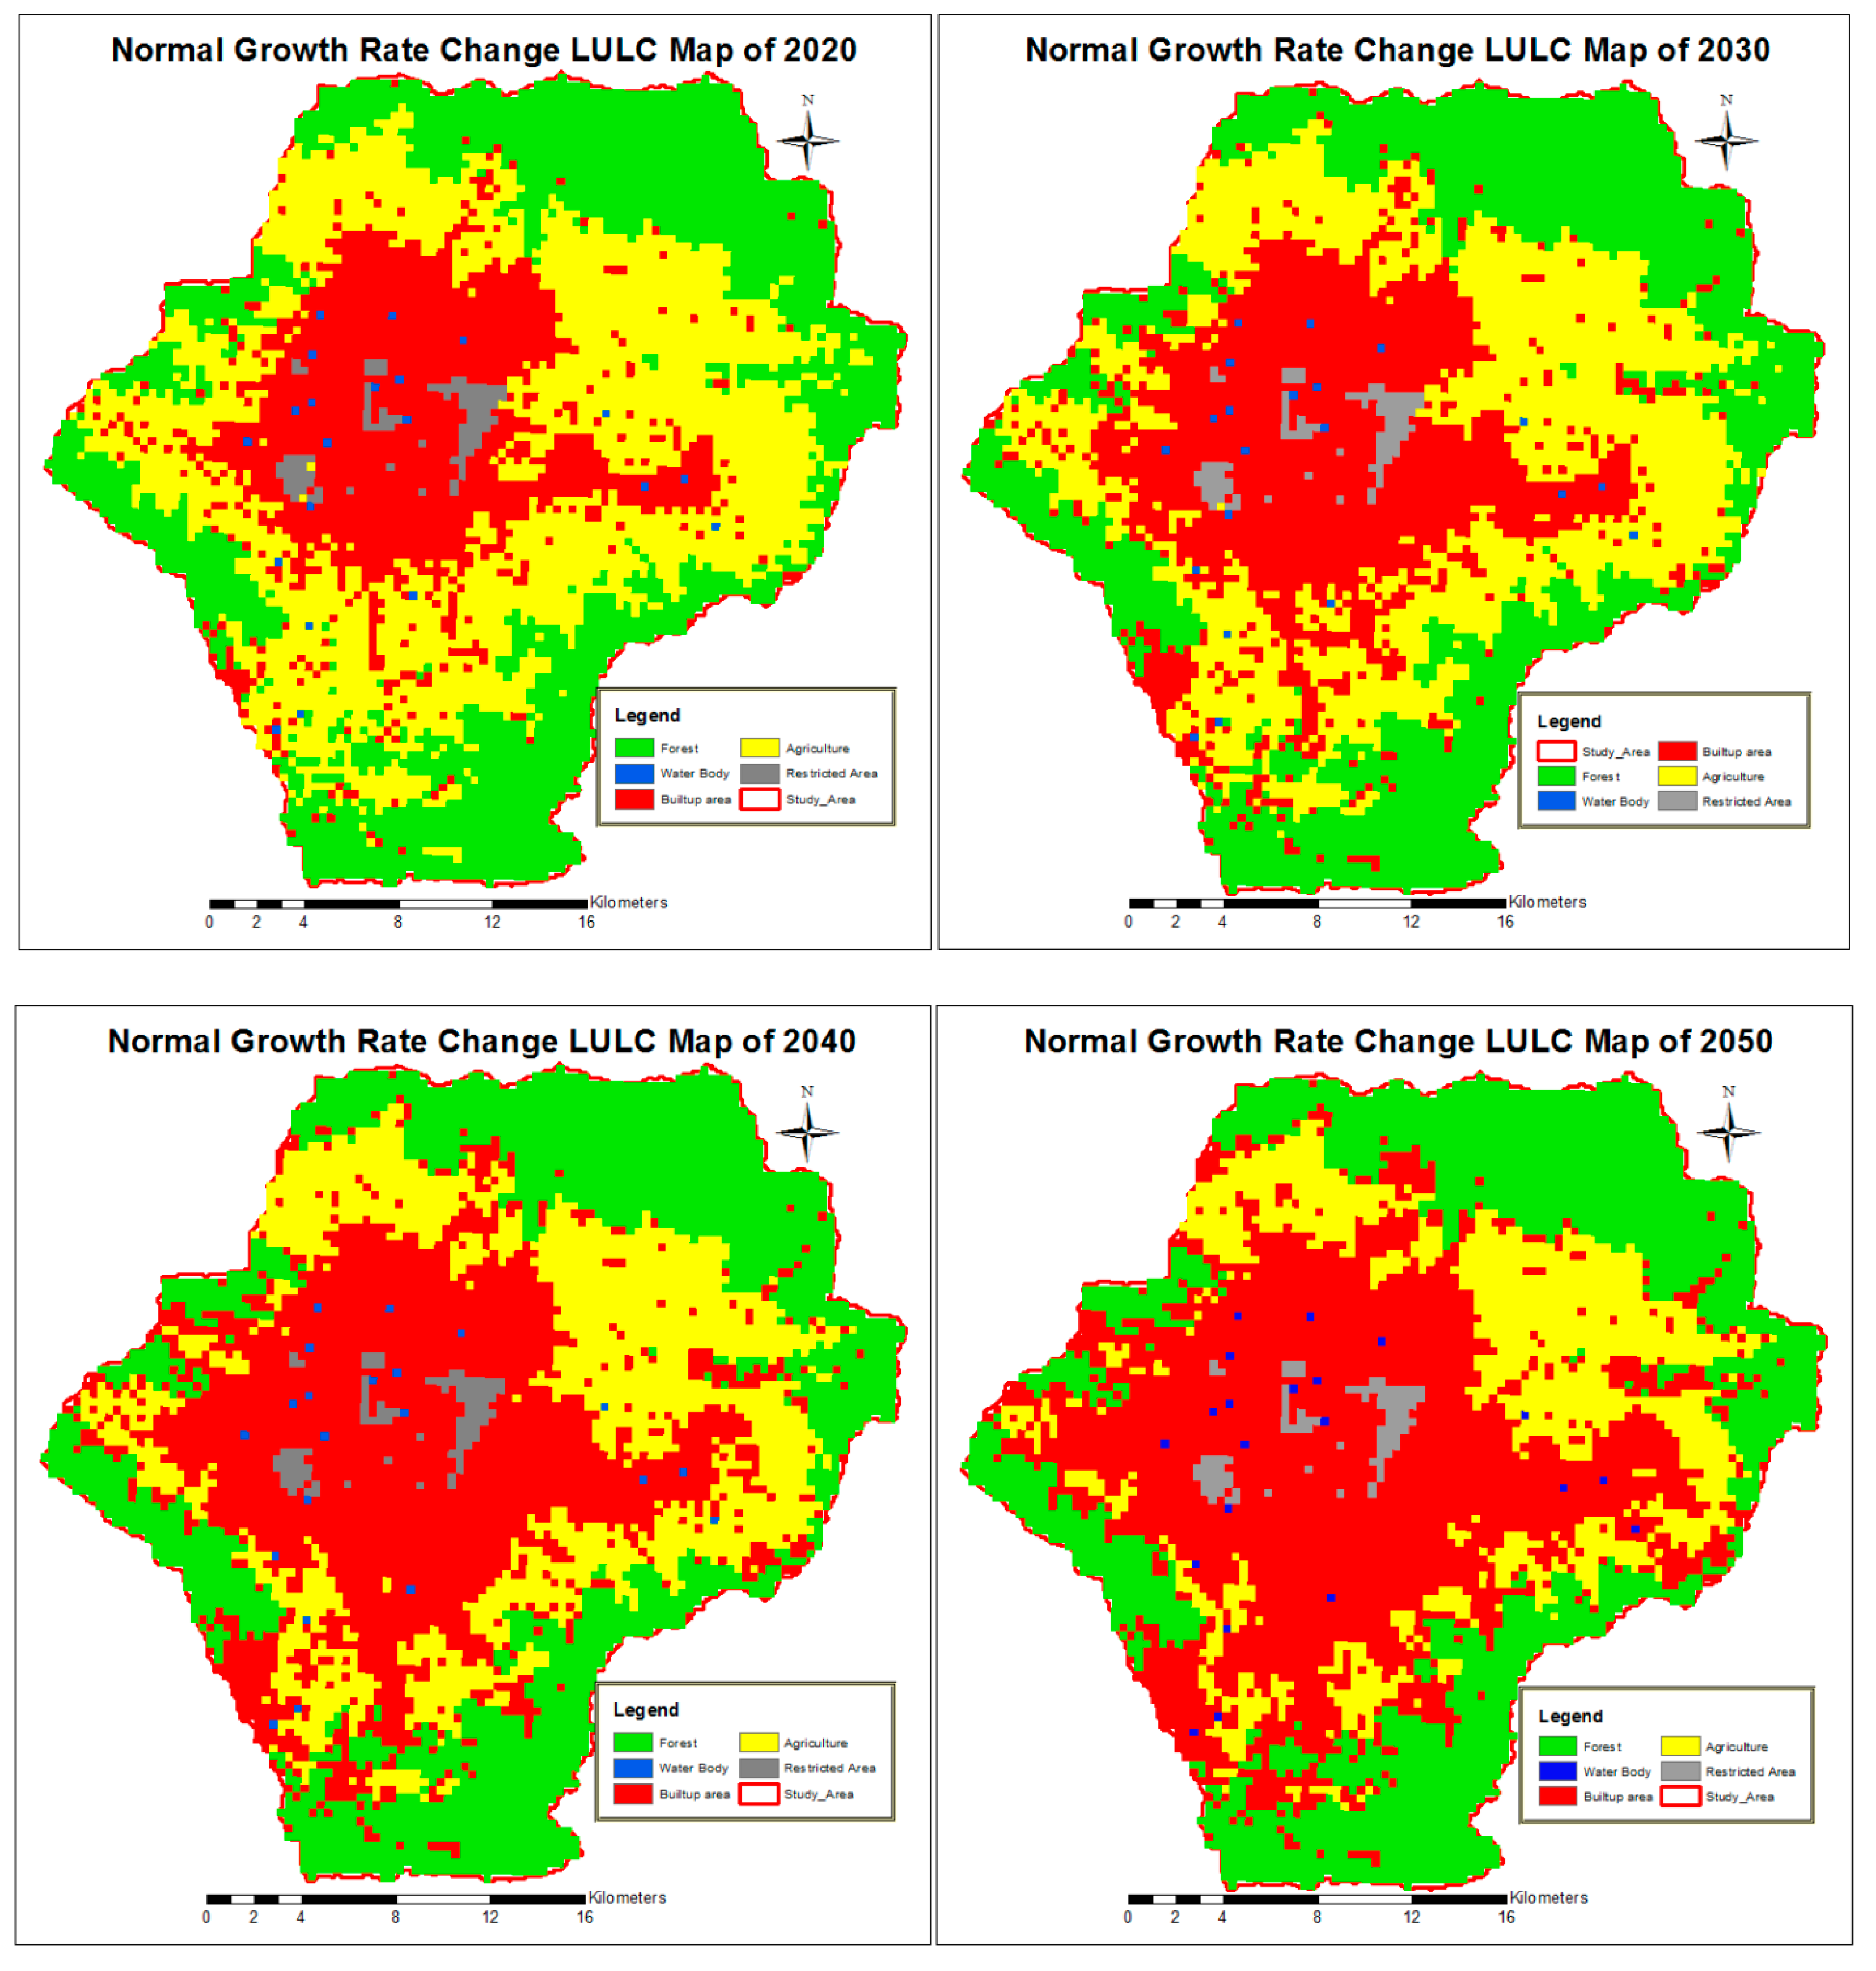
The projected future LULC data was taken from Lamichhane and Shakya [29]. A brief overview of the projected future LULC is presented hereafter. For the period of 2020–2050, agriculture and forest lands are projected to decrease by 20.45% (124.9 km2) and 0.94% (5.76 km2) of the total watershed area, respectively. The total built-up area is projected to increase by 21.4% (130.68 km2). Figure 3 shows LULC maps for the different decades. If the current urbanization is continued, fertile land might be converted into a concrete jungle. This may result in a decrease in agricultural production and subsequent food deficiency or trade imbalance due to additional imports. It may further have implications in water resources in terms of increase in the demand–supply gap due to more water-intensive lifestyles in urban areas, as well as reducing groundwater recharge due to an increase in impervious areas.
4.2. Projected Change in Climate
Future climate was represented by precipitation and temperature (both maximum and minimum temperatures) and was projected under RCP4.5 (medium) and RCP8.5 (high) emission scenarios by correcting biases in three RCMs, viz. ACCESS-CSIRO-CCAM, CNRM-CM5-CSIRO-CCAM, and CCSM-4. Biases in baseline were first corrected using linear-scaling and quantile mapping methods. Comparison of projected future climate data with the observed one showed that projection based on correction of biases in ACCESS-1 using quantile mapping method gives more realistic results compared to others. This finding is consistent with other studies (e.g., [16,20,38,39]) which demonstrated similar results for the areas that have similar climatic and topographic characteristics to that of the Bagmati river basin. Therefore, future climate data from ACCESS-1 with biases corrected by quantile mapping method were selected for analysis of future climate in the study area.
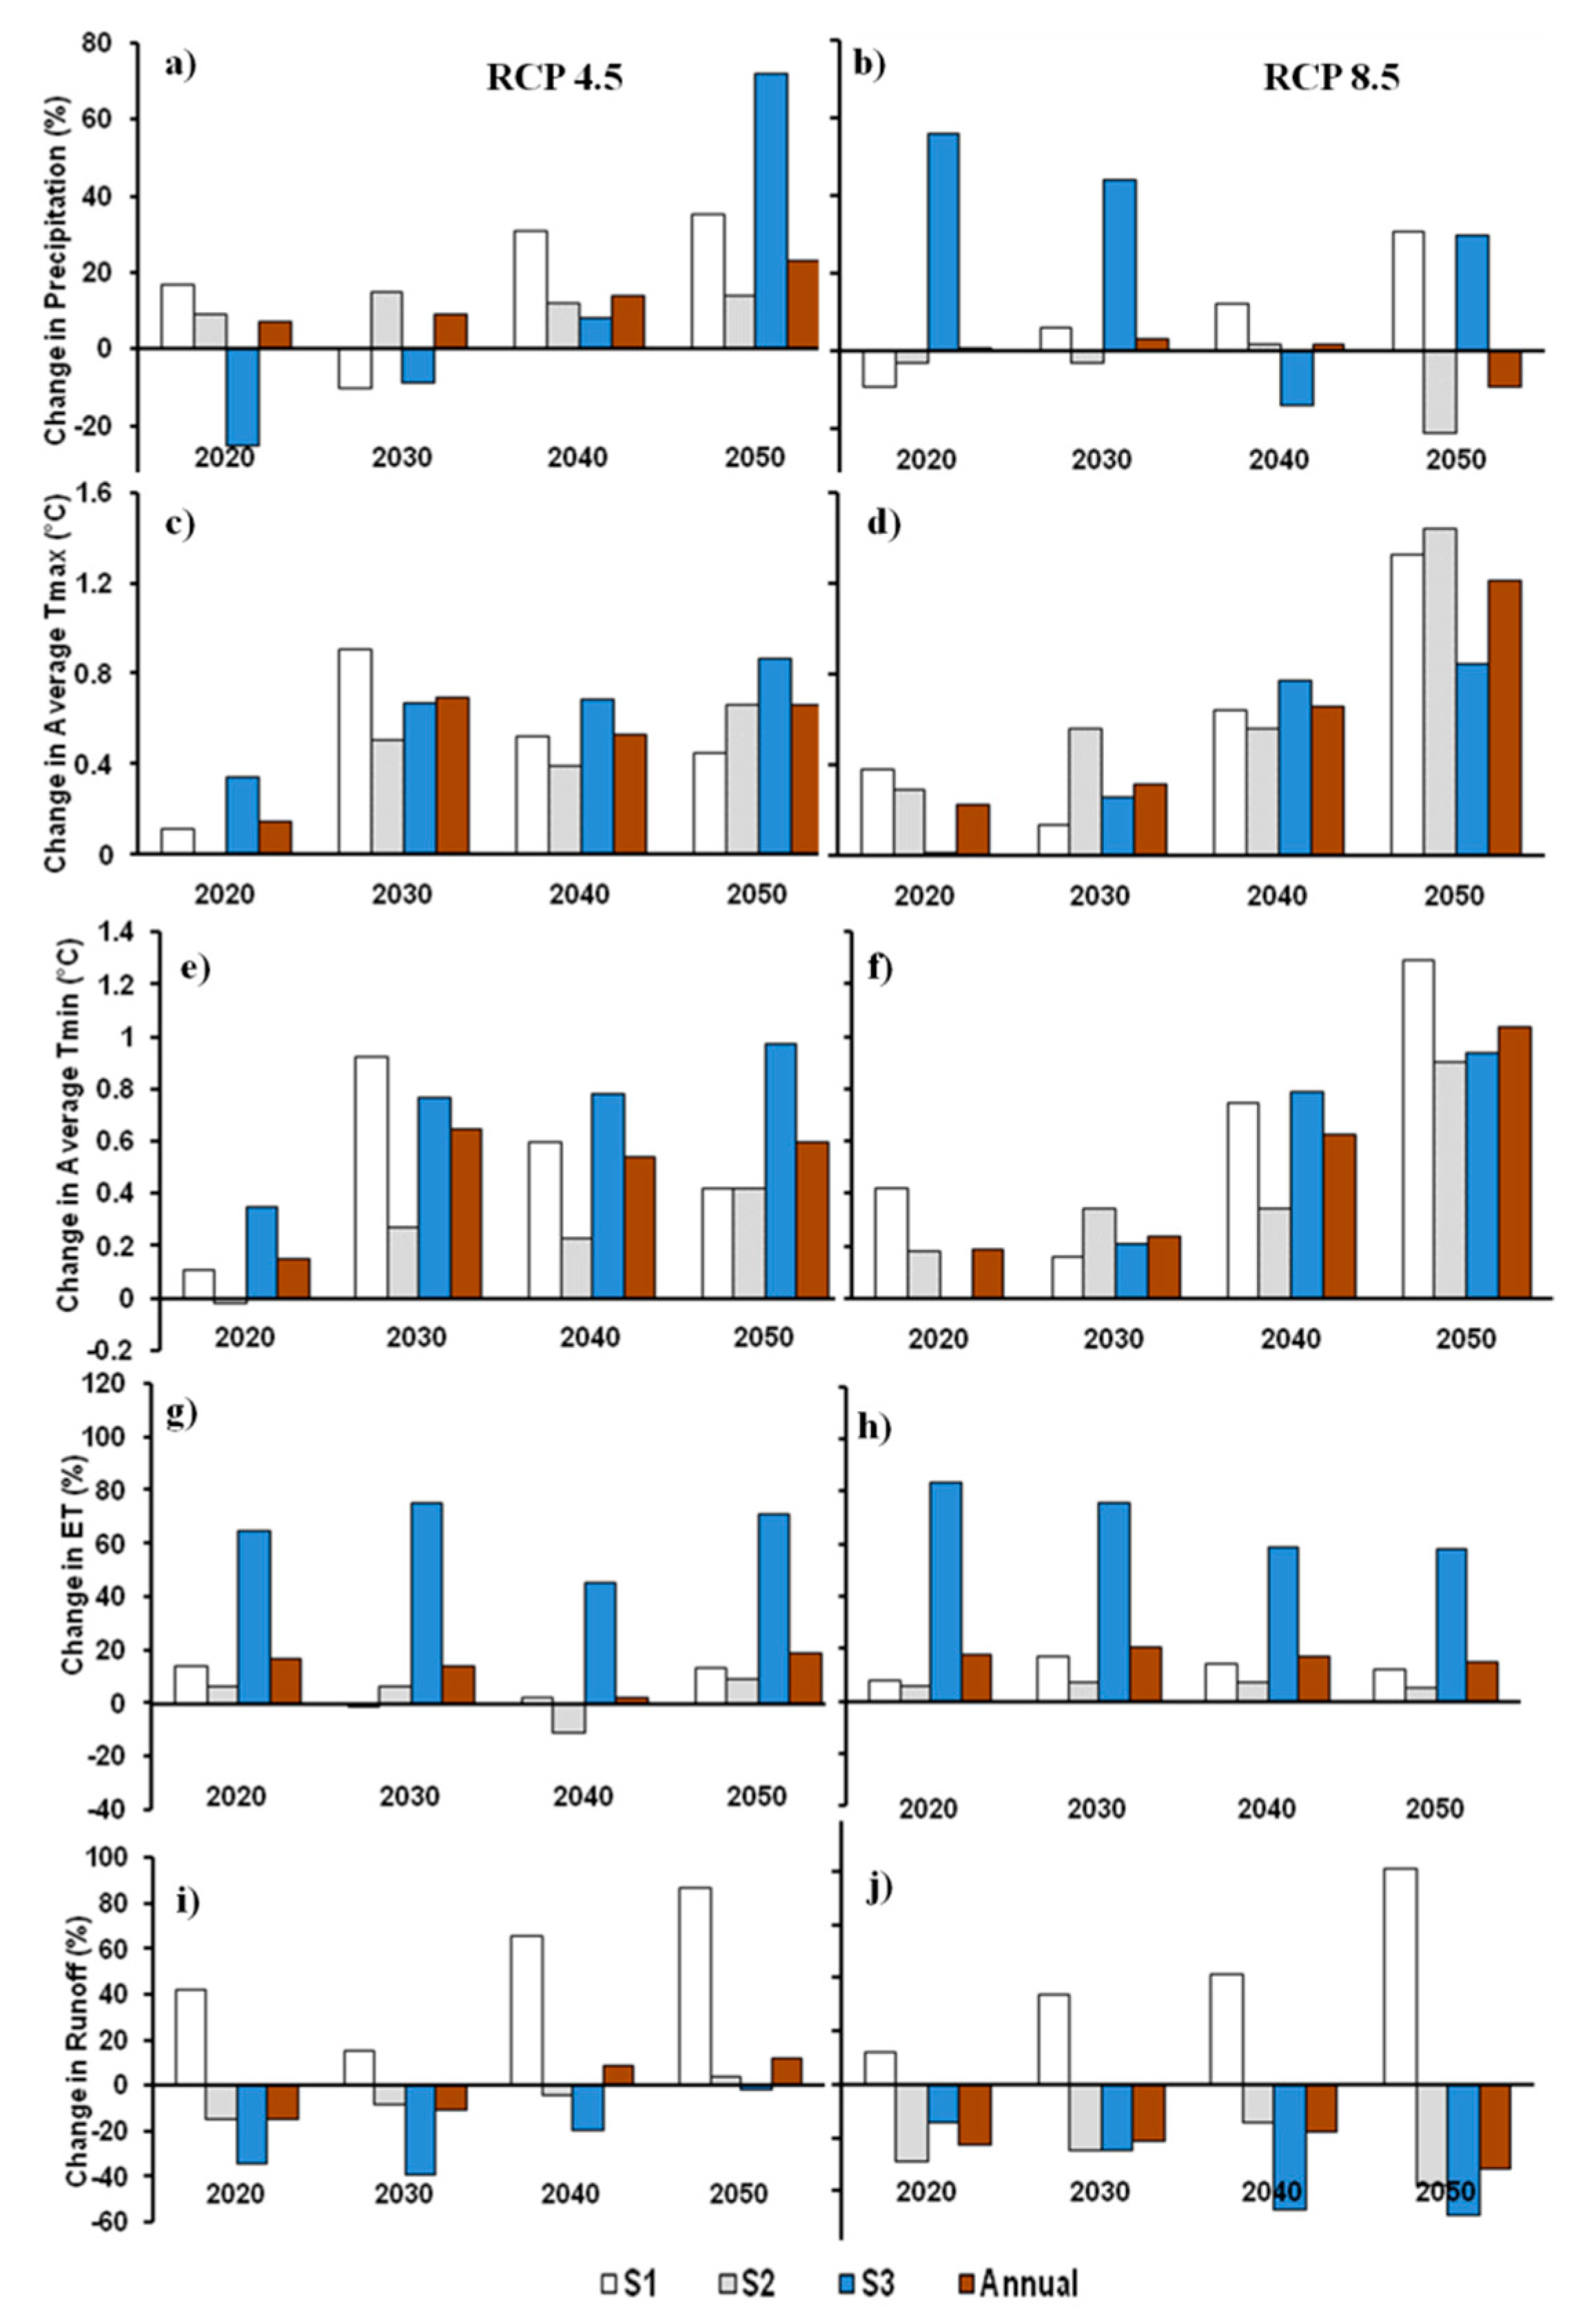
Bias-corrected data were compared with the baseline to estimate absolute changes in precipitation and temperature. Four scenarios were considered for 2020s, 2030s, 2040s, and 2050s. The RCM-based baseline (after bias correction) was used, rather than the observed one, so as to ensure that the differences are more realistic. The baseline average annual precipitation, maximum temperature, and minimum temperature values for RCP4.5 are 1,516 mm, 24.2 °C, and 12.4 °C, respectively (Table 2). Both scenarios show that average annual values of both the minimum and maximum temperatures increase consistently for all future periods considered. The absolute changes in average annual maximum temperature are 0.15, 0.70, 0.53, and 0.66 °C under RCP4.5 and 0.23, 0.32, 0.66, and 1.21 °C under RCP8.5 for 2020s, 2030s, 2040s and 2050s, respectively (Table 2). Similarly, absolute changes in average annual minimum temperature are 0.15, 0.65, 0.54, and 0.60 °C under RCP4.5 and 0.19, 0.24, 0.63 and 1.04 °C under RCP8.5 during the four future periods, respectively. It is evident that rate of increase in maximum temperature is more than the minimum temperature for both the RCP scenarios. The rate of increase is higher under RCP8.5 scenarios when compared to RCP4.5. Though all seasons show an increase in temperature, both maximum and minimum, the rate of increase varies across the season. The rate of increase in maximum temperature during post-monsoon season is considerably higher compared to other seasons as well as annual. The minimum temperature also follows a similar trend. Similar results are reported in other studies related to Nepal and South Asia as well [15,16,34,39,40,41].
In case of precipitation, average annual precipitation in general shows an increasing trend for all the scenarios and future periods considered, except for 2050s under RCP8.5. For example, it increases by 6%, 7%, 14% and 21% for 2020s, 2030s, 2040s, and 2050s under RCP4.5 scenarios. The percentage change, however, varies across the seasons. In general, precipitation is projected to increase in monsoon seasons, under RCP4.5 scenarios, with the rate higher than the average annual values. In case of post-monsoon, precipitation is projected to decrease in the first two decades and then increase. Since there is no consistent trend in precipitation, as reported in other literatures [15,17,20,34,42,43], projected change in precipitation can be considered erratic.
In 2030, the rate of precipitation has the decreasing trend (−11%) and the temperature in both (max and min) are increasing (+0.91 and +0.92), which show that this decade is drier than the other decades.
4.3. SWAT Model Performance
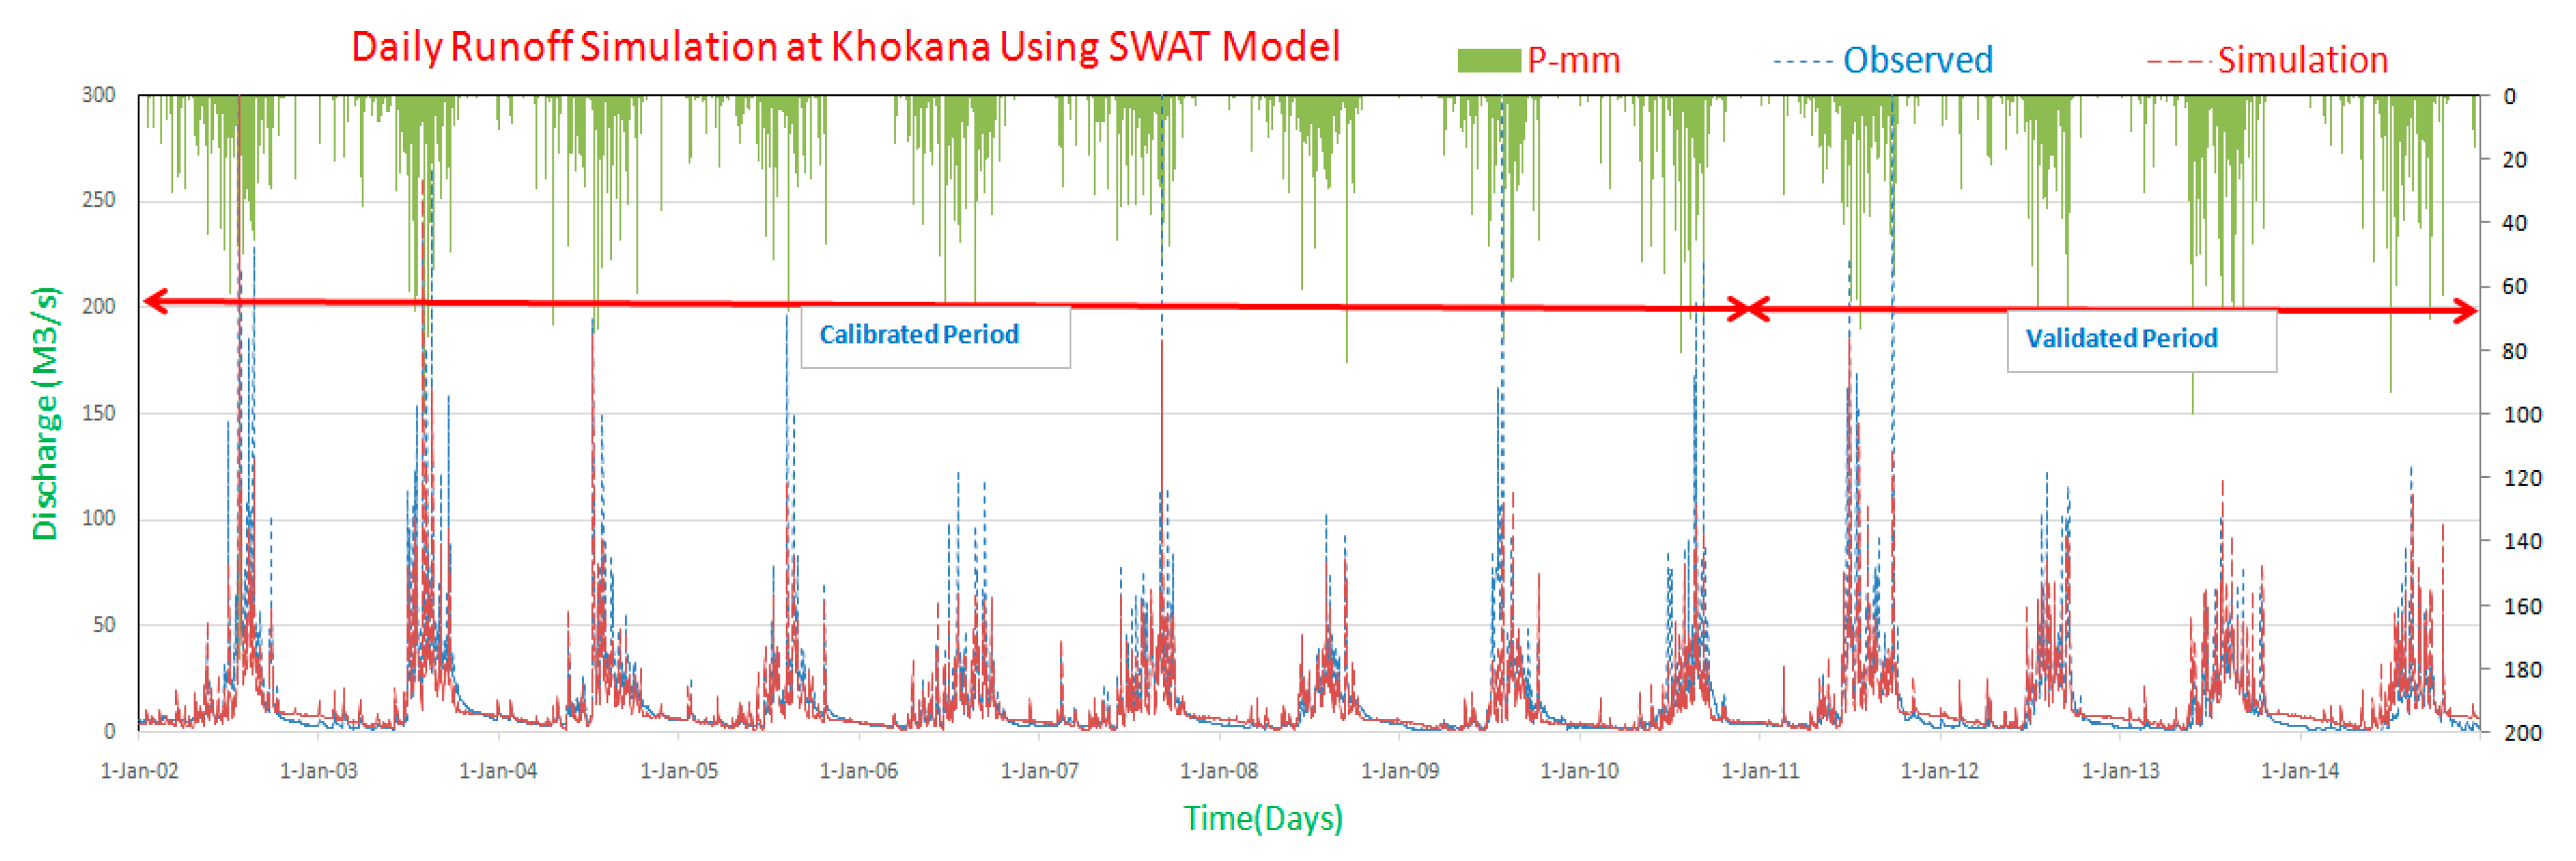
The SWAT model was set up, calibrated, and validated as described in Section 3. The model was calibrated for daily as well as monthly discharge at Khokana station in the Bagmati river. Model performance was evaluated by assessing hydrograph pattern as well as values of statistical parameters such as NSE, R2, and PBIAS. The observed and simulated daily hydrograph for calibration and validation periods are shown in Figure 4 and model performance indicators are depicted in Table 3.
Results showed that the hydrograph is reasonably reproduced for daily as well as monthly simulations. Model performance indicators are also satisfactory. The values of NSE, R2, and PBIAS for daily simulation are 0.87, 0.80, and 0.16, respectively (Table 3). The values for monthly simulation, in the same order are 0.96, 0.83, and 0.16. The monthly simulation shows better performance compared to the daily one. High flows are not adequately reproduced, however, average and low flow patterns as well as long-term average values are satisfactorily reproduced. The model performance during validation period (2011–2014) is also satisfactory, especially for the monthly simulation.
4.4. Climate Change Impacts
The well calibrated and validated SWAT model was used to assess the impacts of climate change on hydrology and water balance components in the Kathmandu Valley watershed. Climatic inputs to the SWAT model was changed as per the projected future climate, while keeping land use/cover same as the baseline. The model was simulated for the period of 2015–2054 for daily and monthly time periods under both RCP4.5 and 8.5 scenarios. The runoff (or net water yield) in a basin can be better characterized by analyzing the water balance components. The average annual values of rainfall, evapo-transpiration, and runoff during the baseline period were 1516 mm, 573mm, 12.92 m3/s, respectively. The difference between total inflow and outflow is considered as a change in storage.
The results of change (%) in water balance components for future periods with respect to baseline is reported in Table 4. The runoff under both the scenarios is projected to increase at the Khokana station, but the rate of increase varies across seasons, future periods considered, and emission scenarios. For RCP4.5 scenarios, except for a few exceptions, the percentage increase in average annual runoff is increasing toward the future; from 12% in 2020 to 37% in 2050. The pre-monsoon season has the highest percentage increase compared to other seasons, when we move toward the far future. The increase in runoff is related more to the increase in the average annual precipitation. The rate of change of the pre-monsoon water yield has greater significance to the monsoon and post-monsoon season. Post-monsoon groundwater recharge contributes the pre-monsoon base-flow to the river runoff and therefore, the percentage increase in the pre-monsoon water yield has been projected to be higher [20,34]. Such changes might have implications in agricultural sector by means of changing suitability of crop type, duration, showing and harvesting time in future day [44]. Furthermore, climate change impact on water balance component varies spatio-temporally, which highlights drier winters and wetter summers in future.
4.5. Land Use/Cover Change Impacts
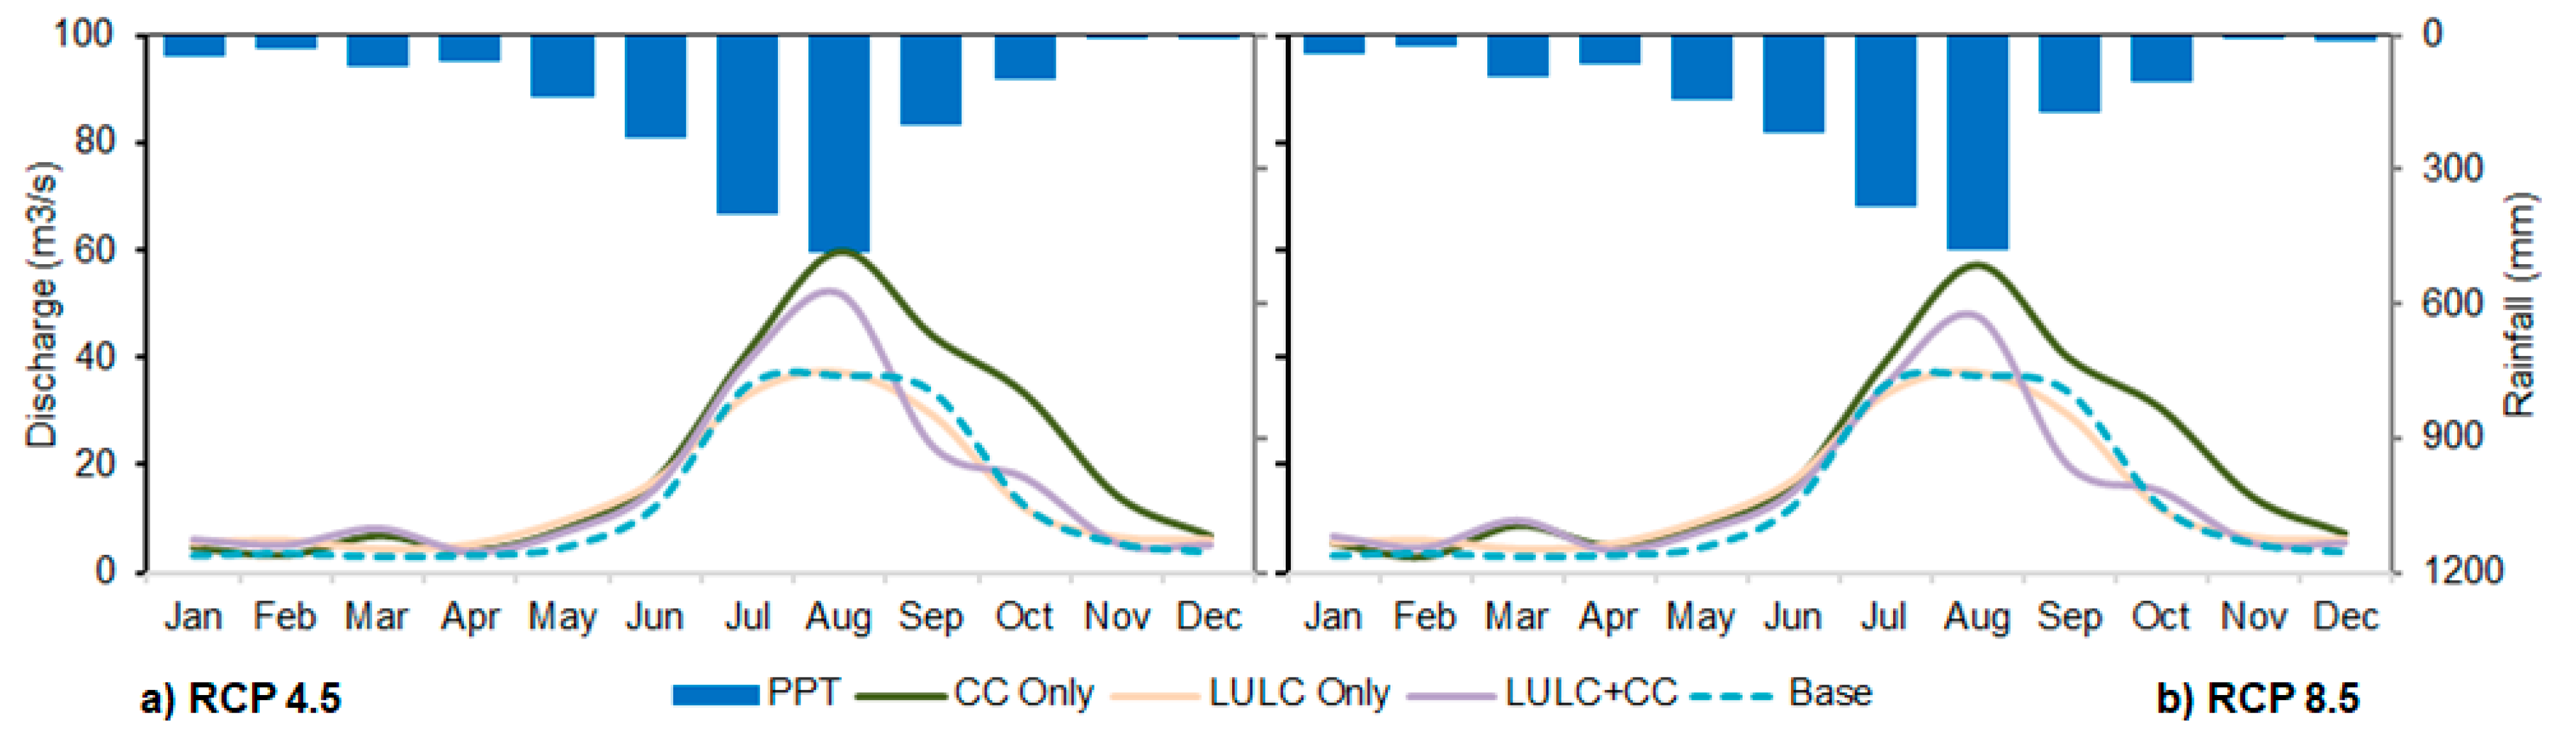
Assessment of LULC impact on hydrology is based on CLUE-S projected LULC for 2020, 2030, 2040 and 2050, and keeping climatic data same as used during calibration and validation of SWAT model. The LULC for the decade of 2010 was considered as the baseline. The results are tabulated in Table 5. As climatic data used was same as the baseline, there was no change in precipitation and temperature. However, change in land use/cover, evapo-transpiration is projected to decrease gradually when we move further in the future. For example, the average annual evapo-transpiration is projected to decrease by 13%, 14%, 15% and 16% for the decades of 2020, 2030, 2040, and 2050, respectively. The direction of change for all the seasons are consistent with the average annual changes in evapo-transpiration. In terms of water yield (or runoff), the average annual value increases gradually toward the future and the direction of change is similar for pre-monsoon as well as monsoon seasons. However, the rate of increase is maximum for pre-monsoon period compared to other seasons, as well as average annual values. Increase in runoff even with no changes in precipitation is justified due to the decrease in evapo-transpiration as a result of changing vegetation covers and cultivation land into built-up area. The projected change in built-up, agriculture, and forest areas are +21.4%, −20.5%, and −0.9%, respectively, for the period of 2020 to 2050 [29]. In addition, 6% of open-land is projected to be converted into impervious land. All these facts support decrease in evapo-transpiration and subsequent increase in runoff. The rate of change of volume of the average monthly and seasonal peak flow and the lean flow of the basin is projected to decrease (see Figure 5) toward the future. Due to increase in impervious surface, contribution to the groundwater as well as lateral flow is projected to decrease.
As a result of LULC change, moisture deficiency in the agricultural field may increase, which then increases agricultural water demand. Therefore, farmers may need to apply adaptation strategies such as changing cropping patterns, crop types, and cropping times in order to deal with soil moisture deficiency. Furthermore, urbanization and associated increase in built-up areas will result in an increase in volume of groundwater pumping, which is likely to decline the groundwater level. This ultimately affects the groundwater contribution in the basin; however, this is not considered in the present study.
4.6. Integrated Impacts of Land Use/Cover Change and Climate Change
To assess the integrated impacts of both LULC and climate changes in hydrology, the calibrated and validated SWAT model inputs were determined with projected LULC as well as climate for the four decades. The results of changes in water balance components are tabulated in Table 6. The average annual runoff for RCP4.5 scenario is projected to decrease for the first decade (2020) by 15% and then projected to increase gradually, i.e., decreasing percentage decrease to 11% in 2030, and then overall increase of 9% and 12% in 2040 and 2050 respectively. It follows a similar trend for monsoon and post-monsoon seasons as well. Overall, pre-monsoon runoff is projected to increase for all the future periods, though in varying rates, probably due to pattern of changes in precipitation and evapotranspiration. The projected increase in average annual evapotranspiration is 17%, 14%, and 2% for 2020, 2030, and 2040 respectively. As evapotranspiration is affected by both precipitation as well as temperature, the changes in average annual as well as seasonal values are different than those from only LULC change and climate change. The excess runoff flow due to projected increase in runoff will result a decrease in groundwater and lateral flows. This may lead to a decrease in the volume of sub-surface water movement and subsequent occurrence of moisture deficiency in the agricultural land.
A comparison of changes in runoff and water balance components under individual changes in LULC only, climate change only, and integrated change of both LULC and climate changes is shown in Table 2 and Table 6, and Figure 6. The summary of Table 4, Table 5 and Table 6 is also presented in Table 7. While considering only climate change, the overall response of the watershed in terms of runoff is highly dependent on changes in precipitation rather than temperature. Even within temperature, effects of change in minimum temperature is more comparable to maximum temperature, because an increase in minimum temperature in the winter season results in an increase in evapotranspiration from soil moisture, thus, leading to a moisture deficit in soil. Though not assessed in this study, there might exist uncertainty in the projected future climate and associated impacts on hydrology due to relatively smaller size of the study basin compared to the RCM grids. For the second case of considering only LULC change, runoff is more sensitive to evapotranspiration rather than precipitation, because an increase in built-up areas increases the effective area for evapotranspiration and therefore enhances evapotranspiration. Furthermore, consideration of LULC change only increases peak runoff and average flow, but reduces base-flow due to less recharge to the groundwater system. While combining the impacts of both LULC and climate change, rather than simply superimposing, the total impact is less than the sum of the individual impacts of both. In terms of peaks, the combined scenarios smooth the peak flow and reduce the peak volume of discharge compared to individual ones, whereas in the case of lean flow, there is a minor increase in runoff compared to individual ones (Figure 5). This holds true for the both RCP scenarios.
5. Conclusions
This study projected future LULC and climate changes in the Kathmandu Valley watershed, the upper catchment of the Bagmati river basin, central Nepal, and then evaluated the impacts of individual as well as integrated changes in hydrological regime and water balance. A hydrological model in Soil and Water Assessment Tool (SWAT) was developed for the hydrological simulation and scenario analysis. Future climate (temperature and precipitation) were projected based on three regional climate models (RCMs) (i.e., ACCESS-CSIRO-CCAM, CNRM-CM5 and CCSM4), and two representative concentration pathways (RCP) scenarios (i.e., RCP4.5 and RCP8.5). Linear scaling and quantile mapping techniques were used for bias correction of the RCM data. The performance of the ACCESS-1, bias-corrected with quantile mapping method, gave a robust output when compared with the observed data, and therefore, the same was used for further evaluation of climate change impacts. Similarly, future land use/cover (LULC) data were simulated in the CLUE-S model with five different LULC projection scenarios, out of which, the normal LULC change rate gave a better performance than the others, and was therefore selected for impact evaluation. The SWAT model performance was evaluated for annual, seasonal, and monthly time-scales and found that the calibrated and validated hydrological model is capable to reproduce hydrological regime with reasonably good model performance indicators. Three scenarios were simulated with calibrated and validated model, namely, only climate change, only LULC change, and both LULC and climate changes.
The maximum and minimum temperatures (Tmax and Tmin) and precipitation in the Kathmandu Valley watershed for the period of 2010 to 2050 are projected to increase by 0.66 °C, 0.6 °C, and 23%, respectively, for RCP4.5 scenario and 1.21 °C, 1.04 °C and decrease by 9% respectively for RCP8.5 scenarios. In the same period, the agricultural land and forest area within the basin was converted into the built-up area by 21.4% (130.7 km2). As the result, the river discharge due to climate change alone, LULC alone, and combination of LULC and CC scenarios was increased by 37%, 21%, and 12%, respectively, for RCP4.5 scenario. The decadal average rate of groundwater contribution to the river discharge for the RCP4.5 and RCP8.5 scenarios declined with 58% and 68%, respectively for the integrated scenario due to less infiltration by the expansion of the built-up area.
For all the scenarios, future temperature is projected to increase, summer runoff volume is projected to increase, and winter runoff is projected to decrease. These indicate that the dry and wet seasons are projected to be dryer and wetter, respectively. LULC change alone is projected to increase average annual discharge but decrease the lean period flow. In case of integrating both changes together, it is projected to force the decline in river discharge. Response of the river system to projected changes in climate and LULC is not simply a superposition of response due to individual changes. For this specific case study, the combined change has smoothed the shape of the monthly hydrograph. Here we can conclude that change in the water balance and hydrological process of the Bagmati basin was mainly due to changes in climatic variable (precipitation and temperature) and the LULC change gave the counteractive role toward the urbanized section of the river basin area. The increase in rainfall and river discharge as a result of projected change in climate and LULC; it could be used beneficially by storing excess rainwater and river discharge, the people and ecosystem can harness benefits of climate change/variability. The research results are expected to be useful for the planning and management of water supply, irrigation, hydropower, river basin management projects in the study area. Furthermore, this study has contributed in the body of knowledge on integrated impacts of climate and LULC changes on hydrology.
Author Contributions
Conceptualization, S.L. and N.M.S.; methodology, N.M.S.; software, S.L.; validation, S.L.; formal analysis, S.L.; investigation, S.L.; resources, N.M.S.; writing—original draft preparation, S.L.; writing—review and editing, S.L., N.M.S.; visualization, S.L.; supervision, N.M.S.; project administration, N.M.S.
Funding
The first author acknowledges the funding provided by Institute of Engineering, Tribhuvan University for doctoral research.
Acknowledgments
Authors acknowledge the support provided by NTNU, Norway, Vishnu Prasad Pandey, Bhesh Raj Thapa, Saraswati Thapa, Sarita Dawadi, Dipendra Gautam, Anil Aryal, and other people who have supported them in various ways. The authors express sincere thanks to the reviewers and the editor. The quality of the manuscript has significantly improved by the constructive comments of the editor.
Conflicts of Interest
The authors declare no conflict of interest.
References
- UNPF United Nations Population Fund. Available online: http://www.unfpa.org/public (accessed on 15 January 2018).
- Beskow, S.; Norton, L.D.; Mello, C.R. Hydrological prediction in a tropical watershed dominated by oxisols using a distributed hydrological model. Water Resour. Manag. 2013, 27, 341–363. [Google Scholar] [CrossRef]
- Zhou, F.; Xu, Y.; Chen, Y.; Xu, C.-Y.; Gao, Y.; Du, J. Hydrological response to urbanization at different spatio-temporal scales simulated by coupling of CLUE-S and the SWAT model in the Yangtze River Delta region. J. Hydrol. 2013, 485, 113–125. [Google Scholar] [CrossRef]
- Pandey, V.P.; Dhaubanjar, S.; Bharati, L.; Thapa, B.R. Science of the Total Environment Hydrological response of Chamelia watershed in Mahakali Basin to climate change. Sci. Total Environ. 2019, 650, 365–383. [Google Scholar] [CrossRef]
- Shrestha, S.; Bhatta, B.; Shrestha, M.; Shrestha, P.K. Integrated assessment of the climate and landuse change impact on hydrology and water quality in the Songkhram River Basin, Thailand. Sci. Total Environ. 2018, 643, 1610–1622. [Google Scholar] [CrossRef]
- Pokhrel, B. Impact of Land Use Change on Flow and Sediment Yields in the Khokana Outlet of the Bagmati River, Kathmandu, Nepal. Hydrology 2018, 5, 22. [Google Scholar] [CrossRef]
- Mohammady, M.; Moradi, H.R.; Zeinivand, H.; Temme, A.; Yazdani, M.R.; Pourghasemi, H.R. Modeling and assessing the effects of land use changes on runoff generation with the CLUE-s and WetSpa models. Theor. Appl. Climatol. 2018, 133, 459–471. [Google Scholar] [CrossRef]
- Aich, V.; Liersch, S.; Vetter, T.; Fournet, S.; Andersson, J.C.M.; Calmanti, S.; van Weert, F.H.A.; Hattermann, F.F.; Paton, E.N. Flood projections within the Niger River Basin under future land use and climate change. Sci. Total Environ. 2016, 562, 666–677. [Google Scholar] [CrossRef] [PubMed]
- Veldkamp, A.; Fresco, L.O. CLUE: A conceptual model to study the Conversion of Land Use and its Effects. Ecol. Model. 2002, 85, 253–270. [Google Scholar] [CrossRef]
- Soares-Filho, B.S.; Cerqueira, G.C.; Pennachin, C.L. DINAMICA—A stochastic cellular automata model designed to simulate the landscape dynamics in an Amazonian colonization frontier. Ecol. Model. 2002, 154, 217–235. [Google Scholar] [CrossRef]
- Praskievicz, S.; Chang, H. Impacts of climate change and urban development on water resources in the Tualatin River Basin, Oregon. Ann. Assoc. Am. Geogr. 2011, 101, 249–271. [Google Scholar] [CrossRef]
- Pratomoatmojo, N.A. LanduseSim Algorithm: Land use change modelling by means of Cellular Automata and Geographic Information System. IOP Conf. Ser. Earth Environ. Sci. 2018, 202, 012020. [Google Scholar] [CrossRef]
- Kim, O. Comparison of Two GIS Based Land Change Modules for Constructing REDD Baselines in Bolivia; AAG Annual Meeting: Washington, DC, USA, 2010. [Google Scholar]
- Shrestha, S.; Shrestha, M.; Babel, M.S. Modelling the potential impacts of climate change on hydrology and water resources in the Indrawati River Basin, Nepal. Environ. Earth Sci. 2016, 75, 280. [Google Scholar] [CrossRef]
- Thapa, B.R.; Ishidaira, H.; Pandey, V.P.; Shakya, N.M. A multi-model approach for analyzing water balance dynamics in Kathmandu Valley, Nepal. J. Hydrol. Reg. Stud. 2017, 9, 149–162. [Google Scholar] [CrossRef]
- Aryal, A.; Shrestha, S.; Babel, M.S. Quantifying the sources of uncertainty in an ensemble of hydrological climate-impact projections. Theor. Appl. Climatol. 2019, 135, 193–209. [Google Scholar] [CrossRef]
- Wang, Q.; Xu, Y.; Xu, Y.; Wu, L.; Wang, Y.; Han, L. Spatial hydrological responses to land use and land cover changes in a typical catchment of the Yangtze River Delta region. Catena 2018, 170, 305–315. [Google Scholar] [CrossRef]
- IPCC, Intergovernmental Panel on Climate Change. ‘Summary for policymakers, climate change 2007: The physical science basis’. In Contribution of Working Group II: The Fourth Assessment Report of the Intergovernmental Panelon Climate Change; Cambridge University Press: Cambridge, UK, 2007. [Google Scholar]
- Lutz, A.F.; ter Maat, H.W.; Biemans, H.; Shrestha, A.B.; Wester, P.; Immerzeel, W.W. Selecting representative climate models for climate change impact studies: An advanced envelope-based selection approach. Int. J. Climatol. 2016, 36, 3988–4005. [Google Scholar] [CrossRef]
- Sharma, R.H.; Shakya, N.M. Hydrological changes and its impact on water resources of Bagmati watershed, Nepal. J. Hydrol. 2006, 327, 315–322. [Google Scholar] [CrossRef]
- Shi, P.; Ma, X.; Hou, Y.; Li, Q.; Zhang, Z.; Qu, S.; Chen, C.; Cai, T.; Fang, X. Effects of land-use and climate change on hydrological processes in the upstream of Huai River, China. Water Resour. Manag. 2013, 27, 1263–1278. [Google Scholar] [CrossRef]
- Yang, L.; Feng, Q.; Yin, Z.; Wen, X.; Si, J.; Li, C.; Deo, R.C. Identifying separate impacts of climate and land use/cover change on hydrological processes in upper stream of Heihe River, Northwest China. Hydrol. Process. 2017, 31, 1100–1112. [Google Scholar] [CrossRef]
- DHM. Hydrological Records of Nepal, Streamflow Summary; Updated Version; Department of Hydrology and Meteorology, Goverment of Nepal, Ministry of Water Resources, DHM: Kathmandu, Nepal, 2015.
- Thapa, R.B.; Murayama, Y. Examining spatiotemporal urbanization patterns in Kathmandu Valley, Nepal: Remote sensing and spatial metrics approaches. Remote Sens. 2009, 1, 534–556. [Google Scholar] [CrossRef]
- Ishtiaque, A.; Shrestha, M.; Chhetri, N. Rapid urban growth in the Kathmandu Valley, Nepal: Monitoring land use land cover dynamics of a himalayan city with landsat imageries. Environments 2017, 4, 72. [Google Scholar] [CrossRef]
- Thapa, R.B.; Murayama, Y. Land use Change Factors in Kathmandu Valley: A GWR Approach. In Proceedings of the 10th International Conference on Geocomputation, Sydney, Australia, 30 November–2 December 2009; pp. 255–260. [Google Scholar]
- Haack, B. A history and analysis of mapping urban expansion in the Kathmandu valley, Nepal. Cartogr. J. 2009, 46, 233–241. [Google Scholar] [CrossRef]
- Rimal, B.; Zhang, L.; Fu, D.; Kunwar, R.; Zhai, Y. Monitoring urban growth and the nepal earthquake 2015 for sustainability of Kathmandu Valley, Nepal. Land 2017, 6, 42. [Google Scholar] [CrossRef]
- Lamichhane, S.; Shakya, N.M. Alteration of groundwater recharge areas due to land use/cover change in Kathmandu Valley, Nepal. J. Hydrol. Reg. Stud. 2019, in press. [Google Scholar]
- Verburg, P.H.; Soepboer, W.; Veldkamp, A.; Limpiada, R.; Espaldon, V.; Mastura, S.S.A. Modeling the spatial dynamics of regional land use: The CLUE-S model. Environ. Manag. 2002, 30, 391–405. [Google Scholar] [CrossRef] [PubMed]
- Pontius, R.G., Jr.; Schneider, L.C. Land-cover change model validation by an ROC method for the Ipswich watershed, Massachusetts, USA. Agric. Environ. Ecosyst. 2001, 85, 239–248. [Google Scholar] [CrossRef]
- Verburg, P. The CLUE Model Hands-On Exercises Course Material (vol. 53); Institute of Environmental Studies, University of Amsterdam: Amsterdam, The Netherlands, January 2010. [Google Scholar]
- Li, C.; Sinha, E.; Horton, D.E.; Diffenbaugh, N.S.; Michalak, A.M. Joint bias correction of temperature and precipitation in climate model simulations. J. Geophys. Res. Atmos. 2014, 119. [Google Scholar] [CrossRef]
- Bajracharya, A.R.; Bajracharya, S.R.; Shrestha, A.B.; Maharjan, S.B. Climate change impact assessment on the hydrological regime of the Kaligandaki Basin, Nepal. Sci. Total Environ. 2018, 625, 837–848. [Google Scholar] [CrossRef]
- Arnold, J.G.; Srinivasan, R.; Muttiah, R.S.; Williams, J.R. Large area hydrologic modeling and assessment part I: Model development 1. J. Am. Water Resour. Assoc. 1998, 34, 73–89. [Google Scholar] [CrossRef]
- Santhi, C.; Arnold, J.G.; Williams, J.R.; Dugas, W.A.; Srinivasan, R.; Hauck, L.M. Validation of the swat model on a large rwer basin with point and nonpoint sources 1. J. Am. Water Resour. Assoc. 2001, 37, 1169–1188. [Google Scholar] [CrossRef]
- Moriasi, D.N.; Arnold, J.G.; Van Liew, M.W.; Bingner, R.L.; Harmel, R.D.; Veith, T.L. Model evaluation guidelines for systematic quantification of accuracy in watershed simulations. Am. Soc. Agric. Biol. Eng. St. Joseph Michigan 2007, 50, 885–900. [Google Scholar]
- Kumar Mishra, B.; Herath, S. Assessment of future floods in the Bagmati River Basin of Nepal using bias-corrected daily GCM precipitation data. J. Hydrol. Eng. 2014, 20, 5014027. [Google Scholar] [CrossRef]
- Shrestha, M.; Acharya, S.C.; Shrestha, P.K. Bias correction of climate models for hydrological modelling–are simple methods still useful? Meteorol. Appl. 2017, 24, 531–539. [Google Scholar] [CrossRef]
- Asia, S.; Caesar, J.; Janes, T. Regional Climate Change over South Asia. Ecosyst. Serv. Well-Being Deltas 2018, 207–221. [Google Scholar] [CrossRef] [Green Version]
- Guo-yu, R.E.N.; Bhakta, A. Climate change in the Hindu Kush Himalaya. Adv. Clim. Chang. Res. 2017, 8, 137–140. [Google Scholar]
- Sheikh, M.M.; Manzoor, N.; Ashraf, J.; Adnan, M.; Collins, D.; Hameed, S.; Manton, M.J.; Ahmed, A.U.; Baidya, S.K.; Borgaonkar, H.P.; et al. Trends in extreme daily rainfall and temperature indices over South Asia. Int. J. Climatol. 2015, 35, 1625–1637. [Google Scholar] [CrossRef]
- Karki, R.; Hasson, S.; Schickhoff, U.; Scholten, T. Rising Precipitation Extremes across Nepal. Climate 2017, 5, 4. [Google Scholar] [CrossRef]
- Bhatt, D.; Maskey, S.; Babel, M.S.; Uhlenbrook, S.; Prasad, K.C. Climate trends and impacts on crop production in the Koshi River basin of Nepal. Reg. Environ. Chang. 2014, 14, 1291–1301. [Google Scholar] [CrossRef]
Figure 1.
Location map of the study area in central Nepal.

Figure 2.
Flowchart of the methodology.

Figure 3.
Projected future land use/cover map for 2020–2050 (extracted from [29]).
Figure 3.
Projected future land use/cover map for 2020–2050 (extracted from [29]).

Figure 4.
Daily observed and simulated discharge at Khokana station, Kathmandu Valley watershed.

Figure 5.
Projected average monthly river discharge at Khokana station under various scenarios.

Figure 6.
(a) Percentage change in precipitation for representative concentration pathway (RCP)4.5, (b) Percentage change in precipitation for RCP8.5, (c) Change in average Tmax for RCP4.5, (d) Change in average Tmax for RCP8.5, (e) Change in average Tmin for RCP4.5, (f) Change in average Tmin for RCP8.5, (g) Percentage change in evapotranspiration(ET) for RCP4.5, (h) Percentage change in evapotranspiration (ET) for RCP8.5, (i) Percentage change in runoff for RCP4.5, (j) Percentage change in runoff for RCP8.5 with respect to baseline data (2010) for climate and land use/cover.


Table 1.
Sources and scales of database used in this study.
| Type of Data | Sources | Resolution | Length | Processing Tools |
|---|---|---|---|---|
| DEM | ASTER GDEM version 2 | 30 m | ArcGIS-10.2 | |
| Geology | Department of Mines and Geology | 1:50,000 | ArcGIS-10.2 | |
| Soil | Soil and Terrain Database (SOTER) | 1:1,000,000 | ArcGIS-10.2 | |
| Land Use | USGC (Land sat 5 to 8 image) | 30 | 2010–2018 | ArcGIS-10.2 |
| Climate Change (ACCESS-CSIRO-CCAM) | Collaboration for Australia Weather and Climate Research, Australian Government | 1.25×1.40625° | 1975–2099 | R-tools |
| Climate Change (CNRM-CM5) | Centre National de RecherchesMe’te’orologiques (CNRM), France | 1.4008×1.875° | 1975–2099 | R-tools |
| Climate Change (CCSM4) | National Center for Atmospheric Research (NCAR), USA | 0.9424× 1.25° | 1975–2099 | R-tools |
| River Runoff | DHM | Daily | 2000–2014 | Khokana (st no: 550.5) |
| Temperature | DHM | Daily | 2000–2014 | 5 station |
| Precipitation | DHM | Daily | 2000–2014 | 21 station |
| Relative Humidity | DHM | Daily | 2000–2014 | 7 station |
| Solar Radiation | DHM | Daily | 2000–2014 | 2 station |
| Wind Speed | DHM | Daily | 2000–2014 | 2 station |
| Population | CBoS, Nepal | 1991,2001, 2011 | ||
| Settlements | Survey Department | 1:25000 | ArcGIS-10.2 | |
| Market | Survey Department | 1:25000 | ArcGIS-10.2 | |
| Road Network | Survey Department | 1:25000 | ArcGIS-10.2 |
Table 2.
Projected changes in precipitation and temperature with respect to (w.r.t.) baseline 2007–2014.
Table 2.
Projected changes in precipitation and temperature with respect to (w.r.t.) baseline 2007–2014.
| RCP4.5 | RCP8.5 | ||||||||
|---|---|---|---|---|---|---|---|---|---|
| S1 | S2 | S3 | Annual | S1 | S2 | S3 | Annual | ||
| Change in P (%) w.r.t. baseline | Baseline * | 229 | 1127 | 160 | 1516 | 264 | 1251 | 139 | 1654 |
| 2020 | 17 | 9 | −25 | 7 | −9 | −3 | 56 | 1 | |
| 2030 | −10 | 15 | −9 | 9 | 6 | −3 | 44 | 3 | |
| 2040 | 31 | 12 | 8 | 14 | 12 | 2 | −14 | 2 | |
| 2050 | 35 | 14 | 72 | 23 | 31 | −21 | 30 | −9 | |
| Change in average Tmax (°C) w.r.t. baseline | Baseline $ | 25.10 | 27.20 | 20.25 | 24.18 | 25.22 | 27.17 | 20.72 | 24.37 |
| 2020 | 0.11 | 0.00 | 0.34 | 0.15 | 0.38 | 0.29 | 0.02 | 0.23 | |
| 2030 | 0.91 | 0.51 | 0.67 | 0.70 | 0.14 | 0.56 | 0.26 | 0.32 | |
| 2040 | 0.52 | 0.39 | 0.69 | 0.53 | 0.64 | 0.56 | 0.77 | 0.66 | |
| 2050 | 0.45 | 0.66 | 0.87 | 0.66 | 1.33 | 1.44 | 0.85 | 1.21 | |
| Change in average Tmin (°C) w.r.t. baseline | Baseline $ | 11.40 | 18.89 | 6.85 | 12.38 | 11.40 | 18.89 | 7.50 | 12.6 |
| 2020 | 0.11 | −0.02 | 0.35 | 0.15 | 0.42 | 0.18 | 0.00 | 0.19 | |
| 2030 | 0.92 | 0.27 | 0.77 | 0.65 | 0.16 | 0.34 | 0.21 | 0.24 | |
| 2040 | 0.60 | 0.23 | 0.78 | 0.54 | 0.75 | 0.34 | 0.79 | 0.63 | |
| 2050 | 0.42 | 0.42 | 0.97 | 0.60 | 1.29 | 0.90 | 0.94 | 1.04 | |
Note: * is in mm; $ is in °C; S1 is pre-monsoon (March–May); S2 is monsoon (June–September); S3 is post-monsoon (October–February).
Table 3.
Statistical indicator performance of daily and monthly discharges.
| Items | Calibration Daily (2002–2010) | Calibration Monthly | Validation Daily (2011–2014) | Validation Monthly | ||||
|---|---|---|---|---|---|---|---|---|
| Obs | Sim | Obs | Sim | Obs | Sim | Obs | Sim | |
| Mean Discharge | 16.13 | 13.57 | 16.02 | 13.50 | 12.69 | 12.50 | 12.62 | 12.44 |
| Minimum Discharge | 1.20 | 0.91 | 2.39 | 3.01 | 0.03 | 0.69 | 1.07 | 1.39 |
| Maximum Discharge | 814.00 | 653.70 | 107.76 | 63.53 | 369.00 | 185.80 | 67.72 | 40.93 |
| R2 | - | 0.87 | - | 0.96 | - | 0.60 | - | 0.79 |
| NSE | - | 0.80 | - | 0.83 | - | 0.60 | - | 0.76 |
| PBIAS | - | 0.16 | - | 0.16 | - | 0.02 | - | 0.01 |
In table, Obs stands for observed and Sim stands for simulated values.
Table 4.
Impacts of climate change on hydrology considering baseline data of 2010. S1 is pre-monsoon season (March–May); S2 is monsoon season (June–September); and S3 is post-monsoon season (October–February).
Table 4.
Impacts of climate change on hydrology considering baseline data of 2010. S1 is pre-monsoon season (March–May); S2 is monsoon season (June–September); and S3 is post-monsoon season (October–February).
| Precipitation (%) | Evapotranspiration (%) | Water Yield (Runoff) (%) | ∆ Storage (%) | ||||||||||||||
|---|---|---|---|---|---|---|---|---|---|---|---|---|---|---|---|---|---|
| S1 | S2 | S3 | Annual | S1 | S2 | S3 | Annual | S1 | S2 | S3 | Annual | S1 | S2 | S3 | Annual | ||
| RCP4.5 | 2020 | 17 | 9 | −25 | 7 | 1 | −2 | −9 | −2 | 43 | 15 | −3 | 12 | 303 | 7 | 14 | −15 |
| 2030 | −10 | 15 | −9 | 9 | 1 | −3 | 2 | −1 | 6 | 16 | 11 | 15 | −1264 | 38 | 25 | 7 | |
| 2040 | 31 | 12 | 8 | 14 | 8 | −1 | 0 | 2 | 69 | 22 | 12 | 23 | 644 | −2 | 7 | −11 | |
| 2050 | 35 | 14 | 72 | 23 | 9 | 0 | 4 | 3 | 85 | 27 | 45 | 37 | 513 | −4 | 2 | 2 | |
| RCP8.5 | 2020 | −9 | −3 | 56 | 1 | −3 | −1 | 3 | −1 | 2 | −5 | 24 | 1 | −100 | 4 | −6 | 6 |
| 2030 | 6 | −3 | 44 | 3 | 4 | −1 | 3 | 1 | 40 | −3 | 13 | 3 | −100 | −2 | −12 | 11 | |
| 2040 | 12 | 2 | −14 | 2 | 8 | −2 | −6 | 0 | 36 | 2 | −3 | 4 | −34 | 6 | 3 | −1 | |
| 2050 | 31 | −21 | 30 | −9 | 10 | −4 | −1 | 1 | 80 | −25 | −9 | −14 | 23 | −32 | −31 | −2 | |
Table 5.
Impacts of land use/cover change on hydrology considering baseline data of 2010. S1 is pre-monsoon season (March–May); S2 is monsoon season (June–September); and S3 is post-monsoon season (October–February).
Table 5.
Impacts of land use/cover change on hydrology considering baseline data of 2010. S1 is pre-monsoon season (March–May); S2 is monsoon season (June–September); and S3 is post-monsoon season (October–February).
| Precipitation (%) | Evapotranspiration (%) | Water Yield (Runoff) (%) | ∆ Storage (%) | |||||||||||||
|---|---|---|---|---|---|---|---|---|---|---|---|---|---|---|---|---|
| S1 | S2 | S3 | Annual | S1 | S2 | S3 | Annual | S1 | S2 | S3 | Annual | S1 | S2 | S3 | Annual | |
| 2020 | - | - | - | - | −9 | −15 | −10 | −13 | 27 | 17 | 10 | 16 | 5 | −5 | 1 | −13 |
| 2030 | - | - | - | - | −12 | −16 | −11 | −14 | 28 | 23 | 0 | 18 | −11 | −11 | −8 | −15 |
| 2040 | - | - | - | - | −15 | −16 | −12 | −15 | 28 | 30 | −11 | 19 | −28 | −18 | −17 | −17 |
| 2050 | - | - | - | - | −17 | −16 | −13 | −16 | 29 | 35 | −21 | 21 | −42 | −24 | −26 | −19 |
Table 6.
Combined impacts of climate change and land use/cover change on hydrology considering baseline data of 2010. S1 is pre-monsoon season (March–May); S2 is monsoon season (June–September); and S3 is post-monsoon season (October–February).
Table 6.
Combined impacts of climate change and land use/cover change on hydrology considering baseline data of 2010. S1 is pre-monsoon season (March–May); S2 is monsoon season (June–September); and S3 is post-monsoon season (October–February).
| Precipitation (%) | Evapotranspiration (%) | Water Yield (Runoff) (%) | ∆ Storage (%) | ||||||||||||||
|---|---|---|---|---|---|---|---|---|---|---|---|---|---|---|---|---|---|
| S1 | S2 | S3 | Annual | S1 | S2 | S3 | Annual | S1 | S2 | S3 | Annual | S1 | S2 | S3 | Annual | ||
| RCP4.5 | 2020 | 17 | 9 | −25 | 7 | 14 | 6 | 65 | 17 | 42 | −15 | −34 | −15 | −713 | 81 | 6 | 576 |
| 2030 | −10 | 15 | −9 | 9 | −1 | 6 | 75 | 14 | 15 | −8 | −39 | −11 | −1565 | 84 | −10 | 645 | |
| 2040 | 31 | 12 | 8 | 14 | 2 | −11 | 45 | 2 | 66 | −4 | −20 | 9 | −49 | 52 | −14 | 537 | |
| 2050 | 35 | 14 | 72 | 23 | 13 | 9 | 71 | 19 | 87 | 4 | −2 | 12 | 53 | 39 | −33 | 583 | |
| RCP8.5 | 2020 | −9 | −3 | 56 | 1 | 8 | 6 | 84 | 18 | 12 | −29 | −14 | −23 | −243 | 77 | −20 | 713 |
| 2030 | 6 | −3 | 44 | 3 | 17 | 7 | 76 | 21 | 34 | −25 | −25 | −21 | −198 | 61 | −29 | 681 | |
| 2040 | 12 | 2 | −14 | 2 | 14 | 7 | 59 | 17 | 41 | −14 | −47 | −18 | −112 | 50 | −25 | 619 | |
| 2050 | 31 | −21 | 30 | −9 | 12 | 5 | 58 | 15 | 81 | −38 | −49 | −32 | 10 | −5 | −57 | 496 | |
Table 7.
Percentage change in river runoff due to projected changes in climate only, land use/cover (LULC) only, and combination of both changes in Kathmandu Valley watershed.
Table 7.
Percentage change in river runoff due to projected changes in climate only, land use/cover (LULC) only, and combination of both changes in Kathmandu Valley watershed.
| 1. | Scenario | Seasons | 2020 | 2030 | 2040 | 2050 |
|---|---|---|---|---|---|---|
| CC Only | RCP4.5 | S1 | 43 | 6 | 69 | 85 |
| S2 | 15 | 16 | 22 | 27 | ||
| S3 | −3 | 11 | 12 | 45 | ||
| Annual | 12 | 15 | 23 | 37 | ||
| RCP8.5 | S1 | 2 | 40 | 36 | 80 | |
| S2 | −5 | −3 | 2 | −25 | ||
| S3 | 24 | 13 | −3 | −9 | ||
| Annual | 1 | 3 | 4 | −14 | ||
| LULC Only | S1 | 27 | 28 | 29 | 30 | |
| S2 | 17 | 23 | 30 | 35 | ||
| S3 | 10 | 0 | −11 | −21 | ||
| Annual | 16 | 18 | 19 | 21 | ||
| Combined LULC + CC | RCP4.5 | S1 | 42 | 15 | 66 | 87 |
| S2 | −15 | −8 | −4 | 4 | ||
| S3 | −34 | −39 | −20 | −2 | ||
| Annual | −15 | −11 | 9 | 12 | ||
| RCP8.5 | S1 | 12 | 34 | 41 | 81 | |
| S2 | −29 | −25 | −14 | −38 | ||
| S3 | −14 | −25 | −47 | −49 | ||
| Annual | −23 | −21 | −18 | −32 |
© 2019 by the authors. Licensee MDPI, Basel, Switzerland. This article is an open access article distributed under the terms and conditions of the Creative Commons Attribution (CC BY) license (http://creativecommons.org/licenses/by/4.0/).
Share and Cite
MDPI and ACS Style
Lamichhane, S.; Shakya, N.M. Integrated Assessment of Climate Change and Land Use Change Impacts on Hydrology in the Kathmandu Valley Watershed, Central Nepal. Water 2019, 11, 2059. https://doi.org/10.3390/w11102059
AMA Style
Lamichhane S, Shakya NM. Integrated Assessment of Climate Change and Land Use Change Impacts on Hydrology in the Kathmandu Valley Watershed, Central Nepal. Water. 2019; 11(10):2059. https://doi.org/10.3390/w11102059
Chicago/Turabian StyleLamichhane, Suraj, and Narendra Man Shakya. 2019. "Integrated Assessment of Climate Change and Land Use Change Impacts on Hydrology in the Kathmandu Valley Watershed, Central Nepal" Water 11, no. 10: 2059. https://doi.org/10.3390/w11102059
Note that from the first issue of 2016, this journal uses article numbers instead of page numbers. See further details here.