Seasonal and Annual Rainfall Variability and Their Impact on Rural Water Supply Services in the Wami River Basin, Tanzania


1
United Nations University Institute for Integrated Management of Material Fluxes and of Resources (UNU-FLORES), Ammonstrasse 74, 01067 Dresden, Germany
2
Institute for Cartography, Technische Universität Dresden, 01062 Dresden, Germany
*
Author to whom correspondence should be addressed.
Water 2019, 11(10), 2055; https://doi.org/10.3390/w11102055
Submission received: 16 August 2019
/
Revised: 27 September 2019
/
Accepted: 28 September 2019
/
Published: 1 October 2019
(This article belongs to the Section Water Use and Scarcity)
Abstract
:In some parts of Africa, rainfall variability has resulted in widespread droughts and floods, thus posing a substantial challenge to water availability in rural areas, especially drinking water. Therefore, due to increasing water demands, increases in the population, and economic development, water supply systems are under constant stress. One of the critical uncertainties surrounding the effects of rainfall variability in Africa is the significant impact that it imposes on rural water supply services. The present study analyzes the trends in annual and seasonal rainfall time series in the Wami River Basin to see if there have been any significant changes in the patterns during the period 1983–2017 and how they affect the access to water supply services in rural areas. The study analyzes the trends of rainfall series of three stations using simple regression, Mann–Kendal Test and Sen’s Slope Estimator. The water point mapping datasets were analyzed considering seasonal variation. The analysis showed a statistically significant positive trend in annual rainfall at Kongwa and March–April–May (MAM) seasonal rainfall at Dakawa. The maximum increase in annual rainfall occurred at Kongwa (5.3 mm year−1) and for MAM seasonal data at Dakawa (4.1 mm year−1). Water points were found to be significantly affected by seasonal changes, both in terms of availability and quality of water. There also exists a strong relationship between rural water services and seasons.
1. Introduction
Rainfall is the most critical meteorological phenomenon on earth for the natural environment and human life, making it the most vital ecological factor [1]. In several parts of Africa, rainfall variability has resulted in widespread droughts and floods, thus posing a substantial challenge to water availability [2]. Though water supply systems are under constant stress due to growing water demands, economic development, and increases in the population [3], one of the critical concerns surrounding the effects of rainfall variability in Africa is the significant impact that it imposes on rural water supply services [4]. Water is a requirement for human existence and changes in its supply can potentially have significant consequences, mainly in rural areas, where the population depends on local rivers for their water supply [5].
Rainfall is directly connected with global climate change and is subject to variability. Therefore, rainfall trend analysis at different temporal and spatial scales is a vital concern [6,7]. Worldwide climate change has evident wide-ranging impacts on natural resources, including freshwater ecosystems [8]. Its devastating impacts are agreed upon among researchers and policy-makers worldwide but the extent of exposure to different regions of the biosphere differs [9]. According to the Intergovernmental Panel on Climate Change (IPCC) Report [6], the rural underprivileged in developing countries are the most exposed to the effects of climate change. Climate change will cause an intensification of rainfall variability, thus resulting in river flow fluctuations and a higher frequency of droughts or floods [10,11,12,13,14,15,16]. The increased or decreased annual rainfall in various areas affects the annual and seasonal runoff and hence, water quality, water supply, and flood hazards [17].
Previous studies have highlighted the connection between rainfall variability and water access, as well as demand and quality. According to Calow et al. [18], during the drought season, access to safe drinking water can be a critical problem because of water access, availability, and limitations and control of water usage. Seasonal variations in rainfall affect the availability of water, while eco-social processes may affect access [19]. Moreover, some studies demonstrate that contamination varies with season and a clear trend for fecal contamination appears to be more common during the wet season [20]. Several studies on the influence of rainfall variability on water resources in Africa (e.g., [21,22,23,24,25,26]) have been conducted, so far, information on the effects of seasonal and annual rainfall variability in rural water supply services is still lacking.
Rainfall variability plays a significant role in several disciplines. For example, in engineering, variability in time and magnitude influence the designing of structures for different uses including hydropower, irrigation, and water supply [27]. Water supply comprises the provision of drinking water, domestic use, and irrigation while its availability is controlled by universal water distribution [28]. Water managers have to continuously deal with annual, seasonal, and daily changes in rainfall, lake levels, stream flows, and other features of the water cycle [29,30]. Their ability to adapt to the predictability of climatic variability is a crucial factor contributing to their achievement [31]. Therefore, an evaluation of historical trends on rainfall inconsistency at a local scale is essential for managing water supply services [32], especially in the Wami River Basin.
The quantity or availability of water for various purposes is very much dependent on the amount of rain. Furthermore, water supply depends on the accessibility of source and amount of water, which directly depends on rainfall variability and processes that include when and where the rain will fall. There is inadequate evidence signifying the extent of the impact on the rural water supply services, as well as the essential movements to be considered to deal with the impact. Moreover, the available evidence about the level of impact and essential adaptation measures is limited and inconclusive. Hence, the current study analyzes the trends in annual and seasonal rainfall time series in the Wami River Basin of Northern Tanzania to find out if there have been any significant changes in the patterns during the period 1983–2017 and if so, how they have affected access to rural water supply services.
2. Methods and Data
2.1. Study Area
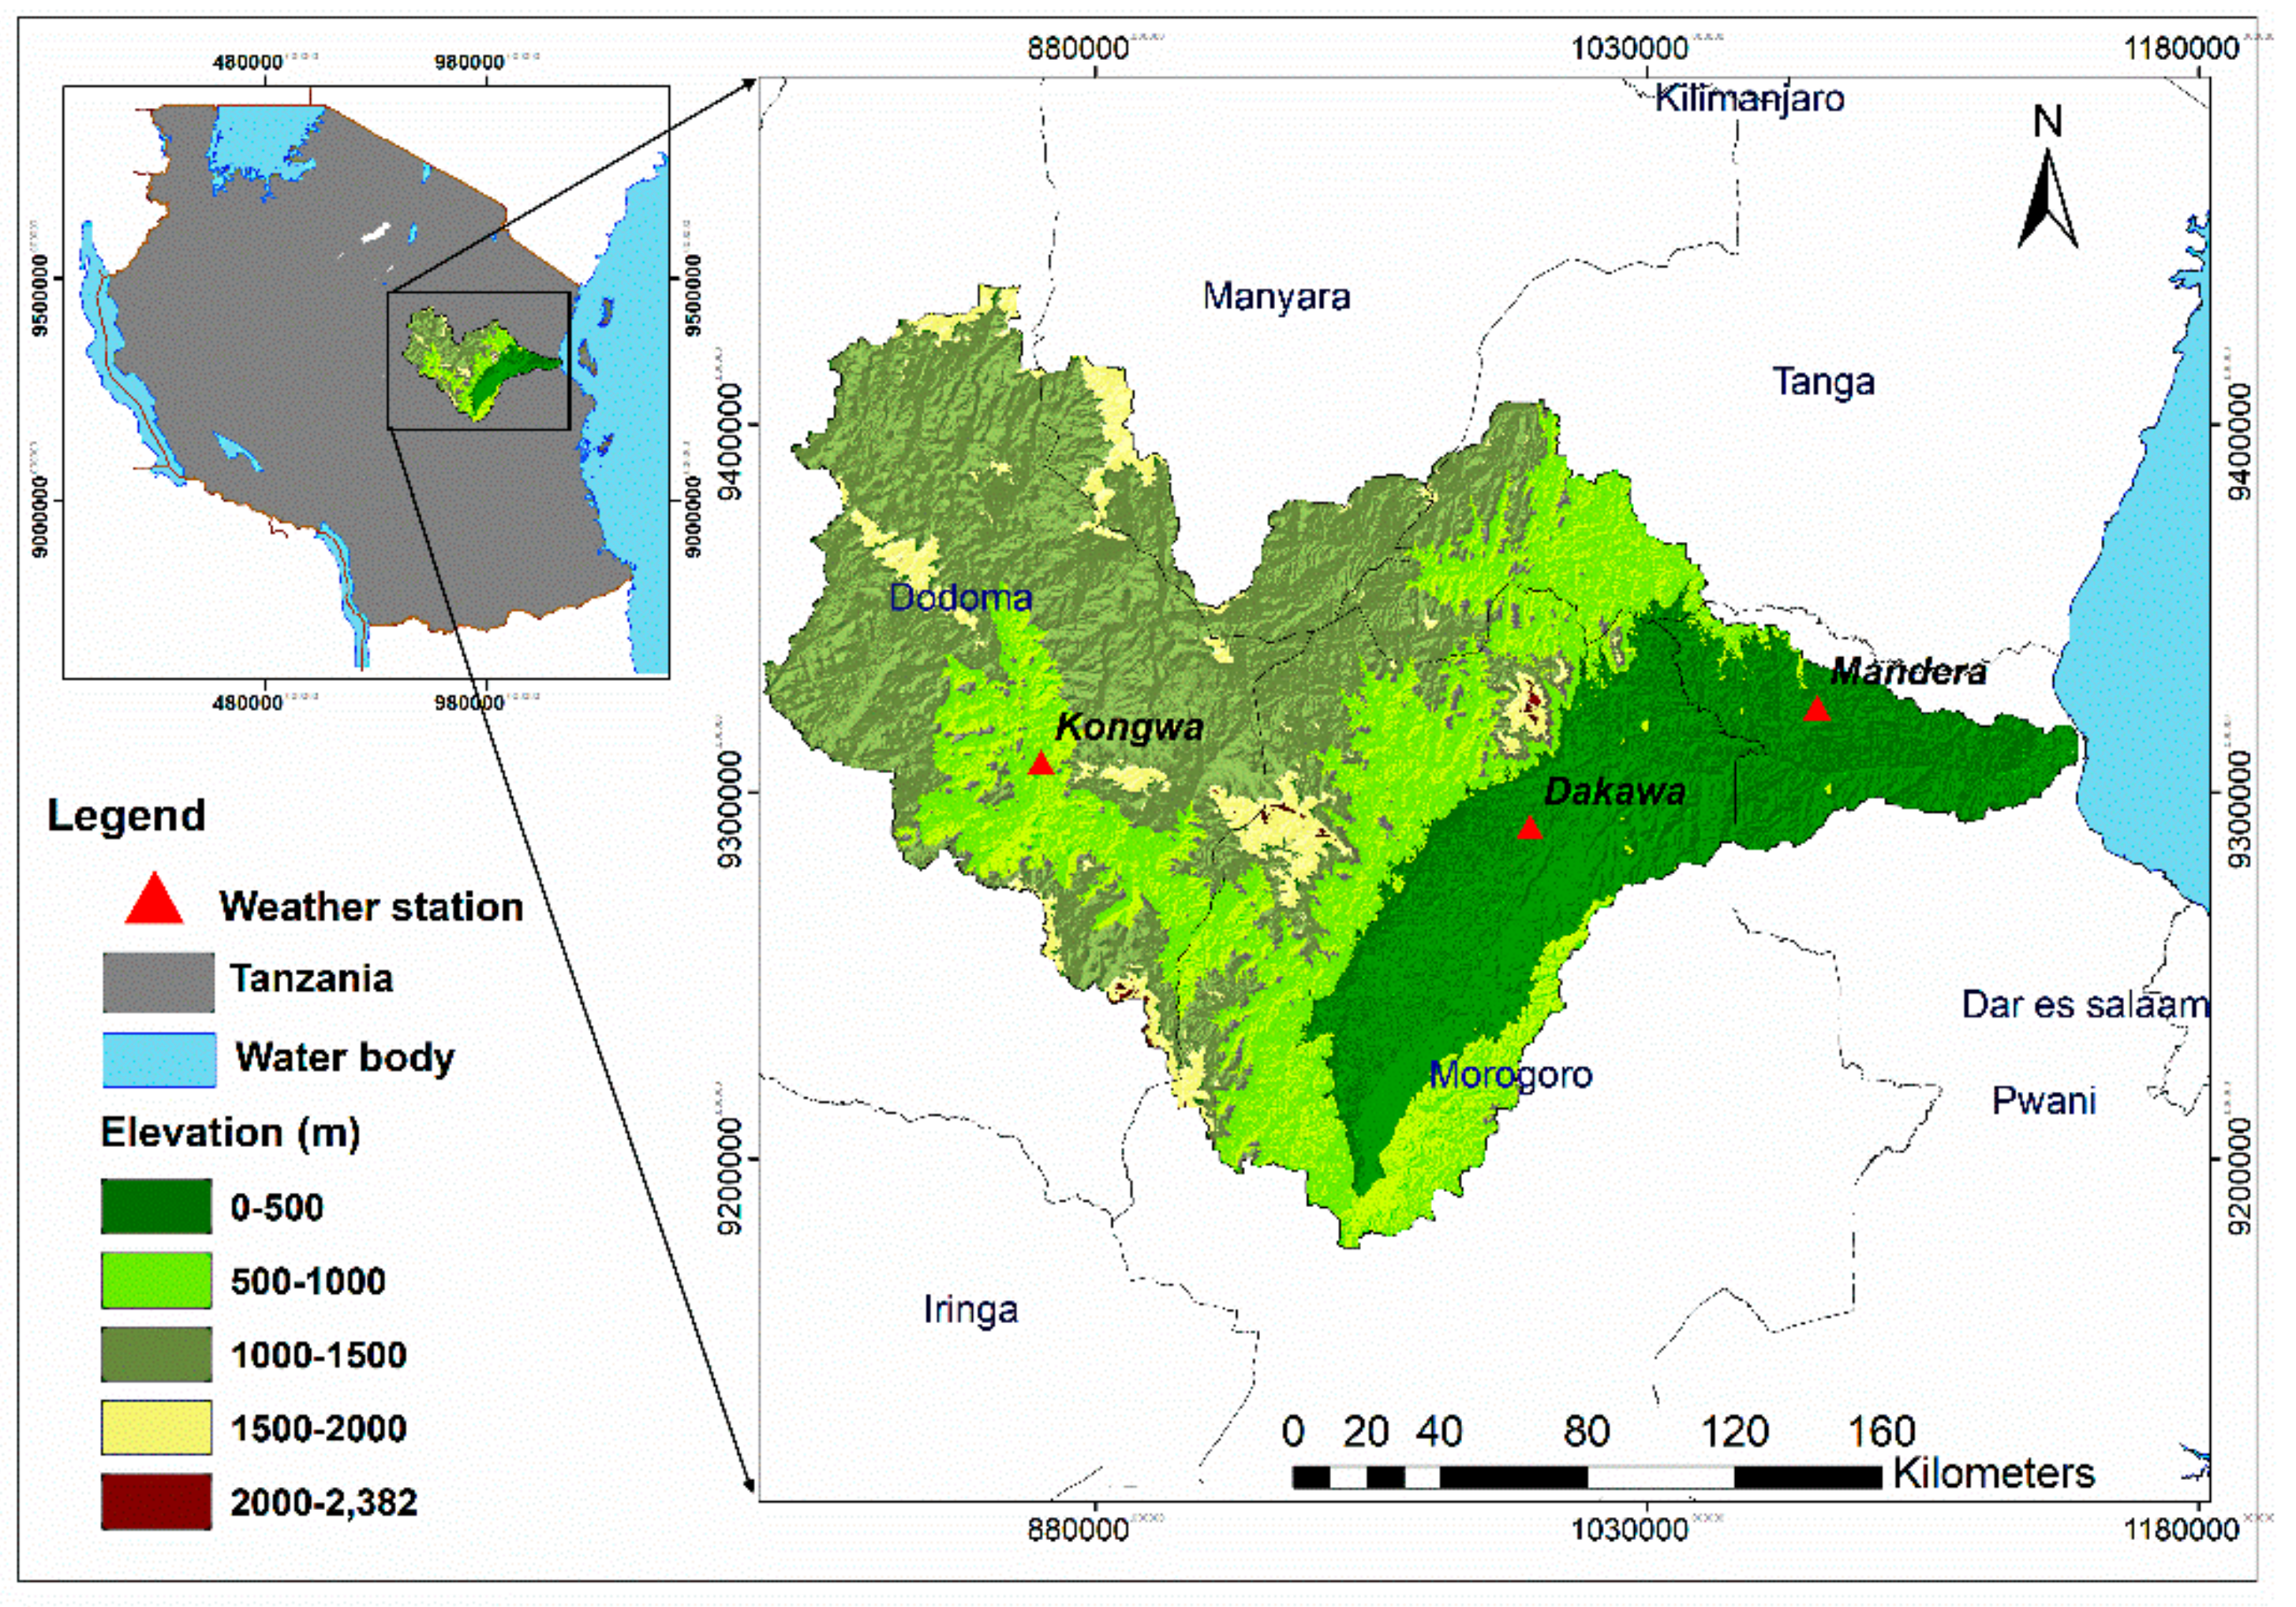
The Wami River Basin (Figure 1) is located between 5° to 7° S and 36° to 39° E. It covers the semi-arid areas in central Tanzania via the humid inland swamps in east-central Tanzania to the Indian Ocean and spans an area of 41,167 km2. The relief of the Wami River Basin ranges from sea level 2 m to 2370 m. The average rainfall in the basin ranges from 550 mm to 1000 mm per annum. There are two rainfall regions in the basin [33]:
- The unimodal rainfall region covers the western and south-western parts [one wet period lasts November–December–January–February–March–April (NDJFMA)] and;
- The bimodal rainfall region includes the eastern and north-eastern part of the basin [two wet periods: October–November–December (OND) and March–April–May (MAM)].
The population of the Wami/Ruvu Basin is estimated to amount to 9.9 million based on the 2012 national population census. According to the inventory survey conducted within a project of the Japan International Cooperation Agency (JICA) [34], the total population in the Wami/Ruvu Basin in 2035 is forecasted to be 12.58 million, of which 7.39 million (59%) will be urban, and 5.20 million (41%) will be rural residents.
2.2. Data and Methods
The total monthly rainfall data series (1983–2017) of Kongwa, Dakawa, and Mandera were obtained from the Tanzania Meteorological Agency. The data were used to compute the annual and seasonal rainfall trends. The present study analyzes the trends of rainfall series of each station using simple regression, Mann–Kendal Test, and Sen’s Slope Estimator. Parametric and non-parametric approaches are commonly used to study trends in datasets. For this study, Sen’s Slope Estimator [35] was used to examine the extent of the trend in the time series, while the Mann–Kendall (MK) test [36,37] was used to analyze the significance of the trend in the seasonal and annual rainfall data series. All statistical analyses of annual and seasonal rainfall data were carried out using XLSTAT software and an Excel spreadsheet.
Data from the Water Point Mapping System (WPMS) (http://wpm.maji.go.tz/), which is managed by the Ministry of Water, Tanzania, were used to analyze the seasonal variation of water points in the Wami River Basin. The data were downloaded on August 2016. Information regarding three typologies of water points was selected. These include water point functionality, water quantity, and water quality. Only water points whose sources are from surface water were considered. Water point data exported from the WPMS to a spreadsheet were subsequently saved as a comma-separated value (CSV) file. During fieldwork in both the dry (August to September 2016) and wet seasons (March to April 2017), a total of 356 water points were verified. Then, an analysis of Water Point Mapping (WPM) data considering the aspects of water quality, water quantity, and status was performed using Quantum Geographical Information System (QGIS) software.
Primary data were collected from different sources using questionnaires, oral interviews, and personal observations. A total of 60 surveys were randomly distributed over the water-points. All 60 questionnaires were filled out by the respondents. Oral interviews were conducted with officials of the local government who had a historical understanding of the subject matter, including those who could not read or write. The data obtained were presented in the tables of frequencies and percentage. Secondary data, such as the amount of water supplied from the intake and other appropriate information, were collected from the Local Government Authorities (Kongwa and Chalinze) and literature.
2.2.1. Statistical Test for Trend Analysis
Trend analysis is a very useful and essential tool for projecting and managing water resources. Trend investigation of hydrological variables, such as precipitation and discharge offer evidence for the possibility of variation of the variables in the future [38]. In the current study, simple regression (parametric) and non-parametric methods (Sen’s Slope Estimator and Mann–Kendall) were used to analyze the trends in annual and seasonal rainfall. The advantages of non-parametric testing include the following [39]:
- These statistics are considered to work with a dataset that has more substantial variances;
- They can be useful for interval, ordinal, nominal, and ratio data;
- The test is not affected, even if the deviation of the dataset is extreme;
- The test can be successfully applied to the skewed dataset.
Simple Linear Regression
The simple linear regression model is one of the most suitable parametric models to detect the trend. The approach of linear regression involves an assumption of constant variance, normality of residuals and accurate linearity of relationship [40]. The simple linear regression model can be defined as follow:
where t is time (year), a is slope coefficient, and b is the least-squares estimate of the intercept.
The slope coefficient shows the yearly average rate of variation in the hydrologic characteristic. When the slope is significantly changed from zero, statistically, it is rational to interpret that there is a real variation happening over time. The symbol of the slope describes the direction of the trend of the variable, decreasing if the sign is negative and increasing if the sign is positive.
Significance of Trend
The Mann–Kendall (MK) test is a non-parametric test [36,37] which has been identified as one of the unique approaches to study monotonic trends in hydrological variables. The MK test tests the monotonic significance (increasing or decreasing) trends in hydrological variables and is frequently used to study trends in time series dataset [41]. It is one of the most appropriate ways to evaluate rainfall trend and one advantage is that it does not need normally distributed dataset [41,42]. The MK statistics (S) can be defined as follows:
where n represents the sample size, Xj and Xk are consecutive data for kth and jth terms, and
The statistic S is treated as normally distributed when n ≥ 18 with zero mean and variance is given by:
When there are bonds in the data, the Var(S) is calculated as follows:
where n represents the number of tied groups and represents the sum of all dataset in the kth tied group with a similar value. The standardized Z-statistics is computed as:
Magnitude of Trend
For the analysis, the trend magnitude present in the hydrological time series data, the slope estimator (β) explained by [35,43] was used. If the computed value of β is positive, it shows an increasing trend, while a negative value indicates a decreasing trend [44,45]. For all the dataset, the slope (Ti) was computed as follows:
where and represent the dataset values at time and , respectively.
The median of this value of is Sen’s Slope Estimator, which is calculated as follows:
The computed value of is studied by a two-sided test at the confidence interval. When the value is positive, then it shows an increasing trend, and a negative value indicates a decreasing trend.
2.2.2. Water Point Mapping System
The Water Point Mapping (WPM) approach was designed by the international NGO Water Aid to measure access indicators for improved water points in a specific area [46]. This method has been widely used in Africa by many Non-Governmental Organisations (NGO) in many countries (i.e., Tanzania, Malawi, Ethiopia) for some years. WPM is defined as a process whereby the physical positions of all improved water points (WP) in a zone are collected including technical, management, and demographical information. This data was collected using global positioning system (GPS) and a survey located at any improved water point. The dataset was entered into a geographical information system and then linked with the available administrative, demographic, and physical data. Later using digital maps, the information was displayed [47].
According to the Ministry of Water Tanzania, water point mapping is the process of tracing water infrastructure and gathering related data using any existing technology, the data that is collected later is available to different users [48]. The dataset is entered into a geographic database and then linked with all available administrative, demographic, and physical data (Table 1). In contrast, the Water Point Mapping System is an integration of software, hardware, data, methodologies, processes, and users devoted to gathering, storing, processing and analyzing the water-related dataset and giving results for public use.
The surveys were done using local company expertise in land surveying, geographic information systems (GIS), and database development. The personnel of the company communicated the district, which allocated one person for the execution of the water point survey. The mapping team presented itself to the ward, then the subdistrict managerial level, from whom he/she obtained direction to contact village executive officers, for the survey of all improved water points in the village. The method involved taking a digital image of all surveyed water points [47].
3. Results
For the understanding and clarification of the detected trends, seasonal, and annual data for each station were calculated. Additionally, these datasets were plotted against time and trend were studied by fitting the linear regression line. The linear trend values signified by the slope of the simple least square regression providing the rate of increase/decrease in the variables. After that, the Mann–Kendall (MK) test was used to analyze the trend of statistical significance. Sen’s Slope Estimator was used to examine the extent of the trend in the time series and to verify the results of the simple regression analysis. The results of the analysis are presented in the table and graph.
3.1. The Trend of Annual and Seasonal Rainfall Data
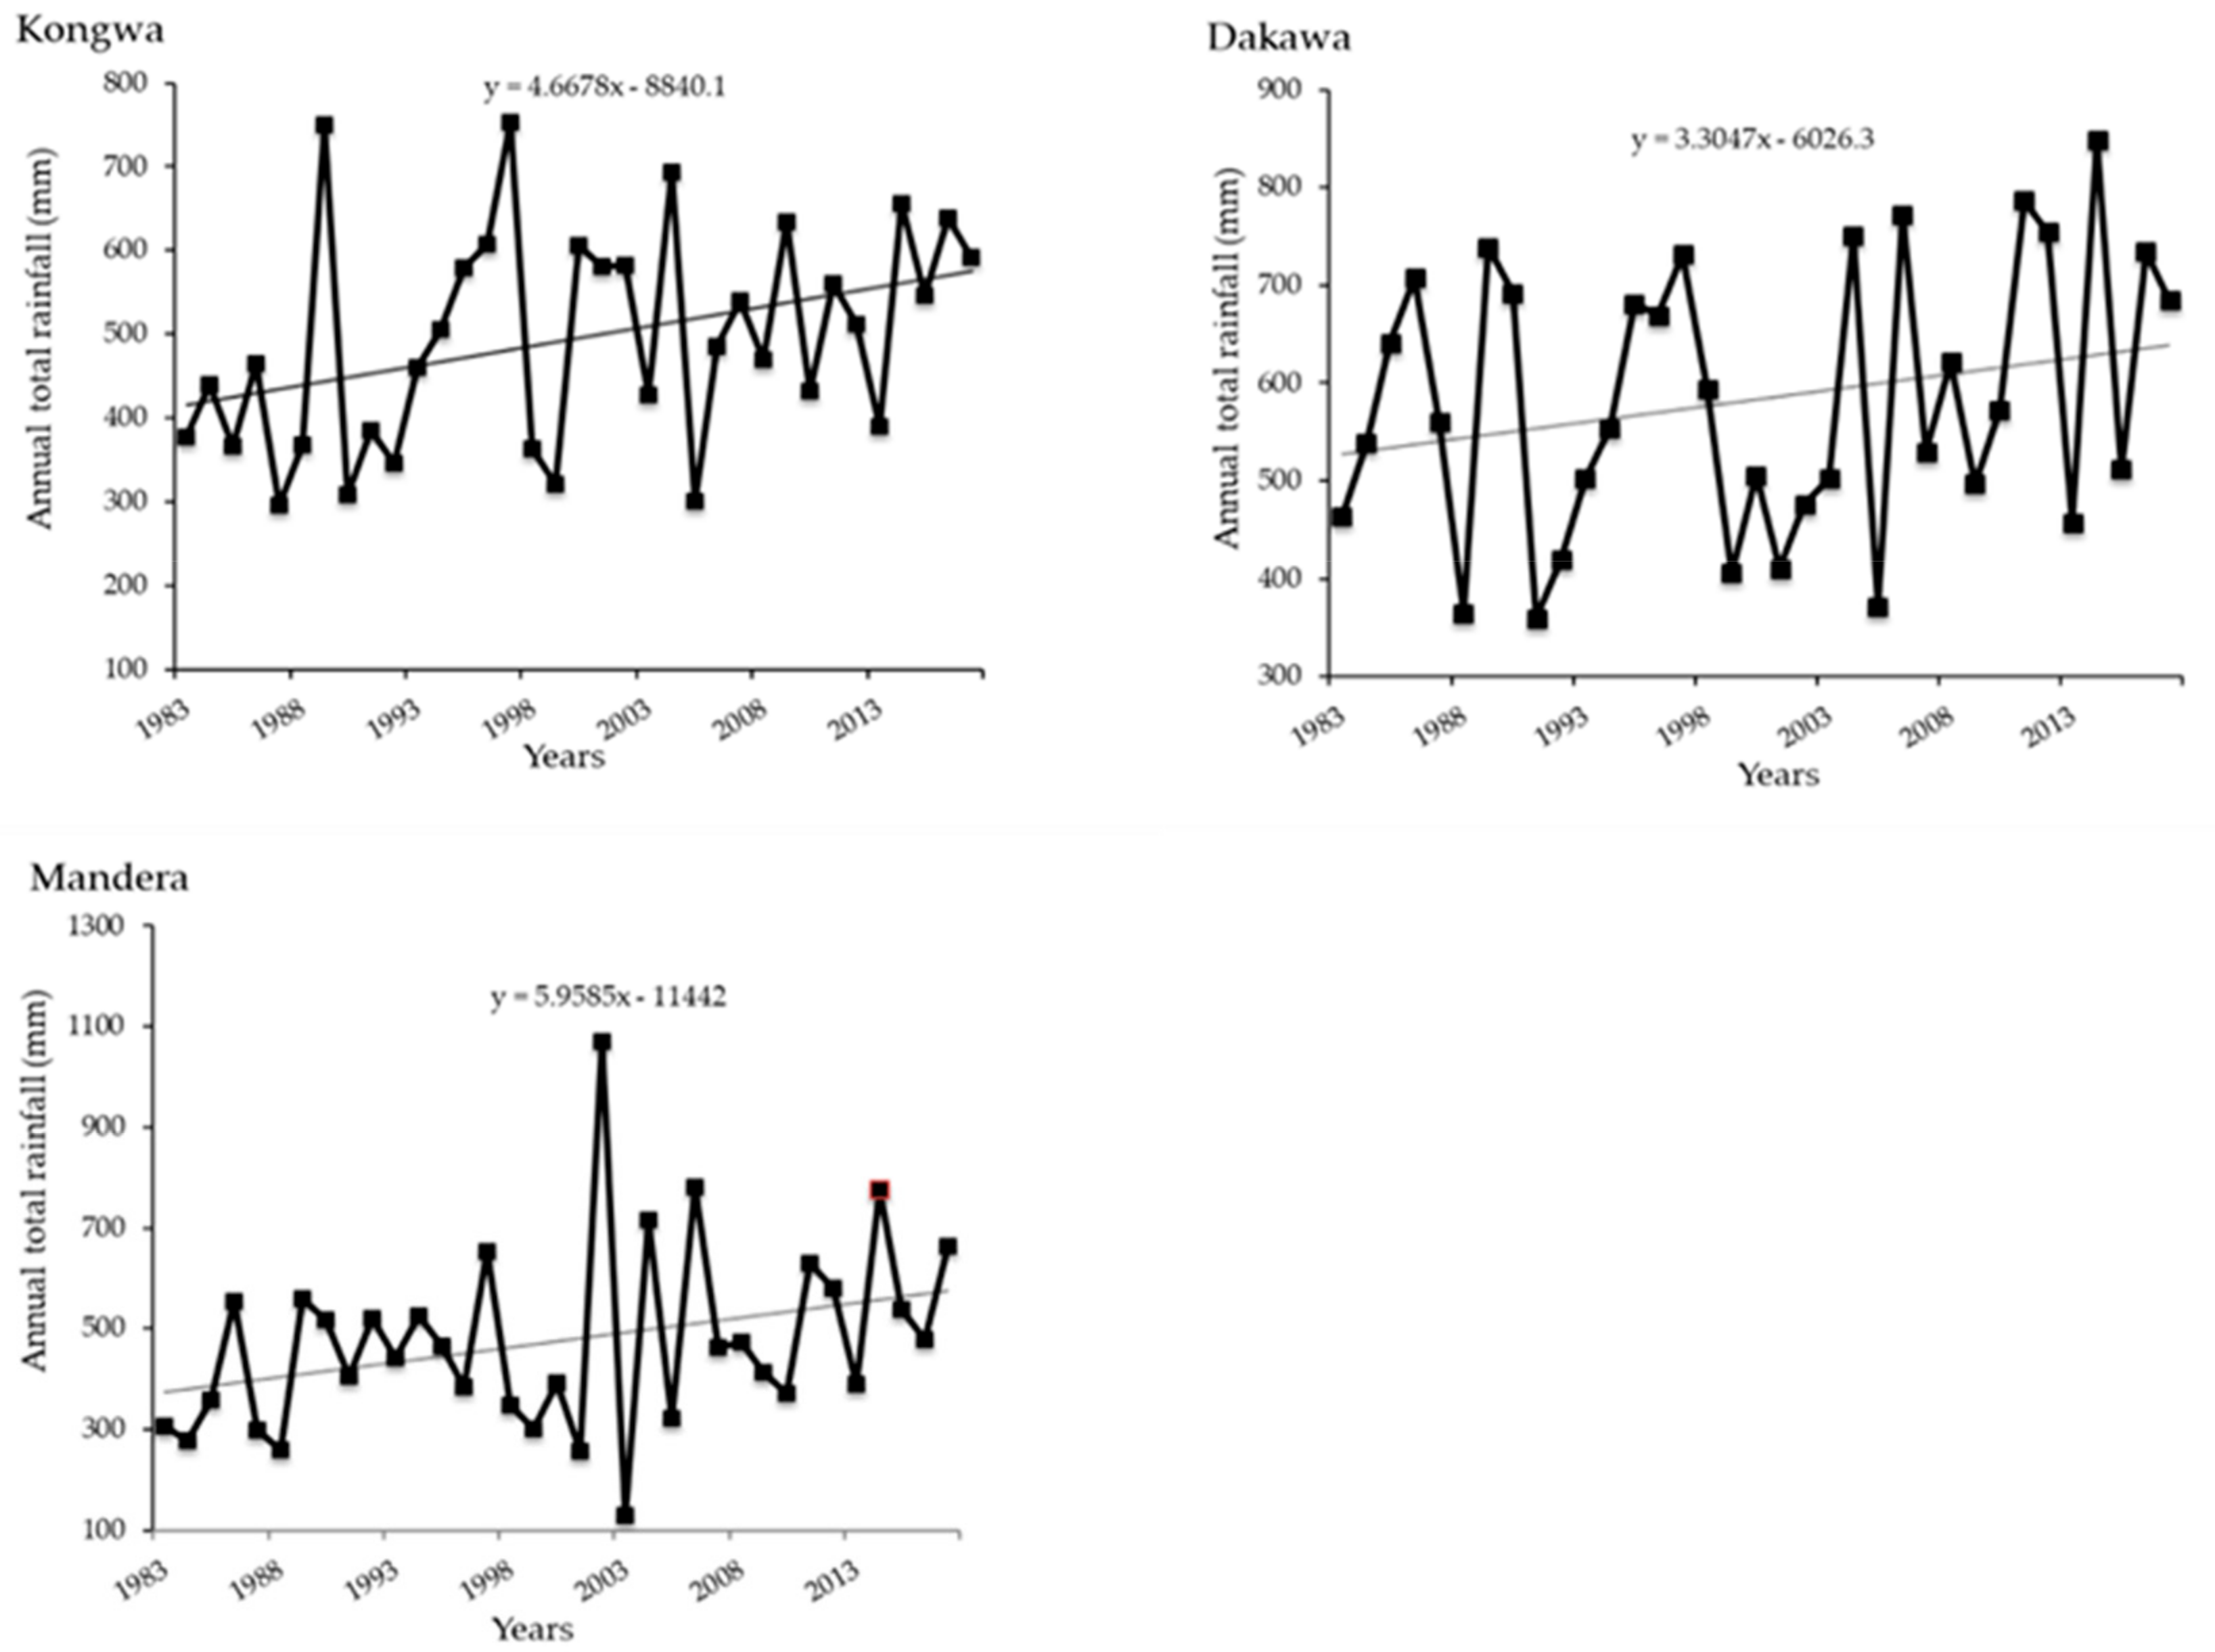
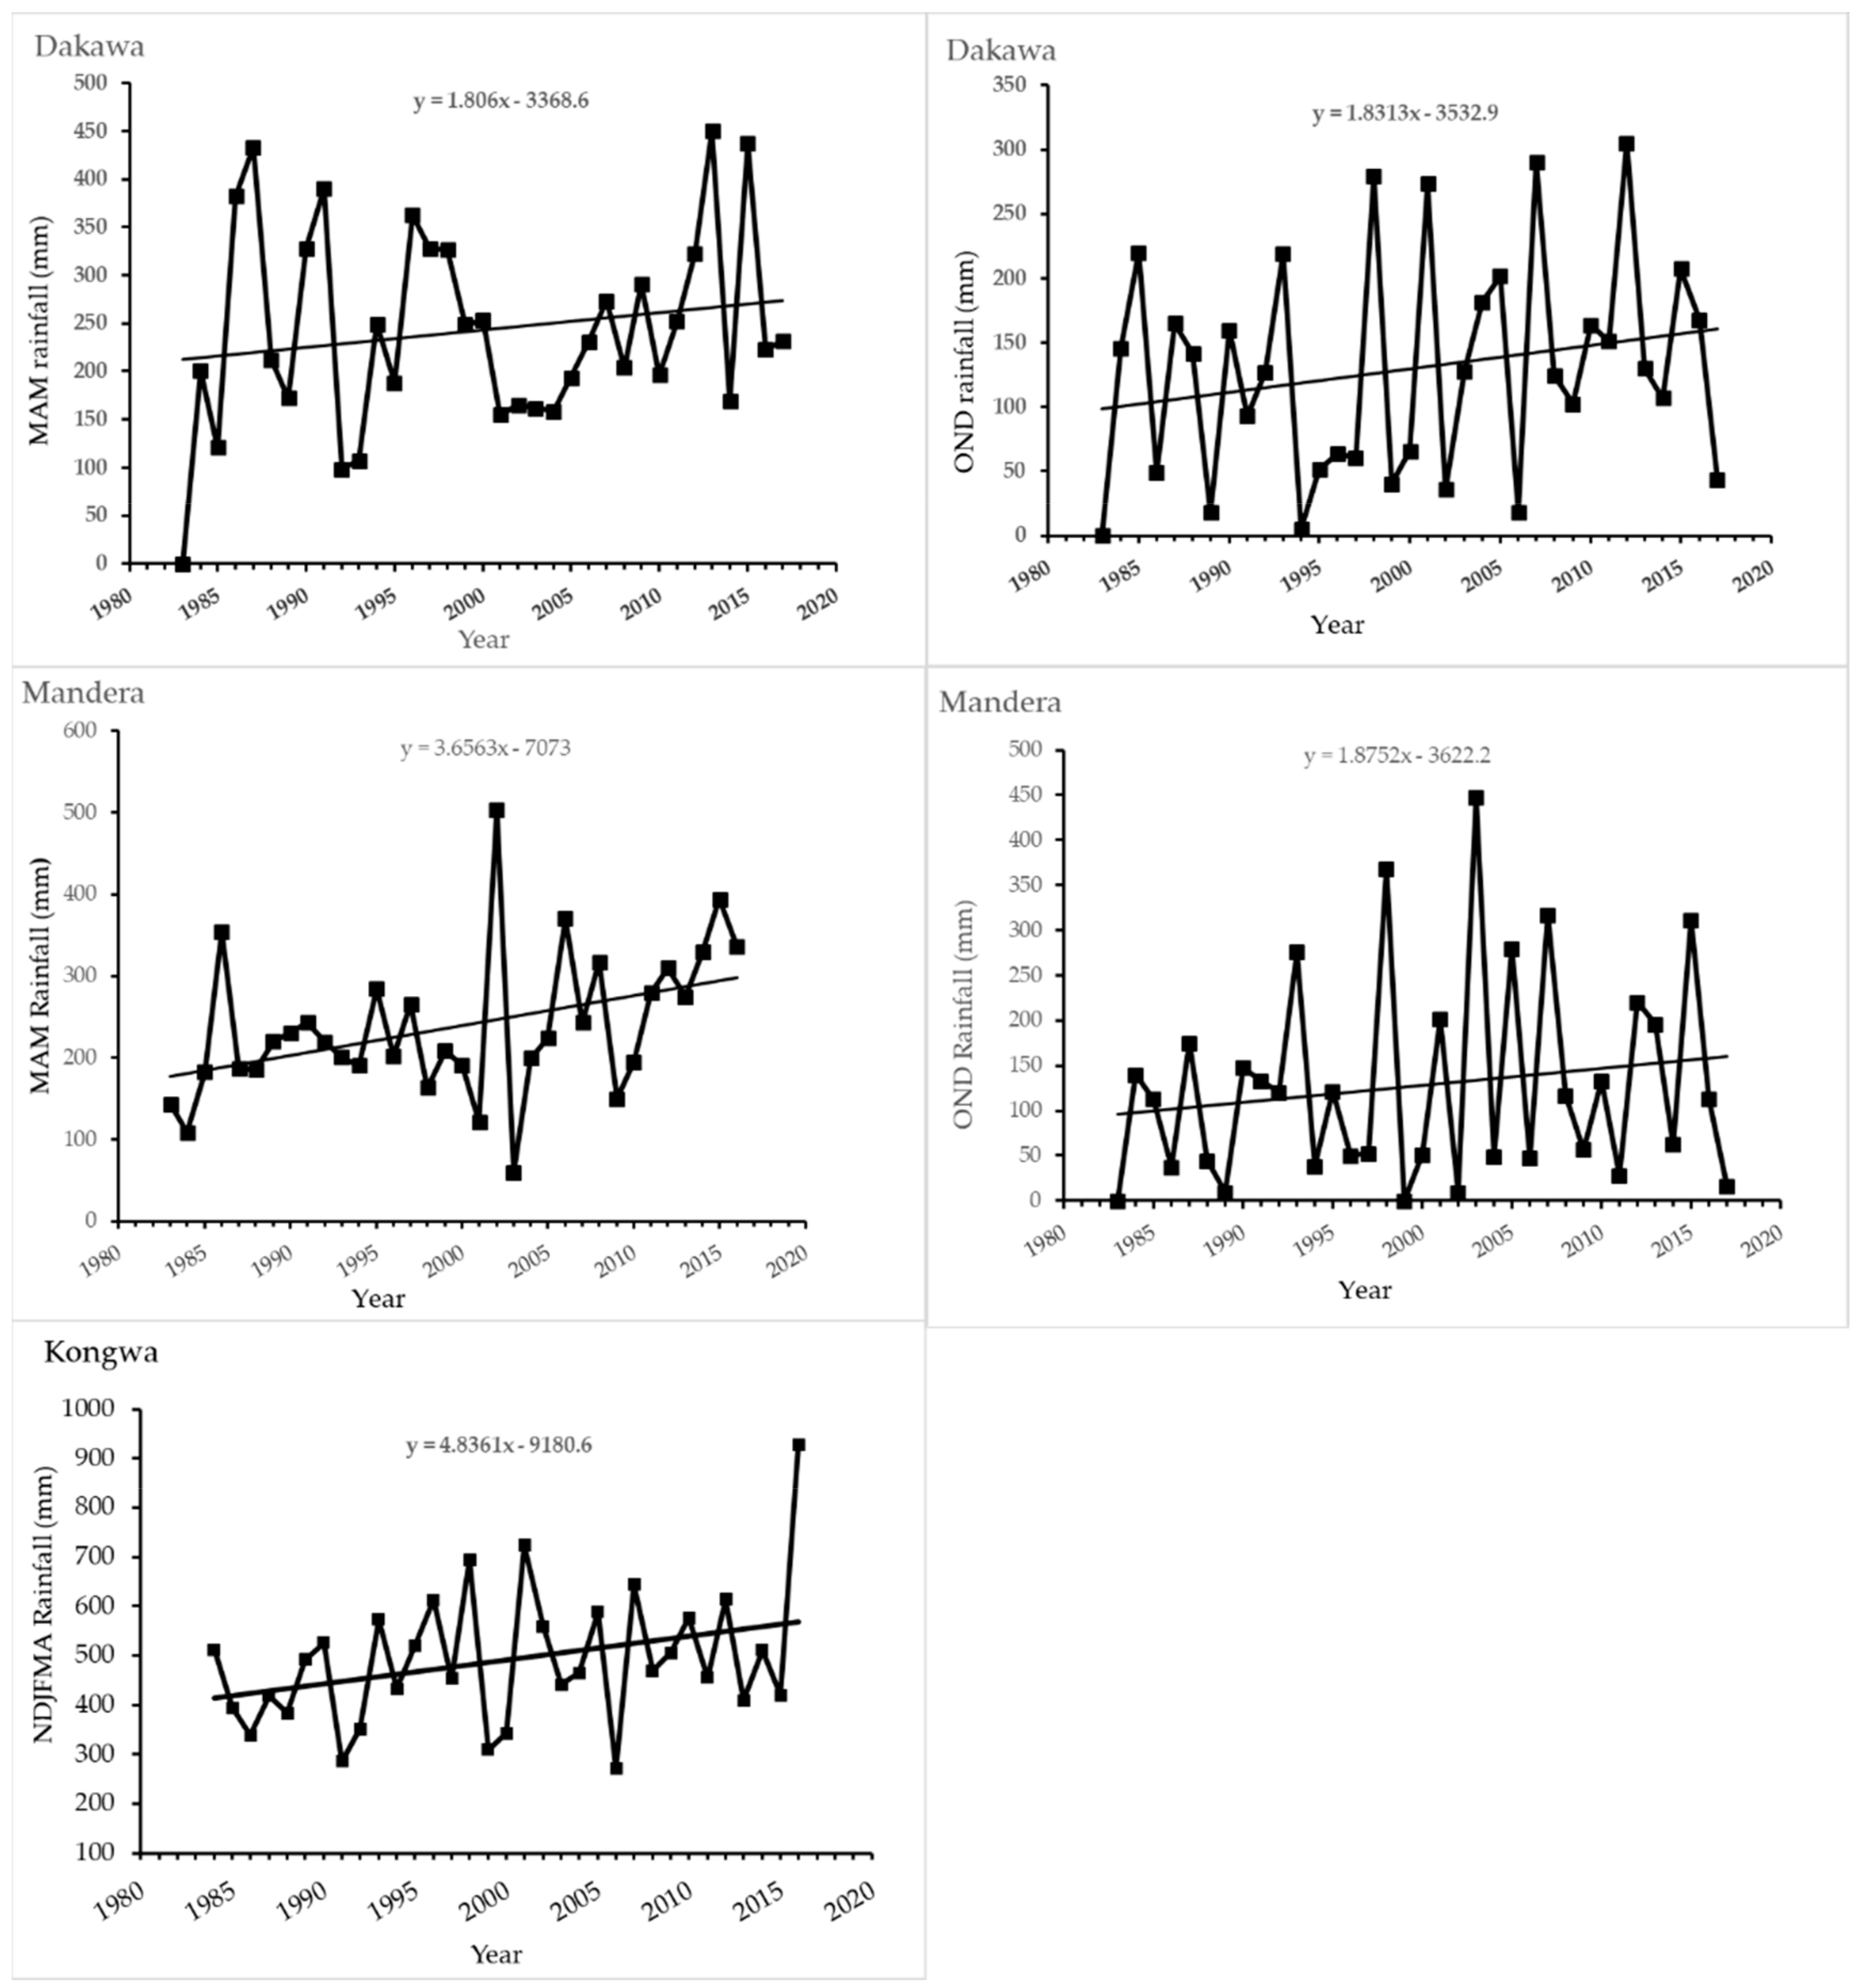
The annual and seasonal rainfall trends were examined for the three stations in the study. Figure 2 and Figure 3 show the outcome of the regression model of the seasonal and annual rainfall of the Wami River Basin for the study period. The figure shows the results of the parametric method, which displays that there is an increasing trend in all three stations. It is visible that the annual and seasonal rainfall series followed an increasing trend in all three stations.
3.2. Magnitude and Significance of Trend Analysis 1983–2017
For the analysis of a trend in the time series dataset, Sen’s Slope Estimator and the Mann–Kendall (MK) test were used in this study. A trend analysis was performed for Kongwa, Dakawa, and Mandera stations for the period from 1983 to 2017 using annual and seasonal rainfall data. The results of the p-value and Sen’s Slope Estimator were attained from analyzing the rainfall dataset for annual and seasonal rainfall of Wami River Basin (Table 2). The results of the MK test carried out for the time-series data showed positive trends for both annual and seasonal rainfall time series at a 5% significance level. The annual rainfall showed a statistically significant positive trend (p < 0.05) for Kongwa, while the yearly rainfall showed a statistically insignificant positive trend (p > 0.05) at Dakawa and Mandera stations. The seasonal rainfall showed a statistically significant positive trend (p < 0.05) for Dakawa station, while an insignificant statistical positive trend was observed for the Kongwa and Mandera station rainfall dataset.
The Mann–Kendall (Z-statistics) results for an annual and seasonal dataset for 1983–2017 are presented in Table 2. The negative and positive values of Z-statistics show increasing and decreasing trends, respectively. Only the annual rainfall at Kongwa and the MAM seasonal rainfall at Dakawa showed a significant positive trend, while the rest of the annual and seasonal rainfall showed an insignificant positive trend. In the seasonal rainfall series, the values of Z-statistics were 0.993 NDJFMA at Kongwa, 0.229 MAM and 0.019 OND at Dakawa, and 0.494 MAM and 0.017 OND at Mandera. Annual rainfall at Mandera showed the highest positive value of 0.804 for the Z-statistics, whereas, at Dakawa, the minimum positive value of 0.038 occurred.
The magnitude of the rainfall trends was analyzed using Sen’s Slope Estimator and is shown in Table 2. Seasonal and annual rainfall shows a rising rate. The maximum increase in the magnitude of rain was observed for annual rainfall with 5.3 mm per year at Kongwa and Mandera showed the least increased annual rainfall, with 3.082 mm per year. Moreover, the maximum increase in the magnitude of seasonal rainfall was observed for seasonal rainfall NDJFMA with 5.3 mm per year for Kongwa, and at Mandera, the least increased seasonal rainfall is exhibited, with 0.758 mm per year.
3.3. Dry and Wet Seasonal Variation and Use of Water Points
Table 3 highlights the percentage of distribution of water access, source of income, and primary water uses during the dry and wet seasons. About 38% of the respondents said they have access to tap water, while 62% have no access to tap water, and they depend on water from vendors and rivers. Furthermore, during the wet season, 68% of the population have access to tap water, while 32% have no access, and they obtain water from rain harvesting. The respondents were asked if water access influences their source of income and the water use pattern across the season. The result (Table 3) shows that during the dry season, farmers (66%) and pastoralists (85%) are most affected. Moreover, all main water uses show significant changes during the dry season, with 78%, 95%, and 98% for domestic use, livestock, and house gardening, respectively. During this period, most of the pastoralists with many cattle move from the village to other areas with enough water, while house gardening is not practiced due to water scarcity.
3.3.1. Dry and Wet Seasonal Variation of Water Point Status
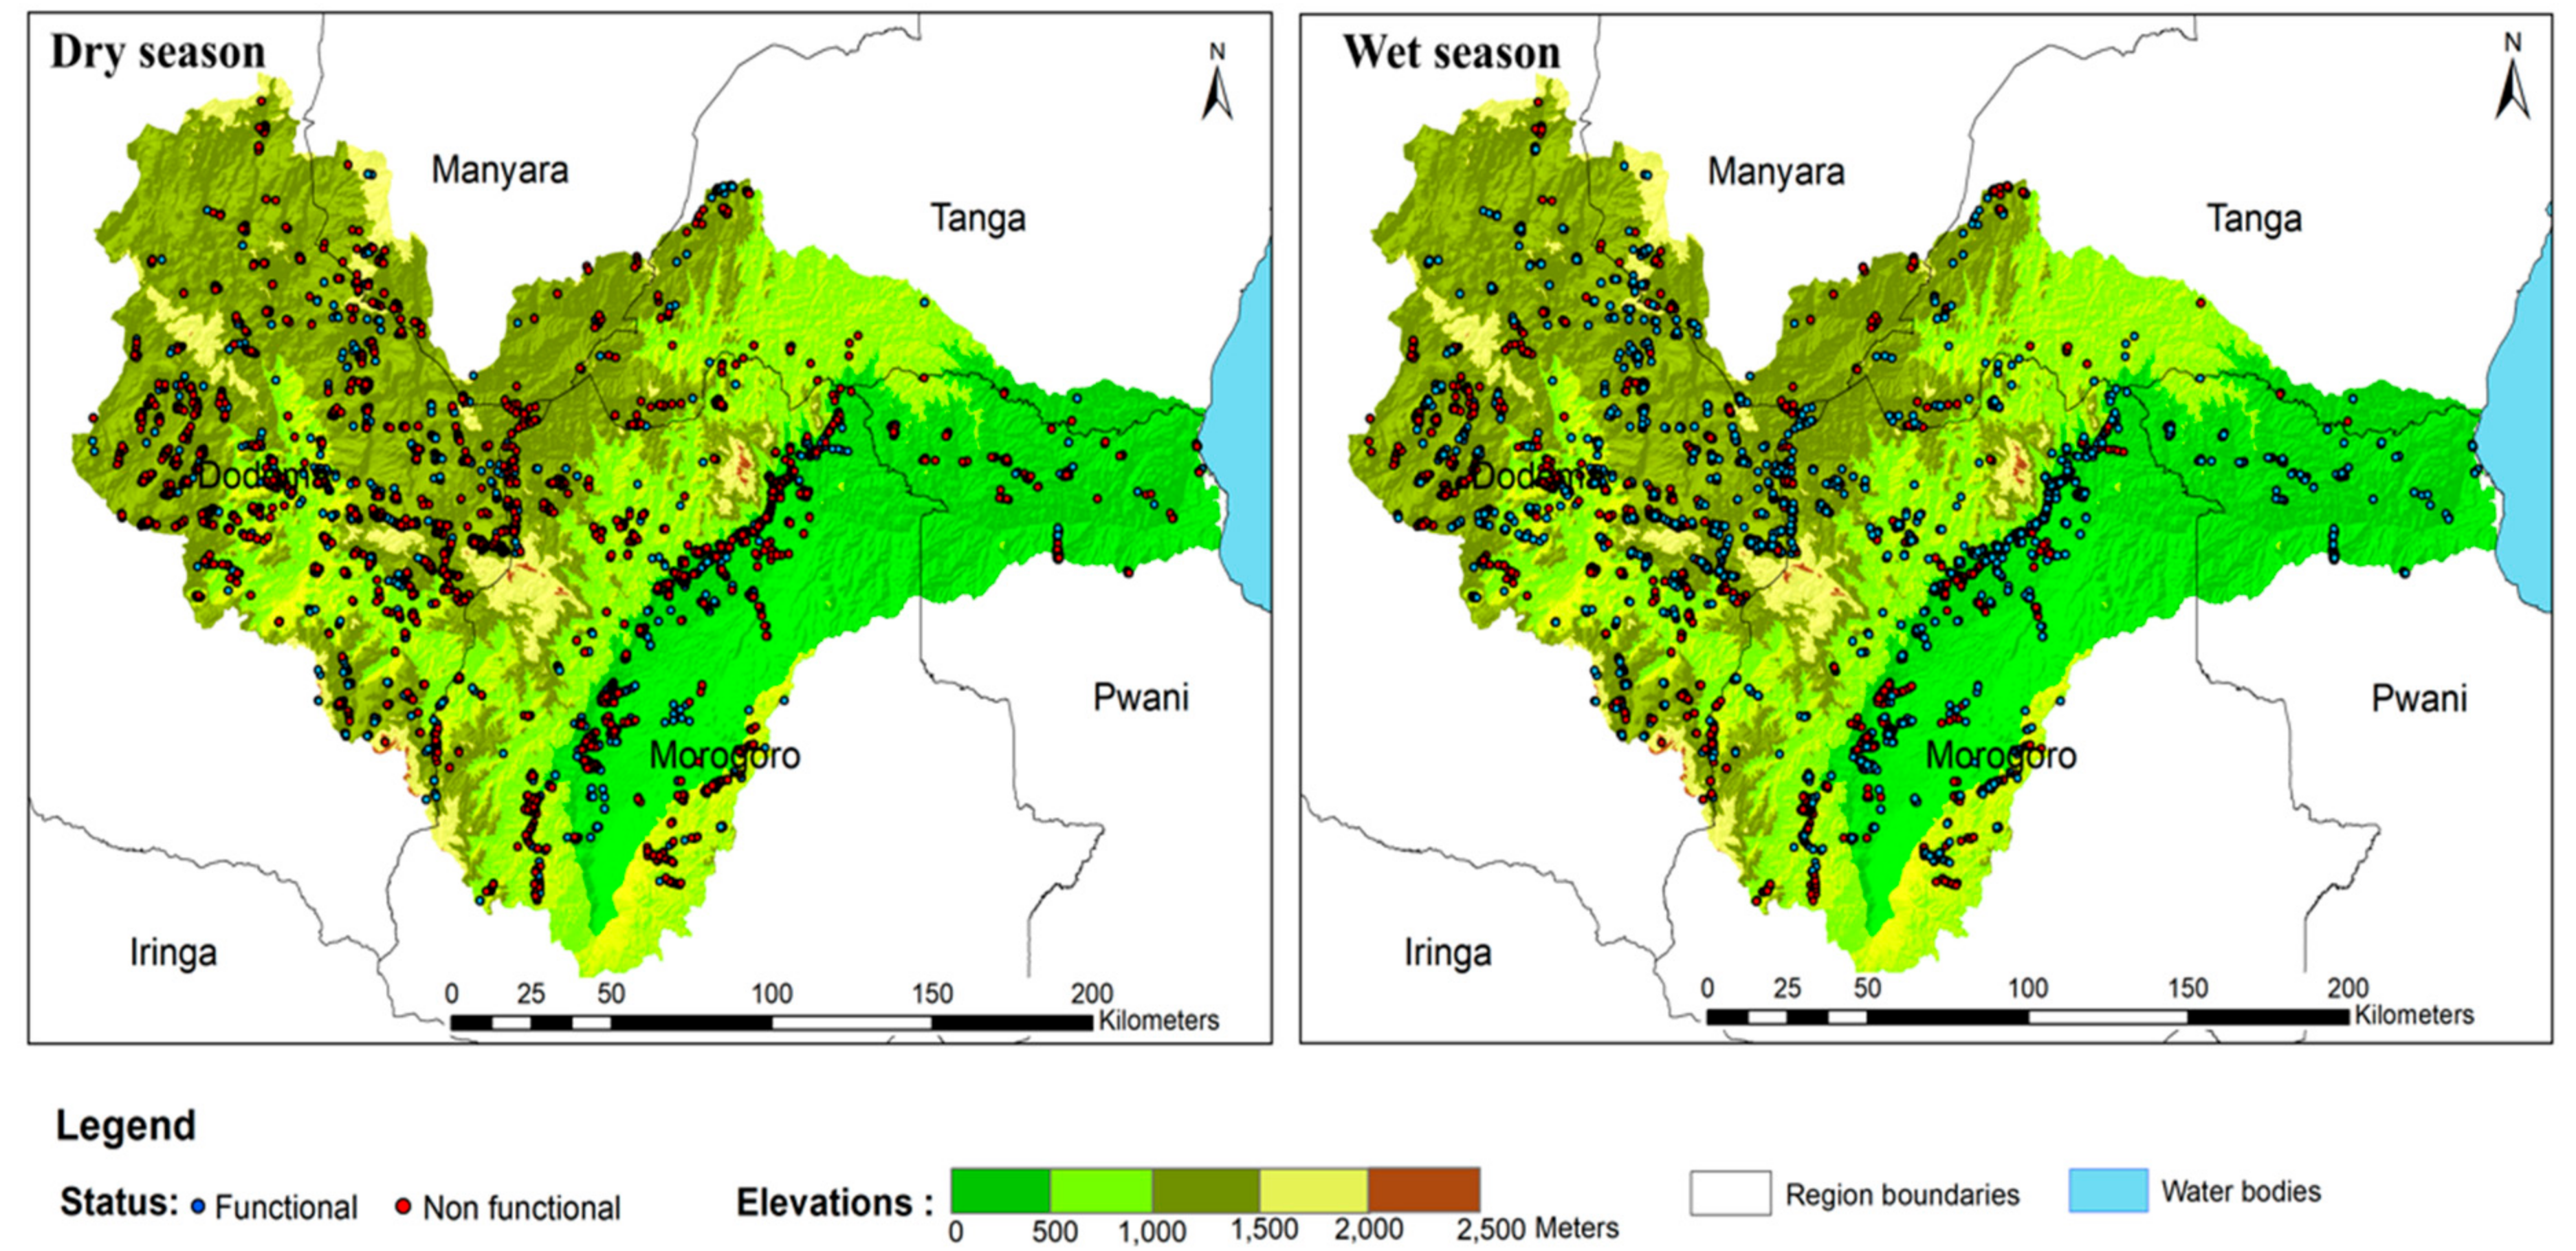
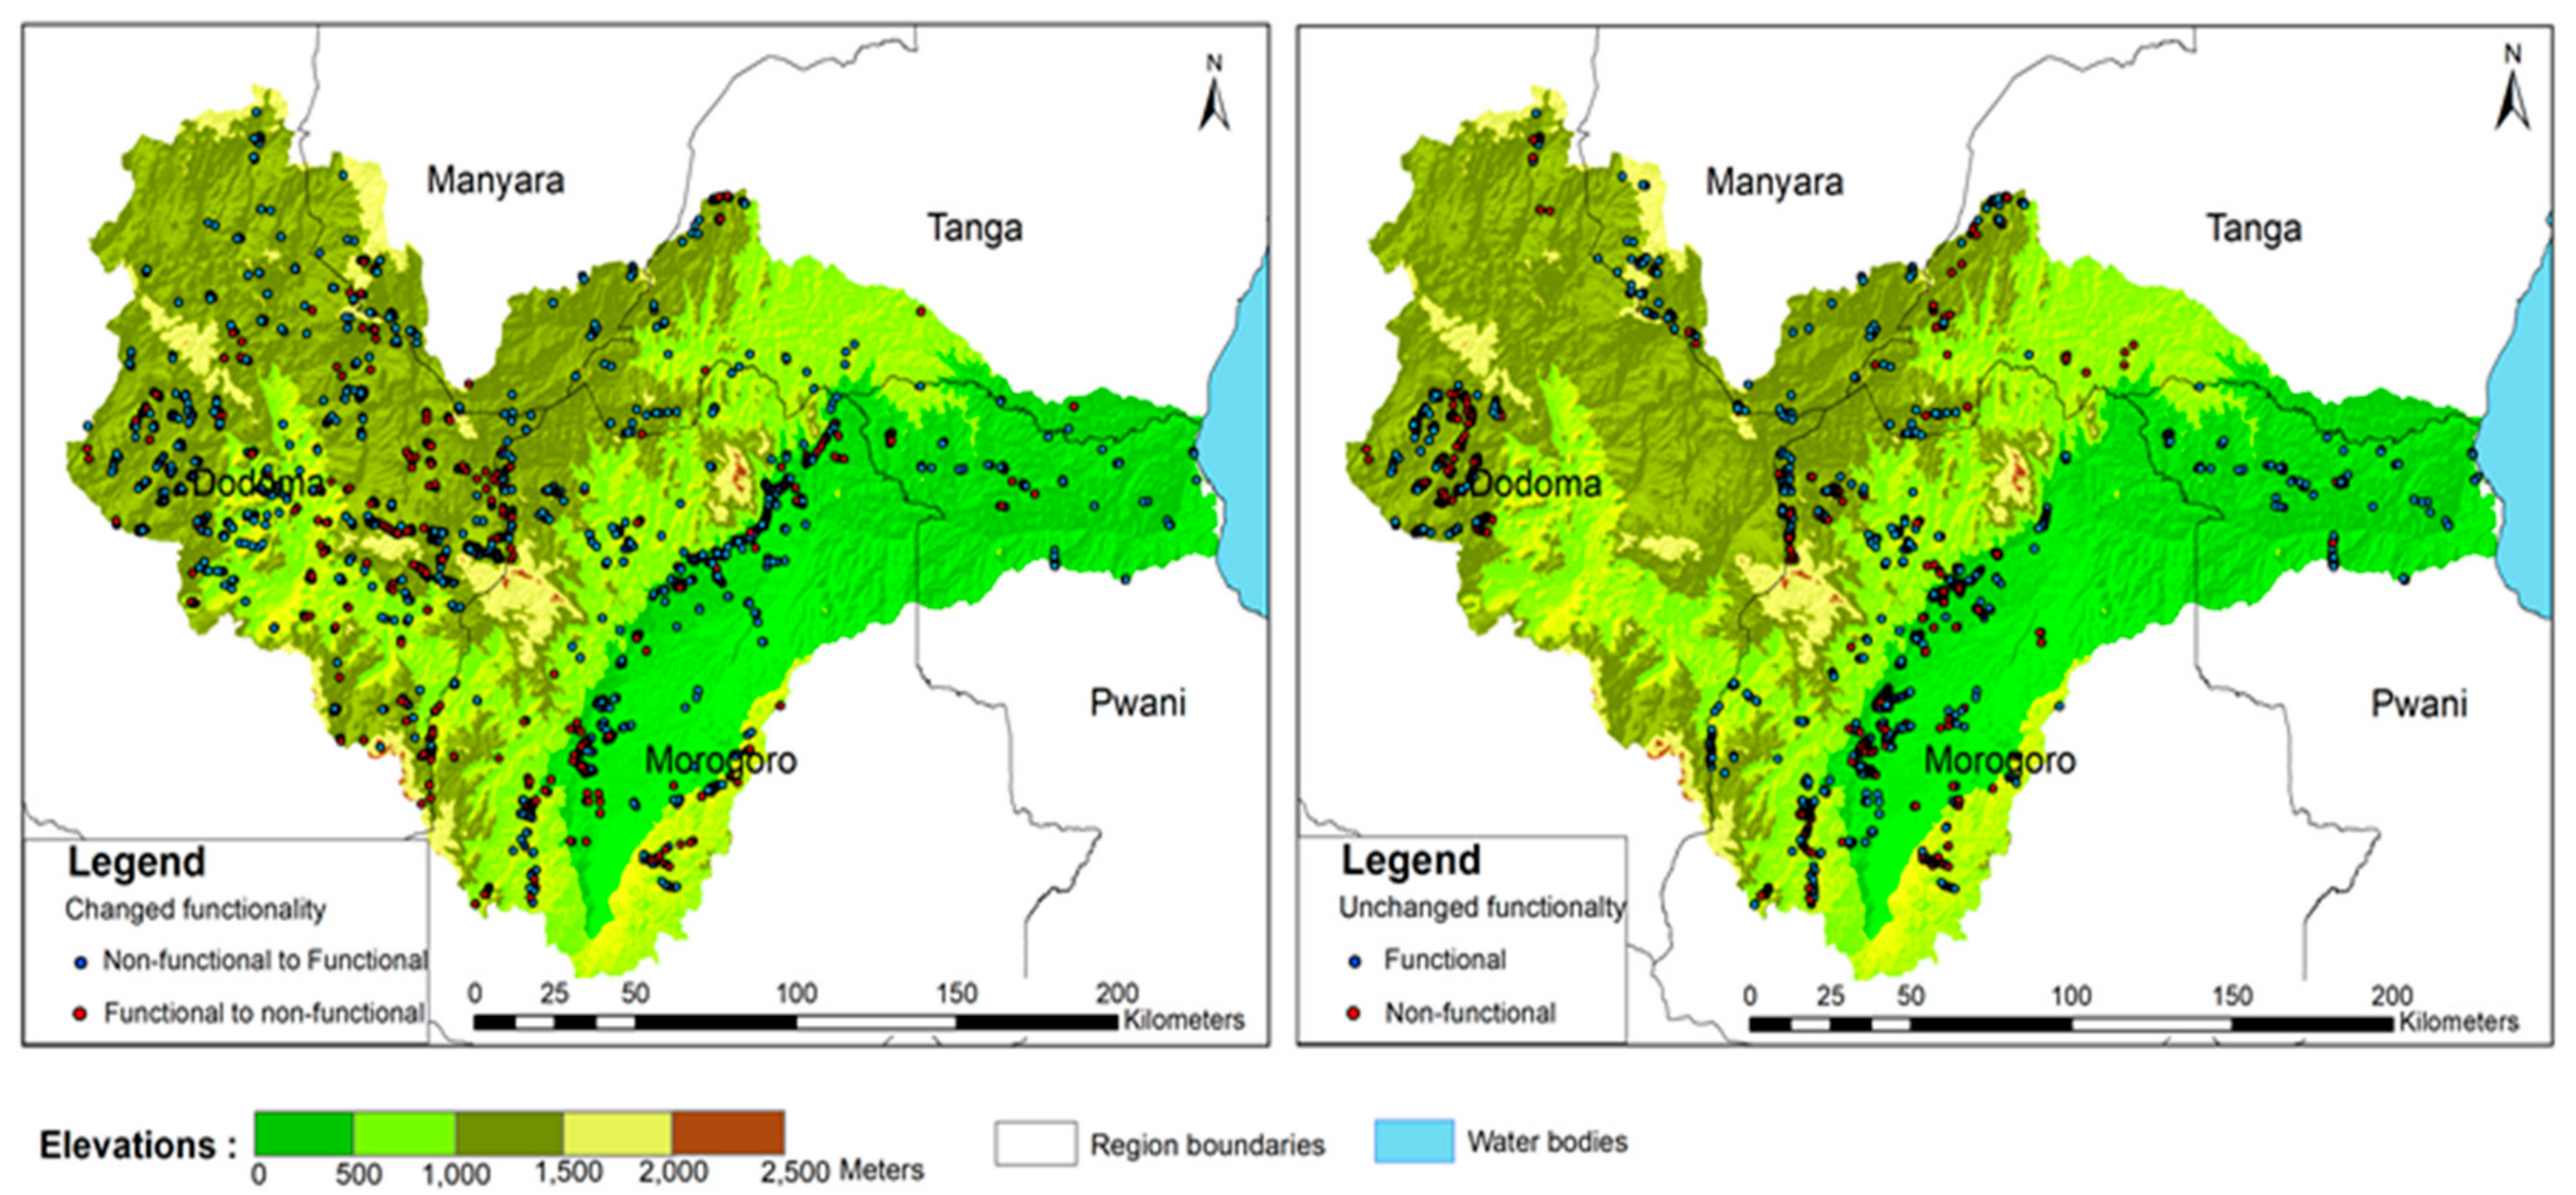
Waterpoint status was found to be substantially affected by seasonal changes (Figure 4 and Figure 5). The results show that 67% of the water points are not functioning during the dry season, while only 33% function. However, during the wet season, only 51% function, while 49% are not operating, with many water points changing from the non-functional during the dry season to functional during the wet season (Table 4). Additionally, 18% of the water points change from being functional to non-functional and vice versa, seasonally.
3.3.2. Dry and Wet Seasonal Variation of Water Quantity at Water Points
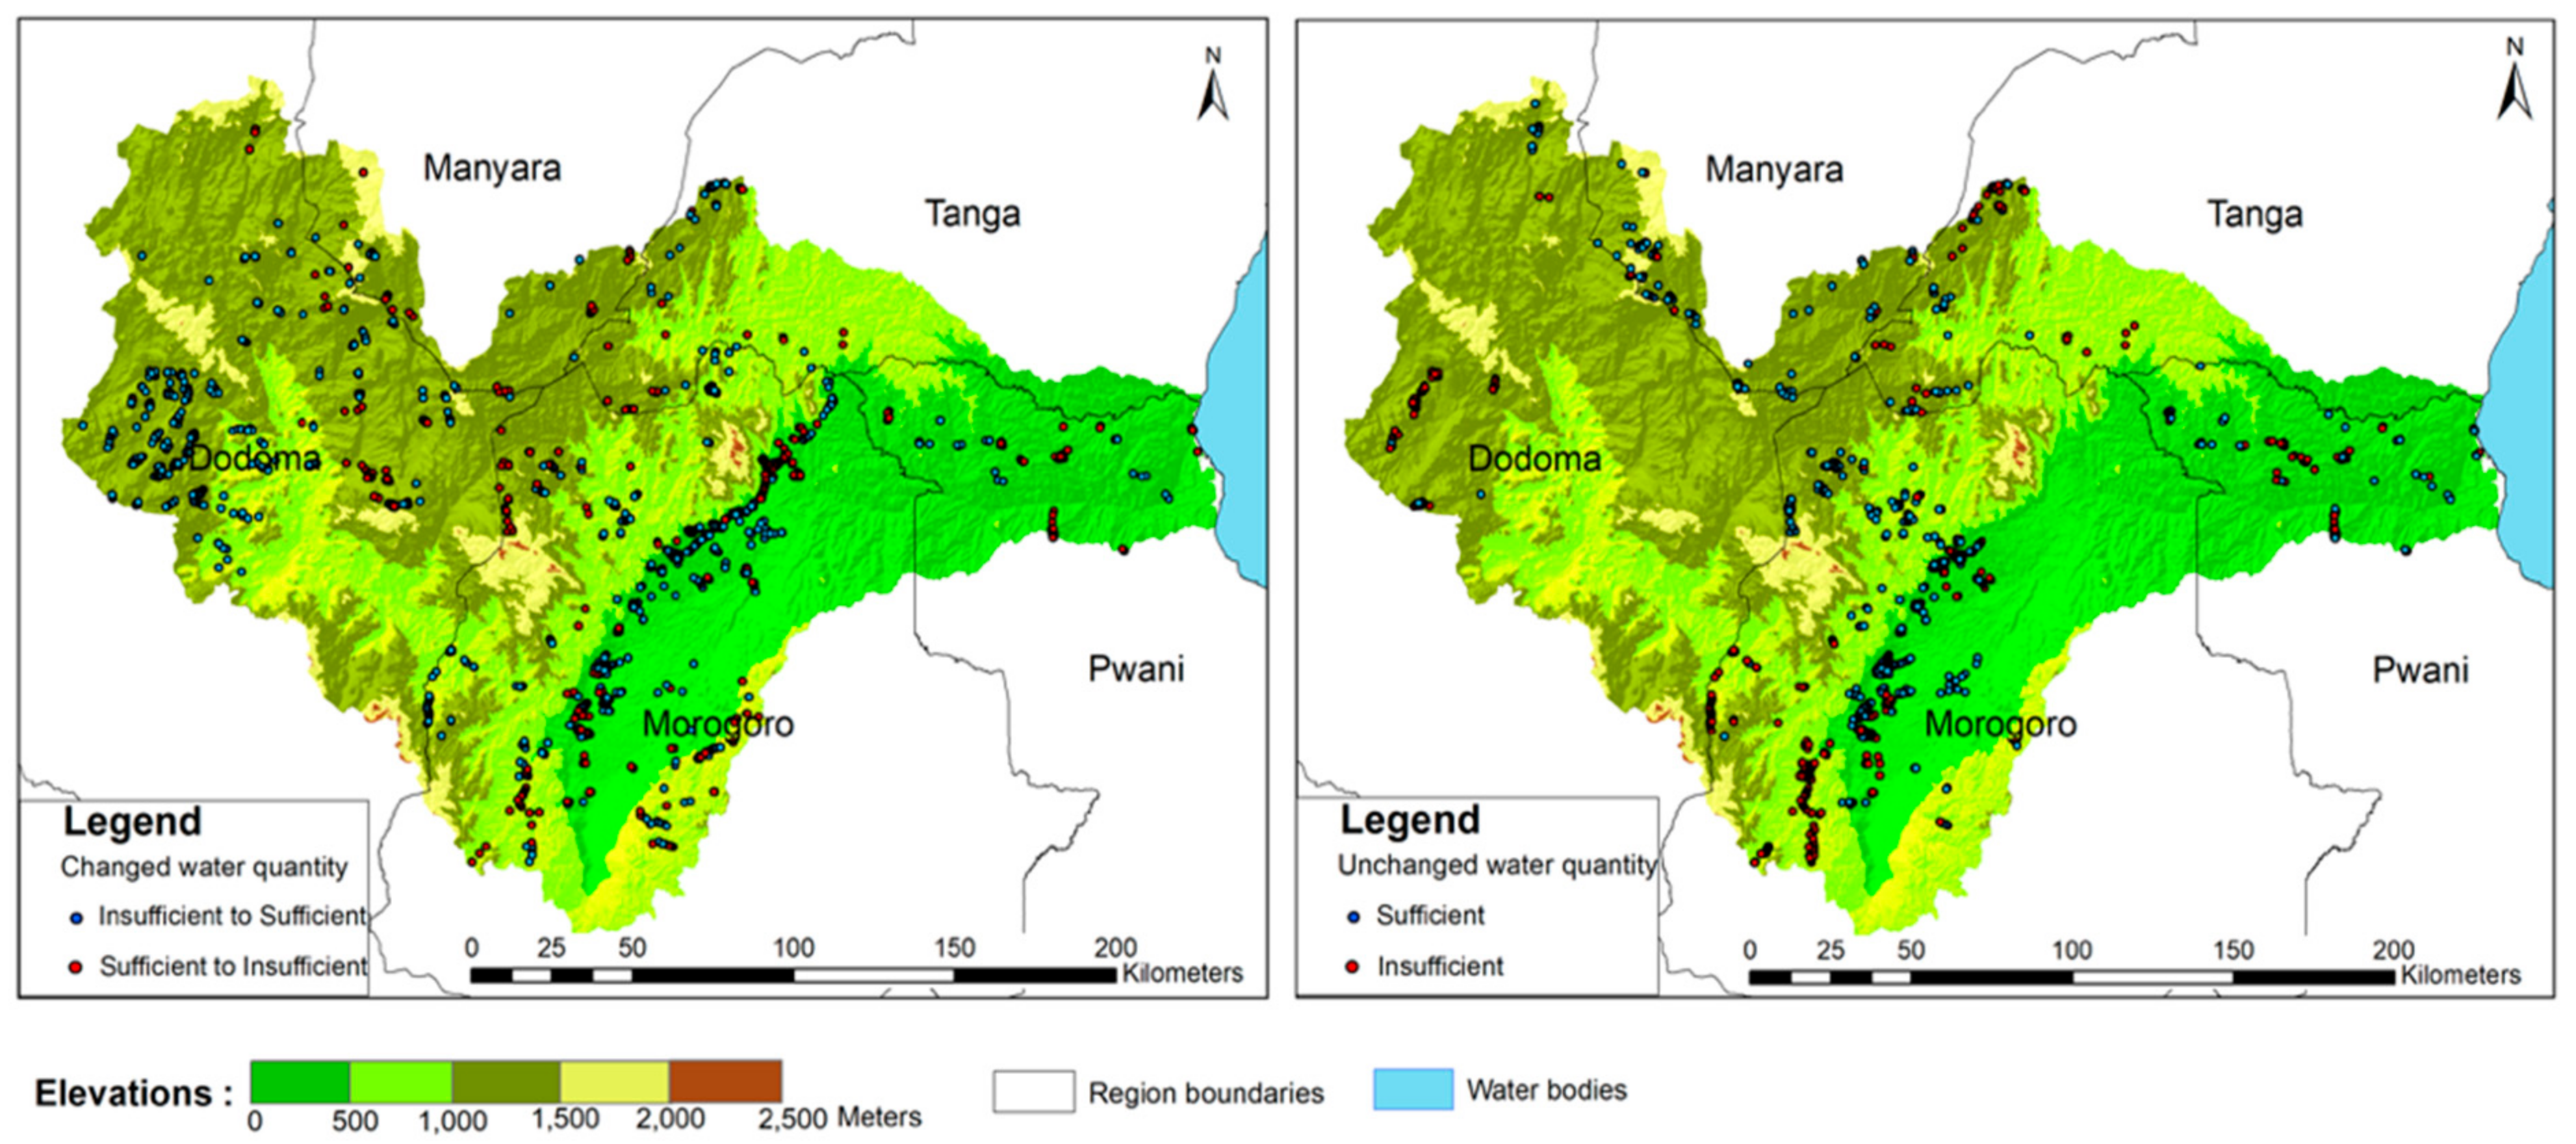
The results show that sufficient water is available at the water points during the wet season (Figure 6 and Figure 7), with a significant number of water points changing from providing an insufficient amount during the dry season to providing a sufficient amount during the wet season. Moreover, 67% of the population receive adequate water from water points, and 15% of the water points do not provide a sufficient amount, while 18% are dry. There is a significant decrease in the quantity of water available during the dry season, whereby 43% of the water points provide adequate water, while 39% of the water points provide an insufficient amount, and 18% are dry. Additionally, 24% of the water points change seasonally from providing a sufficient to an insufficient amount of water and vice versa (Table 5).
3.3.3. Seasonal Variation of Water Quality at Water Points
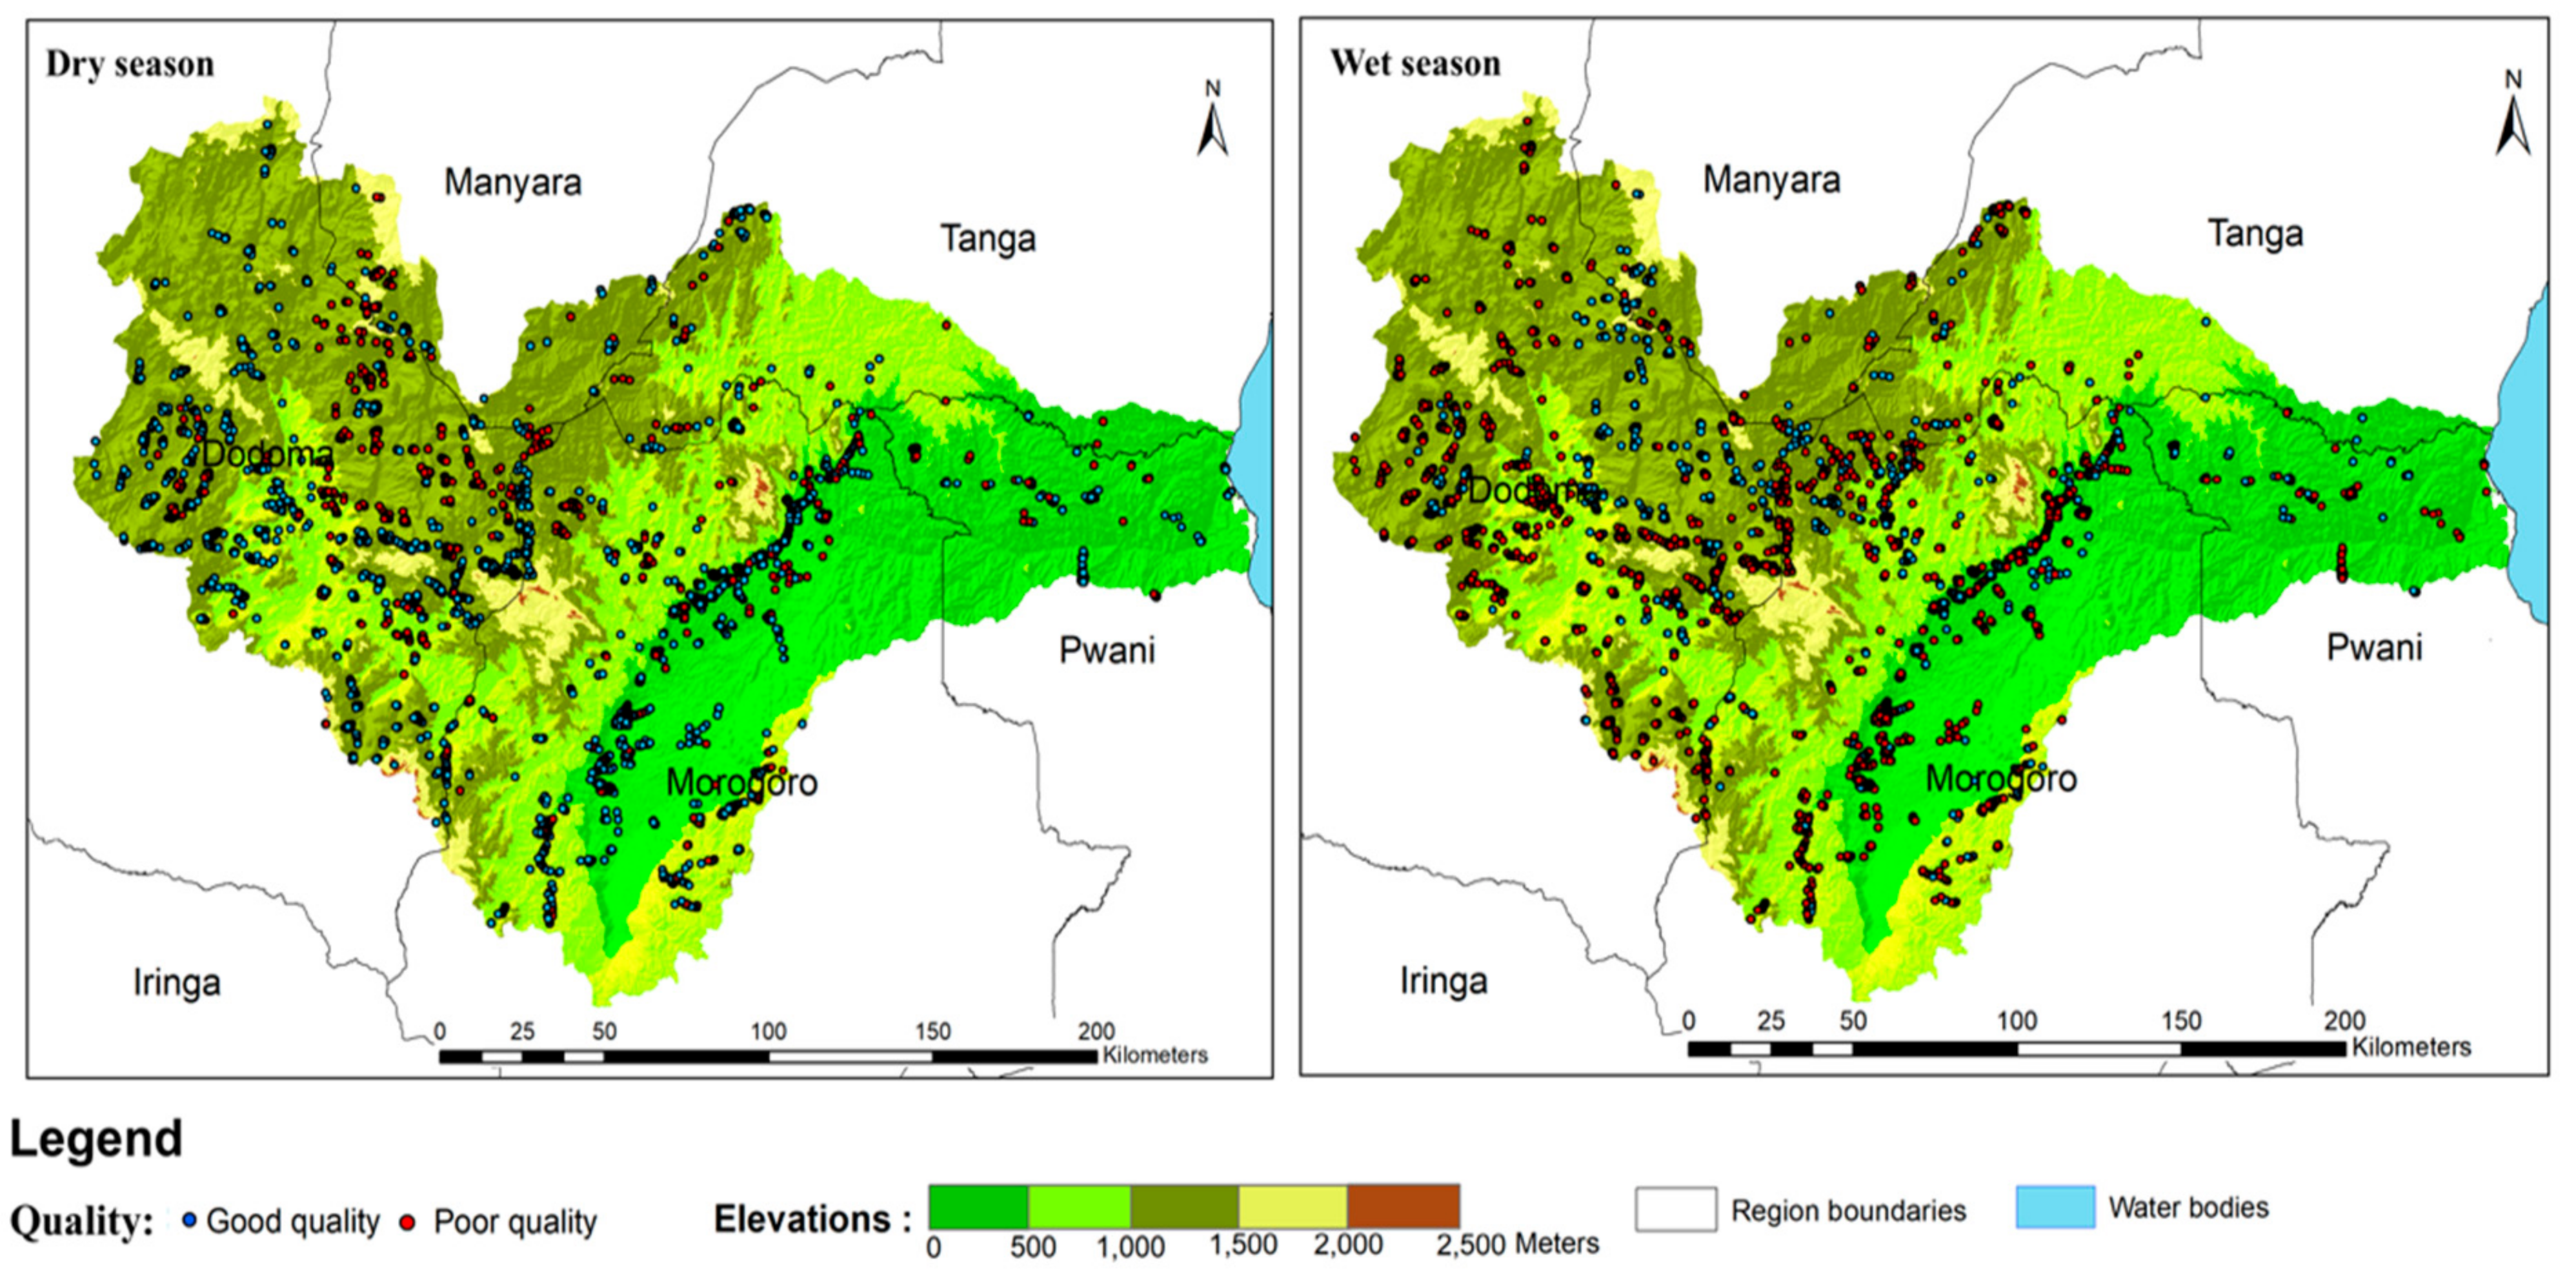
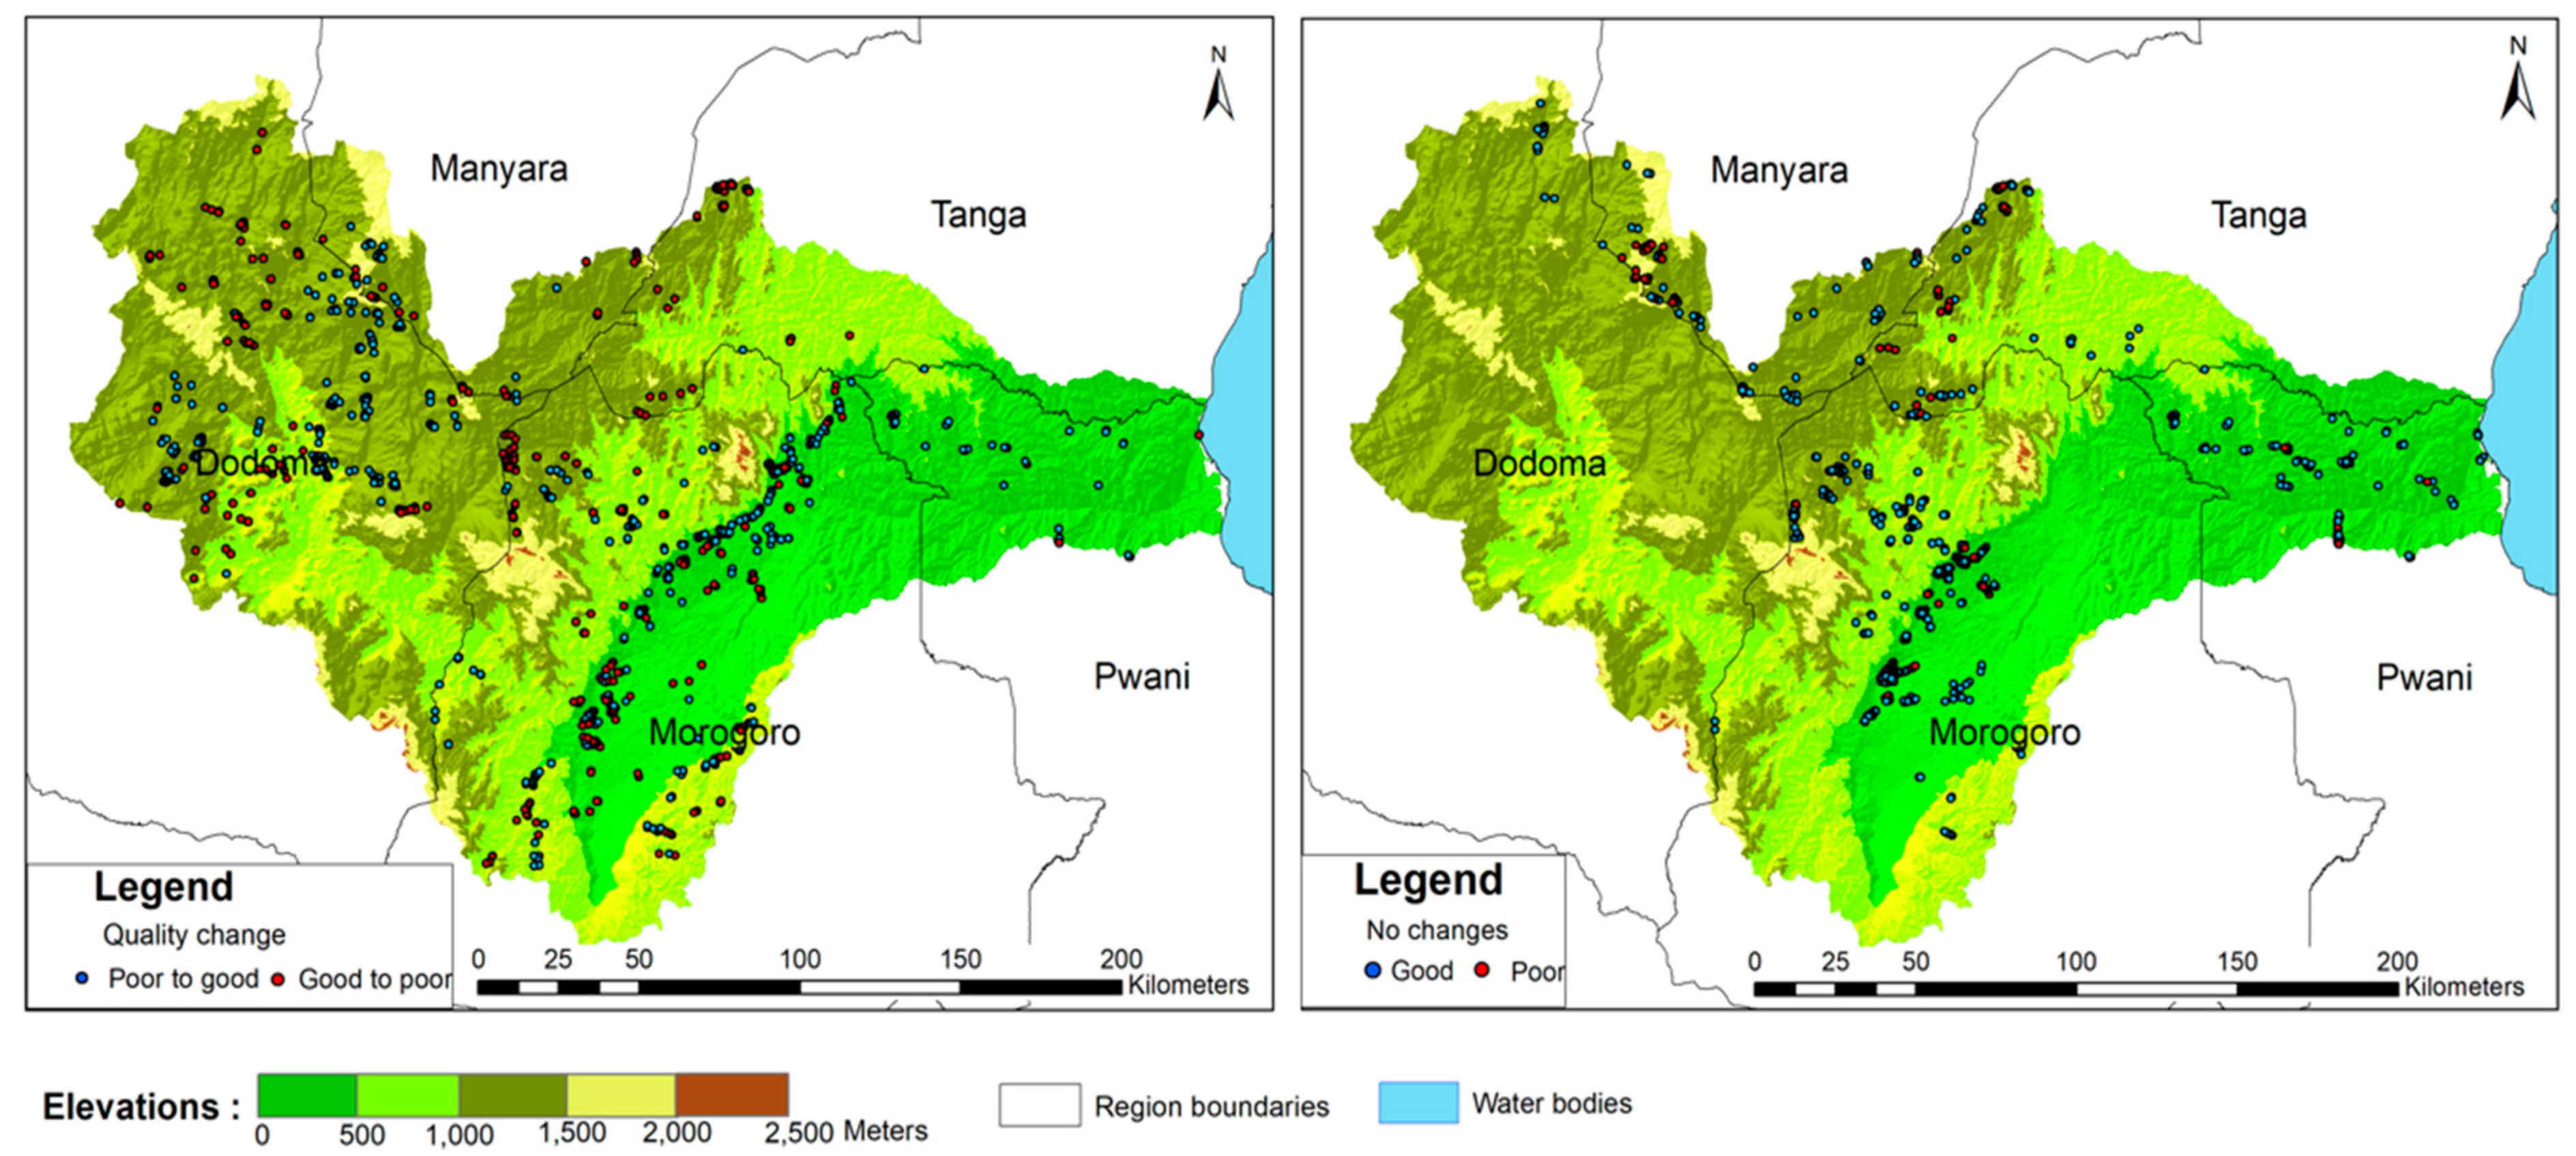
The analysis reveals that rainfall has a stronger negative impact on water quality (Figure 8 and Figure 9). The results show that 56% of water points reported poor quality and only 44% a good quality during the rainy season. The situation improves during the dry season and only 32% of all water points report poor quality and 68% good quality, with a substantial number of water points changing from poor quality in the wet season to good quality in the dry season. Furthermore, 24% of water points change from good quality to poor quality and vice versa, seasonally (Table 6).
4. Discussion
Measuring rural water service availability constraints is a challenge due to the complex variety of results associated. This discussion is focused on the questions: What are the current seasonal and annual rainfall variabilities in the study area? Moreover, how are the current seasonal and annual rainfall variabilities going to impact the water access and what are the foreseen outcomes of those impacts? Our study uses annual and seasonal rainfall for assessing rainfall effects on rural water supply services. Our findings described in this paper aim to provide a proper understanding of the magnitude of the seasonal and annual rainfall variability challenge related to rural water supply services. As indicated above, rural water supply services are significantly affected by annual and seasonal rainfall variability. Rainfall seasonality affects water access in terms of both quality and availability, as well as water point functionality. Several studies have discovered that in rural areas of developing countries, water supply services are hardly sufficient [49,50,51]. These are mainly a result of seasonal variation [23,52,53,54] and implies that an increase in demand for drinking water seasonally will potentially occur. Furthermore, the vulnerability to rainfall variability varies broadly [55,56]. Thus, it is not surprising that the influences of rainfall variability are experienced differently in different environments [57,58,59]. Some rural water supply services are facing pressures from population growth and constraints on their ability to secure further water sources; in many areas, rainfall variability is expected to worsen the circumstances [60,61]. Areas other than the studied one are served from abundant water sources and the impact of rainfall variability is more on water quality than on water amount [62].
By addressing queries like these, a greater understanding of the challenges connected with rainfall variability can be developed and more suitable strategies can be planned [63]. These proofs alone support the importance of taking justification related circumstances to produce broad-scale adaptation approaches. They require not only an investigation of causes but also analytical skills, which may be beyond the knowledge of the experts [64,65,66]. These have severe implications for decision-making since infrastructural investments are difficult to reverse and might not be able to provide adequate or appropriate adjustment to the environment or situation [67,68].
Any variations in rainfall amounts and variability will have a substantial impact on water supply services and hence affect livelihoods [69,70]. For the rural population to benefit from reliable and safe drinking water, thus improving wellbeing and reducing poverty, the water supply must meet several requirements [4]: The water should be of adequate amount to meet all domestic desires; consumption must not pose a health risk; and the supply should be consistent between seasons and over the years [4]. Rainfall varies over time and space, as does water availability, which determines the variation in sanitation and development of people all over the world [71]. However, rainfall variability is not the only consideration. The question is whether a water point is not functioning because of seasonal weather conditions or whether its functionality is affected by another factor [72,73,74,75]. Over time, service levels can vary in unpredictable ways [53].
Water supply schemes in rural areas typically have less technical, financial, and managerial capacity [65]. Therefore, in schemes that will experience the effects of rainfall variability, broad-scale adaptation strategies are needed to address a threat [76,77]. However, for this purpose, further assessments are vital which can also analyze the potential influence of other climate variables (e.g., temperature), additional variables, such as population growth, the standard of water supply infrastructure, and management practices [23]. The presentation of the complexity of rural water supply services to multiple stakeholders, many of whom are primarily driven by local perspectives and experiences and have an inadequate understanding of science, represents a significant challenge for planning adaptation [78]. Once functional relationships from a scientific standpoint are understood, then approaches for managing rural water services can account for synergies and trade-offs among services, for example, when they include encouraging one service at the cost of another seasonally [67,68]. There are many factors, such as the water source, network distribution, and management practice associated with functional water points, that support experts identify prospects to improve service delivery [73,79]. Therefore, consideration must be focused on capacity building in order to adapt to rainfall variability, thus demands a broad view of the structure and capacity needs to be developed including water services based on modeling future rainfall scenarios.
5. Conclusions
The present study intended to analyze the trends of annual and seasonal rainfall time series in the Wami River Basin to see if any significant changes in the patterns occurred for 35 years and how they affect the access to rural water supply services. The study showed that in the Wami River Basin, both, annual and seasonal rainfall increased from 1983 to 2017. It also revealed that there exists a strong relationship between rural water services and seasons in the study area. Any change in rainfall profoundly influences rural water services. The magnitude of changes in rural water service accessibility due to the season is significantly different, depending on several factors, including functionality, water quantity, and water quality. The results indicate the importance of detailed investigations of seasonal individualities to clarify the seasonal impacts of rainfall variability on rural water supply services. Furthermore, knowledge about the influence of seasonal rainfall variability can inform water engineers about the critical periods in rural water supply and the future potential of rural water service access.
The results show a significant correlation between the source of income and the pattern of water use across the seasons. The analyzed data show that water point mapping can be used as an indicator of water-point improvement and the acquisition of reliable information on seasonal water access. They offer evidence about the actual access to water in difficult times and are relevant to areas which rely on vulnerable sources. Moreover, our approach based on detailed large-area field data can be used to identify seasonal variations in the spatial distribution of the water points regarding quality and quantity to a reasonable degree of accuracy. Hence, it presents an excellent possibility to provide relevant information about water points in response to seasonal variability. However, due to the lack of up-to-date information, it does not cover other essential access aspects concerning, e.g., seasonal variation of the water quality or the vulnerability of the water point services, which are considered to function all year round.
Author Contributions
The two authors contributed in a substantial way to the manuscript. S.T. conceived and performed the research and wrote the manuscript. M.F.B. supervised the study at all stages and reviewed the manuscript. Both authors discussed the structure of the manuscript, and read and approved the submitted manuscript.
Funding
This research was funded by the Ministry of Water; the United Republic of Tanzania and the APC was funded by SLUB/TU-DRESDEN.
Acknowledgments
We acknowledge support from UNU-FLORES and TU Dresden. The first author would like to acknowledge the financial support from the Government of the United Republic of Tanzania.
Conflicts of Interest
The authors declare no conflicts of interests.
References
- Kipkorir, E.C. Analysis of rainfall climate on the Njemps Flats, Baringo District, Kenya. J. Arid Environ. 2002, 50, 445–458. [Google Scholar] [CrossRef]
- Gautam, M. Managing drought in sub-Saharan Africa: Policy Perspectives. In Proceedings of the 2006 Drought: Economic Consequences and Policies for Mitigation at the IAAE Conference, Queensland, Australia, 12–18 August 2006. [Google Scholar]
- Nyatuame, M.; Owusu-Gyimah, V.; Ampiaw, F. Statistical Analysis of Rainfall Trend for the Volta Region in Ghana. Int. J. Atmos. Sci. 2014, 2014, 203245. [Google Scholar] [CrossRef]
- Macdonald, A.M.; Roger, C.; Calow, D.M.; Macdonald, W.G.; Brighid, Ó.D. What impact will climate change have on rural groundwater supplies in Africa? Hydrol. Sci. J. 2009, 54, 690–703. [Google Scholar] [CrossRef] [Green Version]
- World Bank. Poverty and Climate Change: Reducing the Vulnerability of the Poor Through Adaptation; World Bank: Washington, DC, USA, 2003. [Google Scholar]
- IPCC Summary for Policymakers. Climate change 2013: The physical science basis. In Contribution of Working Group I to the Fifth Assessment Report of the Intergovernmental Panel on Climate Change; Stocker, T.F., Qin, D., Plattner, G.K., Tignor, M., Allen, S.K., Boschung, J., Nauels, A., Xia, Y., Bex, V., Midgley, P.M., Eds.; Cambridge University Press: Cambridge, UK; New York, NY, USA, 2013; pp. 1–30. [Google Scholar]
- McCarthy, J.J. Climate Change: Impacts, Adaptation, and Vulnerability. In Contribution of Working Group II to the Third Assessment Report of the Intergovernmental Panel on Climate Change; Cambridge University Press: Cambridge, UK, 2001. [Google Scholar]
- Abbaspour, K.C.; Monireh, F.; Samaneh, S.G.; Hong, Y. Assessing the impact of climate change on water resources in Iran. Water Resour. Res. 2009, 45, 114. [Google Scholar] [CrossRef]
- Chhibber, A.; Laajaj, R. Disaster, Climate change and economic development in Sub-Saharan Africa: Lesson and directions. J. Afr. Econ. 2008, 17, ii7–ii49. [Google Scholar] [CrossRef]
- IPCC Core Writing Team. Climate Change 2007: Synthesis Report. In The Contribution of Working Groups I, II and III to the Fourth Assessment Report of the Intergovernmental Panel on Climate Change; Pachauri, R.K., Reisinger, A., Eds.; IPCC: Geneva, Switzerland, 2007; p. 104. [Google Scholar]
- Ekstreom, M.; Fowler, H.J.; Kilsby, C.G.; Jones, P.D. New estimates of future changes in extreme rainfall across the UK using regional climate model integrations: Future estimates and use in impact studies. J. Hydrol. 2005, 300, 234–251. [Google Scholar] [CrossRef]
- Frei, C.; Sch€oll, R.; Fukutome, S.; Schmidli, J.; Vidale, P.L. Future change of precipitation extremes in Europe: Intercomparison of scenarios from regional climate models. J. Geophys. Res. 2006, 111, 318. [Google Scholar] [CrossRef]
- Kirono, D.G.C.; Kent, D.M.; Hennessy, K.J.; Mpelasoka, F. Characteristics of Australian droughts under enhanced greenhouse conditions: Results from 14 global climate models. J. Arid Environ. 2011, 75, 566–575. [Google Scholar] [CrossRef]
- Lenderink, G.; Buishand, A.; Van Deursen, W. Estimates of future discharges of the river Rhine using two scenario methodologies: Direct versus delta approach. Hydrology. Earth Syst. Sci. 2007, 11, 1145–1159. [Google Scholar] [CrossRef]
- May, W. Potential future changes in the characteristics of daily precipitation in Europe simulated by the HIRHAM regional climate model. Climatol. Dyn. 2008, 30, 581–603. [Google Scholar] [CrossRef]
- Vrochidou, A.E.K.; Tsanis, I.K.; Grillakis, M.G.; Koutroulis, A.G. The impact of climate change on hydrometeorological droughts at a basin scale. J. Hydrol. 2013, 476, 290–301. [Google Scholar] [CrossRef]
- Georgakakos, A.; Fleming, P.; Dettinger, M.; Peters-Lidard, C.; Terese, T.C.; Richmond, K.; Reckhow, K.; White, D. Ch. 3: Water Resources. In Climate Change Impacts in the United States: The Third National Climate Assessment; Melilo, J.M., Richmond, T., Yohe, G.W., Eds.; U.S. Global Change Research Program: Washington, DC, USA, 2014; pp. 69–112. [Google Scholar]
- Calow, R.; MacDonald, C.; Nicol, M.; Robins, N.S. Groundwater security and drought in Africa: Linking availability access and demand. J. Ground Water 2010, 48, 246–256. [Google Scholar] [CrossRef] [PubMed]
- Bisung, E.; Elliott, S.J.; Abudho, B.; Schuster-Wallace, C.J.; Karanja, D.M. Dreaming of toilets: Using photovoice to explore knowledge, attitudes and practices around water-health linkages in rural Kenya. Health Place 2015, 31, 208–215. [Google Scholar] [CrossRef]
- Kostyla, C.; Bain, R.; Cronk, R.; Bartram, J. Seasonal variation of faecal contamination in drinking water sources in developing countries: A systematic review. Sci. Total Environ. 2015, 514, 333–343. [Google Scholar] [CrossRef] [PubMed]
- Ngongondo, C.S. An analysis of long-term rainfall variability, trends and groundwater availability in the Mulunguzi river catchment area, Zomba mountain, Southern Malawi. Quat. Int. 2006, 148, 45–50. [Google Scholar] [CrossRef]
- Conway, D.; Aurelia, P.; Sandra, A.; Hamisai, H.; Claudine, D.; Gil, M. Rainfall and water resources variability in Sub Saharan Africa during the 20th century. J. Hydrometeorol. 2008, 10, 41–59. [Google Scholar] [CrossRef]
- Onyenechere, E.C.; Azuwike, D.O.; Enwereuzor, A.I. Effect of rainfall variability on water supply in Ikeduru, L.G.A of Imo State, Nigeria. Int. Multidiscip. J. 2011, 5, 223–241. [Google Scholar] [CrossRef]
- Nyakundi, R.M.; Makokha, M.; Mwangi, J.K.; Obiero, C. Impact of Rainfall Variability on Groundwater Levels in Ruiru Municipality. Afr. J. Sci. Technol. Innov. Dev. 2014, 7, 329–335. [Google Scholar] [CrossRef]
- Kombo, A.K.; Kanyama, A. Effect of Climate change and variability on water supply in Zanzibar. Int. J. Mar. Atmos. Earth Sci. 2015, 3, 1–16. [Google Scholar]
- Amber, L.P.; Zwickle, A.; Namanya, J.; Rzotkiewicz, A.; Mwita, E. Seasonal Shifts in Primary Water Source Type: A Comparison of Largely Pastoral Communities in Uganda and Tanzania. Int. J. Environ. Res. Public Health 2016, 13, 169. [Google Scholar]
- Kwon, H.H.; Casey, B.; Kaiqin, X.; Upmanu, L. Seasonal and annual maximum streamflow forcasting using climate information: Application to the Three Gorges Dam in Yangtze River basin, China. Hydrol. Sci. J. 2009, 54, 582–595. [Google Scholar] [CrossRef]
- Oteze, G.E.; Fayose, S.A. Regional development in the Hydrogeology of the Chad basin. Water Resour. 1998, 1, 9–29. [Google Scholar]
- McDonald, A.T.; Kay, D. Water resources: Issues and strategies; Longman Scientific & Technical, Wiley: Harlow, UK, 1988. [Google Scholar]
- Cech, T.V. Principles of Water Resources: History, Development, Management and Policy, 2nd ed.; Wiley: New York, NY, USA, 2003. [Google Scholar]
- Kabat, P.; Van Schaik, H. Climate Change the Water Rules: How Water Managers Can Cope with Today’s Climate Variability and Tomorrow Climate Change. World Water Assessment Programme. In World Water Development Report; World Water Assessment Programme; UNESCO: Paris, France, 2003. [Google Scholar]
- Montanari, A.; Zhou, Y.F.; D’Orsi, M.F.; Bolotin-Fukuhara, M.; Frontali, L.; Francinsa, S. Panta Rhei, Everything Flows: Change in hydrology and society; the IAHS scientific decade 2013–2022. Hydrol. Sci. J. 2013, 58, 1256–1275. [Google Scholar] [CrossRef]
- Wambura, F.J.; Ottfried, D.; Gunnar, L. Evaluation of spatiotemporal patterns of remotely sensed evapotranspiration to infer information about hydrological behaviour in a data-scarce region. Water 2017, 9, 333. [Google Scholar] [CrossRef]
- JICA RUWASA-CAD II. The Study on Water Resources Management and Development in Wami/Ruvu Basin in the United Republic of Tanzania (RUWASA-CAD); Technical Report for Ministry of Water and Livestock Development 2002; National Water Policy: Dar es Salaam, Tanzania, 2013. [Google Scholar]
- Sen, P.K. Estimates of the regression coefficient based on Kendall’s tau. J. Am. Stat. Assoc. 1968, 63, 1379–1389. [Google Scholar] [CrossRef]
- Mann, H. B Non-parametric tests against trend. Econ. J. Econ. Soc. 1945, 13, 245–259. [Google Scholar]
- Kendall, M.G. Rank Correlation Methods; Charles Griffin: London, UK, 1975. [Google Scholar]
- Dinpashoh, Y.; Mirabbasi, R.; Jhajharia, D.; Abianeh, H.Z.; Mostafaeipour, A. Effect of short-term and long-term persistence on the identification of temporal trends. J. Hydrol. Eng. 2013, 19, 617–625. [Google Scholar] [CrossRef]
- Scheff, S.W. Fundamental Statistical Principles for the Neurobiologist: A Survival Guide; Academic Press: Cambridge, MA, USA, 2016. [Google Scholar]
- Helsel, D.R.; Hirsch, R.M. Statistical Methods in Water Resources; Elsevier: Amsterdam, The Netherlands, 1992. [Google Scholar]
- Sahu, R.K.; Khare, D.E. Spatial and temporal analysis of rainfall trend for 30 districts of a coastal state (Odisha) of India. Int. J. Geol. Earth Environ. Sci. 2015, 5, 40–53. [Google Scholar]
- Libiseller, C.; Grimvall, A. Performance of partial Mann–Kendall tests for trend detection in the presence of covariates. Env. Metr. 2002, 13, 71–84. [Google Scholar] [CrossRef]
- Hirsch, R.M.; Slack, J.R.; Smith, R.A. Techniques of trend analysis for monthly water quality data. Water Resour. Res. 1982, 18, 107–121. [Google Scholar] [CrossRef] [Green Version]
- Xu, Z.X.; Li, J.Y.; Liu, C.M. Long term trend analysis for major climate variables in the Yellow River basin. Hydrol. Process. 2000, 21, 1935–1948. [Google Scholar] [CrossRef]
- Karpouzos, D.K.; Kavalieratou, S.; Babajimopoulos, C. Trend analysis of rainfall data in Pieria Region. Eur. Water 2010, 30, 31–40. [Google Scholar]
- Stoupy, O.; Sudgen, S. Halving the number of people without access to safe water by 2015: A Malawian perspective. In Part 2: New Indicators for the Millennium Development Goal; WaterAid: London, UK, 2003. [Google Scholar]
- Welle, K. Learning for advocacy and good practice: WaterAid water point mapping. In Report of Findings Based on Country Visits to Malawi and Tanzania; WaterAid: London, UK, 2005. [Google Scholar]
- Nyitambe, J.E. Water point mapping initiative: The case of rural water supply in Tanzania. In Proceedings of the International Kick-Off Workshop, Advancing a Nexus Approach to the Sustainable Management of Water, Soil and Waste, Dresden, Germany, 11–12 November 2013; Unuflores: Dresden, Germany, 2014; pp. 106–118. [Google Scholar]
- Tussupova, K.; Hjorth, P.; Berndtsson, R. Access to Drinking Water and Sanitation in Rural Kazakhstan. Int. J. Environ. Res. Public Health 2016, 13, 1115. [Google Scholar] [CrossRef] [PubMed]
- Shaheed, A.; Orgill, J.; Montgomery, M.A.; Marc, A.; Jeuland, M.A.; Brownd, J. Why “improved” water sources are not always safe. Bull. World Health Organ. 2014, 92, 283–289. [Google Scholar] [CrossRef] [PubMed]
- Wegner, A. Domestic Water Supply in Rural Việt Nam—Between Self-Supply and Piped Schemes. Ph.D. Thesis, The Faculty of Civil Engineering, Geo and Environmental Science, Karlsruhe Institute of Technology, Karlsruhe, Germany, 2015. [Google Scholar]
- Ayoade, J.O. Forecasting and managing demand for water in Nigeria. In Proceedings of the 27th Annual Conference of the Nigerian Geographical Association, Nsukka, Nigeria, 27 April–1 May 1986. [Google Scholar]
- Chima, G.N. Rural Water Supply in Isiala Ngwa Local Government Area of Imo State. Master’s Thesis, Department of Geography, University of Nigeria, Nsukka, Nigeria, 1989. [Google Scholar]
- Uzoma, E.C. Rural Water Supplies in Enugu State: A Comparative Analysis. Master’s Thesis, Department of Geography, University of Nigeria, Nsukka, Nigeria, 1996. [Google Scholar]
- Rurinda, J.; Mapfumo, P.; Van Wijk, M.T.; Mtambanengwe, F.; Rufino, M.C.; Chikowo, R.; Giller, K.E. Sources of vulnerability to a variable and changing climate among smallholder households in Zimbabwe: A participatory analysis. Clim. Risk Manag. 2014, 3, 65–78. [Google Scholar] [CrossRef]
- Singh, P.K.; Nair, A. Livelihood vulnerability assessment to climate variability and change using fuzzy cognitive mapping approach. Clim. Chang. 2014, 127, 475–491. [Google Scholar] [CrossRef] [Green Version]
- Kyei-Mensah, C.; Kyerematen, R.; Adu-Acheampong, S. Impact of Rainfall Variability on Crop Production within the Worobong Ecological Area of Fanteakwa District, Ghana. Adv. Agric. 2019, 2019, 7930127. [Google Scholar] [CrossRef]
- Thornton, P.K.; Ericksen, P.J.; Herrero, M.; Challinor, A.J. Climate variability and vulnerability to climate change: A review. Glob. Chang. Biol. 2014, 20, 3313–3328. [Google Scholar] [CrossRef]
- Borgomeo, E.; Vadheim, B.; Woldeyes, F.B.; Alamirew, T.; Tamru, S.; Charles, K.J.; Kebede, S.; Walker, O. The Distributional and Multi-Sectoral Impacts of Rainfall Shocks: Evidence from Computable General Equilibrium Modelling for the Awash Basin, Ethiopia. Ecol. Econ. 2018, 146, 621–632. [Google Scholar] [CrossRef]
- Misra, A.K. Climate change and challenges of water and food security. Int. J. Sustain. Built Environ. 2014, 3, 153–165. [Google Scholar] [CrossRef] [Green Version]
- World Health Organisation. Global Water Supply and Sanitation Assessment; WHO 2000 Report; WHO: New York, NY, USA, 2000. [Google Scholar]
- Howard, G.; Calow, R.; MacDonad, A.; Batram, J. Climate change and Water and Sanitation: Likely Impacts and emerging Trends for Action. Annu. Rev. Environ. Resour. 2016, 41, 253–276. [Google Scholar] [CrossRef]
- Ojwang’, G.O.; Agatsiva, J.; Situma, C. Analysis of Climate Change and Variability Risks in the Smallholder Sector: Case Studies of the Laikipia and Narok Districts Representing Major Agro-Ecological Zones in Kenya; Department of Resource Surveys and Remote Sensing (DRSRS) in Collaboration with the Food and Agriculture Organization of the United Nations: Rome, Italy, 2010. [Google Scholar]
- World Health Organisation. Water Safety in Distribution Systems; WHO Press: Geneva, Switzerland, 2014. [Google Scholar]
- Behailu, B.M.; Hukka, J.; Katko, T. Service Failures of Rural Water Supply Systems in Ethiopia and Their Policy Implications. Public Work. Manag. Policy 2017, 22, 179–196. [Google Scholar] [CrossRef]
- Machado, A.V.; Dos Santos, J.A.; Alves, L.M.; Quindeler, N.S. Contributions of Organizational Levels in Community Management Models of Water Supply in Rural Communities: Cases from Brazil and Ecuador. Water 2019, 11, 537. [Google Scholar] [CrossRef]
- Butler, J.R.A.; Bohensky, E.L.; Darbas, T.; Kirono, D.; Wise, R.M.; Sutaryono, Y. Building capacity for adaptation pathways in eastern Indonesian islands: Synthesis and lessons learned. Clim. Risk Manag. 2016, 12, A1–A10. [Google Scholar] [CrossRef] [Green Version]
- Wise, R.M.; Fazey, I.; Stafford, M.; Smith, S.E.; Park, H.C.; Eakin, E.R.M.; van Gardenen, A.; Campbell, B. Reconceptualising adaptation to climate change as part of pathways of change and response. Glob. Environ. Chang. 2014, 28, 325–336. [Google Scholar] [CrossRef] [Green Version]
- Srinivasan, G.; Rafiusra, K.M.; Subbiah, A.R. Climate information requirements for community—Level risk management and adaptation. Clim. Res. 2011, 47, 5–12. [Google Scholar] [CrossRef]
- Kirono, D.G.C.; Larson, S.; Tjandraatmadja, G.; Leitch, A.; Neumann, L.; Maheepala, S.; Barkey, R.; Achmad, A.; Selintung, M. Adapting to climate change through urban water management: A participatory case study in Indonesia. Reg. Environ. Chang. 2014, 14, 355–367. [Google Scholar] [CrossRef]
- Ifabiyi, I.P.; Ashaolu, E.D. Analysis of the impacts of rainfall variability on public water supply in ILORIN, Nigeria. J. Meteorol. Clim. Sci. 2013, 11, 18–26. [Google Scholar]
- Carter, R.C.; Ross, I. Beyond ‘functionality’ of handpump-supplied rural water services in developing countries. Waterlines 2016, 35, 94–110. [Google Scholar] [CrossRef]
- Alexander, K.T.; Tesfaye, Y.; Dreibelbis, R.; Abaire, B.; Freeman, M.C. Governance and functionality of community water schemes in rural Ethiopia. Int. J. Public Health 2015, 60, 977–986. [Google Scholar] [CrossRef] [PubMed]
- Whittington, D.; Davis, J.; Prokopy, L.; Komives, K.; Thorsten, R.; Lukacs, H.; Wakeman, W. How well is the demand-driven, community management model for rural water supply systems doing? Evidence from Bolivia, Peru and Ghana. Water Policy 2009, 11, 696–718. [Google Scholar] [CrossRef] [Green Version]
- Foster, T.; Shantz, A.; Lala, S.; Willetts, J. Factors associated with operational sustainability of rural water supplies in Cambodia. Environ. Sci. Water Res. Technol. 2018, 4, 1577–1588. [Google Scholar] [CrossRef]
- Bloemen, P.; Reeder, T.; Zevenbergen, C.; Rijke, J.; Kingsborough, A. Lessons learned from applying adaptation pathways in flood risk management and challenges for the further development of this approach. Mitig. Adapt. Strateg. Glob. Chang. 2018, 23, 1083–1108. [Google Scholar] [CrossRef] [PubMed]
- Mubiru, D.N.; Radeny, M.; Kyazze, F.B.; Zziwa, A.; Lwasa, J.; Kinyangi, J.; Mungai, C. Climate trends, risks and coping strategies in smallholder farming systems in Uganda. Clim. Risk Manag. 2018, 22, 4–21. [Google Scholar] [CrossRef]
- Butler, J.R.A.; Suadnya, W.; Puspadi, K.; Sutaryono, Y.; Wise, R.M.; Skewes, T.D.; Kirono, D.; Bohensky, E.L.; Handayani, T.; Habibi, P.; et al. Framing the application of adaptation pathways for rural livelihoods and global change in Eastern Indonesian islands. Glob. Environ. Chang. 2014, 28, 368–382. [Google Scholar] [CrossRef]
- Foster, T. Predictors of sustainability for community-managed handpumps in Sub-Saharan Africa: Evidence from Liberia, Sierra Leone, and Uganda. Environ. Sci. Technol. 2013, 21, 12037–12046. [Google Scholar] [CrossRef]
Figure 1.
Location of the study area of the Wami River Basin.

Figure 2.
The 1983–2017 variation of annual total rainfall (in mm) recorded at Kongwa, Dakawa, and Mandera stations.
Figure 2.
The 1983–2017 variation of annual total rainfall (in mm) recorded at Kongwa, Dakawa, and Mandera stations.

Figure 3.
The 1983–2017 variation of total seasonal rainfall (in mm) recorded at Kongwa, Dakawa, and Mandera stations (NDJFMA—November–December–January–February–March–April; MAM—March–April–May; OND—October–November–December).
Figure 3.
The 1983–2017 variation of total seasonal rainfall (in mm) recorded at Kongwa, Dakawa, and Mandera stations (NDJFMA—November–December–January–February–March–April; MAM—March–April–May; OND—October–November–December).

Figure 4.
Spatial distribution of water points and their status during the dry season (August to September 2016) and wet season (March to April 2017) in the Wami River Basin.
Figure 4.
Spatial distribution of water points and their status during the dry season (August to September 2016) and wet season (March to April 2017) in the Wami River Basin.

Figure 5.
Spatial distribution of water points and their status changing from the dry season (August to September 2016) to wet season (March to April 2017) the Wami River Basin.
Figure 5.
Spatial distribution of water points and their status changing from the dry season (August to September 2016) to wet season (March to April 2017) the Wami River Basin.

Figure 6.
Spatial distribution of water quantity received at the water points during the dry season (August to September 2016) and wet season (March to April 2017) in the Wami River Basin.
Figure 6.
Spatial distribution of water quantity received at the water points during the dry season (August to September 2016) and wet season (March to April 2017) in the Wami River Basin.

Figure 7.
Spatial distribution of water quantity received at water points changing between the dry season (August to September 2016) and wet season (March to April 2017) in the Wami River Basin.
Figure 7.
Spatial distribution of water quantity received at water points changing between the dry season (August to September 2016) and wet season (March to April 2017) in the Wami River Basin.

Figure 8.
Spatial distribution of water quality at the water points during the dry season (August to September 2016) and wet season (March to April 2017).
Figure 8.
Spatial distribution of water quality at the water points during the dry season (August to September 2016) and wet season (March to April 2017).

Figure 9.
Spatial distribution of water quality at the water points changing between the dry season (August to September 2016) and wet season (March to April 2017) in the Wami River Basin.
Figure 9.
Spatial distribution of water quality at the water points changing between the dry season (August to September 2016) and wet season (March to April 2017) in the Wami River Basin.


Table 1.
Description of simple querying in the water point mapping system.
| Querying | Description |
|---|---|
| Functional | Reference to the functionality of a water point indicating that it yields water regularly and is used daily |
| Non-Functional | Reference to the functionality of a water point indicating that it does not yield water for any reason (hardware problem, dry source, or poor management) |
| Sufficient | A dimensionless quantity to which no physical dimension is applicable and where the amount of water satisfies human needs (based on user perspective) |
| Insufficient | A dimensionless quantity to which no physical dimension is applicable and where the amount of water does not satisfy human needs |
| Dry | Waterpoint characterized by an absence of water |
| Good water quality | A qualitative statement on the condition of water relative to the desires of human needs based on user perspective referred to as clear water which does not taste salty |
| Poor water quality | A qualitative statement on the condition of water relative to the desires of human needs based on user perspective referred to as salty, colored, and/or fluoride water |
Table 2.
Result of the trend analysis for annual and seasonal and rainfall of Wami River Basin (1983–2017).
Table 2.
Result of the trend analysis for annual and seasonal and rainfall of Wami River Basin (1983–2017).
| Station | Seasonal/ Annual | Z-Statistics | Sen’s Slope (mm/year) | p-Value | Trend |
|---|---|---|---|---|---|
| Kongwa | NDJFMA | 0.993 | 3.97 | 0.080 | Increasing |
| Annual | 0.568 | 5.3 | 0.028 | Increasing | |
| Dakawa | MAM | 0.229 | 4.1 | 0.004 | Increasing |
| OND | 0.019 | 0.758 | 0.468 | Increasing | |
| Annual | 0.038 | 5.2 | 0.080 | Increasing | |
| Mandera | MAM | 0.494 | 1.662 | 0.495 | Increasing |
| OND | 0.017 | 1.268 | 0.406 | Increasing | |
| Annual | 0.804 | 3.082 | 0.236 | Increasing |
NDJFMA—November–December–January–February–March–April; MAM—March–April–May; OND—October–November–December.
Table 3.
Percentage of distribution of tap water access, source of income, and primary water use.
| Tap Water Access | ||||
|---|---|---|---|---|
| Dry Season Responses (%) | Wet Season Responses (%) | |||
| Access | No Access | Access | No Access | |
| Tap | 38 | 62 | 68 | 32 |
| Vendor | - | 15 | - | 3 |
| River/Spring/Dam | - | 47 | - | - |
| Rain harvest | - | - | - | 29 |
| Source of Income | ||||
| Dry Season Responses (%) | Wet Season Responses (%) | |||
| Affected | Not Affected | Affected | Not Affected | |
| Farming | 66 | 34 | 0 | 100 |
| Business | 27 | 73 | 7 | 93 |
| Employment | 9 | 91 | 0 | 100 |
| Livestock | 85 | 15 | 2 | 98 |
| Main Water Use | ||||
| Dry Season Responses (%) | Wet Season Responses (%) | |||
| Affected | Not Affected | Affected | Not Affected | |
| Domestic | 78 | 22 | 5 | 95 |
| Livestock | 95 | 5 | 0 | 100 |
| House gardening | 98 | 2 | 0 | 100 |
Table 4.
Waterpoint status (number and percentage) during the dry and wet seasons.
| Status | ||||
|---|---|---|---|---|
| Dry Season | Wet Season | |||
| Number | Percentage (%) | Number | Percentage (%) | |
| Functional | 1259 | 33 | 1946 | 51 |
| Non-functional | 2556 | 67 | 1869 | 49 |
Table 5.
Water quantity received at water points (number and percentage) during the dry and wet seasons.
Table 5.
Water quantity received at water points (number and percentage) during the dry and wet seasons.
| Quantity | ||||
|---|---|---|---|---|
| Dry Season | Wet Season | |||
| Number | Percentage (%) | Number | Percentage (%) | |
| Sufficient | 1640 | 43 | 2556 | 67 |
| Insufficient | 1488 | 39 | 572 | 15 |
| Dry | 687 | 18 | 687 | 18 |
Table 6.
Water quality at the water points (number and percentage) during the dry and wet seasons.
| Quality | ||||
|---|---|---|---|---|
| Dry Season | Wet Season | |||
| Number | Percentage (%) | Number | Percentage (%) | |
| Good | 2594 | 68 | 1679 | 44 |
| Poor | 1221 | 32 | 2136 | 56 |
© 2019 by the authors. Licensee MDPI, Basel, Switzerland. This article is an open access article distributed under the terms and conditions of the Creative Commons Attribution (CC BY) license (http://creativecommons.org/licenses/by/4.0/).
Share and Cite
MDPI and ACS Style
Twisa, S.; Buchroithner, M.F. Seasonal and Annual Rainfall Variability and Their Impact on Rural Water Supply Services in the Wami River Basin, Tanzania. Water 2019, 11, 2055. https://doi.org/10.3390/w11102055
AMA Style
Twisa S, Buchroithner MF. Seasonal and Annual Rainfall Variability and Their Impact on Rural Water Supply Services in the Wami River Basin, Tanzania. Water. 2019; 11(10):2055. https://doi.org/10.3390/w11102055
Chicago/Turabian StyleTwisa, Sekela, and Manfred F. Buchroithner. 2019. "Seasonal and Annual Rainfall Variability and Their Impact on Rural Water Supply Services in the Wami River Basin, Tanzania" Water 11, no. 10: 2055. https://doi.org/10.3390/w11102055
Note that from the first issue of 2016, this journal uses article numbers instead of page numbers. See further details here.