1. Introduction
Presently, based on farmland drainage ditches, agricultural non-point pollution control technology has been focused on ecological ditches, and nitrogen and phosphorus adsorbent as a kind of adsorption material has had wide application in the treatment of agricultural non-point source pollution in rivers and lakes. Furthermore, nitrogen and phosphorus adsorbents have advantages in terms of stable performance, a wide range of application, efficiency, simple operation and artificial controllability [
1]. The use of adsorbents with strong adsorption of nitrogen and phosphorus in farmland drainage ditches can improve the efficiency of the interception and absorption of nitrogen and phosphorus; therefore, these adsorbents can help considerably in controlling agricultural non-point source pollution.
At present, several adsorbents have been developed and utilised to remove pollutants from water, including acid soil, smectite, kaolinite, ceramicite, aluminium oxide, activated carbons, graphene oxide, and diatomite, as well as zeolite [
2,
3,
4]. He et al. [
5] proposed a composite adsorbent in which lanthanum oxide was incorporated onto porous zeolite (La–Z), preferably phosphate. Based on the adsorption kinetics, isotherms, pH, and interfering ion effect, porous zeolite-supported lanthanum oxide was shown to be an excellent material to adsorb phosphate. Wu et al. [
6] proposed a novel granular adsorbent fabricated with zeolite and Al–Mn binary oxide to remove ammonium–nitrogen (NH
4+–N) and phosphorus (P) from contaminated water. Mahardika et al. [
7] investigated granular activated carbon impregnated with amorphous ferrihydrite for adsorption of phosphorus from water solution and increased the uptake of phosphorus by preoxidation treatment. Goscianska et al. [
8] proposed a new low-cost synthetic zeolite obtained from fly ash and modified with lanthanum to remove phosphate from aqueous solution. A number of adsorbents are used to remove nitrogen and phosphorus pollutants from water. Among them, the adsorption of ammonia by zeolite and phosphorus by diatomite has become a hot topic in current research. Therefore, this study conducted in-depth research on these two adsorbents.
There are also many studies on the adsorption mechanism. The improved adsorption capacity of three kinds of smectite for ammonia nitrogen was proposed based on clay characterization methods and adsorption experiments [
9]. Pertaining to the influence of adsorption capacity, the effects of pH, background electrolyte cations and heavy metal were investigated, e.g., the effect of tetracycline adsorption onto kaolinite [
10]. Fe
3O
4/kaolin magnetic nanocomposites by the chemical co-precipitation method were proposed, and the effects of contact time, initial dye concentration, adsorbent dose, temperature, and initial pH of the solution on the adsorption process were studied [
11]. The chemical adsorption mechanism was further analyzed by FT-IR, x-ray photoelectron spectroscopy (XPS), and UV-VIS is spectroscopy [
12]. Skubiszewska-Ziba et al. [
13] investigated a carbon–mineral adsorbent (CMA) prepared using complex diatomaceous earth/perlite adsorbent that was spent in the purification of apple juice and carbonised with the addition of starch or glucose to enhance the content of carbon deposits and develop the porosity of the CMA. In an effort to increase the effectiveness of removing ammonium ion from natural zeolite, Widiastuti et al. [
14] examined the theoretical aspects of adsorption, including adsorption isotherms, kinetics, and thermodynamics, as well as desorption–regeneration studies. Li et al. [
15] conducted a study on the preparation of β-cyclodextrin polymers. The adsorption behaviour of β-Cd polymer for Pb, Cu, and Cd was investigated in terms of adsorption kinetics, isotherms, and thermodynamics. Li et al. [
16] modified starch nanoparticles and systematically investigated their stability and adsorption properties. Yang et al. [
17] fabricated an adsorbent from N-doped porous carbon sheets resulting from wheat straws through the use of molten salts via the carbonisation–functionalisation process. Fang et al. [
18] provided a new method to describe an adsorbent particle’s surface element of pollutant distribution based on statistical results.
According to these studies, many different adsorbents have been proposed for particular pollutants. Ultimately, most of the studies concentrated on modifying the inner structure, which seems to be a key point of adsorbent research. Adsorbents have also been analyzed based on some conventional methods, such as the study of adsorption kinetics and isotherms. Some of the issues that remain are as follows: (1) how to break through the limit of conventional methods and go deeper into methods to characterize the adsorption process, (2) how to reflect the process of chemical adsorption more clearly and prepare high-efficiency adsorbents, and (3) how to use greyscale and gradient recognition to reveal the adsorption process.
Based on the above issues, the content of this study includes the following aspects: (1) A more intuitive method is proposed that can distinctly explain the adsorption process of nitrogen and phosphorus. In detail, the distribution of nitrogen and phosphorus on the surface was determined by adsorption images obtained by scanning electron microscopy (SEM) mapping and judging the surface configuration of the adsorbent by greyscale and gradient recognition of SEM images. (2) Adsorption properties were studied by kinetic and isothermal adsorption experiments, and the ratio of composite adsorbents was determined based on equilibrium adsorption experiments with different ratios. (3) The adsorption mechanism, characterized by FT-IR and XRD analysis, was investigated to reveal changes in the functional groups and main material components in the adsorption process.
To achieve these targets, this paper is organised as follows: First, an analysis is presented based on the provided XRD data. XRD mainly observes the chemical composition inside an adsorbent. Then, the adsorption kinetics and isotherm experiments for natural zeolite, modified zeolite, and diatomite are performed in which an adsorbent is selected for high-efficiency removal of nitrogen and phosphorus and mixed into a composite adsorbent. Next, the optimal ratio of the composite adsorbent is determined by testing its adsorption properties. The composite adsorbent exhibiting the best adsorption performance is characterized by SEM, FT-IR, and SEM mapping. SEM is used mainly to observe the surface morphology of the adsorbent, FT-IR mainly measures the surface functional groups of the adsorbent, and SEM mapping characterization is mainly used to monitor the pollutant particles adsorbed on the surface of the adsorbent. Surface adsorption conditions were studied by using greyscale and surface gradient recognition, through which the surface configuration is evaluated, as shown in the research framework in
Figure 1.
3. Results and Discussion
3.1. X-ray Diffraction Pattern
Figure 3 displays the XRD profiles of natural green zeolite powder, sodium chloride modified green zeolite powder, thermally modified green zeolite powder, and diatomite composite. Though the natural, thermally modified and sodium chloride modified green zeolite have similar diffraction peaks, the composition of the substance changed after calcination and salt modification treatment. The main phase of the zeolite used for the experiment was silicate minerals, and raw material diatomaceous was mainly composed of cristobalite. As opposed to natural zeolite, the analcime in the thermally modified zeolite disappeared. Meanwhile, quartz and heulandite continued to exist, but a new phase appeared, which was muscovite. This may be due to the fact that zeolite is calcined at high temperatures, which accounts for the change in the crystal structure of natural zeolite, and the elements in the zeolite mutually diffused and reacted with analcime and phlogopite to produce a new phase or solid solution. When zeolite is modified with sodium chloride, some metal salt in the zeolite participates in the reaction, the content of sodium in the sodium chloride modified green zeolite increases and the entire substance is negatively charged. Due to the insertion of sodium ions, the atomic radius increased, which could improve the ability to adsorb ammonia nitrogen.
3.2. Adsorption Kinetics
3.2.1. Nitrogen Adsorption Kinetics
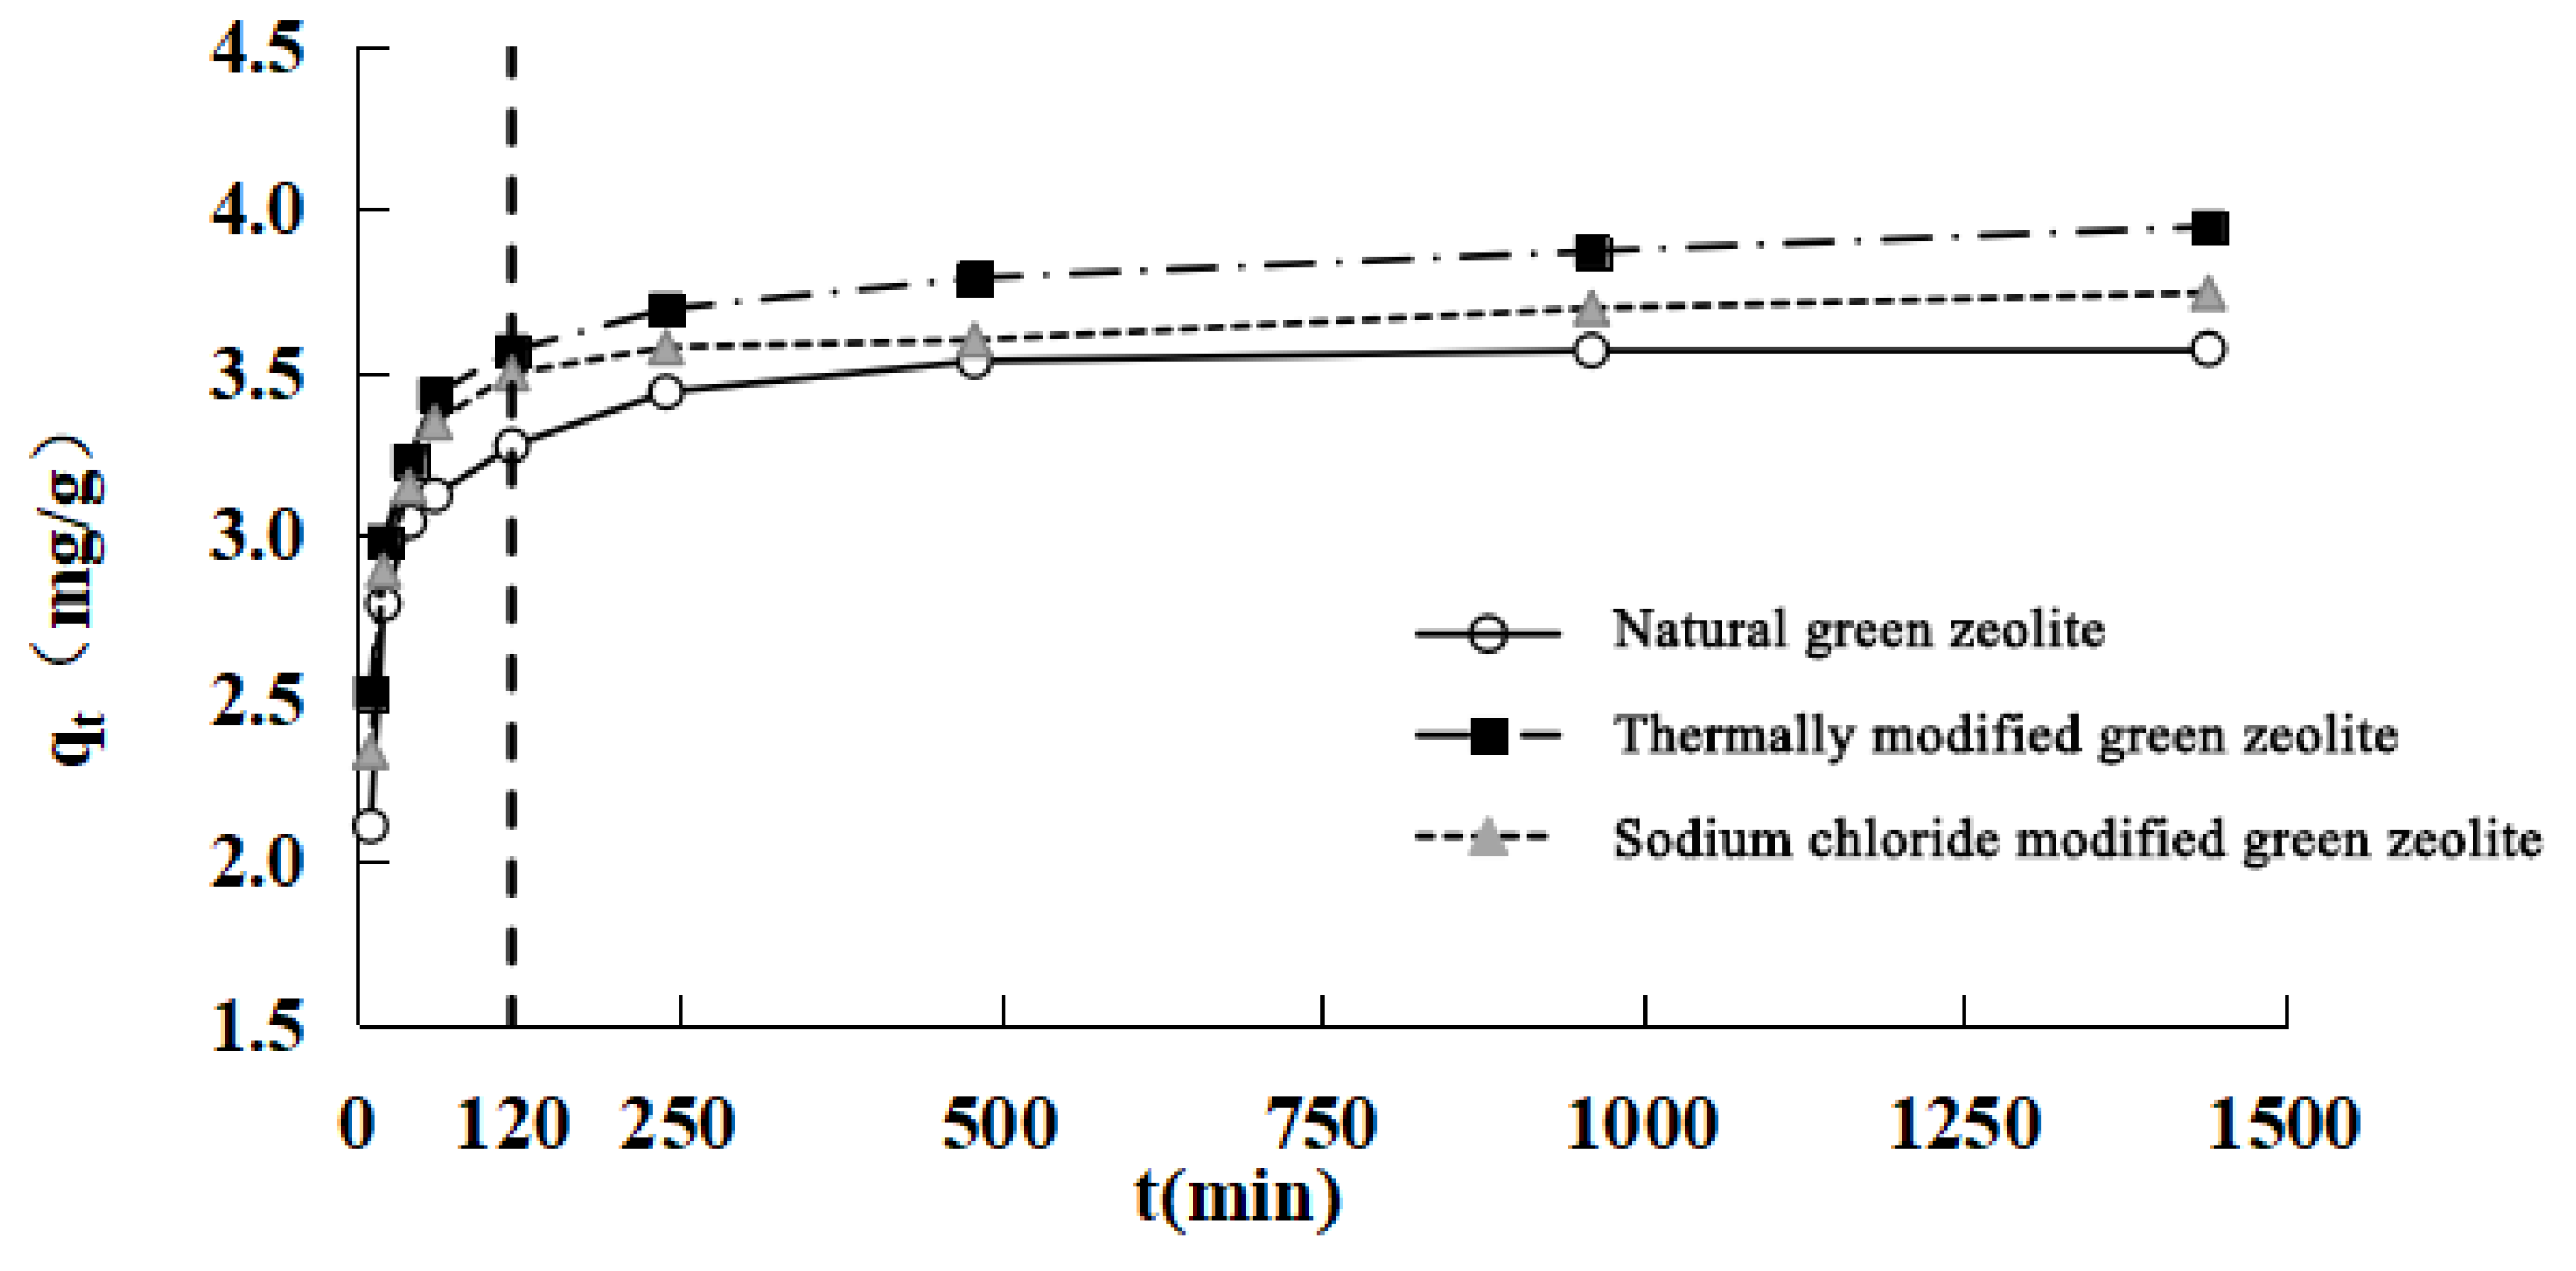
The nitrogen adsorption kinetics of modified green zeolite at different initial concentrations was investigated by varying the contact time, and the results are presented in
Figure 4. It is evident that the adsorption process could be divided into two stages. First is the rapid stage, which occurs before 120 min. In this stage, the three types of zeolites exhibited the phenomenon of rapid adsorption, because the concentration of adsorbate was high at the initial stage of the adsorption process, and there were more available adsorbates for adsorption of the zeolites. Second is a gradually slower stage that occurs after 120 min, in which the adsorption equilibrium is achieved over time, and the adsorption rate was low compared with the initial stage of adsorption. This stage lasted longer, hence the phenomenon could be characterized as “fast adsorption, slow saturation.”
For further explanation of the adsorption kinetics, two other kinetic models, pseudo-first-order and pseudo-second-order, were employed. The pseudo-first-order kinetic model is expressed in Equation (3):
where
qe and
qt (mg/g) are the amounts of nitrogen adsorbed on adsorbents at equilibrium and contact time
t (min), respectively, and
k1 is the rate constant of the model (min
−1). The values of
k1 and
qe can be obtained from the slope and intercept of the linear plots of ln(
qe −
qt) versus
t, as shown in
Table 1. The
qe values of natural, NaCl modified and thermally modified green zeolite were calculated (3.40, 3.66, 3.53 mg/g), showing only a small difference compared with the experimental data (3.57, 3.95, 3.74), and the correlation coefficient values (
R2) are 0.8915, 0.8334, 0.7332. These show that the experimental data are not consistent with the pseudo-first-order model. The pseudo-second-order model is represented as Equation (4):
where
k2 (g/mg·min) is the rate constant for adsorption. As we can see in
Table 1, the values of
k2 and
qe can be obtained from the slope and intercept of the plot of
t/qt versus
t. It is noticeable that the calculated
qe values for natural, NaCl modified and thermally modified green zeolite of the pseudo-second-order kinetic model (3.59, 3.95, 3.75) are closer to those of the experimental data (3.57, 3.95, 3.74), and the
R2 values (1.0, 0.9999, 0.9998) are higher than those of the pseudo-first-order model, which indicates that the pseudo-second-order kinetic model is more suitable for the adsorption of nitrogen. This indicates that the adsorption of ammonia nitrogen by zeolite is chemical adsorption. This also indicates that the removal of ammonia nitrogen by zeolite is mainly based on ion exchange and supplemented by physical adsorption, consistent with the related studies [
19,
20].
Although the pseudo-first-order and pseudo-second-order kinetic models demonstrated the process of adsorption, the intraparticle diffusion model can perform a deeper study of the process of adsorbing pollutants to determine whether the diffusion mechanism is a limiting step in the adsorption process.
The mathematical equation for the intraparticle diffusion model is:
where
ki is the intraparticle diffusion rate parameter.
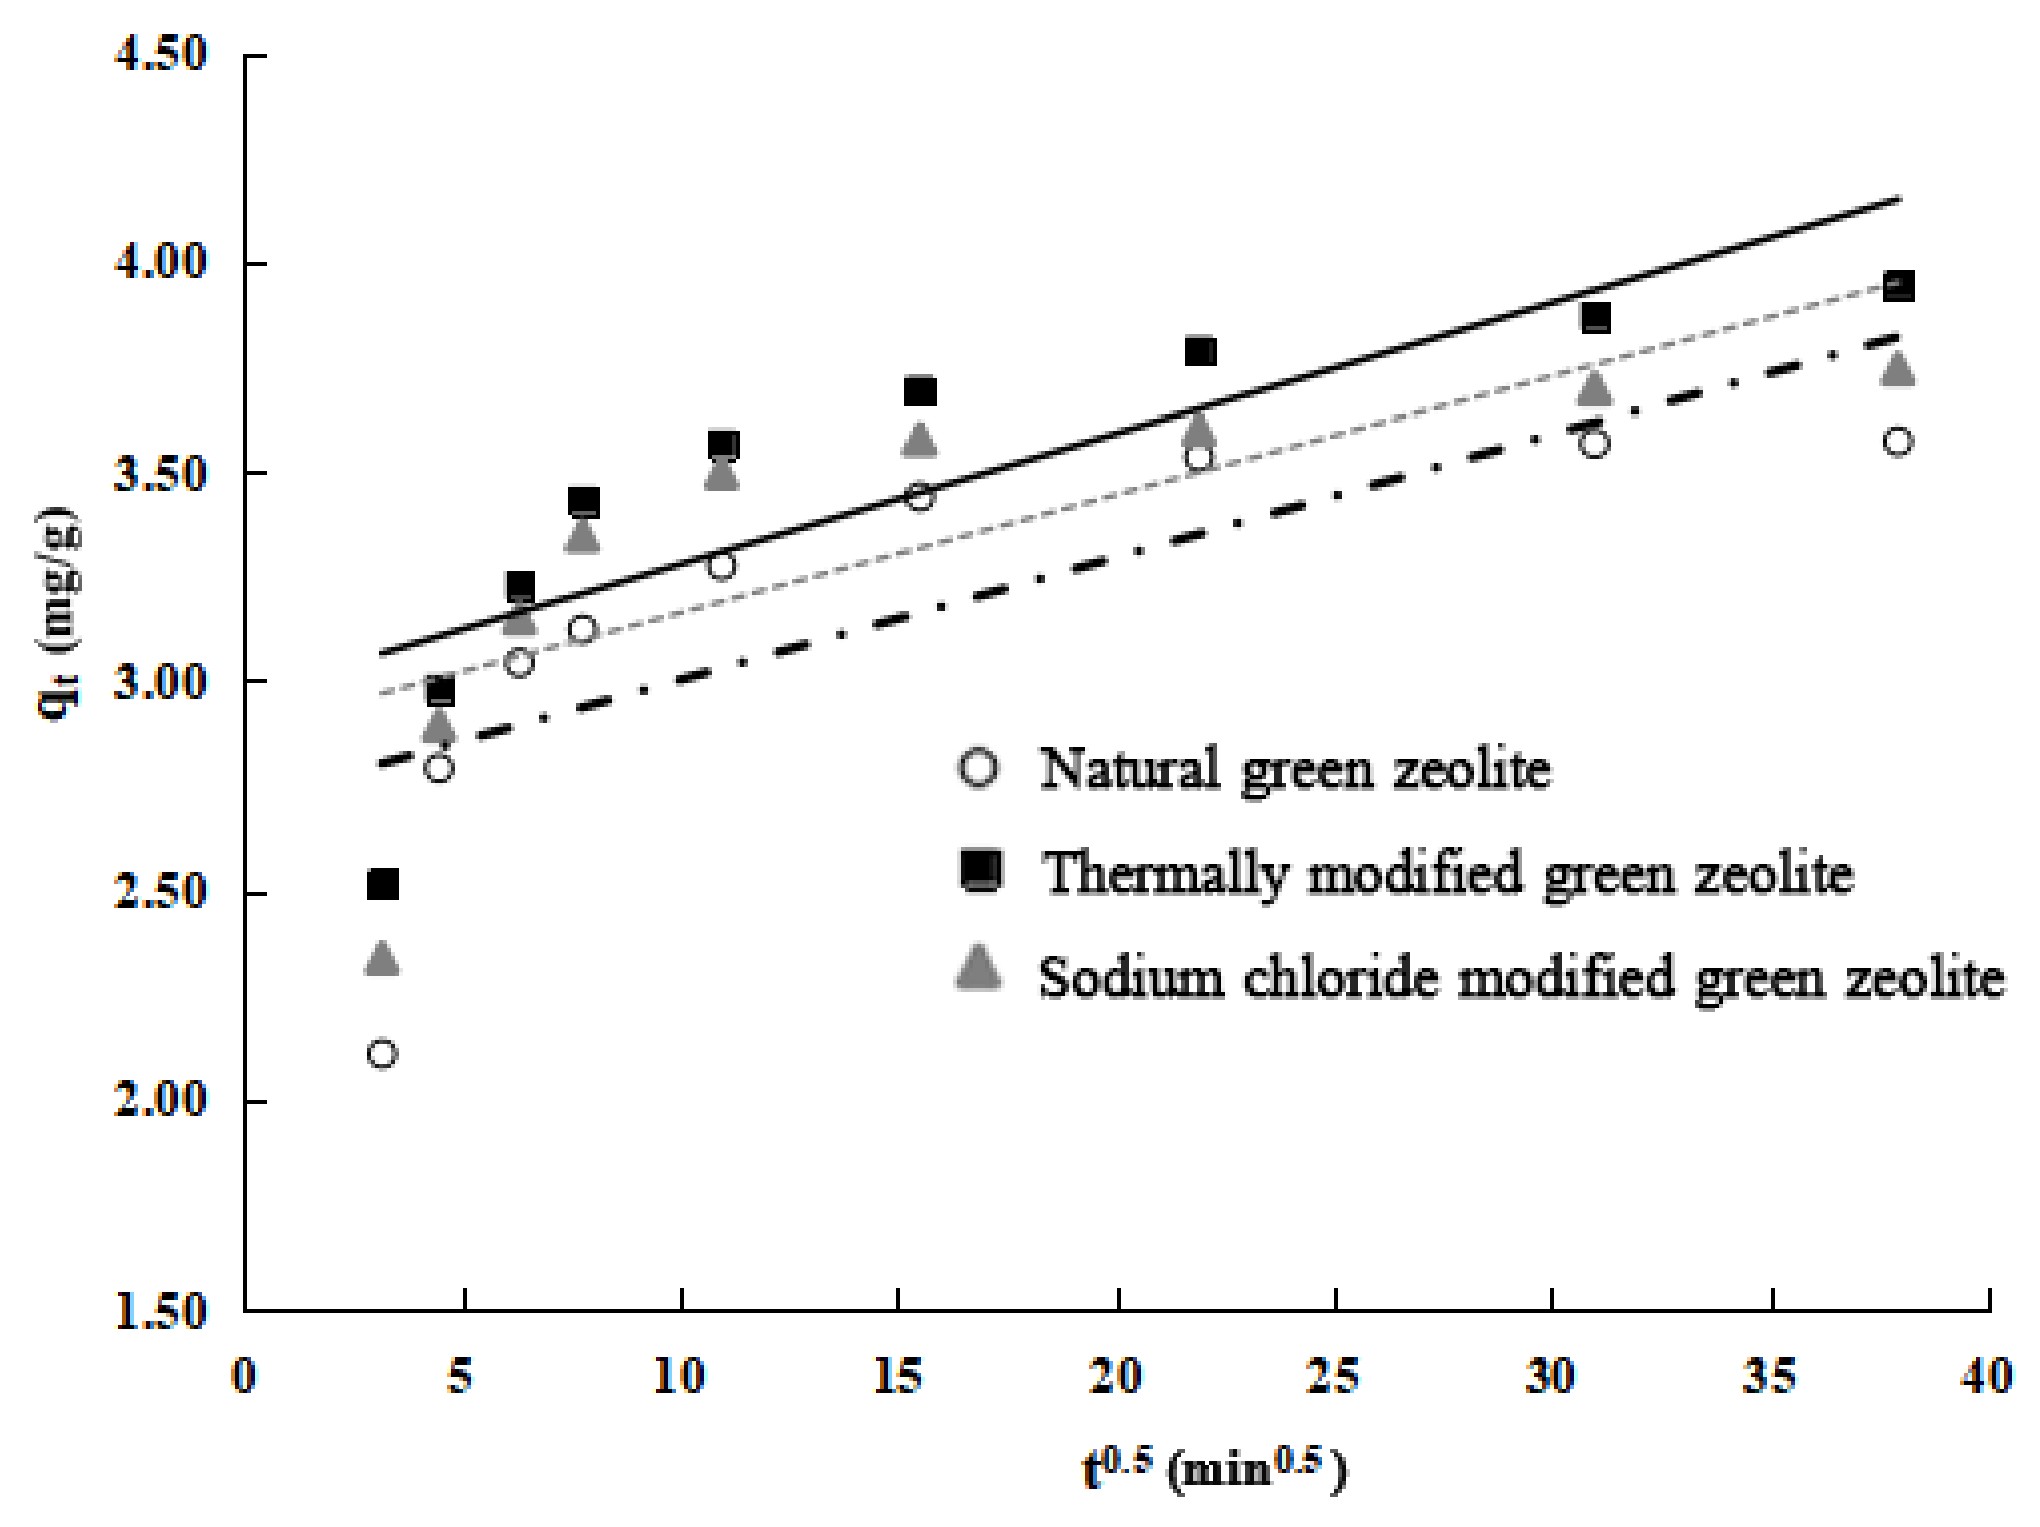
Figure 5 shows that the nitrogen adsorption process of the three types of zeolite can be roughly divided into three stages: first is the rapid external surface adsorption stage; second is the gradual adsorption stage, and intraparticle diffusion is the rate-limiting step of the process in this stage; and third is the final balanced stage. The fitting curve of the second stage clearly does not pass through the origin, which indicates that intraparticle diffusion is not the only rate-limiting step in the adsorption stage, and the rate-limiting step in the gradual adsorption stage includes both liquid film and intraparticle diffusion [
21].
3.2.2. Phosphorus Adsorption Kinetics
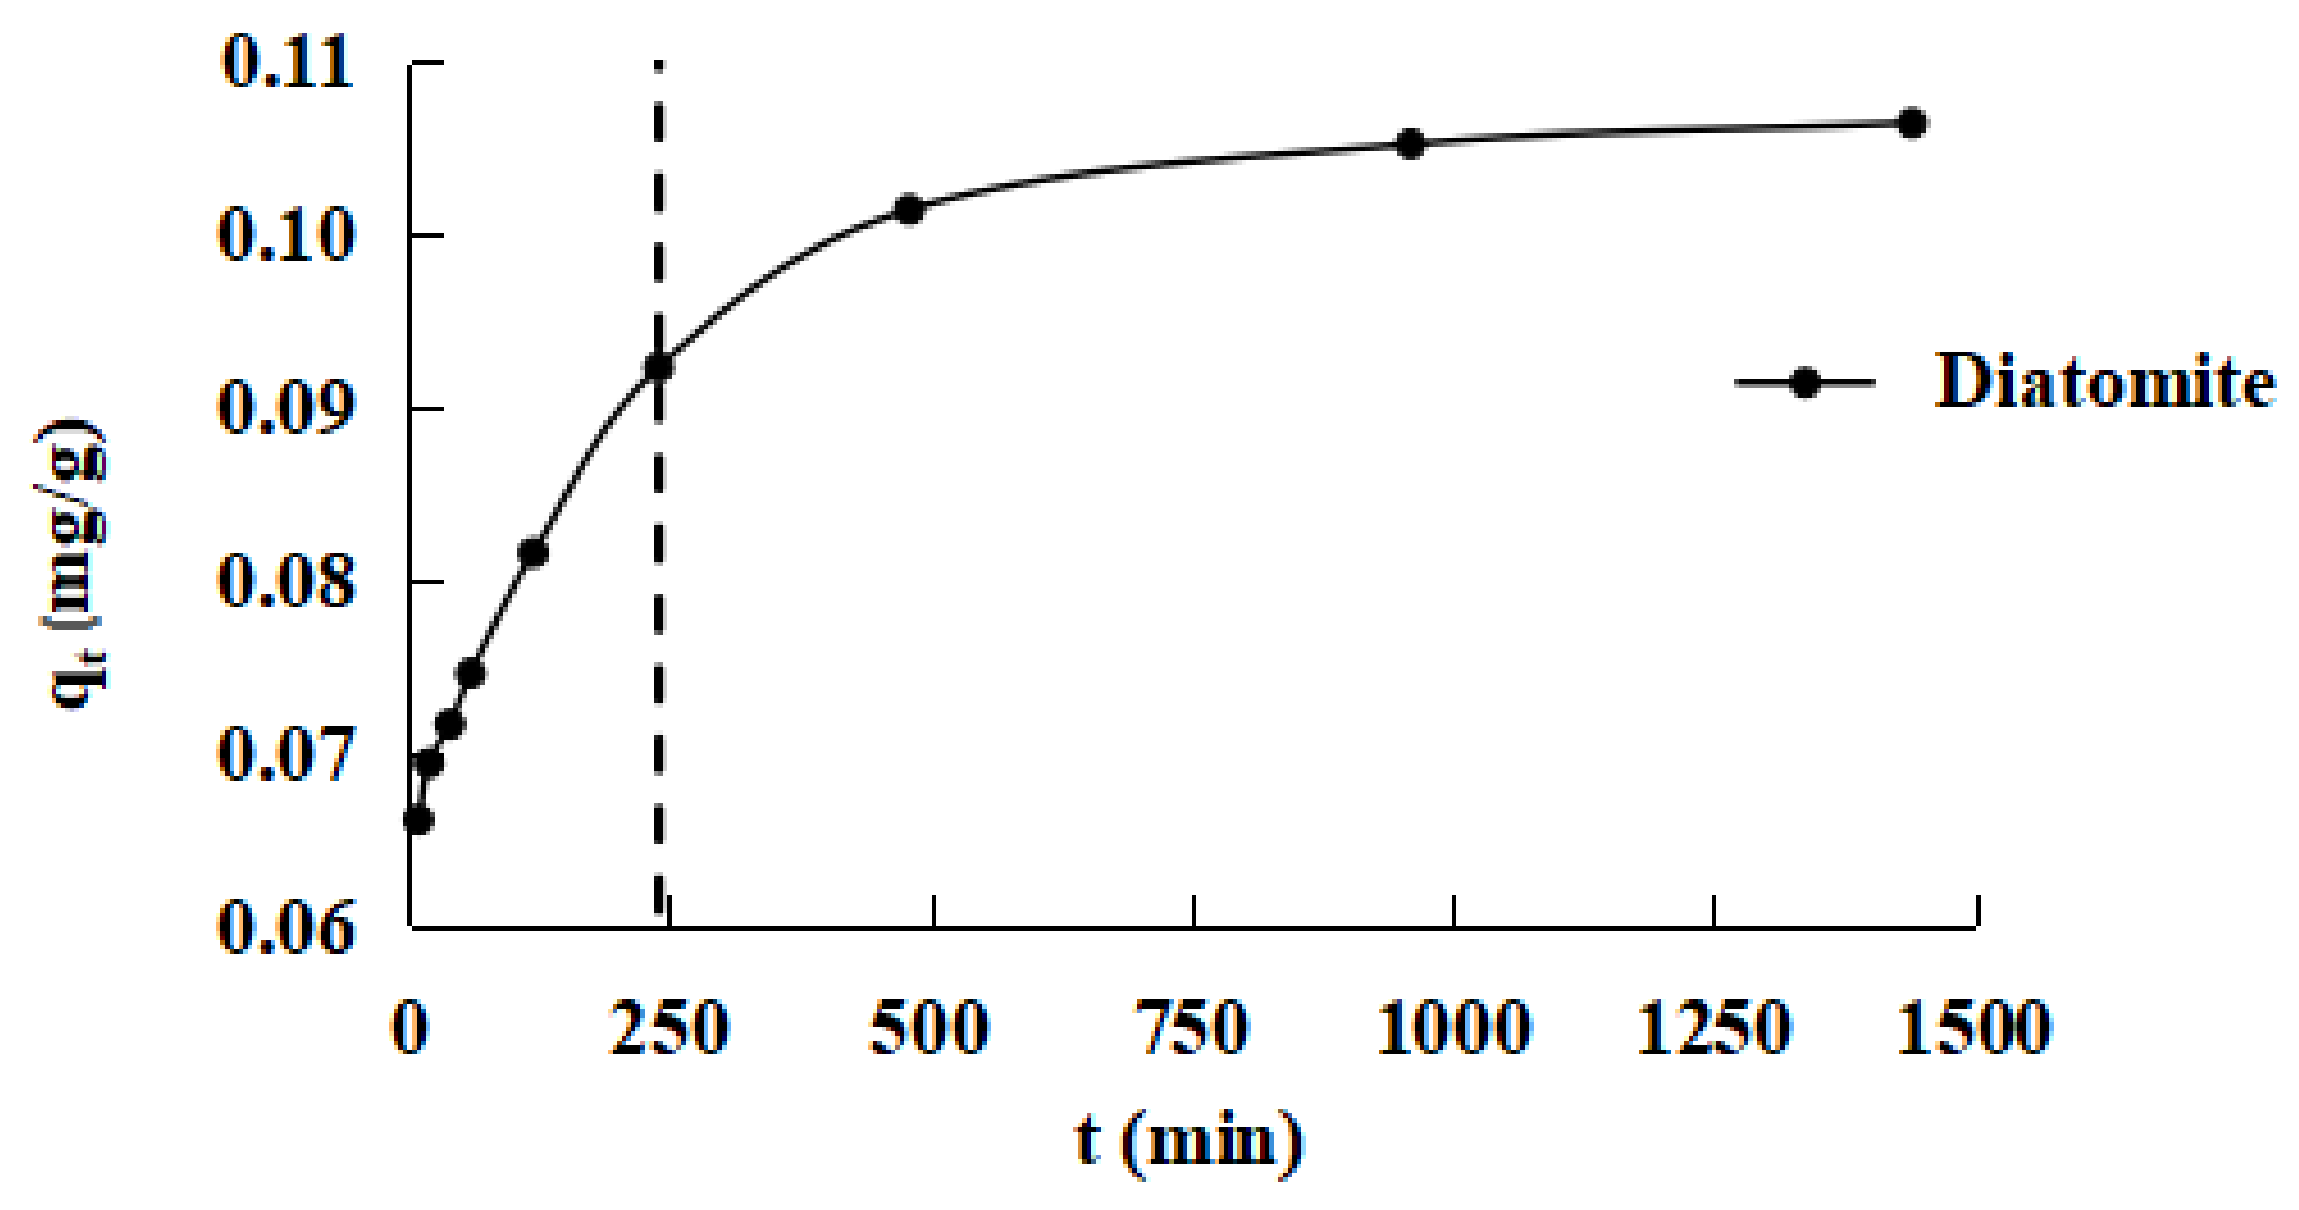
The phosphorus adsorption kinetics of diatomite are shown in
Figure 6. The figure shows that the unit adsorption capacity of diatomite on phosphate gradually increases with the increased reaction time until an equilibrium is reached. It was shown that the adsorption process could also be divided into two parts: a rapid stage before 240 min, which may be due to the higher concentration of phosphorus during the initial adsorption stage, and the middle and later stages of the process after 240 min, in which the adsorbent gradually reaches saturation and the adsorption rate is lower, which is longer than that in the initial stage. This phenomenon can be characterized as “rapid adsorption, slow saturation.”
The pseudo-first-order and a pseudo-second-order kinetic models were used to fit the experimental data. The results are shown in
Table 2. The table shows that equilibrium adsorption capacity
qe obtained by the pseudo-second-order kinetic model is closer to the equilibrium adsorption quantity
qt, and
R2 is higher. The pseudo-second-order kinetic model is more suitable for describing the adsorption of diatomite onto phosphorus in water than the pseudo-first-order model. Therefore, the adsorption of ammonia phosphorus by diatomite is chemical adsorption. Chemical adsorption involves valence forces in which the adsorbent and adsorbate share or exchange electrons.
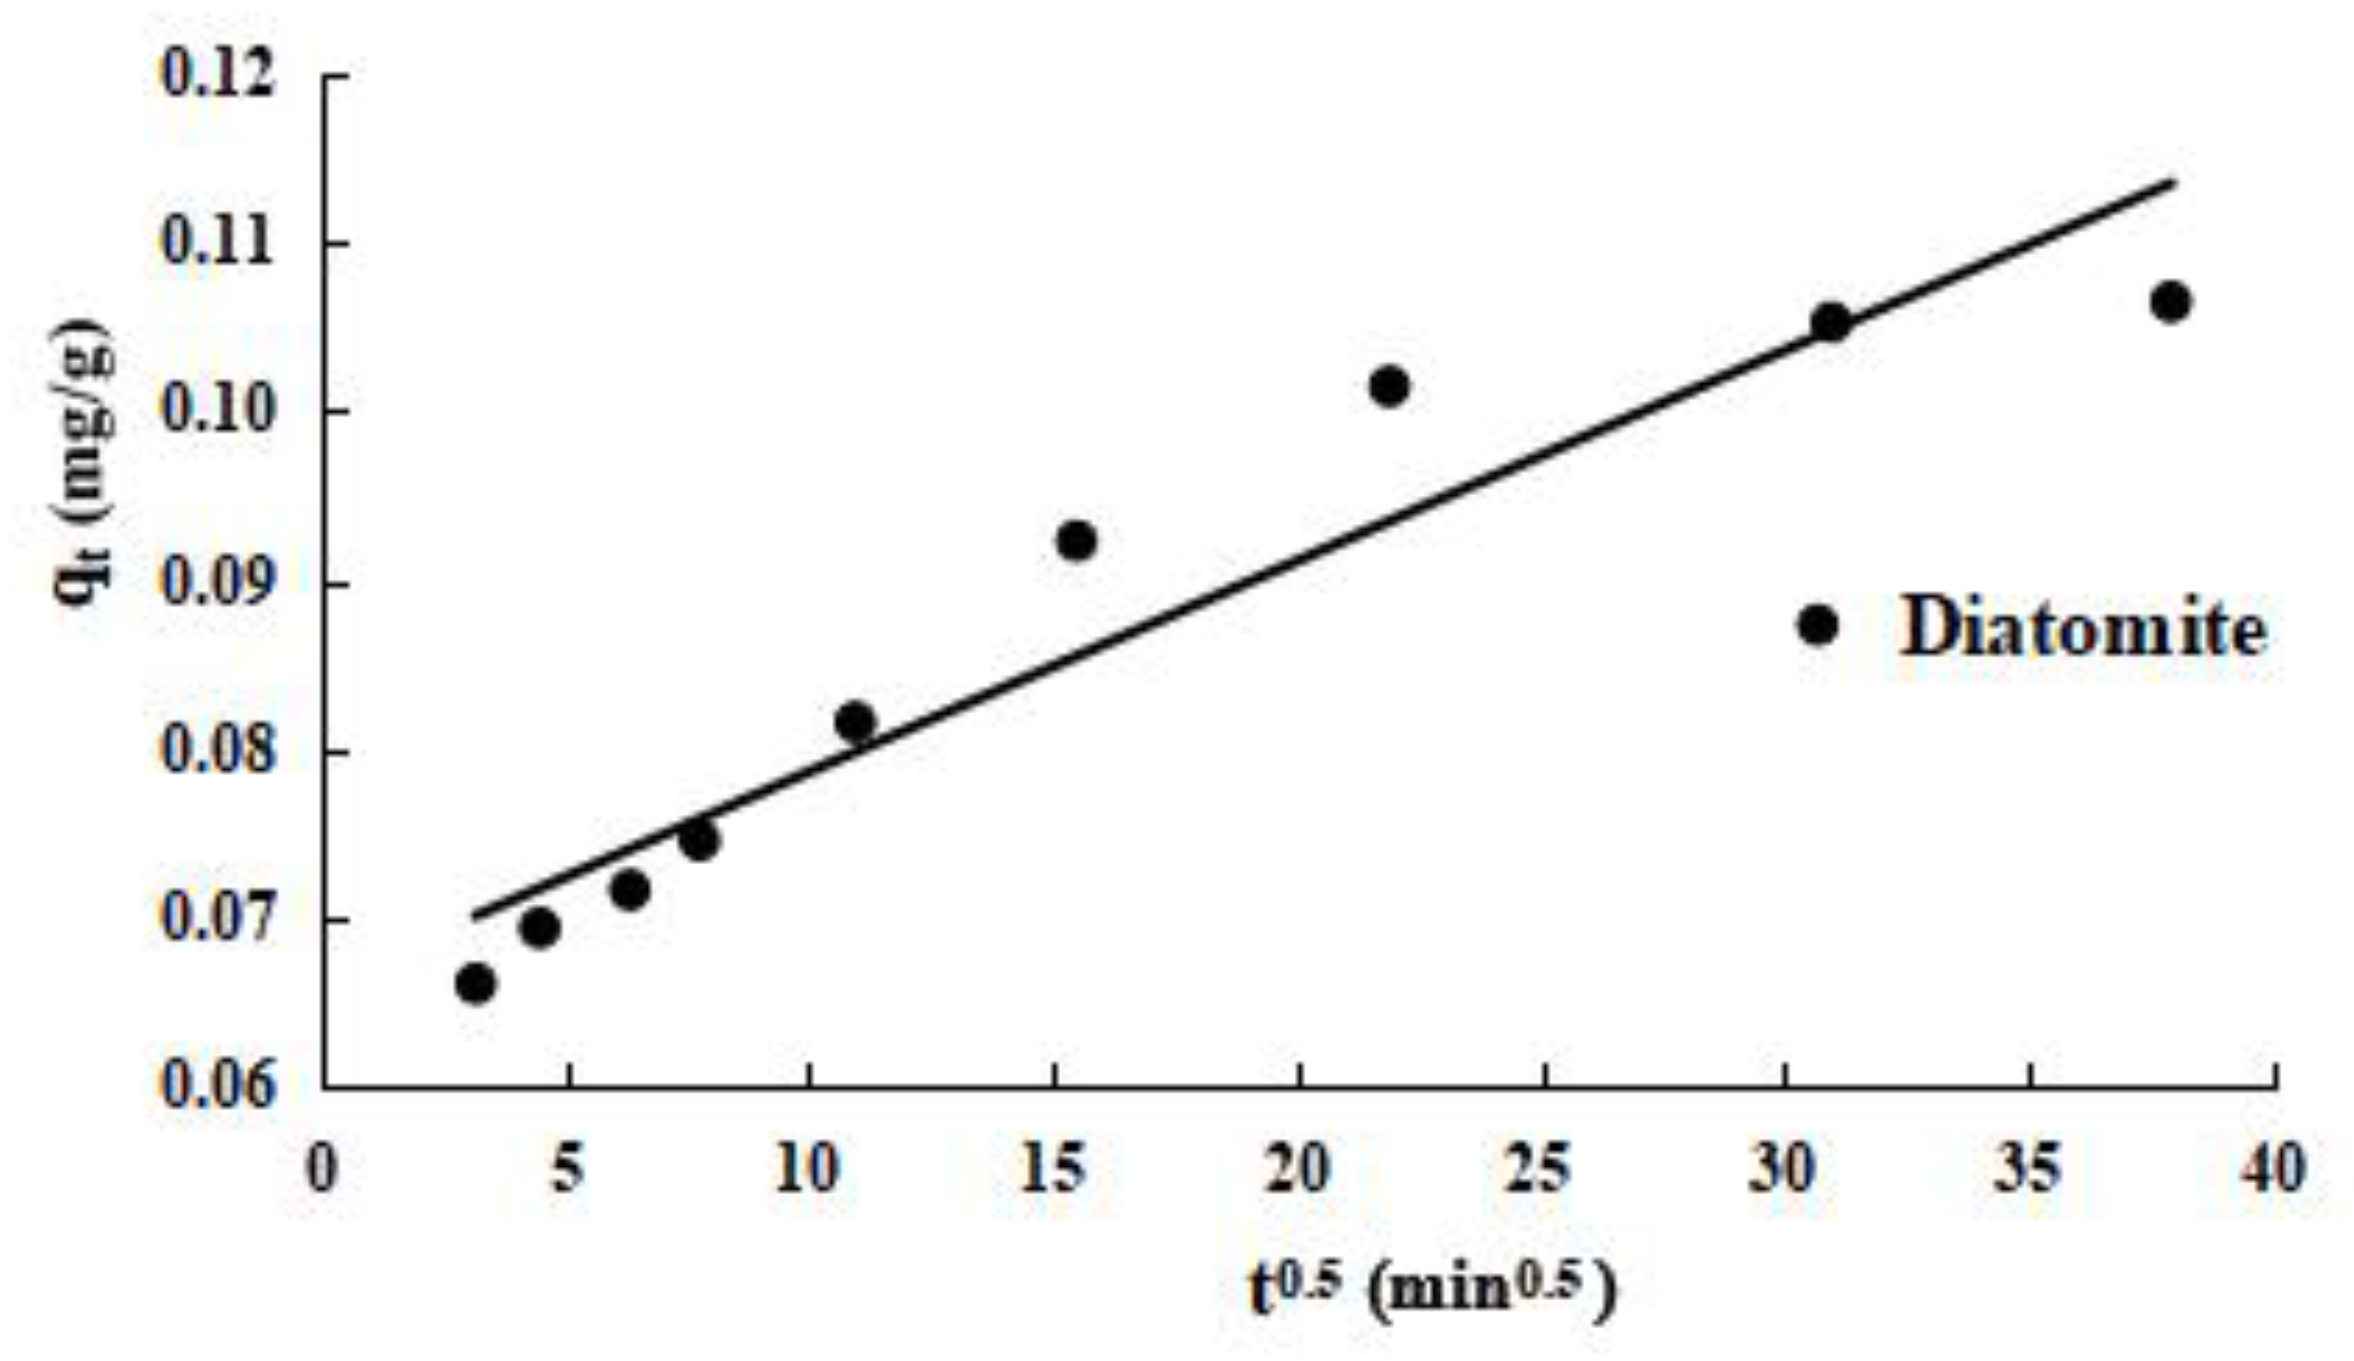
The intraparticle diffusion model is used to further study the process of diatomite kinetic adsorption. The experimental results are shown in
Figure 7. From the curves of
qt fit to
t0.5 of diatomite adsorbed phosphorus in
Figure 7, the adsorption of phosphorus can be roughly divided into three stages: first is rapid adsorption on the outside surface, second is gradual adsorption, and third is the final balancing. The fitting curve for stage 2 clearly does not pass through the origin, indicating that intraparticle diffusion is not the only rate-limiting step in the gradual adsorption phase of diatomite. Instead, the rate-limiting step includes liquid film and intraparticle diffusion.
3.3. Adsorption Isotherms
3.3.1. Adsorption Isotherms of Three Kind of Zeolites
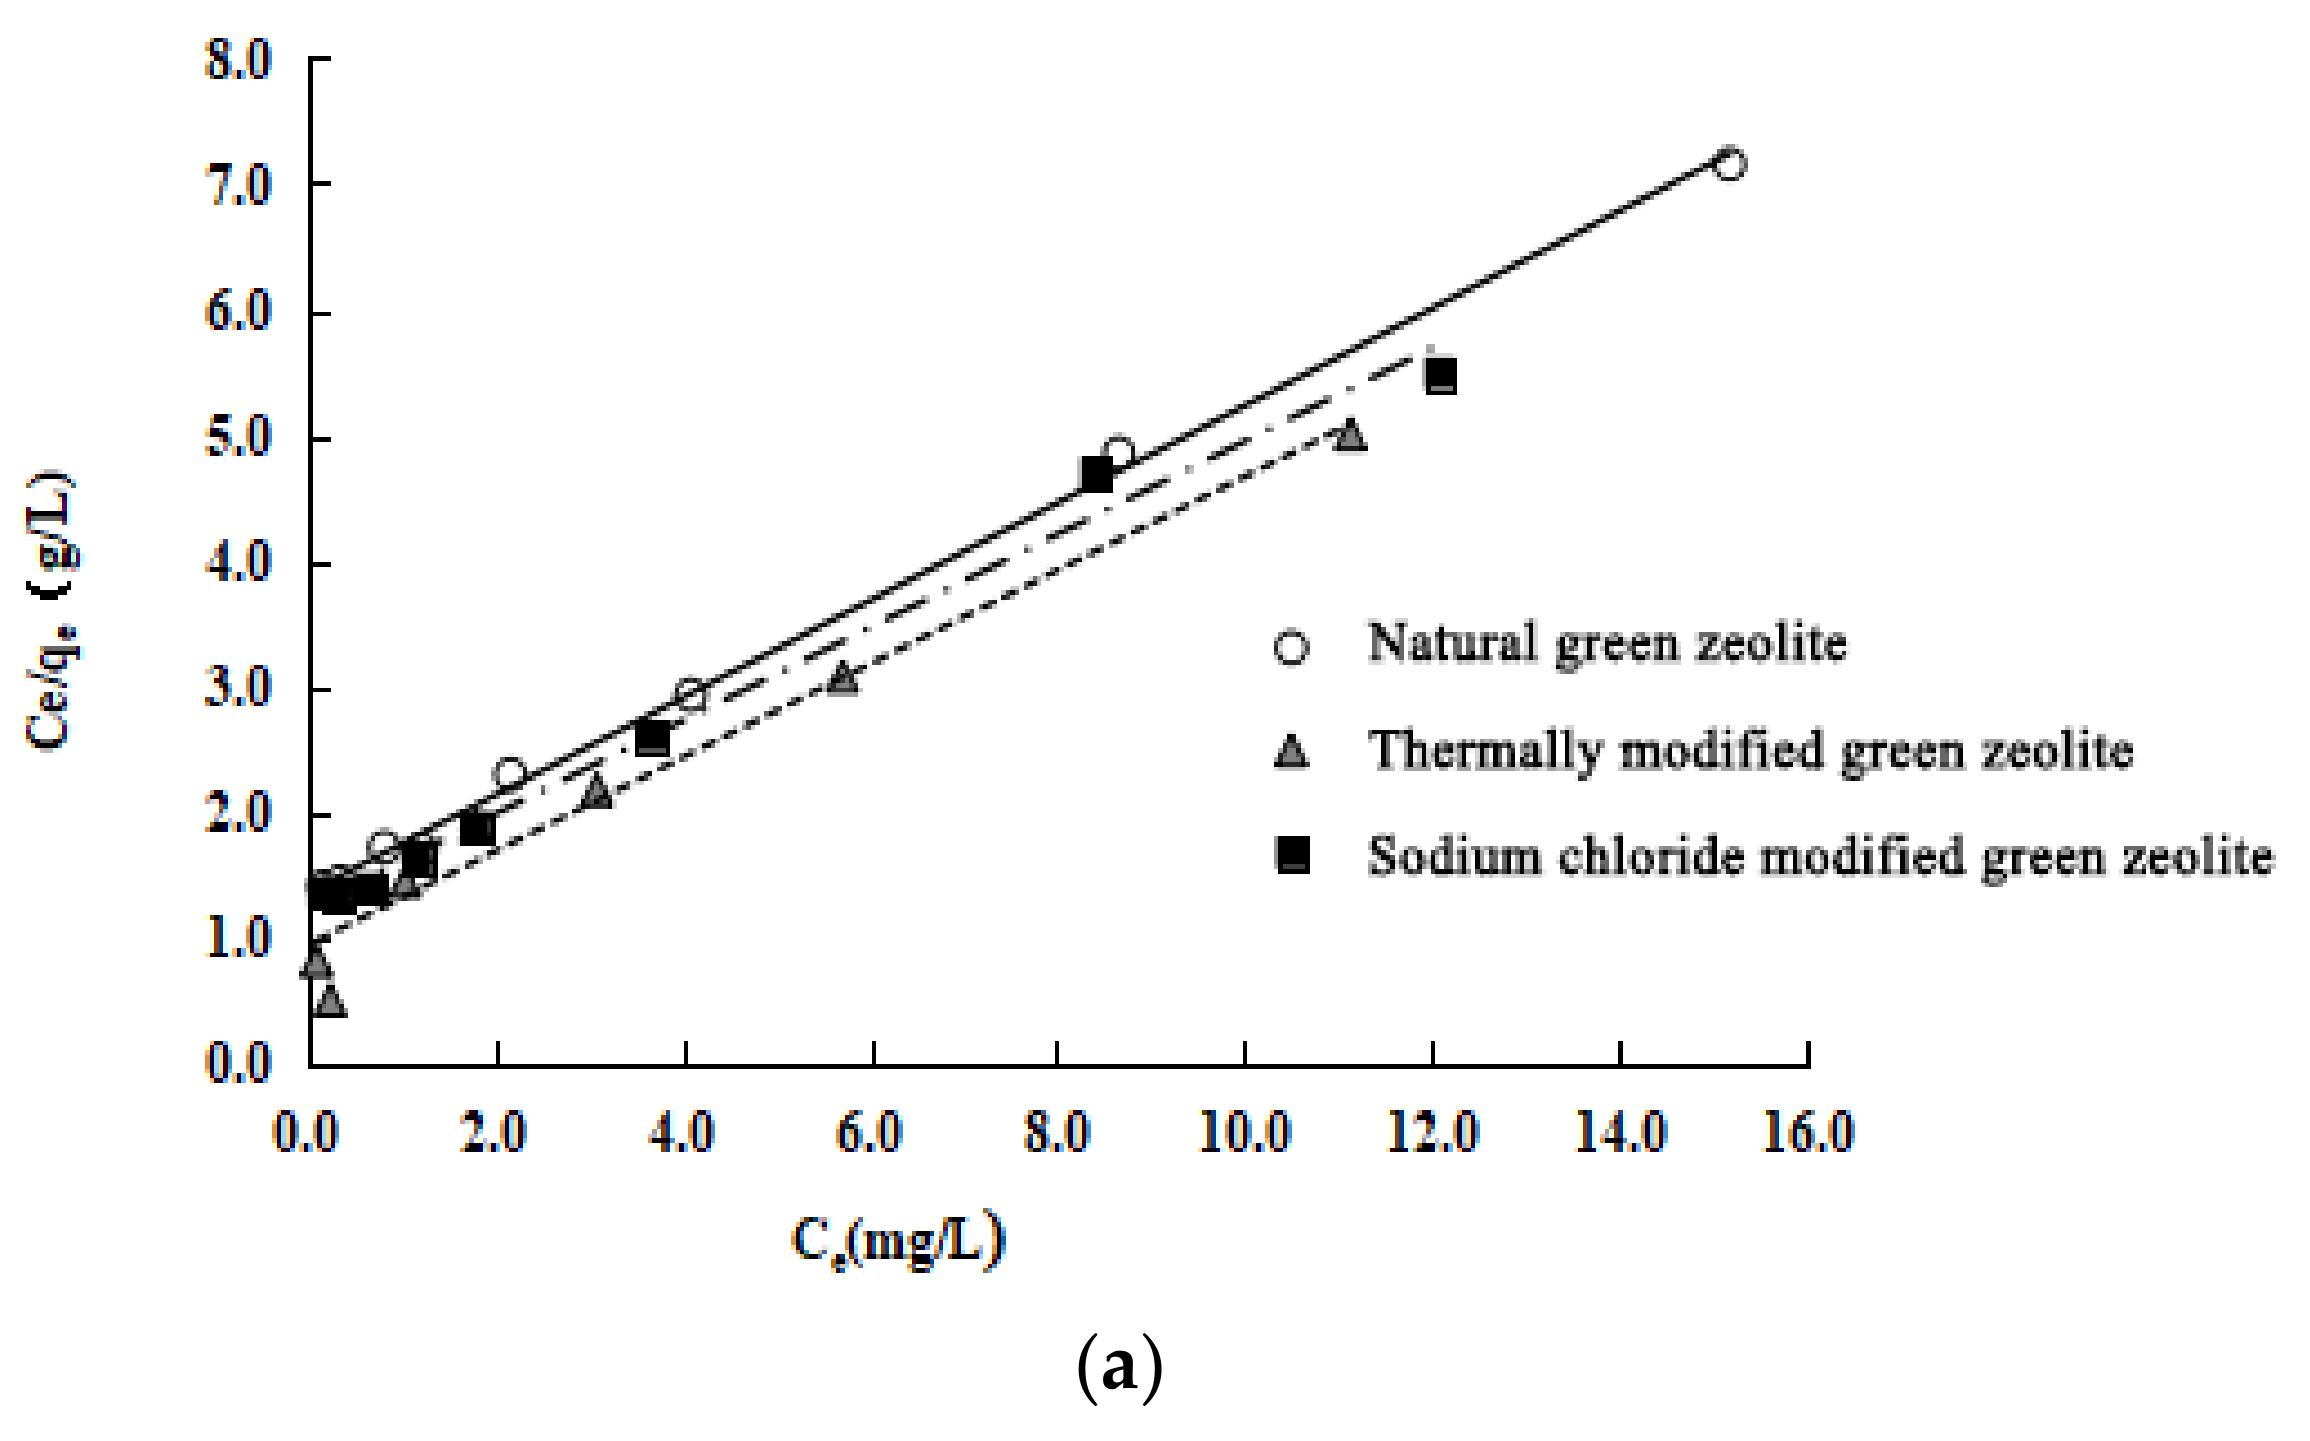
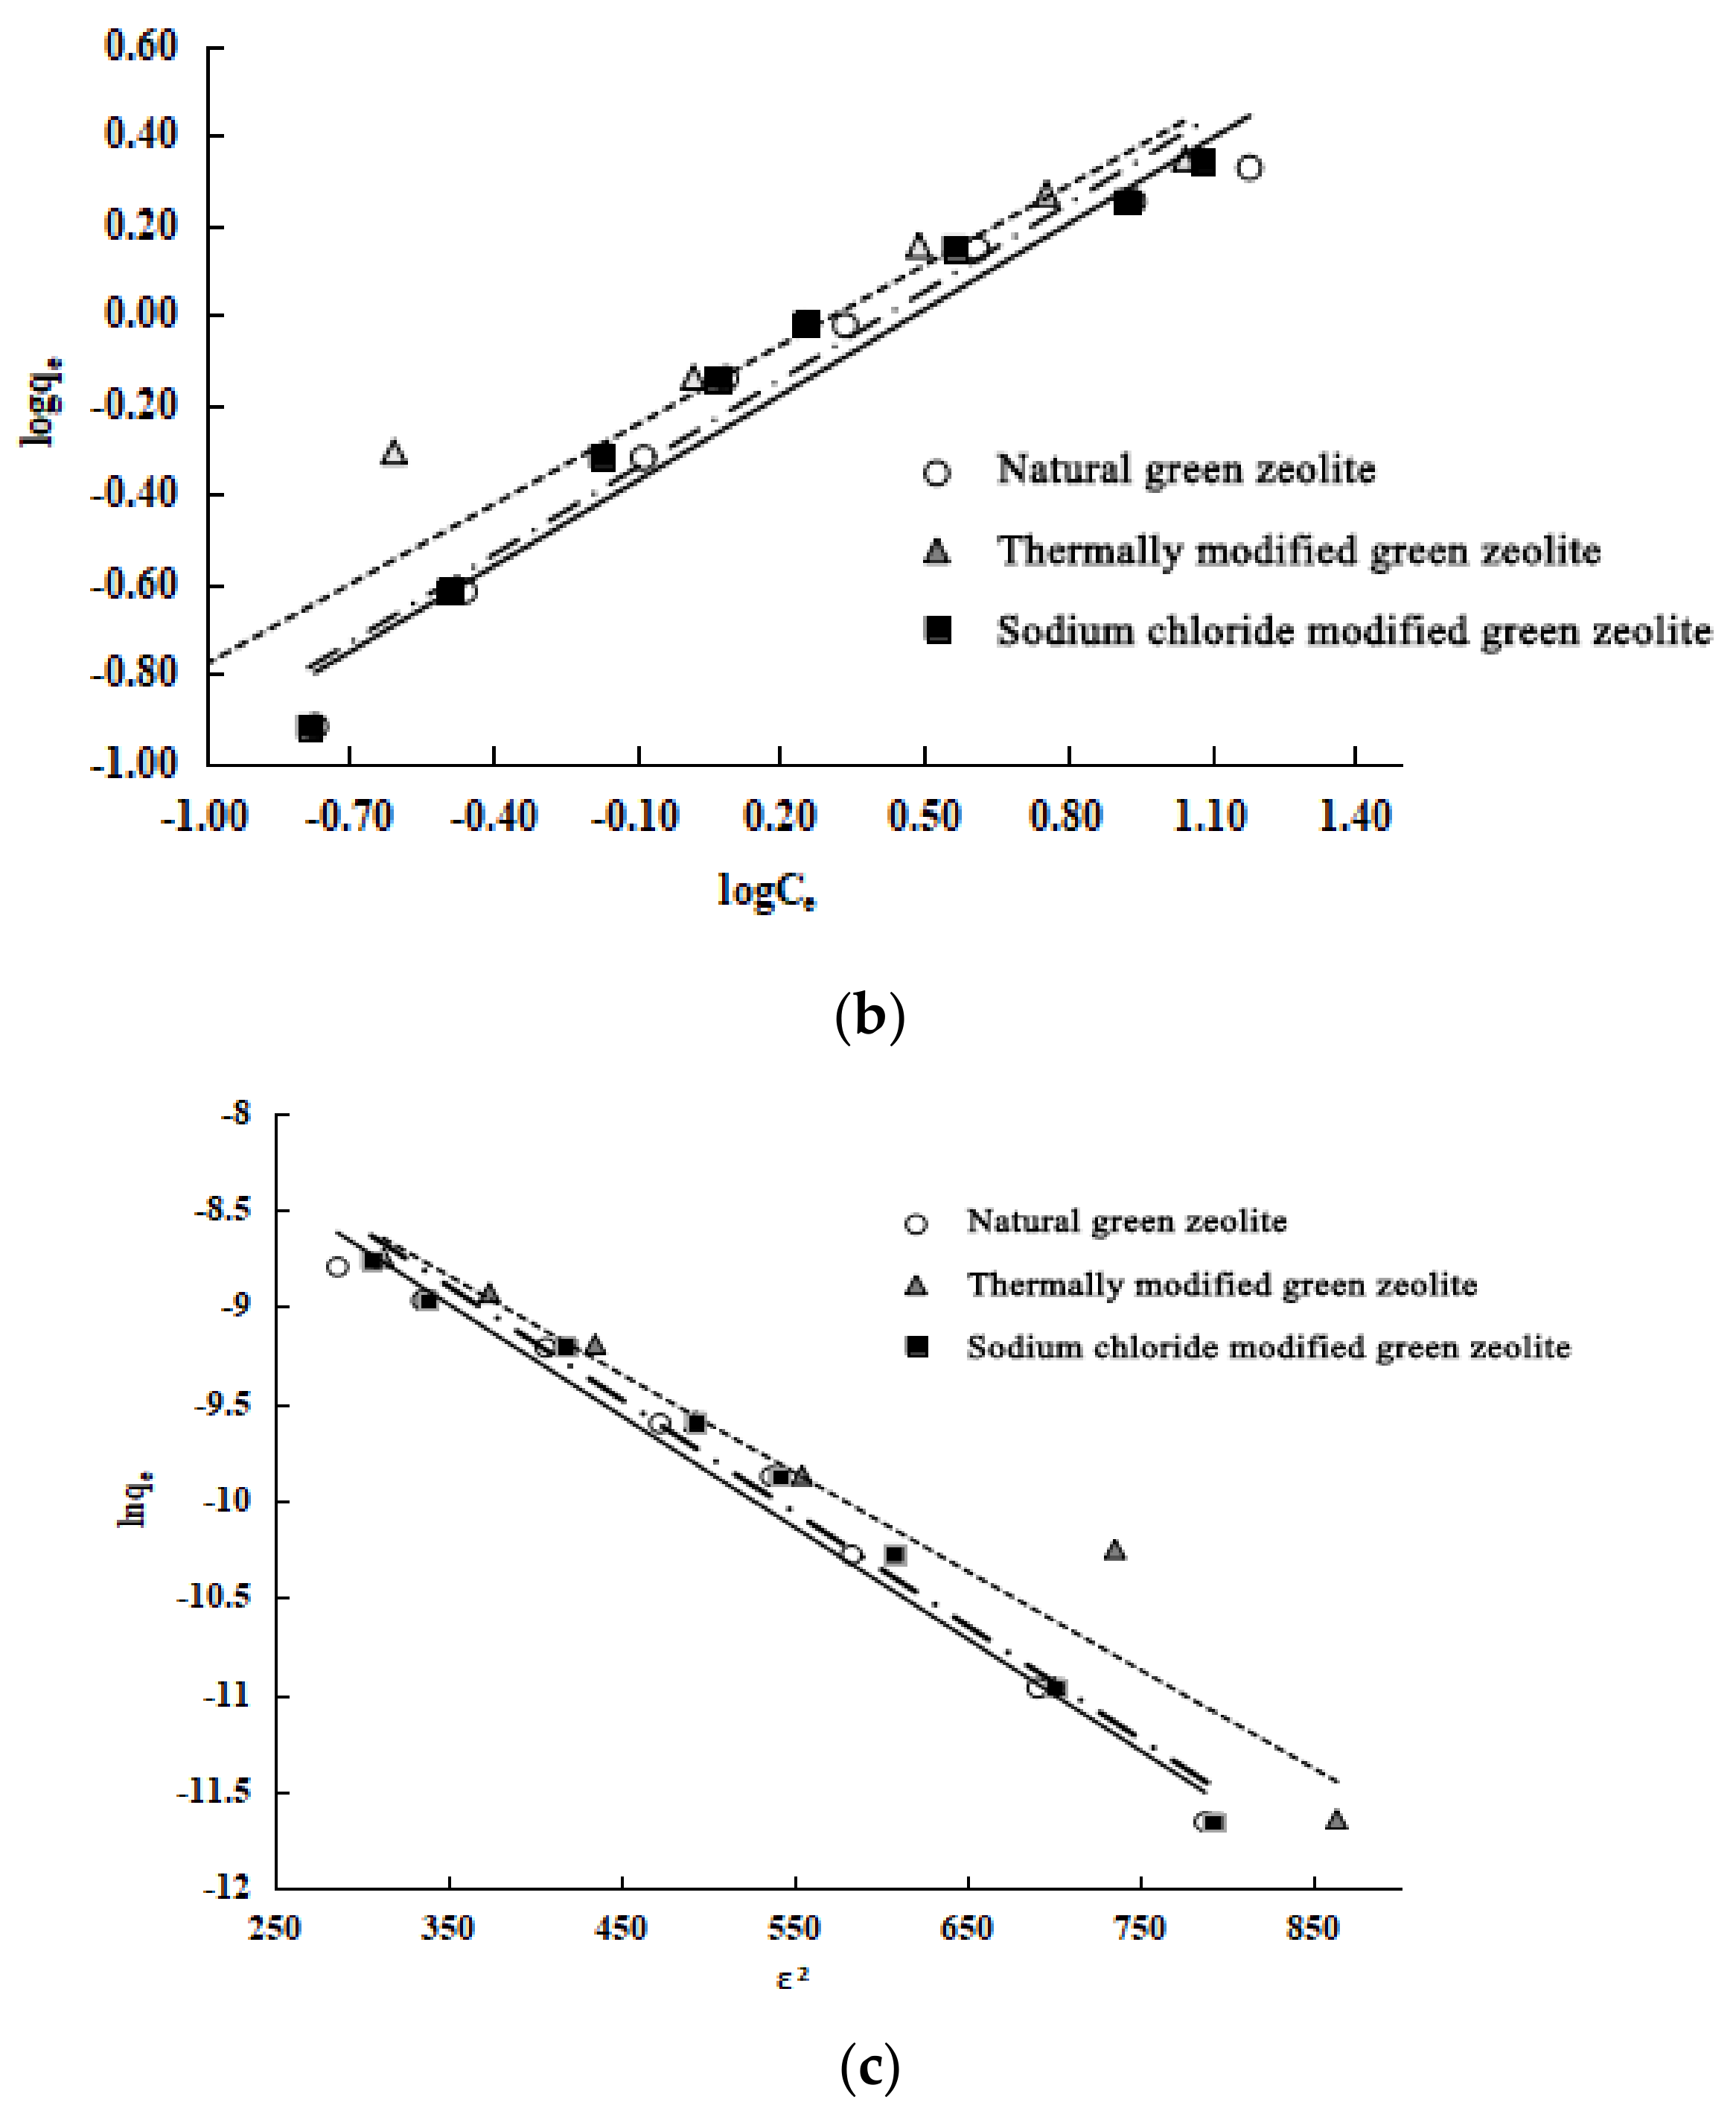
To clearly understand the surface properties and adsorption behaviour of the three types of zeolite, their adsorption onto nitrogen was investigated by fitting the experimental data with the Langmuir, Freundlich [
22], and Dubinin–Radushkevich (D–R) [
23] isotherm models. The models are shown in
Figure 8a–c. The Langmuir model is based on the assumption that adsorption is localised on a monolayer and there is no interaction between the adsorbed pollutants; the Freundlich isotherm assumes that the process of adsorption occurs on a heterogeneous surface. The three isotherm equations are expressed as follows (Equations (6)–(8)):
where
KL is the Langmuir isotherm constant,
qe represents the equilibrium adsorption capacity (mg/g),
Ce represents the balance mass concentration (mg/L),
qmax represents the maximum adsorption capacity of the three types of zeolite on nitrogen, and
KF and n are constants. When the Freundlich isotherm model has a 1/n value between 0 and 1, it is classified as preferential adsorption [
24].
KF (mg/g) and 1/n are the Freundlich constants related to adsorption capacity and intensity, respectively.
KD is the constant related to adsorption energy (mol
2/kJ
2);
ε =
RTln(1+1/
Ce);
R is the ideal gas constant, 8.314 J/mol·K;
T is absolute temperature (K). When the average adsorption energy
E of the adsorbed material is between 8 and 16 kJ/mol, the adsorption process is classified as ion exchange;
E is the mean free energy of adsorption,
E = 1/(2
KD)
0.5.
The Langmuir, Freundlich, and D–R models are used to study the isothermal adsorption processes of the three types of zeolite. The experiment results, shown in
Table 3, are as follows: (1) These three models can describe the isothermal adsorption process of the three kinds of zeolite on nitrogen. (2) The adsorption isotherm is more consistent with the Langmuir model because of its higher correlation coefficients. The Langmuir model assumes that these adsorbents undergo monolayer adsorption. (3) The maximum adsorption capacity of the three types of zeolite is calculated as follows: natural green zeolite, 0.8644 mmol/L; thermally modified green zeolite, 1.0660 mmol/L; and sodium chloride modified green zeolite, 0.9430 mmol/L. (4) The parameter 1/n of the adsorption models of natural, thermally modified and NaCl modified zeolite are 0.6512, 0.5920, and 0.6351, respectively, which shows that the nitrogen adsorption process of the zeolites belongs to the preferential adsorption class. (5) The average adsorption energy (
E) values of natural, thermally modified, and NaCl modified zeolite calculated by parameter
KD of the
D–R model are 9.2851 kJ/mol, 9.9010 kJ/mol, and 9.2851 kJ/mol, ranging from 8 kJ/mol to 16 kJ/mol, indicating that the nitrogen adsorption of the zeolites can be classified as ion exchange.
3.3.2. Adsorption Isotherms of Diatomite
The experimental results of investigating the adsorption process of diatomite by the Langmuir, Freundlich, and D–R models [
25] are shown in
Table 4. From the fitting results, we can find the following: (1) The three models can describe the isothermal adsorption of diatomite onto phosphate. (2) Compared with the Langmuir and Freundlich models, the D–R model can describe this process more completely. (3) The Freundlich model parameter 1/n of diatomite is 0.8146, which is between 0 and 1, hence it can be classified as preferential adsorption. (4) The average adsorption energy (
E) value of diatomite calculated by parameter
KD of the D–R model was 9.53 kJ/mol, ranging from 8 kJ/mol to 16 kJ/mol, indicating that the phosphate adsorption of diatomite is ion exchange.
3.4. Adsorption Experiment of Composite Adsorbent
The adsorption capacity of composite adsorbent on nitrogen and phosphorus was investigated by regulating the proportion of the mix of thermally modified green zeolite and diatomite, presented in
Figure 9. As the proportion of thermally modified zeolite in the composite adsorbent is decreased gradually, the ability of the composite adsorbent to adsorb nitrogen in water gradually decreases. Similarly, as the proportion of diatomite accounts for the gradual increase in composite adsorbent, the phosphate adsorption ability of composite adsorbent in water also gradually increases. When the ratio of thermally modified zeolite to diatomite is 2:3, the composite adsorbent exhibits good efficiency to adsorb nitrogen and phosphorus in water, with a removal efficiency of 88.54% and 91.08%, respectively. When the ratio of thermally modified zeolite to diatomite is 3:2, the composite adsorbent removal rate of nitrogen and phosphorus is 92.07% and 84.61%, respectively. According to experimental studies, nitrogen pollution is more serious than phosphorus pollution in farmland drainage. Therefore, we decided to use composite adsorbent with a compound ratio of 3:2 for in-depth study. Up to now, there have been some studies on the removal of nitrogen and phosphorus from water by modified zeolite and diatomite. Stocker et al. [
26] investigated the influence of highly concentrated reagents (NaCl, 22.36%; HCl, 20%; NaOH, 32%) on the mineralogy (e.g., structure and mineral chemistry) and NH
4+ exchange capacity of a natural zeolite (particle size 0.05–0.2 mm). Based on adsorption performance experiments, NaCl–zeolite was shown to be an excellent material to adsorb nitrogen, and the removal rate reached about 65%. Wu et al. [
27] proposed a highly efficient adsorbent for low-concentration phosphate removal from aqueous solution made of hydrated lanthanum (La) oxide-modified diatomite composite (La-diatomite). The maximum capacity to remove phosphorus reached 96%. By comparison, it was found that the composite adsorbent in this study had a better adsorption effect on ammonia nitrogen and phosphorus in water.
3.5. Fourier Transform Infrared Spectroscopy (FT-IR) Analysis
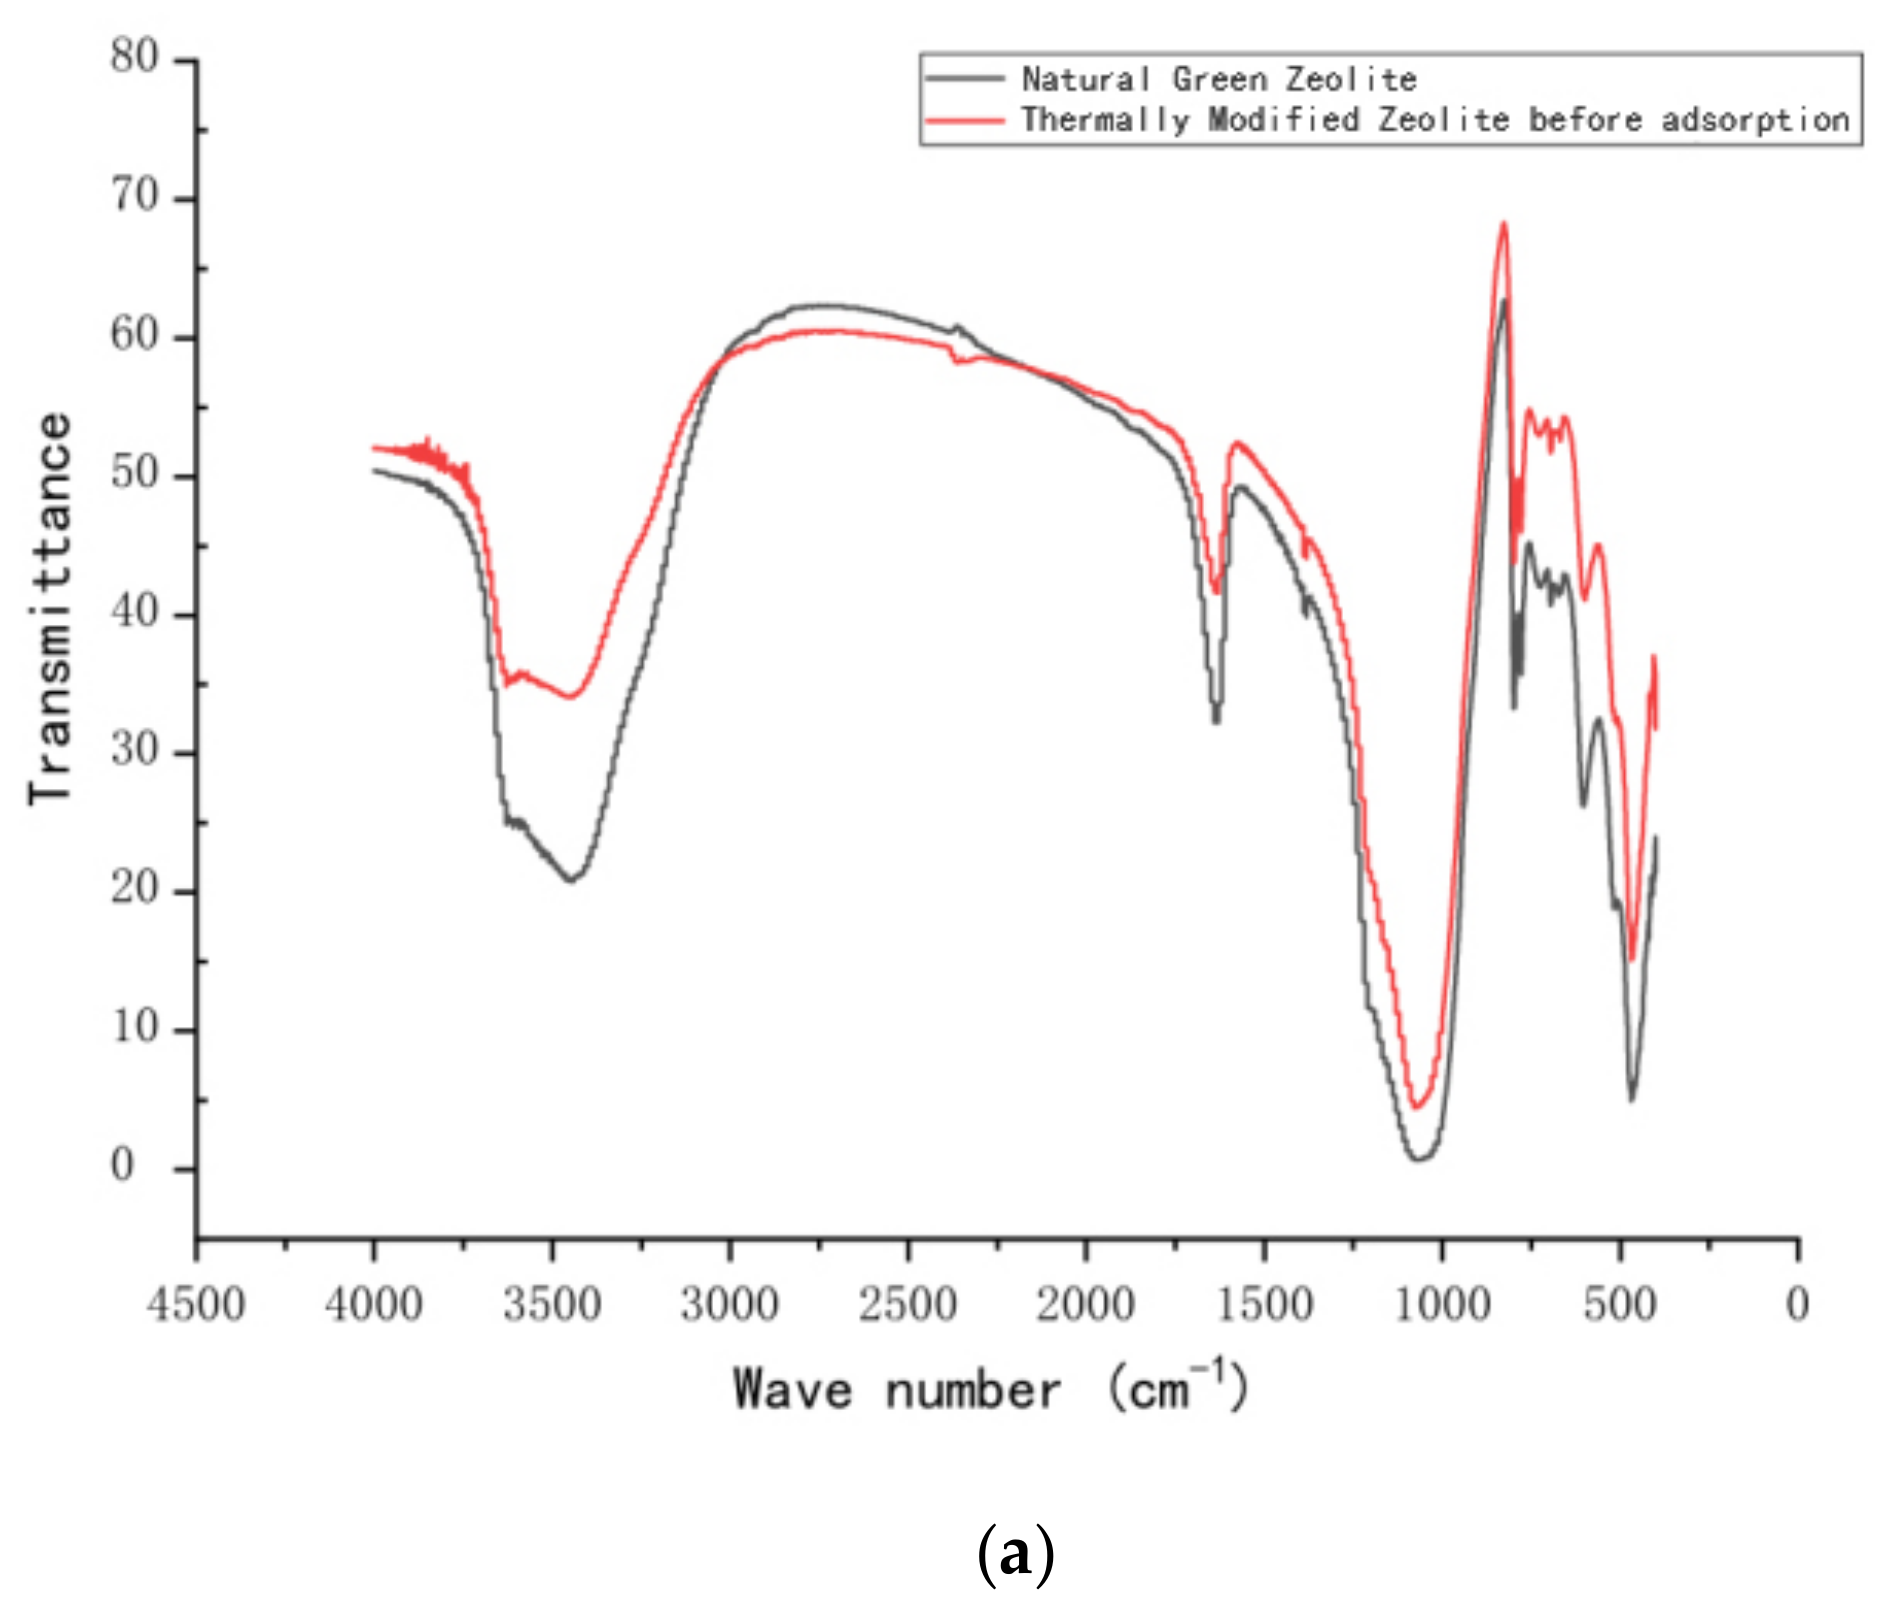
Fourier-transform infrared spectra were obtained using an FT-IR spectrophotometer (FT-IR, Nicolet iS10, American state of Massachusetts). The FT-IR spectra (
Figure 10) displayed variations in functional groups on the surface of the zeolite before and after modification. They also show changes in the nitrogen functional group before and after adsorption. The infrared spectra of natural zeolite and calcined zeolite are shown in
Figure 10a. The bending vibration peak appears at 564 cm
−1, which was attributed to the vibration adsorption peak of Fe–O. The peak at 1568 cm
−1 corresponds to the vibration peak of Al–O, and that at 1061 cm
−1 can be matched with the vibration of the Si–O–Si skeleton. In addition, there is an adsorption peak of bound water at 3000–3500 cm
−1, which corresponds to the antisymmetric vibration of the –OH group, and the maximum absorption peaks of zeolite and thermally modified zeolite are located at 3454 cm
−1 and 3447 cm
−1, respectively, mainly due to the difference in the bending vibration of combined water after the thermal modification of zeolite, consistent with previous studies [
28,
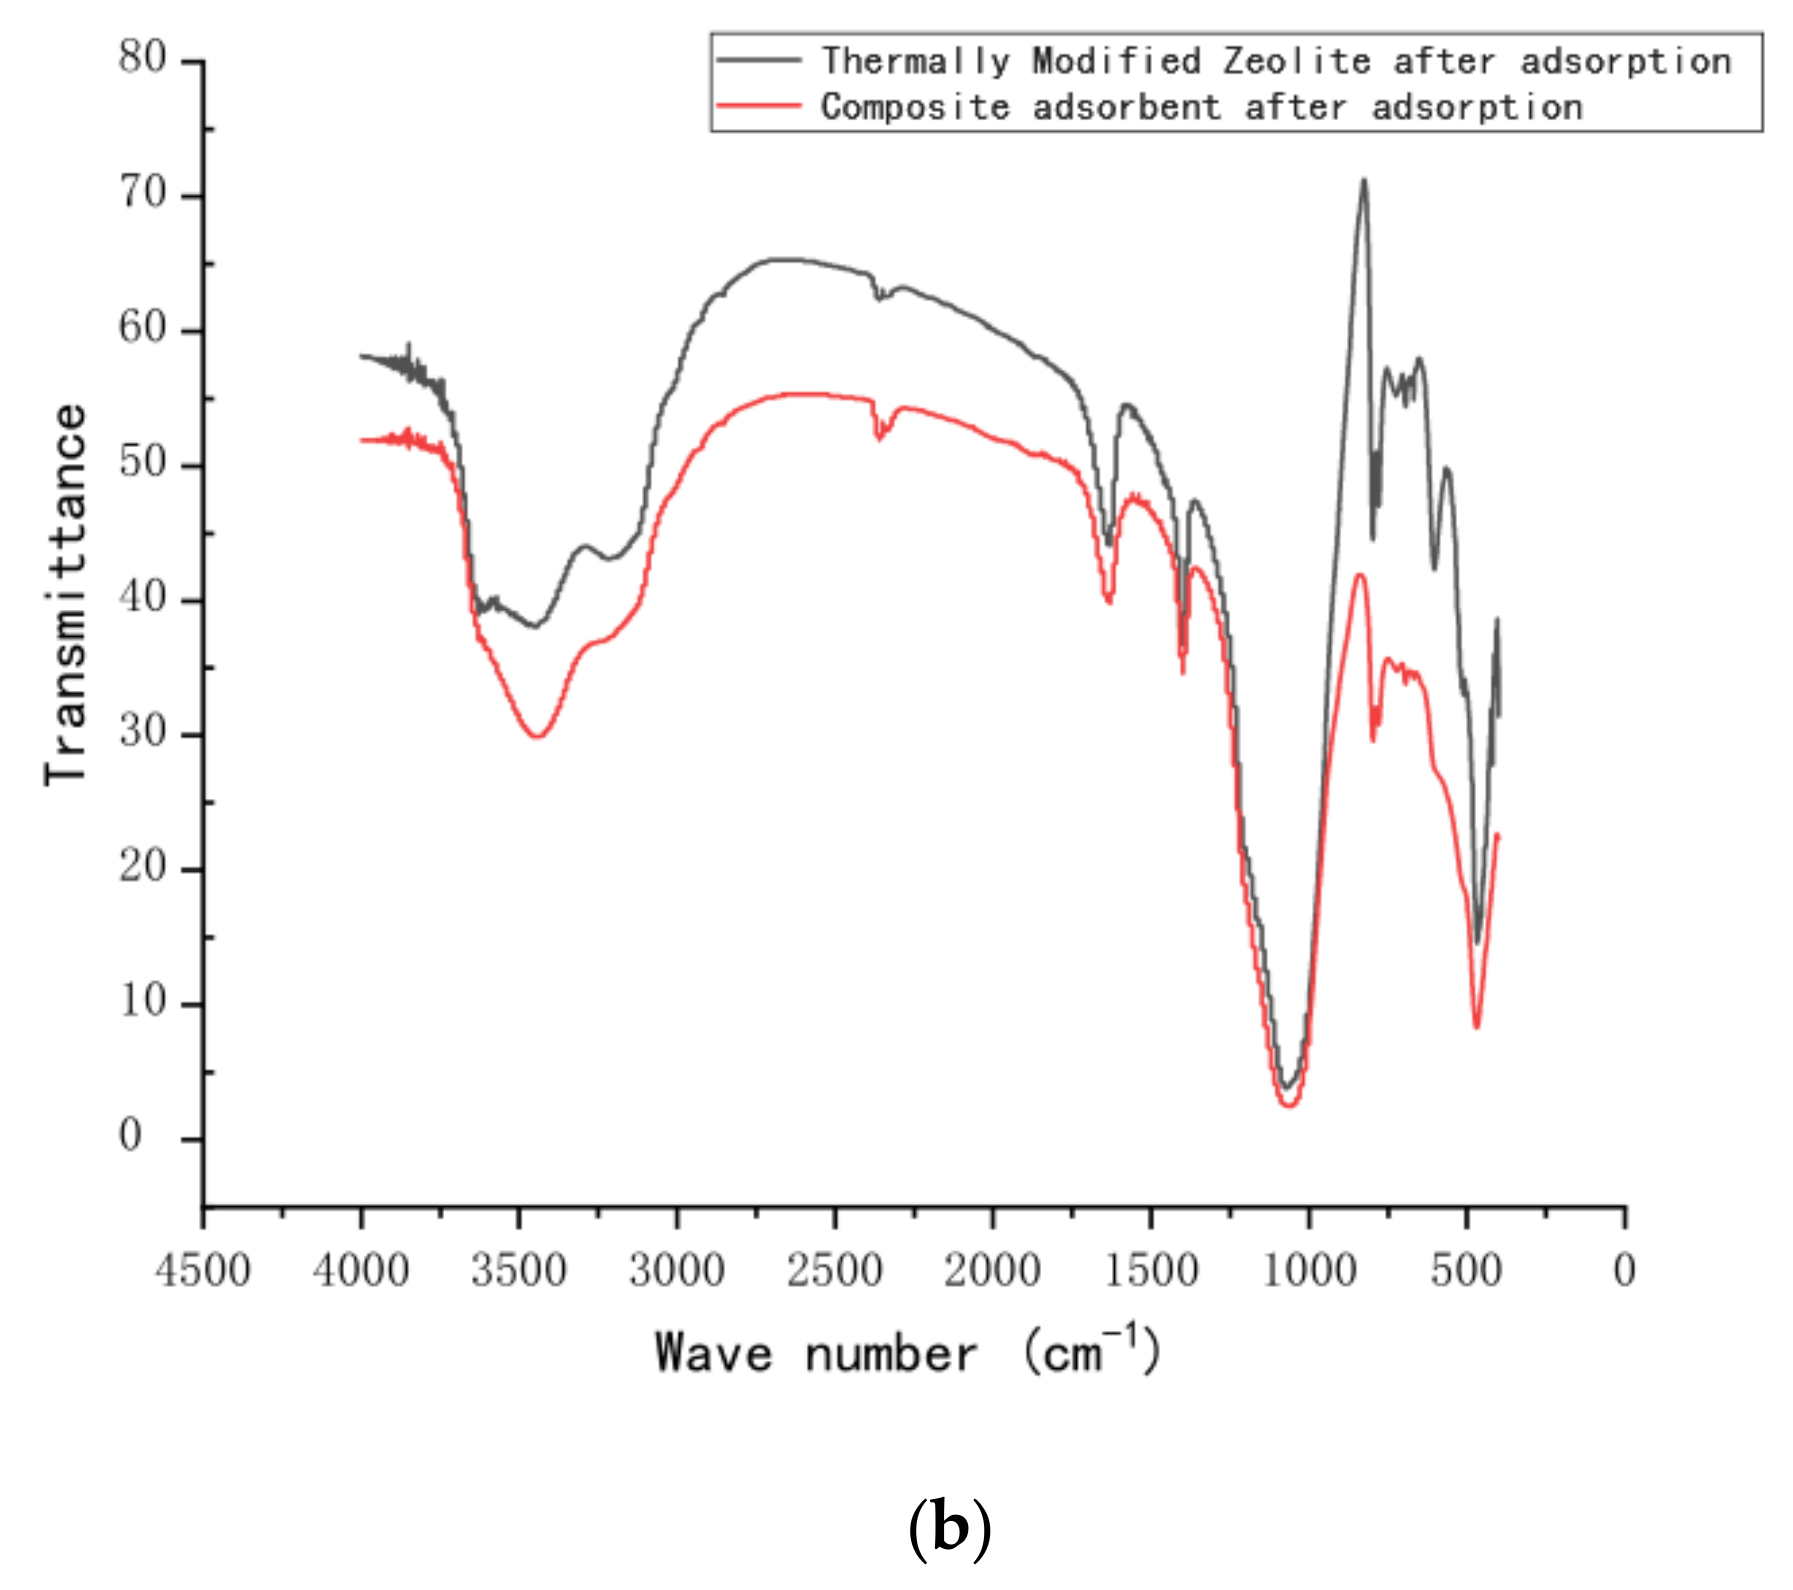
29]. The infrared spectra of calcined green zeolite and composite adsorbent after the respective adsorption (thermally modified green zeolite and diatomite at a ratio of 3:2) are shown in
Figure 10b. Surprisingly, the absorption peaks of calcined green zeolite and composite adsorbent are located at 3150 cm
−1 and 1400 cm
−1, respectively, after the respective adsorption, which are N–H group vibration peaks, indicating that ammonia nitrogen was adsorbed into the internal pores of the zeolite molecular sieve.
3.6. SEM Analysis
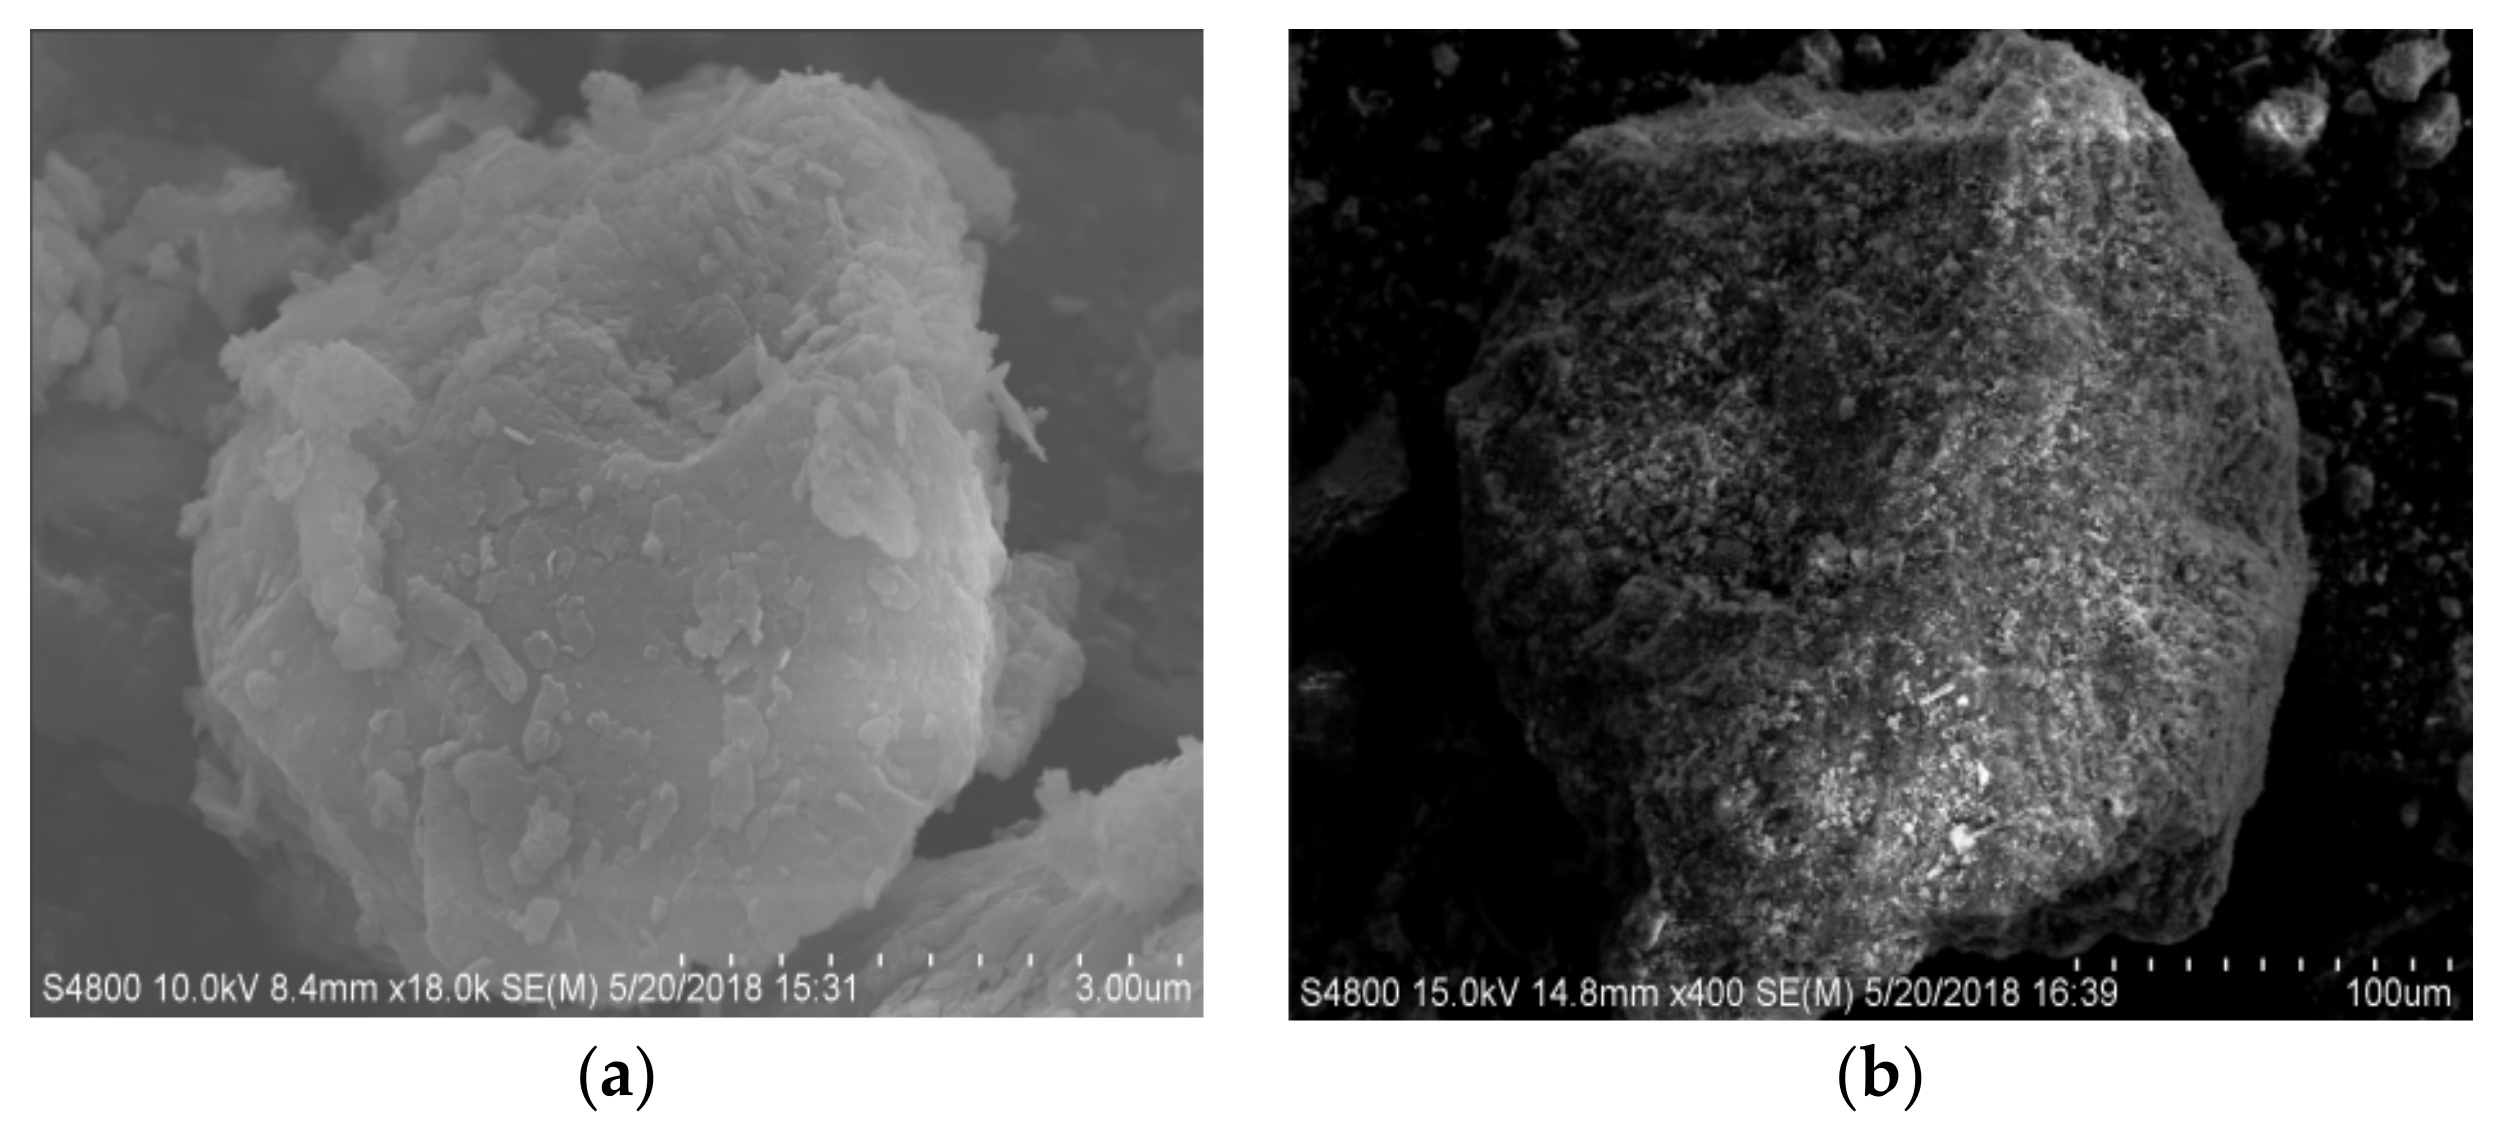
The surface morphology of the modified zeolite and diatomite is shown in
Figure 11. It can be observed that the surface of the zeolite is relatively glossy and smooth. After recombination with a certain proportion of diatomite, the surface of composite adsorbent is newly covered with protrusions.
Figure 11a shows a scanning electron micrograph of thermally modified green zeolite, which does not have a regular surface morphology, and there is little agglomeration.
Figure 11b shows the SEM image of diatomite, with a microstructure composed of sheets of diatomaceous earth, irregularly arranged and partially overlapping.
Figure 11c,d shows SEM images of thermally modified green zeolite and diatomite at the ratio of 3:2 and 2:3, respectively. Compared with the morphology of zeolite and diatomite, the structure of compound adsorbent is loose, forming a number of coral-like surface structures. Accompanied by a network of microporous structures, compound adsorbent is widely distributed, with a greatly increased specific surface area to improve the ability to adsorb ammonia nitrogen and phosphorus. Many studies have been done on Brunauer–Emmett–Teller (BET) [
30]. The specific surface area of NaCl modified and thermally modified green zeolite was improved after modification to some extent. Our study is more focused on the surface adsorption mechanism of nitrogen and phosphorus, and the effect of BET was not considered.
3.7. Greyscale Analysis
The SEM image of the adsorbent is a greyscale image, which includes 256 grey levels and a greyscale range of 0–255. The grayscale image is composed of grid-like pixels, and the brightness of each pixel corresponds to a grey value. The differences in grey values reflect the different micro-morphology of the particle surface. The higher the resolution of the scanning electron microscope, the more the sediment is the same. The more SEM image pixels the particles get, the clearer the image and the richer the image information.
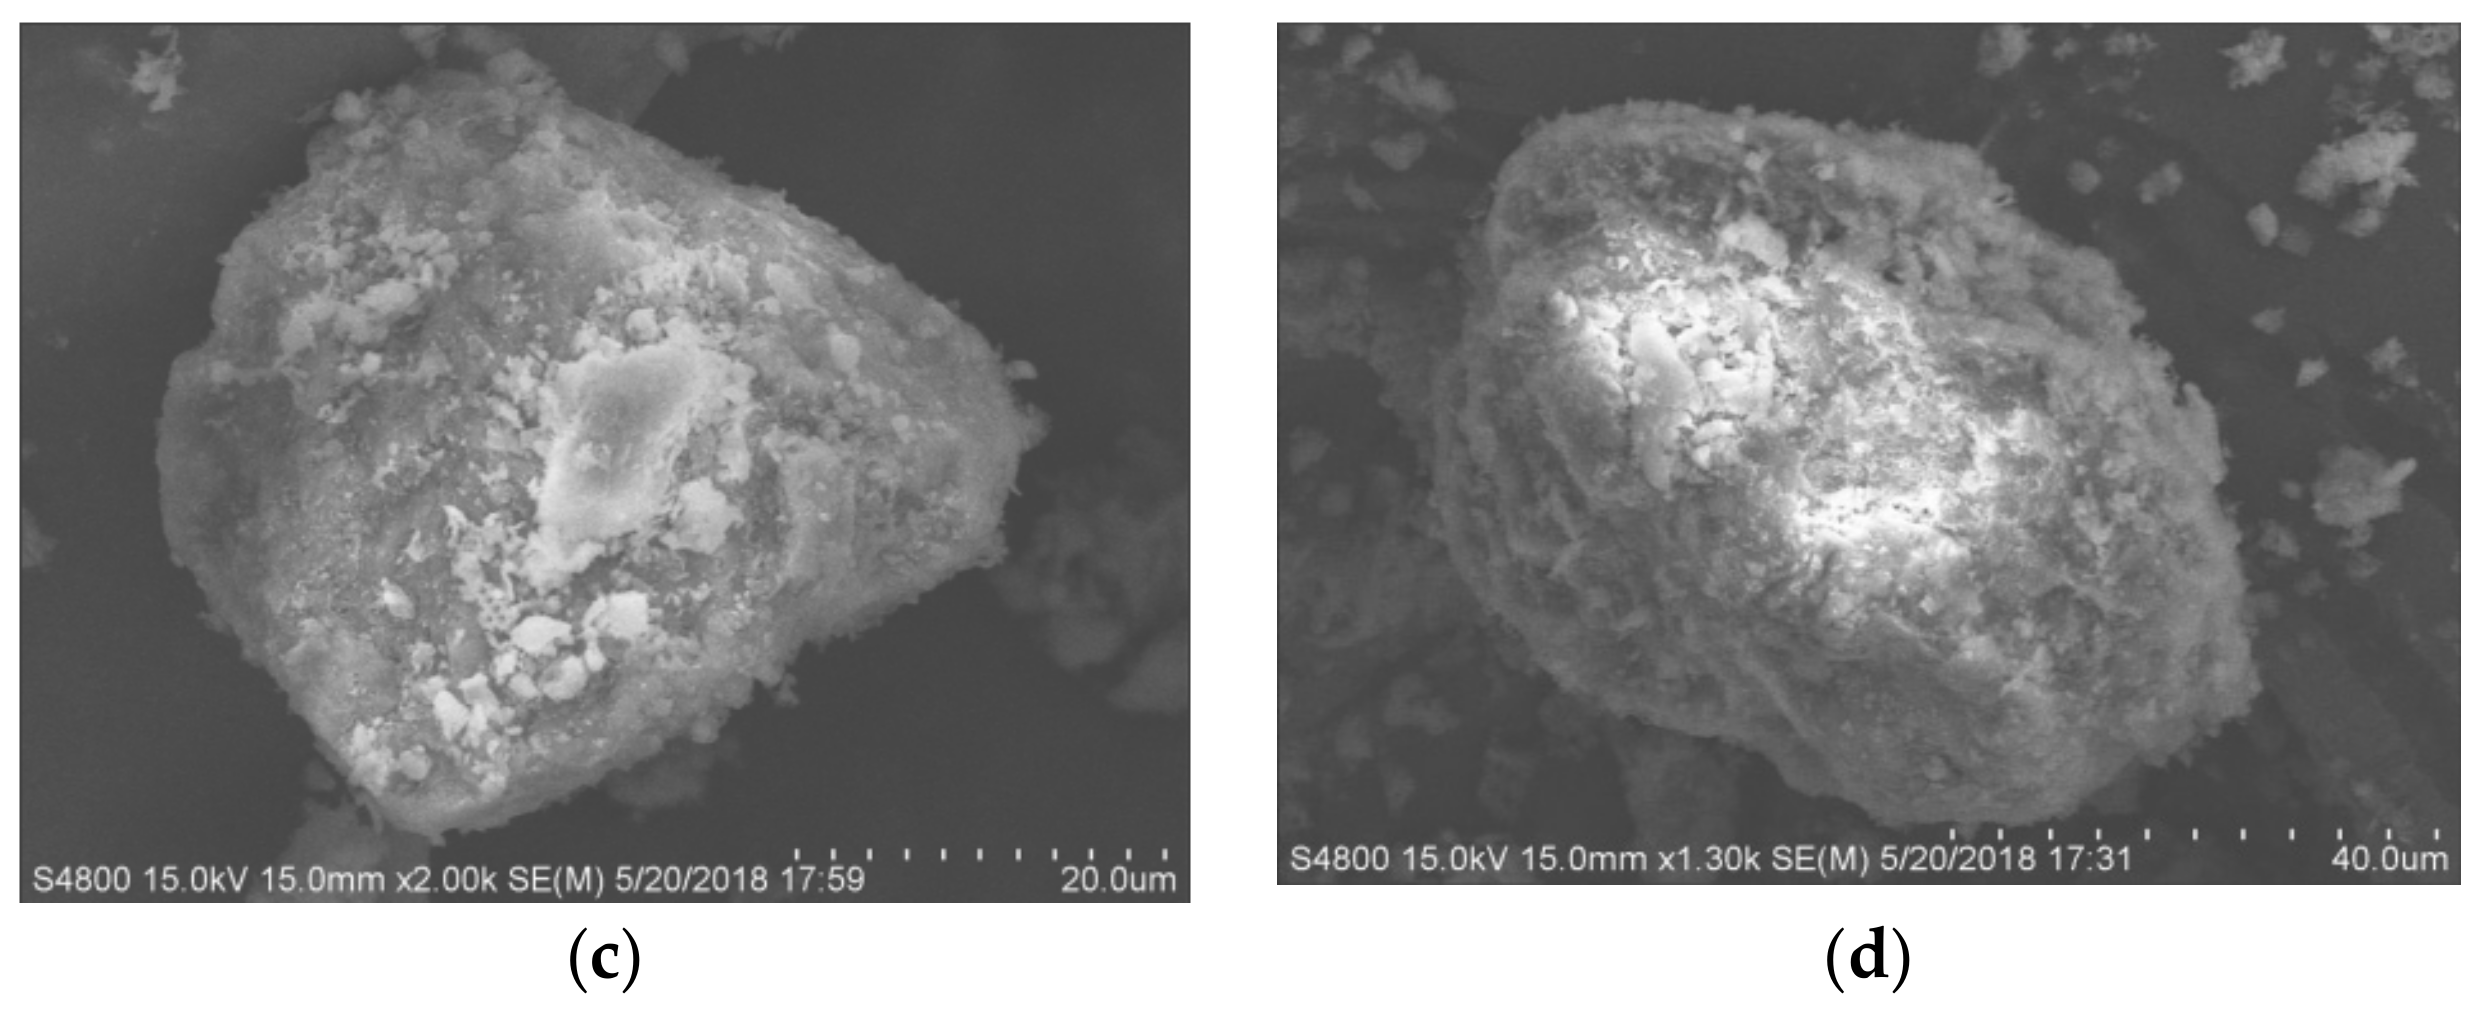
The S-4800 x-ray energy spectrometer (SEM, Hitachi S-4800, Tokyo, Japan) was used to map the surface of composite adsorbent with a ratio of thermally modified zeolite to diatomite of 3:2. The mapping scan of the adsorbed elemental N and P is shown in
Figure 12. According to the image display, the bright green and blue spots in the figure represent the adsorption of nitrogen and phosphorus on the surface of a composite adsorbent single particle with a ratio of thermally modified zeolite to diatomite of 3:2. The black area represents zero adsorption of nitrogen and phosphorus.
Images of adsorbent particles can be obtained by scanning electron microscopy, reflecting the microscopic characteristics of the surface of the sediment particles. The derivative of the surface greyscale can approximately reflect the gradient reaction of particle surface height distribution.
The first-order gradient reaction on the surface of the adsorbent reflects its roughness. The greater the difference in the gradient, the more undulating the surface of the adsorbent. The second-order gradient reflects the sags and crests on the surface, reflecting the proportion of peaks and valleys. For a continuous function, the first derivative of f(
x,y) can be expressed as a vector whose expression is as follows:
The vector magnitude and direction angle are:
Generally, to calculate the pixel points of each grey image according to the partial derivative of the above formula, a small area template approximation is used for Gx and Gy. The two templates are combined to form a gradient operator. The operator performs a convolution integral calculation to convolute the image with the horizontal template Gx to obtain a horizontal gradient image. This has a strong effect on the vertical edge and is convolved with the vertical template Gy to obtain a vertical gradient map, which has a strong effect on the horizontal edge. The Sobel operator gradient template performs better and Sobel operator gradient template (a) and (b) are as follows:
![Water 11 02053 i001]()
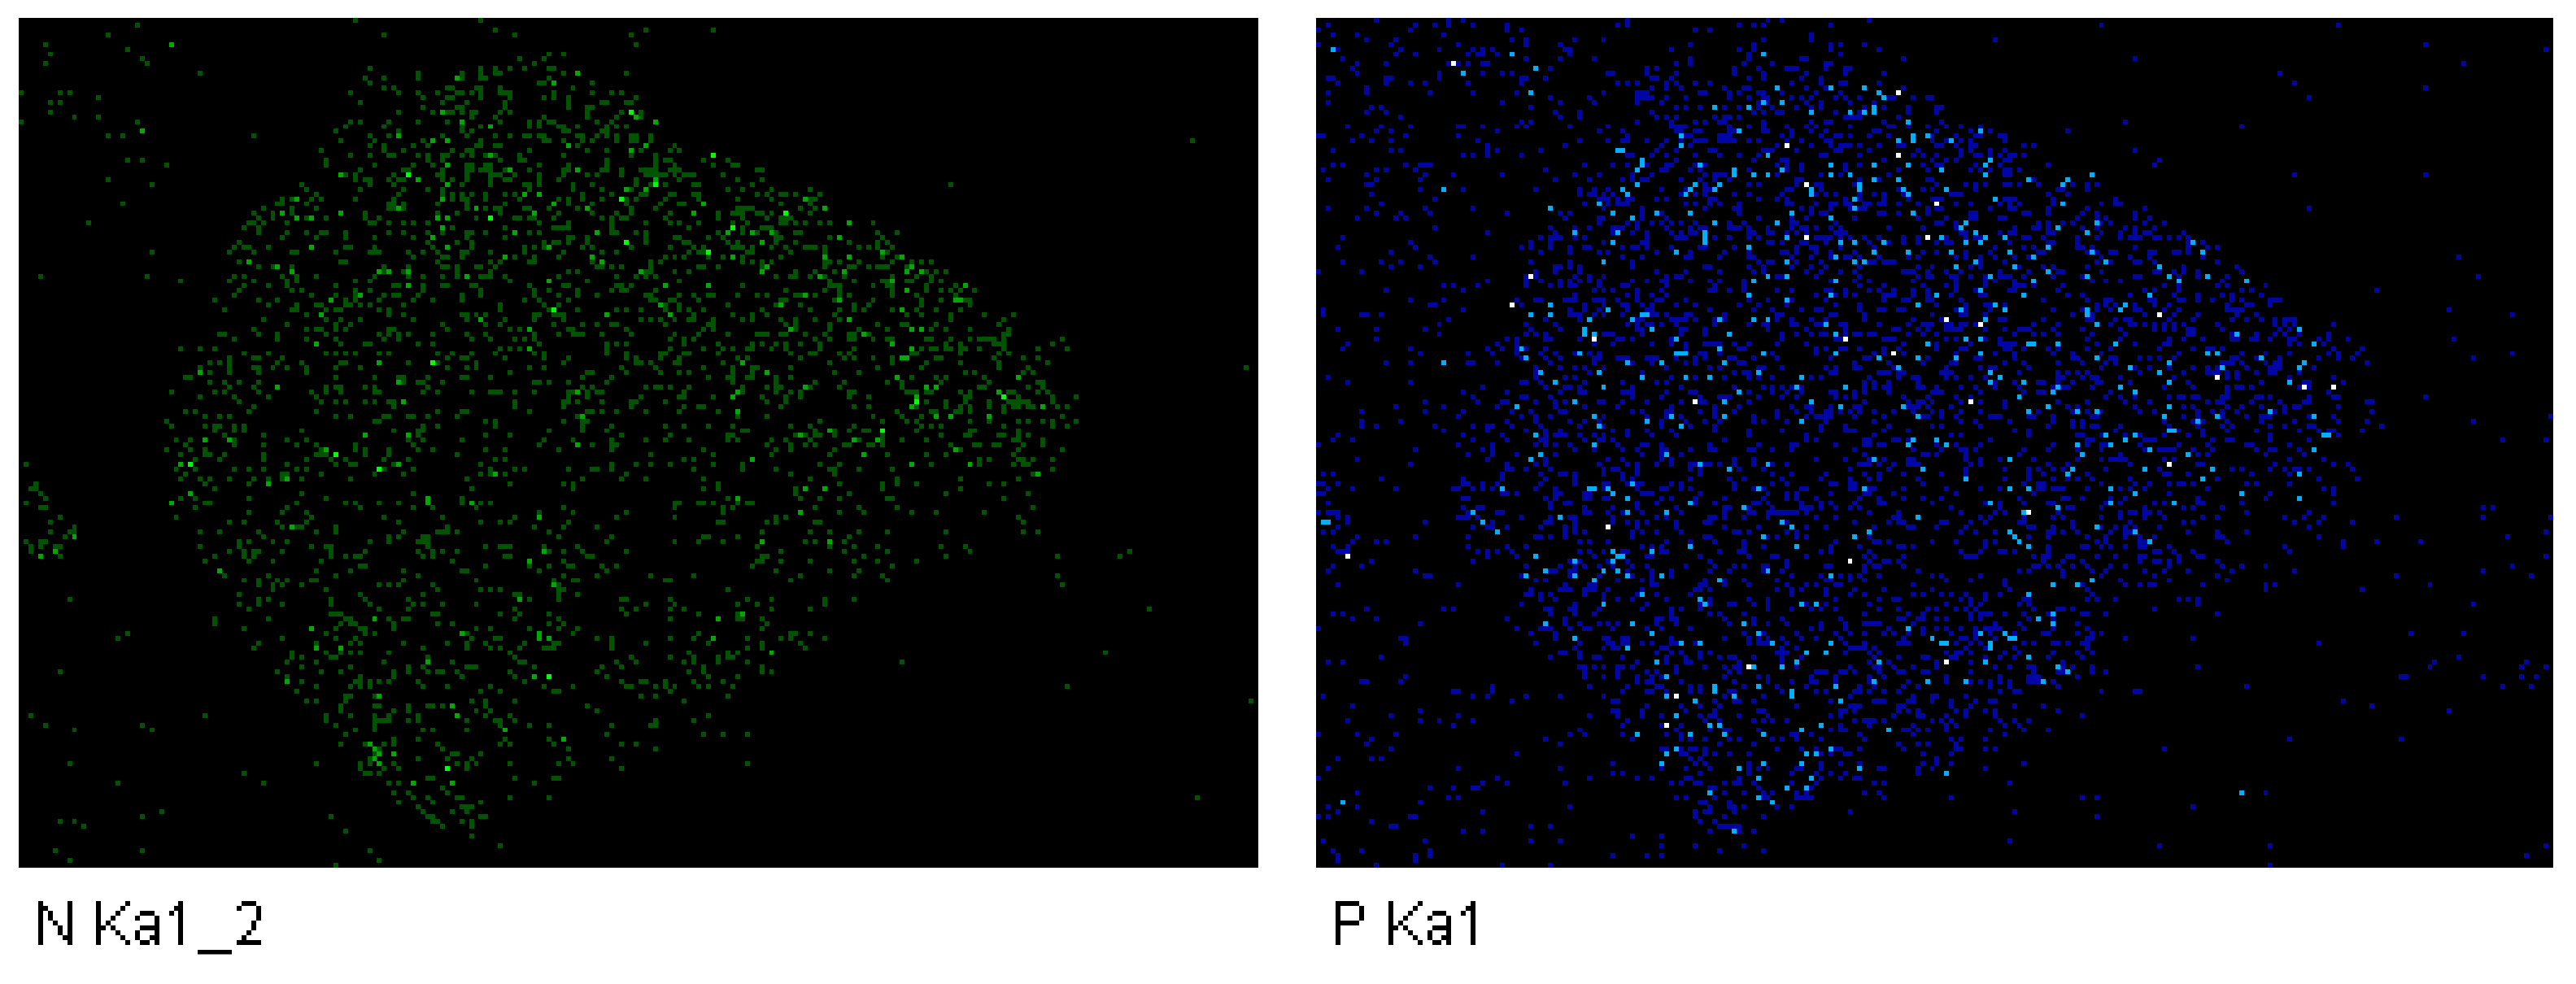
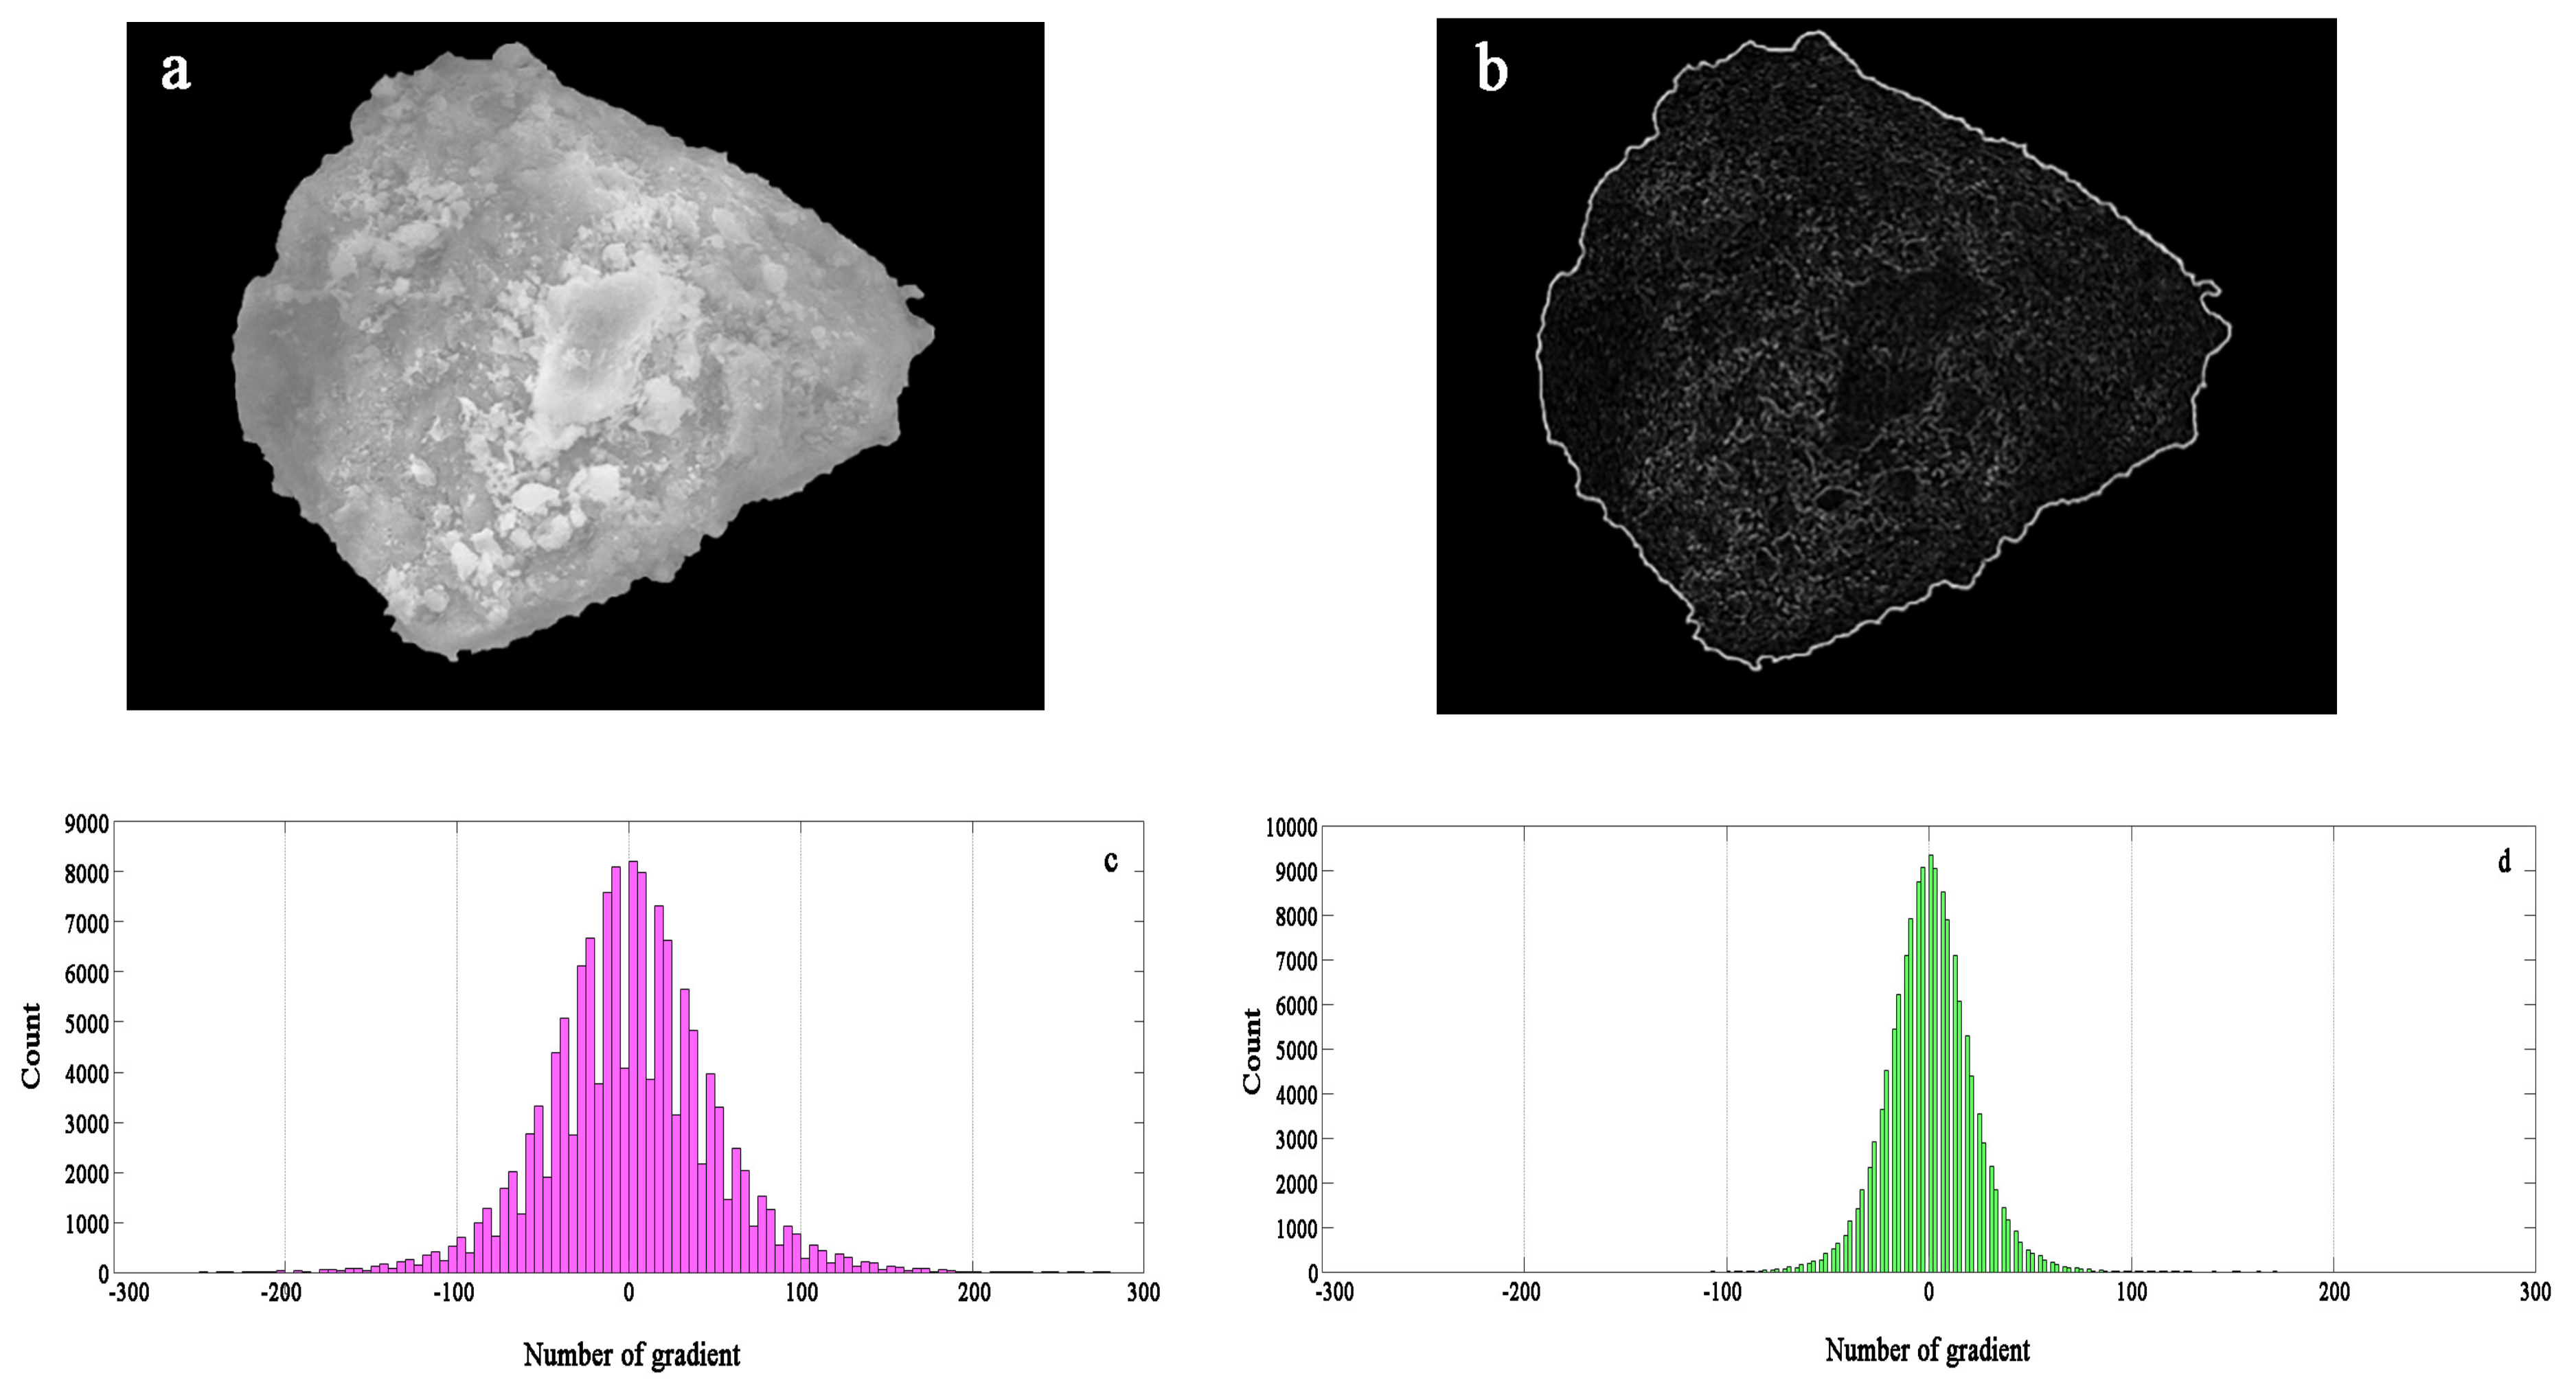
An image of the particle greyscale and amplitude characteristics of the composite adsorbent particles is shown in
Figure 13. A gradient image of the original greyscale image in the
x- and
y-directions can be obtained by the Sobel operator. The grey gradient feature map can truly reflect the fluctuation of the surface height of the particle surface; the more surface protrusions, the brighter the display and the larger the gradient value. In addition, the larger the surface depression, the smaller the gradient value. The gradient features in the
x- and
y-directions are more demonstrable, as shown in
Figure 13.
The gradient statistical histogram in the
x- and
y-directions reflects the range of the gradient distribution in each direction. The two directions are basically similar, and the distribution is primarily in the range of −150 to 150. The distribution is relatively scattered, and the numerical statistics are shown in
Figure 13. It can be seen that the grey point gradient is more prominent in the range of −50 to 50, indicating that the surface of zeolite particles is irregularly changed, the relief becomes more uneven, and the surface morphology changes are significant.
Laplacian transform is commonly used as a second-order derivative operator. For continuous function f(
x,y), the Laplacian operator can be used to calculate the second-order derivative of the SEM image of the adsorbent. The second derivative histogram can be calculated by MATLAB (MathWorks, Natick, MA, USA). The Laplacian value is, for most pixels, near zero. Combined with the first derivative histogram, the degree of unevenness of the particle surface can be seen. The first-order derivative histogram can be used to detect the unevenness of the particle surface, indicating the roughness and complex appearance of the particle. SEM mapping, greyscale image recognition, and gradient recognition were used to compare the distribution of contaminants and the morphology of the adsorbent surface. The images of the second-order derivative characteristic map and the grey histogram are shown in
Figure 14.
The Laplacian operator is as follows:
The Laplacian operator gradient template (a) and (b) are as follows:
The uneven data of the histogram show large surface roughness of the composite adsorbent. Combined with second-order gradient histogram, it can be seen that the number of Laplace values is greater than zero, and the phase is near zero. At most, the surfaces of the particles are uneven and the shapes are complicated. SEM mapping and greyscale gradient identification are used to compare and analyze the distribution of pollutants and the morphological contrast of the adsorbent surface. It can be seen that the larger the surface of the gradient, the more uneven it is, the more nitrogen and phosphorus sites are adsorbed on the surface, and the more nitrogen and phosphorus are adsorbed.
4. Conclusions
In this study, based on an experimental examination of adsorption properties, a composite adsorbent with high removal of nitrogen and phosphorus was prepared and tested. SEM mapping combined with greyscale and gradient recognition was used to study the distribution of pollutants and the surface morphology of adsorbents. The composite adsorbents were investigated not only from the perspective of the internal chemical mechanism but also, more importantly, in terms of the surface adsorption morphology and distribution of pollutants. Specifically, the following four conclusions are made, in detail:
(1) Adsorption-modified kinetics and isothermal adsorption experiments were used to screen out thermally modified zeolite for higher removal of nitrogen. It was demonstrated that there are three stages of nitrogen and phosphorus adsorption by zeolite and diatomite: rapid external surface adsorption, gradual adsorption, and final balance. The gradual adsorption stage includes not only intraparticle diffusion, but also liquid film diffusion. The adsorption of nitrogen by zeolite and the adsorption of phosphorus by diatomite can be classified as ion exchange.
(2) Through the relevant experiments, thermally modified zeolite and diatomite were selected to prepare the composite adsorbent. When the proportion of thermally modified zeolite and diatomite was 3:2, the efficiency of removing nitrogen and phosphorus in the water was higher than that of the other structures, reaching 91.08% and 88.54%, respectively.
(3) Modification of the adsorbent and the adsorption process was confirmed by characterization techniques (XRD, SEM, and FT-IR), which were used to study the internal elemental composition, surface morphology, and chemical bonds before and after modification and adsorption. The processes of modification and adsorption have a certain influence on the elemental composition and structure of the adsorbent itself.
(4) In terms of the composite adsorbent obtained by screening, SEM mapping, grey image recognition, and gradient recognition were used to determine the distribution of pollutants and the morphology of the adsorbent surface. There is a particular relationship between the nature of the distribution and the amount of adsorption. It can be seen that the larger the surface of the gradient, the more uneven it is, and the more nitrogen and phosphorus are adsorbed.
In summary, this method has significant value for determining the adsorption mechanism of adsorbents and the overall adsorption process, particularly in practical terms. We will prepare powdered composite adsorbent as ecological concrete blocks and take them to farmland drainage ditches, ecological ponds, and other ecosystems, which will be of considerable help in agricultural non-point-source pollution control. Future work will address high-efficiency nitrogen and phosphorus adsorbents, the overall change in adsorption, the distribution of elemental and internal adsorption of nitrogen and phosphorus, and elemental composition changes. This study provides technical guidance for the preparation of adsorbents to facilitate highly efficient nitrogen and phosphorus removal.


