Dam Effects on Downstream Riparian Wetlands: The Nenjiang River, Northeast China


1
Key Laboratory of Wetland ecology and Environment, Northeast Institute of Geography and Agroecology, Chinese Academy of Sciences, No. 4888, Shengbei Street, Changchun 130102, China
2
Institute of Water Conservancy and Electric Power, Heilongjiang University, Harbin 150080, China
3
University of the Chinese Academy of Sciences, Beijing 100049, China
4
School of Renewable Natural Resources, Louisiana State University Agricultural Center, Baton Rouge, LA 70803, USA
*
Author to whom correspondence should be addressed.
Water 2019, 11(10), 2038; https://doi.org/10.3390/w11102038
Submission received: 12 August 2019
/
Revised: 20 September 2019
/
Accepted: 26 September 2019
/
Published: 29 September 2019
(This article belongs to the Special Issue Wetland Ecohydrology and Water Resource Management)
Abstract
:Many studies have found that damming a river can change downstream hydrology, sediment transport, channel morphology, and fish habitat. However, little is known about river dam effects on downstream riparian wetland dynamics and their quantitative relationship with hydrological alterations. In this study, hydrological time series and wetland distribution data spanning nearly 40 years (1978–2016) before and after the construction of a large dam in 2005 across the Nenjiang River in Northeast China were used to reveal the impact of dam on the downstream discharge regime and wetland degradation. Hydro-statistical and stepwise multiple regression analyses were performed to quantify the relationship of riparian wetland area with a metrics of 33 hydrological indicators. Dam construction caused decline in peak discharge, flood frequency, and magnitude. Moreover, 150 km riparian wetlands along the downstream of the dam was largely reduced. The count and duration of high flow pulses, 1-day maximum, and date of maximum discharge changed significantly after the dam construction. The hydrological changes have made a significant contribution to the 44% reduction in riparian wetlands following the dam construction. Our results indicated that hydrological alterations caused by dam regulation led to the area reduction of downstream riparian wetlands. The findings provide relevant information for developing best dam operation practices to protect and restore downstream wetland ecosystems.
1. Introduction
The construction by damming rivers has considerably altered downstream hydrologic regimes around the world [1,2,3,4,5]. Considering that 85% of the total rivers were controlled and fragmented by dams [6], many downstream hydrologic effects of dams are noticeable and direct. For example, dams have been found to decrease maximum discharge and flow variability, while they can increase minimum discharge and homogenize flow in different hydro–climatic regions [7]. In arid regions, dams are built for regulating discharge to ensure water supply [8]. On the other hand, damming rivers can help flood control, which can reduce intensity of downstream inundation [9] and make the channel occasionally or enduringly dry or at least significantly reduce discharge, which can alter the floodplain and river channel [10]. Dam operations often result in trapping sediment upstream and reducing sediment delivery downstream, affecting fish habitat, spawning, and migration [11]. Studies have found that river dams can reduce sediment, nutrients, and organic matter inputs downstream, altering physical, chemical, and biological characteristics of riparian soils [12,13].
Hydrological processes play a decisive role in the formation, development, succession, and extinction of riparian wetlands. Changes in floodplain sediment and riparian soils could reduce the abundance of nitrogen-fixing plants and reduce nitrogen input [14,15,16,17,18], potentially altering structure and ecological functions of the riparian wetlands and exacerbating degradation and destruction of the wetland ecosystems [19,20,21,22]. Riparian wetland areas are exceedingly sensitive to the hydrological alterations by way of favorable indicators of the ecological variation that is caused by dam operations [23,24,25,26]. Over the past several decades, more than 70% of riparian wetlands in the world have gradually been changed into other land use types [27]. Facing these pressing challenges, quantifying the relationship of riparian wetland loss with hydrological alterations caused by dam operations is gaining attention from both the research community and the general public [28,29,30,31]. Although many studies on river dam effects on downstream changes in hydrology, geomorphology, vegetation, and fish have been conducted [32,33,34], less is known about dam effects on downstream wetland dynamics [35,36,37].
With this in mind, this study focuses on how hydrologic changes following a dam construction can affect downstream riparian wetlands. As an example, the study utilizes long-term hydrologic data and wetland areal assessment along a 150-km river reach downstream of a dam constructed across the Nenjiang River in Northeast China. Specifically, the study aims to: (1) identify downstream discharge changes after the dam construction in 2005; (2) determine riparian wetland changes along the river reach from 1978 to 2016; and (3) investigate the relationship between riparian wetland changes and altered hydrological indicators. The primary goal of the study is to provide scientific information for developing ecological management strategies and plans for dam operation to protect downstream riparian wetlands.
2. Study Area
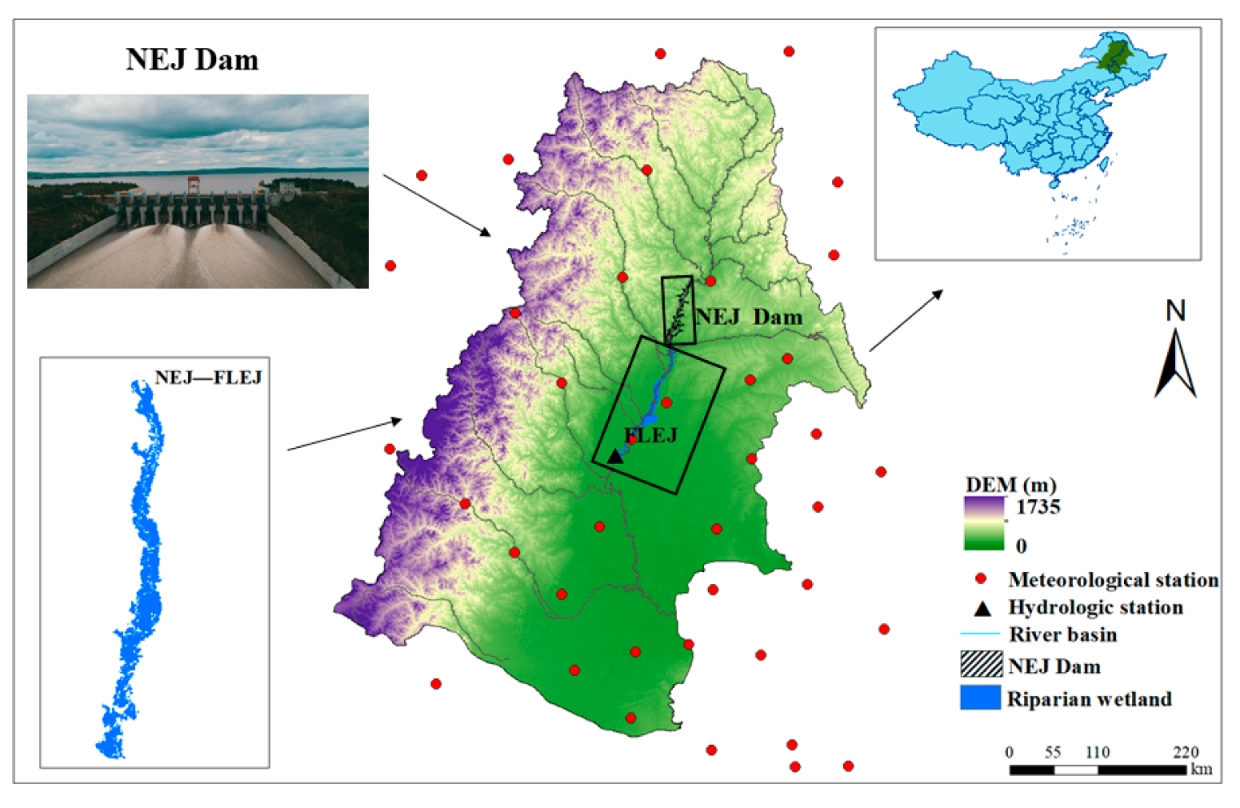
This study assessed changes in riparian wetlands along a 150-km reach downstream of the Nierji (NEJ) Dam in the middle Nenjiang River Basin, Northeast China (Figure 1). The region has a mean annual precipitation of 448 mm [38], approximately 80% of which occurs from June to September. This river basin is one of the most important wetland regions and commodity grain bases in China. Large areas of wetlands in the basin, including Zhalong, Xianghai, Momog, and Nanweng (Ramsar Recognized Wetland Sites of International Importance) have important hydrological functions such as water storage, recharging groundwater, and flood mitigation. In recent years, the decrease in area and hydrological functions of wetlands has been detrimental to the agriculture and economic development in the Nenjiang River Basin. It is necessary to examine how wetlands changed and their relationship with hydrological alteration. The NEJ Dam, built in 2005, is a large reservoir across the Nenjiang River, approximately 585 km upstream from its confluence with the Songhua River. It is the only flow control structure in the mainstream of the Nenjiang River, playing an important role in flood control. The dam creates a reservoir with a total storage capacity of 86.1 × 10⁸ m3, and the drainage area to the reservoir is 6.64 × 10⁴ km2, accounting for 22.4% of the total drainage area of the Nenjiang River Basin [39].
3. Methods
3.1. Data Collection
We collected daily discharge records for 1968–2016 from the Fulaerji (FLEJ) gauge station, which is the first station downstream of the NEJ Dam. River stage records at the station were also collected for 1972–1981 and 2003–2016. Wetland distribution maps in the years of 1978, 1990, 2000, 2005, 2010, and 2015 were obtained from the Institute of Remote Sensing and Digital Earth, Chinese Academy of Sciences. The datasets used moderate-resolution imaging spectroradiometer (MODIS) time series data to map wetland distribution in China [40,41] and have been widely used in assessment on wetland development and wetland ecological service functions [42]. The original data resolution of DEM is 30 m × 30 m, which was obtained from geospatial data cloud (http://www.gscloud.cn/). The precipitation data (1968–2016) used to remove the underlying influence of climate alteration on hydrological progression came from 40 Meteorological Stations by National Meteorological Information Center (http://data.cma.cn/).
3.2. Break Point Determination Time Series Division
Given that NEJ operation considerably altered hydrological regimes in downstream Nenjiang River, we divided the 48-year period (1968–2016) into two time windows: (1) before dam construction: 1968–2004 and (2) after dam construction: 2005–2016.
3.3. Removal of Latent Impacts of Climate Change on Hydrological Process
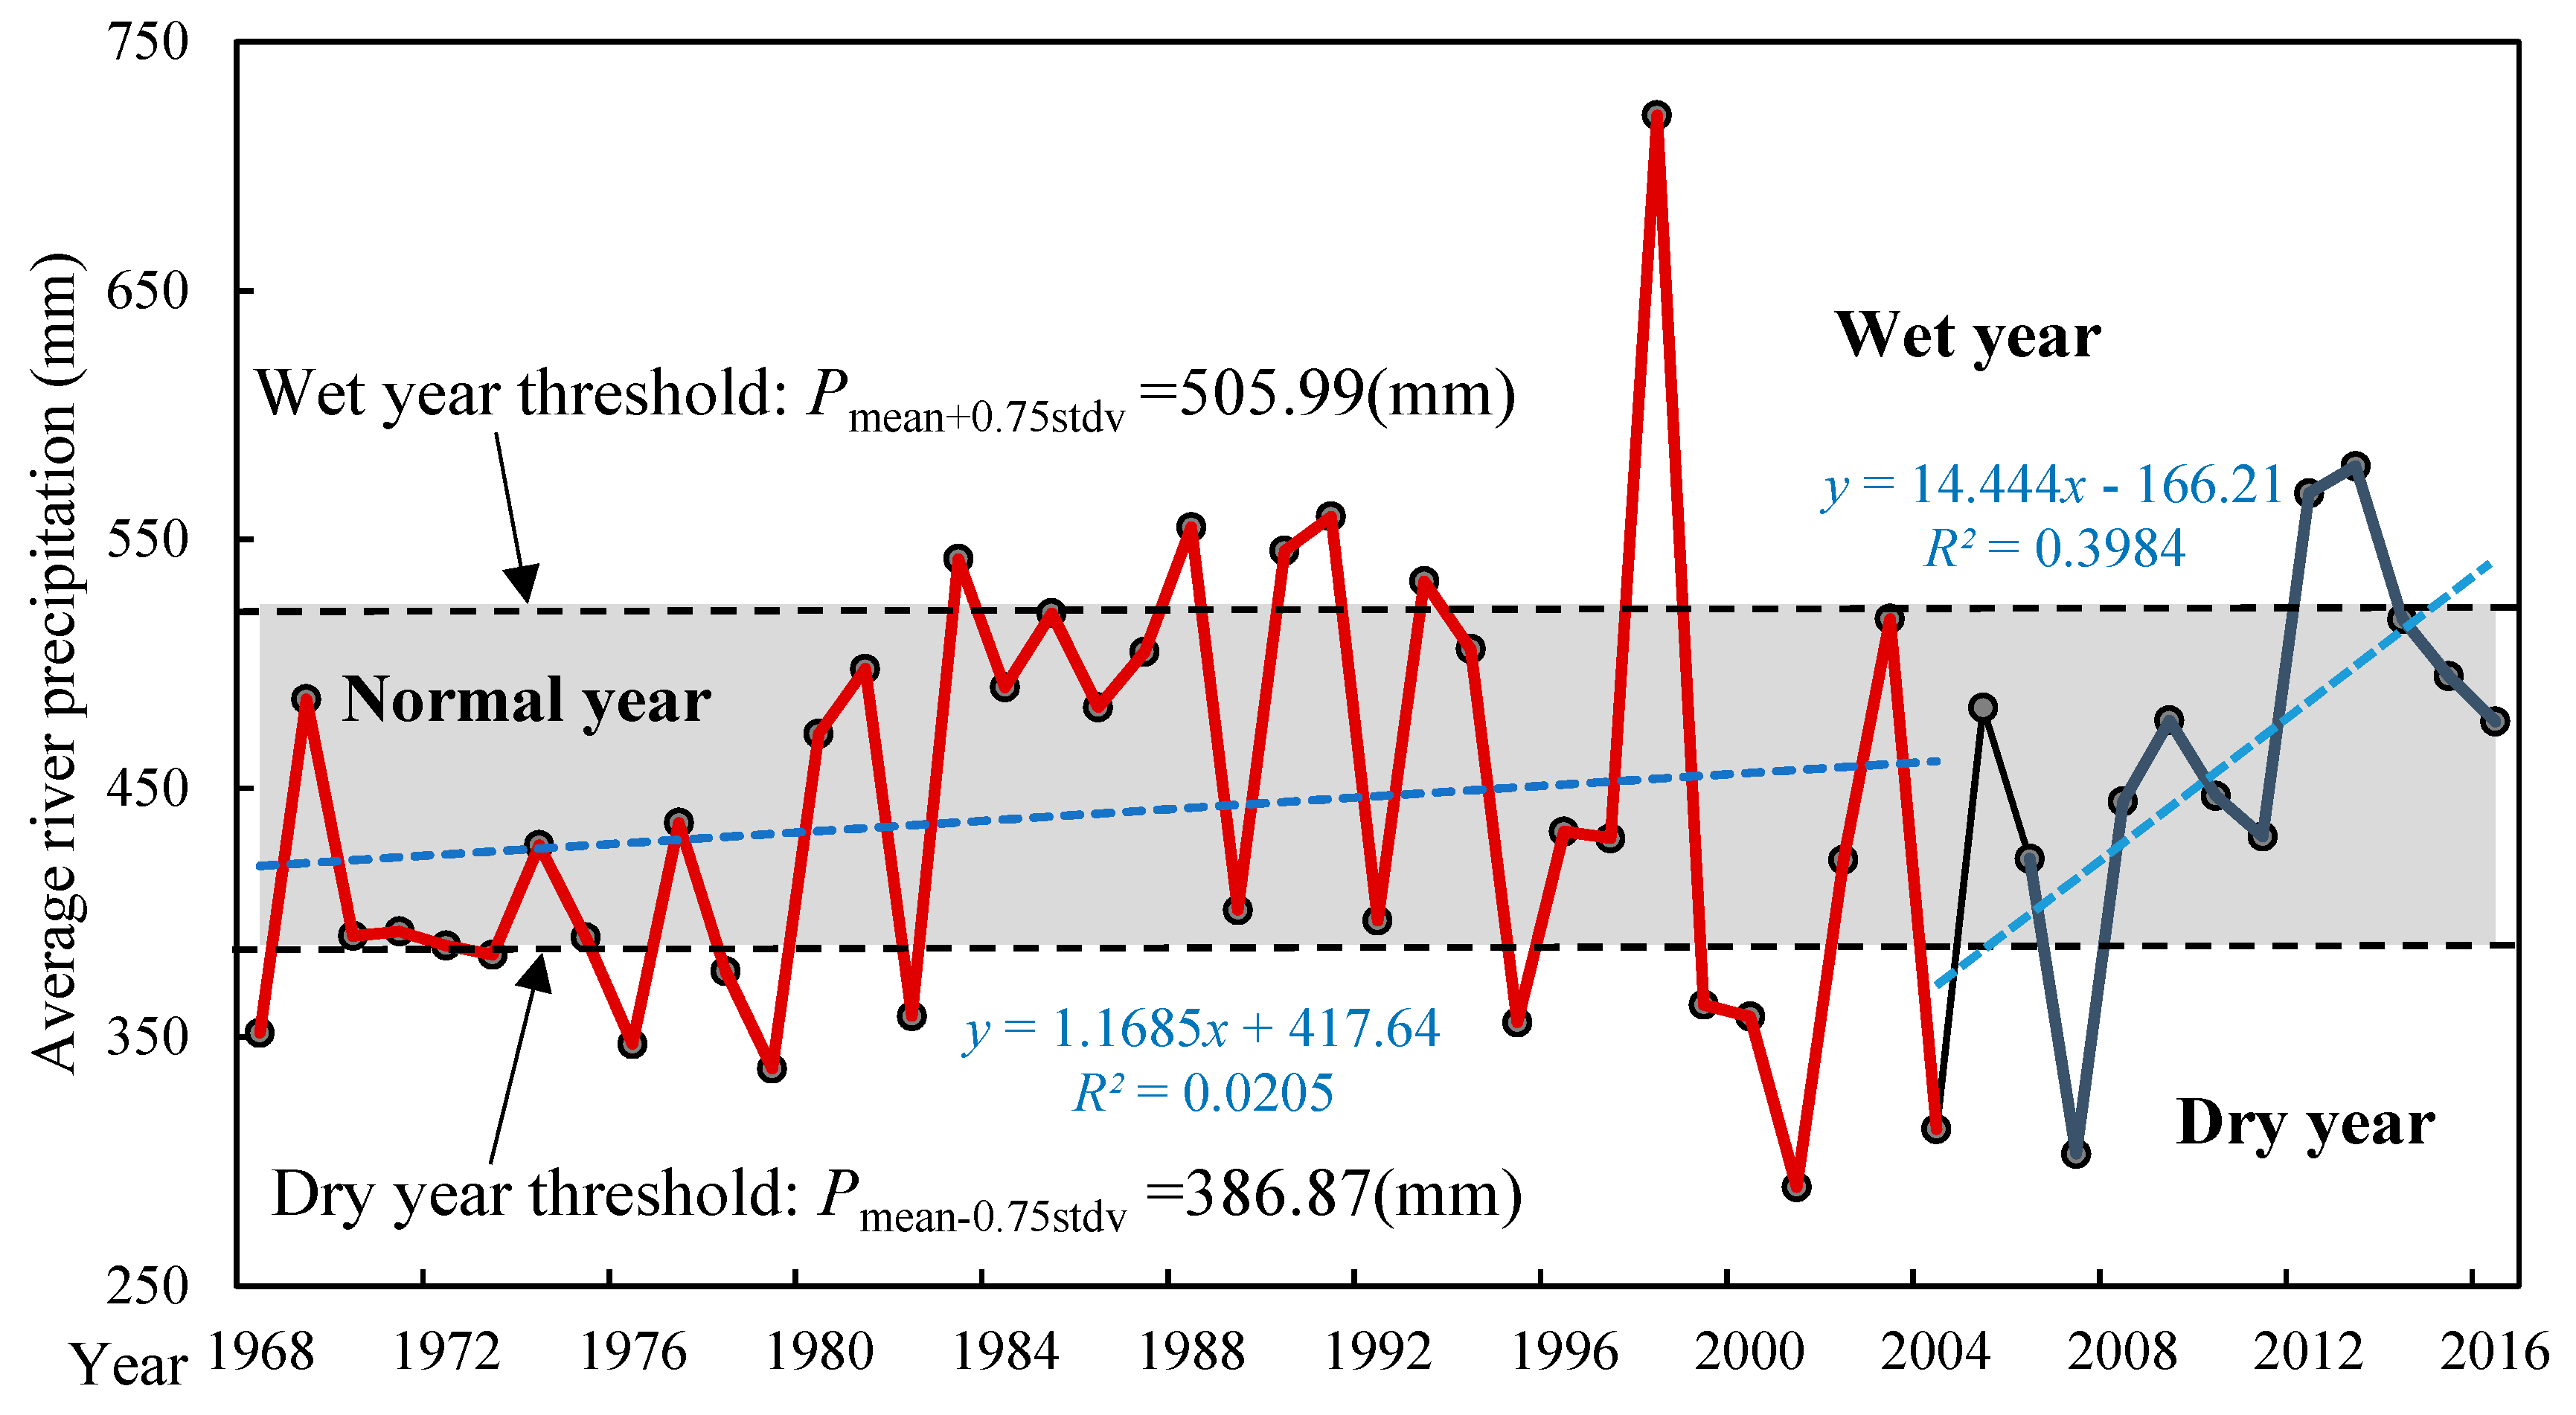
It is necessary to separate the combination of dam construction and climatic variety [43,44]. In the present study, we used the precipitation data during the 1968–2016 period to define wet and dry years for hydrologic time-series. Generally, the dry and wet years directly characterize a relative lower and higher discharge in a given year, respectively [45]. Yang [46] suggested that the optimal periods in which annual river precipitation is more than Pmean+0.75stdv (P ≥ Pmean+0.75stdv) are considered as the wet years, while periods of annual river precipitation less than Pmean+0.75stdv (P ≤ Pmean+0.75stdv) can be regarded as the dry years. Therefore, annual precipitation between Pmean+0.75stdv ≤ P ≤ Pmean−0.75stdv serve as normal years. Therefore, hydrological changes in normal years are attributable to factors other than precipitation (Figure 2).
3.4. Indicators and Range of Hydrologic Alteration
We used indicators of hydrologic alteration (IHA) metrics and the range of variability approach (RVA) described by Richter and others [47,48] to analyze discharge regime changes before and after dam construction. The metrics are comprised of 33 hydrologic parameters including five groups, namely magnitude of monthly discharges, magnitude, and duration of annual extreme flows, frequency and duration of high and low pulses, and the rate and frequency of discharge change (Table 1) [49]. We split the 48-year study period (1968–2016) into two-time windows: (1) the pre-dam period: 1968–2000; (2) the post-dam period: 2005–2016. We did not consider the construction period (2001–2005) in this study because the dam was not in complete operation. For further comparative analysis of hydrologic alteration caused by the NEJ dam, we divided the year into three periods: pre-monsoon season (March–May), monsoon period (June–September) and post-monsoon season (October–February). The IHA metrics at the FLEJ gauge station was calculated using daily river discharge data. Changes in the IHA metrics between the pre and post NEJ periods were classified into three groups with respect to the hydrologic alteration degree, as follows: 0–35% (no altered or minimally altered), 35–75% (moderately altered), and 75–100% (highly altered) [50].
3.5. Quantifying Relationship of Riparian Wetland Change with Hydrologic Alteration
First, the riparian wetland areas were calculated from each wetland distribution map. The hydrologic alteration of 33 hydrologic parameters and overall hydrologic alteration were presented during the pre-dam and post-dam operation periods. Secondly, we used a principal component analysis (PCA) [51,52,53], to determine the relevance of various hydrologic parameters obtained by the IHA and selected those that have a cumulative contribution rate of 70–90%. These parameters serve as indicators related to the area of riparian wetlands. Finally, a stepwise multiple regression analysis was performed for further recognizing the most relevant hydrological indicators. The relationship between the wetland areas and the hydrological indicators was then determined using linear regression.
4. Results
4.1. The Alteration of Hydrological Regime Downstream of the Dam
River stage records were assessed for pre-dam and post-dam (for pre-monsoon season (March–May) and post monsoon season (October–February)). In the post dam period, the average, maximum and minimum river stage records reduced 0.02 m; 0.54 m; 0.01 m and 0.47 m; 0.43 m; 1.05 m during the pre-monsoon season and post-monsoon season, respectively (Table 2). In the pre and post dam periods, the average and maximum river stage decreased significantly from 139.58 m to 139.11 m and from 140.45 m to 140.02 m. The coefficient of variation decreased from 0.77% to 0.32%, from 0.39% to 0.22% and from 0.21% to 0.20% for maximum, average, and minimum river stage during pre-monsoon season, respectively.
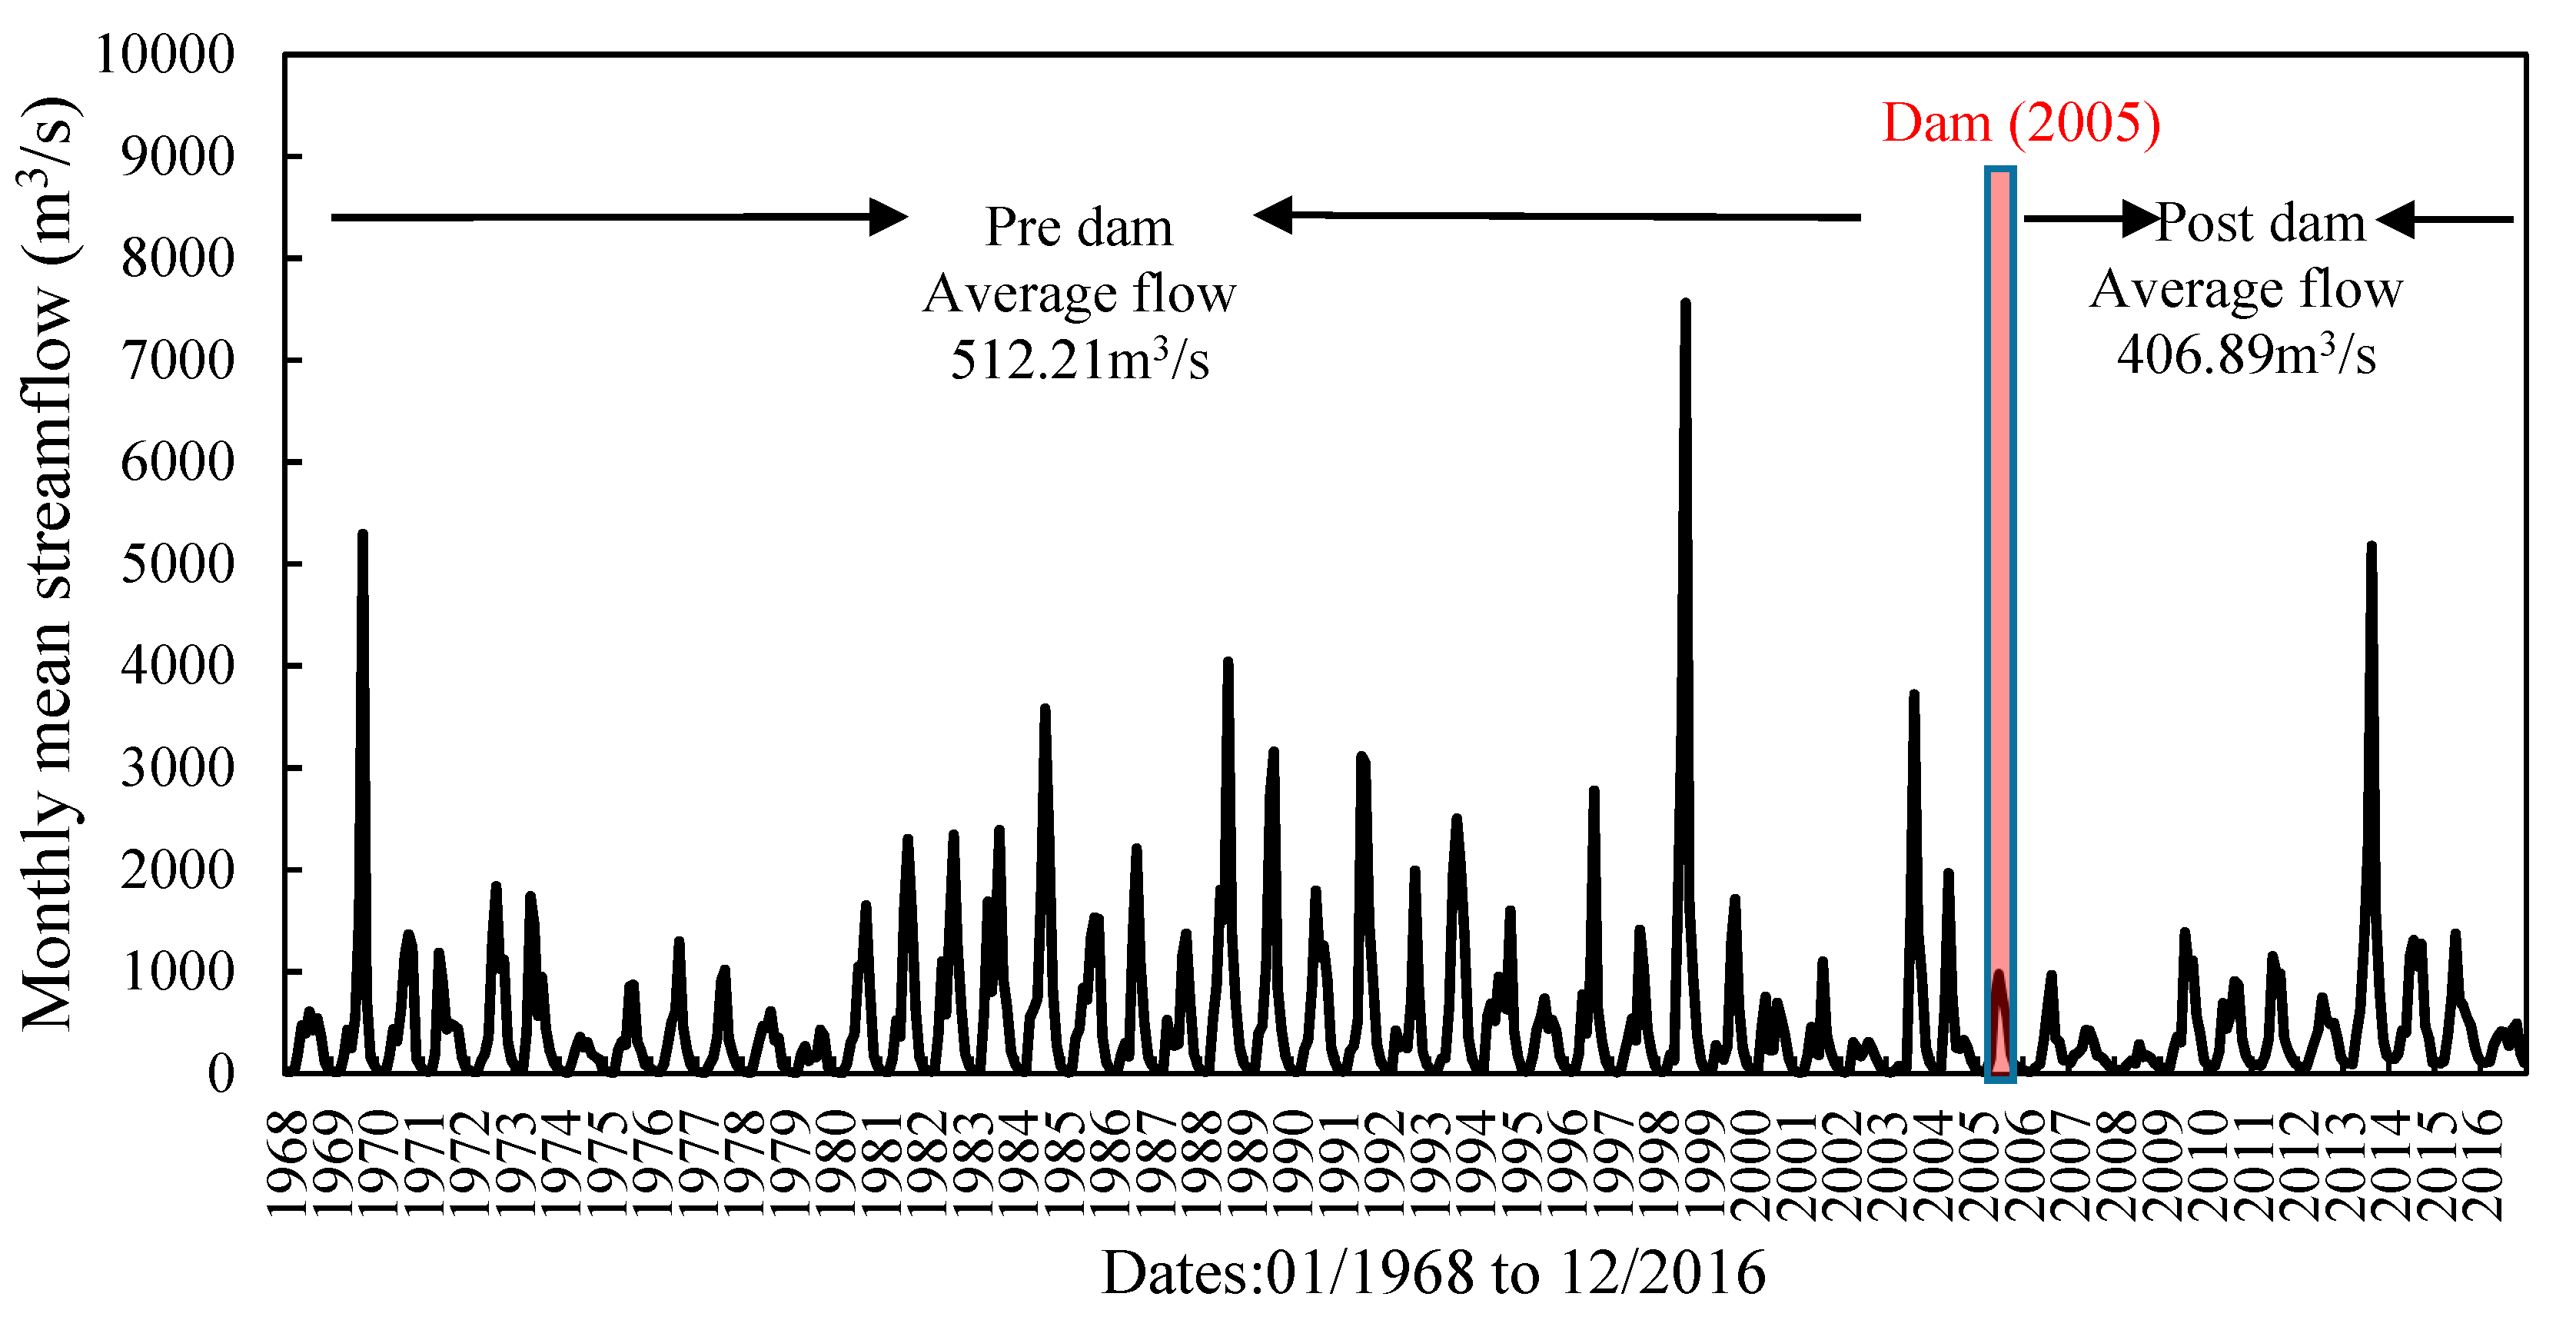
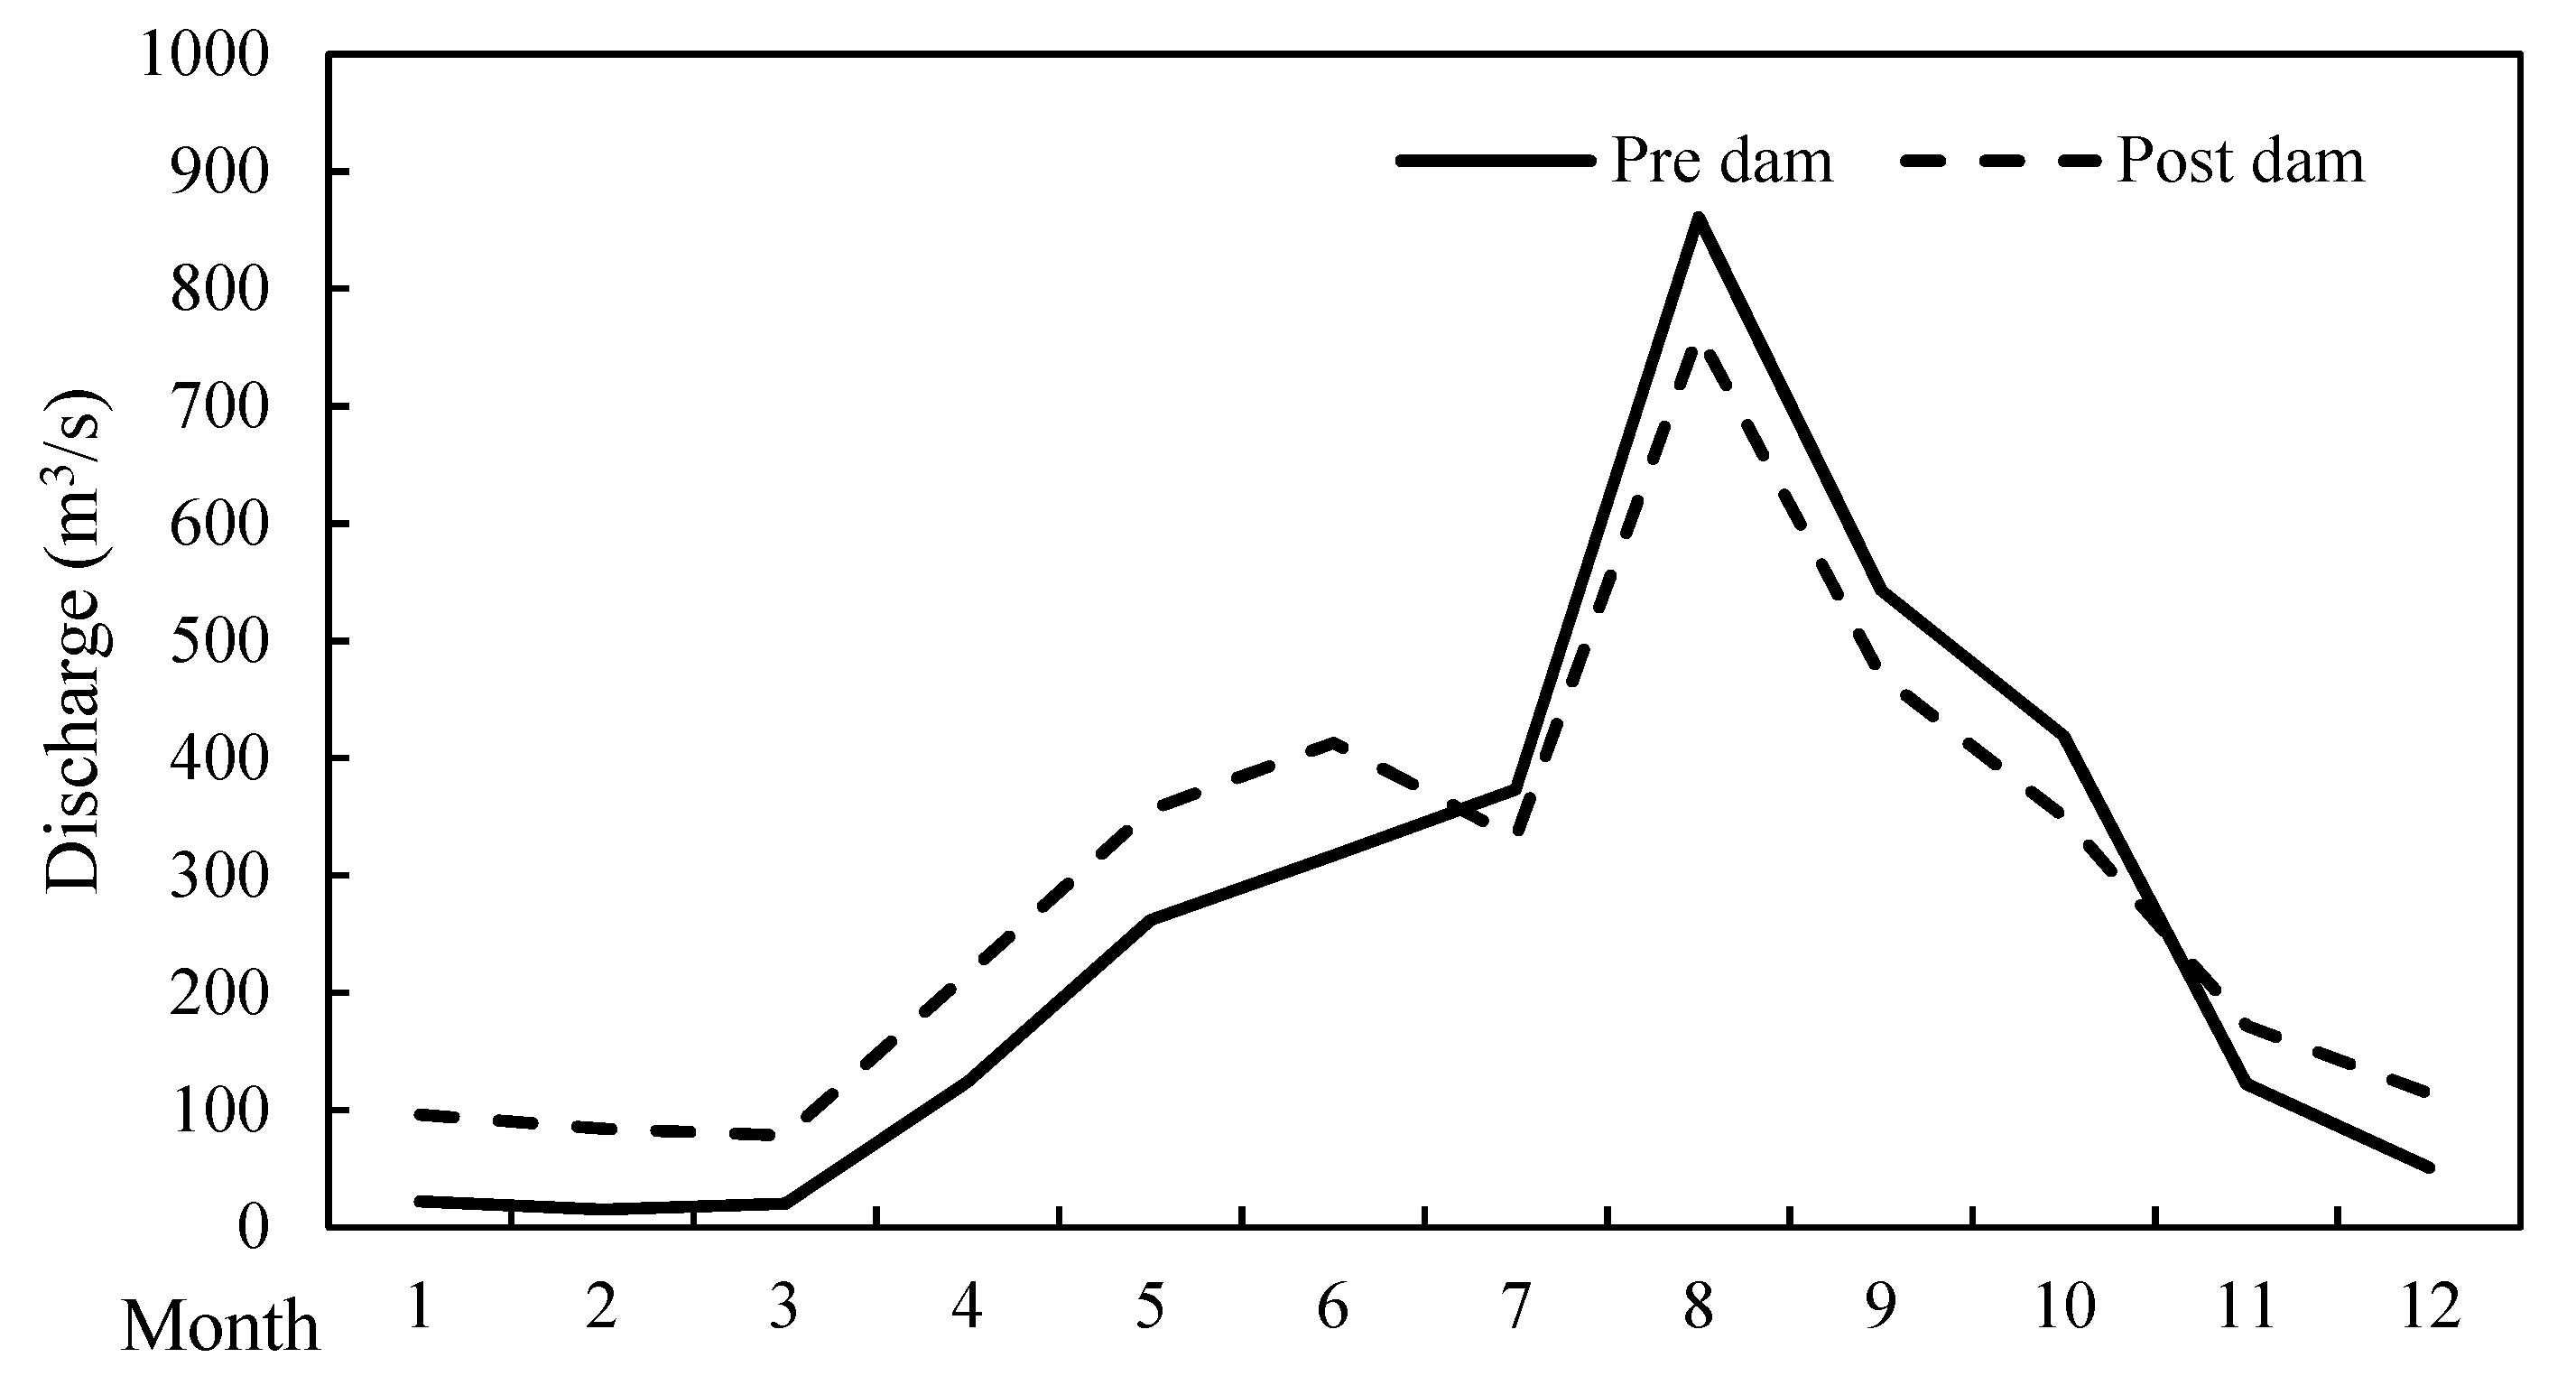
After the dam construction, average discharge reduced from 512 m3/s to 406 m3/s (Figure 3). Before damming, except for the flood years of 1969 and 1998, the monthly maximum discharge reached 4041 m3/s. In the post dam period, the monthly mean discharge maintained below 2245 m3/s except for the flood year of 2013.
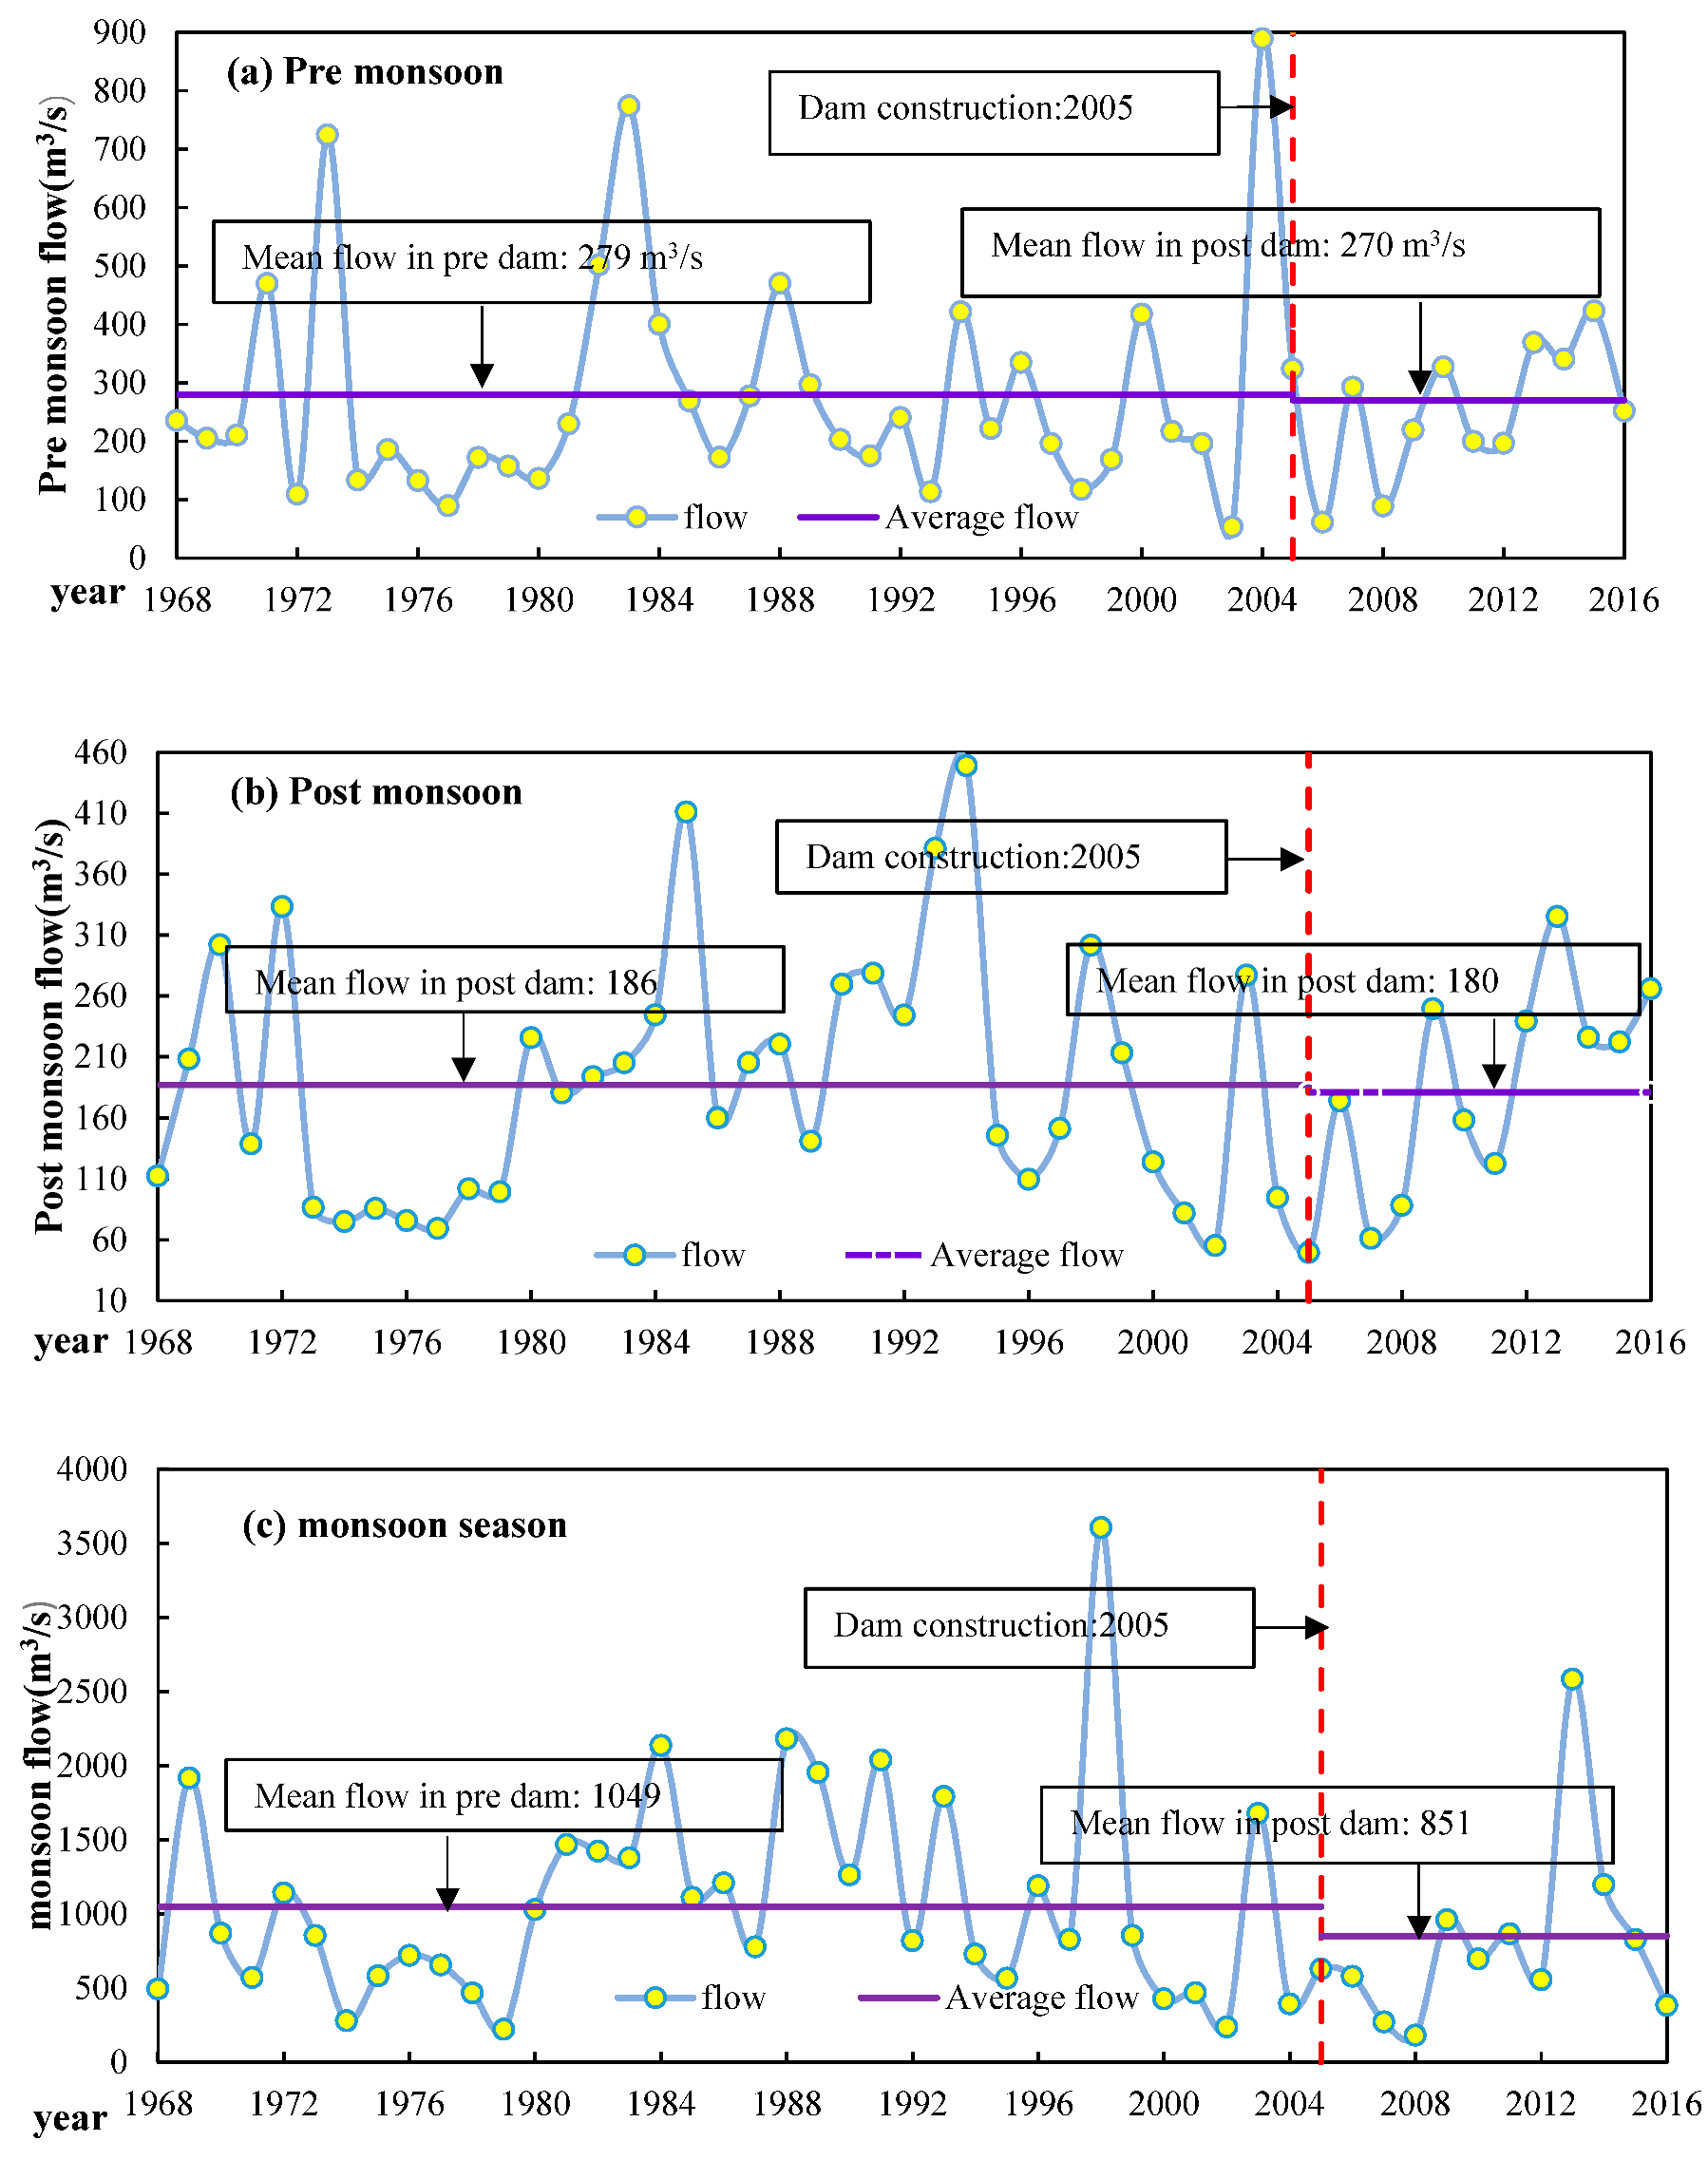
When compared with the pre-dam period, the discharge variability has decreased during the post-dam period for the pre-monsoon season (279–270 m3/s) (Figure 4a), post monsoon season (186–180 m3/s) (Figure 4b), and monsoon season (1049–851 m3/s) (Figure 4c).
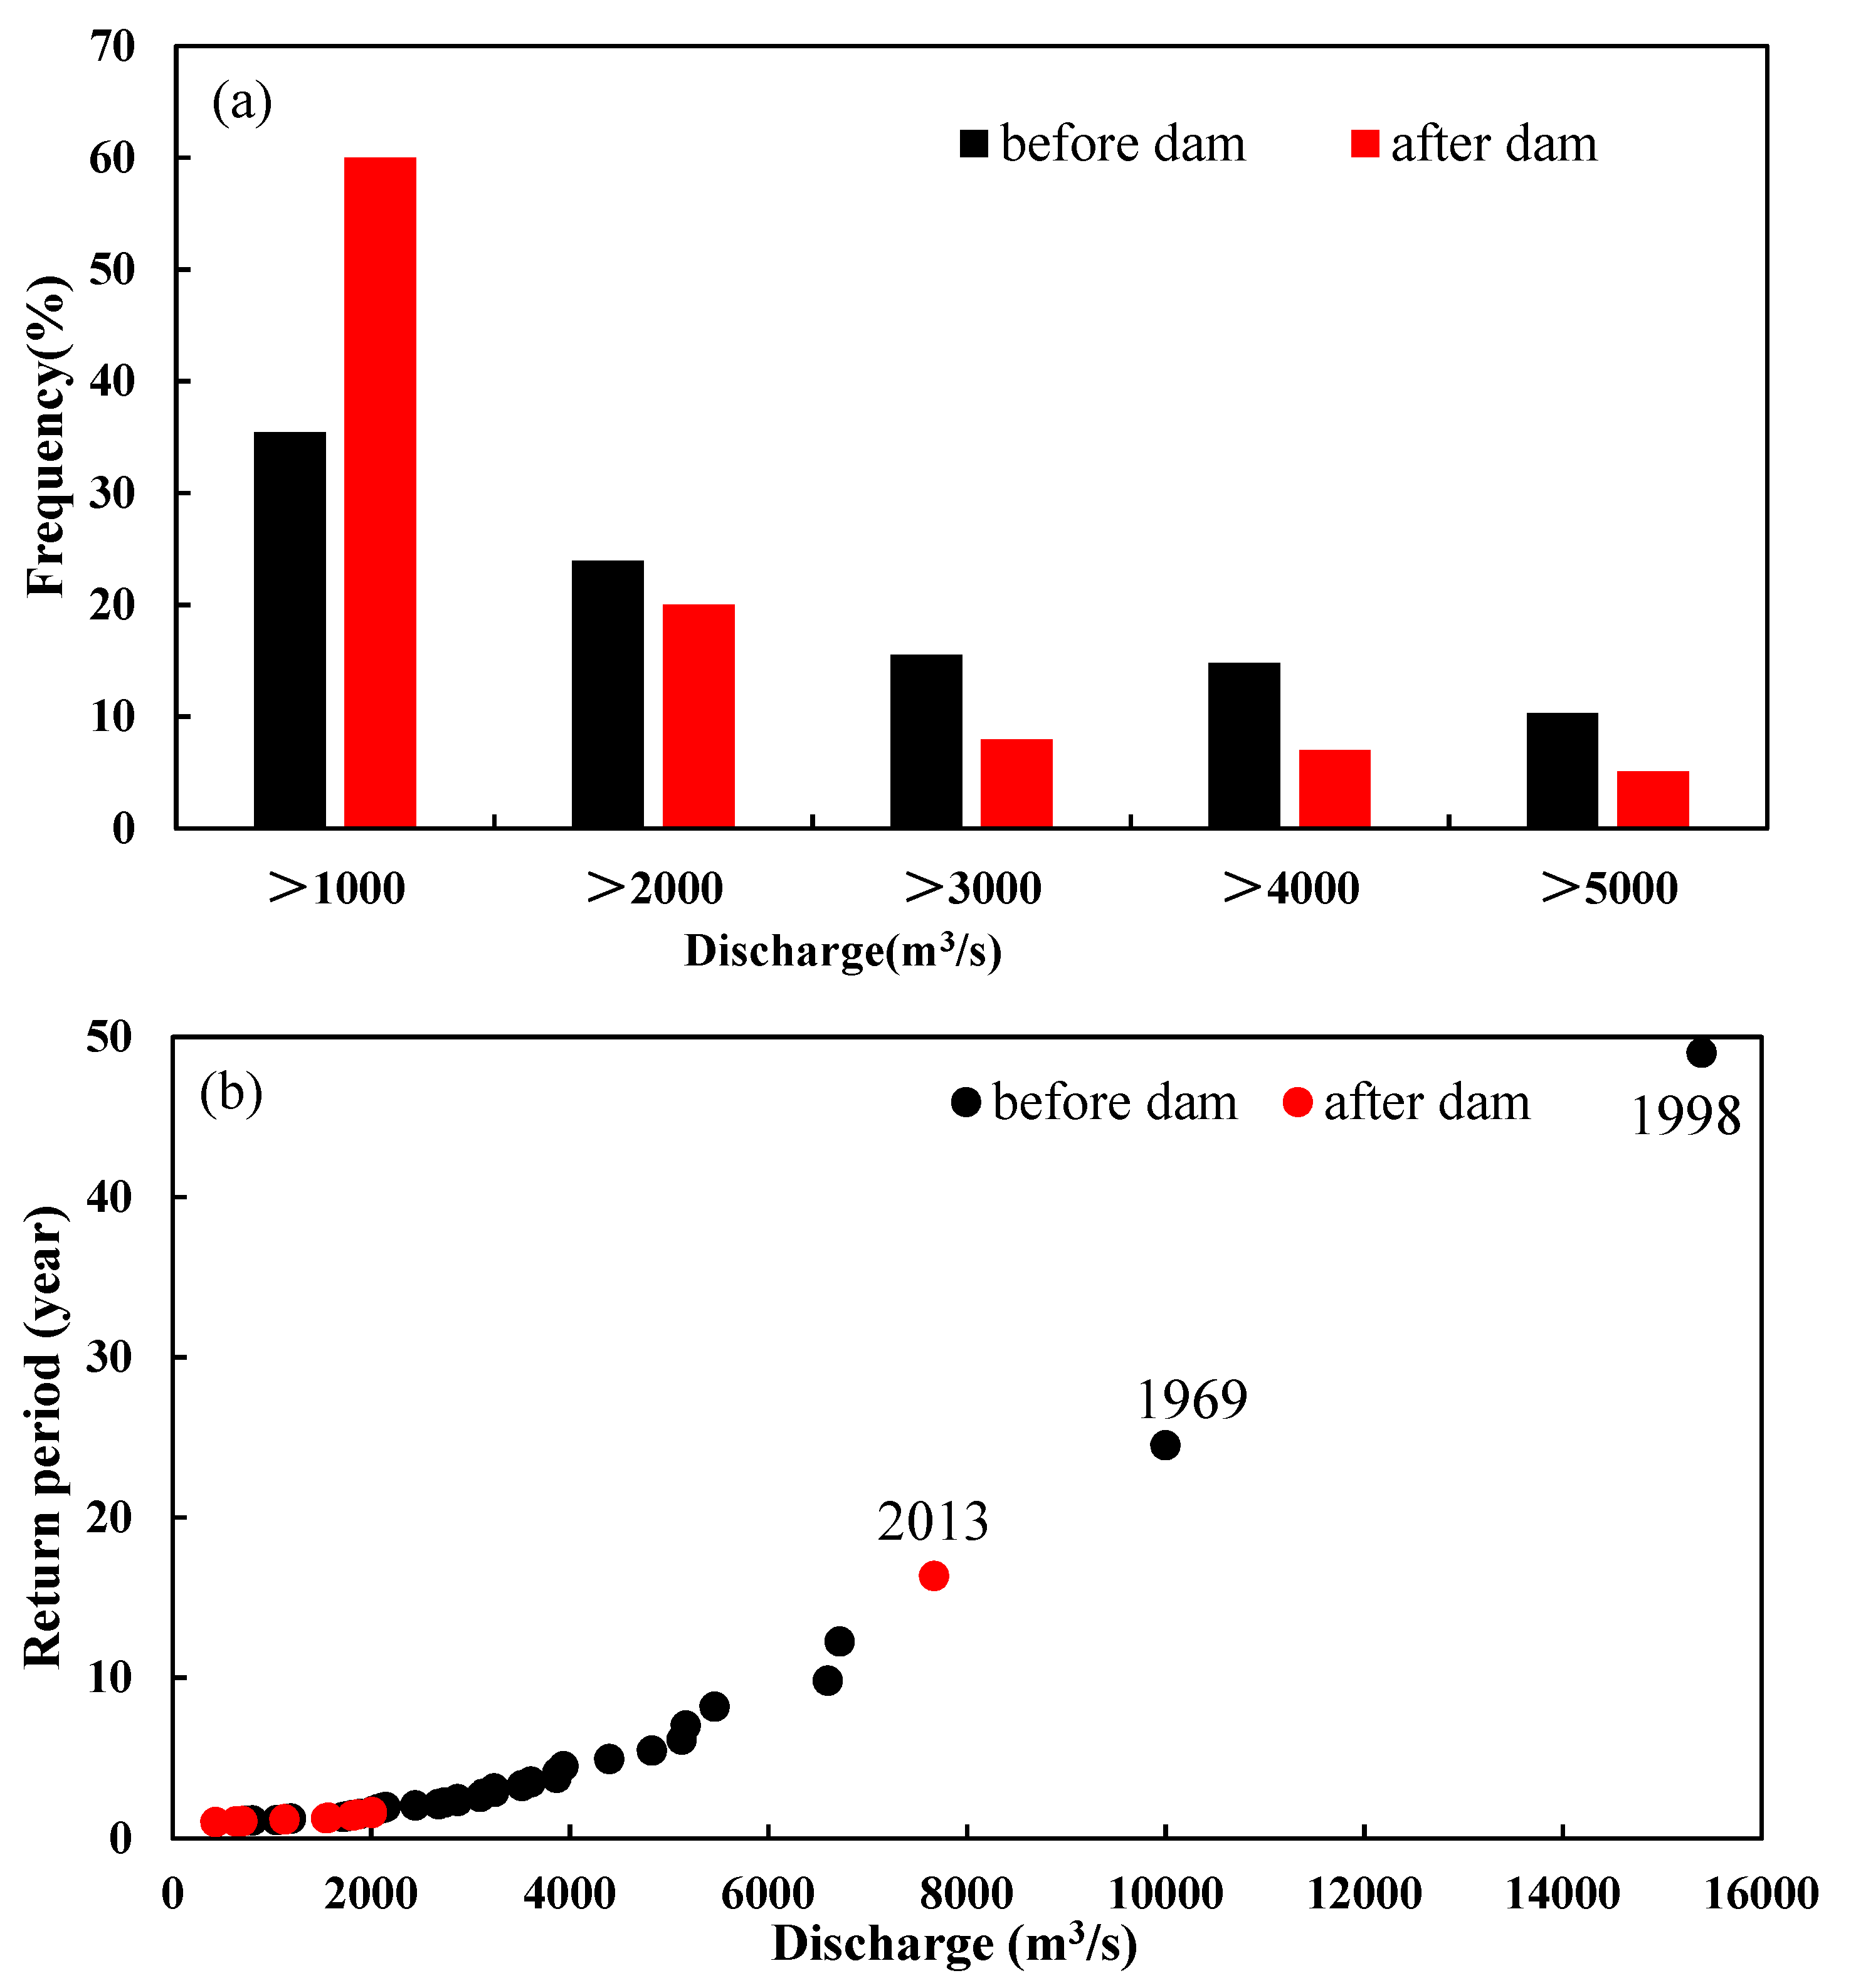
Dam construction reduced flood frequency in high discharge groups (Figure 5a), for instance, floods with a peak discharge of >5000 m3/s with the percentage of 10% before the dam construction and only 5% afterwards. Simultaneously, floods with a peak discharge between 2000 and 4000 m3/s showed a 53% occurrence before dam construction and 34% afterwards. A once-in-50-year event occurred in 1998 (15,400 m3/s) (Figure 5b). However, the flood recurrence interval is maintained within once-in-two-years event after the dam construction.
As shown by the results of the range of IHA (Table 3 and Figure 6), the monthly mean discharges during January and June increased after the dam construction. The monsoon season discharge decreased from July to September, the monthly mean discharges decreased after October in the post-dam period and the maximum discharge decreased during the entire study period. However, the minimum discharges increased to some extents. Apparently, the operation of the NEJ Dam weakened the hydrological extremes. Moreover, the frequency and duration of high and low pulse discharge are important parameters for the construction of the river eco-environment. The low pulse count decreased with a decrease in duration. The operation of the dam has a great influence on the low pulse count and high pulse count. It can be observed that the regulation of the dam has weakened the peak discharge and flood volume. The overall hydrological alteration is 66%, namely, a moderate alteration.
4.2. Riparian Wetland Loss after Dam Construction
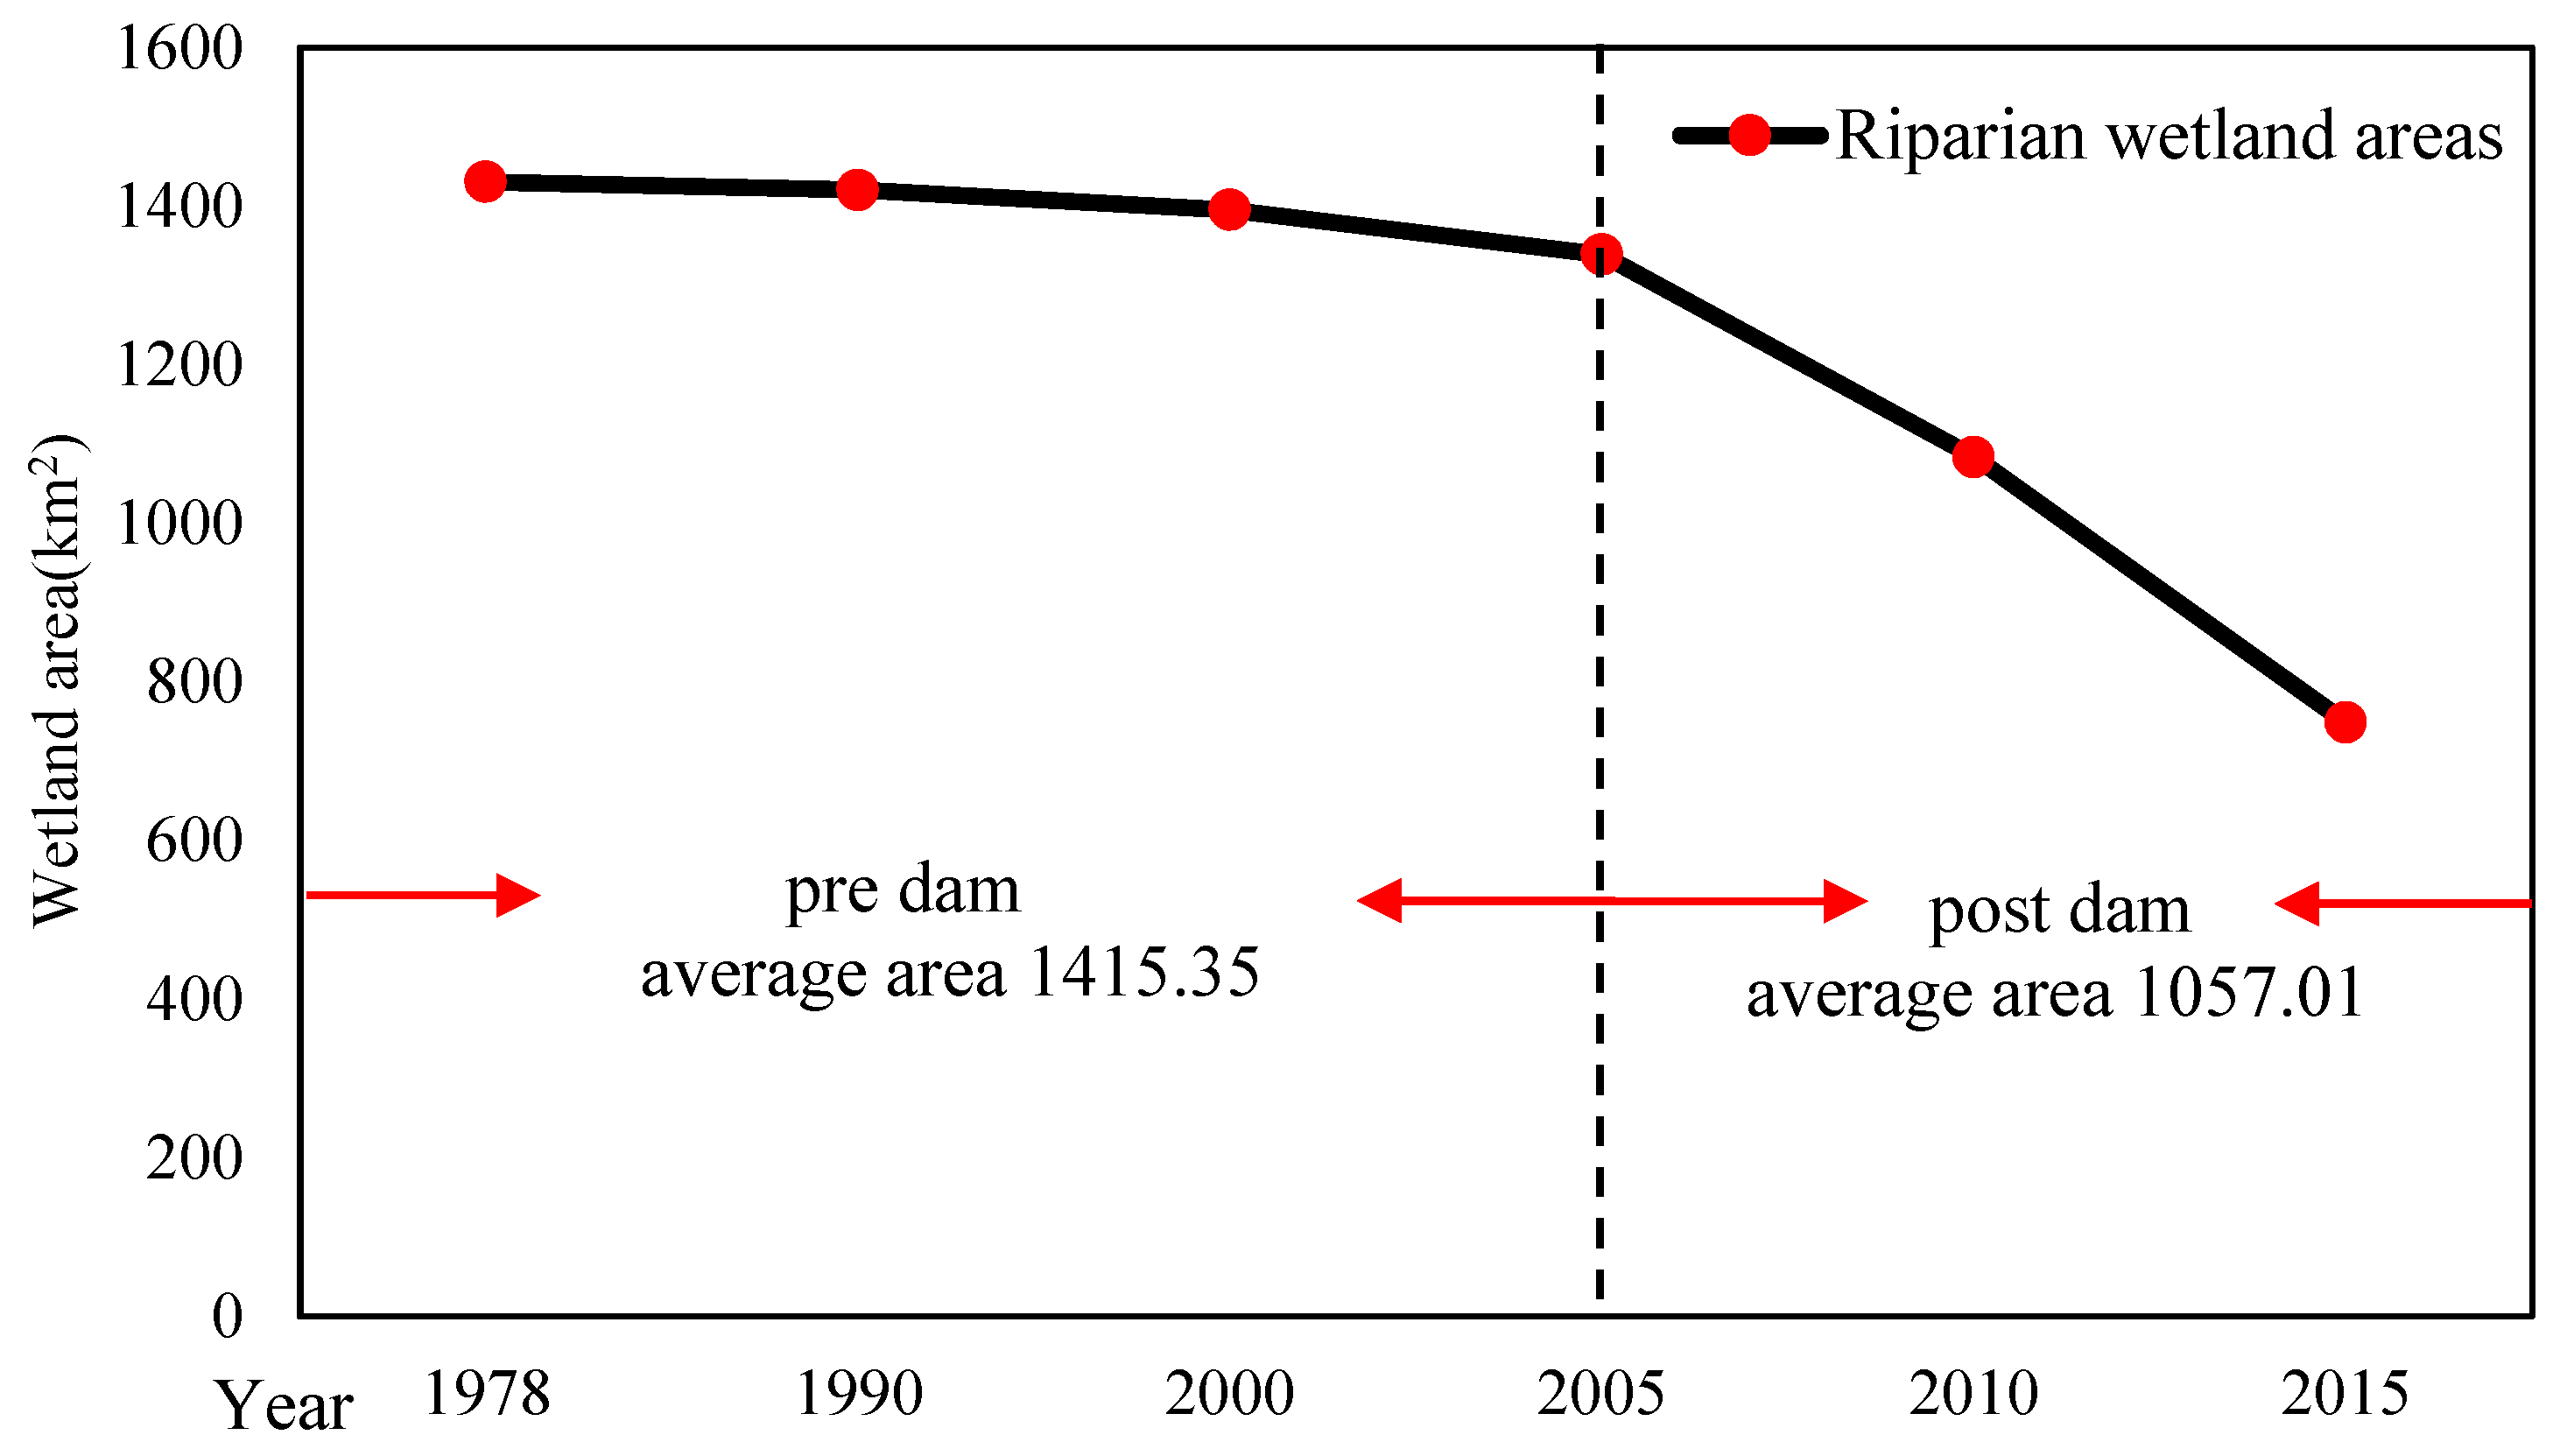
The riparian wetland area in the study area decreased 91.68 km2 from 1978 to 2005 (Figure 7). After the NEJ dam construction (from 2005 to 2015), the wetland area further and largely decreased by 590.01 km2 (or 44%). The average wetland areas before and after the dam construction were 1415.35 km2 and 1057.01 km2, respectively, suggesting a clear association of wetland loss with the dam construction.
4.3. Relation of Riparian Wetland Loss with Hydrological Indicators
Principal component analysis between the riparian wetland areas and the 33 hydrological indicators isolated five principal components. Eighteen hydrological variables were selected (High pulse count, High pulse duration, Date of maximum, March, June, July, August, September, 1-day minimum, 3-day minimum, 7-day minimum, 30-day minimum, 90-day minimum, 1-day maximum, 3-day maximum, 7-day maximum, 30-day maximum, 90-day maximum), which are the 18 most relevant hydrological indicators for the change of riparian wetlands.
Our stepwise multiple regression analysis between riparian wetland area and the 18 hydrological indicators showed that wetland area is mostly associated with the count of high pulse (Pearson correlation > 0.6, p < 0.05), the duration of high pulse (Pearson correlation > 0.7, ρ < 0.05), date of maximum (Pearson correlation > 0.7, ρ < 0.05), and 1-day maximum (Pearson correlation > 0.6, ρ < 0.05), which can be numerically described as follows:
Riparian wetland areas = 880.93 + 16.34× high pulse count + 4.31× high pulse count duration
+ 1.15× 1-day maximum + 7.08× date of maximum
+ 1.15× 1-day maximum + 7.08× date of maximum
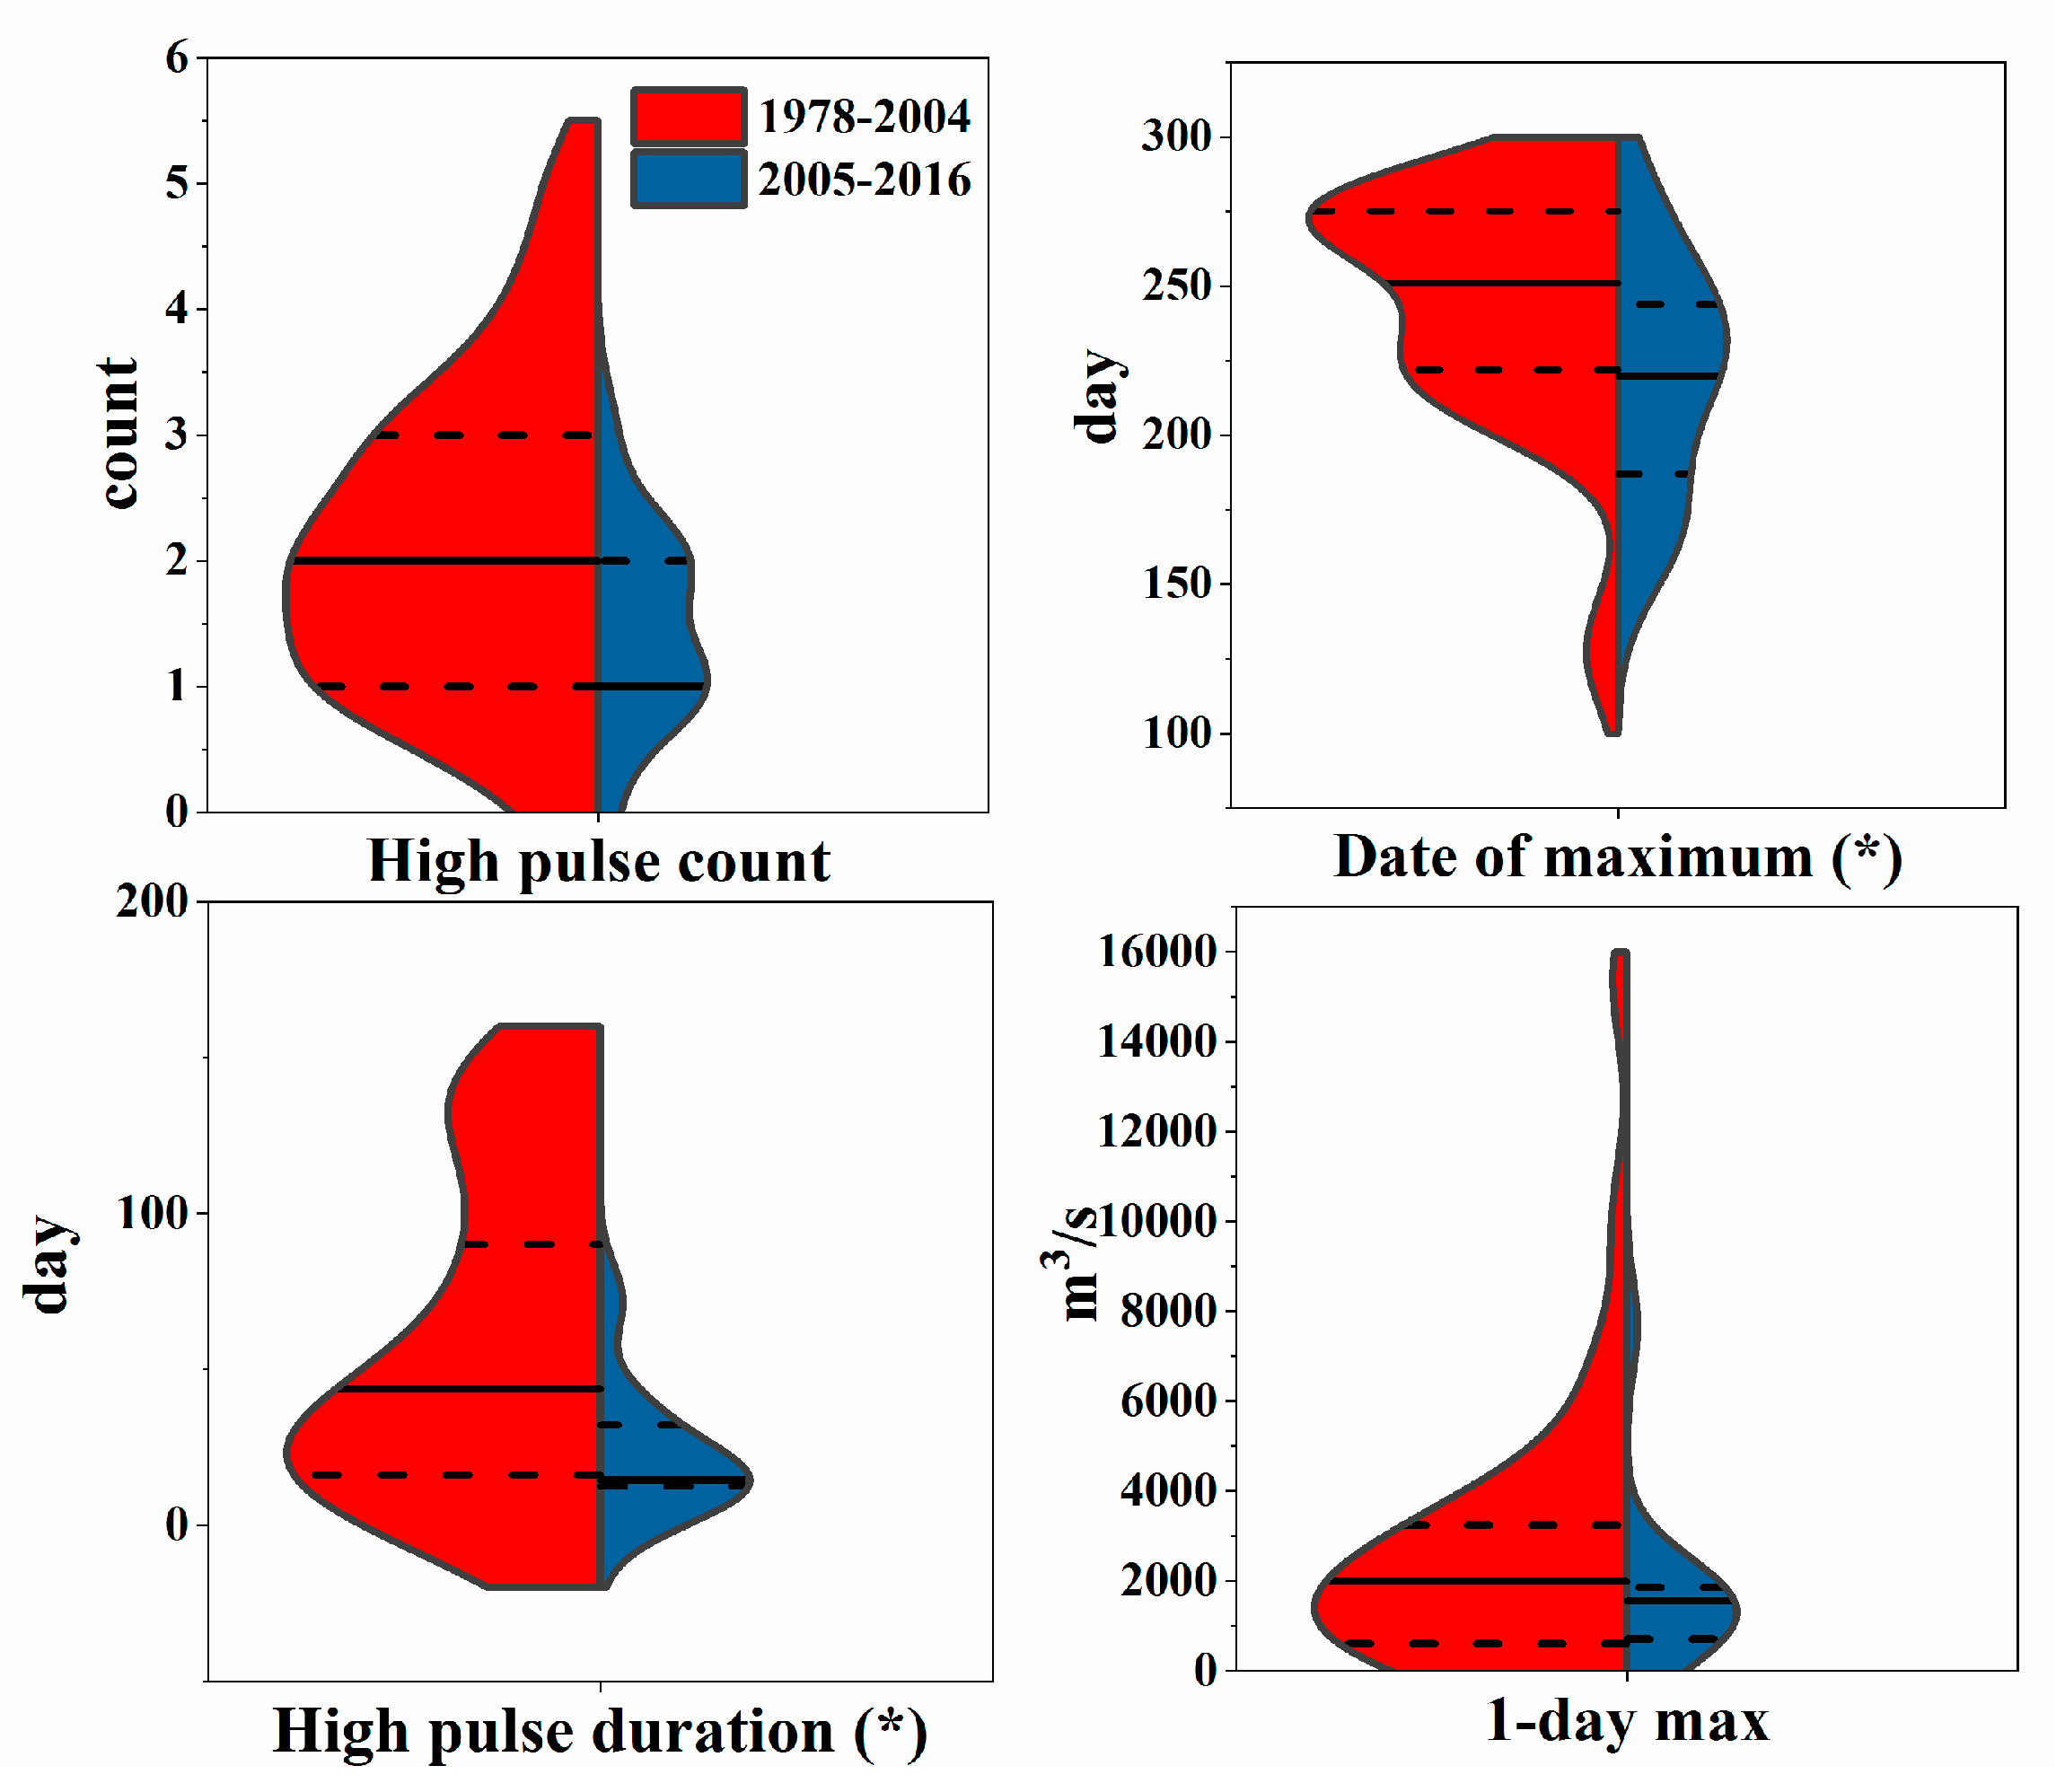
For further illustration of how the four most relevant hydrological indicators were altered by dam construction, violin plots were used to comparatively analyze high pulse count, high pulse duration, 1-day maximum, and date of maximum during the pre-dam and post-dam periods (Figure 8). High pulse count and 1-day maximum values were reduced compared to pre-dam conditions. Date of maximum and high pulse duration variation of post dam were significantly lower compared to pre-dam period (p < 0.05). The mean value of high pulse count decreased from two times to one, the mean discharge of 1-day maximum reduced from 2617 m3/s to 1782 m3/s, the date of maximum occurring time reduced from 224 to 219 days, and the high pulse duration decreased significantly from 78 to 23 days. These alterations contribute to the decrease of wetlands from 1338.76 km2 to 748.75 km2 in the post-dam period.
5. Discussion
5.1. Hydrological Alterations Caused by Dam Construction
Analysis of the discharge between pre-monsoon season and post-monsoon season in the downstream indicated that the magnitude of two periods’ discharges presented a difference caused by dam operation. Extreme low/high discharges were both altered in the post-dam period. Dam impoundment reduced the discharge and peak flow during the pre-monsoon season. In addition, after the post monsoon season, a large amount of water released by the dam can sustain water requirements during dry period, so as to increase the minimum discharge. Furthermore, dams can seasonally alter the river stage records. Therefore, the operation of NEJ dam reduced the frequency and magnitude of high flow and diminished extreme discharge in the downstream basin. The results are consistent with those reported in previous studies [54,55].
5.2. Spatiotemporal Dynamics of Riparian Wetlands Downstream of Dam
The results of this study show that riparian wetland areas in the Nenjiang River decreased by 590.01 km2 in the period of 2005–2016 when compared with those in the period of 1978–2004 (Figure 7). Because riparian wetlands were mainly located at floodplain areas where the terrain is relatively flat, any decline in water stage can considerably alter the river–riparian wetland connectivity [56,57]. For example, although precipitation showed a rapid increasing trend during the post dam period (Figure 2), the decreasing trend of wetlands area also can be found in the study area, indicating that dam contribute substantially to the areal change of riparian wetlands in the downstream. Specifically, the water stage decreased and the maximum difference between the pre-dam and post-dam periods were 0.54 m and 0.43 m, respectively (Table 2). This slight reduction in water stage can lead to a hydrological regime transformation in riparian wetlands, namely, from frequently flooding to scarce flooding. This indicated that water stage variation caused by the dam contributed substantially to the areal change of riparian wetlands downstream and influenced the connectivity between riparian wetlands and rivers.
5.3. Major Hydrological Indicators Reflecting Downstream Riparian Wetland Loss
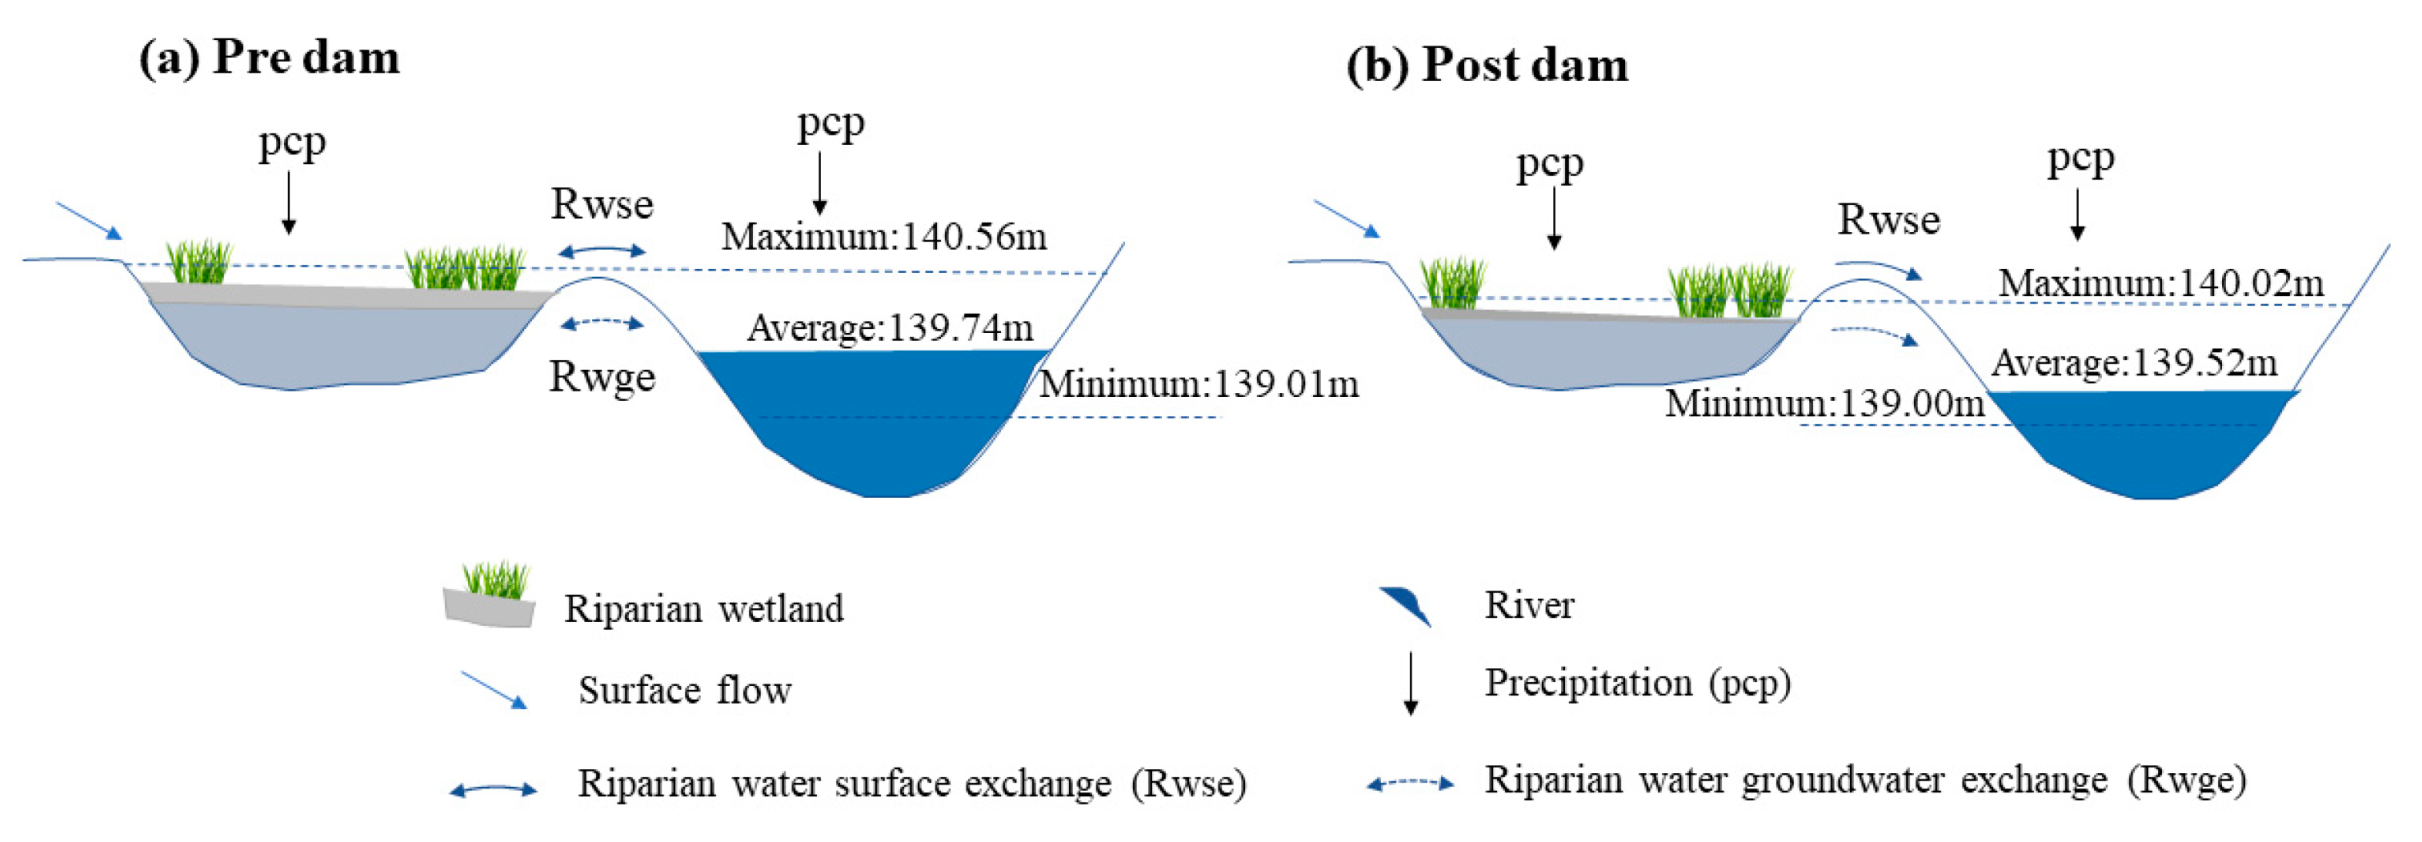
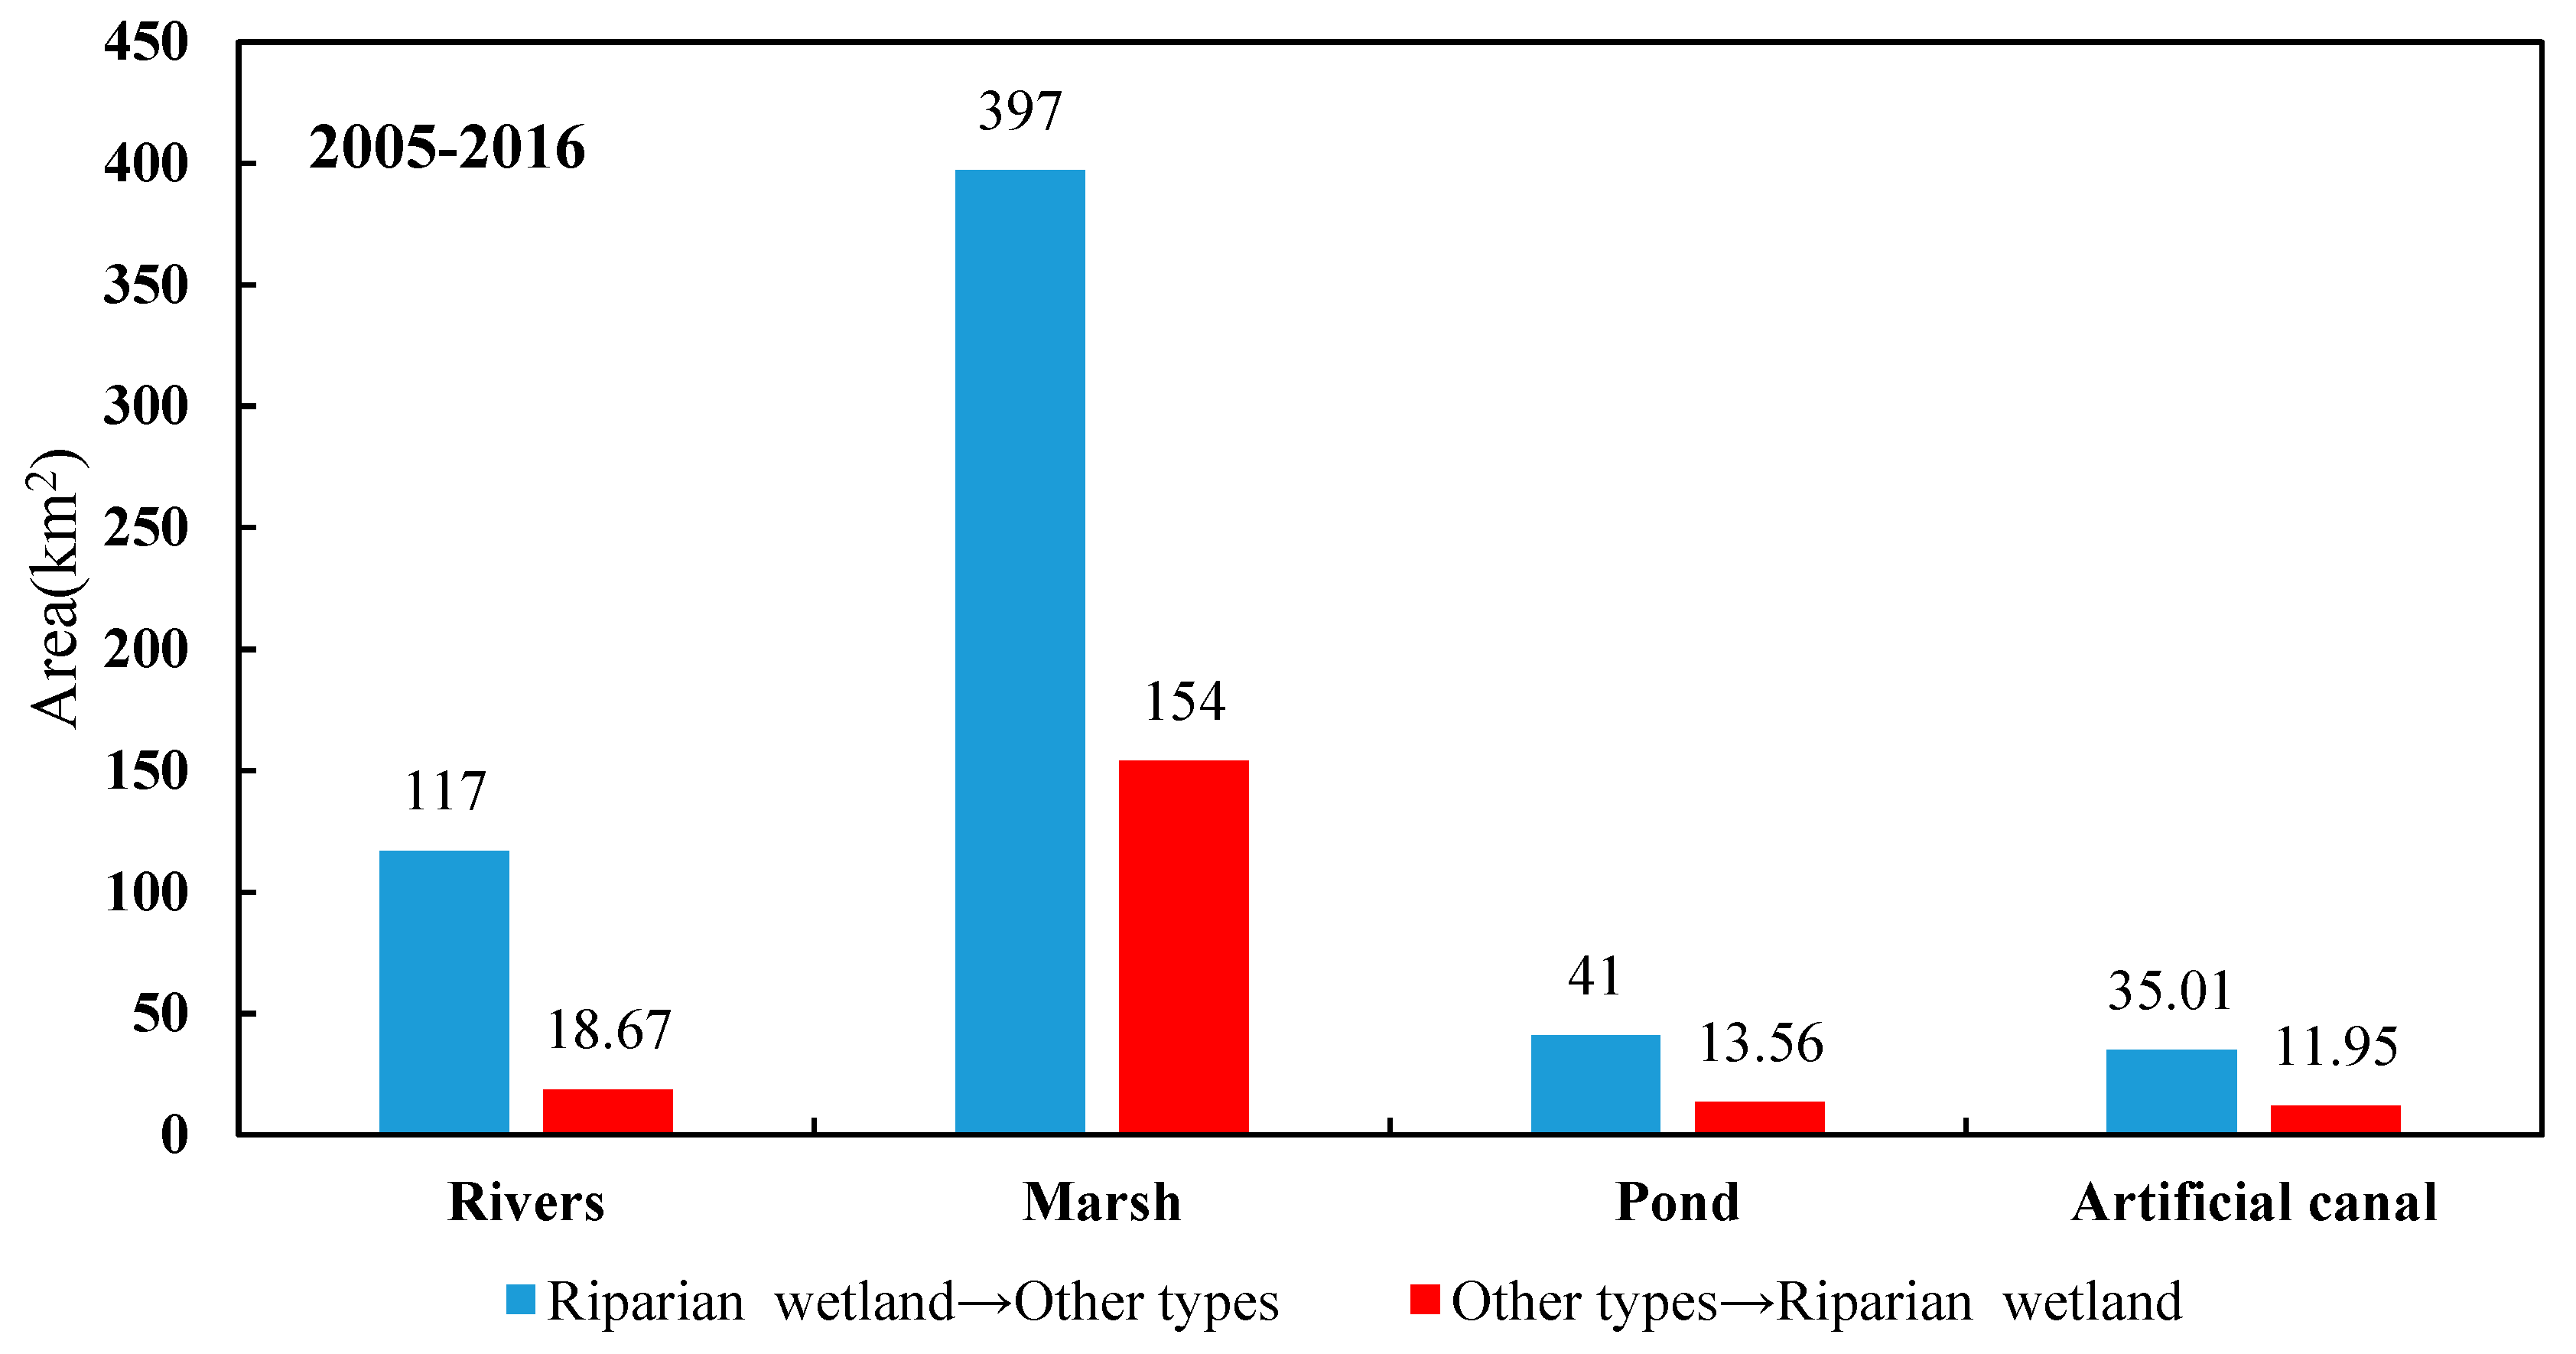
In addition to hydrological conditions, other factors such as topography, river bank elevation, and the promenade along the river can also play an important role in regulating water exchange (hydrological connectivity) between wetlands and their river channel. These changes could have an important impact on water level and wetland water recharge during flooding [58,59,60] (Figure 9). For example, after damming, the peak flow decreased by 32% (Figure 8), and the flow velocity decreased with the decrease of peak flow. Simultaneously, the maximum and the average water level were 140.56 and 139.74 m before the dam (Figure 9a), while decreased to 140.02 and 139.52 m after the dam (Figure 9b). This can considerably reduce the water exchange between river channel and riparian wetlands, namely surface and subsurface water exchange, and eventually lead to area loss and functional degeneration of wetlands. Previous studies have shown that the reduction of peak flow decreases the frequency and area of floodplain flooding in the Atreyee River by 28% after construction of the dam [61]. Therefore, the slowing down of moving flood wave has a greater impact on the flood inundation area and frequency of riparian wetlands. The antecedent date of maximum flow, and the decreasing times and duration of high pulse flow also can lead to a shorter duration of the connection between wetland and surrounding water bodies, and to the reduction of water supply from rivers to wetlands, which extensively change the transformation mode and distribution of wetland types [35,62,63]. For example, the peak flow time is 15 days earlier and the duration is 55 days shorter after damming, which results in a considerable reduction in the interaction time between river and wetland, and the corresponding reduction in water volume. The total area of riparian wetlands decreased by 590.01 km2, of which 397 km2 transformed into marsh (Figure 10). The finding indicates the importance of maintaining hydrological connectivity for river corridor wetlands.
Few studies have looked at the downstream effects of dams on wetland ecosystem development. Our results provide a clear quantification between alteration to hydrological indicators and wetland loss downstream of a river dam. Exploring the relationship between hydrology and wetland ecology from the perspective of hydrologic regime can be used to better understand the characteristics of wetland development. However, the discharge serious used in the post-dam period is relatively shorter than that in the pre-dam period. This will influence the degree of fitting to some extent when developing the multiple regression between wetlands area and flow indictors. In addition, the reduction in flood peak discharge can change the frequency and area of inundation [64]; but, in this study, we have only investigated the impact of hydrological conditions on wetland degradation. Further studies are needed to assess the characteristic changes of wetlands under different flood intensities.
6. Conclusions
In this study, we investigated hydrologic alteration and riparian wetland changes after dam construction in the middle Nenjiang River, Northeast China. Our results show that the dam construction has decreased the peak discharge, flood frequency, and the count and duration of high flow pulses. Dam construction has significantly decreased the riparian wetland areas along a 150-km river reach downstream of the dam. Many previous riparian wetlands have become separated from the river channel and have changed to marsh due to hydrological alterations caused by the dam operation. The reduction in the count and duration of high flow pulses, date of maximum, and 1-day maximum discharge have been found to be the key factors responsible for the wetland area decline. The information gained from this study may have useful implications, not only for the Nenjiang River but also for other dammed rivers in the world, in developing best dam operation practices to protect and/or restore riparian wetland ecosystems downstream of river dams.
Author Contributions
G.Z.; Y.Z. and Y.W. conceived the idea of the study; Y.Z. carried out data analysis and wrote the first manuscript draft; G.Z. supervised the research project and contributed to oversight of the data collection; Y.J.X. and C.D. contributed critical conceptual review and manuscript revisions; all authors approved the final manuscript.
Funding
This research was supported by the National Key R&D Program of China (Grant: 2017YFC0406003) and National Natural Science Foundation of China (Grant: 41877160). The statements, findings, and conclusions are those of the authors and do not necessarily reflect the views of the funding agencies.
Acknowledgments
We would like to express our sincere gratitude to both the editors and two anonymous reviewers for their effort and helpful comments and suggestions on an early version of this manuscript.
Conflicts of Interest
The authors declare no conflict of interest.
References
- Graf, W.L. Dam nation: A geographic census of American dams and their large-scale hydrologic impacts. Water Resour. Res. 1999, 35, 1305–1311. [Google Scholar] [CrossRef]
- Graf, W.L. Downstream hydrologic and geomorphic effects of large dams on American rivers. Geomorphology 2006, 79, 336–360. [Google Scholar] [CrossRef]
- Magilligana, F.J.; Nislow, K.H. Changes in hydrologic regime by dams. Geomorphology 2005, 71, 61–78. [Google Scholar] [CrossRef]
- López-Moreno, J.I.; Vicente-Serrano, S.M.; Beguería, S.; García-Ruiz, J.M.; Portela, M.M.; Almeida, A.B. Dam effects on droughts magnitude and duration in a transboundary basin: The Lower River Tagus, Spain and Portugal. Water Resour. Res. 2009, 45. [Google Scholar] [CrossRef] [Green Version]
- Wang, D.; Zhang, S.H.; Wang, G.L.; Han, Q.Q.; Huang, G.X.; Wang, H.; Liu, Y.; Zhang, Y.P. Quantitative Assessment of the Influences of Three Gorges Dam on the Water Level of Poyang Lake, China. Water 2019, 11, 1519. [Google Scholar] [CrossRef]
- Naiman, R.J.; Décamps, H. The ecology of interfaces: The riparian zone. Annu. Rev. Ecol. Syst. 1997, 28, 621–658. [Google Scholar] [CrossRef]
- Magilligan, F.J.; Nislow, K.H. Long-term changes in regional hydrologic regime following impoundment in a humid-climate watershed. J. Am. Water Resour. Assoc. 2001, 37, 1551–1569. [Google Scholar] [CrossRef]
- Dudgeon, D.; Arthington, A.H.; Gessner, M.O.; Kawabata, Z.I.; Knowler, D.J.; Leveque, C.; Naiman, R.J.; Prieur-Richard, A.H.; Soto, D.; Stiassny, M.L.J.; et al. Freshwater biodiversity: Importance, threats, status and conservation challenges. Biol. Rev. 2006, 81, 163–182. [Google Scholar] [CrossRef] [PubMed]
- Dynesius, M.; Nilsson, C. Fragmentation and flow regulation of river systemsin the northern third of the world. Science 1994, 66, 753–762. [Google Scholar] [CrossRef] [PubMed]
- Junk, W.J.; Bayley, P.B.; Sparks, R.E. The flood pulse concept in river-floodplain systems. Can. Spec. Publ. Fish. Aquat. Sci. 1989, 106, 110–127. [Google Scholar]
- Morris, M.R.; Stanford, J.A. Floodplain succession and soil nitrogen accumulation on a salmon river in southwestern Kamchatka. Ecol. Monogr. 2011, 81, 43–61. [Google Scholar] [CrossRef] [Green Version]
- Kunz, M.J.; Anselmetti, F.S.; Wuest, A.; Wehrli, B.; Vollenweider, A.; Thuringn, S.; Senn, D.B. Sediment accumulation and carbon, nitrogen, and phosphorus deposition in the large tropical reservoir Lake Kariba (Zambia/Zimbabwe). J. Geophys. Res. Biogeosci. 2011, 116. [Google Scholar] [CrossRef] [Green Version]
- Adair, E.C.; Binkley, D.; Andersen, D.C. Patterns of nitrogen accumulation and cycling in riparian floodplain ecosystems along the Green and Yampa rivers. Oecologia 2004, 139, 108–116. [Google Scholar] [CrossRef] [PubMed]
- Mallik, A.U.; Richardson, J.S. Riparian vegetation change in upstream and downstream reaches of three temperate rivers dammed for hydroelectric generation in British Columbia, Canada. Ecol. Eng. 2009, 35, 810–819. [Google Scholar] [CrossRef]
- Johnson, W.C. Adjustment of riparian vegetation to river regulation in the great plains, USA. Wetlands 1998, 18, 608–618. [Google Scholar] [CrossRef]
- Nilsson, C.; Kajsa, B. Alterations of riparian ecosystems caused by river regulation: Dam operations have caused global-scale ecological changes in riparian ecosystems. How to protect river environments and human needs of rivers remains one of the most important questions of our time. BioScience 2000, 50, 783–792. [Google Scholar]
- Bunn, S.E.; Arthington, A.H. Basic principles and ecological consequences of altered flow regimes for aquatic biodiversity. Environ. Manag. 2002, 30, 492–507. [Google Scholar] [CrossRef]
- Evenson, G.R.; Golden, H.E.; Lane, C.R. Depressional Wetlands Affect Watershed Hydrological, Biogeochemical, and Ecological Functions. Ecol. Appl. 2018, 28, 53–66. [Google Scholar] [CrossRef] [PubMed]
- Mei, X.; Van Gelder, P.H.A.J.M.; Dai, Z.; Tang, Z. Impact of dams on flood occurrence of selected rivers in the United States. Front. Earth Sci. 2017, 11, 268–282. [Google Scholar] [CrossRef]
- Bernal, B.; Mitsch, W.J. A comparison of soil carbon pools and profiles in wetlands in Costa Rica and Ohio. Ecol. Eng. 2008, 34, 311–323. [Google Scholar] [CrossRef]
- Hu, Y.; Wang, L.; Tang, Y.; Li, Y.; Chen, J.; Xi, X.; Sun, Y. Variability in soil microbial community and activity between coastal and riparian wetlands in the Yangtze River estuary—Potential impacts on carbon sequestration. Soil. Biol. Biochem. 2014, 70, 221–228. [Google Scholar] [CrossRef]
- Mitsch, W.J.; Gosselink, J.G. The value of wetlands: Importance of scale and landscape setting. Ecol. Econ. 2000, 35, 25–33. [Google Scholar] [CrossRef]
- Fossey, M.; Rousseau, A.N. Assessing the long-term hydrological services provided by wetlands under changing climate conditions: A case study approach of a Canadian watershed. J. Hydrol. 2016, 10, 1287–1302. [Google Scholar] [CrossRef]
- Zedler, J.B.; Kercher, S. Wetland resources: Status, trends, ecosystem services, and restorability. Annu. Rev. Environ. Resour. 2005, 30, 39–74. [Google Scholar] [CrossRef]
- Talukdar, S.; Pal, S. Impact of dam on inundation regime of flood plain wetland of punarbhaba river basin of barind tract of Indo-Bangladesh. Int. Soil Water Conserv. Res. 2017, 5, 109–121. [Google Scholar] [CrossRef]
- Mcmanamay, R.A. Quantifying and generalizing hydrologic responses to dam regulation using a statistical modeling approach. J. Hydrol. 2014, 519, 1278–1296. [Google Scholar] [CrossRef] [Green Version]
- Baker, D.W.; Bledsoe, B.P.; Albano, C.M.; Poff, N.L. Downstream effects of diversion dams on sediment and hydraulic conditions of Rocky Mountain streams. River Res. 2011, 27, 88–401. [Google Scholar] [CrossRef]
- Gao, Y.; Vogel, R.M.; Kroll, C.N.; Poff, N.L.; Olden, J.D. Development of representative indicators of hydrologic alteration. J. Hydrol. 2009, 374, 136–147. [Google Scholar] [CrossRef]
- Graf, W.L. Geomorphology and American dams: The scientific, social, and economic context. Geomorphology 2005, 71, 3–26. [Google Scholar] [CrossRef]
- Arthur, R.; Dana, M.; Kevin, E. Identifying indicators and quantifying large-scale effects of dams on fishes. Ecol. Indic. 2016, 61, 646–657. [Google Scholar]
- Pal, S.; Saha, T.K. Identifying dam-induced wetland changes using an inundation frequency approach: The case of the Atreyee River basin of Indo-Bangladesh. Ecohydrol. Hydrobiol. 2018, 18, 66–81. [Google Scholar] [CrossRef]
- Natoli, L.; Luci, G.; Mennillo, E.; Adeogun, A.O.; Arukwe, A. Assessing the effects of Awba dam sediment (Nigeria) on the steroidogenesis of H295R cells using different extraction methods. Sci. Total Environ. 2019, 650, 121–131. [Google Scholar] [CrossRef] [PubMed]
- Conkle, J.L.; Gan, J.; Anderson, M.A. Degradation and sorption of commonly detected PPCPs in wetland sediments under aerobic and anaerobic conditions. J. Soils Sediments 2012, 12, 1164–1173. [Google Scholar] [CrossRef]
- Zhang, X.; Cao, W.H.; Guo, Q.C. Effects of landuse change on surface runoff and sediment yield at different watershed scales on the Loess Plateau. Int. J. Sediment Res. 2010, 25, 283–293. [Google Scholar] [CrossRef]
- Li, S.N.; Wang, G.X.; Deng, W.; Hu, Y.M.; Hu, W.W. Influence of hydrology process on wetland landscape pattern: A case study in the Yellow River Delta. Ecol. Eng. 2009, 35, 1719–1726. [Google Scholar] [CrossRef]
- Sun, K.; Zhang, J.; Yong, H.; Liu, J. FPCANet: Fisher discrimination for Principal Component Analysis Network. Knowl. Based Syst. 2019, 166, 108–117. [Google Scholar] [CrossRef]
- Yang, Y.; Zhang, M.; Zhu, L.; Liu, W.; Han, J.; Yang, Y. Influence of large reservoir operation on water-levels and flows in reaches below dam: Case study of the Three Gorges Reservoir. Sci. Rep. 2017, 7, 15640. [Google Scholar] [CrossRef] [PubMed]
- Gao, F.; Li, H.; Jiang, X.H. Water use law of the main irrigational areas in the Yellow River. J. Irrig. Drain. 2004, 23, 21–24. [Google Scholar]
- Meng, B.; Liu, J.L.; Bao, K.; Sun, B. Water fluxes of Nenjiang River Basin with ecological network analysis: Conflict and coordination between agricultural development and wetland restoration. J. Clean. Prod. 2019, 213, 933–943. [Google Scholar] [CrossRef]
- Wei, G.; Tych, W.; Beven, K.; He, B.; Ning, F.; Zhou, H. Nierji reservoir flood forecasting based on a Data-Based Mechanistic methodology. J. Hydrol. 2018, 567, 227–237. [Google Scholar] [CrossRef]
- Xing, L.; Niu, Z.; Xu, P.; Li, D. Wetlands classification and assessment of Ramsar sites in China based on time series Moderate Resolution Imaging Spectroradiometer (MODIS) imagery. Mar. Freshw. Res. 2018, 69, 658–668. [Google Scholar] [CrossRef]
- Niu, Z.G.; Zhang, H.Y.; Wang, X.W.; Yao, W.B.; Zhou, D.M.; Zhao, K.Y.; Yang, J. Changes of wetland types in China from 1978 to 2008. Chin. Sci. Bull. 2012, 57, 1400–1411. [Google Scholar] [CrossRef]
- Dixon, M.J.R.; Loh, J.; Davidson, N.C.; Beltrame, C.; Freeman, R.; Walpole, M. Tracking global change in ecosystem area: The Wetland Extent Trends index. Biol. Conserv. 2016, 193, 27–35. [Google Scholar] [CrossRef]
- Hamed, K.H.; Rao, A.R. A Modified Mann-Kendall Trend Test for Autocorrelated Data. J. Hydrol. 1998, 204, 182–196. [Google Scholar] [CrossRef]
- Yang, T.; Zhang, Q.; Chen, Y.Q.D.; Tao, X.; Xu, C.Y.; Chen, X. A spatial assessment of hydrologic alteration caused by dam construction in the middle and lower Yellow River, China. Hydrol. Process. 2008, 22, 3829–3843. [Google Scholar] [CrossRef]
- Chen, Y.Q.D.; Yang, T.; Xu, C.Y.; Zhang, Q.; Chen, X.; Hao, Z.C. Hydrologic alteration along the Middle and Upper East River (Dongjiang) basin, South China: A visually enhanced mining on the results of RVA method. Stoch. Environ. Res. Risk. A 2010, 24, 9–18. [Google Scholar] [CrossRef]
- Zhao, Q.; Liu, S.; Deng, L.; Dong, S.; Yang, Z.; Yang, J. Landscape change and hydrologic alteration associated with dam construction. Int. J. Appl. Earth. Obs. 2012, 16, 17–26. [Google Scholar] [CrossRef]
- Richter, B.; Baumgartner, J.; Wigington, R.; Braun, D. How much water does a river need. Freshw. Biol. 1997, 37, 231–249. [Google Scholar] [CrossRef]
- Richter, B.D.; Baumgartner, J.V.; Braun, D.P.; Powell, J. A spatial assessment of hydrologic alteration within a river network. Regul. Rivers Res. Manag. Int. J. Devoted River Res. Manag. 1998, 14, 329–340. [Google Scholar] [CrossRef]
- Richter, B.D.; Baumgartner, J.V.; Powell, J.; Braun, D.P. A method for assessing hydrologic alteration within ecosystems. Conserv. Biol. 1996, 10, 1163–1174. [Google Scholar] [CrossRef]
- Maingi, J.K.; Marsh, S.E. Quantifying hydrologic impacts following dam construction along the Tana River, Kenya. J. Arid. Environ. 2002, 50, 53–79. [Google Scholar] [CrossRef]
- Arabzadeh, R.; Kholoosim, M.; Bazrafshan, J. Regional hydrological drought monitoring using principal components analysis. J. Irrig. Drain. 2016, 142, 1943–4774. [Google Scholar] [CrossRef]
- Olsen, R.L.; Chappell, R.W.; Loftis, J.C. Water quality sample collection, data treatment and results presentation for principal components analysis--literature review and Illinois River Watershed case study. Water Res. 2012, 46, 3110–3122. [Google Scholar] [CrossRef] [PubMed]
- Matteau, M.; Assani, A.A.; Mesfioui, M. Application of multivariate statistical analysis methods to the dam hydrologic impact studies. J. Hydrol. 2009, 371, 120–128. [Google Scholar] [CrossRef]
- Zhang, Z.Y.; Huang, Y.L.; Huang, J.L. Hydrologic alteration associated with dam construction in a medium-sized coastal watershed of southeast China. Water 2016, 8, 317. [Google Scholar] [CrossRef]
- Swades, P. Impact of Water Diversion on Hydrological Regime of Atreyee River of Indo-Bangladesh. Int. J. River Basin Manag. 2016, 14, 1–42. [Google Scholar]
- Pal, S.; Talukdar, S. Application of frequency ratio and logistic regression models for assessing physical wetland vulnerability in Punarbhaba river basin of Indo-Bangladesh. Hum. Ecol. Risk Assess. Int. J. 2018, 24, 1–21. [Google Scholar] [CrossRef]
- Karim, F.; Kinsey-Henderson, A.; Wallace, J.; Arthington, A.H.; Pearson, R.G. Modelling wetland connectivity during overbank flooding in a tropical floodplain in north Queensland, Australia. Hydrol. Process. 2012, 26, 2710–2723. [Google Scholar] [CrossRef]
- Keesstra, S.D. Impact of natural reforestation on floodplain sedimentation in the Dragonja basin, SW Slovenia. Earth Surf. Process. Landf. 2007, 32, 49–65. [Google Scholar] [CrossRef]
- Zhang, Z.; Huang, Y.; Xu, C.Y.; Chen, X.; Moss, E.M.; Jin, Q.; Bailey, A.M. Analysis of Poyang Lake water balance and its indication of river–lake interaction. SpringerPlus. 2016, 5, 1555. [Google Scholar] [CrossRef]
- Keesstra, S.D.; Huissteden, J.V.; Vandenberghe, J. Evolution of the morphology of the river Dragonja (SW Slovenia) due to land-use changes. Geomorphology 2005, 69, 191–207. [Google Scholar] [CrossRef]
- Ablat, X. Application of Landsat derived indices and hydrological alteration matrices to quantify the response of floodplain wetlands to river hydrology in arid regions based on different dam operation strategies. Sci. Total Environ. 2019, 232, 1–44. [Google Scholar] [CrossRef]
- Boulton, A.J.; Rolls, R.J.; Jaeger, K.L. Chapter 2.3—Hydrological Connectivity in Intermittent Rivers and Ephemeral Streams. In Intermittent Rivers and Ephemeral Streams; Academic Press: Cambridge, MA, USA, 2017; pp. 79–108. [Google Scholar]
- Capon, S.J. Flood variability and spatial variation in plant community composition and structure on a large arid floodplain. J. Arid Environ. 2005, 60, 283–302. [Google Scholar] [CrossRef]
Figure 1.
Geographical locations of the Nenjiang River Basin, meteorological and hydrological stations, and the Nierji–Fulaerji (NEJ–FLEJ) river reach, where the present study focuses.
Figure 1.
Geographical locations of the Nenjiang River Basin, meteorological and hydrological stations, and the Nierji–Fulaerji (NEJ–FLEJ) river reach, where the present study focuses.

Figure 2.
Hydrologic year separation of the streamflow time-series in the lower Nenjiang River, Northeast China.
Figure 2.
Hydrologic year separation of the streamflow time-series in the lower Nenjiang River, Northeast China.

Figure 3.
Monthly mean discharge at the Fulaerji (FLEJ) gage station on the Nenjiang River in Northeast China, showing the impact of the Nierji (NEJ) Dam construction in 2005.
Figure 3.
Monthly mean discharge at the Fulaerji (FLEJ) gage station on the Nenjiang River in Northeast China, showing the impact of the Nierji (NEJ) Dam construction in 2005.

Figure 4.
Discharge fluctuation at the Fulaerji (FLEJ) gage station on the Nenjiang River in the (a) pre-monsoon, (b) post-monsoon seasons, and (c) monsoon season before and after the Nierji (NEJ) dam construction. The average discharge is calculated by normal year (Figure 2).
Figure 4.
Discharge fluctuation at the Fulaerji (FLEJ) gage station on the Nenjiang River in the (a) pre-monsoon, (b) post-monsoon seasons, and (c) monsoon season before and after the Nierji (NEJ) dam construction. The average discharge is calculated by normal year (Figure 2).

Figure 5.
Changes in flood frequency before and after dam construction (a) and discharge–recurrence interval distribution (b) in Fulaerji station.
Figure 5.
Changes in flood frequency before and after dam construction (a) and discharge–recurrence interval distribution (b) in Fulaerji station.

Figure 6.
Alteration of monthly discharge before and after dam construction in Fulaerji station.

Figure 7.
Area change of riparian wetlands along the 150-km Nierji–Fulaerji (NEJ–FLEJ) reach of the Nenjiang River in Northeast China from 1978 to 2015.
Figure 7.
Area change of riparian wetlands along the 150-km Nierji–Fulaerji (NEJ–FLEJ) reach of the Nenjiang River in Northeast China from 1978 to 2015.

Figure 8.
Variety characteristics of four hydrologic indicators (high pulse count, high pulse duration, 1-day maximum and date of maximum) for pre-dam (red) vs. post-dam (blue) conditions. The dashed line represents the range of quartiles between the first and third quartiles, and the horizontal line represents the mean value. Differences between pre-dam vs. post-dam conditions were based on paired permutation tests. (Note: A significant difference of four hydrologic indicators between before and after dam construction is marked by an asterisk (Welch’s t-test—p < 0.05)).

Figure 9.
Conceptual model of interaction between river stage and riparian wetland water volume (pcp: Precipitation; Rwse: Riparian water surface exchange; Rwge: Riparian water groundwater exchange).
Figure 9.
Conceptual model of interaction between river stage and riparian wetland water volume (pcp: Precipitation; Rwse: Riparian water surface exchange; Rwge: Riparian water groundwater exchange).

Figure 10.
Conversion types of riparian wetlands along the 150–km Nierji–Fulaerji (NEJ–FLEJ) reach of the Nenjiang River in Northeast China from 2005 (when a dam was constructed) to 2016. The numbers denote to the changed areas from riparian wetlands to other types and vice versa.
Figure 10.
Conversion types of riparian wetlands along the 150–km Nierji–Fulaerji (NEJ–FLEJ) reach of the Nenjiang River in Northeast China from 2005 (when a dam was constructed) to 2016. The numbers denote to the changed areas from riparian wetlands to other types and vice versa.


Table 1.
Indicators of hydrologic alteration and their definitions used in this study.
| Parameter Group | Regime Features | Hydrologic Parameters |
|---|---|---|
| 1. Magnitude of monthly median discharge | Magnitude, timing | Median discharge for each calendar month |
| 2. Magnitude of annual extreme flows | Magnitude, duration | Annual minimum 1-day medians |
| Annual minimum 3-day medians | ||
| Annual minimum 7-day medians | ||
| Annual minimum 30-day medians | ||
| Annual minimum 90-day medians | ||
| Annual maximum 1-day medians | ||
| Annual maximum 3-day medians | ||
| Annual maximum 7-day medians | ||
| Annual maximum 30-day medians | ||
| Annual maximum 90-day medians | ||
| Number of zero-flow days | ||
| Base flow (7-day minimum discharge divided by median discharge for year) | ||
| 3. Duration of annual extreme flows | Timing | Julian date of each annual one-day maximum discharge |
| Julian date of each annual one-day minimum discharge | ||
| 4. Frequency and duration of the high and low pulses | Magnitude, frequency | Number of high pulses for each year |
| Number of low pulses for each year | ||
| Medians duration of high pulses for each year | ||
| Medians duration of low pulses for each year | ||
| 5. Rate of change and frequency | Frequency, rate of change | Number of rises |
| Number of falls | ||
| Number of flow reversals |
Table 2.
River stage record gaps in pre and post monsoon seasons in reference to maximum, minimum and average river stage records. Before and after dam construction have been considered. (Note: A significant difference of river stage (pre-monsoon season and post-monsoon season) between before and after dam construction is marked by an asterisk (Welch’s t-test—p < 0.05)).
| River Stage Records Type | Season | River Stage Records(m) | Gap | % of Gap | CV in % | ||
|---|---|---|---|---|---|---|---|
| Before Dam Construction | After Dam Construction | Before Dam Construction | After Dam Construction | ||||
| Average | Pre monsoon | 139.74 | 139.52 | 0.22 | 0.16 | 0.39 | 0.22 |
| Post monsoon | 139.58 | 139.11 | 0.47 (*) | 0.34 | 0.31 | 0.44 | |
| Maximum | Pre monsoon | 140.56 | 140.02 | 0.54 | 0.38 | 0.77 | 0.32 |
| Post monsoon | 140.45 | 140.02 | 0.43 (*) | 0.31 | 0.59 | 0.37 | |
| Minimum | Pre monsoon | 139.01 | 139.00 | 0.01 | 0.01 | 0.21 | 0.20 |
| Post monsoon | 139.00 | 137.95 | 1.05 | 0.76 | 0.28 | 1.46 | |
Table 3.
Results of indicators of hydrologic alteration (IHA) non-parametric range of variability approach (RVA) for the Nierji (NEJ) dam.
Table 3.
Results of indicators of hydrologic alteration (IHA) non-parametric range of variability approach (RVA) for the Nierji (NEJ) dam.
| Indicators | Pre-Impact Period | Post-Impact Period | Hydrologic Alteration | ||
|---|---|---|---|---|---|
| Monthly Median Discharge | Median (m3·s−1) | Coeff. of Dispersion | Median (m3·s−1) | Coeff. of Dispersion | (%) |
| January | 22 | 6.46 | 96 | 0.62 | 87 (H) |
| February | 15 | 10.51 | 84 | 0.82 | 87 (H) |
| March | 20 | 9.11 | 78 | 0.81 | 87 (H) |
| April | 124 | 1.53 | 216 | 1.18 | 34 (L) |
| May | 262 | 1.12 | 356 | 1.31 | 24 (L) |
| June | 317 | 0.99 | 413 | 2.09 | 48 (M) |
| July | 373 | 1.40 | 332 | 1.29 | 73 (M) |
| August | 861 | 2.04 | 762 | 1.25 | 73 (M) |
| September | 543 | 1.15 | 470 | 1.66 | 97 (H) |
| October | 419 | 0.78 | 350 | 1.09 | 73 (M) |
| November | 122 | 1.05 | 172 | 1.19 | 34 (L) |
| December | 51 | 2.49 | 114 | 0.75 | 60 (M) |
| Magnitude of annual extreme flows (m3∙s−1) | |||||
| 1-day minimum | 13 | 8.15 | 60 | 0.86 | 75 (H) |
| 3-day minimum | 13 | 8.12 | 66 | 0.82 | 87 (H) |
| 7-day minimum | 13 | 8.10 | 71 | 0.75 | 87 (H) |
| 30-day minimum | 14 | 7.69 | 76 | 0.78 | 87 (H) |
| 90-day minimum | 21 | 6.63 | 86 | 0.73 | 87 (H) |
| 1-day maximum | 2245 | 1.41 | 1570 | 0.80 | 87 (H) |
| 3-day maximum | 2142 | 1.40 | 1557 | 0.83 | 87 (H) |
| 7-day maximum | 1977 | 1.38 | 1517 | 0.83 | 87 (H) |
| 30-day maximum | 1531 | 1.43 | 1222 | 0.79 | 87 (H) |
| 90-day maximum | 945 | 1.10 | 788.2 | 0.92 | 75 (H) |
| Number of zero days | 0 | 0 | 0 | 0 | 0 |
| Base flow index | 0.02 | 13.75 | 0.18 | 0.91 | 73(L) |
| Duration of annual extreme flows | |||||
| Date of minimum | 58 | 0.39 | 41 | 0.10 | 75 (H) |
| Date of maximum | 234 | 0.15 | 220 | 0.17 | 87 (H) |
| Frequency and duration of the high and low pulses | |||||
| Low pulse count | 3 | 1 | 1 | 0 | 100 (H) |
| Low pulse duration | 16 | 0.21 | 2 | 8.18 | 100 (H) |
| High pulse count | 4 | 2.00 | 1 | 1.50 | 100 (H) |
| High pulse duration | 55 | 1.70 | 7 | 1.50 | 100 (H) |
| Rate of change and frequency of flow | |||||
| Rise rate | 12 | 1.54 | 7 | 1.63 | 6 (L) |
| Fall rate | −8 | −1.79 | −8 | −1.08 | 57 (M) |
| Number of reversals | 29 | 1.41 | 72 | 0.29 | 100 (H) |
© 2019 by the authors. Licensee MDPI, Basel, Switzerland. This article is an open access article distributed under the terms and conditions of the Creative Commons Attribution (CC BY) license (http://creativecommons.org/licenses/by/4.0/).
Share and Cite
MDPI and ACS Style
Zheng, Y.; Zhang, G.; Wu, Y.; Xu, Y.J.; Dai, C. Dam Effects on Downstream Riparian Wetlands: The Nenjiang River, Northeast China. Water 2019, 11, 2038. https://doi.org/10.3390/w11102038
AMA Style
Zheng Y, Zhang G, Wu Y, Xu YJ, Dai C. Dam Effects on Downstream Riparian Wetlands: The Nenjiang River, Northeast China. Water. 2019; 11(10):2038. https://doi.org/10.3390/w11102038
Chicago/Turabian StyleZheng, Yuexin, Guangxin Zhang, Yanfeng Wu, Y. Jun Xu, and Changlei Dai. 2019. "Dam Effects on Downstream Riparian Wetlands: The Nenjiang River, Northeast China" Water 11, no. 10: 2038. https://doi.org/10.3390/w11102038
Note that from the first issue of 2016, this journal uses article numbers instead of page numbers. See further details here.