Article

Analysis of an Ecological Flow Regime during the Ctenopharyngodon Idella Spawning Period Based on Reservoir Operations

1
School of Hydropower and Information Engineering, Huazhong University of Science and Technology, Wuhan 430074, China
2
Hubei Key Laboratory of Digital Valley Science and Technology, Wuhan 430074, China
3
Changjiang River Scientific Research Institute of Changjiang Water Resources Commission, Wuhan 430015, China
4
Central-southern Safety and Environment Technology Institute Co LTD, Wuhan 430051, China
*
Author to whom correspondence should be addressed.
Water 2019, 11(10), 2034; https://doi.org/10.3390/w11102034
Submission received: 15 June 2019 / Revised: 18 September 2019 / Accepted: 24 September 2019 / Published: 29 September 2019
(This article belongs to the Special Issue Environmental Flows, Ecological Quality and Ecosystem Services)

Abstract

:
The study of fish habitats is important for us to better understand the impact of reservoir construction on river ecosystems. Many habitat models have been developed in the past few decades. In this study, a fuzzy logic-based habitat model, which couples fuzzy inference system, two-dimensional laterally averaged hydrodynamic model, and two-dimensional shallow water hydrodynamic model, is proposed to identify the baseline condition of suitable habitat for fish spawning activities. The proposed model considers the reservoir and the downstream river channel, and explores the comprehensive effects of water temperature, velocity, and water depth on habitat suitability. A real-world case that considers the Ctenopharyngodon idella in the Xuanwei Reservoir of Qingshui River is studied to investigate the effect of in- and outflow of reservoir on fish habitat and the best integrative management measure of the model. There were 64 simulations with different reservoir in- and outflows employed to calculate the weighted usable area and hydraulic habitat suitability. The experimental results show that the ecological flow for Ctenopharyngodon idella spawning can satisfy the basic demand when the reservoir inflow is greater than 60 m3/s and the reservoir outflow is greater than 100 m3/s. The habitat ecological suitability is the best when the reservoir outflow is 120 m3/s. A more reasonable and reliable ecological flow range can be obtained based on the habitat model in this paper, which provides the best scenario for water resources planning and management in the Qingshui River Basin.

1. Introduction

Reservoirs play key roles in the social and economic development as a water conservancy project that prevents or controls flood and regulates water flow [1], however, the construction of a reservoir changes natural flow regimes of a river and has an impact on the river. These effects are mainly manifested as follows: (1) blocking the migration path of fish to make it impossible to complete its life history process, resulting in a decline in genetic diversity of fish populations [2]; (2) affecting sediment transport, resulting in sedimentation at the bottom of the reservoir and river blockage [3]; (3) affecting nitrogen, phosphorus, and other substances migration, thereby inducing eutrophication [4]; (4) leading to a decrease in the temperature of the outflow during the spawning period of the fish which delays the breeding season, and thus affects the growth of the individual born in the current year. Furthermore, the resulting discharge process changes the river characteristics and related fish habitats quantity and quality [5]. As a result, reservoir construction may cause a decrease in the biological abundance of fish species and even leads to the disappearance of some spawning grounds [6]. With the rapid development of the economy, the problem of energy shortage is becoming more and more serious. Hydropower is attracting more and more attention as a clean and sustainable energy source. In recent years, more and more reservoirs have been built. According to statistics, more than 100,000 reservoirs have been built in China with more than 100,000 m3 of storage capacity [7,8]. Watershed water resources management and planning and the development of rational flow plans also require in-depth research and exploration.
Fish are a common indicator of aquatic habitat richness [9,10]. Their habitats include the waters necessary to complete the entire life history process, such as spawning grounds, feeding grounds, wintering grounds, and migratory passages connecting waters of different life stages [11,12]. Fish habitats not only provide living space for fish, but also provide all environmental factors such as water temperature, substrate, flow rate, pH value, and dissolved oxygen that satisfy the survival, growth, and reproduction of fish. Fish habitats are mainly affected by the hydrological conditions of the river, where flow and water temperature are one of the two main important factors affecting fish spawning [13]. Thermal stratification is common in narrow channel reservoirs and greatly influences the aquatic animal habitat environment [14]. It causes a significant difference between the reservoir outflow temperature and the inflow temperature [15]. The hysteresis of the water temperature in the downstream of the thermal stratification reservoir is affected to some extent by the discharge. Meanwhile, the discharge of the reservoir also affects the flow velocity and water depth distribution of the downstream river channel [16]. Therefore, it is necessary to predict the quality and quantity of fish habitats by simulating the spatial and temporal distribution of various hydraulic factors such as water temperature, velocity, and water depth in the reservoir and the downstream river. The development of a rational watershed planning and management plan (develop a suitable ecological flow scenarios) is significant for the survival, reproduction, and development of fish [17].
Recently, several classical approaches were used to estimate ecological flow, including hydrologic [18], hydraulic [19], and a habitat suitability modeling approach [20]. The hydrological approach determines ecological flow based on historical hydrological data, of which one representative method is the Tennant method [21]. The hydraulic approach determines the ecological flow according to the wetted perimeter of the cross section of the river [22]. Hydrological and hydraulic approaches are favored because of their simplicity and ease of calculation, but both of them lack the biological mechanisms and biological requirements. Fortunately, the habitat suitability modeling approach combines the knowledge of hydraulics and biology to establish the relationship between habitat and hydraulic factors [23]. It has certain advantages in the evaluation of ecological flow and has attracted more and more researchers’ attention. The most classical habitat suitability modeling approach is the instream flow incremental methodology (IFIM) and its physical habitat simulation component (PHABSIM) [24], which includes the suitability of habitat target species to a series of hydraulic factors such as flow velocity and water depth to build a habitat suitability index model. The habitat suitability modeling approach provides the best range of hydraulic factors such as flow for habitat target species, which has certain reference significance for guiding reservoir operation [25]. In past decades, habitat suitability modeling approaches have been applied to rainbow trout Oncorhynchus mykiss at the Colorado River [26], brown trout Salmo trutta at the Calore Irpino River [27], and Indian Carp fish [28], which have successively assessed the relationship between habitat weighted usable area and outflow. The computer aided simulation model for instream flow requirements (CASiMiR) is a habitat simulation tool for aquatic organisms with a focus on fish and macroinvertebrates [29], which uses a multivariate fuzzy logic approach to link abiotic attributes with habitat requirements of aquatic species, resulting in a habitat suitability index (HSI) [29]. The fuzzy model considers the uncertainties of habitat hydraulics variables and enables expressing nonlinear relationships between habitat hydraulic variables in a transparent manner [30]. It uses the three physical characteristics of rivers that allow for the determination of the quality of habitats for fish species, i.e., velocity, water depth, and water temperature [31]. Each parameter is classified by an overlapping membership function described by a fuzzy language. Since the boundaries of two consecutive fuzzy sets are overlapping, an object may partially belong to two consecutive fuzzy sets [32]. The expert knowledge is embedded in fuzzy if–then rules to determine the relationship between these physical parameters and biological responses, and to define fuzzy rules in combination. It uses language descriptions such as ”low”, ”moderate”, and ”high” for the quantification of hydraulics variables and combines the knowledge of aquatic ecology experts to translate these descriptions into a data processing framework [33]. In recent years, fuzzy models such as a fuzzy logic-based Spinibarbus hollandi habitat suitability model [34], data-driven fuzzy habitat suitability models for brown trout [32], and a fuzzy habitat model based on Chinese sturgeon (Acipenser sinensis) [35] have been used to calculate habitat ecological flow. In the same way, this study uses fuzzy models to explore the effects of water temperature, velocity, water depth, and other hydraulic factors on Ctenopharyngodon idella habitat. Through the simulation results of habitat suitable ecological flow, the best flow management scenario suitable for the study area is given. The main contributions of this study are as follows:
  • We consider the thermal stratification of reservoirs and analyze the important influence of the hysteresis of the water temperature on the spawning of Ctenopharyngodon idella in habitats.
  • A fuzzy logic-based habitat suitability model is established to evaluate the influence of hydraulic factors such as water temperature, velocity, and water depth on the suitability of a Ctenopharyngodon idella habitat.
  • By simulating a variety of different reservoir inflow and outflow conditions, the functional relationship between flow and habitat suitability is established, which provides the best management plan for water resources planning and construction.
The remaining parts of this paper are arranged as follows: In Section 2, we introduce the study area and target ecological species. In Section 3, we describe the construction of hydraulic habitat suitability (HHS) for target ecological species, a method for evaluating the weighted usable area (WUA) based on hydraulic simulation and the fuzzy logic-based habitat model. The results analysis and discussion are presented in Section 4. Finally, in Section 5, we state our conclusion for this study.

2. Study Area and Species
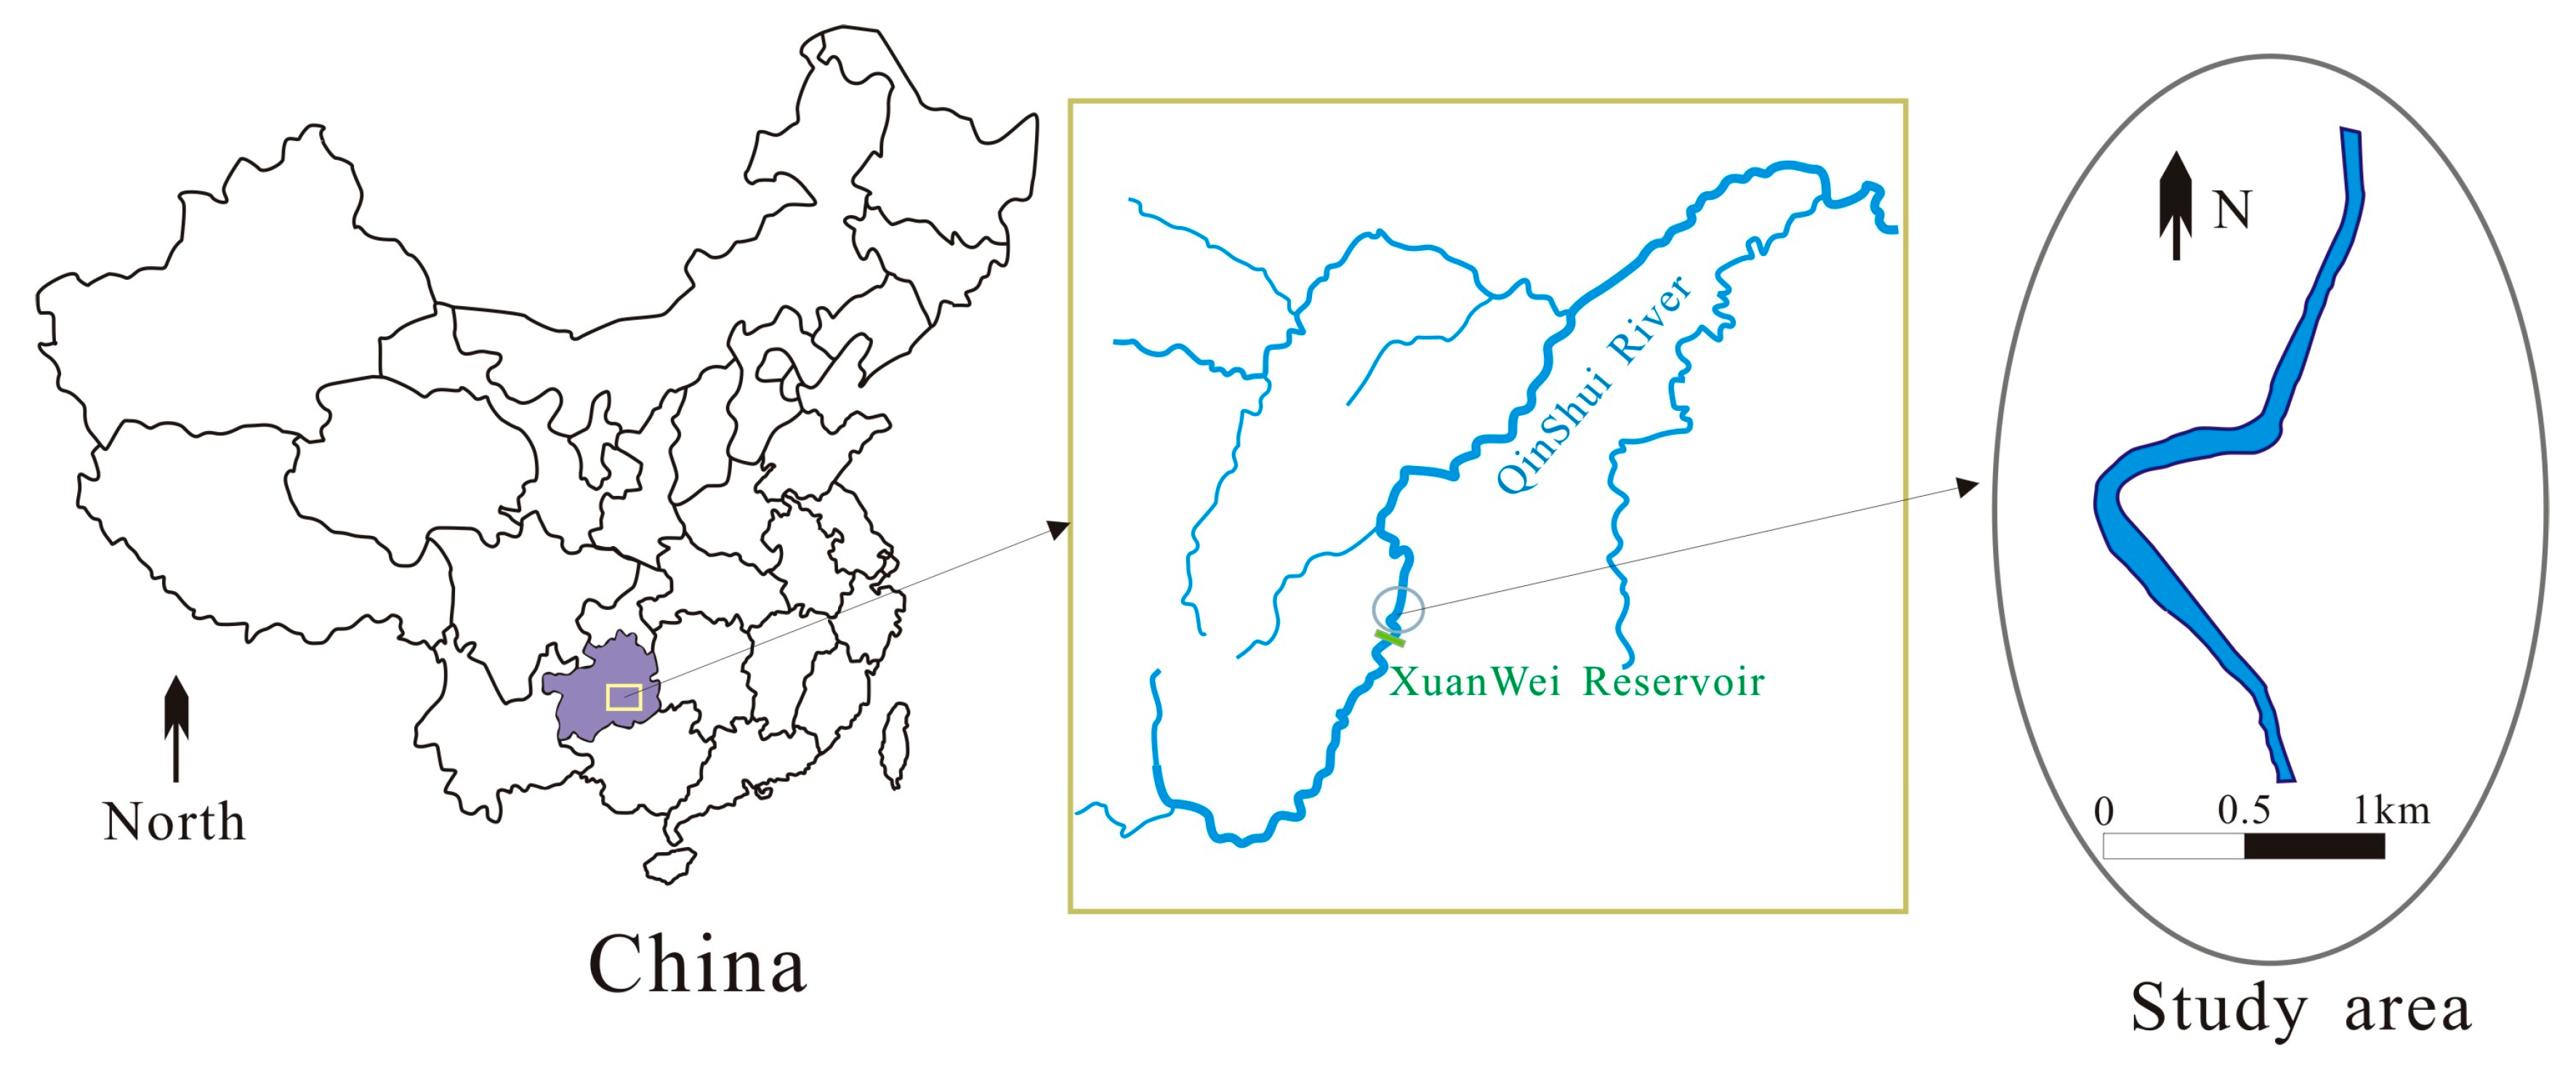
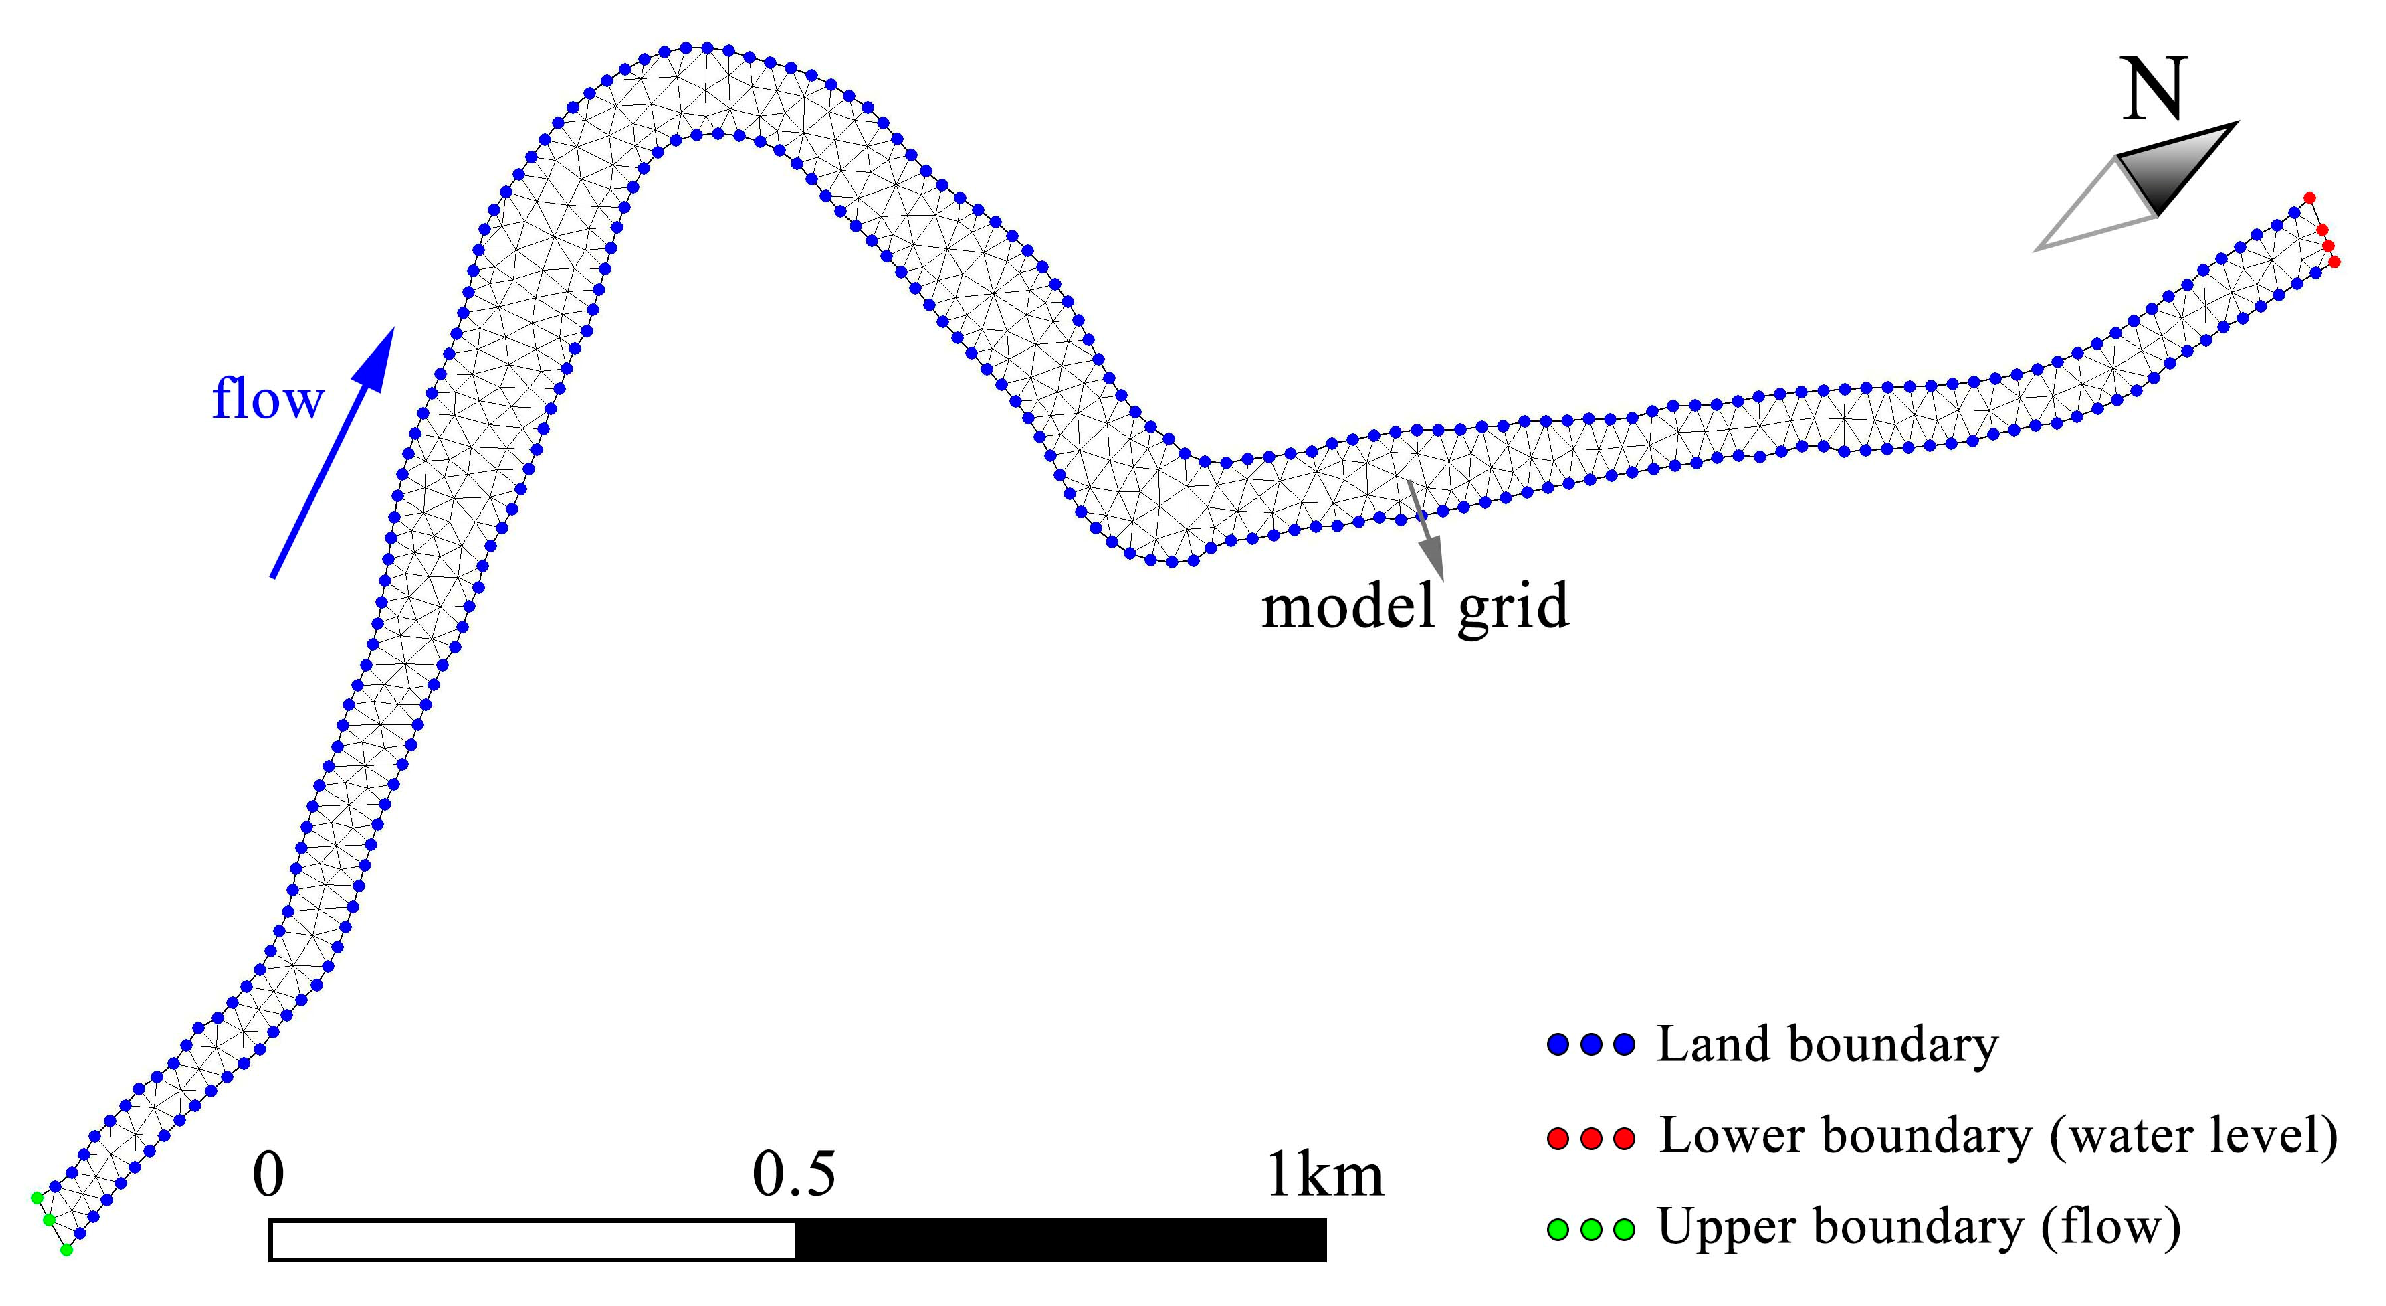
2.1. Study Area

The Qingshui River, located in the upper reaches of the Yuanjiang River, belongs to the Yangtze River system in China. It is located in the southeast of Guizhou Province and southwest of Hunan Province, with a drainage area of 15,000 km2. Hills and mountainous regions compose most of the Qingshui River Basin. The basin has abundant rainfall, warm climate, rich oil, and diverse types of aquatic habitats. The Xuanwei reservoir is located in the upper reaches of the mainstream of the Qingshui River, with a catchment area of 1337 km2. The design parameters of the reservoir include a normal water level of 681 m, a dead water level of 657 m, a total storage capacity of 139.80 million m3, and an average annual storage flow of 903.39 million m3. Among the fish in the study area, the largest number of cypriniformes (34 species) accounted for 65.4% of the total number of fish species by the scene investigation and sampling in the field, followed by 17.3% perciformes (9 species), 15.4% siluriformes (8 species), and 1.9% synbranchiformes (1 species). There is a spawning ground from the reservoir to the downstream river channel with a length of 3 km. The main fish species in the spawning ground is Ctenopharyngodon idella which produces drifting eggs. The bottom of the riverbed is an open rocky beach formed by pebbles and river sand. By considering the 3 km river channel downstream of the reservoir as a study case, the influence of hydraulic factors on fish spawning is simulated and analyzed. The location of the study area is shown in Figure 1.

2.2. Ctenopharyngodon idella (C. idella)

Ctenopharyngodon idella (C. idella) is a freshwater species native mainly to China. It plays an important role in aquaculture, being the second highest in world fish production. C. idella, as a food fish or as a biological controller of aquatic vegetation, has been introduced into more than 100 countries in various continental regions, including East Asia, North America, and Europe [36]. The natural reproduction of C. idella has certain demands for water temperature [37], landform, hydrology, and hydrodynamic conditions, especially related to flow and water temperature. C. idella migrates from the middle and lower reaches of the Qingshui River to the upstream for spawning and breeding during the summer flood season. In the autumn, it swims to the deep waters of the lower reaches of the Qingshui River for overwintering. Its spawning occurs during the flood period from mid-May to mid-July each year when the water temperature reaches 18 °C. According to the survey data of C. idella in the Qingshui River, it is most suitable for adult C. idella spawning when the water temperature is between 21 °C and 24.5 °C, the velocity is between 0.3 m/s and 0.9 m/s, and the water depth is between 3 m and 7.5 m. This migratory fish is the target species of reservoir ecological scheduling because the construction of the dam greatly threatens its survival. The ecological scheduling of such reservoirs generally involves releasing a suitable flow for fish migration during the migratory period of the fish and combining certain fish facilities to help the fish reach the spawning ground [38]. Therefore, the natural reproduction of C. idella is required to incorporate the water environment requirements of the spawning habitat into the reservoir scheduling objective. The construction of multi-objective ecological scheduling is one of the ways to effectively protect the river’s important economic fish species resources [39]. However, a key step in the implemention of a reservoir ecological scheduling scenario that takes into account the conservation of rare aquatic organisms is to determine the ecological water demand and to clarify the relationship between reservoir scheduling and the suitability of water environment for protecting aquatic habitats.
Practical topographic data of the Xuanwei reservoir and the downstream river channel was acquired from the Hydraulic Exploration Design Institute of the Guizhou Province. Meteorological data such as temperature, relative humidity, wind speed, and cloudage come from the Duyun meteorological station, since 1970. Hydraulic data such as reservoir inflow and water level are provided by the Xiasi hydrological station. The C. idella information of the Qingshui River comes from the sampling data of the past five years in the field. According to the data of the Duyun hydrological station in the study area, the data of reservoir inflow and water temperature of typical years are obtained as follows: wet year (75% guarantee rate of runoff), normal year (50% guarantee rate of runoff), and dry year (25% guarantee rate of runoff). According to the inflow data of the reservoir, the annual large-scale flow is mainly concentrated from mid-May to early-July. The highest water temperature in the year occurred in August, and the lowest water temperature occurred in February. According to the survey, the spawning period of C. idella in the study area is mostly concentrated from mid-May to mid-July. The suitable flow range and suitable water temperature range determine the spawning period of the fish. The annual reservoir inflow rate and water temperature of the study area is shown in Figure 2.
C. idella has an important economic value and is the target species in the study area for this study. On the basis of constructing the hydrodynamic mathematical model and habitat suitability evaluation model of the spawning ground in the downstream of the Xuanwei Reservoir, the correlation between the key indicators of reservoir scheduling and the suitability of C. idella spawning habitat have been studied. The research results provide the basis for constructing reservoir ecological scheduling of C. idella protection.

3. Methods

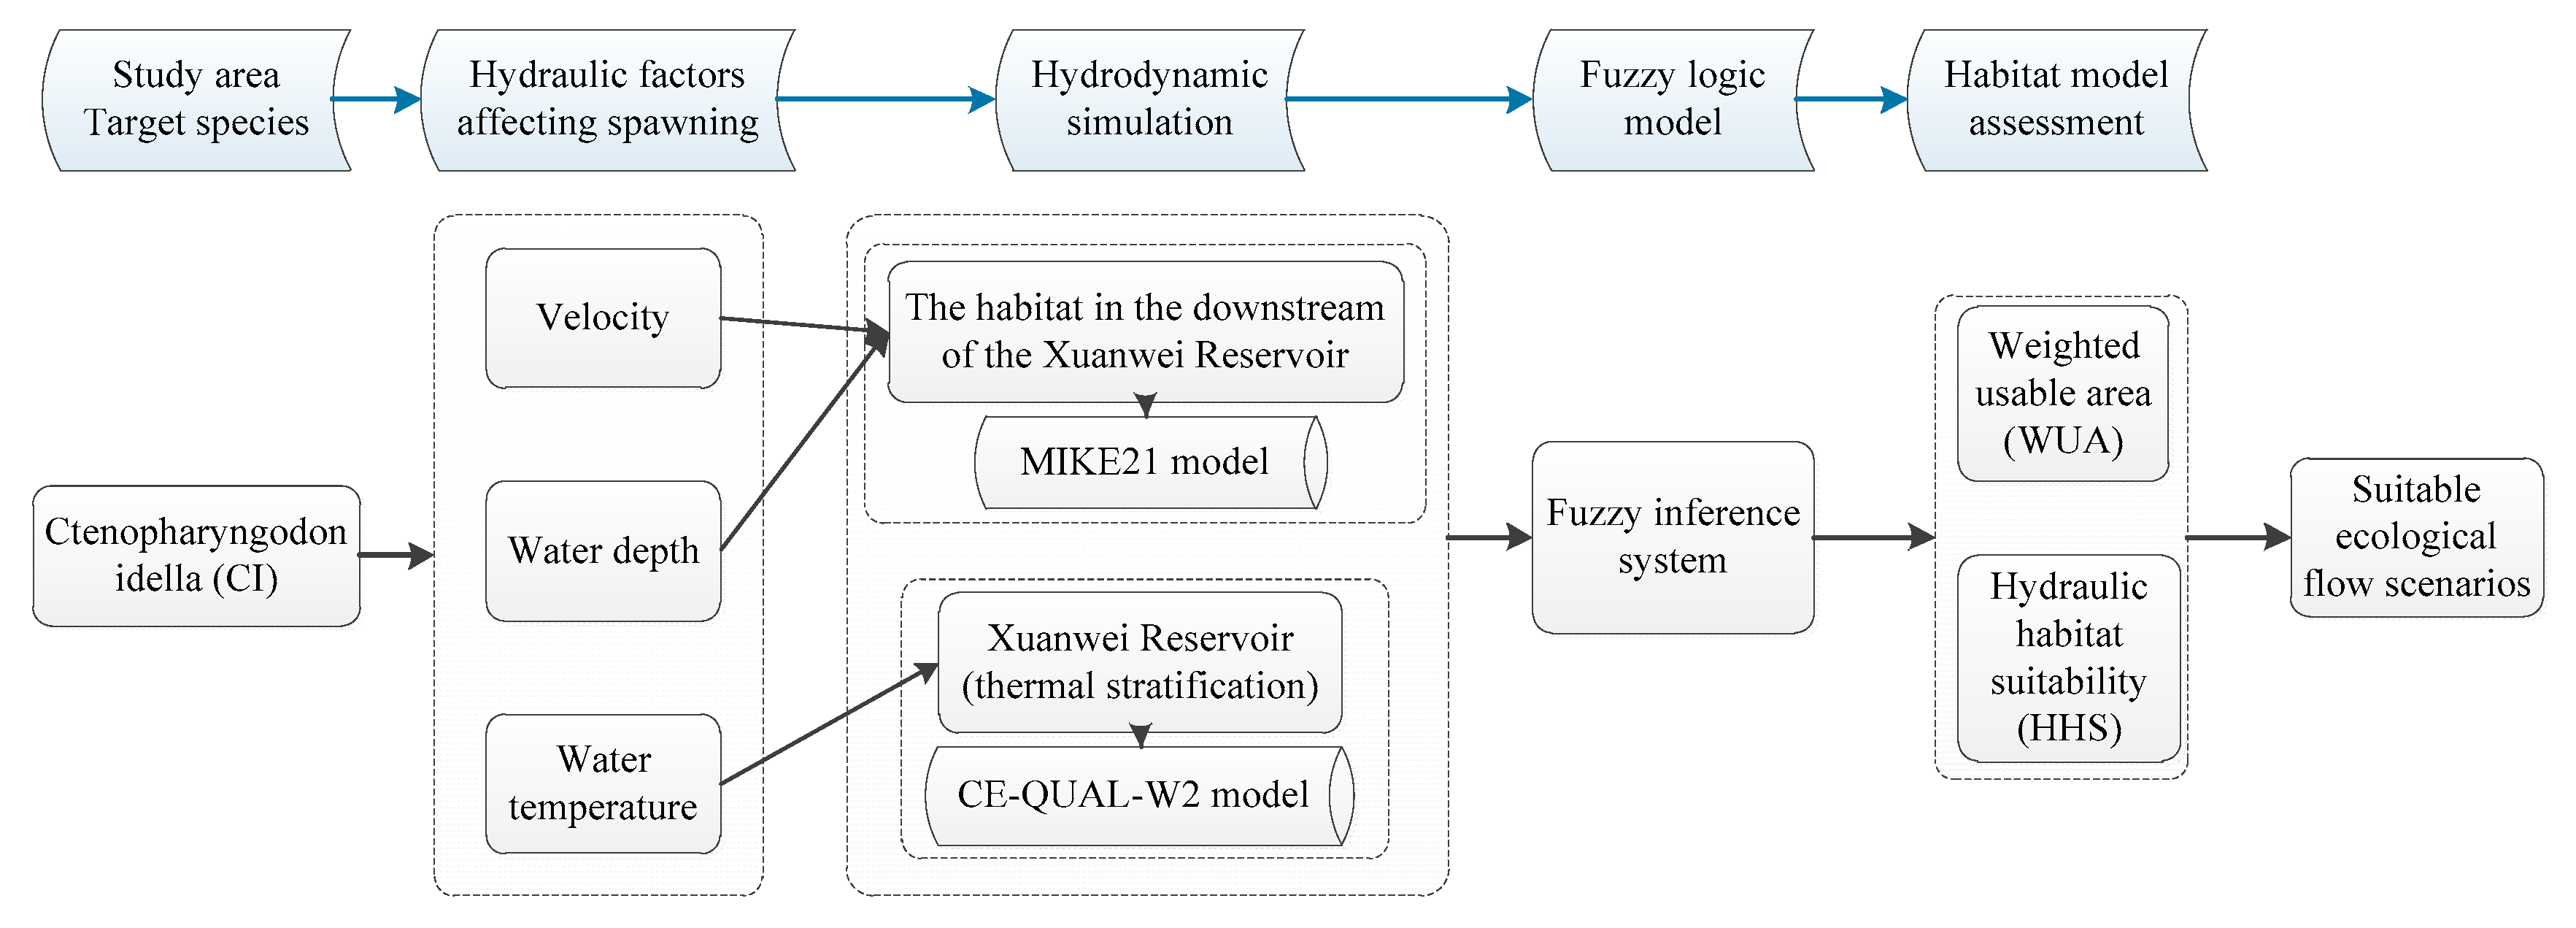
3.1. Model Framework

In this study, the C. idella in the study area was used as the target species to study the flow and water temperature effects of C. idella during spawning. This study specifically analyzed the following three main factors affecting the spawning of C. idella: velocity, water depth, and water temperature. Two hydrodynamic models were used to simulate the hydraulic conditions of reservoir and the downstream habitats of reservoir. MIKE21 simulated the spatial distribution of velocity and water depth under different flows in the habitat. CE-QUAL-W2 simulated the water temperature stratification of reservoirs under different inflows and outflows. The simulation results of velocity, water depth, and water temperature were used to construct a fuzzy model [31,40] to comprehensively analyze the effects of the three factors on C. idella spawning. The simulation results of the fuzzy logic-based habitat suitability model were analyzed and evaluated by WUA and HHS, and the best flow management scenario in the study area was finally obtained. The overall framework of the habitat model is shown in Figure 3.

3.2. Hydrodynamic Simulation

The hydrodynamic modeling was divided into two parts. The first part of the reservoir was simulated by CE-QUAL-W2 model, which mainly explored the influence of water temperature change caused by reservoir thermal stratification on downstream habitat. The second part of the downstream channel was simulated by MIKE21 model, which mainly explored the velocity and water depth distribution of the downstream habitat.

3.2.1. CE-QUAL-W2 Model

The CE-QUAL-W2 model is a two-dimensional (longitudinal/vertical) laterally averaged hydrodynamic model for surface water systems [41]. The model is based on the assumption that lateral homogeneity and the flow in a reservoir with a distinct flow direction can be computed from the laterally integrated Navier–Stokes equation [42]. This is particularly suited for relatively long and narrow water bodies exhibiting longitudinal and vertical water temperature gradients. The W2 model was successfully applied to stratified water systems, including reservoirs, lakes, and estuaries.
On the basis of the Boussinesq assumption, the model integrates the homogeneous continuity equation, the momentum equation, and the caloric equation of the three-dimensional turbulent buoyant flow to obtain the equations of the two-dimensional laterally averaged temperature model as follows:
x ( B u ) + z ( B w ) = 0
t ( B u ) + u x ( B u ) + w z ( B w ) = 2 x ( B ν e u x ) + z ( B ν e u z ) + z ( B ν e w x ) B ρ a p x
t ( B w ) + u x ( B w ) + w z ( B w ) = 2 z ( B ν e w z ) + x ( B ν e w x ) + x ( B ν e u z ) B ρ a p z + β Δ T g B
t ( B T ) + u x ( B T ) + w z ( B T ) = x ( B ν e σ T T x ) + z ( B ν e σ T T z )
where B is the river width, u is the longitudinal velocity, w is the vertical velocity, v is the coefficient of kinematic viscosity, vt is the turbulent viscosity coefficient, ve = v + vt is the effective viscosity coefficient, T is the water temperature, Ta is the reference temperature of water, ΔT = TTa, ρ is the water density, ρa is the reference density of water, β is the coefficient of thermal expansion, and σT is the Prandtl number of temperature.
The Xuanwei Reservoir was represented as 63 longitudinal segments with lengths of 250 m and 48 vertical layers with thicknesses of 1 m according to the topographic data recorded in 2018. The CE-QUAL-W2 turbulence closure algorithm was used. There is only one inflow entrance upstream of the mainstream and there are no other inflow entrances from the tributaries. The boundary data was input with a daily resolution, including reservoir inflow and temperature, outflow, air temperature, wind speed and direction, solar radiation, cloud cover, precipitation, and evaporation. Reservoir grid model is shown in Figure 4.

3.2.2. MIKE21 Model

The fish habitat in the downstream of the Xuanwei Reservoir was simulated by MIKE21, and the spatial distribution of velocity and water depth under different outflows was calculated. The hydrodynamic module is based on the solution of two-dimensional shallow water equations obtained from the Navier–Stokes equations, which are integrated over the water depth including the depth and horizontal momentum equation of the flow just as follows [43]:
T t + U x + V y = S
where t indicates the time; x and y are Cartesian coordinates; T, U, V, and S indicate vectors of the conserved variables, fluxes in the x- and y-direction, and source terms, respectively.
T = [ h h u h v ] , U = [ h u h u 2 + g h 2 / 2 h u v ] , V = [ h v h u v h v 2 + g h 2 / 2 ] , S = [ 0 g h ( S 0 x S f x ) g h ( S 0 y S f y ) ]
where h is the water depth; g = 9.81 m/s2 is the gravity acceleration; u and v is the depth-averaged velocity components in the x-direction and y-direction, respectively; S0x and S0y are the bed slopes in the x-direction and y-direction, respectively; Sfx and Sfy are the friction slopes in the x-direction and y-direction, respectively.
Tests of numerical experiments and results of the practical applications showed that this model can simulate the water flow movement over complex terrain accurately [44]. The MIKE21 model was used to divide the downstream habitat of the Xuanwei Reservoir into 796 triangular grids, with a maximum area of 523.49 m2 and a minimum area of 130.33 m2. The measured outflow time curve of the reservoir was taken as the upper boundary of the model. The measured water level time curve at 3 km from the reservoir was taken as the lower boundary of the model. The model simulated the velocity and water depth distribution in the habitat under different outflows. Habitat grid model is shown in Figure 5.

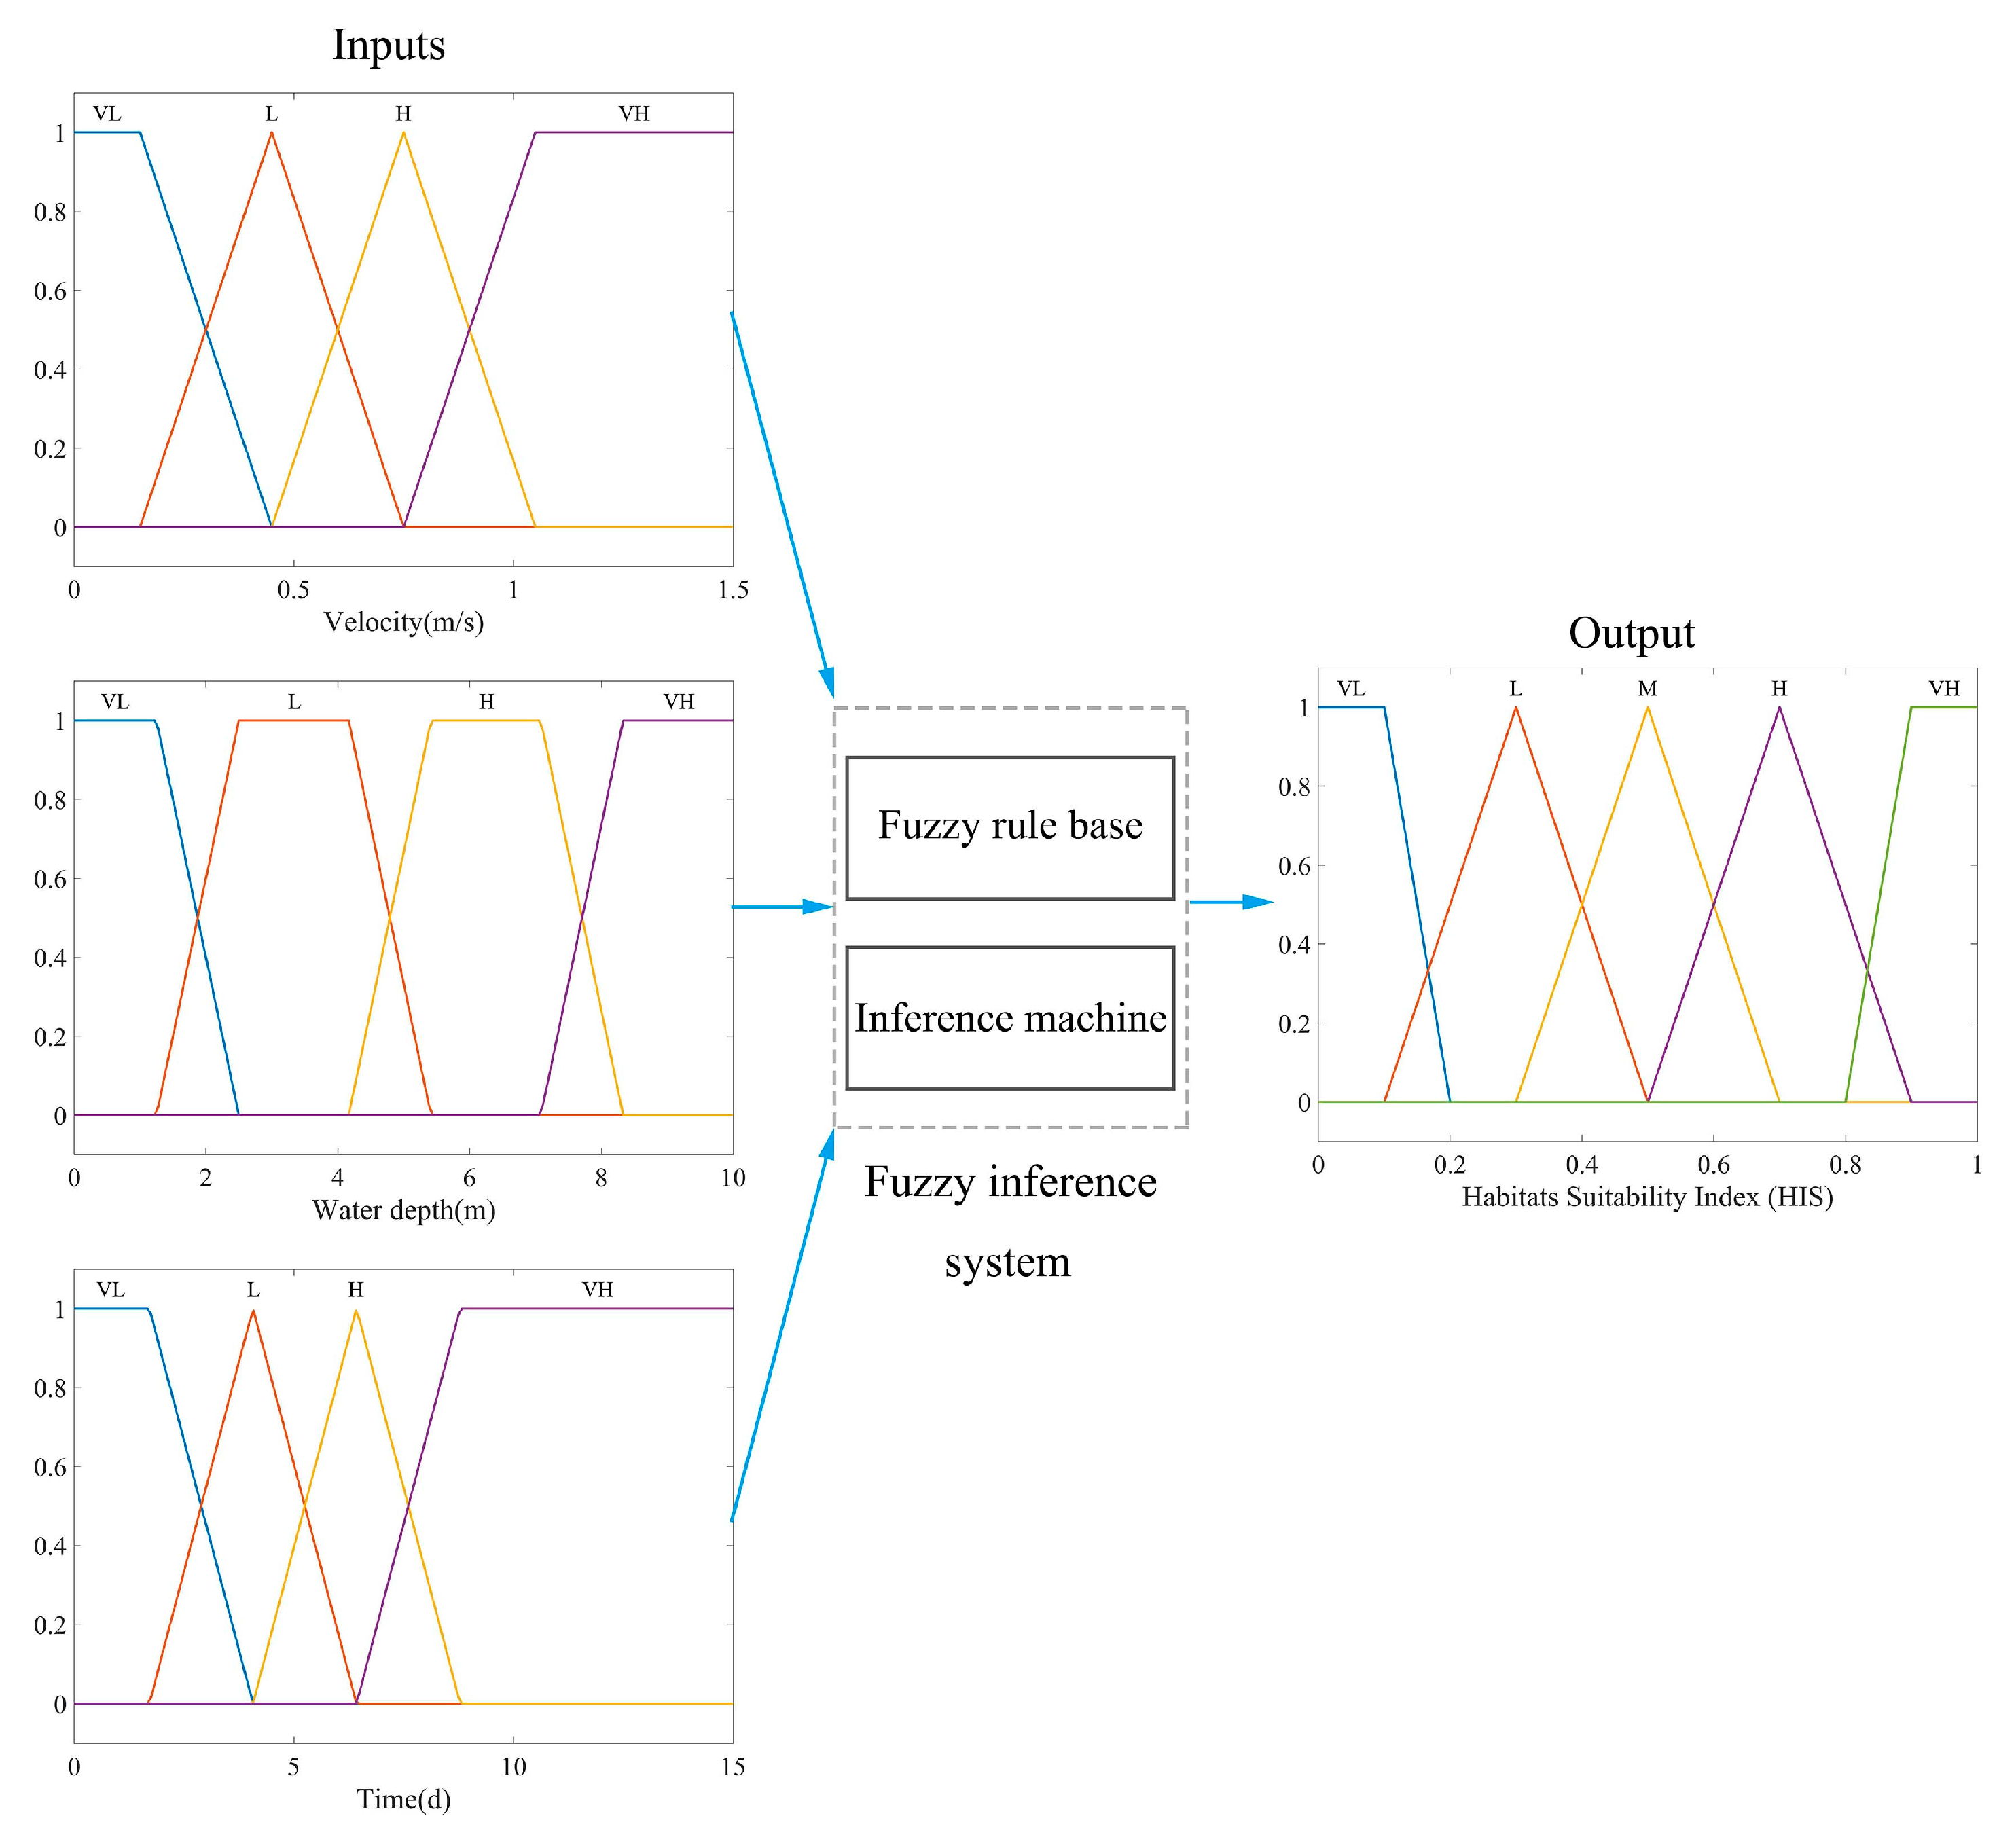
3.3. Fuzzy Logic-Based Habitat Modeling

Fuzzy logic can copy the judgment of the uncertainty concept and the way of reasoning thinking of the human brain by using fuzzy sets and fuzzy rules [45,46]. Meanwhile, the model considers the inherent uncertainty of ecological variables and enables expressing nonlinear relations between ecological variables in a transparent way [47,48]. Fuzzy species distribution models transform fuzzy modeling into a technique suitable for species distribution modeling, which can reflect the specific characteristics of ecological problems. This study was based on fuzzy inference for habitat suitability (HS) simulation. The inference process consisted of three steps as follows: (1) fuzzification, in which fuzzifier is used to convert crisp input to fuzzy set using membership functions; (2) fuzzy inference, in which a fuzzy inference system is applied to convert fuzzy input sets to fuzzy output sets; and (3) defuzzification, in which fuzzy output sets are converted to crisp output by a defuzzifier. The modeling for the fuzzy inference process is shown in Figure 6.

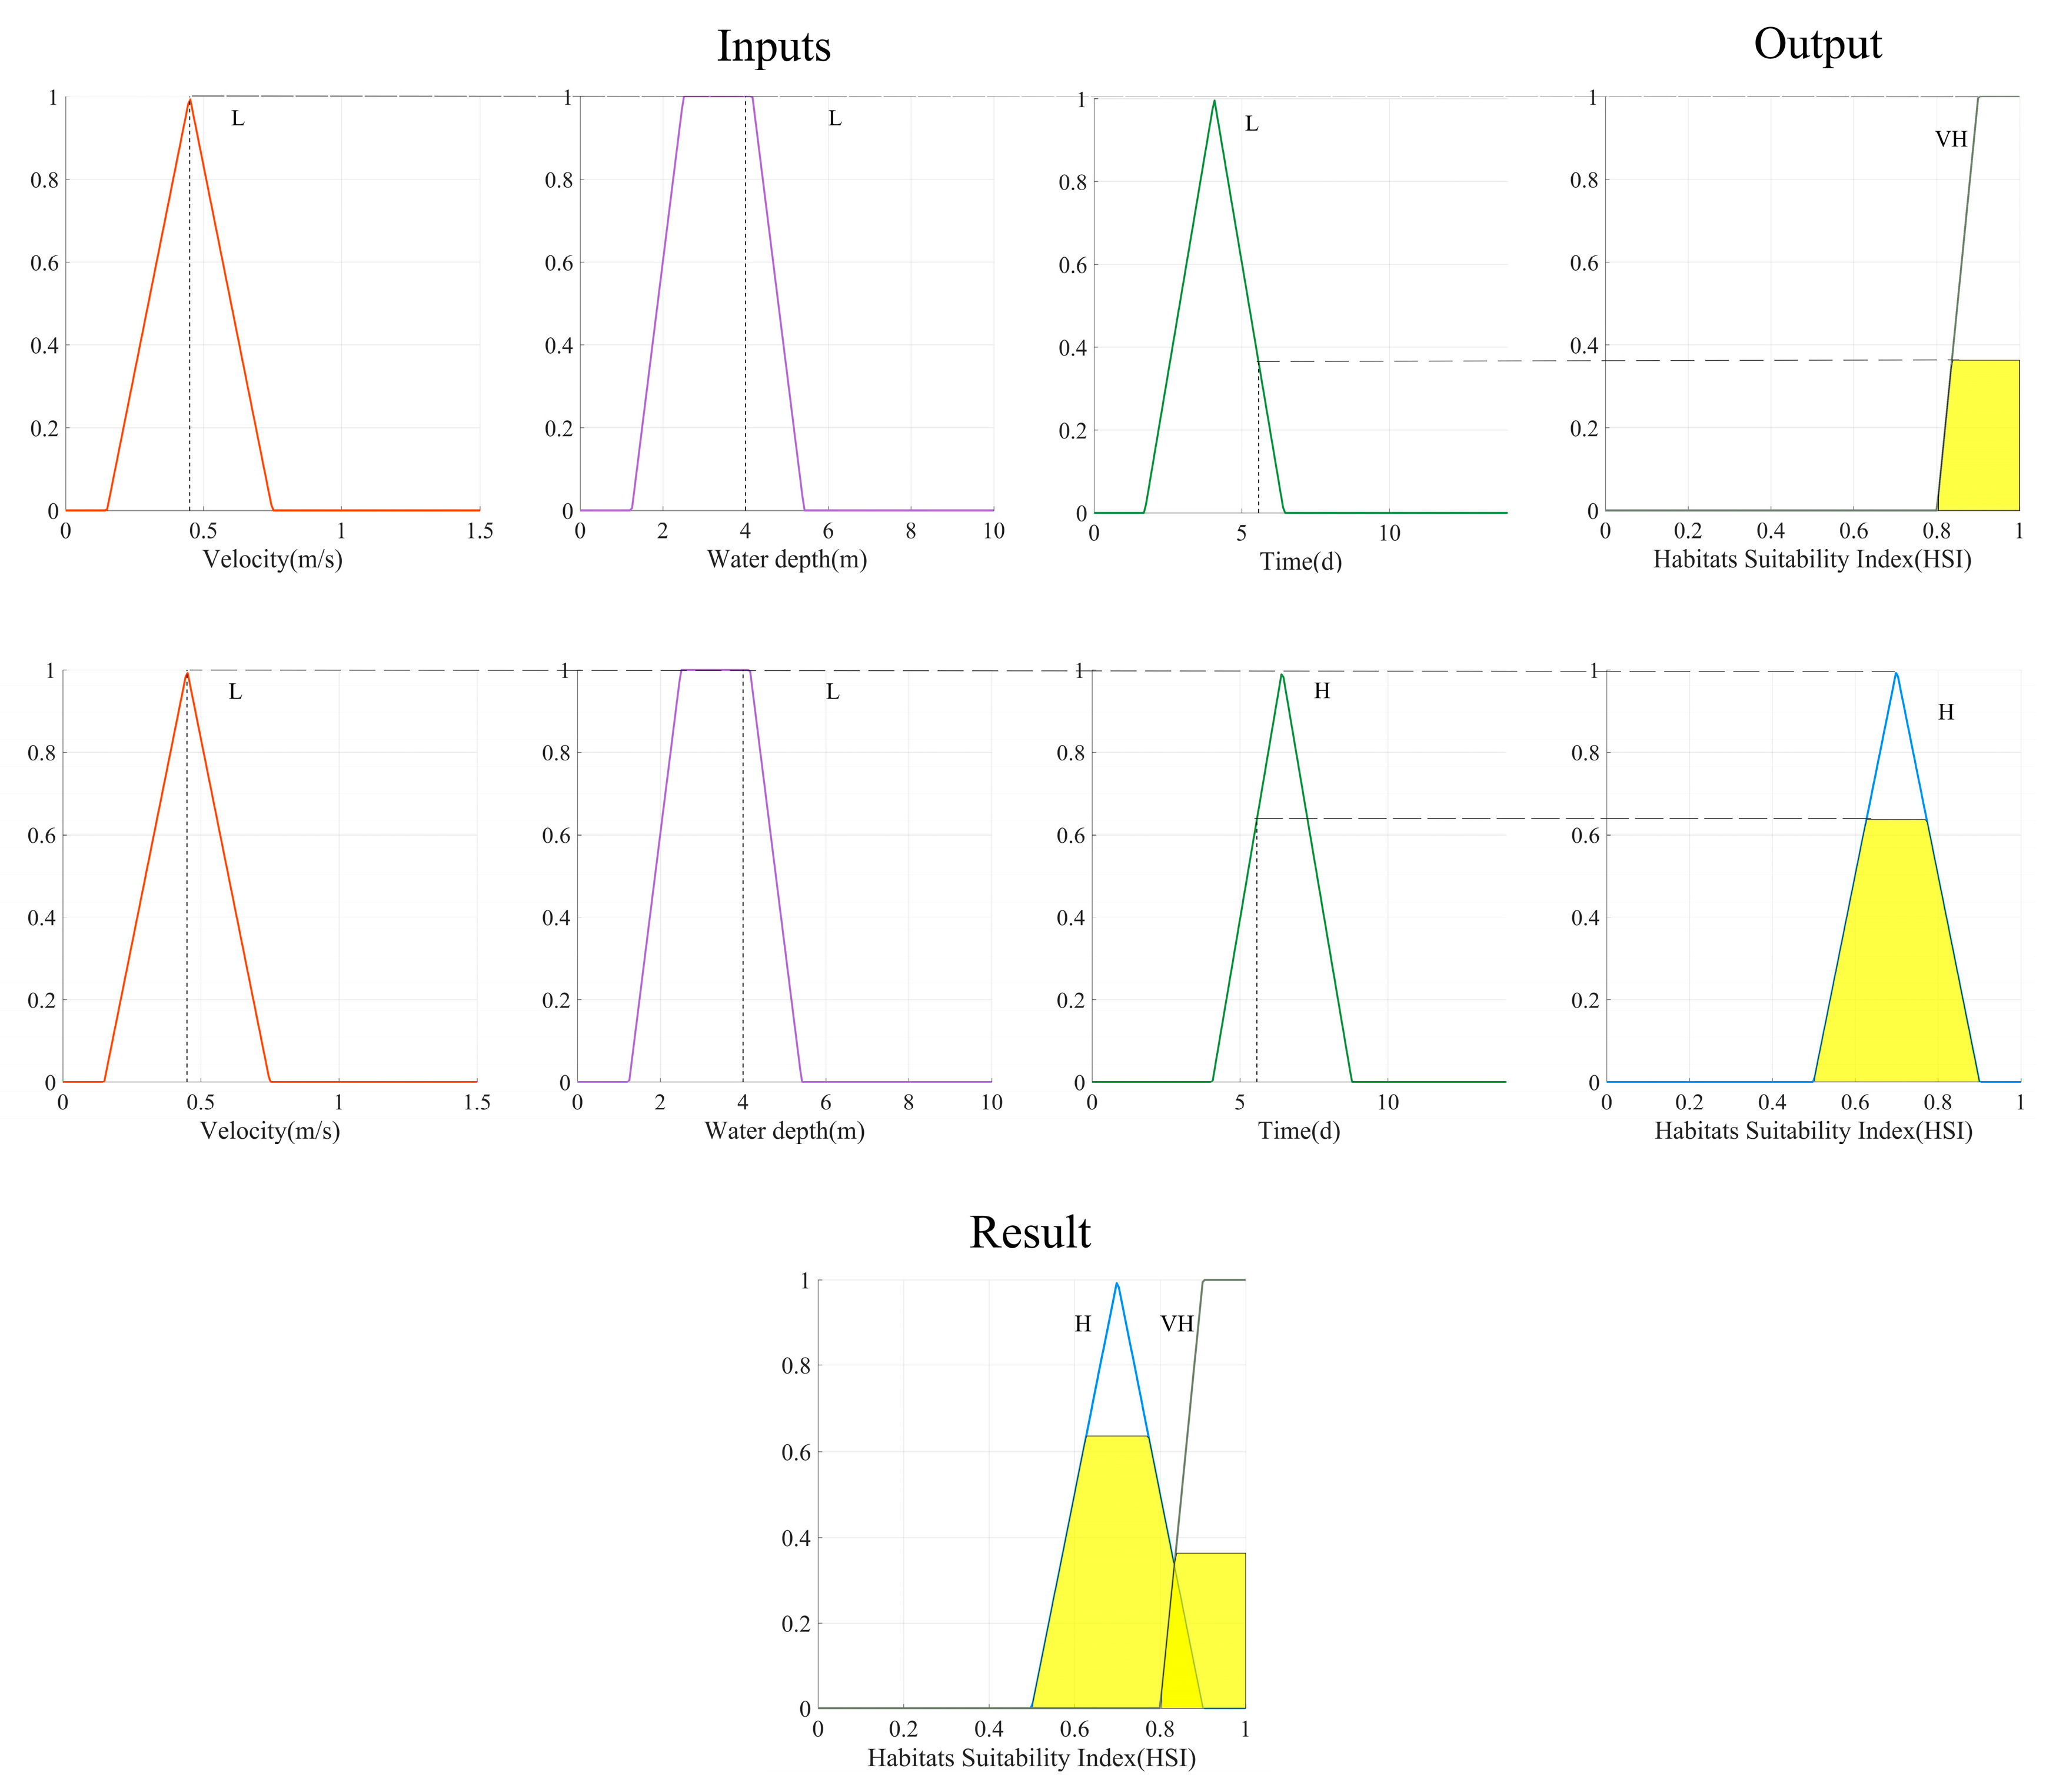
3.3.1. Fuzzification and Defuzzification

(1)
Fuzzification
In this study, for the habitat modeling, the membership functions of trapezoidal and triangular shapes are used to convert crisp input values of velocity, water depth, and water temperature lag time to fuzzy sets expressed by one or more linguistic values with membership degrees. Fuzzy sets are usually expressed by linguistic description such as ”very low”, ”low”, ”high”, and ”very high”. The membership functions of the fuzzy sets have overlapping boundaries and the linguistic statement ”the water temperature lag time is quite short but tending to be long” can be translated into a time which has a membership degree of 0.8 to the fuzzy set ”high” and of 1 to the fuzzy set ”very high”.
(2)
Fuzzy Inference
A fuzzy inference system is composed of a fuzzy rule base and an inference machine. The fuzzy rule consists of if–then fuzzy rules, such as ”if x IS A AND y IS B, THEN z IS C”, by links the input variables to output. In the same way, the fuzzy rules as a total of 64 (velocity with four linguistic values, water depth with four linguistic values, and water temperature lag time with four linguistic values) describing HS for the spawning period of C. idella are created based on literature reviews and expert experience [49,50,51]. The fuzzy rules for the spawning of C. idella is shown in Table 1. The water temperature lag time is used as an evaluation index of the fuzzy model. The water temperature lag time indicates the time required for the outflow water temperature to reach the same water temperature when the reservoir inflow water temperature (21 °C) is suitable for C. Idella to spawn. By using this fuzzy rule base, the Mamdani–Assilian inference was used in the current application. An example of a fuzzy inference process is described in Figure 7. The first line and second line show three inputs and a single output. The third line depicts how three input values are partial members of three linguistic variables for ”velocity”, ”water depth” and ”water temperature lag time”. This leads three fuzzy rules to be activated. The implication operator determines the partial membership to the output. These are aggregated into an output surface.
(3)
Defuzzification
The fuzzy inference system uses implication and aggregation operators to scale the membership functions of output linguistic variables before performing defuzzification. Afterwards, a numerical output value of the fuzzy inference process is obtained with defuzzification methods, center of gravity. In this study, the center of gravity defuzzification method is used as follows:
C G = x min x max f ( x ) × x d x x min x max f ( x ) d x
where CG is the center gravity of the area, x is the value of the linguistic variable, and xmax and xmin indicate the range of the linguistic variable. The CG defuzzification method effectively calculates the best compromise between multiple output linguistic terms. This crisp output value calculated by this method denotes HS for C. idella, described as the habitat suitability index (HSI).

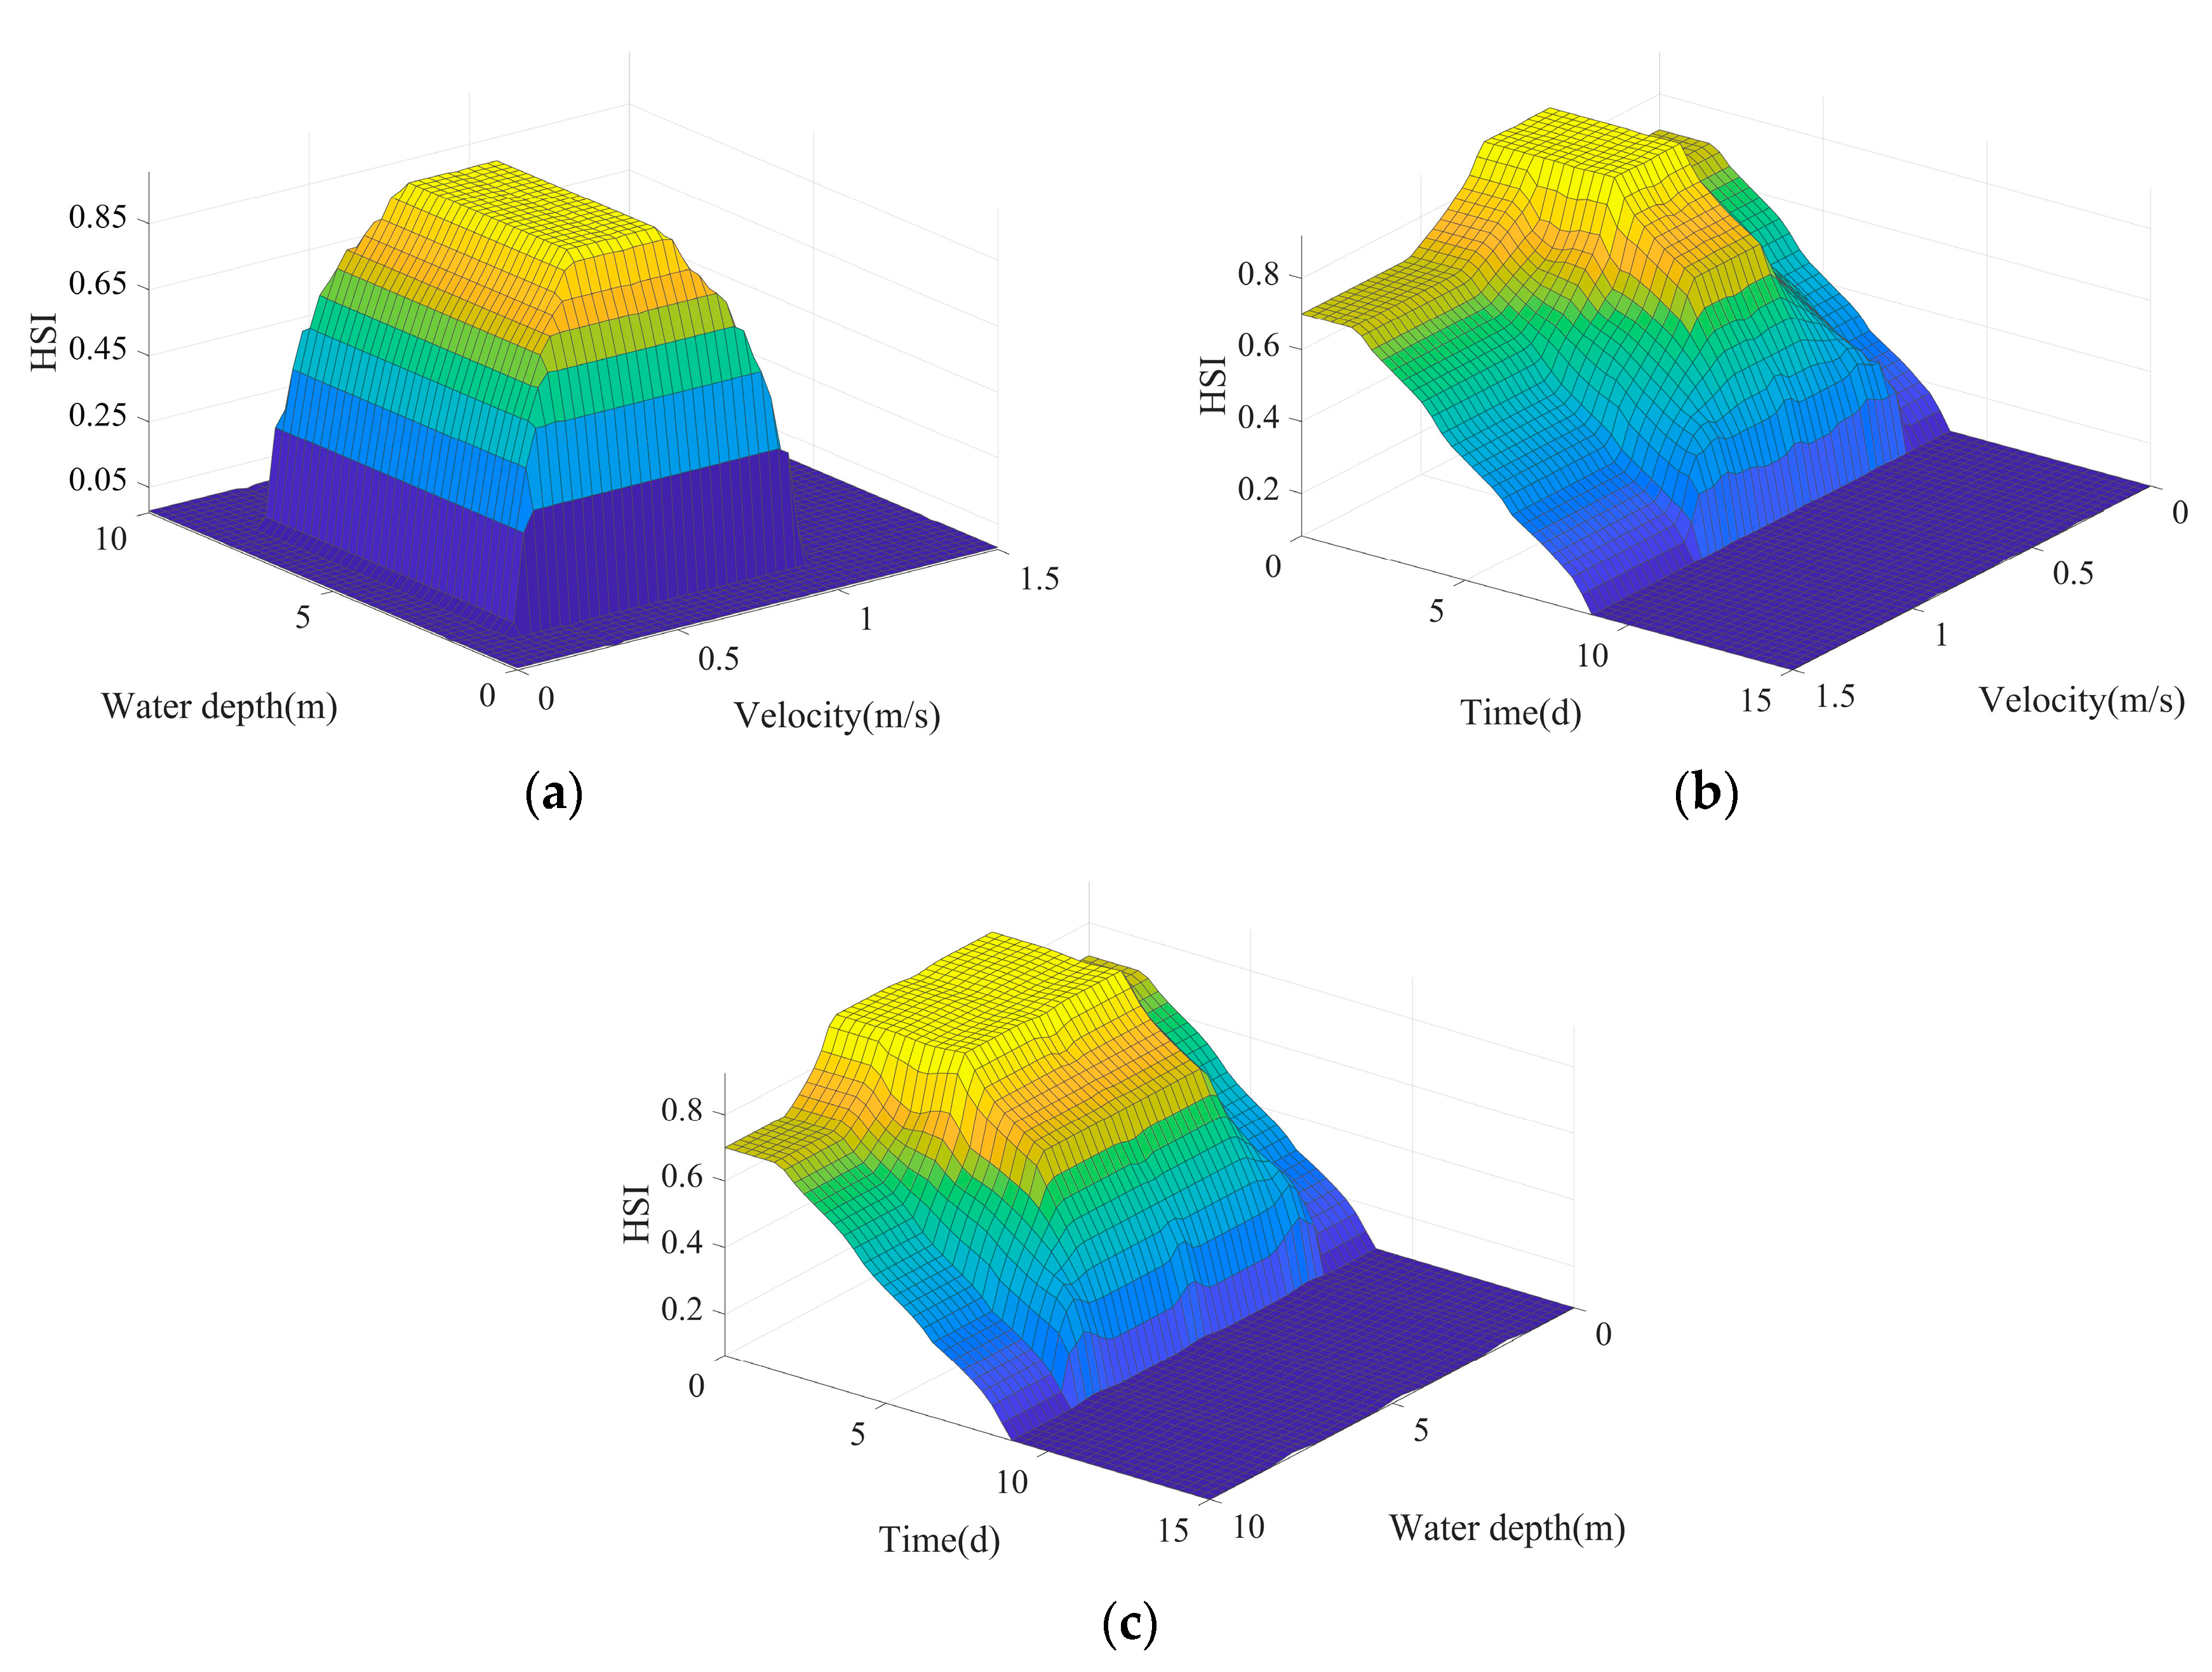
3.3.2. Criteria for Assessing Habitat Quality

In order to make a better and accurate evaluation for availability and suitability of habitat, some related evaluation methodology such as weighted usable area (WUA), hydraulic habitat suitability (HHS), and habitat suitability maps were calculated in the study. Habitat suitability maps were generated to visualize the habitat suitability within the river under a steady flow condition. The WUA was calculated by integrating habitat quality over the cells of the studied area, which can be widely used to show the habitats available for species. It was assumed that WUA is positively associated with fish biomass in IFIM. The HHS was obtained by dividing the WUA by the total area, which assigns relative values between 0 and 1. It describes the suitability of hydrodynamic variables for the fish species considered. The calculation methods of WUA and HHS are as follows:
W U A = i = 1 n H S I i × A i
H H S = 1 i = 1 n A i i = 1 n H S I i × A i
where Ai indicates the i-th grid area, n indicates the total number of grids, and HSIi indicates the i-th habitat suitability index.
The best flow management scenario is determined by comparing and analyzing the simulation results under WUA and HHS for each scenario. A larger the WUA value, the larger total habitat weighted usable area for fish spawning. A larger WUA value is more favorable for fish spawning. HHS is a normalized value between 0 and 1. The larger the HHS value, the larger the proportion of habitats area for fish spawning. A larger HHS value is more favorable for fish spawning.

4. Results and Discussion

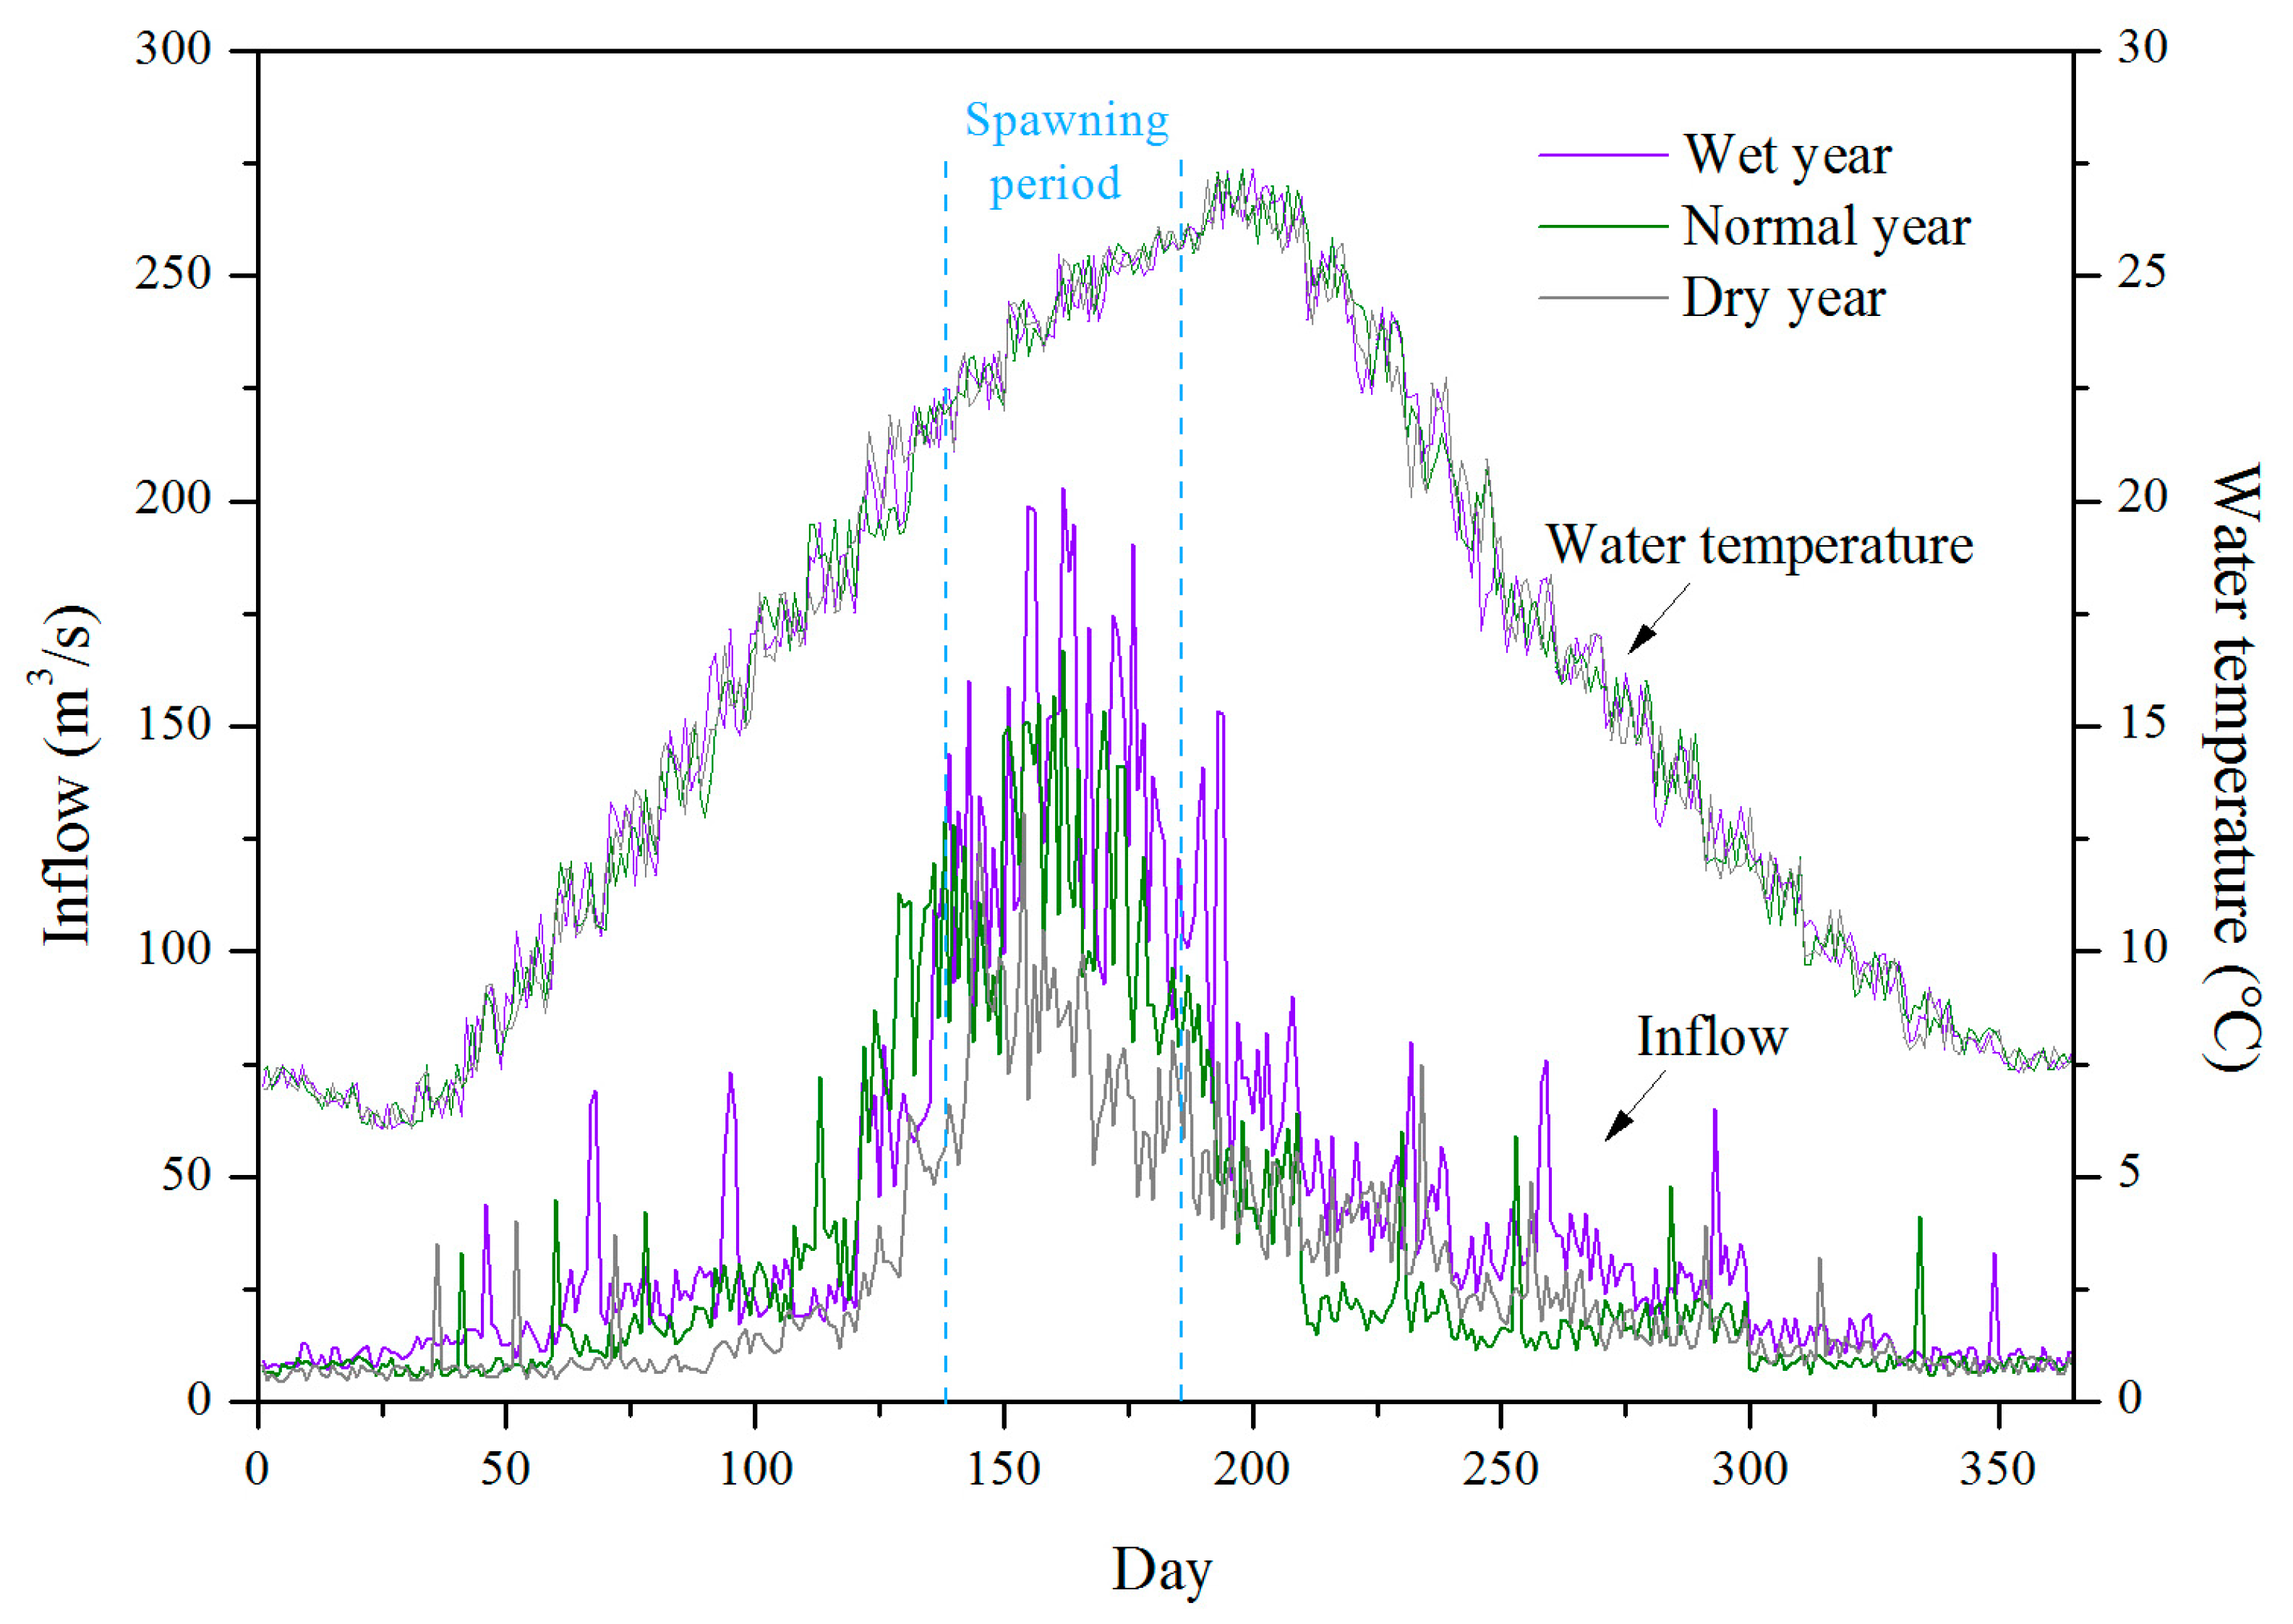
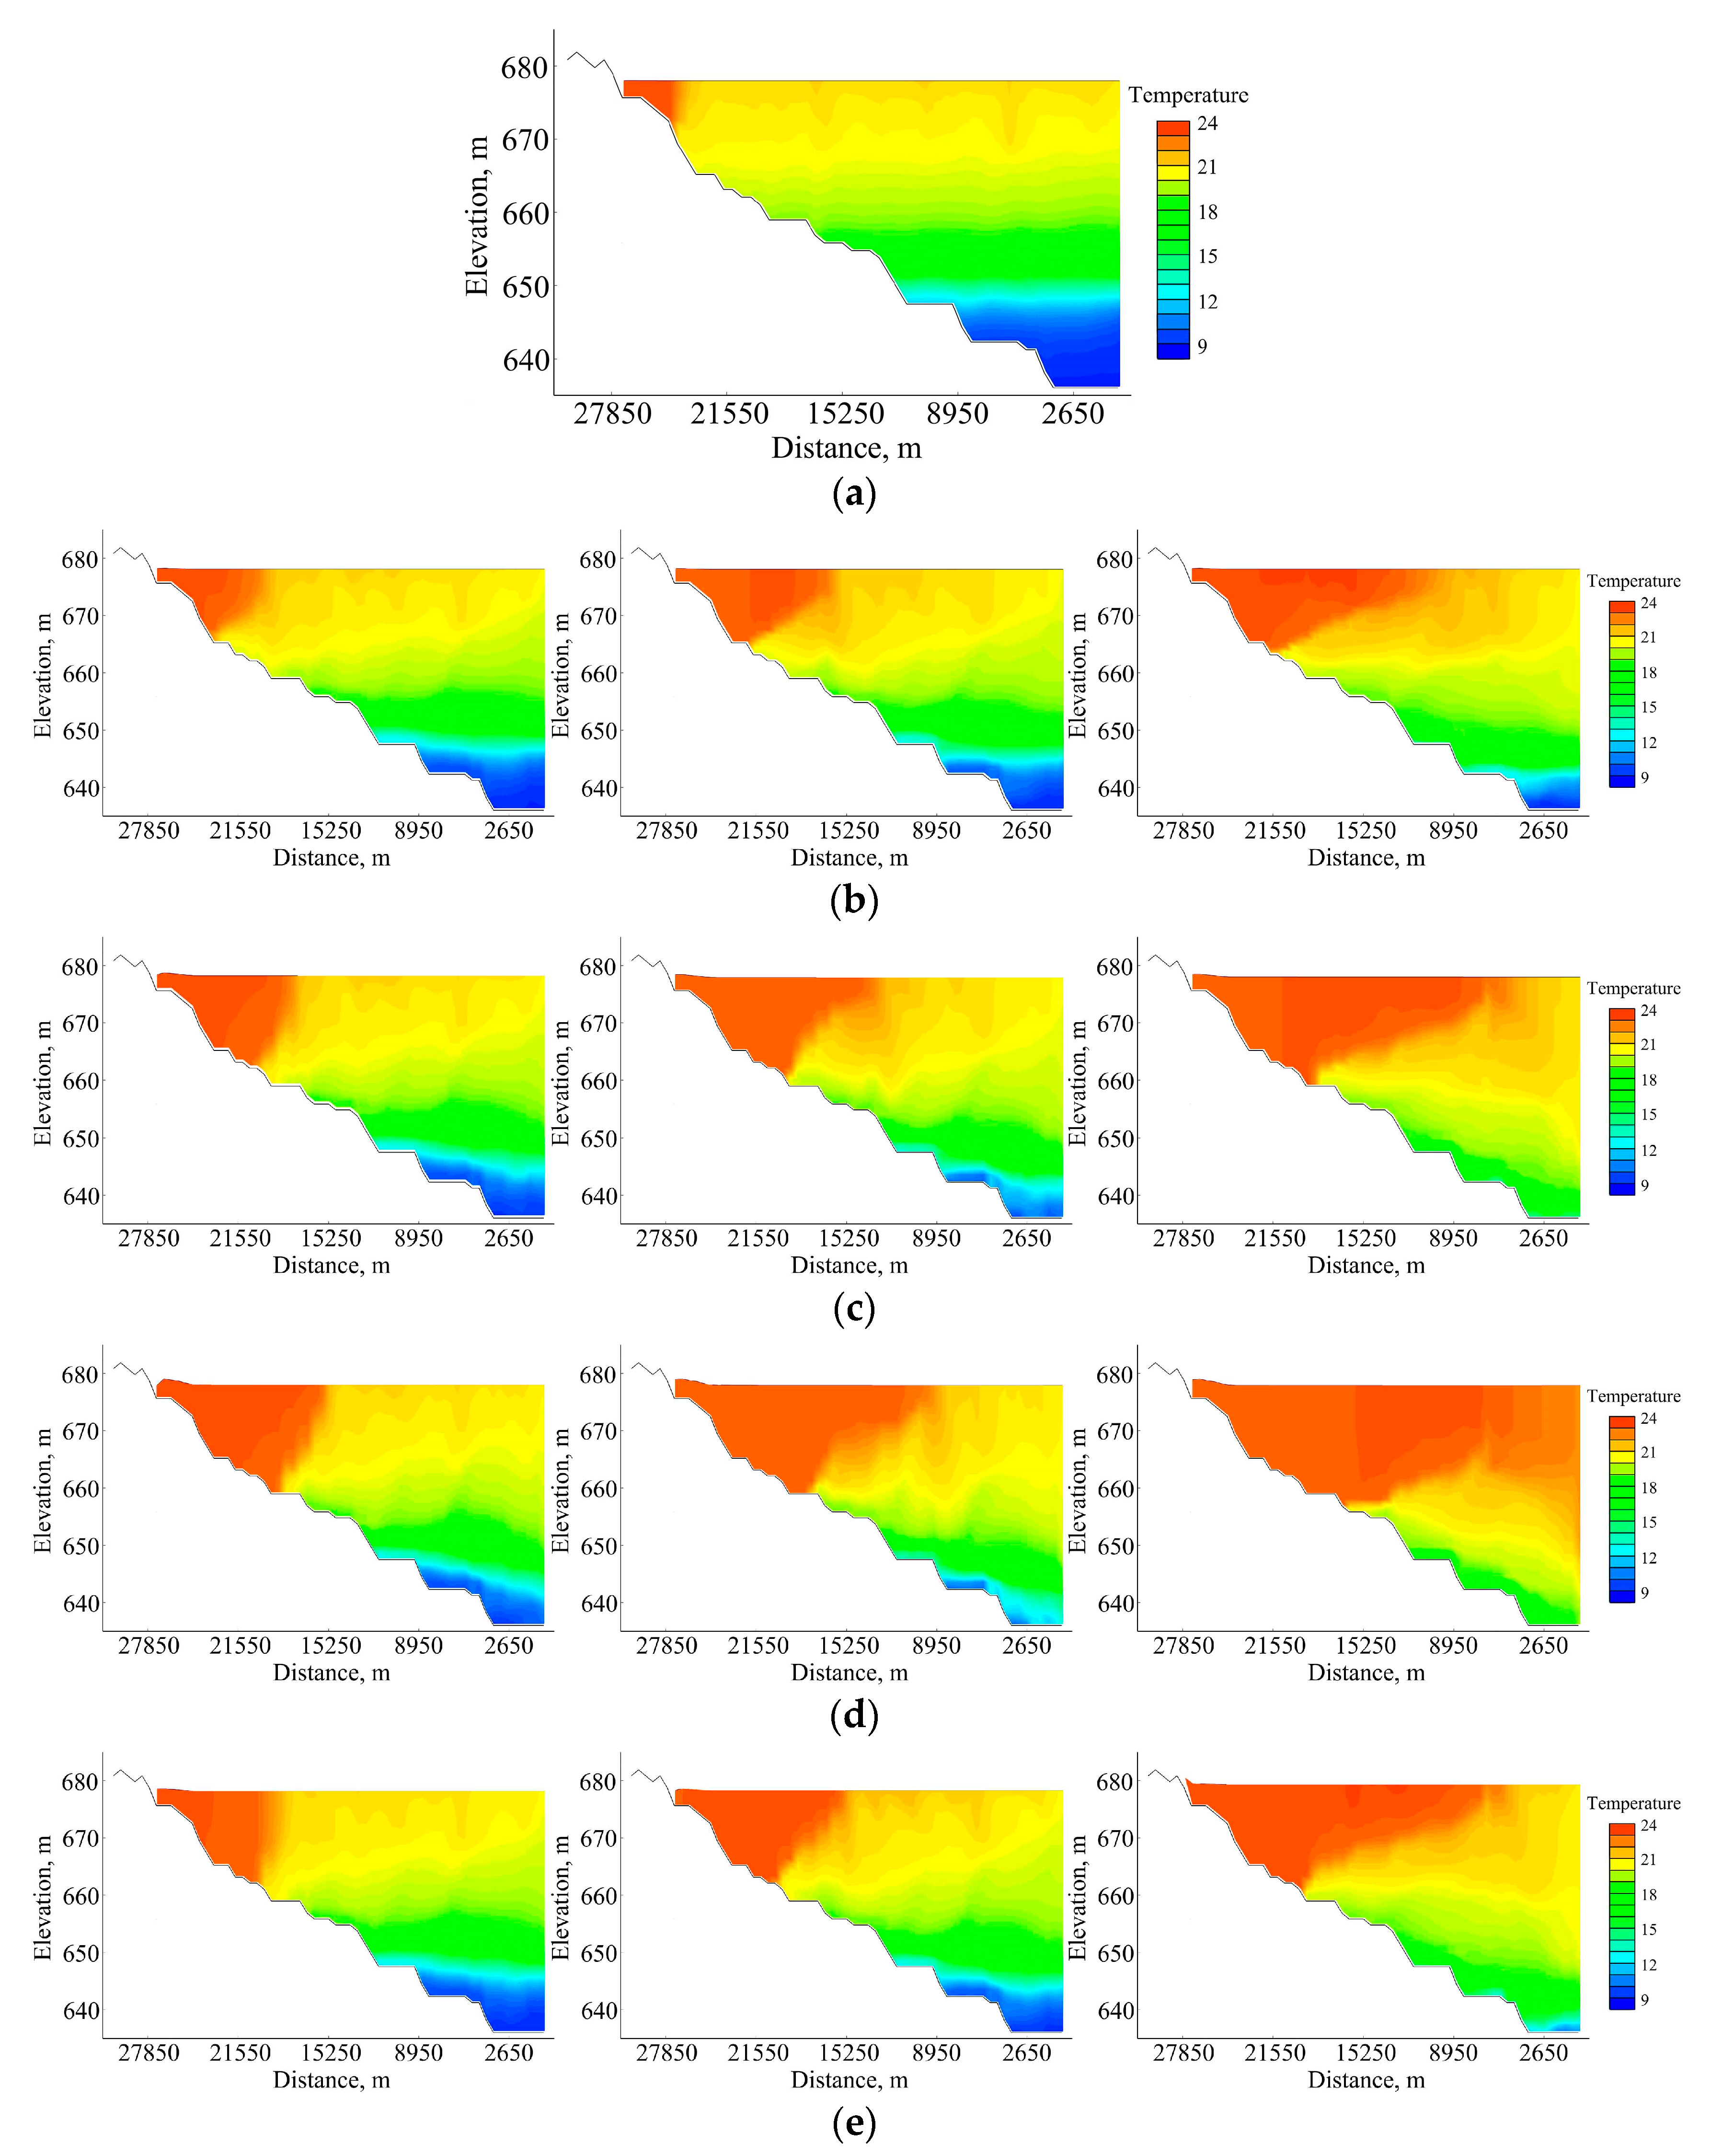
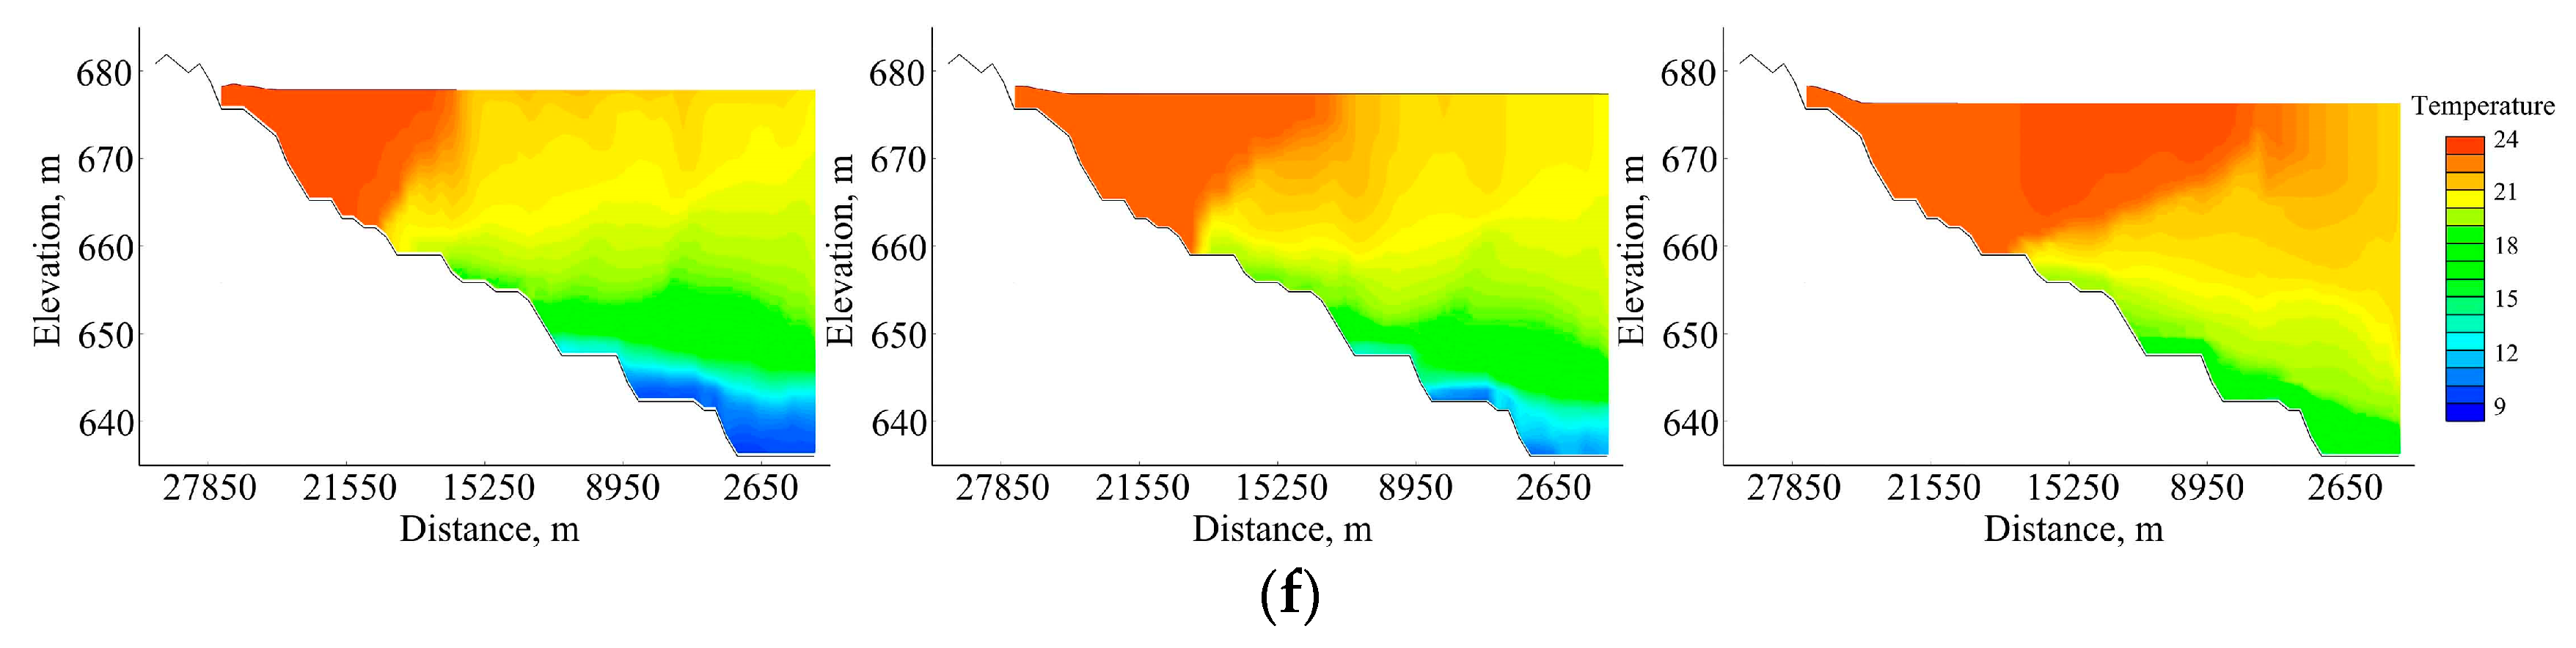
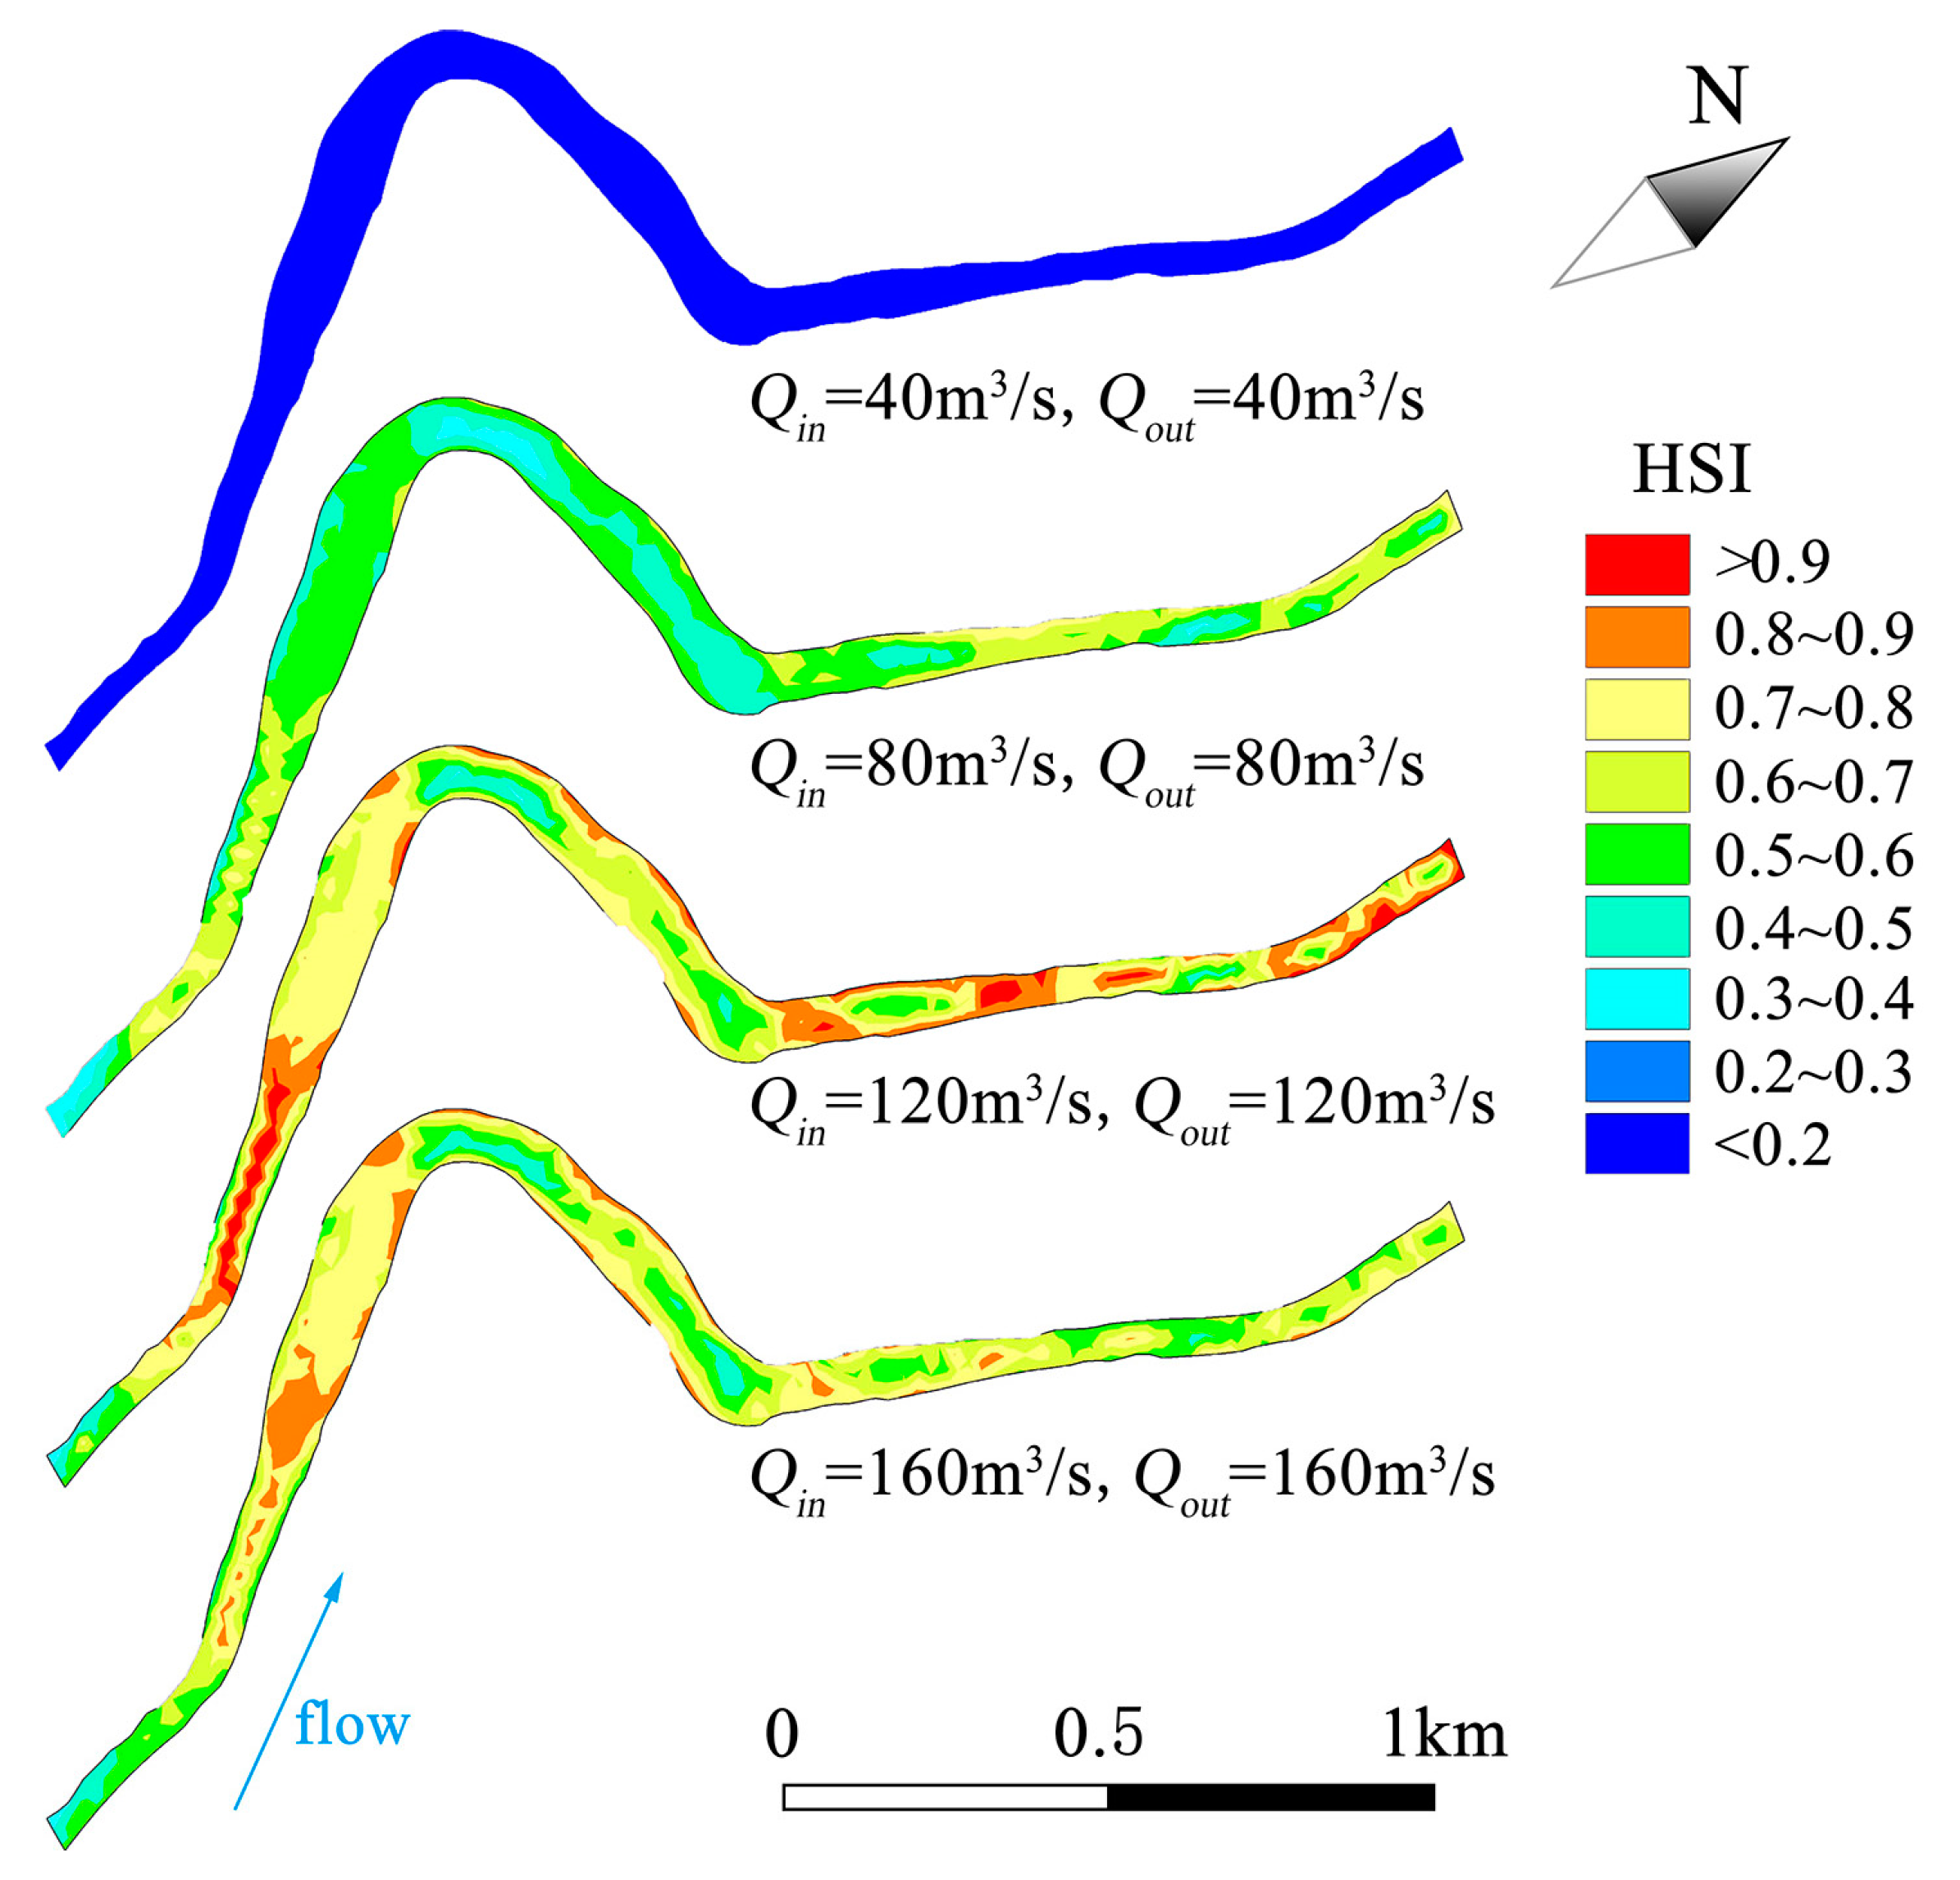
4.1. Result of CE-QUAL-W2 Model Simulation

According to the research, the Xuanwei Reservoir has thermal stratification, and therefore it is necessary to analyze the negative effect on the C. idella spawning in downstream of the reservoir caused by the releasing of water with low temperature. In this study, the CE-QUAL-W2 model is used to simulate the time taken to reach an appropriate ecological water temperature under different inflow and outflow conditions. First of all, the initial conditions and boundary conditions of the model are set. The historical runoff data (water level and flow) of the hydrological station and the historical meteorological data (wind speed, wind direction, relative humidity, temperature, and cloudage) of the meteorological station are collected to simulate the daily change process of the water temperature of the Xuanwei Reservoir. The vertical distribution of the water temperature of the reservoir in mid-May is obtained by calculating the simulation results, and the results are shown in Figure 8a. The vertical distribution of water temperature in mid-May was taken as the initial conditions of the model, when the inflow water temperature is 21 °C, and the outflow water temperature is 15.8 °C. According to the sampling survey in the study area, the spawning period of C. idella occurs mostly from mid-May to mid-July of the year, and the optimal water temperature range for spawning is between 21 °C to 24.5 °C.
The inflow range is between 21 m3/s to 163 m3/s according to the historical runoff data from the hydrological station in May, since 1970. The inflow and outflow are each divided into eight different scenarios by using 20 m3/s as the flow interval. Different inflows and different outflows are combined into 64 sets of scheduling scenarios. The inflow water temperature and meteorological data are based on the multi-year average data in mid-May. By simulating 64 different scenarios, the results obtained are shown in Figure 8 and Table 2.
In Figure 8, the vertical distribution of water temperature in the reservoir for one day, three days, and five days is shown by five different scheduling scenarios. The vertical distribution of the reservoir water temperature, respectively, is show in Figure 8b–d, when the reservoir inflow is equal to reservoir outflow. The comparison results show that the large inflow of the reservoir makes the water body mix well, which leads to the decrease of the thermal stratification stability. Therefore, the temperature difference between the inflow and the outflow is relatively small. Similarly, the small inflow of the reservoir makes the water body mix slowly, resulting in enhanced thermal stratification stability. Therefore, the temperature difference between the inflow and the outflow is relatively high. The vertical distributions of the reservoir water temperature are shown in Figure 8c, e, and f, where the reservoir inflow is 100 m3/s and reservoir outflows are 100 m3/s, 80 m3/s, and 120 m3/s, respectively. The comparison results show that the larger outflow of the reservoir makes the water body mix more fully for the same reservoir inflow, which leads to the decrease of the thermal stratification stability.
When the inflow water temperature is 21 °C, the time taken for the outflow water temperature to reach 21 °C is shown in Table 2. It can be seen from Table 2 that the larger outflow of the reservoir makes the time to reach the appropriate water temperature shorter for the same reservoir inflow.
Due to the thermal stratification of the reservoir, there appears to exist a time lag phenomenon between inflow water temperature and outflow water temperature. The results of the model simulation show that the larger inflow and outflow of the reservoir will make the water body mix more intensely, resulting in shorter time delay of water temperature. At the same time, the fish reach the appropriate water temperature for spawning in a short time, which is more beneficial to C. idella. Conversely, a long lag time of water temperature delays the spawning of C. idella, which is less favorable for spawning.

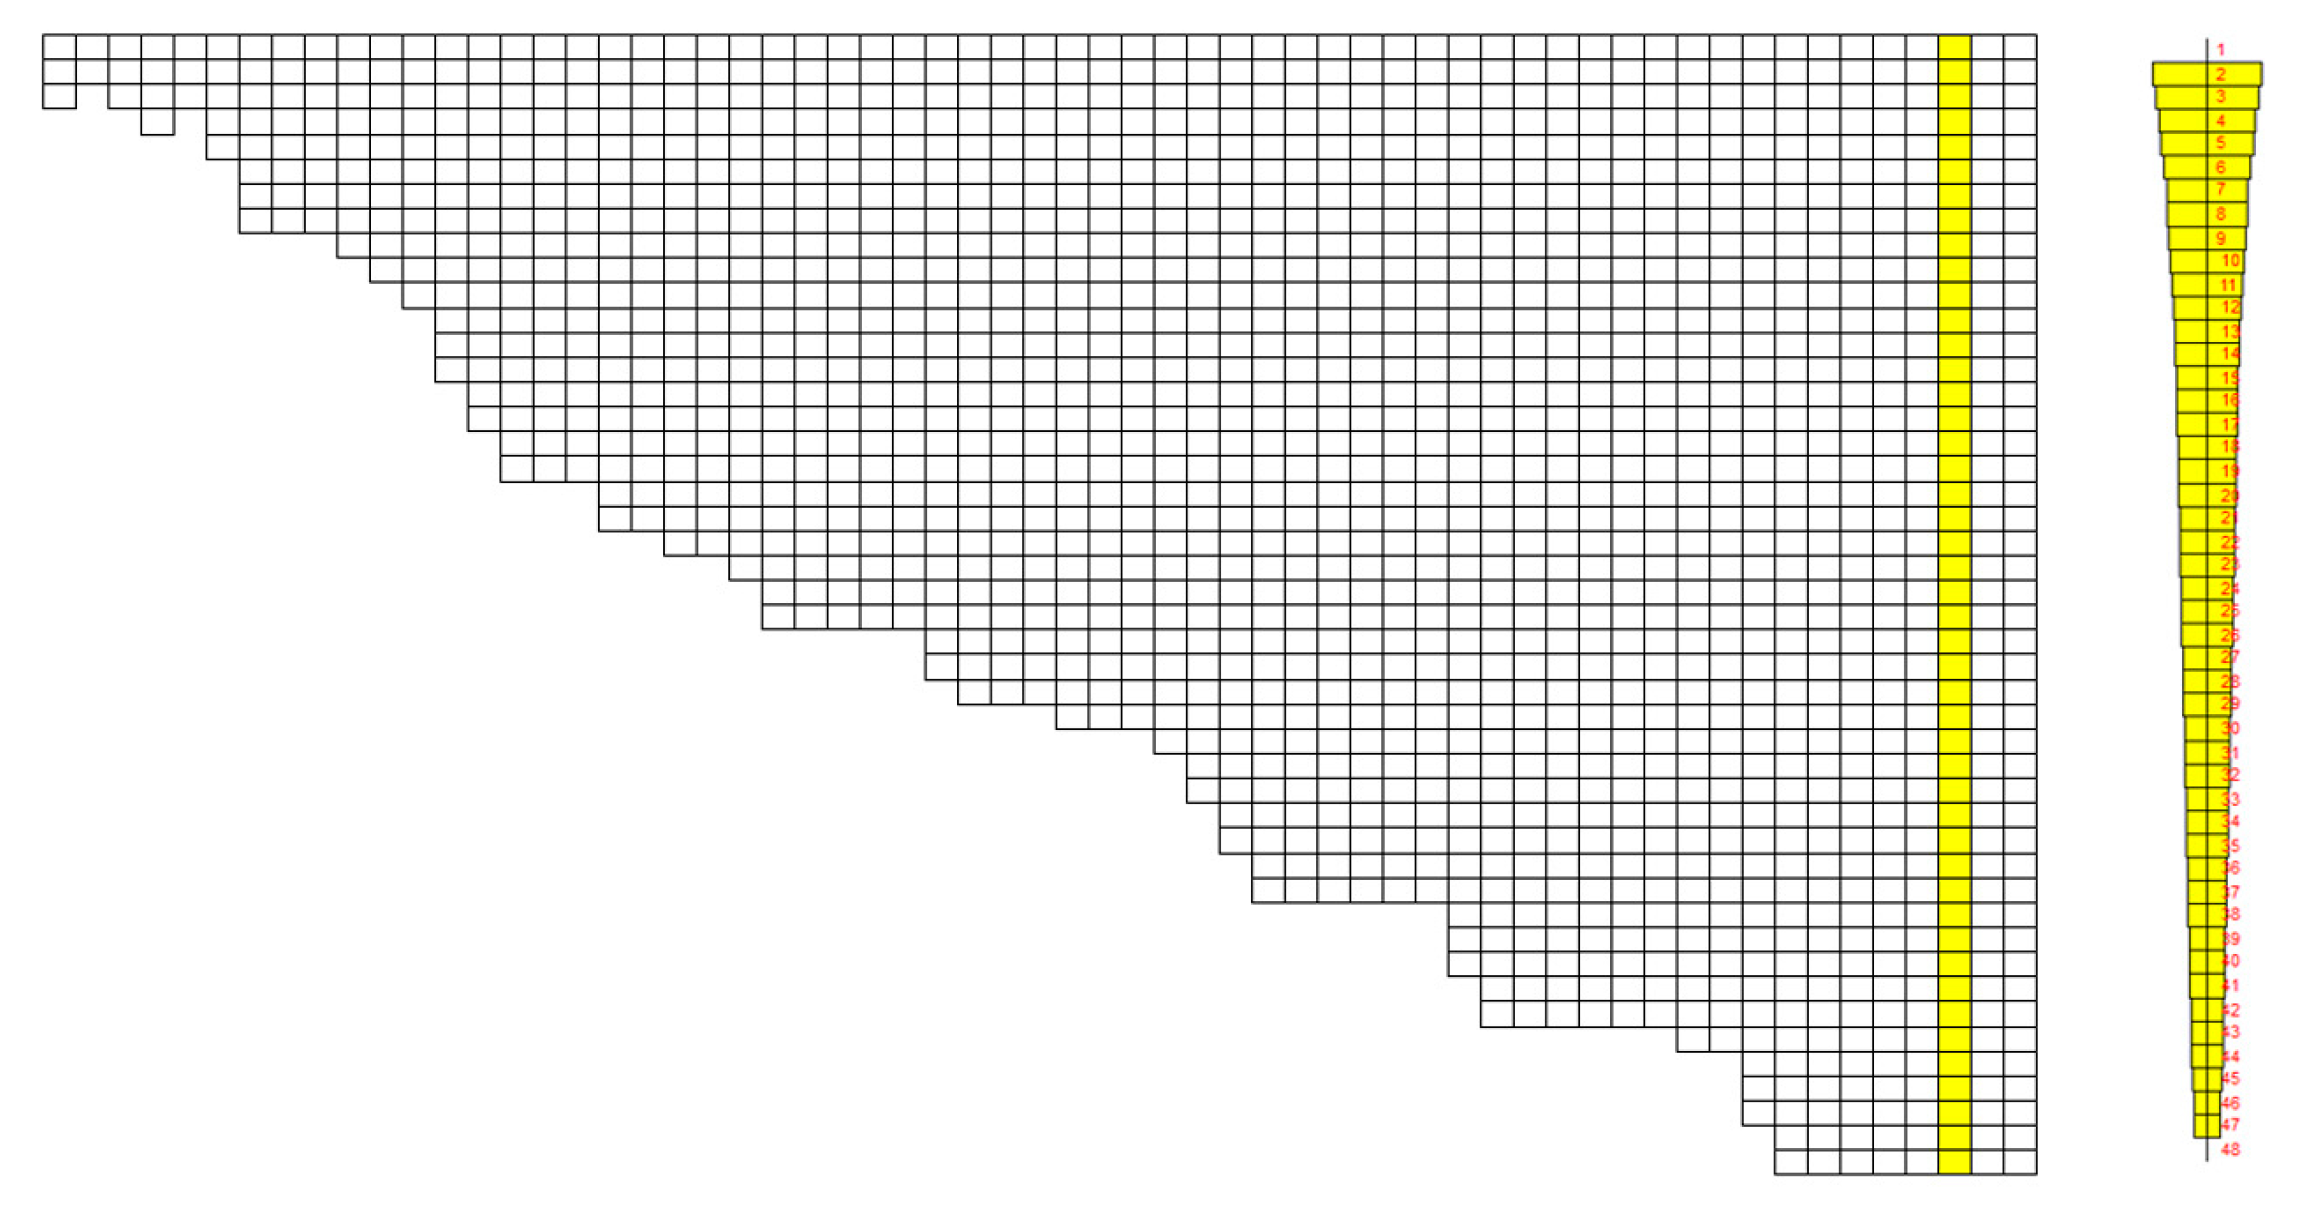
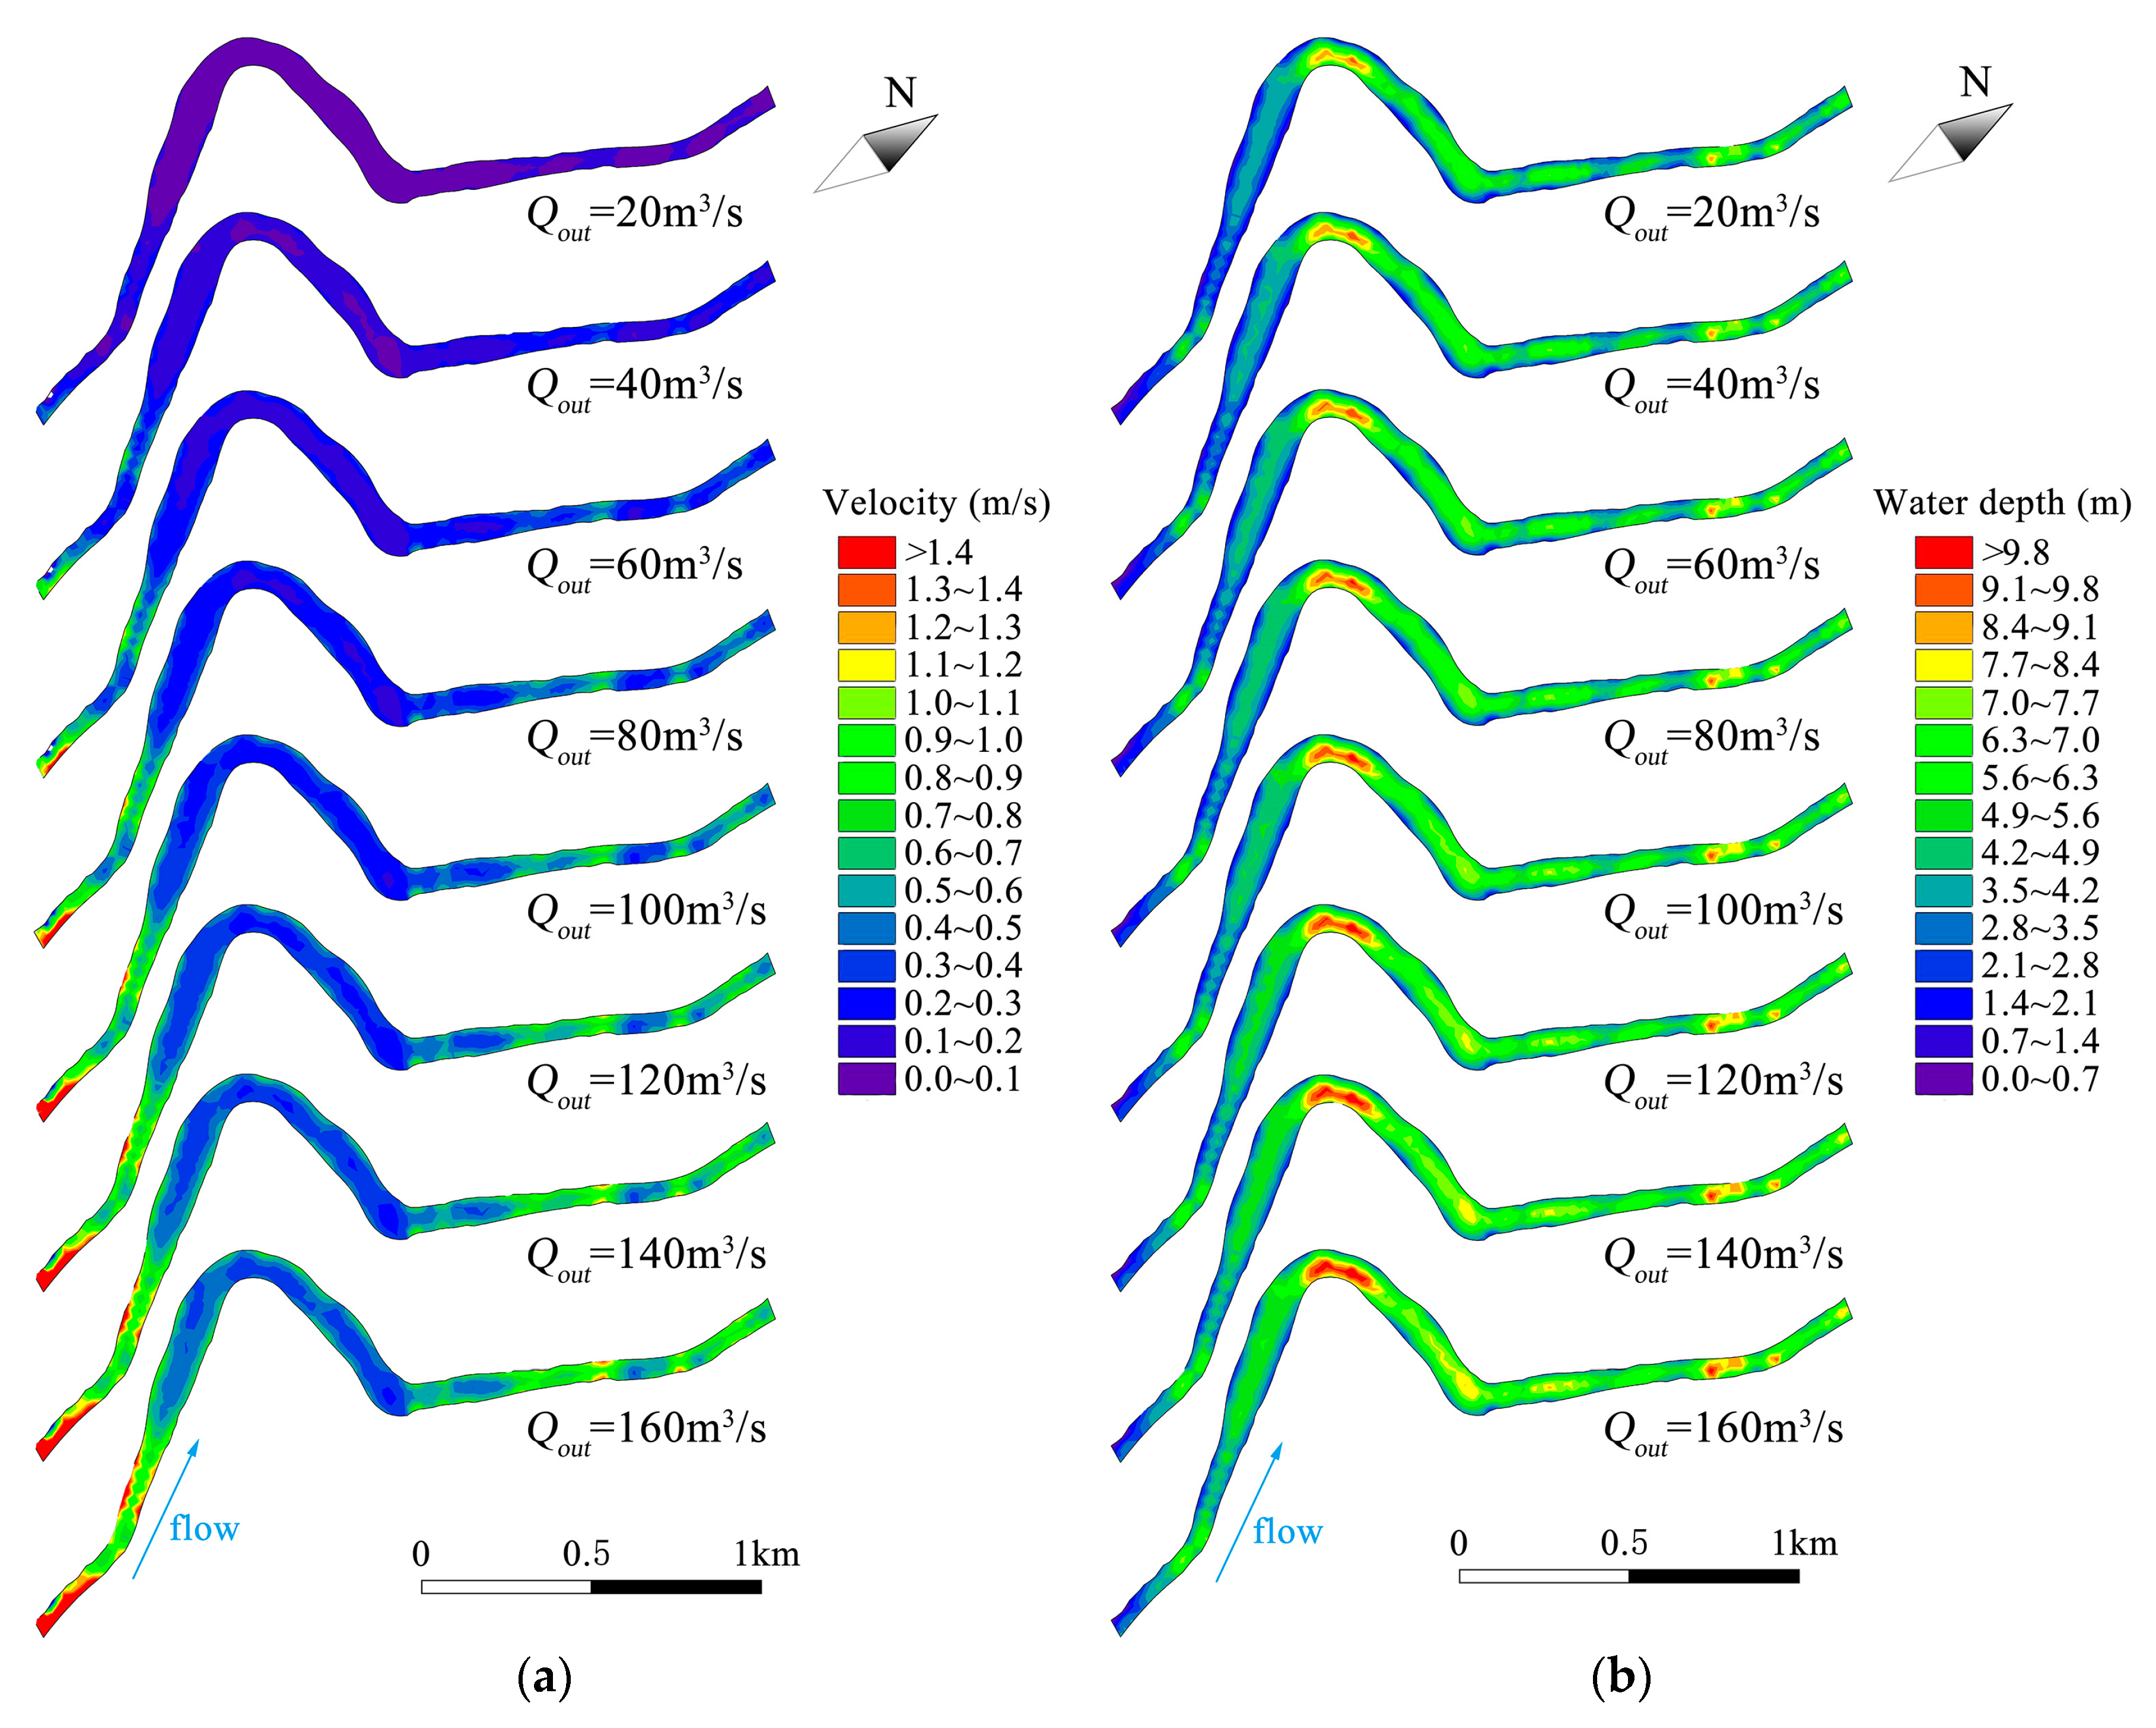
4.2. Result of MIKE21 Model Simulation

The MIKE21 model is used to simulate the velocity and water depth distribution of fish habitats under different outflows of the reservoir. The outflow range uses the value simulated by the CE-QUAL-W2 model, which is divided into eight different scenarios. The minimum outflow is 20 m3/s and the maximum outflow is 160 m3/s with an outflow interval of 20 m3/s. The upper boundary of the habitat model uses a flow boundary, and the lower boundary uses a water level boundary. The topographic data is provided by the Hydraulic Exploration Design Institute of the Guizhou Province in China. On the basis of the hydraulic simulation, the spatial distribution of water depth and velocity under eight different modeling scenarios is shown in Figure 9. As can be seen from the figure, the velocity is relatively large near the reservoir location, and the water depth is deeper at the river bend.

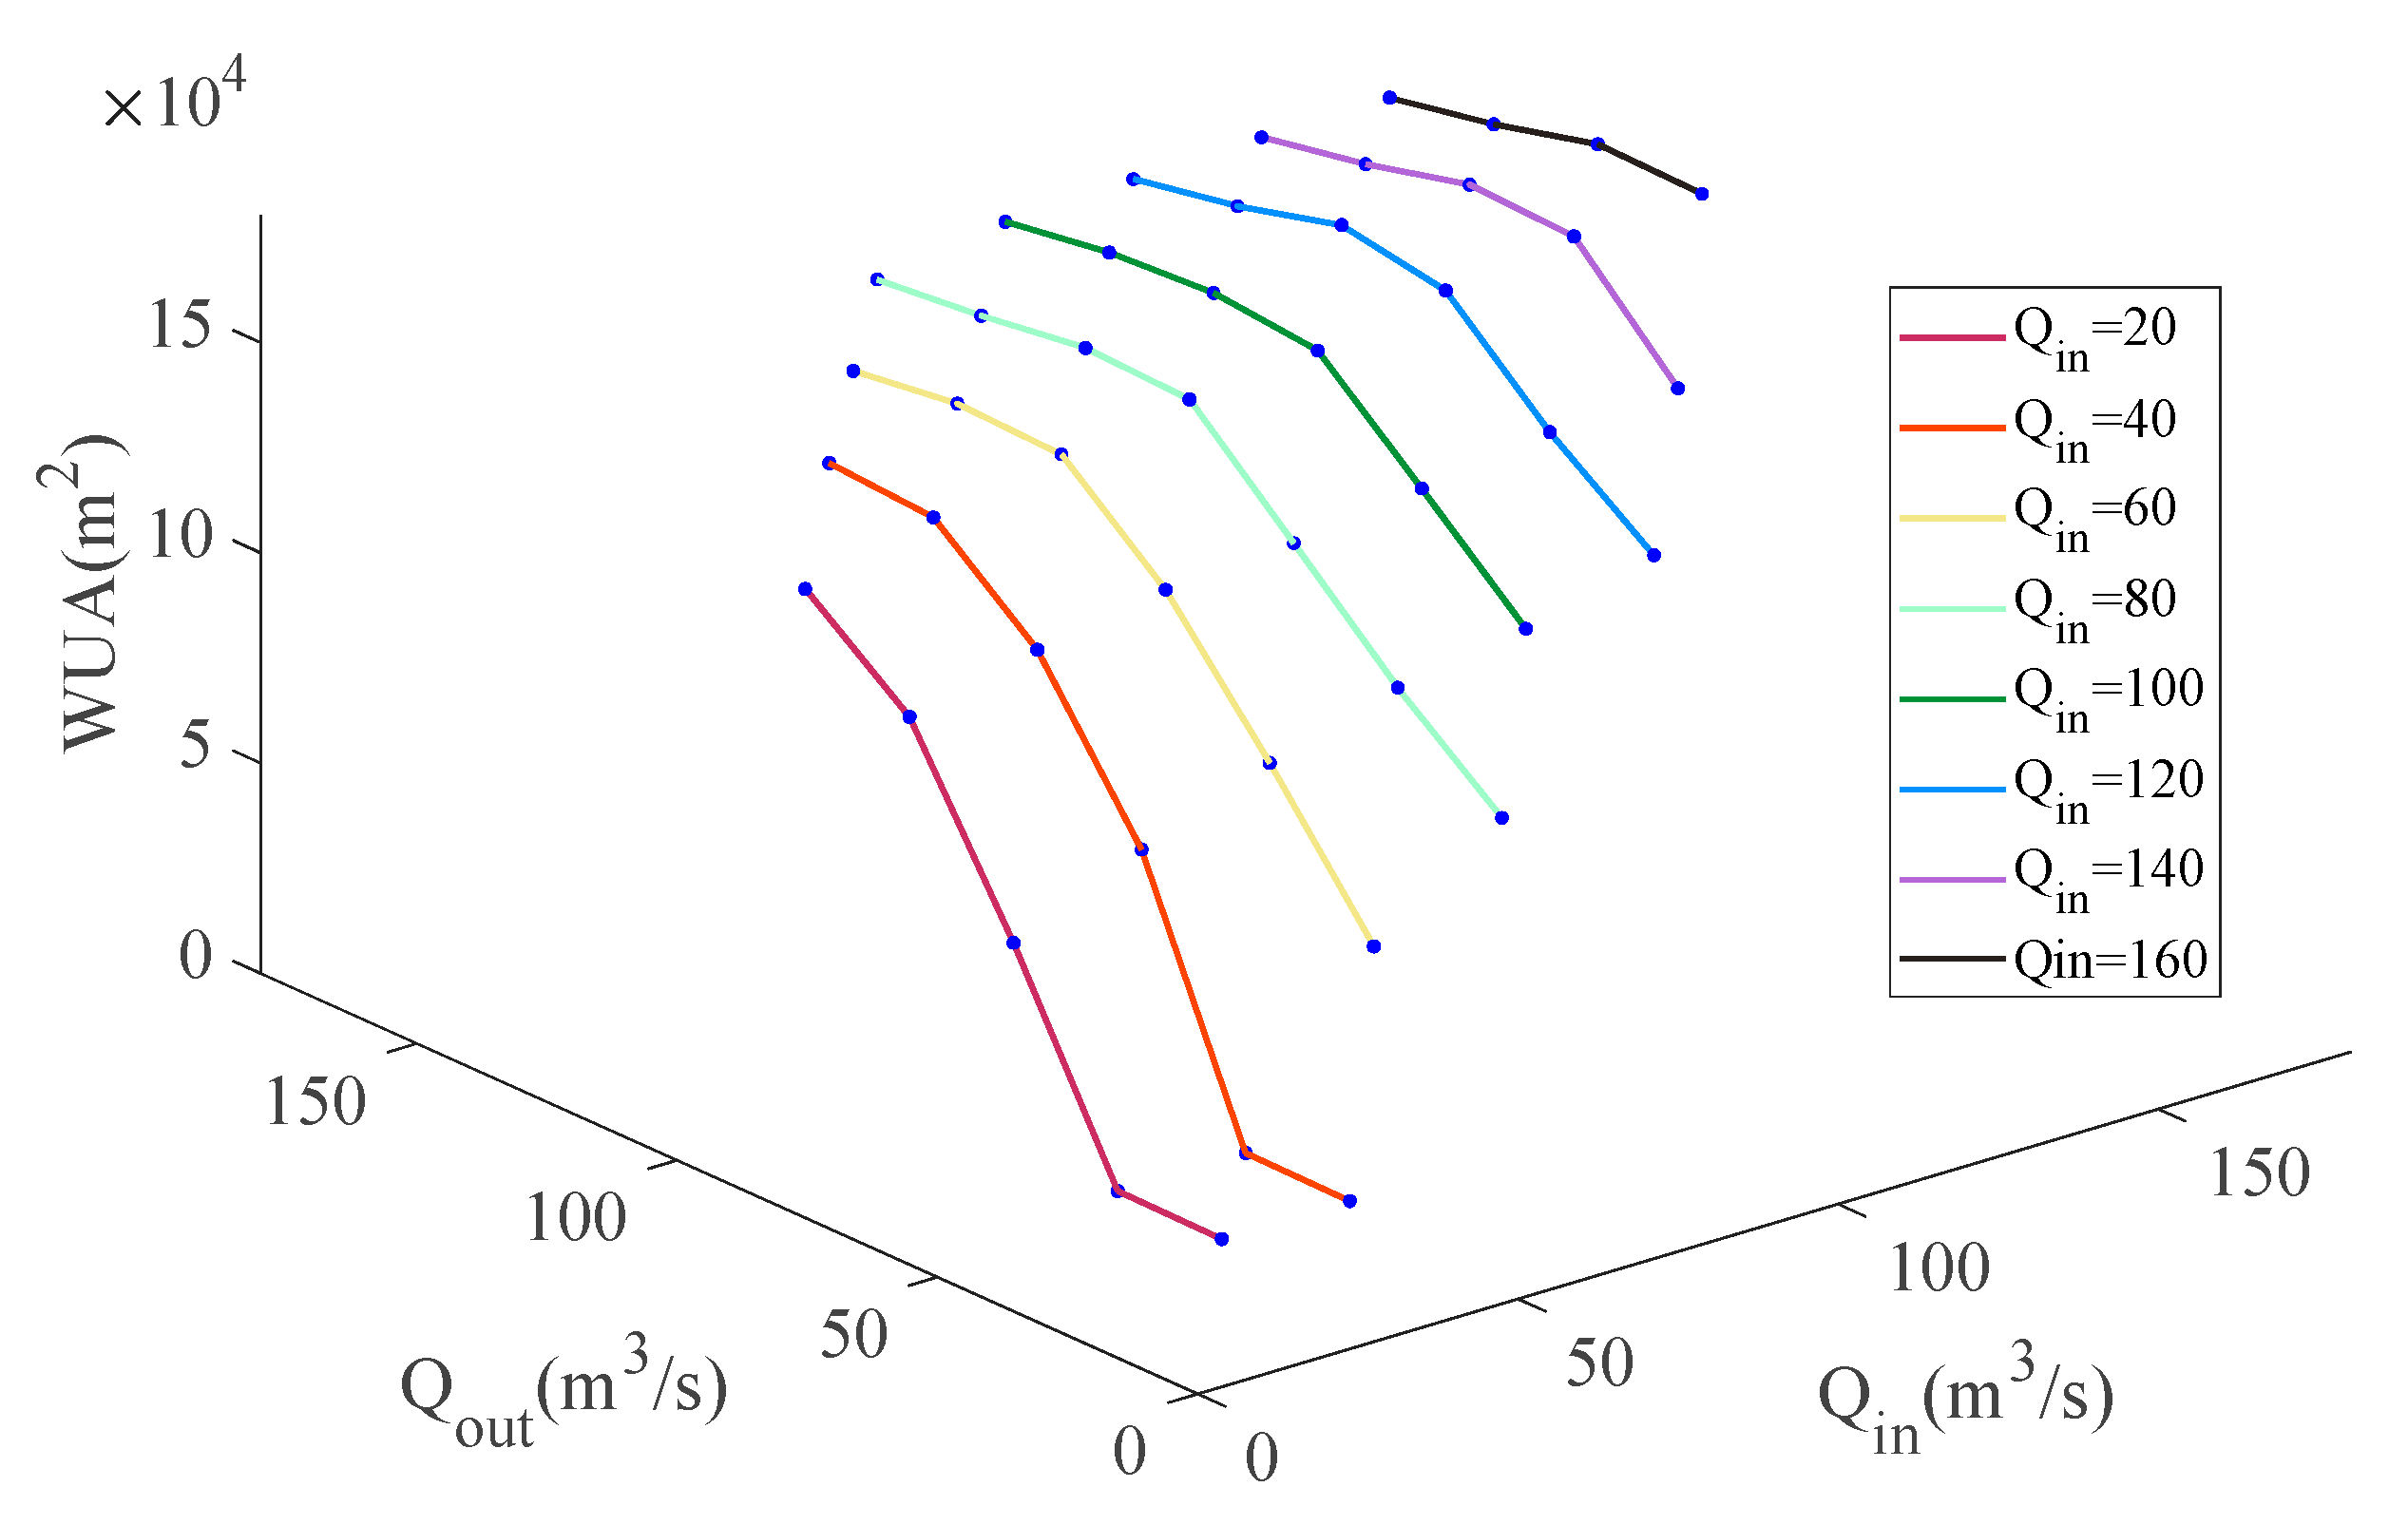
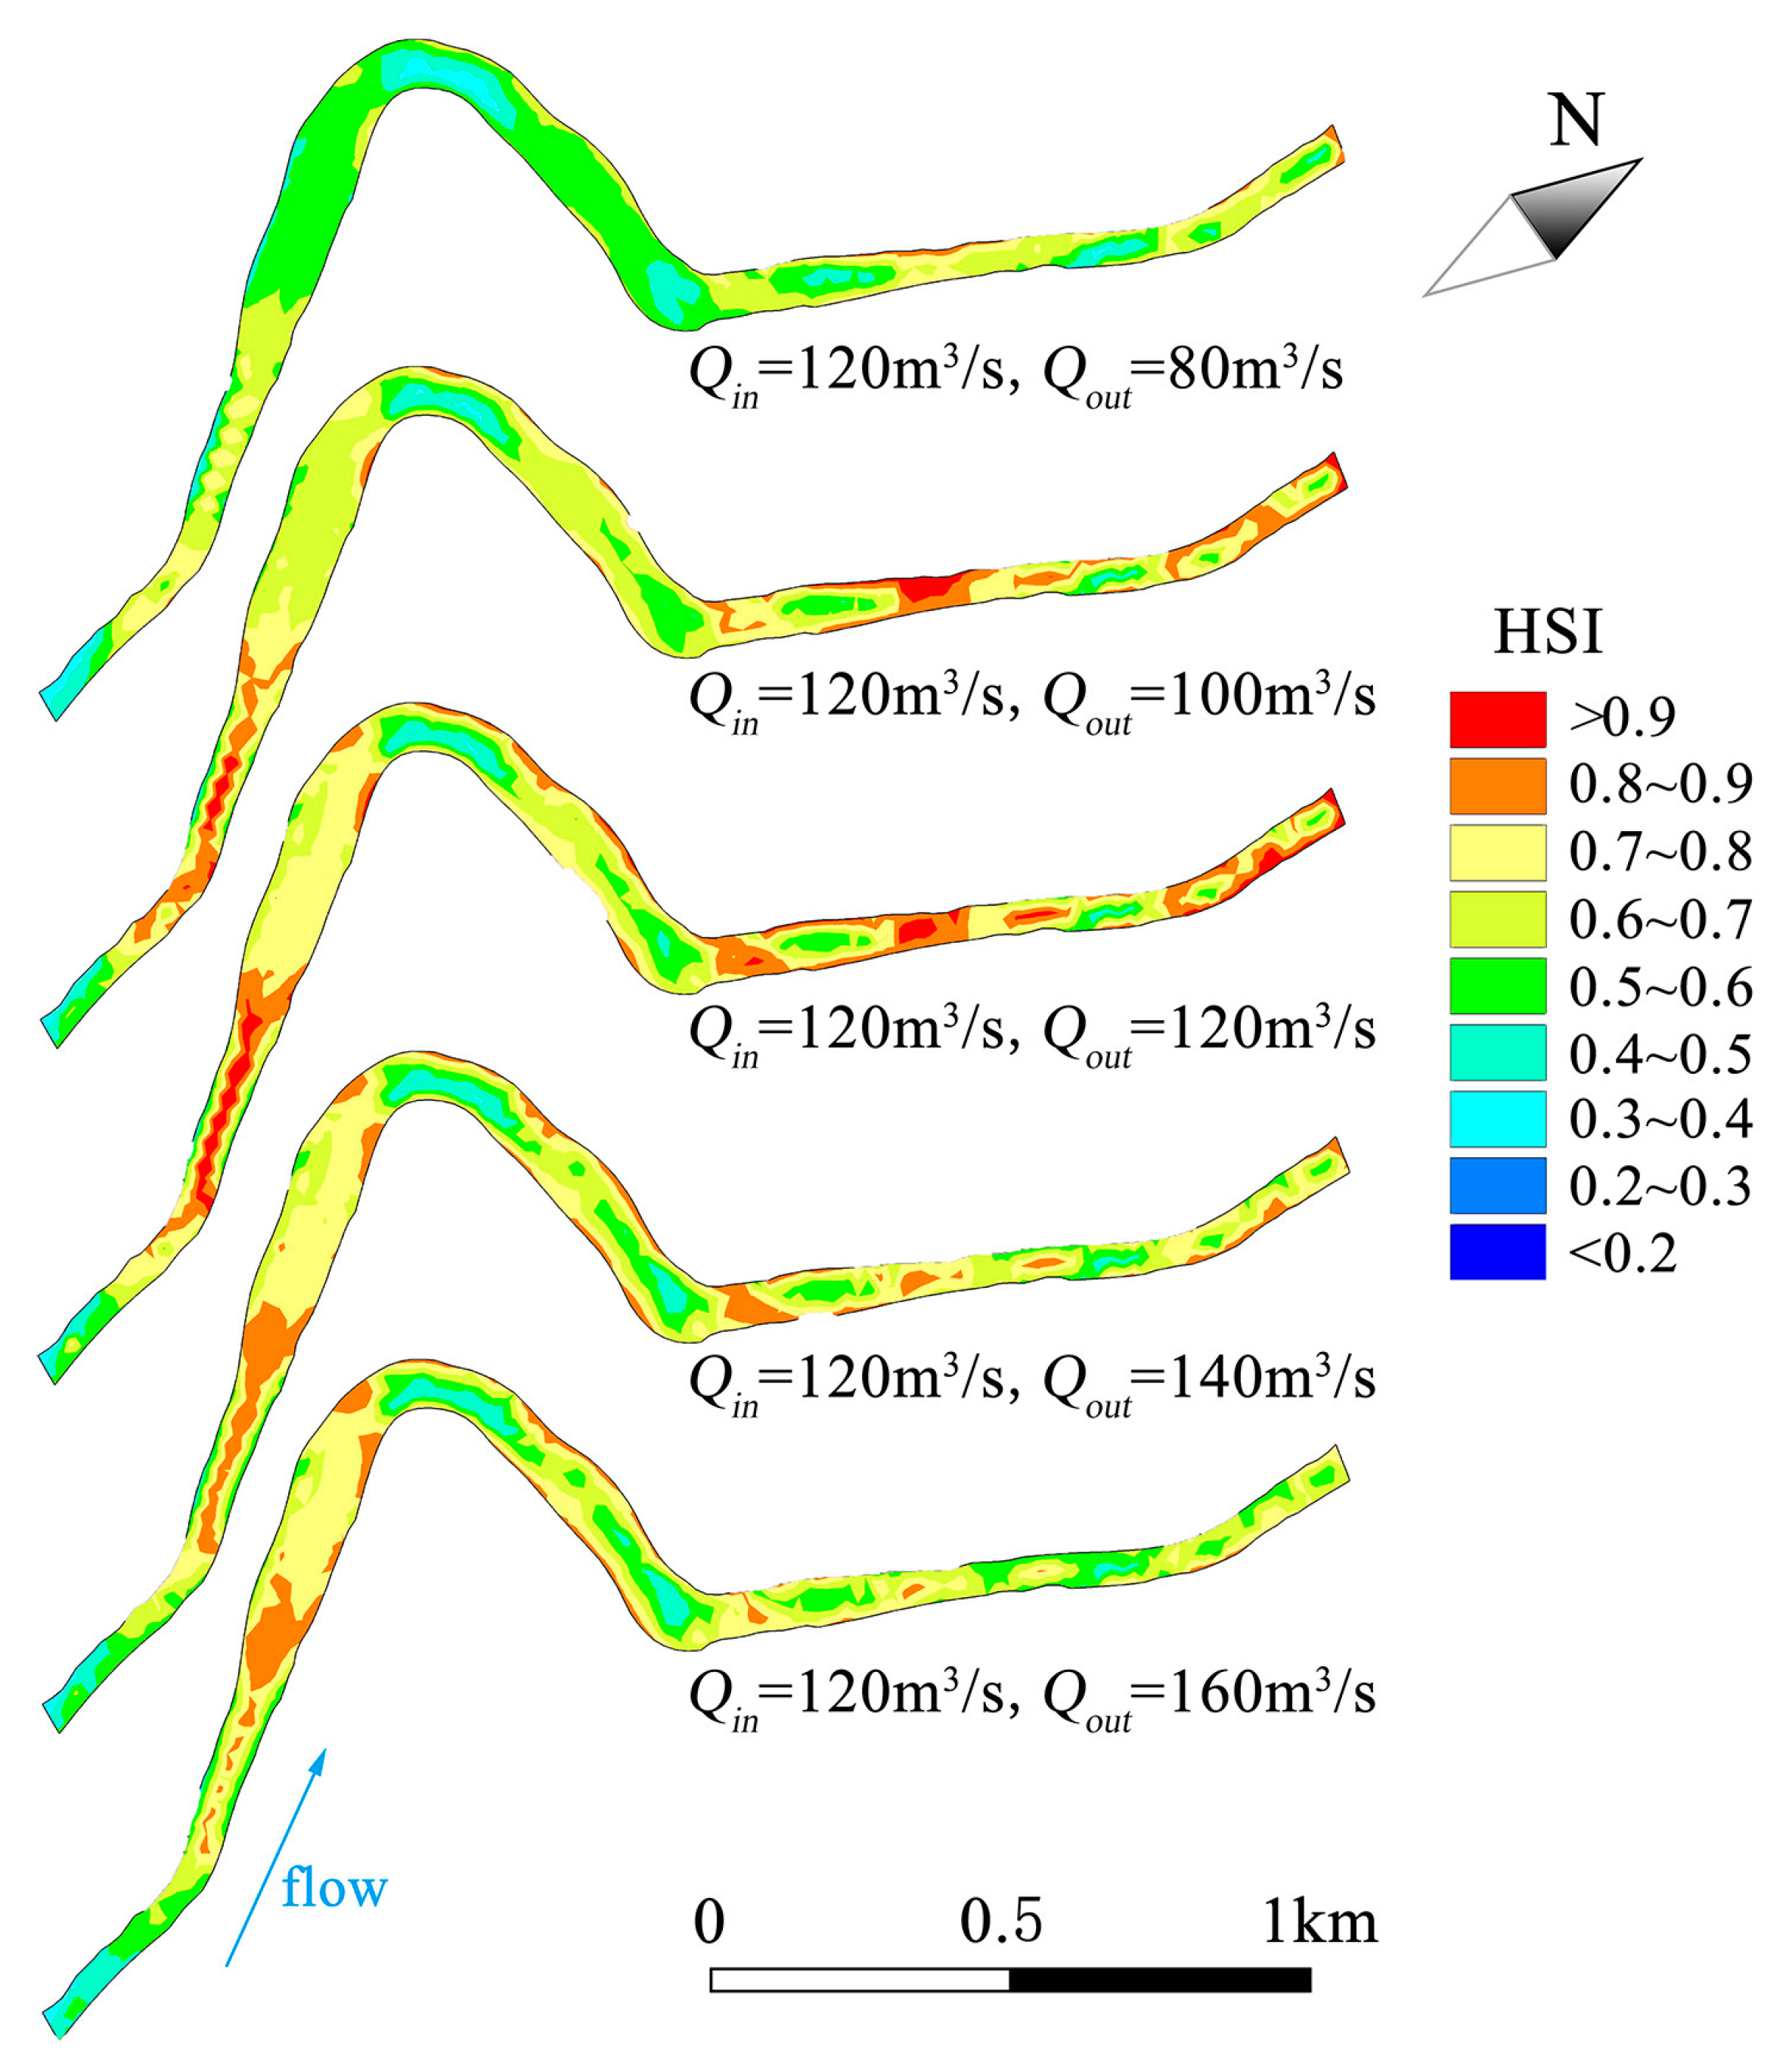
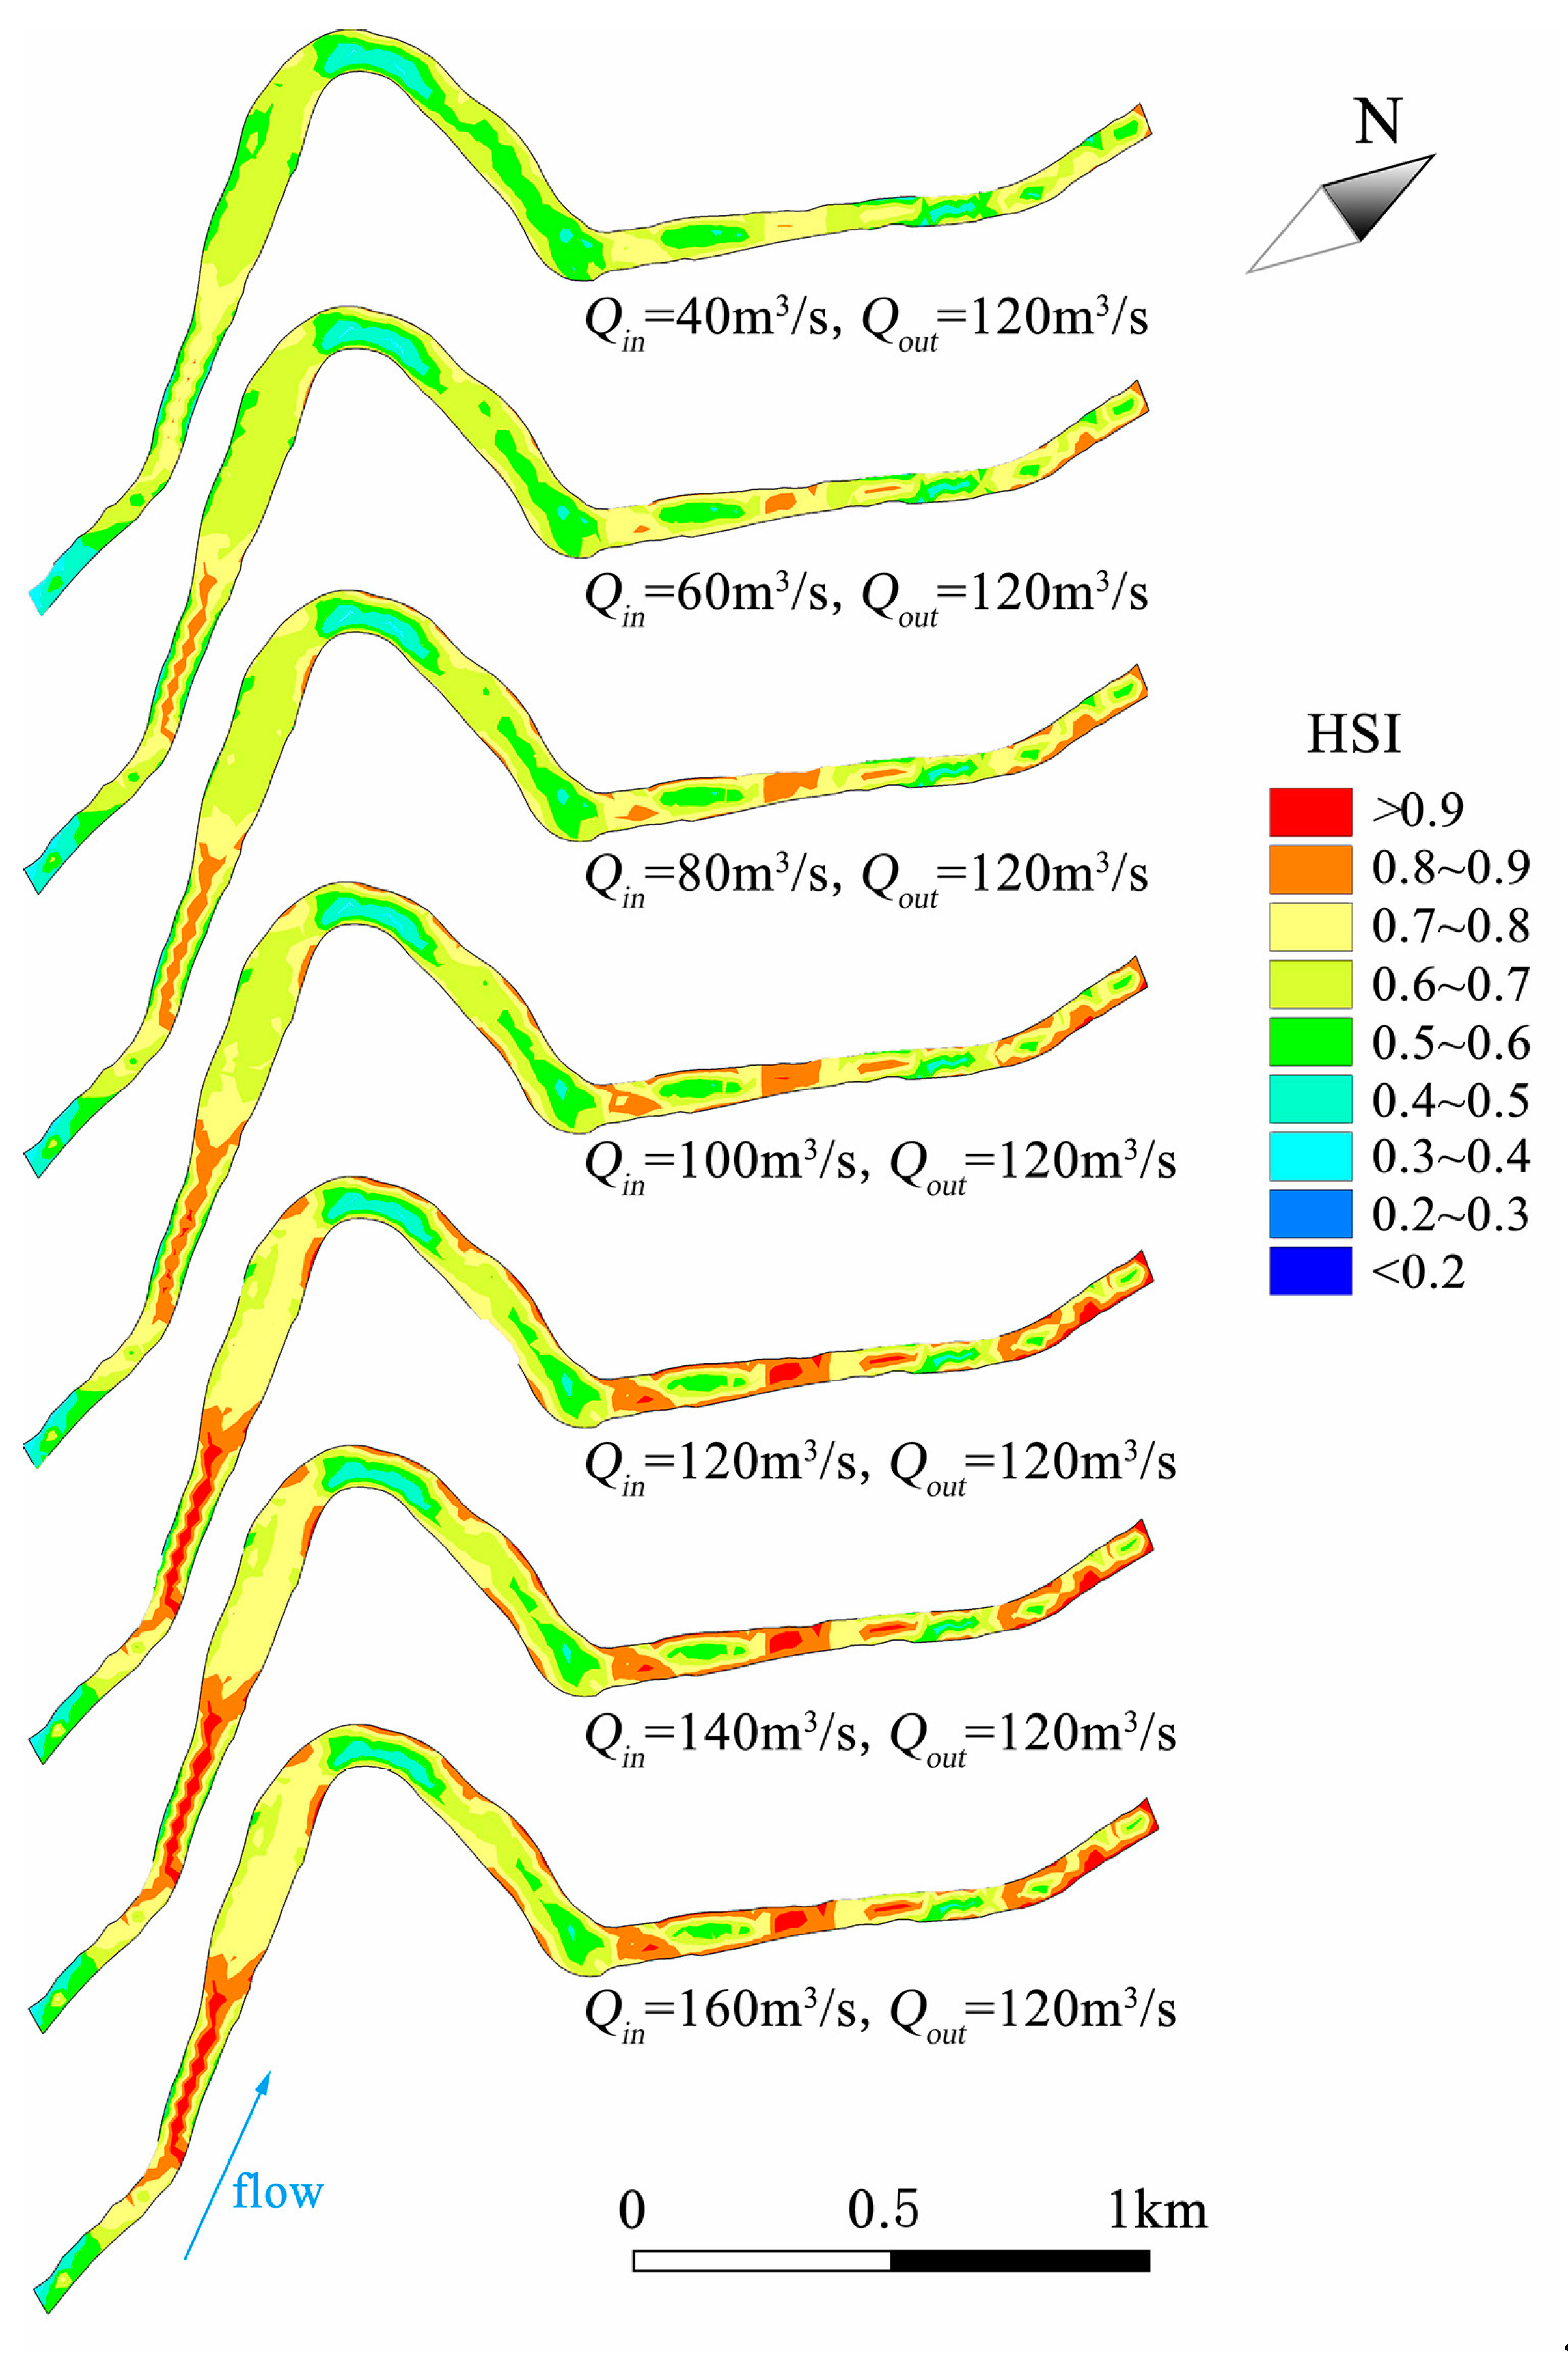
4.3. Suitable Ecological Flow Calculation

The simulation results of the CE-QUAL-W2 model and the MIKE21 model are applied to the suitability evaluation of representative species in the study area. The effects of flow, water depth, and water temperature hysteresis on habitats are reflected in the suitability evaluation. The implementation of the fuzzy inference system represented in the previous section gives the outputs for all possible inputs, as shown in Figure 10. The combined effects of each of the two indicators on habitat suitability are shown in Figure 10, with a total of three sets of analysis results. The results show that when velocity and water depth are excessively large or small, habitat suitability is so poor that the hydraulic condition cannot meet the spawning requirements of C. idella. According to the survey data of C. idella in the Qingshui River (Section 2, 2.2. Ctenopharyngodon idella) it is most suitable for adult C. idella spawning when the water temperature is between 21 °C and 24.5 °C, velocity is between 0.3 m/s and 0.9 m/s, and water depth is between 3 m and 7.5 m. The results derived from the 3D fuzzy surface graph are basically the same as the field measured data, so the fuzzy logic-based habitat model should be reliable and adoptable.
On the basis of the hydraulic simulation and the fuzzy logic-based habitat model, the weighted usable area (WUA) and hydraulic habitat suitability (HHS) are evaluated. The specific operational steps are to simulate the distribution of velocity, water depth, and water temperature lag time under different inflows and outflows through two hydraulic models. Then, the fuzzy-based habitat model is used to construct the relationship between hydraulic factors and habitat suitability index. Finally, the WUA and the HHS under different reservoir inflows and reservoir outflows are obtained by fuzzy calculation. This study simulates a combination of eight different reservoir inflows and eight different reservoir outflows, including a total of 64 scenarios. The results of 64 scenarios are analyzed, but 19 of them do not meet the scheduling requirements. According to these scenarios, the water level is higher or lower than the water level limit. The simulation results under 45 scenarios are shown in Figure 11 and Table 3.
The WUA and HHS are calculated from the habitat quality maps by using Equations (8) and (9). As can be seen from Figure 11 and Table 3, the change tendencies of the WUA and HHS are almost consistent. The suitability of hydraulic habitats under different reservoir inflows and outflows are shown in Table 3. The best flow management scenario is determined by comparing and analyzing the simulation results under the WUA and HHS for each scenario as follows:
1. The effects of different outflow on the WUA and HHS for the same reservoir inflow. It can be seen from the table that an increase of the reservoir outflow will make the HHS value gradually increase for the same reservoir inflow. When the reservoir outflow reaches 120 m3/s, the HHS value is the largest. However, the HHS value gradually decreases when the reservoir outflow is greater than 120 m3/s. At the same time, it can be seen from the table that when the reservoir outflow reaches 100 m3/s or more, the comprehensive index of HHS can generally reach 0.6 or more.
2. The effect of the WUA and HHS when the reservoir inflow is equal to outflow. A total of eight scenarios (20, 40, 60, 80, 100, 120, 140, and 160 m3/s) were simulated for the same reservoir inflow and outflow. The habitat ecological suitability is the best when the reservoir outflow is 120 m3/s. When the flow is greater than 100 m3/s, the HHS index can reach 0.6 or more, which is beneficial to C. idella spawning.
3. Determination of the suitable ecological flow range based on 64 scenarios. According to the results of 64 scenarios, it shows that the ecological flow for C. idella spawning can satisfy the basic demand when the reservoir inflow is greater than 60 m3/s and the reservoir outflow is greater than 100 m3/s. The habitat ecological suitability is the best when the reservoir outflow is 120 m3/s. Therefore, compared with historical data, the suitable ecological flow from 100 m3/s to 160 m3/s for C. idella propagation is reliable, and the ecological flow can meet the spawning requirements of the fish species.

4.4. Discussion

4.4.1. Suitable Ecological Flow Discussion

For further analysis of the simulation results, several scenarios are selected for analysis. The spatial distribution of habitat suitability for several scenarios is shown in Figure 12 and Figure 13. According to the simulation results of velocity and water depth in Figure 12 and Figure 13, the velocity is larger at the dam site, but the excessive velocity leads to poor habitat suitability. The water depth at the bend of the river is deep, and the deepwater depth leads to poor habitat suitability.
The spatial distribution of habitat suitability indicators is shown in Figure 12, where the reservoir inflow is equal to outflow. It can be seen from the results that the large inflow of the reservoir makes the water body mix well, which leads to a decrease of the thermal stratification stability. Therefore, the temperature difference between the inflow and the outflow is relatively small, which is beneficial to C. idella spawning. Similarly, the small inflow of the reservoir makes the water body mix slowly, resulting in an enhanced thermal stratification stability. Therefore, the temperature difference between the inflow and the outflow is relatively high, which is unfavorable for C. idella spawning. Comparing the spatial distribution characteristics of the four different scenarios in Figure 12, the overall suitability is optimal at 120 m3/s. Habitat suitability is extremely poor when the reservoir outflow is below 40 m3/s. This shows that too much or too little flow will be detrimental to C. idella spawning. The results show that when reservoir inflow and reservoir outflow are excessively large or small, habitat suitability is so poor that the hydraulic condition cannot meet the spawning requirements of C. idella.
Figure 13 shows the spatial distribution of habitat suitability index when the reservoir inflow is 120 m3/s and reservoir outflows are 80 m3/s, 100 m3/s, 120 m3/s, 140 m3/s, and 160 m3/s, respectively. It can be seen from the results that the larger outflow of the reservoir makes the water body mix well for the same reservoir inflow, which leads to the decrease of the thermal stratification stability. Therefore, the temperature difference between the reservoir inflow and the outflow is relatively small, which is beneficial to C. idella spawning, however, increasing the outflow of the reservoir leads to excessive velocity in the local area of the habitat, and also leads to deeper water depth. A too high velocity and too deepwater depth can negatively affect C. idella spawning. On the basis of the spatial distribution characteristics of habitats under five different reservoir outflow scenarios, the overall suitability is optimal at 120 m3/s. This further validates the results in the previous section. It is most beneficial to the reproduction of C. idella when the reservoir outflow reaches 120 m3/s.
Figure 14 shows the spatial distribution of habitat suitability index when the reservoir outflow is 120 m3/s and the reservoir outflows are 40 m3/s, 60 m3/s, 80 m3/s, 100 m3/s, 120 m3/s, 140 m3/s, and 160 m3/s, respectively. From the analysis in Figure 13, 120 m3/s is a suitable reservoir outflow. From the results of Figure 14, it can be seen that under this suitable outflow, the larger reservoir inflow will make the overall habitat suitability index better. The larger reservoir inflow makes the water body mix well for the same reservoir outflow, which leads to a decrease of the thermal stratification stability. Therefore, the temperature difference between the reservoir inflow and the outflow is relatively small, which is beneficial to C. idella spawning. On the basis of the spatial distribution characteristics of habitats under seven different reservoir inflow scenarios, the overall suitability is optimal at 160 m3/s. This shows that reservoir inflow has a certain impact on C. idella spawning. The reservoir inflow provides a space for rational allocation of water resources.

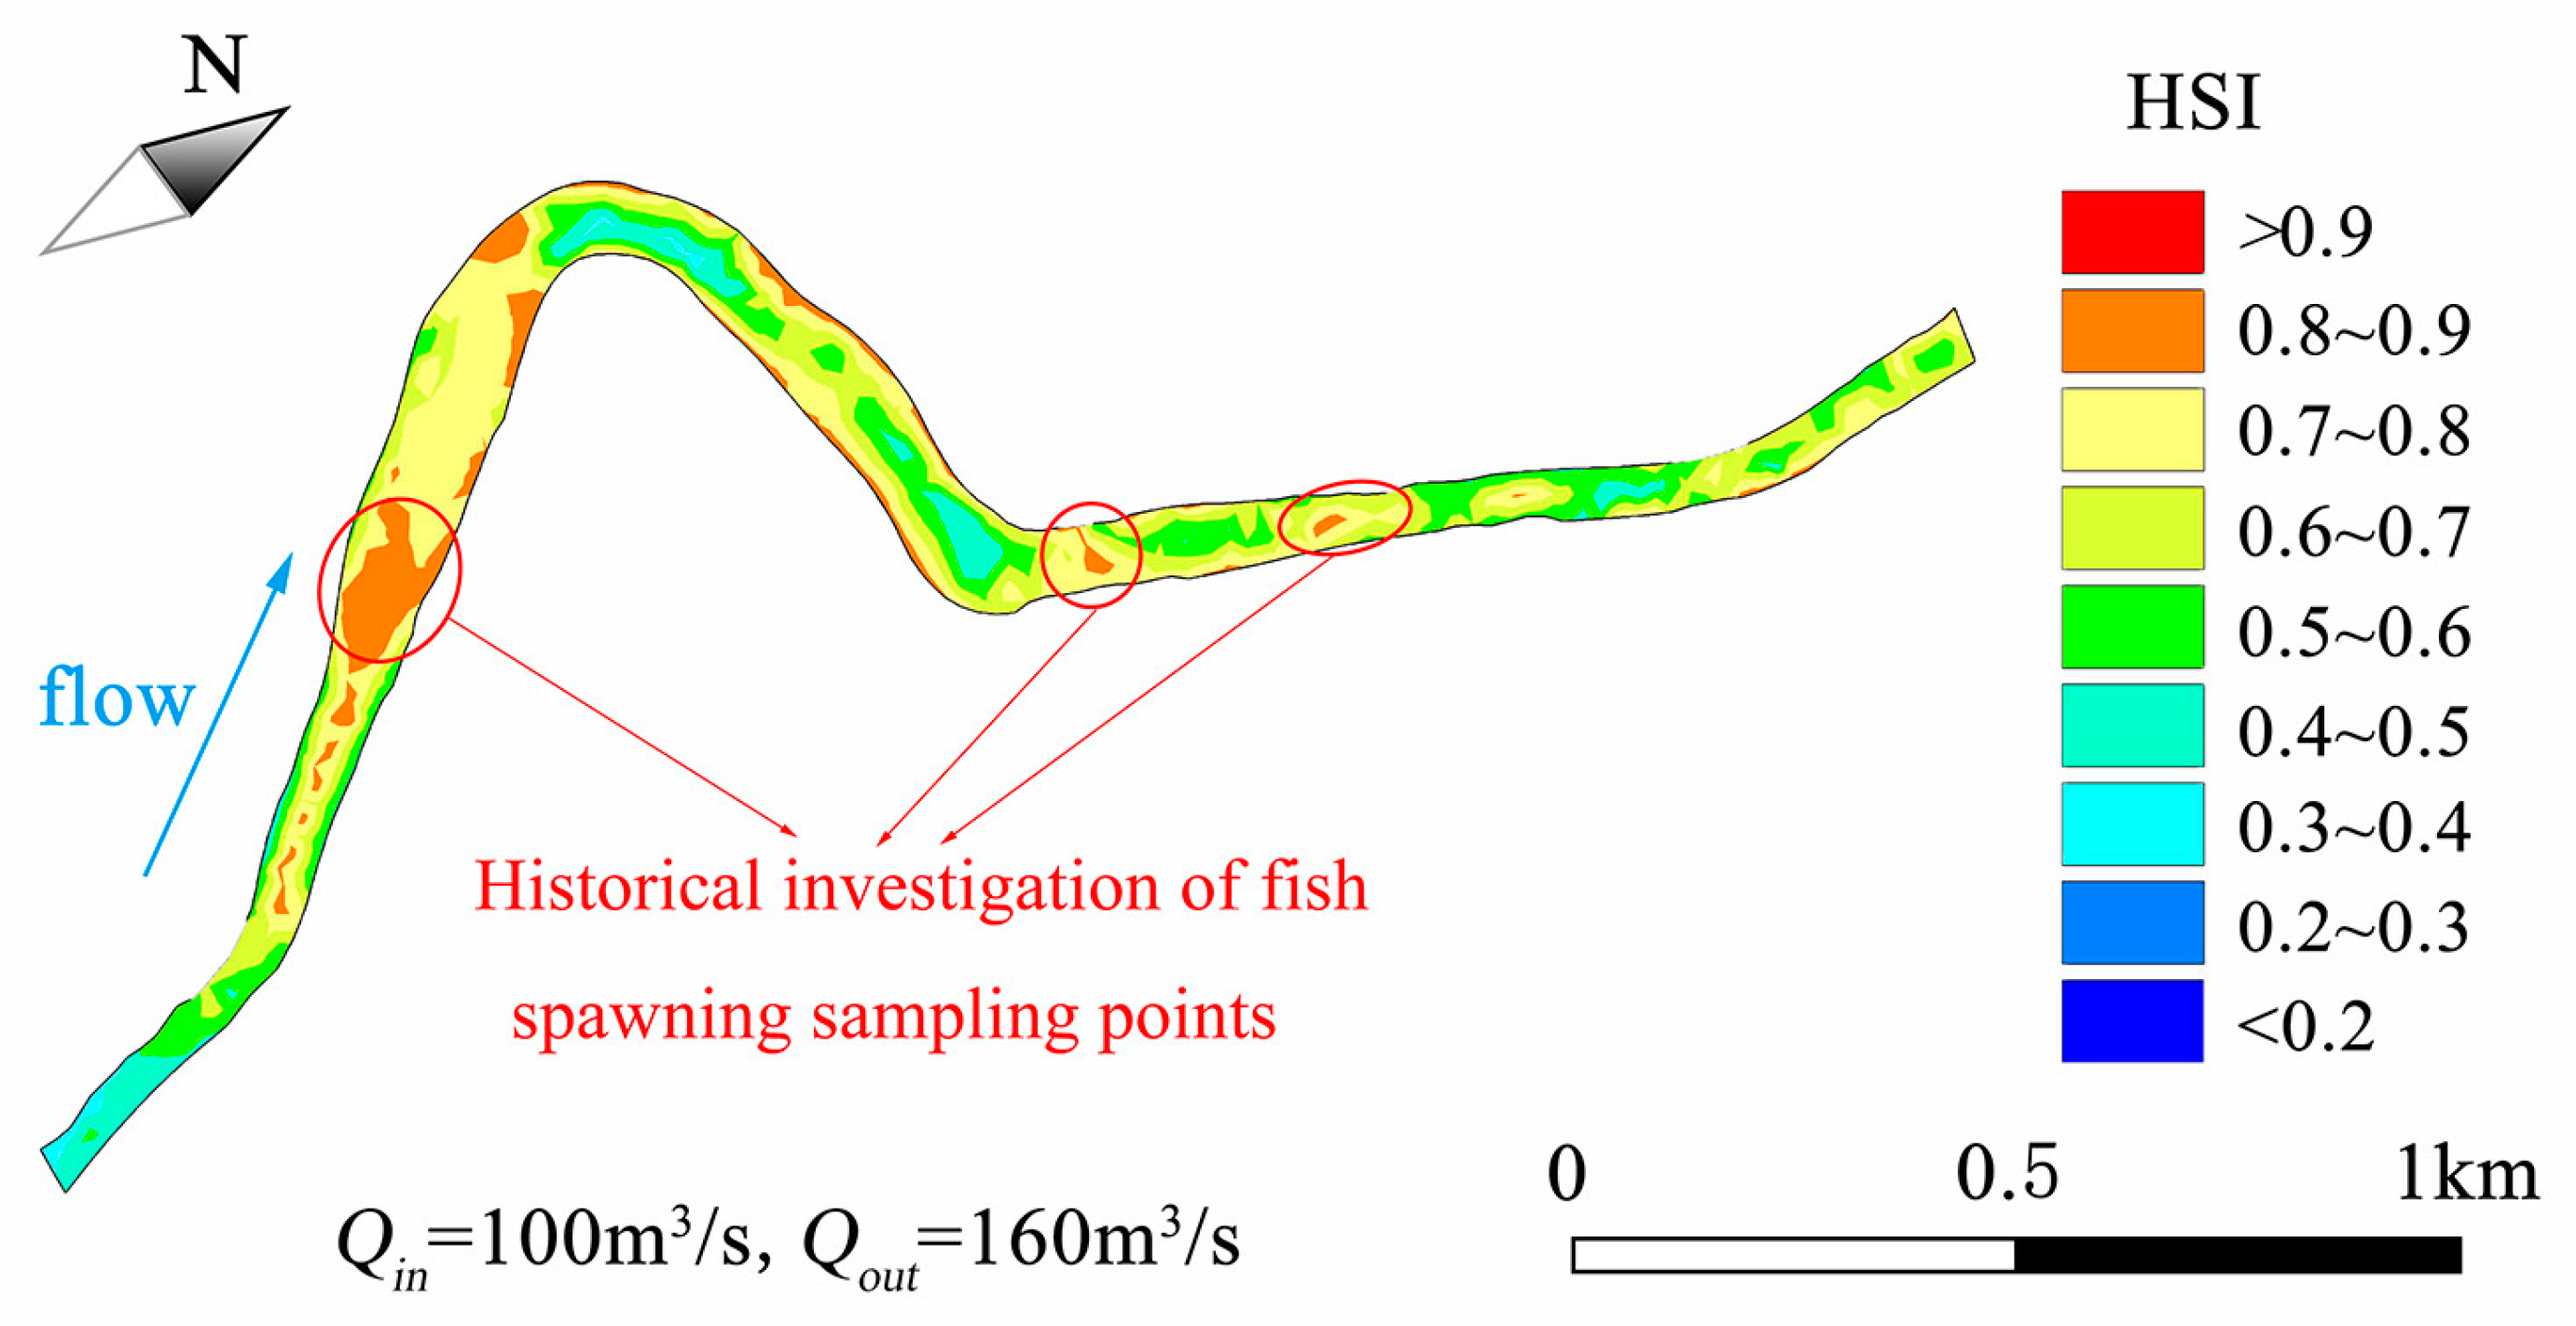
4.4.2. Suitable Spawning Areas Discussion

In order to discuss suitable spawning activity areas for C. Idella, this study calculates and analyzes the weighted usable area with a suitability of 0.6 or more. As shown in Table 4, the following results can be seen from the table: (1) under the seven scenarios with low flow, the weighted usable area with a suitability of 0.6 or more is 0; (2) when the reservoir inflow is 100 m3/s and outflow is 160 m3/s, the weighted usable area with a suitability of 0.6 or more is the largest. The maximum value is 135,396 m3, accounting for 62.6% of the total habitat area of the study area; and (3) when the reservoir inflow is greater than 60 m3/s and outflow is greater than 100 m3/s, the C. idella has more than 100,000 m3 area suitable for spawning activity.
The main spawning area of C. idella spawning is shown in Figure 15 (select a scenario where the reservoir inflow is 100 m3/s and the outflow is 160 m3/s). According to the survey data, the C. idella historical sampling points are mainly concentrated in three areas, which is close to the best suitability area of the simulation results. The model has a certain reliability under less data samples and is a better choice.

4.4.3. Future Work

There are still some shortcomings in the current research and further research should be carried out which includes the following: (1) Fish habitats not only provide living space for fish, but also provide all environmental factors such as water temperature, substrate, flow rate, pH value, and dissolved oxygen that satisfy the survival, growth, and reproduction of fish. The impact of various hydraulic factors on fish habitats should be considered in the future. (2) In addition to C. idella in the study area, other economically valuable local fish should be considered as research protection targets. Habitat models that consider multiple species should be established in the future. (3) The current research is only for the fish spawning period, and the whole life cycle of the fish should be considered in the future, including the hydraulic conditions of the feeding ground, the spawning ground, and the wintering ground.

5. Conclusion

Construction of water conservation projects changes natural flow regimes of rivers and causes adverse impacts on rivers such as obstruction of fish migration paths, as well as altering water quality and water temperature, and thereby causing profound impacts on the aquatic ecosystem. By coupling the fuzzy inference system, a two-dimensional laterally-averaged hydrodynamic model (CE-QUAL-W2), and a two-dimensional shallow water hydrodynamic model (MIKE21), the fuzzy logic-based habitat model is developed for evaluating the effect of inflow and outflow of the Xuanwei Reservoir on the spawning habitat suitability of Ctenopharyngodon idella (C. idella) in the Qingshui River. The model is constructed considering the reservoir and the downstream river channel, and explores the comprehensive effects of water temperature, velocity, and water depth on habitat suitability.
On the basis of the historical runoff data of the hydrological station, 64 different reservoir inflow and outflow scenarios are designed and simulated. The weighted usable area (WUA) and hydraulic habitat suitability (HHS) under each scenario are calculated and analyzed to obtain a suitable ecological flow range. The results show that the ecological flow for C. idella spawning can satisfy the basic demand when the reservoir inflow is greater than 60 m3/s and the reservoir outflow is greater than 100 m3/s. The habitat ecological suitability is the best when the reservoir outflow is 120 m3/s. The suitable ecological flow range provides a reference and guidance for the ecological scheduling of reservoirs and plays an important role in conserving fish habitats. Further works should focus on data collection to consider other important physical variables such water quality, dissolved oxygen, and sediment in order to model a complex river ecosystem with more accuracy. Habitat simulation can evaluate river health and provide support for river management, and therefore it is needs to be quickly put into practice to improve local river ecology and environment.

Author Contributions

Data curation, L.Y.; Formal analysis, J.L.; Funding acquisition, J.Z.; Investigation, S.P.; Methodology, J.L.; Project administration, H.Q.; Software, S.P.; Supervision, L.Y. and L.T.; Validation, W.W.; Writing – original draft, J.L.; Writing – review & editing, H.Q.

Funding

This work is supported by the National Key R & D Program of China (2017YFC0405900), the National Natural Science Foundation of China (No. 91647114, 51979113, 91547208), and the National Public Research Institutes for Basic R & D Operating Expenses Special Project (CKSF2017061/SZ).

Acknowledgments

The authors wish to thank the anonymous reviewers and editors for their constructive comments.

Conflicts of Interest

The authors declare no conflict of interest.

References

  1. Huang, L.; Li, X.; Fang, H.; Yin, D.; Si, Y.; Wei, J.; Liu, J.; Hu, X.; Zhang, L. Balancing social, economic and ecological benefits of reservoir operation during the flood season: A case study of the Three Gorges Project, China. J. Hydrol. 2019, 572, 422–434. [Google Scholar] [CrossRef]
  2. Piper, A.T.; Rosewarne, P.J.; Wright, R.M.; Kemp, P.S. The impact of an Archimedes screw hydropower turbine on fish migration in a lowland river. Ecol. Eng. 2018, 118, 31–42. [Google Scholar] [CrossRef]
  3. Zhang, M.; Wu, W.M. A two dimensional hydrodynamic and sediment transport model for dam break based on finite volume method with quadtree grid. Appl. Ocean Res. 2011, 33, 297–308. [Google Scholar] [CrossRef]
  4. Wang, Y.; Lei, X.; Wen, X.; Fang, G.; Tan, Q.; Tian, Y.; Wang, C.; Wang, H. Effects of damming and climatic change on the eco-hydrological system: A case study in the Yalong River, southwest China. Ecol. Indic. 2018, 7, 1–12. [Google Scholar] [CrossRef]
  5. Miranda, R.; Martinez-Lage, J.; Molina, J.; Oscoz, J.; Tobes, I.; Vilches, A. Effects of stress controlled loading of a reservoir on downstream fish populations in a Pyrenean river. Environ. Eng. Manag. J. 2012, 11, 1125–1131. [Google Scholar] [CrossRef]
  6. Marques, H.; Dias, J.H.P.; Perbiche-Neves, G.; Kashiwaqui, E.A.L.; Ramos, I.P. Importance of dam-free tributaries for conserving fish biodiversity in Neotropical reservoirs. Biol. Conserv. 2018, 224, 347–354. [Google Scholar] [CrossRef] [Green Version]
  7. Feng, Z.; Niu, W.; Cheng, C. China’s large-scale hydropower system: Operation characteristics, modeling challenge and dimensionality reduction possibilities. Renew. Energy 2019, 136, 805–818. [Google Scholar] [CrossRef]
  8. Huang, J.; Zhang, Y.; Arhonditsis, G.B.; Gao, J.; Chen, Q.; Wu, N.; Dong, F.; Shi, W. How successful are the restoration efforts of China’s lakes and reservoirs? Environ. Int. 2019, 123, 96–103. [Google Scholar] [CrossRef]
  9. Birk, S.; Bonne, W.; Borja, A.; Brucet, S.; Courrat, A.; Poikane, S.; Solimini, A.; Bund, W.; Zampoukas, N.; Hering, D. Three hundred ways to assess Europe’s surface waters: An almost complete overview of biological methods to implement the Water Framework Directive. Ecol. Indic. 2012, 18, 31–41. [Google Scholar] [CrossRef]
  10. Pander, J.; Geist, J. Ecological indicators for stream restoration success. Ecol. Indic. 2013, 30, 106–118. [Google Scholar] [CrossRef]
  11. Bishop, M.; Eiler, J.H. Migration patterns of post-spawning Pacific herring in a subarctic sound. Deep Sea Res. Part II Top. Stud. Oceanogr. 2018, 147, 108–115. [Google Scholar] [CrossRef]
  12. Frantzen, S.; Maage, A.; Duinker, A.; Julshamn, K.; Iversen, S.A. A baseline study of metals in herring (Clupea harengus) from the Norwegian Sea, with focus on mercury, cadmium, arsenic and lead. Chemosphere 2015, 127, 164–170. [Google Scholar] [CrossRef] [PubMed]
  13. Benjankar, R.; Tonina, D.; McKean, J.A.; Sohrabi, M.M.; Chen, Q.; Vidergar, D. Dam operations may improve aquatic habitat and offset negative effects of climate change. J. Environ. Manag. 2018, 213, 126–134. [Google Scholar] [CrossRef] [PubMed]
  14. He, W.; Lian, J.; Zhang, J.; Yu, X.; Chen, S. Impact of intra-annual runoff uniformity and global warming on the thermal regime of a large reservoir. Sci. Total Environ. 2019, 658, 1085–1097. [Google Scholar] [CrossRef] [PubMed]
  15. Shen, Y.; Wang, P.; Wang, C.; Yu, Y.; Kong, N. Potential causes of habitat degradation and spawning time delay of the Chinese sturgeon (Acipenser sinensis). Ecol. Inform. 2018, 43, 96–105. [Google Scholar] [CrossRef]
  16. Boskidis, I.; Kokkos, N.; Sapounidis, A.; Triantafillidis, S.; Kamidis, N.; Koutrakis, E.; Sylaios, G.K. Ecohydraulic modelling of Nestos River Delta under low flow regimes. Ecohydrol. Hydrobiol. 2018, 18, 391–400. [Google Scholar] [CrossRef]
  17. Forbes, V.E.; Railsback, S.; Accolla, C.; Birnir, B.; Bruins, R.J.F.; Ducrot, V.; Galic, N.; Garber, K.; Harvey, B.C.; Jager, H.I.; et al. Predicting impacts of chemicals from organisms to ecosystem service delivery: A case study of endocrine disruptor effects on trout. Sci. Total Environ. 2019, 649, 949–959. [Google Scholar] [CrossRef] [PubMed]
  18. Zhang, Q.; Zhang, Z.; Shi, P.; Singh, V.P.; Gu, X. Evaluation of ecological instream flow considering hydrological alterations in the Yellow River basin, China. Glob. Planet. Chang. 2018, 160, 61–74. [Google Scholar] [CrossRef]
  19. Liu, C.; Zhao, C.; Xia, J.; Sun, C.; Wang, R.; Liu, T. An instream ecological flow method for data-scarce regulated rivers. J. Hydrol. 2011, 398, 17–25. [Google Scholar] [CrossRef]
  20. Muñoz-Mas, R.; Martínez-Capel, F.; Alcaraz-Hernández, J.D.; Mouton, A.M. Can multilayer perceptron ensembles model the ecological niche of freshwater fish species? Ecol. Model. 2015, 309–310, 72–81. [Google Scholar] [CrossRef]
  21. Wang, X.; Hao, G.; Yang, Z.; Liang, P.; Cai, Y.; Li, C.; Sun, L.; Zhu, J. Variation analysis of streamflow and ecological flow for the twin rivers of the Miyun Reservoir Basin in northern China from 1963 to 2011. Sci. Total Environ. 2015, 536, 739–749. [Google Scholar] [CrossRef] [PubMed]
  22. Fu, X.; Lu, D.; Jin, G. Calculation of flow field and analysis of spawning sites for Chinese sturgeon in the downstream of Gezhouba Dam. J. Hydrodyn. 2007, 19, 78–83. [Google Scholar] [CrossRef]
  23. Lange, C.; Schneider, M.; Mutz, M.; Haustein, M.; Halle, M.; Seidel, M.; Sieker, H.; Wolter, C.; Hinkelmann, R. Model-based design for restoration of a small urban river. J. Hydro-Environ. Res. 2015, 9, 226–236. [Google Scholar] [CrossRef] [Green Version]
  24. Yi, Y.; Cheng, X.; Yang, Z.; Wieprecht, S.; Zhang, S.; Wu, Y. Evaluating the ecological influence of hydraulic projects: A review of aquatic habitat suitability models. Renew. Sustain. Energy Rev. 2017, 68, 748–762. [Google Scholar] [CrossRef]
  25. Wang, P.; Shen, Y.; Wang, C.; Hou, J.; Qian, J.; Yu, Y.; Kong, N. An improved habitat model to evaluate the impact of water conservancy projects on Chinese sturgeon (Acipenser sinensis) spawning sites in the Yangtze River, China. Ecol. Eng. 2017, 104, 165–176. [Google Scholar] [CrossRef]
  26. Yao, W.; Chen, Y. Assessing three fish species ecological status in Colorado River, Grand Canyon based on physical habitat and population models. Math. Biosci. 2018, 298, 91–104. [Google Scholar] [CrossRef] [PubMed]
  27. Belgiorno, V.; Naddeo, V.; Scannapieco, D.; Zarra, T.; Ricco, D. Ecological status of rivers in preserved areas: Effects of meteorological parameters. Ecol. Eng. 2013, 53, 173–182. [Google Scholar] [CrossRef]
  28. Akter, A.; Tanim, A.H. A modeling approach to establish environmental flow threshold in ungauged semidiurnal tidal river. J. Hydrol. 2018, 558, 442–459. [Google Scholar] [CrossRef]
  29. Zingraff-Hamed, A.; Noack, M.; Greulich, S.; Schwarzwälder, K.; Pauleit, S.; Wantzen, K. Model-Based Evaluation of the Effects of River Discharge Modulations on Physical Fish Habitat Quality. Water 2018, 10, 374. [Google Scholar] [CrossRef]
  30. Boavida, I.; Dias, V.; Ferreira, M.T.; Santos, J.M. Univariate functions versus fuzzy logic: Implications for fish habitat modeling. Ecol. Eng. 2014, 71, 533–538. [Google Scholar] [CrossRef]
  31. Zhang, P.; Yang, Z.; Cai, L.; Qiao, Y.; Chen, X.; Chang, J. Effects of upstream and downstream dam operation on the spawning habitat suitability of Coreius guichenoti in the middle reach of the Jinsha River. Ecol. Eng. 2018, 120, 198–208. [Google Scholar] [CrossRef]
  32. Mouton, A.M.; Alcaraz-Hernández, J.D.; de Baets, B.; Goethals, P.L.M.; Martínez-Capel, F. Data-driven fuzzy habitat suitability models for brown trout in Spanish Mediterranean rivers. Environ. Model. Softw. 2011, 26, 615–622. [Google Scholar] [CrossRef]
  33. Fukuda, S.; de Baets, B.; Mouton, A.M.; Waegeman, W.; Nakajima, J.; Mukai, T.; Hiramatsu, K.; Onikura, N. Effect of model formulation on the optimization of a genetic Takagi–Sugeno fuzzy system for fish habitat suitability evaluation. Ecol. Model. 2011, 222, 1401–1413. [Google Scholar] [CrossRef]
  34. Li, R.; Chen, Q.; Tonina, D.; Cai, D. Effects of upstream reservoir regulation on the hydrological regime and fish habitats of the Lijiang River, China. Ecol. Eng. 2015, 76, 75–83. [Google Scholar] [CrossRef]
  35. Yi, Y.; Cheng, X.; Wieprecht, S.; Tang, C. Comparison of habitat suitability models using different habitat suitability evaluation methods. Ecol. Eng. 2014, 71, 335–345. [Google Scholar] [CrossRef]
  36. Liu, F.; Lin, T.; Huang, D.; Perng, M.; Chiu, L. An automated system for egg collection, hatching, and transfer of larvae in a freshwater finfish hatchery. Aquaculture 2000, 182, 137–148. [Google Scholar] [CrossRef]
  37. Zhao, Z.; Dong, S.; Wang, F.; Tian, X.; Gao, Q. Respiratory response of grass carp (Ctenopharyngodon idellus) to temperature changes. Aquaculture 2011, 322, 128–133. [Google Scholar] [CrossRef]
  38. Feng, Z.; Niu, W.; Cheng, C. Optimization of hydropower reservoirs operation balancing generation benefit and ecological requirement with parallel multi-objective genetic algorithm. Energy 2018, 153, 706–718. [Google Scholar] [CrossRef]
  39. Liu, Y.; Qin, H.; Mo, L.; Wang, Y.; Chen, D.; Pang, S.; Yin, X. Hierarchical flood operation rules optimization using multi-objective cultured evolutionary algorithm based on decomposition. Water Resour. Manag. 2019, 33, 337–354. [Google Scholar] [CrossRef]
  40. Muñoz-Mas, R.; Marcos-Garcia, P.; Lopez-Nicolas, A.; Martínez-García, F.J.; Pulido-Velazquez, M.; Martínez-Capel, F. Combining literature-based and data-driven fuzzy models to predict brown trout (Salmo trutta L.) spawning habitat degradation induced by climate change. Ecol. Model. 2018, 386, 98–114. [Google Scholar] [CrossRef]
  41. Kurup, R.G.; Hamilton, D.P.; Phillips, R.L. Comparison of two 2-dimensional, laterally averaged hydrodynamic model applications to the Swan River Estuary. Math. Comput. Simul. 2000, 51, 627–638. [Google Scholar] [CrossRef]
  42. Zhang, Z.; Sun, B.; Johnson, B.E. Integration of a benthic sediment diagenesis module into the two dimensional hydrodynamic and water quality model—CE-QUAL-W2. Ecol. Model. 2015, 297, 213–231. [Google Scholar] [CrossRef]
  43. Dong, L.; Liu, J.; Du, X.; Dai, C.; Liu, R. Simulation-based risk analysis of water pollution accidents combining multi-stressors and multi-receptors in a coastal watershed. Ecol. Indic. 2018, 92, 161–170. [Google Scholar] [CrossRef]
  44. Hoque, M.A.; Perrie, W.; Solomon, S.M. Evaluation of two spectral wave models for wave hindcasting in the Mackenzie Delta. Appl. Ocean Res. 2017, 62, 169–180. [Google Scholar] [CrossRef] [Green Version]
  45. Purba, J.H.; Tjahyani, D.T.S.; Ekariansyah, A.S.; Tjahjono, H. Fuzzy probability based fault tree analysis to propagate and quantify epistemic uncertainty. Ann. Nucl. Energy 2015, 85, 1189–1199. [Google Scholar] [CrossRef]
  46. Liu, X.; Feng, X.; Pedrycz, W. Extraction of fuzzy rules from fuzzy decision trees: An axiomatic fuzzy sets (AFS) approach. Data Knowl. Eng. 2013, 84, 1–25. [Google Scholar] [CrossRef]
  47. Van Broekhoven, E.; Adriaenssens, V.; de Baets, B.; Verdonschot, P.F.M. Fuzzy rule-based macroinvertebrate habitat suitability models for running waters. Ecol. Model. 2006, 198, 71–84. [Google Scholar] [CrossRef]
  48. Fukuda, S. Consideration of fuzziness: Is it necessary in modelling fish habitat preference of Japanese medaka (Oryzias latipes)? Ecol. Model. 2009, 220, 2877–2884. [Google Scholar] [CrossRef]
  49. Li, G.; Sun, S.; Zhang, C.; Liu, H.; Zheng, T. Evaluation of flow patterns in vertical slot fishways with different slot positions based on a comparison passage experiment for juvenile grass carp. Ecol. Eng. 2019, 133, 148–159. [Google Scholar] [CrossRef]
  50. Šetlíková, I.; Bláha, M.; Edwards-Jonášová, M.; Dvořák, J.; Burianová, K. Diversity of phytophilous macroinvertebrates in polycultures of semi-intensively managed fishponds. Limnologica 2016, 60, 59–67. [Google Scholar] [CrossRef]
  51. Xu, N.; Li, M.; Fu, Y.; Zhang, X.; Dong, J.; Liu, Y.; Zhou, S.; Ai, X.; Lin, Z. Effect of temperature on plasma and tissue kinetics of doxycycline in grass carp (Ctenopharyngodon idella) after oral administration. Aquaculture 2019, 511, 734204. [Google Scholar] [CrossRef]
Figure 1. Study area.
Water 11 02034 g001
Figure 2. A graph of annual reservoir inflow and water temperature in the study area.
Water 11 02034 g002
Figure 3. A graph of habitat model framework.
Water 11 02034 g003
Figure 4. Reservoir grid model.
Water 11 02034 g004
Figure 5. Habitat grid model.
Water 11 02034 g005
Figure 6. The modeling for the fuzzy inference process.
Water 11 02034 g006
Figure 7. Illustration of the fuzzy inference process.
Water 11 02034 g007
Figure 8. Results of thermal stratification simulation: (a) Initial thermal stratification of the reservoir; (b) inflow, 40 m3/s and outflow, 40 m3/s (from left to right: 1 day, 3 days, 5 days); (c) inflow, 100 m3/s and outflow, 100 m3/s (from left to right: 1 day, 3 days, 5 days); (d) inflow, 140 m3/s and outflow, 140 m3/s (from left to right: 1 day, 3 days, 5 days); (e) inflow, 100 m3/s and outflow, 80 m3/s (from left to right: 1 day, 3 days, 5 days); (f) inflow, 100 m3/s and outflow, 120 m3/s (from left to right: 1 day, 3 days, 5 days).
Water 11 02034 g008aWater 11 02034 g008b
Figure 9. The spatial distribution of velocity and water depth under different reservoir outflows: (a) velocity and (b) water depth.
Water 11 02034 g009
Figure 10. Output for habitat suitability index (HSI) after defuzzification. (a) HSI of velocity and water depth, (b) HSI of velocity and water temperature lag time, and (c) HSI of water depth and water temperature lag time.
Water 11 02034 g010
Figure 11. Weighted usable area (WUA) curves for C. idella in the study area.
Water 11 02034 g011
Figure 12. The spatial distribution of HSI under different inflow and outflow scenarios (inflow is equal to outflow).
Water 11 02034 g012
Figure 13. The spatial distribution of HSI under different outflow scenarios.
Water 11 02034 g013
Figure 14. The spatial distribution of HSI under different inflow scenarios.
Water 11 02034 g014
Figure 15. The main distribution area of C. idella spawning.
Water 11 02034 g015
Table 1. Fuzzy rule base representing the habitat suitability index (HSI) for the spawning of Ctenopharyngodon idella (C. idella).
VelocityWater DepthTimeHSIVelocityWater DepthTimeHSI
VLVLVLMVLVLLL
LVLVLHLVLLM
HVLVLHHVLLM
VHVLVLMVHVLLL
VLLVLHVL LLM
LLVLVHLLLVH
HLVLVHHLLVH
VHLVLHVHLLM
VLHVLHVLHLM
LHVLVHLHLVH
HHVLVHHHLVH
VHHVLHVHHLM
VLVHVLMVLVHLL
LVHVLHLVHLM
HVHVLHHVHLM
VHVHVLMVHVHLL
VLVLHLVLVLVHVL
LVLHLLVLVHVL
HVLHLHVLVHVL
VHVLHLVHVLVHVL
VLLHLVLLVHVL
LLHHLLVHL
HLHHHLVHL
VHLHLVHLVHVL
VLHHLVLHVHVL
LHHHLHVHL
HHHHHHVHL
VHHHLVHHVHVL
VLVHHLVLVHVHVL
LVHHLLVHVHVL
HVHHLHVHVHVL
VHVHHLVHVHVHVL
Note: Fuzzy sets are usually expressed by linguistic description such as ”very low”, ”low”, ”high” and ”very high”. VL, L, H, VH indicate ”very low”, ”low”, ”high” and ”very high”, respectively.
Table 2. The time taken to reach suitable ecological water temperature under different inflow and outflow scenarios.
Time (day)Outflow (m3/s)
20406080100120140160
Inflow (m3/s)201310.686.46.2///
4010.89.87.265.75.3//
60/7.76.55.65.24.84.5/
80/6.365.44.84.54.34.2
100//5.654.64.34.14
120//4.84.64.343.93.8
140///4.54.13.93.73.6
160////43.83.63.5
Note: / indicates that this scheduling scenario does not meet the requirements. According to this scenario, the water level is higher or lower than the water level limit.
Table 3. Hydraulic habitat suitability (HHS) under different inflow and outflow scenarios.
HHSOutflow (m3/s)
20406080100120140160
Inflow (m3/s)200.0770.0790.3000.4970.586///
400.0770.0790.3610.5290.6230.631//
60/0.2640.4140.5530.6510.6550.640/
80/0.3640.4550.5630.6690.6750.6590.647
100//0.4780.5810.6810.6930.6860.669
120//0.5170.6010.7050.7260.6960.674
140///0.6080.7230.7290.7000.678
160////0.7280.7310.7020.680
Note: / indicates that this scheduling scenario does not meet the requirements. According to this scenario, the water level is higher or lower than the water level limit.
Table 4. WUA (HSI > 0.6) under different inflow and outflow scenarios.
WUA (HSI>0.6)
(m3)
Outflow (m3/s)
20406080100120140160
Inflow (m3/s)200002776461698///
40000350698671499344//
60/0930842825108387111137103931/
80/29791403847581119950119168109860101351
100//1843255961124693124188117030106967
120//2723669335130415131471118182107612
140///74387134015132086119230108050
160////135396132667120162108712
Note: / indicates that this scheduling scenario does not meet the requirements. According to this scenario, the water level is higher or lower than the water level limit.

