1. Introduction
Efficient management of water resources and optimization of energy requirements are key aspects of sustainable development and urban resilience, particularly for watersheds that must cope with industrial and agricultural demands, along with drought and water pollution. One approach to alleviate such scenarios considers the improvement in design and management of water distribution networks (WDNs).
Optimization of a WDN requires comprehensive knowledge about the system and includes several important factors, such as pipe sizing, distribution demands, pressure uniformity, water quality, improvements in network efficiency by District Metering Areas, etc. Currently, the challenge is to consider all the features in the mathematical models, but it is infeasible to compile a complete list of all decision variables where each possible solution is evaluated because the problem formulation becomes more complex and the search space grows in size. Therefore, the development of tools that optimize the physical behavior of a WDN will facilitate the study and evaluation of improvements in their design, operation, and exploitation. Consequently, efficient guided search methods should be used for optimization of WDNs.
Metaheuristic methods such as multi-objective evolutionary algorithms (MOEAs) have been successfully used to optimize WDNs [
1,
2]. The versatility of these algorithms has allowed their use for problems related to water resources such as leak detection [
3,
4], optimal pipe sizing [
5,
6], water quality [
7], water demand [
8], drainage networks design [
9], irrigation networks [
10,
11], etc. The success of such algorithms lies in their capacity to explore the space of feasible solutions and generate an approximation to the set of solutions in a single execution. Several methods implement different searching strategies, and each method possesses its own set of configurable parameters, whose setting determines the proper performance of the algorithm. Therefore, selection of a MOEA and its set of parameters that optimize the performance of a given water network is not a trivial task, being in itself a multi-objective problem.
Regarding management, WDNs are inherently complex systems owing to the requirements that must be met by the network (e.g., nodal pressure and water flows), and the set of operational variables that regulate its performance, including pump operation schedules. Noteworthy, the requirements and operational variables involved in management of the network are time dependent. Therefore, analysis of the network is often restricted to a discrete time frame, usually within a nominal day. Such complexity has motivated the use of computational methods to optimize the network performance in a given time frame [
1]. Although the hydraulic performance of the network can be successfully addressed through available numerical routines such as EPANET [
12], operational decisions that are key to both the hydraulic behavior and maintenance costs of the network are often decided through inference and practical experience.
Since 1970s, numerous researchers have focused on the pump operation of WDNs. Optimal operation of pumps is often formulated as a cost optimization problem and it has been traditionally addressed by single-objective cost functions [
1,
13]. However, a more flexible approach considers a multi-objective optimization problem that simultaneously addresses both operational costs and coupled pump scheduling operation [
2,
14,
15], in an effort to improve characterization of service life and maintenance costs of the network. Other objectives considered, apart from operational costs, include the difference between initial and final water levels in storage tanks [
16], water quality [
17], greenhouse gas emissions associated with pump operations [
18], etc.
Contrary to single-objective optimization problems, there is no single solution in a multi-objective optimization problem, and the concept of dominance only establishes a partial order between the set of feasible solutions, also known as the Pareto front. In addition, visual inspection is insufficient to judge the quality of the different approximations to the Pareto front, and the use of statistical inference becomes necessary to provide some certainty on the performance superiority of a given MOEA with respect to another.
Given this context, the selection and assessment of a proper MOEA to address optimization of a WDN necessarily requires the ability to (i) efficiently implement a set of algorithms for a given network problem, and (ii) to use proper quality indicators to assess and compare the performance of each algorithm to approximate the Pareto front.
jHawanet is based on integration of two independent tools in a single project. So, EPANET is used as a hydraulic network solver and jMetal is used as optimization engine. jMetal is an object-oriented Java-based framework designed specifically for multi-objective optimization of complex problems. The collaborative work of EPANET and jMetal presents many advantages, facilitating the implementation of solution representations, operators, problems, density estimators, parameters tuning, etc. The effective coupling of both libraries is not trivial. Such situation is in our impression a major drawback for the widespread adoption of multi-objective optimization algorithms by researchers and engineers.
Other programs for water network optimization such as GAnet [
19] or Gondwana [
20] have been developed previously. These programs integrate a hydraulic network solver model with an optimization algorithm but they do not allow to evaluate the performance of different algorithms for a single case study. Among others, Jetmarova et al. [
21] highlights as research challenges developing methods for objective comparison of multiple optimization techniques and to evaluate the sensitivity of solutions and here is another contribution of our work. Noteworthy, jHawanet allows to determine the performance of the main algorithms available in the literature through a fair comparison, since some quality indicators to assess the performance of the algorithms are included into the framework. On this regard, the contributions of our work can be summarized in the following: A novel project for the implementation of MOEAs to optimize WDNs is developed. The project allows coupling between the jMetal framework for evolutionary optimization and the EPANET Programmer’s Toolkit library (EPAtoolkit). Finally, jMetal is used to compare three metaheuristic algorithms for solving a classic multi-objective optimization problem in WDN, pump operation.
The remainder of the paper is organized as follows: Details of the jMetal framework and the EPAtoolkit library are presented first, followed by a description of the linking project, including the implemented classes for efficient coupling between the framework and the library. An example application is later presented by comparing different MOEAs for the optimization of case studies for water distribution networks that include pump scheduling. The results identify the most efficient of the three analyzed algorithms considering the quality indicators available in jMetal.
2. jHawanet: Programming Environment
Before discussing the implemented project, it is convenient to first introduce the main characteristics of the EPAToolkit library and the jMetal framework, along with the rationale behind their selection. This brief introduction is followed by a description of the coupling project, including the developed classes for the description of the hydraulic network and its multi-objective optimization under given constraints.
2.1. EPAToolkit: Library for Modeling of Water Distribution Networks
The EPANET program, developed by the U.S. Environmental Protection Agency (USEPA), has become the de facto standard in both industry and academia for the hydraulic simulation and analysis of water distribution networks [
12]. The program is free for distribution, and includes the EPAToolkit dynamic link library (DLL), which allows programmers to personalize the EPANET engine module according to their own particular needs. The latest version, launched in March 2008, is originally written in the C programming language and has separate code modules for input data processing, hydraulic analysis, water-quality analysis, solving systems of linear equations with sparse matrices, and report generation. In total the library contains 55 functions and 104 variables that are available for input parameters.
This work employs EPAToolkit in optimization routines that require iterative hydraulic simulations to obtain a set of solutions. In this regard, a key advantage of EPAToolkit is the integration with additional libraries available in the programming environment, allowing implementation of sophisticated workflows, integration with complex optimization routines, and advanced statistical analysis of the hydraulic simulation results.
Originally, EPAToolkit was compiled for use in Windows 32-bit OS programming environments, allowing functions to be incorporated into a Windows DLL, such as Delphi Pascal 5.0, Visual Basic 6.0, etc. In order to use EPAToolkit in other programming languages (e.g., Java, Python), it would be necessary to generate a new header file with modifications to the types of data used by functions, variables and input parameters. This is not a trivial task, and consequently,
Section 2.3 explains how the connection was made and the importance of its interaction with the final jHawanet project.
2.2. jMetal: Framework for Multi-Objective Evolutionary Optimization
jMetal is an open-source framework for the implementation and assessment of both single-objective and multi-objective metaheuristics. The framework was developed in Java by Durillo et al. [
22], allowing for code flexibility, simplicity, extensibility, and portability [
23]. The framework is organized in four packages, named
jmetal-core,
jmetal-algorithm,
jmetal-problem, and
jmetal-exec. These packages contain the core functionalities, implemented methods, test functions, and experiments, respectively.
The jmetal-core package supports a wide range of decision variables, including binary, real, and integer representations, in addition to permutations and integer-real, real-binary, and integer-permutation hybrids. These variable representations give the researcher greater flexibility for codification of solutions and operators on multi-objective strategies.
The set of solutions found by a multi-objective evolutionary algorithm is stored in a primary archive, whereas the set of solutions that are non-dominated is stored in a second archive. This second archive is updated continuously and has the same size as the primary archive. Among the strategies to prune the second archive are crowding distance, hypervolume, and adaptative grid [
24]. All these strategies are supported by in the
jmetal-core package.
Starting from version 5.0 jMetal includes routines to obtain algorithm-specific information during runtime, including the size of the current population in a genetic algorithm, the current velocity of particles in a particle swarm optimization, and the current iteration, among others.
Additionally, jMetal supports computation of eleven quality indicators such as Spread, Epsilon, Hypervolume, and Generational Distance. These quality indicators assess the performance of such methods in terms of distribution and convergence of solutions in the Pareto front [
25]. In
Section 2.2.1 we expand on quality indicators in the context of multi-objective optimization.
The
jmetal-algorithm package offers implementations of well-known metaheuristic optimization algorithms such as NSGA-II, SPEA2, MOEA/D, and SMPSO, as well as recently proposed strategies such as NSGA-III, WASFGA, and ESPEA [
23]. These algorithms cover a variety of search strategies, which constitutes an ideal set for computing reference Pareto fronts, as well as benchmarking of newly developed methods.
The
jmetal-problem package contains implementations of well-known continuous multi-objective family test functions of ZDT, DTLZ, WFG [
26], the many objective-optimization families MAF and CDTLZ [
27], among others.
jMetal also allows calculation of distances in the decision and objective spaces, comparison metrics between two solutions based on ranking-base dominance, hypervolume contribution, and constraint violations through utility classes. A convenient utility is the class GenerateReferenceFrontFromFile, which computes a reference Pareto front from a set of different metaheuristic optimization algorithms.
Finally, the
jmetal-exec package assembles the required classes to conduct experiments. Once again, jMetal includes templates for these classes where we can set up the experiment options. Among them, we have the number of independent runs and threads, the list of problems and methods, and the quality indicators. jMetal generates statistics such as tables with the mean and the standard deviation, median and interquartile range (
IQR), the Friedman test results, and codes to conduct the Wilcoxon test and to generate boxplots in common statistical packages such as R.
Section 2.2.2 provides further details on the available statistical methods for multi-objective optimization.
In our judgement, the features implemented in jMetal make it the ideal framework to perform multi-objective evolutionary optimization of WDN. Given our choice of jMetal as the framework for optimization, the Java programing language was used for implementation of the coupling library.
2.2.1. Quality Indicators
Owing to their stochastic nature, a single MOEA will produce a different approximation to the Pareto front for a given instance of the same problem. Therefore, each algorithm possesses an underlying stochastic variable whose values approximate the Pareto front [
28].
A quality indicator attempts to measure the quality of a sampled approximation to the Pareto front in terms of (a) convergence, (b) distribution, or (c) a combination of both [
29], therefore allowing comparison between different MOEAs on a same problem. The indicator maps the approximation to the Pareto front to a real number, and allows statistical inference on the underlying stochastic distribution of the obtained number in order to compare performance [
30].
An ideal quality indicator should be strictly monotonic, invariant to the scaling of the objective functions, computationally affordable and applicable with the available information [
31]. Unfortunately none of the available quality indicators can either meet simultaneously the above properties, or simultaneously measure convergence and distribution [
29]. Therefore, the performance of a given multi-objective algorithm is often determined by a combination of indicators from different categories [
25,
28].
Table 1 summarizes the characteristics of the quality indicators considered for this study, namely Epsilon (
) [
32], Spread (
ISP) [
33], and Hypervolume
(IHV) [
15,
34,
35]. It is worth noting that jMetal can generate the best approximation to the Pareto front for a given algorithm and problem, performing in addition the stochastic analysis required to calculate a given quality indicator and perform statistical analysis.
2.2.2. Statistical Analysis
It is often convenient to summarize a random sample from a distribution using descriptive statistics of central tendency (e.g., median and mean) and dispersion (e.g., standard deviation, IQR). These measures are useful in describing general properties of the underlying distribution, but any formal analysis should also include inferential statistics.
Methods for inferential statistics can be grouped into parametric and non-parametric tests. The first group assumes that random samples come from statistical distributions with a fixed set of parameters (e.g., normal distribution). Such assumption is likely to be violated by samples coming from a MOEA result. On the other hand, non-parametric tests, by not assuming properties in the data, allow more rigorous comparisons between stochastic methods [
36].
To perform a formal hypothesis test, the level of significance α by which the null hypothesis will be rejected must be established
a-priori. Instead of setting a default value for α, an alternative consists of calculating the lowest level of significance that results in the rejection of the null hypothesis, also known as the p-value. The smaller the p-value, the stronger the evidence against the null hypothesis [
36].
Due to the stochastic component of MOEAs, each time a method is applied to the same problem, a different Pareto front approximation is obtained. In this sense, each optimizer has an associated random variable whose possible values approximate the Pareto front. The underlying statistical distribution of the variable is unknown and, in many cases, impossible to determine theoretically. This is the reason why empirical studies are the most common mechanism to assess performance of MOEAs [
28].
After running a MOEA multiple times in the same instance of a problem, a sample of approximate Pareto fronts is obtained. Therefore, comparing the performance of two MOEAs means comparing two samples of approximations. The most widely used approach in the literature is to map each sample of approximations to the Pareto front into a real value using quality indicators. The samples of values for the quality indicators are then used for statistical inference, in order to judge which algorithm is better at approximating the Pareto frontier of a given problem within the level of confidence provided by the calculated p-value.
2.3. Coupling Project between EPAToolkit and jMetal
Here we introduce the jHawanet project, which allows implementation and comparison of MOEAs for optimization problems on WDNs through the combination of jMetal and EPAToolkit.
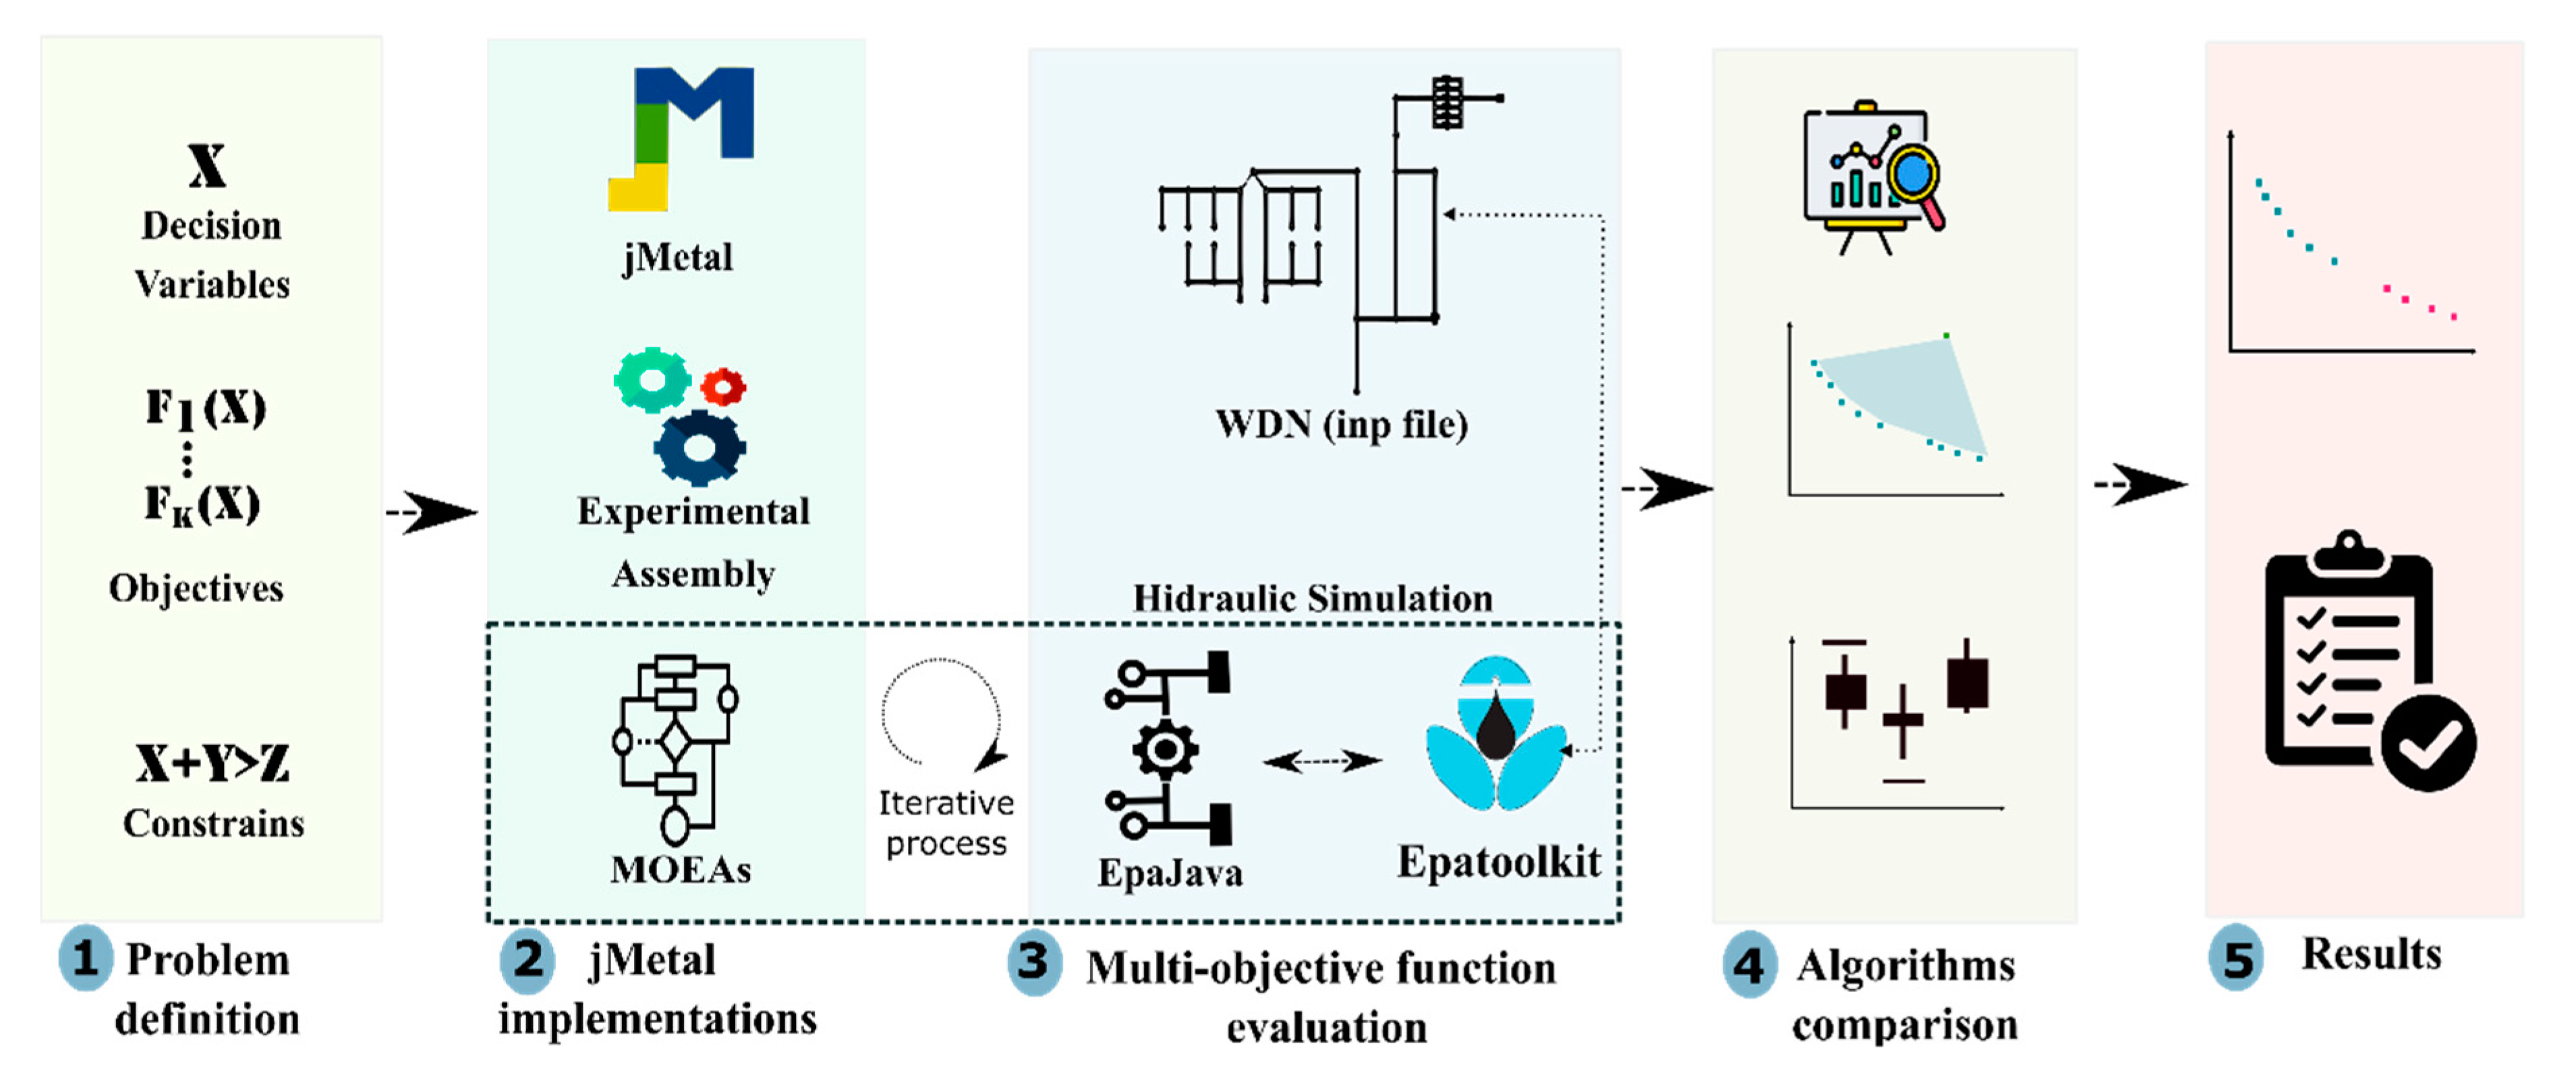
Figure 1 depicts the workflow in jHawanet to address multi-objective optimization problems in WDNs through evolutionary algorithms. The workflow considers five steps (represented with color shades in the figure), namely
Problem definition,
jMetal implementations,
Multi-objective function evaluation,
Algorithms comparison, and
Results.
The Problem Definition step allows to establish the decision variables, objective functions, and restrictions of the mathematical model.
The second step (jMetal Implementations) implements the optimization model as a problem class in jMetal and assembles the experiments. Here, we choose the MOEAs, the operators and general parameters, the quality indicators, and we establish the number of independent experiments to approximate the Pareto front. In this step it is also possible to select and/or generate new MOEAs, and modify their parameters and/or operators to values more suitable to the characteristics of the problem.
The third step (Multi-objective Function Evaluation) corresponds to the iterative evaluation of a solution set generated by a MOEA in the problem class of jMetal. For this purpose, we designed EpaJava, a coupling library that allows calls from Java to EPAToolkit. EpaJava was implemented through the Java Native Access library (JNA), allowing dynamic and native invocations of EPAToolkit. A set of classes were developed in the library to accurately represent the hydraulic components involved in the modeling of the WDN (e.g., pipes, pumps, reservoirs, tanks). Therefore, users familiar with EPAToolkit should be able to accurately model a network in the coupling library. In practice, the library loads the water network previously defined in the EPANET input file (first step), where the decision variables are dynamically modified according to the optimization model (second step).
After running the experiment, jMetal automatically generates the Pareto front approximation, calculates the required quality indicators, the statistical indexes, and summarizes them (Algorithms Comparison step). Finally, the information obtained from the Results step allows researchers to judge the more suitable set of MOEAs according to their optimization problem, but more importantly, it allows them to make informed decisions regarding operation of design of their WDNs.
3. Example Application: Pump Optimization Problem
We decided to test our coupling library on case studies of water distribution networks that include optimization of pumping regime. Briefly, the pumping regime problem consists of determining the optimal operation scheduling of pumps that supply water from a source to either storage tanks or demand nodes [
1].
From an optimization standpoint, the pumping regime problem corresponds to an NP-hard type of problem, highly non-linear and severely constrained, with time-dependent variables [
37]. Such properties invalidate the use of mathematical programming to address the optimization problem, opening the way to MOEAs.
Since it is not possible to know a-priori which multi-objective algorithm is sufficient to approximate the Pareto front of a given pumping regime problem, a reasonable approach involves implementing a set of algorithms that cover a wide range of search strategies. Therefore, we can verify a-posteriori which subset of search strategies, operators, and parameters are efficient in providing a well distributed and sufficient approximation to the Pareto front.
It is worth to note that the pumping regime problem for water distribution networks is particularly suited for our coupling library, since it allows straight-forward implementation and quality assessment of a set of multi-objective algorithms tasked with approximation of the Pareto front. For our test we have chosen the NSGA-II, SPEA2, and SMPSO multi-objective evolutionary algorithms to optimize the proposed case studies.
3.1. Problem Statement
The literature provides many optimization problems related to pumping operations in WDN. In this work, the problem statement for pumping regime in a water distribution network has been detailed extensively elsewhere [
1,
2]. Concretely, the problem can be posed as a two-objective optimization problem. The first objective is the minimization of energy costs. Equation 1 depicts the total energy cost
of a pump scheduling solution
S, where
represents the total energy consumption of
n pumps in operation during each time
t of a total of
NT periods. Meanwhile,
is the energy tariff at time
t. The second objective is the minimization of maintenance costs
detailed in Equation (2). The quantification of these costs is difficult and case dependent. In order to estimate it and according to the literature, the number of pump switches is used [
1,
2]. To perform the mathematical calculation,
is a binary variable equal to one when starting a pump that is turned off in the hour
t.
Note that S can be represented by a binary matrix of n rows by 24 columns (i.e., Snx24), where zero represents an off pump and one represents an on pump. Finally, the set of obtained solutions must meet a series of hydraulic and operational constraints that ensure their feasibility. Such constraints involve water mass and energy conservation at each node of the network, minimum pressure, and demand flow requirements at each node, as well as continuity of water levels in each reservoir from the end of a nominal day to the beginning of the next day.
3.2. Case Studies
Three benchmark networks were selected to optimize pump scheduling and to analyze the behavior of selected multi-objective algorithms. In this regard, Van Zyl, Baghmalek and Anytown networks have been tested by several researchers. Consequently, many solutions are available in the literature, which allows the results to be compared and the conclusions to be extended to networks with a search space of this order of magnitude. A brief description of each case study is provided below. The network components, as well as pipes, nodes, pumps, and valves specifications are presented in some referred papers. Additionally, Epanet files (.inp) are provided as
supplementary material.
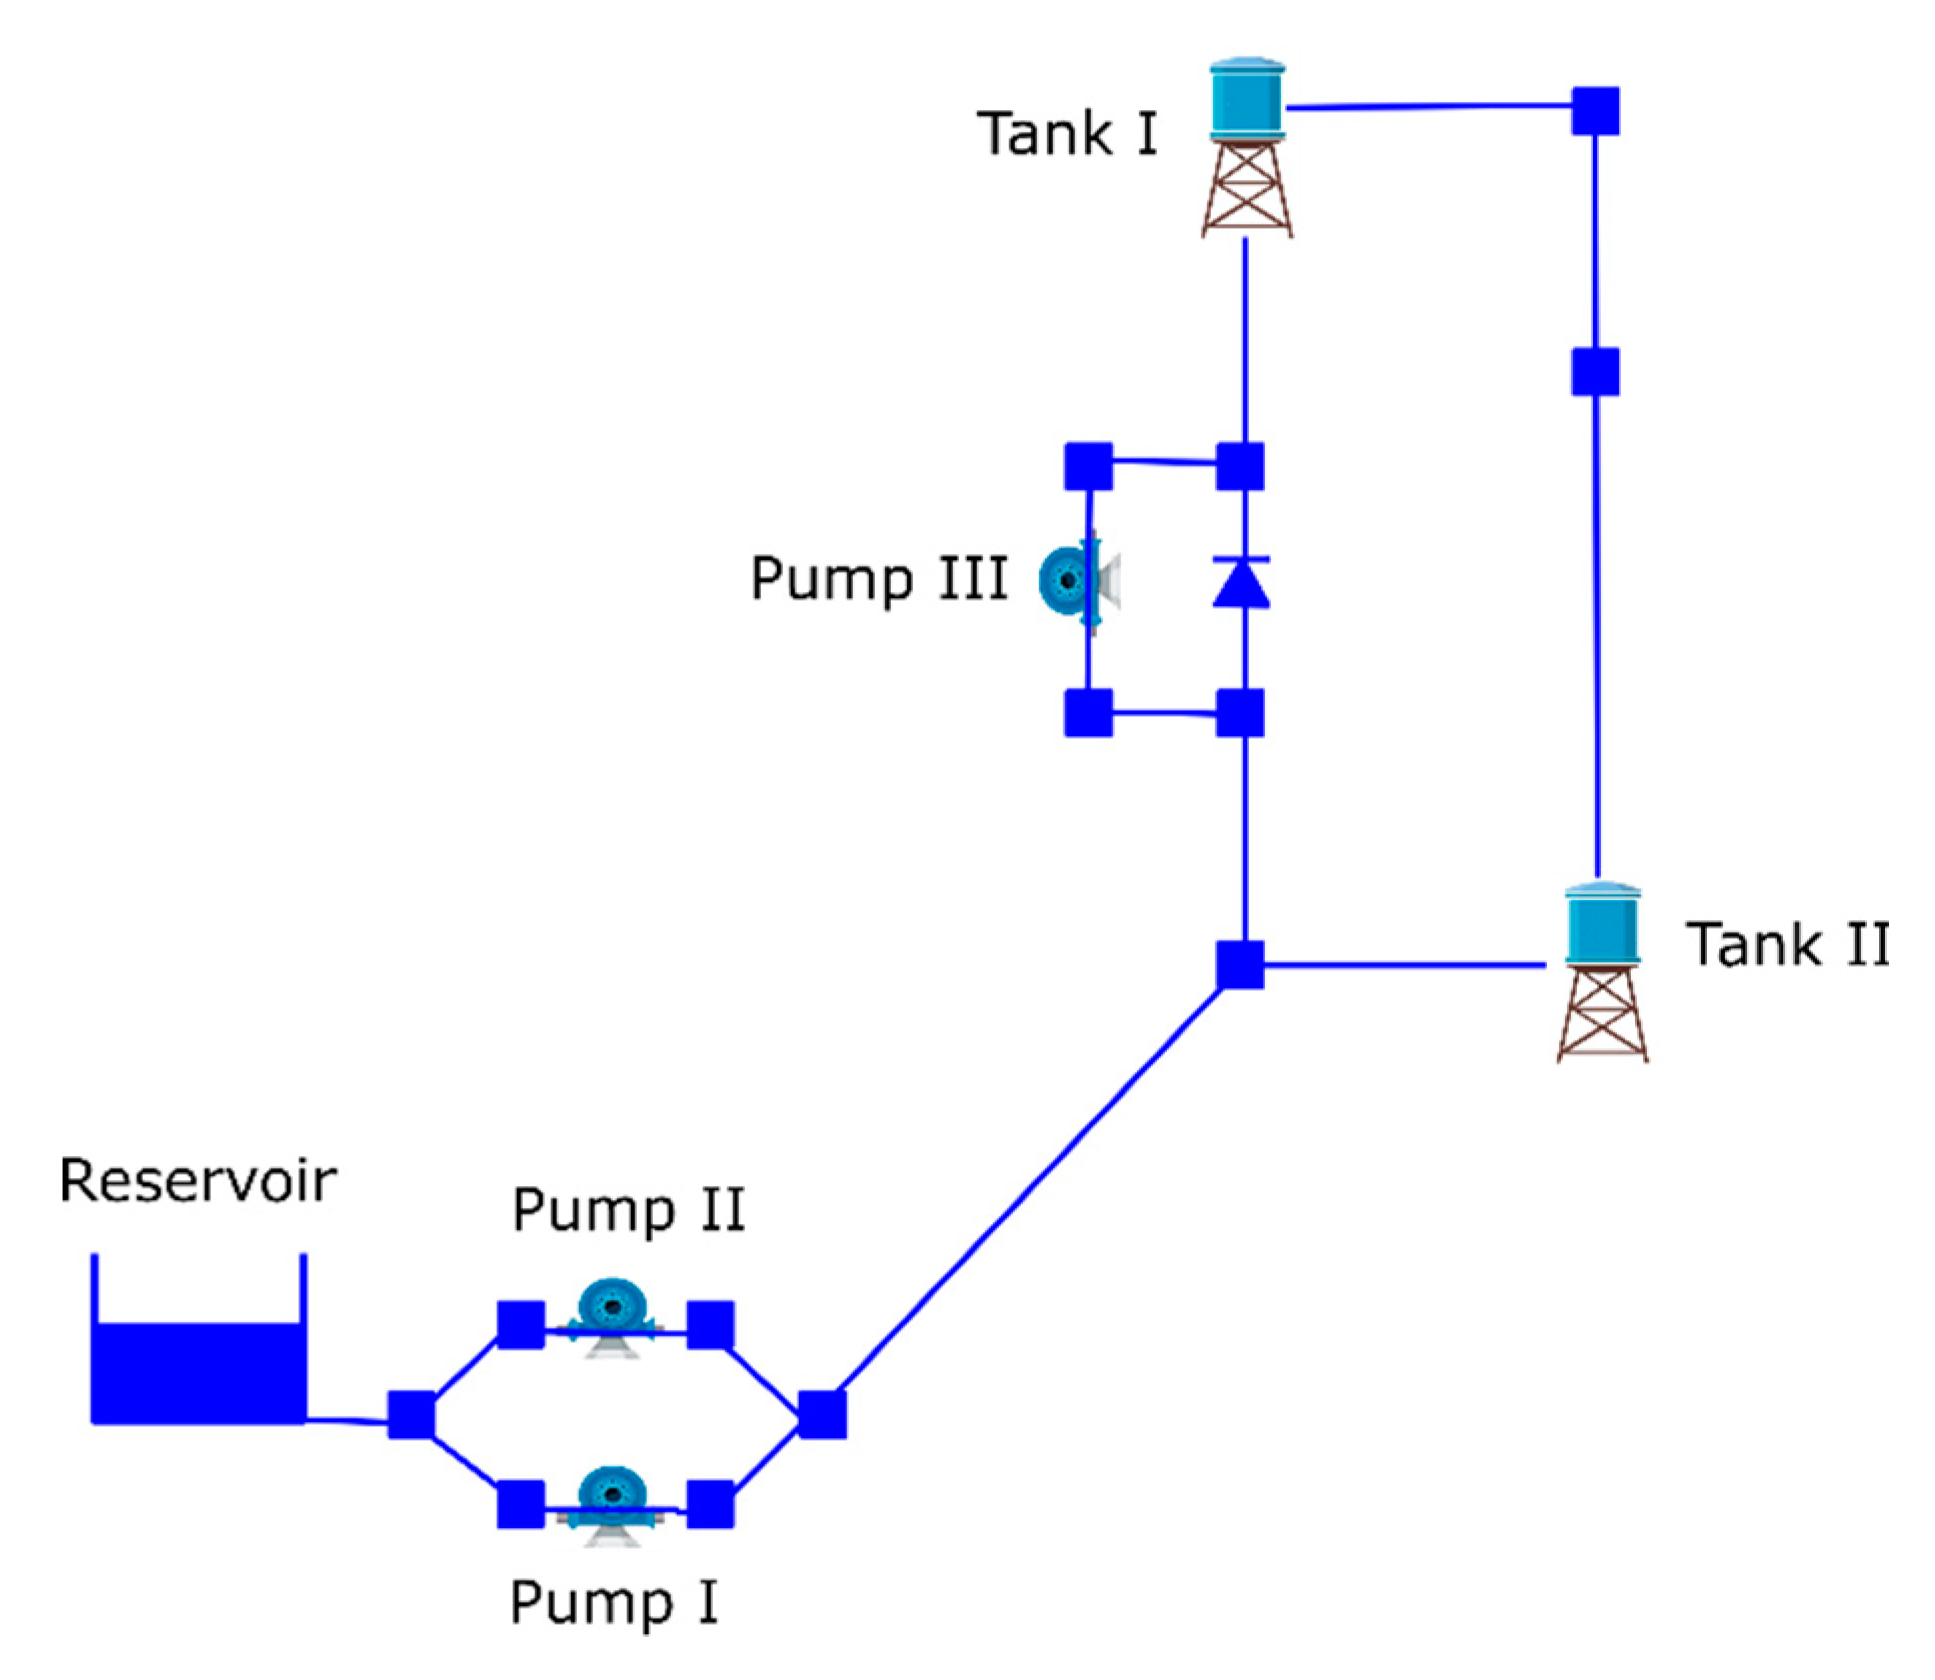
The Van Zyl network was proposed by Van Zyl [
14]. The network is depicted in
Figure 2, and consists of a reservoir that feeds two tanks at different elevations through three pumps. The pumping station at the reservoir contains two identical fixed pumps in parallel (Pumps I and II). The system also has a booster pump (pump III) located at higher elevation than tank II. The elevations of tanks I and II are 85 and 80 m, respectively, while the diameters are 20 and 25 m. The hydraulic time step and patterns time are 1 h and the total time analysis is 24 h. The minimum pressure at the nodes must be 15 mca. The main constraint in the tanks is that the water level has to be kept between an allowable minimum (H
min) and maximum (H
max). In this case, the minimum level is 0 m for both tanks, while the maximum levels are 5 m for tank I and 10 m for tank II. The initial levels are 4.5 and 9.5 m, respectively. Regarding the demand of the system, only the two nodes located between the tanks have demands. They vary reaching the highest level of consumption at 7:00 with a peak factor of 1.7 and at 18:00 with a peak factor of 1.5. The h 00:00, 13:00, and 24:00 have the lowest demands. In these cases, a factor of 0.5 is presented. Energy consumption tariffs have two variations. The first one, 0.0244 (
$/KWh) ranged from 00.00 to 07.00 h. From that time, the prices increase to 0.12 (
$/KWh).
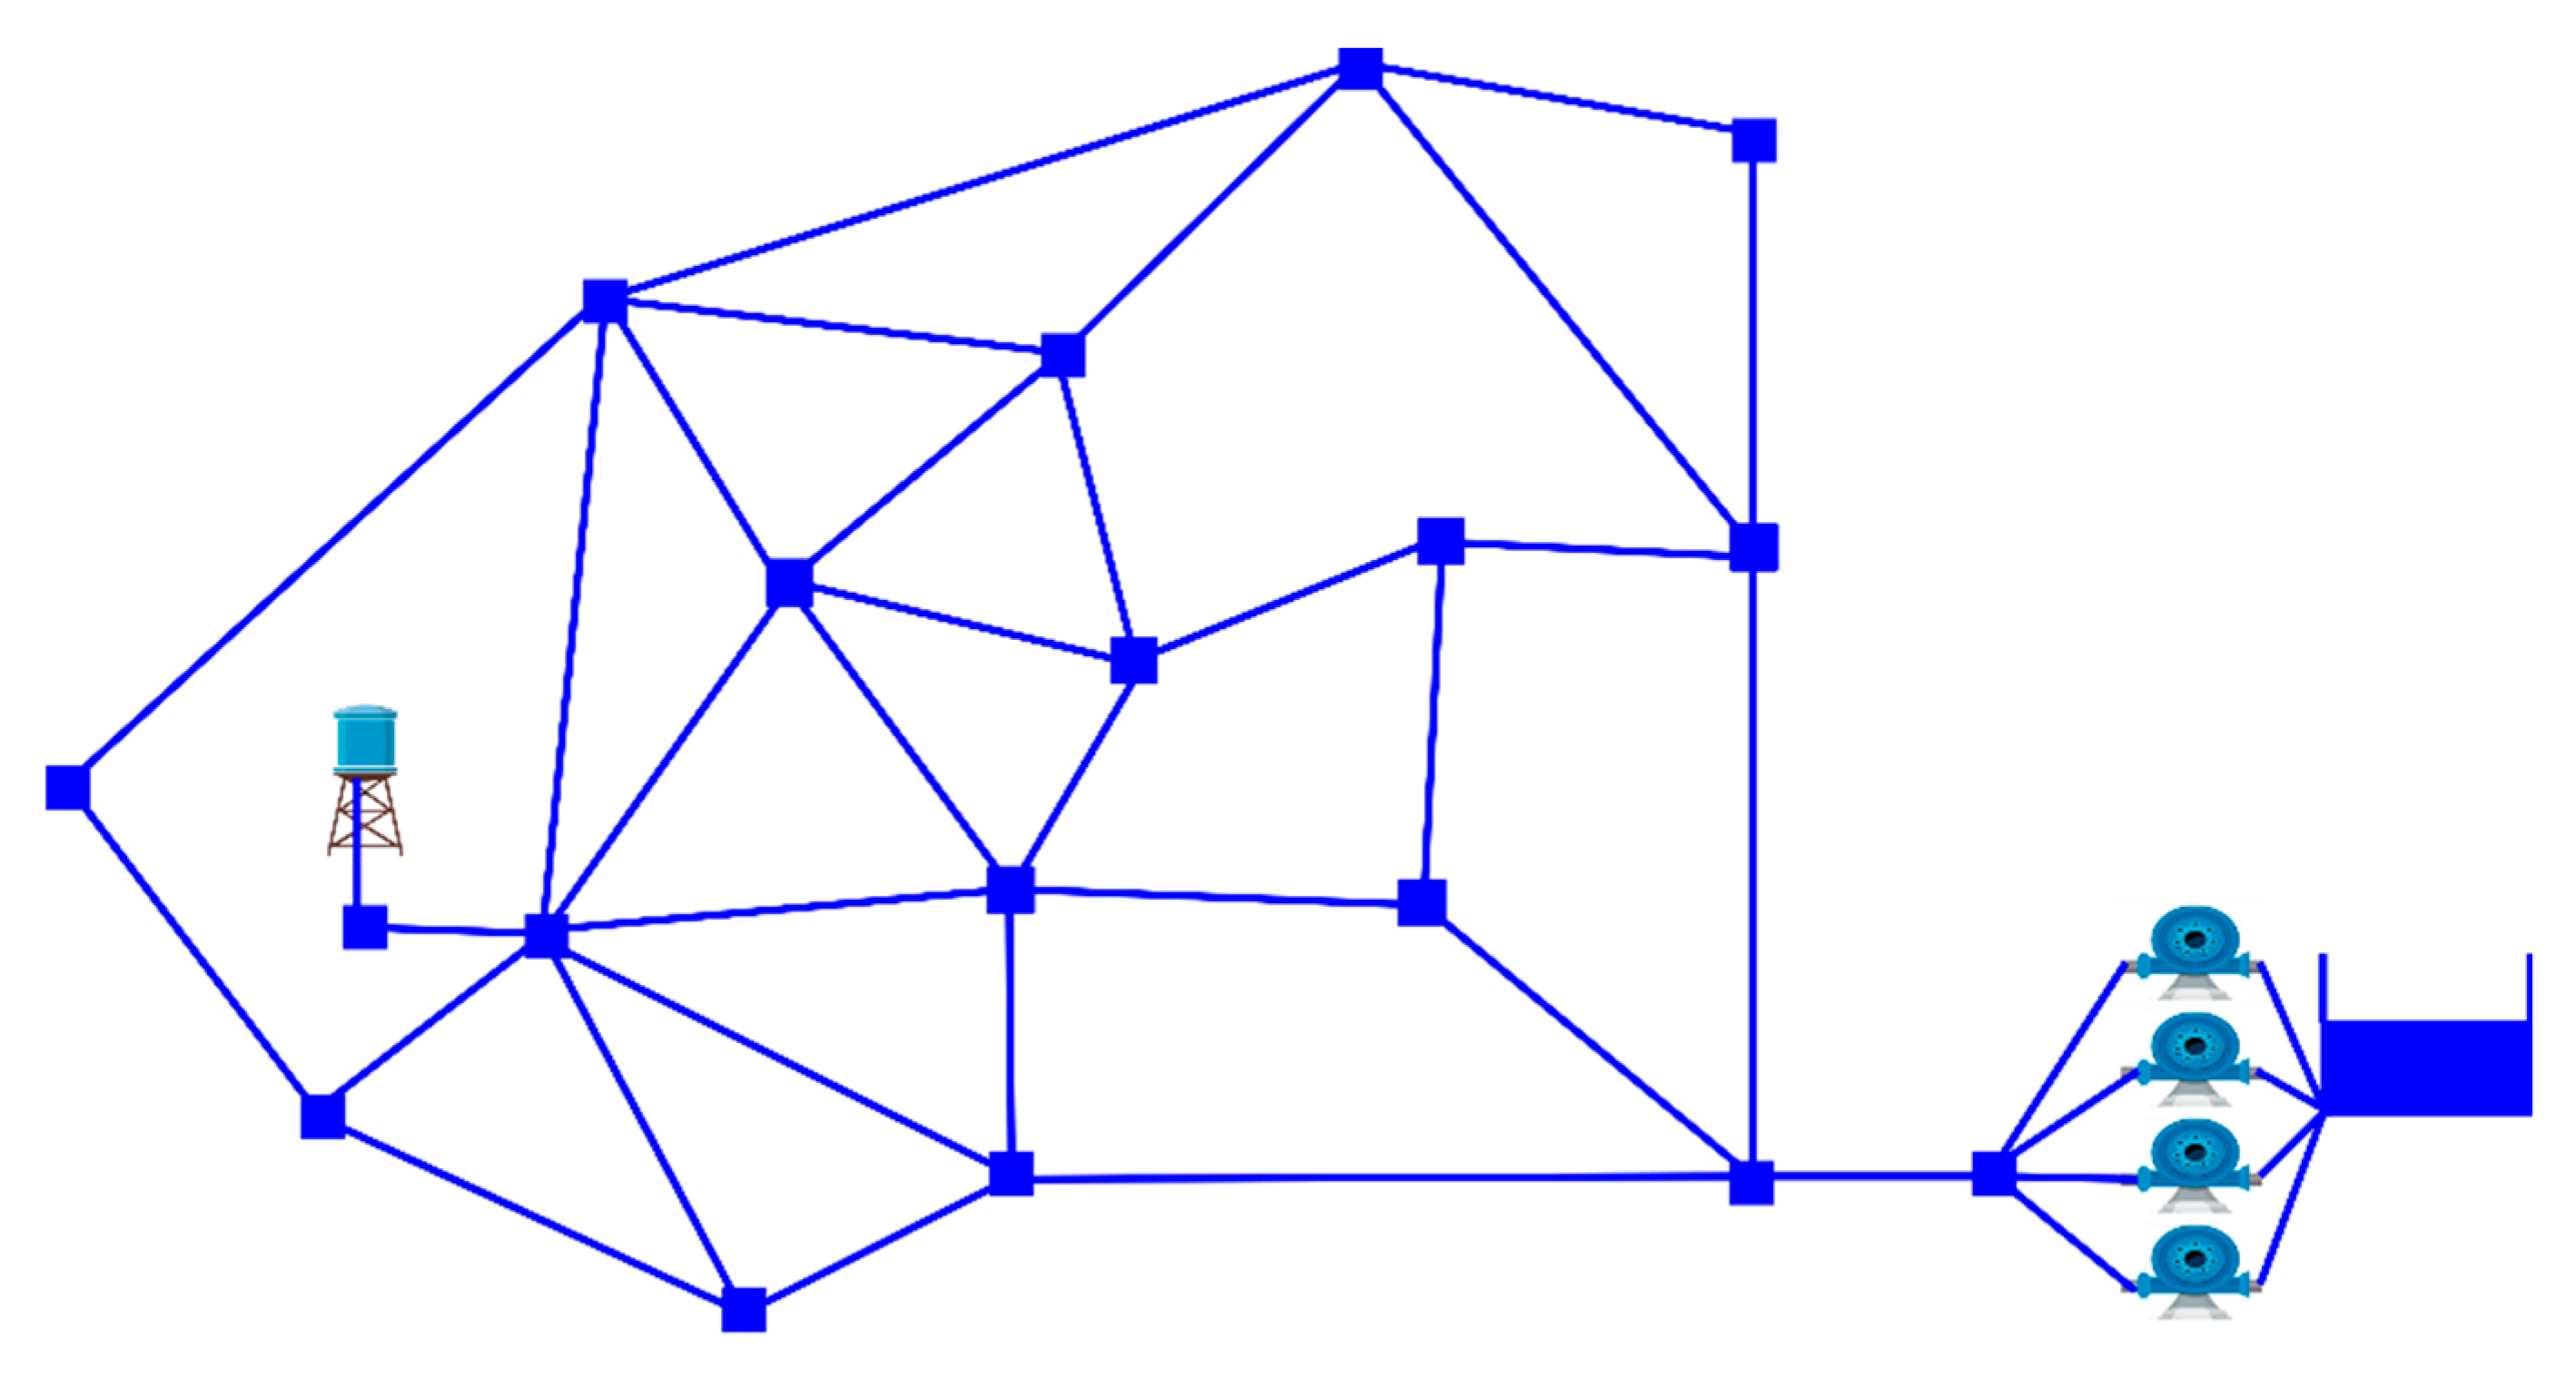
The second example entails an analysis of the Baghmalek network [
2], depicted in
Figure 3. This case study corresponds to a section of the drinking water supply of Baghmalek city, southwest of Iran. The network comprises a deposit reservoir with a fixed water level, one tank located at 760 m with a diameter of 4.63 m, six identical fixed speed pumps operating in parallel, 34 pipes, and 32 nodes that demand water. The highest consumption levels are located at 01:00 and 8:00. In these periods the peak factor reaches around 2.0. In other words, there is almost 200% consumption of considered demand. On the contrary, during the first three and last h of the day the use of water does not exceed 50% of the base demand. Regarding energy rates, they vary during the day and three loading intervals were considered; from 00:00 to 8:00 the price is 0.003 (
$/kWh) from 09:00 to 18:00, the price is 0.006 (
$/kWh) and finally from 19.00 onwards the price is 0.012 (
$/kWh). In addition, a charge of 0.48 (
$/KWh) is considered for the maximum electricity consumption during the 30 days of billing. The minimum required pressure head at the demand nodes is 15 m and the minimum and maximum allowed levels at the tank are 0.5 and 4.5 m, with an initial level of 4.5 m.
Finally, the Anytown network was proposed the first time by Walski [
38]. This network has been widely used as a bench-mark for pumping regime and network extension problems. The network is depicted in
Figure 4, and comprises 37 pipes, 18 nodes, one tank and one reservoir. The network is fed by a single pumping station containing four identical pumps. The tank elevation and diameter are 65.53 m and 12.2 m, respectively. The hydraulic time step and patterns time are one hour. The hourly demands are cyclical and have three increasing intervals from 01:00, 11:00, and 21.00 h, with ranges between 40% and 120% of the demand. The greatest demands are concentrated in the 09:00, 10:00, 11:00, 19:00, and 20:00 h. Finally, the energy consumption tariff varies in two levels from 0.0244 to 0.1194 (
$/KWh). This increase in the prices starts at 08:00 h and ends at midnight. Given the physical and demand data, the network must be able to supply at least 15 mca at the nodes. The main constraint is that the water level in the tank has to be kept between the allowable minimum (67.67 m) and maximum (76.2 m). As there are four fixed speed pumps, the total number of possible pump combinations is 2
4 during each h of the day.
4. Experimental Results and Discussion
The parameters values for NSGA-II, SPEA2, and SMPSO methods were drawn from their original articles. As seen in
Table 2, the methods share the same parameters settings. This ensures a fair comparison among methods because it is possible to establish which search strategy performs better in a specific type of problem.
The population size was set to 100 solutions, the same size was set as the maximum primary archive for SMPSO. The crossover operator for NSGA-II and SPEA2 was an integer version of the SBX with distribution index and as crossover rate (probability). All methods implement an integer version of the polynomial mutation operator, in this case with a distribution index of and a mutation rate of , where is the number of decision variables (solution dimensionality).
We execute 30 independent experiments per each combination of method-network. The stop condition in all cases was 30,000 evaluations of the objective function. The presented case studies are offline problems and require computational simulations to assess the fitness of each solution. Independently of the computational complexity of each method, the higher computational cost of each experiment falls on the evaluation of the objective function. Therefore, by using a stop condition we ensure to establish which search strategy performs better in a specific type of problem.
In this section, we present the experimental results obtained in the context of the experimental framework discussed above. The comparison of solutions in multi-objective optimization is substantially more complex than in single objective optimization, because there is no single performance metric that can be used to measure several desired qualities for the optimal solution set [
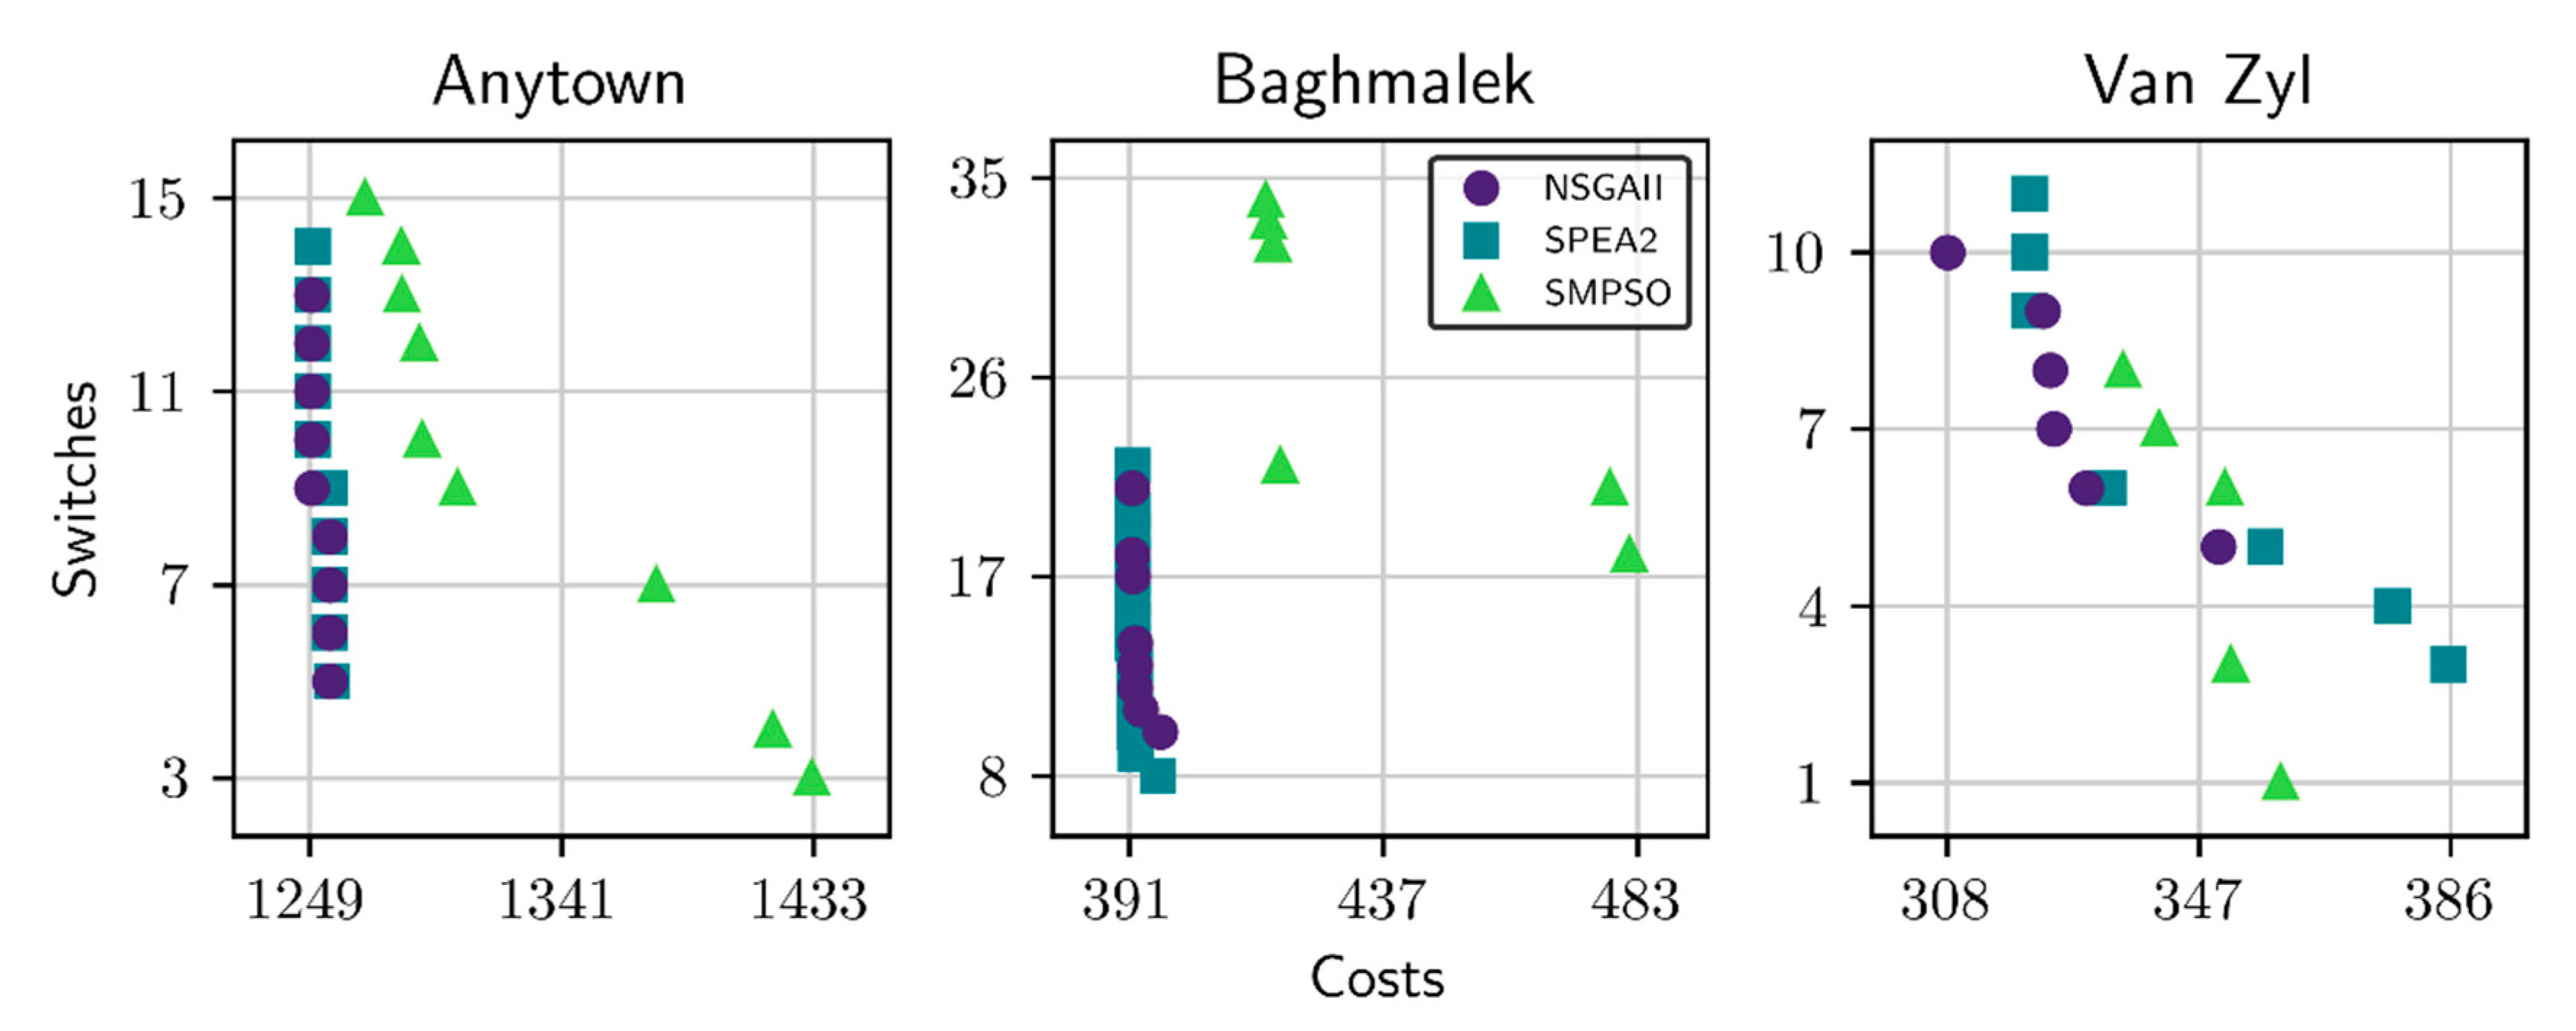
39]. Therefore, some WDN optimization studies have limited the performance analysis to a visual comparison of solutions in terms of the quality of the Pareto fronts obtained, as shown in
Figure 5.
Figure 5 demonstrates that using the Pareto front as the only measure of performance comparison between algorithms is insufficient. Specifically, NSGA-II and SPEA2 build the same Pareto front for the Anytown and Baghmalek networks, so the only conclusion is that SMPSO works worse in these two case studies, but we cannot establish significant differences between NSGA-II and SPEA2. Moreover, in the Van Zyl network all algorithms contribute to building the Pareto front at some of its points, so it is not possible to establish differences between NSGA-II, SPEA2, and SMPSO.
Consequently, additional evaluations about the performance and search behavior of multi-objective algorithms in relation to their parameters and/or WDN features are needed. On this regard, based on the statistics instrument offered by jMetal, we arrive at conclusions regarding the performance of NSGA-II, SPEA2, and SMPSO on the test problems Van Zyl, Baghmalek, and Anytown.
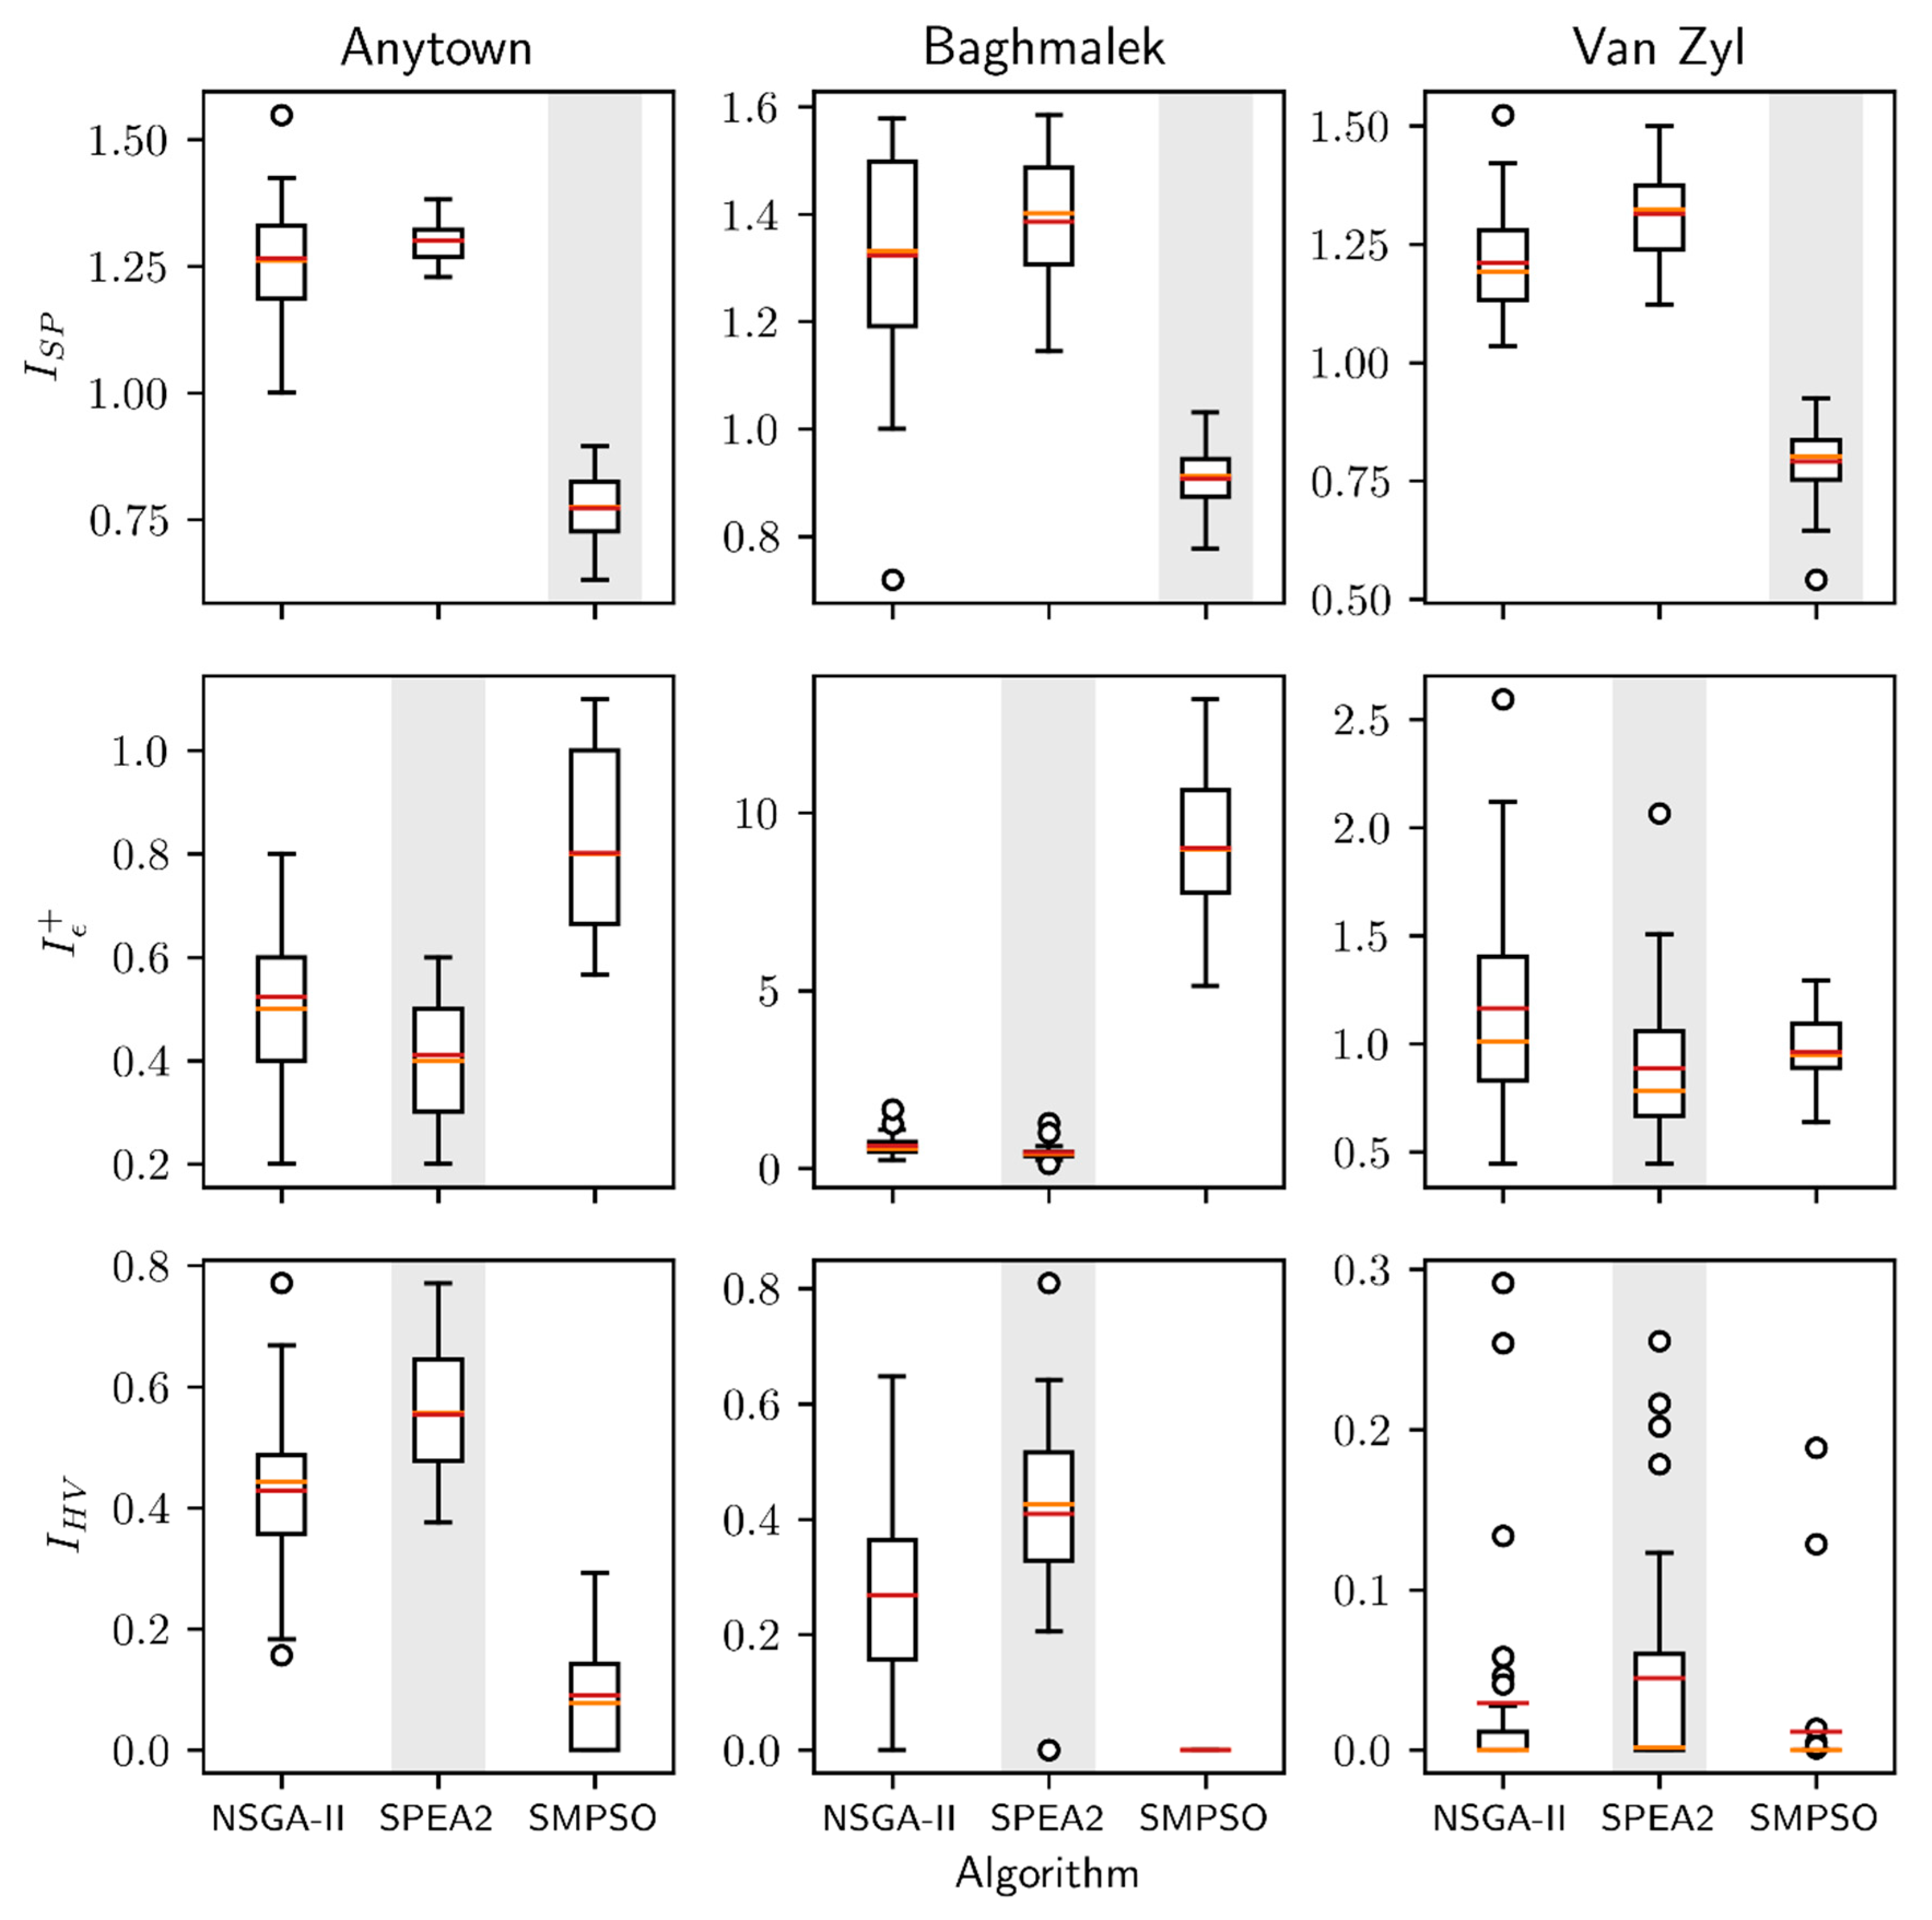
Figure 6 shows boxplots for the Epsilon (
), Spread (
ISP), and Hypervolume (
IHV) indicator distributions calculated for the case studies. Red lines indicate the median value, while the orange lines indicate the mean value. Grey bars indicate the best performing algorithm for each indicator, as inferred by the Wilcoxon and Friedman statistical tests.
The first row in
Figure 6 depicts the median, mean, and the
IQR for the
ISP distributions as a function of algorithm and case study. SMPSO achieves on average the best (lowest) values in all three case studies. NSGA-II was the second-best algorithm with three-second places, while SPEA2 had the worst performance for the three case studies. The Wilcoxon test confirms that SMPSO spread values on Van Zyl, Baghmalek, and Anytown networks outperform the ones obtained by NSGA-II and SPEA2, with a statistical significance of 95%. However, this test did not show differences statistically significant between NSGA-II and SPEA2 for the Baghmalek and Anytown networks.
Table 3 presents the Friedman average ranking of the
ISP metric for the three algorithms under consideration. The results are distributed according to
with two degrees of freedom at 5% significance level (
p-value < 0.05). In this case, SMPSO, NSGA-II, and SPEA2 were ranked first, second, and third, respectively.
The analyzed performance indicator assesses the distribution of solutions along the Pareto front. Consequently, in the context of the experiments conducted, SMPSO is the algorithm that reaches the best distribution of the non-dominated solutions, followed by the NSGA-II and SPEA2 algorithms.
The performance distribution obtained by the three algorithms on the additive version of the
metric is presented in the second row of
Figure 6. SPEA2 was the best algorithm with three first places, followed by NSGA-II with two-second positions on the Baghmalek and Anytown networks. Finally, SMPSO with a one-second place on the Van Zyl network was the algorithm with the poorest behavior. The comparisons performed by the Wilcoxon test confirm SPEA2 as the algorithm with better performance at a 95% significance level on all three networks under study. At the same time, NSGA-II outperformed, with statistical significance, SMPSO on Baghmalek and Anytown while not found statistical difference on Van Zyl.
The Friedman test ranking, presented in
Table 4, is less conclusive than the previous quality indicator. In this case, the obtained results had 10% of significant level (the recommended value is 5%).
From the previous results we can conclude that, under the experimental framework presented, SPEA2 is the algorithm with the best convergence. On the other hand, the SMPSO algorithm does not generally converge well to the true Pareto front of the networks under consideration.
The
IHV metric implemented in jMetal follows the strategy proposed originally by Zitzler [
15]. The inputs are the Pareto front approximations generated by the algorithms involved in the experiments, and the approximation generated by the analyzed algorithm, while the output is its Hypervolume.
First, are obtained the maximum and minimum values per each objective of the Pareto front. After that, it is normalized as well as the approximation to the Pareto front. The original IHV metric is for maximization problems. Consequently, as jMetal handles the optimization problems as minimization ones, the now normalized Pareto front has to be inverted. Finally, it is calculated the hypervolume contributions of all solutions of the normalized approximation to the Pareto front. It is essential to highlight that all solutions outside the convex hull, formed by the origin of coordinates and the inverted normalized Pareto front, are set up to the origin. The previous means that contribution to the hypervolume of these solutions are zero.
The third row in
Figure 6 displays the median and IQR values for the
IHV distribution as a function of algorithm and case study. Once again, SPEA2 was the algorithm with the best (highest) values for the Van Zyl and Baghmalek networks. The second place was for the NSGA-II algorithm with two-second positions. Finally, SMPSO with the first place in Anytown and two third places was the algorithm with the worse performance on this quality indicator. The Wilcoxon test also confirms SPEA2 as the algorithm with superior behavior on the three networks, considering differences that are statistically significant at the 95% level.
The Friedman test ranking, presented in
Table 5, also confirm the previous results. SPEA2 obtained the first ranking, followed by NSGA-II and SMPSO, respectively. SMPSO was the method with the worse performance on the Hypervolume. Similar to what occured with the Epsilon quality indicator, SPEA2 was the method that leads to a Pareto set approximation.
Finally,
Table 6 summarizes the set of pairwise comparisons between SPEA2 and the rest of the algorithms across the three quality indicators for the two-objective optimization model of Van Zyl, Baghmalek, and Anytown networks. Performance of the SPEA2 algorithm was compared to that of the two state-of-the-art MOEAs throughout the three networks (six pairwise comparisons). The ‘+’ symbol indicates that result was statistically significant in favor of the SPEA algorithm, the ‘-‘ symbol indicates that the result was statistically significant in favor of the competing algorithm, and the ‘=’ symbol indicates no significant differences between the algorithms.
It is clear from
Table 6 that the SPEA2 algorithm outperformed its competitors across
and
IHV metrics.
The No Free Lunch theorem for optimization states that the good performance of an algorithm on a class of problems is at the cost of poor performance on others [
40]. With the parameter configuration used in this paper, we aimed to present the MOEA comparison methodology and assess the search strategy from each method. No problem-tune parameters experiments were conducted because they were out of the scope of the paper. Consequently, the experimental results presented in this paper could vary in the case of experiments with different settings.
Elitism is the strategy that allows the evolutionary algorithms to preserve the best solutions (parents or children) from one generation to the next. This ensures that the algorithm has an increasing monotonous performance [
41]. After analyzing the search strategies of NSGA-II, SMPSO, and SPEA2 methods, their similarities and differences, we can conclude that the last one performs better due to the archive prune operators. In SPEA2, the truncation operator prevents the boundary solutions from being removed from the primary archive, facilitating the preservation of effectiveness in terms of convergence [
42]. This behavior, in the context of the networks under consideration, results in SPEA2 as the method on average with the best performance.
5. Conclusions
To date, many multi-objective algorithms have been applied successfully to WDN problems, but there is still lack of knowledge on appropriate metrics to assess their performance. This work proposes a new methodology based on integration of two softwares in a single project, called jHawanet. On this subject, EPANET is one of the most important tools in the hydraulic simulation of water networks, and jMetal is an object-oriented Java-based framework designed specifically for multi-objective optimization of complex problems.
The collaborative work of both systems presents many advantages. Noteworthy, jHawanet allows to determine the performance of the main algorithms available in the literature through a fair comparison, avoiding biases caused by visual inspection or other spurious methods. Additionally, jHawanet reduces the processing times of the results through the automated comparison available in jMetal and additionally, it can be used by researchers to develop their own algorithms and also to allow them to compare their new techniques against other metaheuristics.
The proposed methodology was applied to the well-known multi-objective optimization problem of pump scheduling. So, jHawanet was tested with three multi-objective evolutionary algorithms (SPEA2, NSGA-II, and SMPSO) and three benchmark networks. Based on the statistical analysis of the results provided by jHawanet, it is possible to state the following:
In terms of the quality of the Pareto fronts obtained, the visual comparison is insufficient and unreliable to determine which algorithm has better performance in the optimization problem.
Considering the quality indicators provided by jMetal, the SPEA2 algorithm outperforms the NSGA-II and SMPSO algorithms. In this regard, both the Epsilon and Hypervolume quality indicators demonstrate that SPEA2 is the best performing algorithm for the studied benchmark networks, while the Spread indicator shows no significant differences between the considered algorithms.
Finally, it is essential to highlight that the presented methodology is generic and can be applied to any WDN multi-objective optimization problem. EpaJava is publicly available under the MIT license, and it can be obtained freely from
https://github.com/jhawanet/epajava. Researchers interested in the entire jHawanet project, please contact the authors. In both cases, we kindly ask you to cite this article.

 ,
, 


