Article

Understanding Groundwater Mineralization Changes of a Belgian Chalky Aquifer in the Presence of 1,1,1-Trichloroethane Degradation Reactions

1
Hydrogeology and Environmental Geology, Urban and Environmental Engineering, University of Liège, Sart Tilman B52, 4000 Liège, Belgium
2
AECOM, Maria-Theresiastraat 34 A, 3000 Leuven, Belgium
*
Author to whom correspondence should be addressed.
Water 2019, 11(10), 2009; https://doi.org/10.3390/w11102009
Submission received: 22 August 2019 / Revised: 5 September 2019 / Accepted: 23 September 2019 / Published: 27 September 2019
(This article belongs to the Special Issue Urban Hydrogeology Studies)

Abstract

:
An abandoned industrial site in Belgium, located in the catchment of a chalk aquifer mainly used for drinking water, has been investigated for groundwater pollution due to a mixture of chlorinated solvents with mainly 1,1,1-trichloroethane (1,1,1-TCA) at high concentrations. The observed elevated groundwater mineralization was partly explained by chemical reactions associated with hydrolysis and dehydrohalogenation (HY/DH) of 1,1,1-TCA in the chalky aquifer. Leaching of soluble compounds from a backfilled layer located in the site could also have influenced the groundwater composition. In this context, the objective of this study was to investigate the hydrochemical processes controlling groundwater mineralization through a characterization of the backfill and groundwater chemical composition. This is essential in the context of required site remediation to define appropriate remediation measures to soil and groundwater. Groundwater samples were collected for chemical analyses of chlorinated aliphatic hydrocarbons, major ions, and several minor ones. X-Ray Diffraction Analysis (XRD), Scanning Electron Microscopy (SEM) and a leaching test according to CEN/TS 14405 norm were carried out on the backfill soil. δ34S and δ18O of sulphate in groundwater and in the backfill eluates were also compared. Both effects influencing the groundwater hydrochemistry around the site were clarified. First, calcite dissolution under the 1,1,1-TCA degradation reactions results in a water mineralization increase. It was assessed by geochemical batch simulations based on observed data. Second, sulphate and calcium released from the backfill have reached the groundwater. The leaching test provided an estimation of the minimal released quantities.

Graphical Abstract

1. Introduction

Chlorinated aliphatic hydrocarbons (CAHs) are among the most common pollutants in industrial sites because of their intensive use as cleaning and degreasing products [1]. CAHs in groundwater is a major concern because of their harmful effect on human health [2]. They may undergo different natural degradation pathways in groundwater. Physicochemical and geochemical data help to identify actual degradation reactions that occur naturally in groundwater [3,4,5]. Degradation reactions of CAHs in groundwater influence the hydrochemistry and may modify the physicochemical conditions [6,7]. This explains the interest given to enhanced monitoring and investigations about physicochemical parameters and groundwater hydrochemistry in cases of CAHs pollutions [8]. Identification of redox conditions, electron donors and acceptors and the source of carbon within the groundwater contamination plume improve the assessment of destructive biodegradation of CAHs [9].
1,1,1-trichloroethane (1,1,1-TCA) is often detected with other CAHs at contaminated sites because of their common use in industry [10]. In groundwater, both biotic and abiotic natural degradation reactions of 1,1,1-TCA are possible [11,12]. Although abiotic degradation of 1,1,1-TCA by hydrolysis and dehydrohalogenation (HY/DH) occurs independently of redox conditions in groundwater [13], it influences the pH that would impact the groundwater mineralization. In this case, a hydrogeochemical investigation including major ions analysis allow a direct link between degradation reactions and mineralization changes, as long as no additional pollution source influencing groundwater mineralization can be identified.
On the other hand, artificial man-made ground (i.e., backfill soil) represent a potential threat to the quality of shallow groundwater in urban context (e.g., [14,15,16,17]) as unwelcome chemical compounds can be leached and contaminate groundwater. Then, a remediation of the groundwater quality, in order to be compliant with drinking water standards, can be a very difficult task [18].
In Belgium, the past intensive industrial activities have caused environmental problems, especially for soil and groundwater. Most cases of local pollution, including the use of uncontrolled backfilling, are a legacy of past practices when the question of the environmental and health consequences of human activities was scarcely considered [19].
At an abandoned industrial site in Wallonia (South of Belgium), a chalky aquifer intensively used for drinking water supply [20] has been locally contaminated by a mixture of CAHs. Local changes in groundwater mineralization have been observed compared to the background composition of groundwater in the aquifer. During the investigations of Palau et al. [21], an increase of Ca2+, HCO3, Cl and SO42− was observed within the plume of dissolved CAHs. Sulphate concentrations even exceed the EU drinking water standard (250 mg/L) [22] in some places, reaching concentration levels as high as 5 times the background concentration. During the investigations of Palau et al. [21], mineralization changes has been first explained by 1,1,1-TCA degradation reactions by HY/DH. However, the presence of a backfill layer at the site has allowed to presume the leaching of different chemical compounds with water infiltration that may also affect groundwater composition.
In this context, the general objective of the investigation is to better characterize and to quantify the hydrochemical processes controlling groundwater mineralization, through a combined approach of groundwater chemistry investigation with backfill soil characterization. This is essential in order to avoid overestimation of degradation reactions through their effect on groundwater mineralization and to define appropriate remediation measures to soil and groundwater in the context of required site remediation.
More specifically, the aim of the study is (1) to improve the understanding of hydrochemistry in the chalky aquifer in a context of 1,1,1-TCA degradation by hydrolysis and dehydrohalogenation, and (2) to identify and quantify processes influencing the hydrochemical changes in groundwater in the study area. The used method is based on groundwater analyses, laboratory backfill soil characterization and the study of sulphate isotopic signature in groundwater, along with the one in backfill eluates.

2. Study Area

The study area is located around an industrial site where the subsurface is polluted by a mixture of CAHs. They have been detected with high concentrations, not only in the unsaturated part of the soil but also in the underlying chalky aquifer [21]. The aquifer is unconfined, made of Cretaceous chalk with an average thickness of about 30 m in the study area. A summary of the local geology is given in Table 1.
In this aquifer, the hydraulic conductivity values of the chalk formation varies from 10−8 m/s for the chalky matrix [23] to values as high as 10−4 m/s for fractured chalk [24]. Hydraulic conductivity values ranging between 3 × 10⁻⁶ and 3 × 10⁻⁴ m/s were obtained from pumping tests near the study site. The effective (transport) porosity varies between 1 and 2% [25,26,27]. The importance of the immobile water on solute transport through matrix diffusion was studied in this chalk [28], with immobile water porosity values ranging between 8 and 42% and first-order transfer coefficients ranging between 9.8 × 10⁻⁸ and 10−6 s−1 were determined [24].
The overlying loess layer induces a delay for the transfer of pollutants that infiltrate from the land surface with water towards the saturated zone. The mean transfer velocity through the unsaturated zone was estimated at 1 m/year [23]. Locally, at the study site, depth to groundwater varies spatially between 17.16 and 28.60 m (in March 2013) with interannual fluctuations that can reach 5 m. Groundwater flow direction is from the South-East towards the North-West direction.
Since the first detection of the contamination in 1987, many investigations have been carried out with installation of a network of 30 wells to delineate and monitor the groundwater pollutants plume, and, more recently, the establishment of a combined venting-air sparging remediation (see here under). Various aliphatic organochlorines have been detected in groundwater, including mainly 1,1,1-TCA, 1,1-dichloroethene (1,1-DCE) and trichloroethene (TCE). The maximum concentrations recorded in the campaign of Palau et al. [21] in March 2013 were 7400 μg/L for 1,1,1-TCA, 4200 μg/L for 1,1-DCE and 2000 μg/L for TCE.
Between May 2013 and August 2016, a combined venting-air sparging program was undertaken to remediate the source zone of CAHs. Air sparging consists of injecting air into the saturated zone of an aquifer. Along the pathways of air bubbles towards the unsaturated zone, contaminant stripping occurs by volatilization of the chlorinated aliphatic hydrocarbons. A total mass of around 800 kg was extracted from the loess layer and the unsaturated upper chalk during this operation. For dissolved CAHs in groundwater, the ongoing monitoring indicates that the plume is currently shrinking. In addition to CAHs contamination, the monitoring program has highlighted significant increase in groundwater mineralization change compared to regional background groundwater composition in the chalk aquifer.
Figure 1 shows Stiff diagrams from groundwater samples taken in the plume in March 2013 (orange) compared to samples taken around before the contamination (blue). The highest concentrations of calcium, bicarbonate, chloride and sulphate are observed near the pollution source and they progressively decrease to the natural background as we move downgradient from the industrial site.

3. Groundwater Quality Investigations

In March 2017, around 7 months after the end of the remediation, a new sampling campaign was carried out in the scope of this research, on the existing monitoring network to assess the groundwater quality and investigate other potential sources resulting on mineralization changes. In addition, analyses results were used to perform hydrogeochemical simulations in PHREEQC [29] to evaluate the increase of calcite dissolution resulting from 1,1,1-TCA degradation reactions in the aquifer.

3.1. Sampling and Analysis

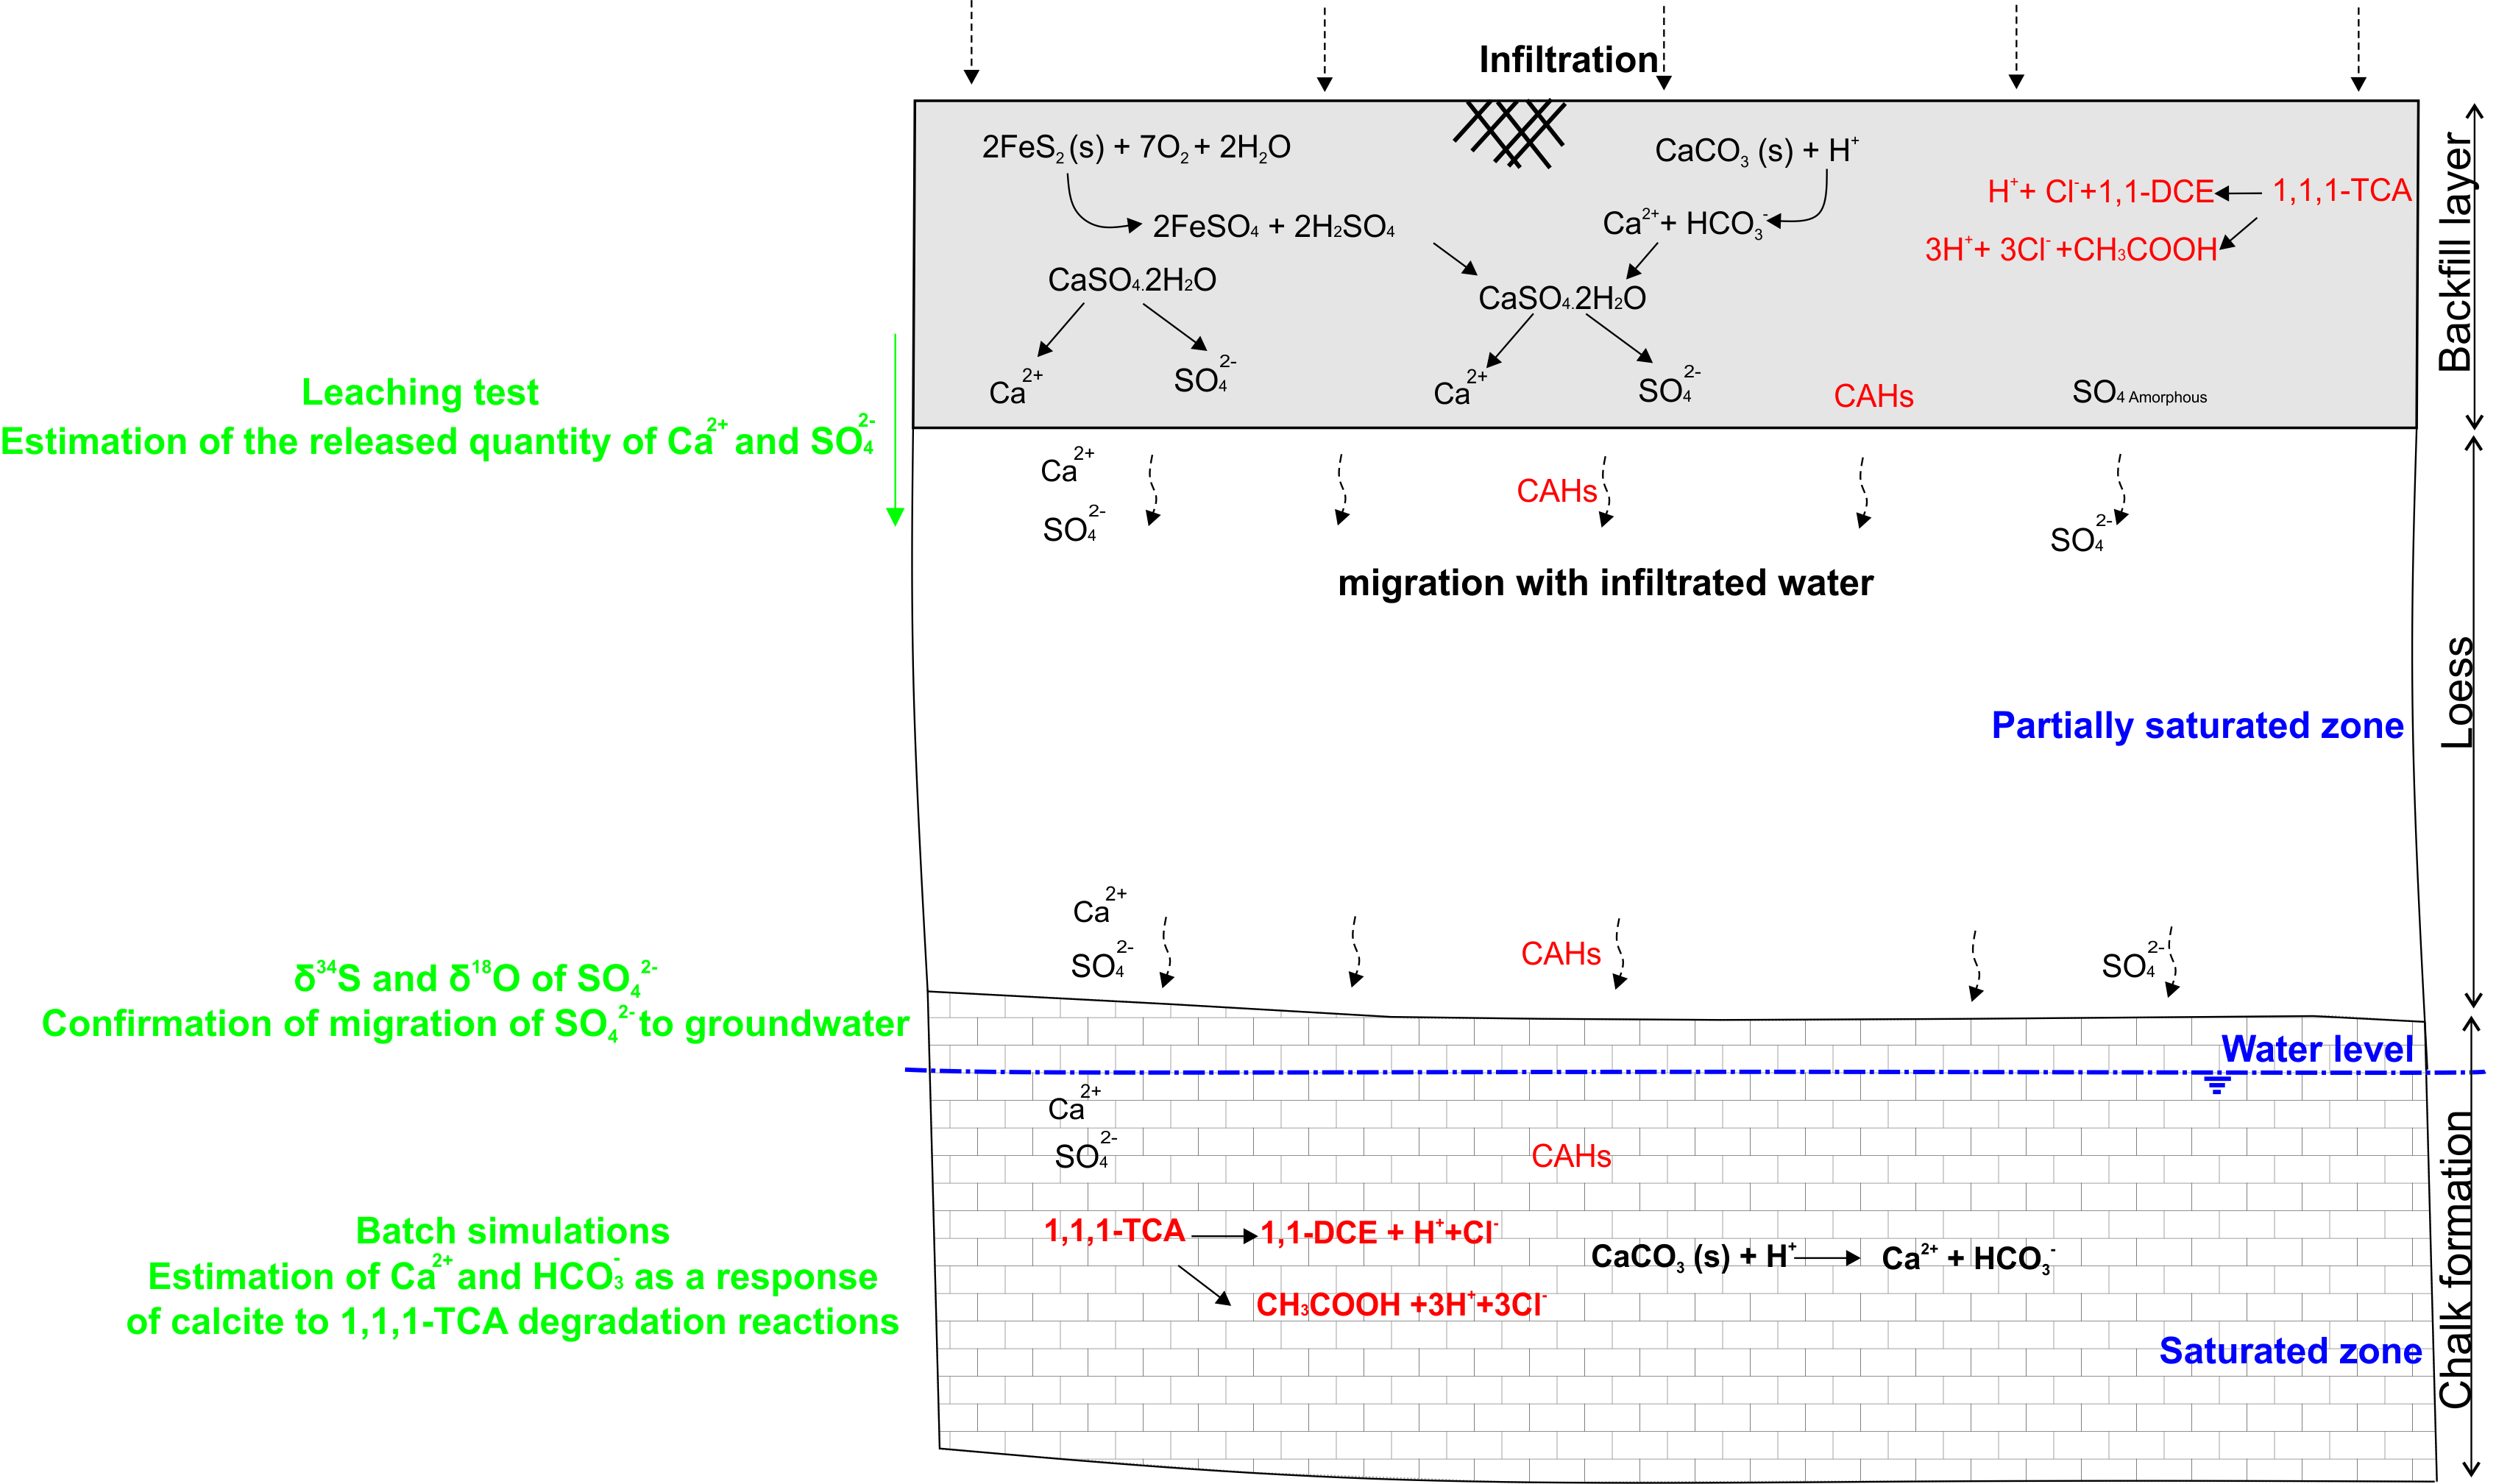
On the existing monitoring network, 22 wells were sampled to analyze chlorinated solvents and among those wells, 13 were also sampled for a more detailed hydrochemical characterization of groundwater. Wells are screened in the upper part of the chalk except for the well ‘S’ equipped with a double casing allowing two sampling levels (25 m and 40 m below surface).
The sampling procedure was carried out by pumping at least 3 times the volume of water in the sampled well and monitoring of temperature, pH, electrical conductivity, redox potential, and dissolved oxygen. All these parameters were monitored using a multi probe handheld meter (WTW multi 350i, Weilheim, Germany) except dissolved oxygen that was measured by a luminescent DO probe (Hach Lange, Düsseldorf, Germany).
Samples for CAHs analyses were collected in 40 mL glass vials filled and acidified with sulphuric acid (H2SO4) at pH ≈ 2. 180 mL polypropylene bottles were used for the analysis in the lab of a standard package of major elements (Ca2+, K+, Mg2+, Na+, Cl, SO42−, HCO3) analyses and several minor chemical compounds (NH4+, Li+, Sr2+, NO3, PO43−, Br, F and SiO2). 100 mL bottles were filled using 0.45 μm filter and acidified (37% HCl) to analyze dissolved iron and manganese. Before being analyzed, all samples were kept refrigerated at 4 °C and protected from light.
At the laboratory, the chemical analyses were carried out using the following methods:
  • Ion chromatography for K+, Mg2+, Na+, NH4+, Li+, Sr2+, PO43−, Br Cl, F, NO3 and SO42;
  • Titrimetric method for Ca2+;
  • Flame atomic absorption for Fe3+, Mn2+ and SiO2;
  • The Carbonate speciation between CO2, HCO3, CO32 is obtained from pH and total alkanity; according to Rodier’s formula [30];
  • Gas chromatography coupled with mass spectrometry (GC/MS) for the CAHs.
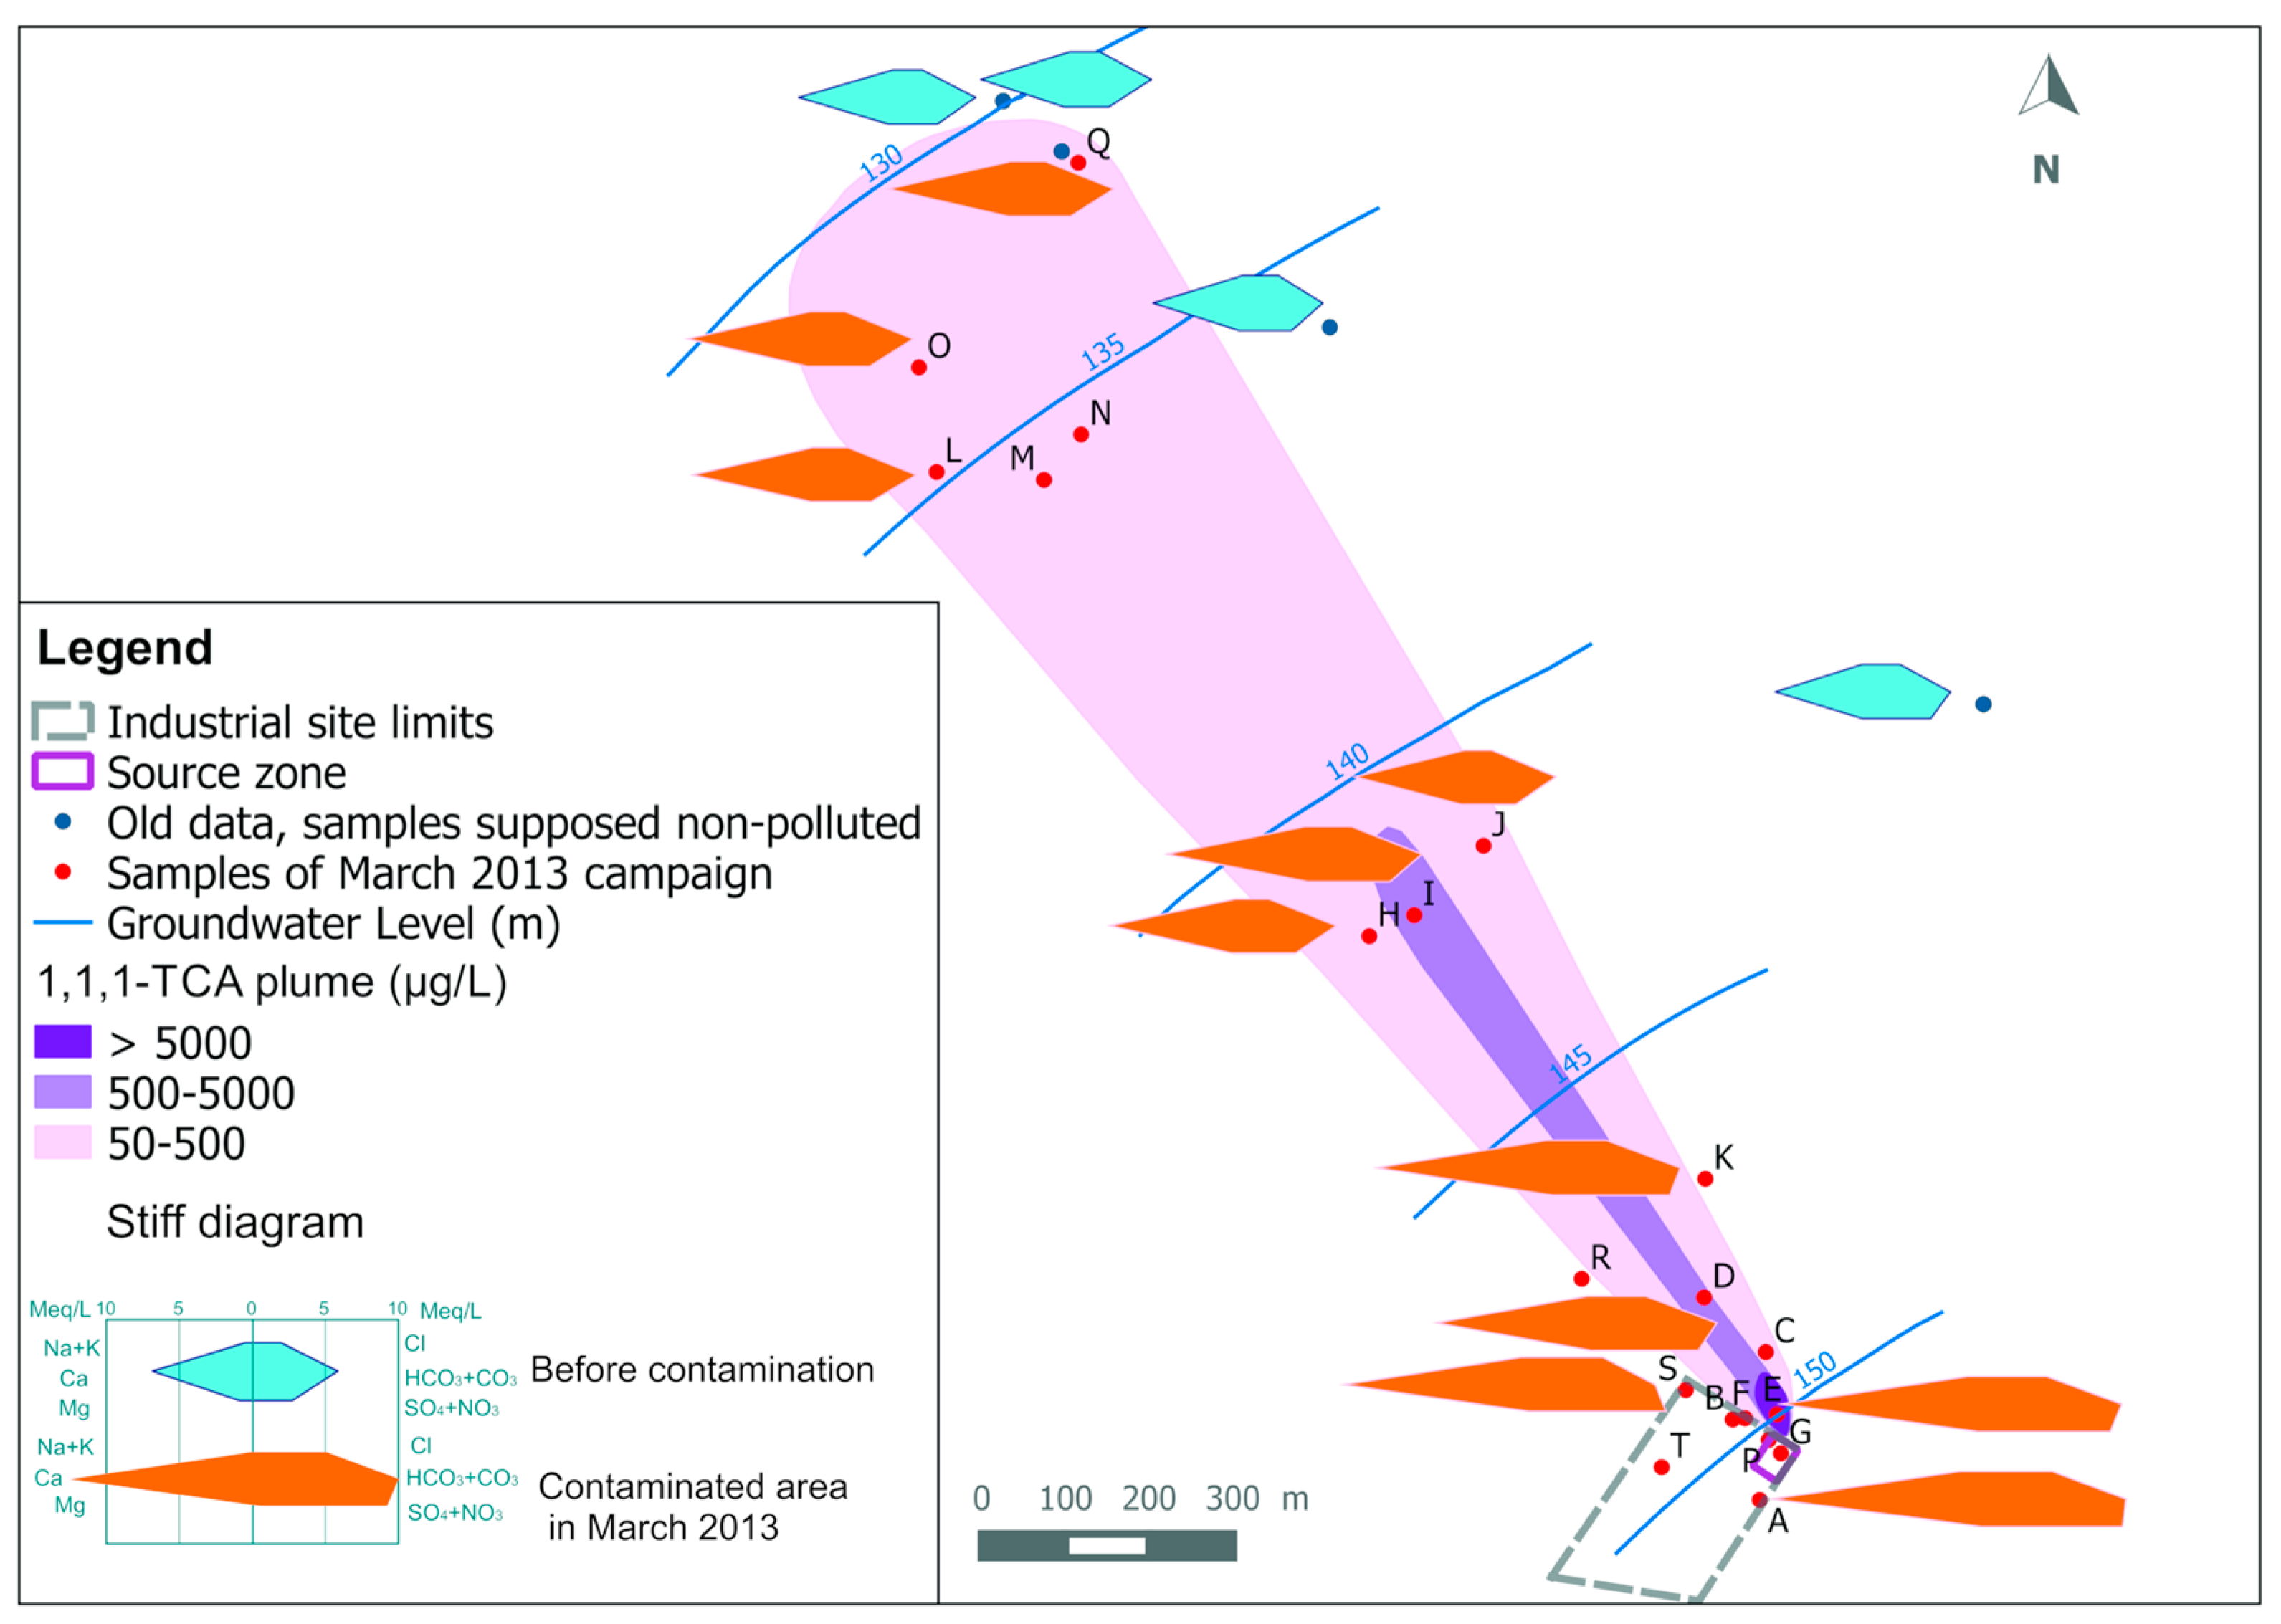
For the organic CAHs compounds, results show that three CAHs are dominant: 1,1,1-TCA, 1,1-DCE and TCE, with maximum concentrations of 1100 μg/L, 820 μg/L and 550 μg/L respectively. Concentrations have decreased of 85.13%, 72.5% and 80.47% respectively compared March 2013, before the beginning of remediation operations of the CAHs source. Other aliphatic hydrocarbons such as 1,1,2-TCA, tetrachloromethane, 1,2-dichloroethane and cis-1,2-DCE are detected with lower concentrations. Results showed also a decrease of concentrations of all CAHs in groundwater compared to the concentrations observed in March 2013.
Along the plume centerline, the sum of molar concentrations of the three dominant CAHs are presented in a same graph with the molar percentage of each (Figure 2) Despite the general decrease in CAHs concentrations, their spatial distribution is quite similar to that from Palau et al. (2016) obtained in March 2013 on this site. Along the centerline, concentrations (of the sum of 1,1,1-TCA + 1,1-DCE + TCE) show a decreasing trend from 20.66 µmol/L at well (E) to 1.28 µmol/L at well (Q). For almost all wells along the plume centerline, 1,1-DCE molar fraction is closer to the one of 1,1,1-TCA, with a slightly lower fraction for TCE.
Results of chemical analyses of the inorganic elements in March 2017 are given in Table 2. Wells are listed according to the increasing distance from the source of the CAHs. Well labels are shown in Figure 1.
The measured average temperature is 11.90 °C. The presence of dissolved oxygen with concentrations between 1.04 mg/L and 4.71 mg/L confirms the dominance of aerobic conditions in the aquifer. At most of the sampled points, the in situ measured pH is lower than 7. These values are mainly explained by HY/DH degradation reactions of 1,1,1-TCA that slightly increase water acidity due to the release of hydrochloric and acetic acids. The electrical conductivity is relatively high, ranging from 787 to 1847 µs/cm. Concentrations in major ions such as Ca2+, HCO3, SO42− and Cl decrease downgradient along the groundwater flow direction. Na2+ and Mg2+ concentrations also show a decrease, but their concentrations are relatively low. Ca2+ concentrations decrease from 310.09 mg/L to 168.39 mg/L, downgradient from the source. Cl concentrations also decrease from 160.97 mg/L to 48.30 mg/L in the plume. Near the source area, the SO42− concentration exceeds the drinking water limit of 250 mg/L set by the European Directive [22]. It decreases from 343.63 mg/L at the well (G) to 93.06 mg/L at the well (Q) located farthest from the source area. HCO3 concentrations are decreasing from 528.95 to 298.28 mg/L with a spatial distribution quite similar to Ca2+ concentrations. NO3 concentrations are higher than 50 mg/L in all sampled wells with a different spatial distribution than for the other elements. NO3 has a distinct origin, related to intense agricultural activities with fertilizers that diffusely impact this aquifer [31]. Compared to data before remediation (March 2013), a general slight decrease in concentrations is observed for Ca2+, HCO3, SO42−, Cl, Na+ and Mg2+.
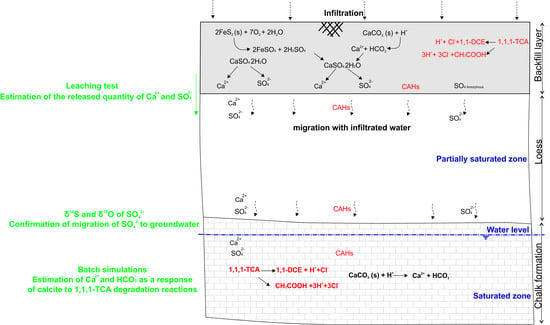
Changes of physicochemical properties and concentrations can be investigated using different groundwater characteristics and tools (i.e., diagrams, graphs) (e.g., [32,33]). From our results, calcite SI were calculated with PHREEQC, using the PHREEQC database. They range between −0.58 and 0.52, indicating that groundwater can be considered in equilibrium with calcite.
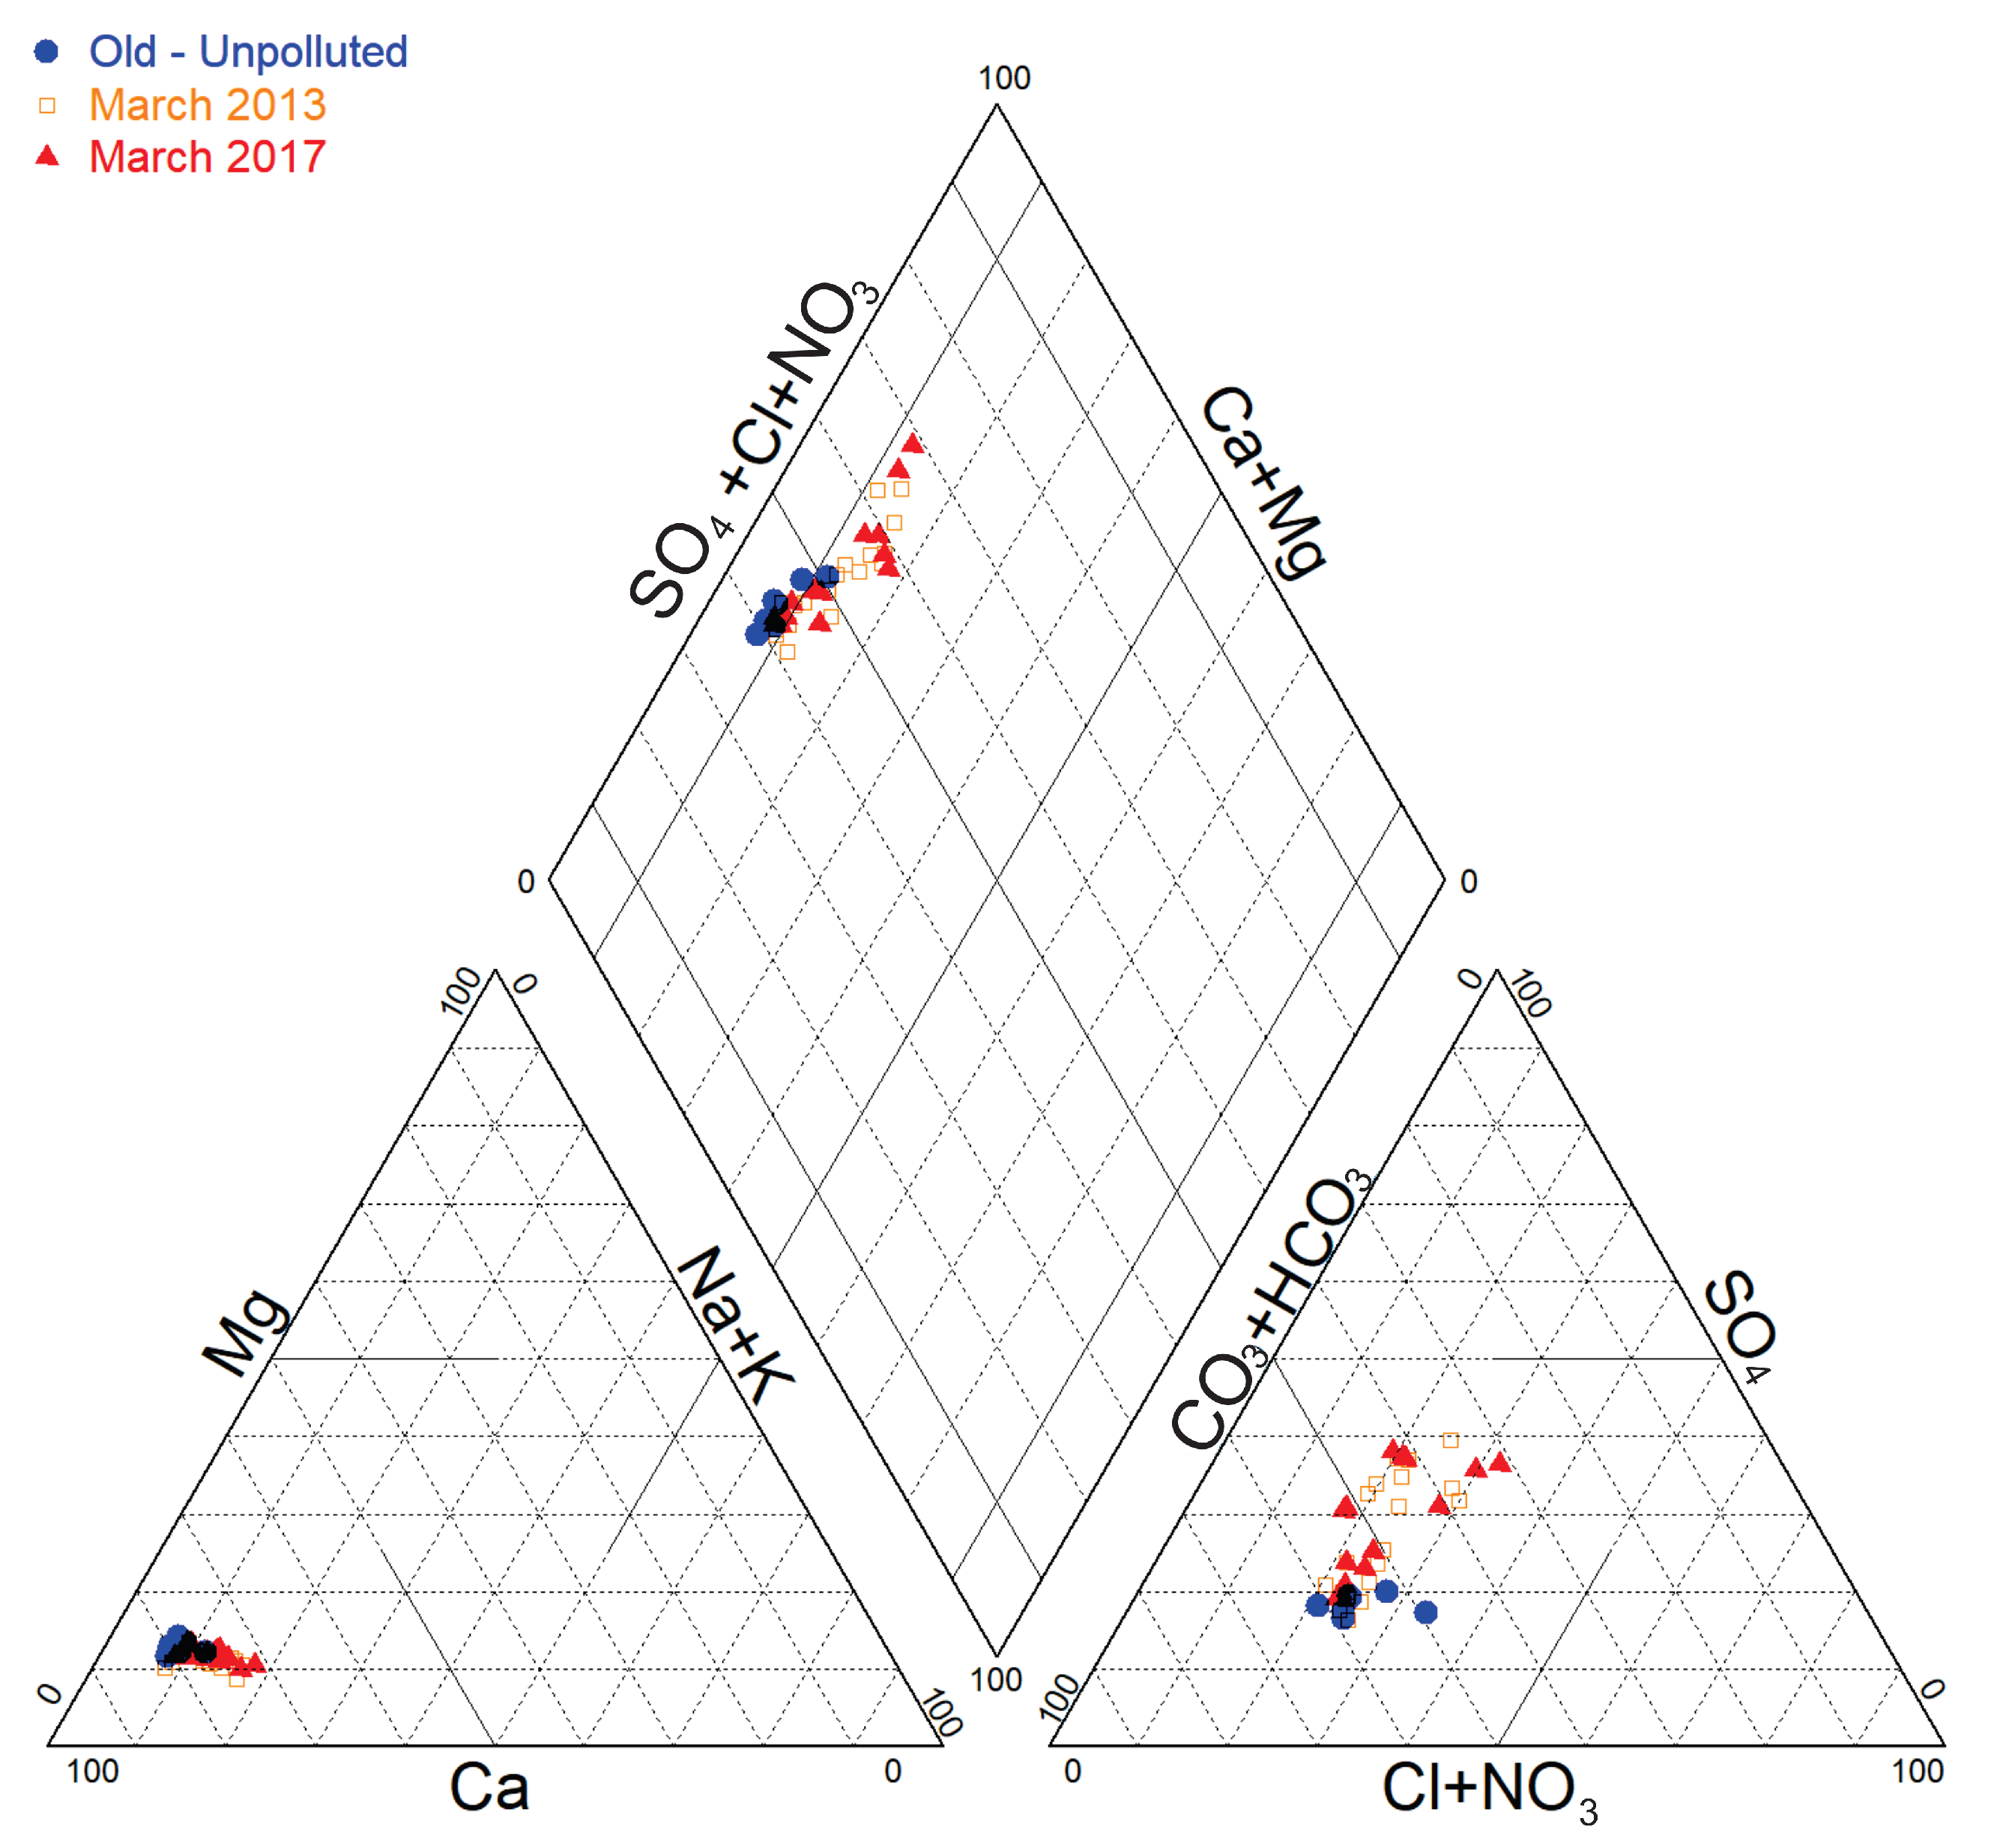
In Piper diagram (Figure 3), a comparison of the relative compositions of groundwater was performed based on data: before pollution detection (October 1993), before source remediation (March 2013) and after source remediation (March 2017).
Historical groundwater data (reflecting unpolluted groundwater status) in the vicinity of the site show typical Ca-HCO3 hydro-chemical facies. The situation in March 2013, at the industrial site and in the direct surroundings the showed that groundwater composition was evolving progressively towards a Ca-SO4 facies, with a clear SO42− enrichment. At the same period, the groundwater composition was tending progressively back to its initial (unpolluted) composition further downgradient. In March 2017, after the CAHs source remediation, the relative chemical composition in Piper diagram seems almost similar to that of March 2013.
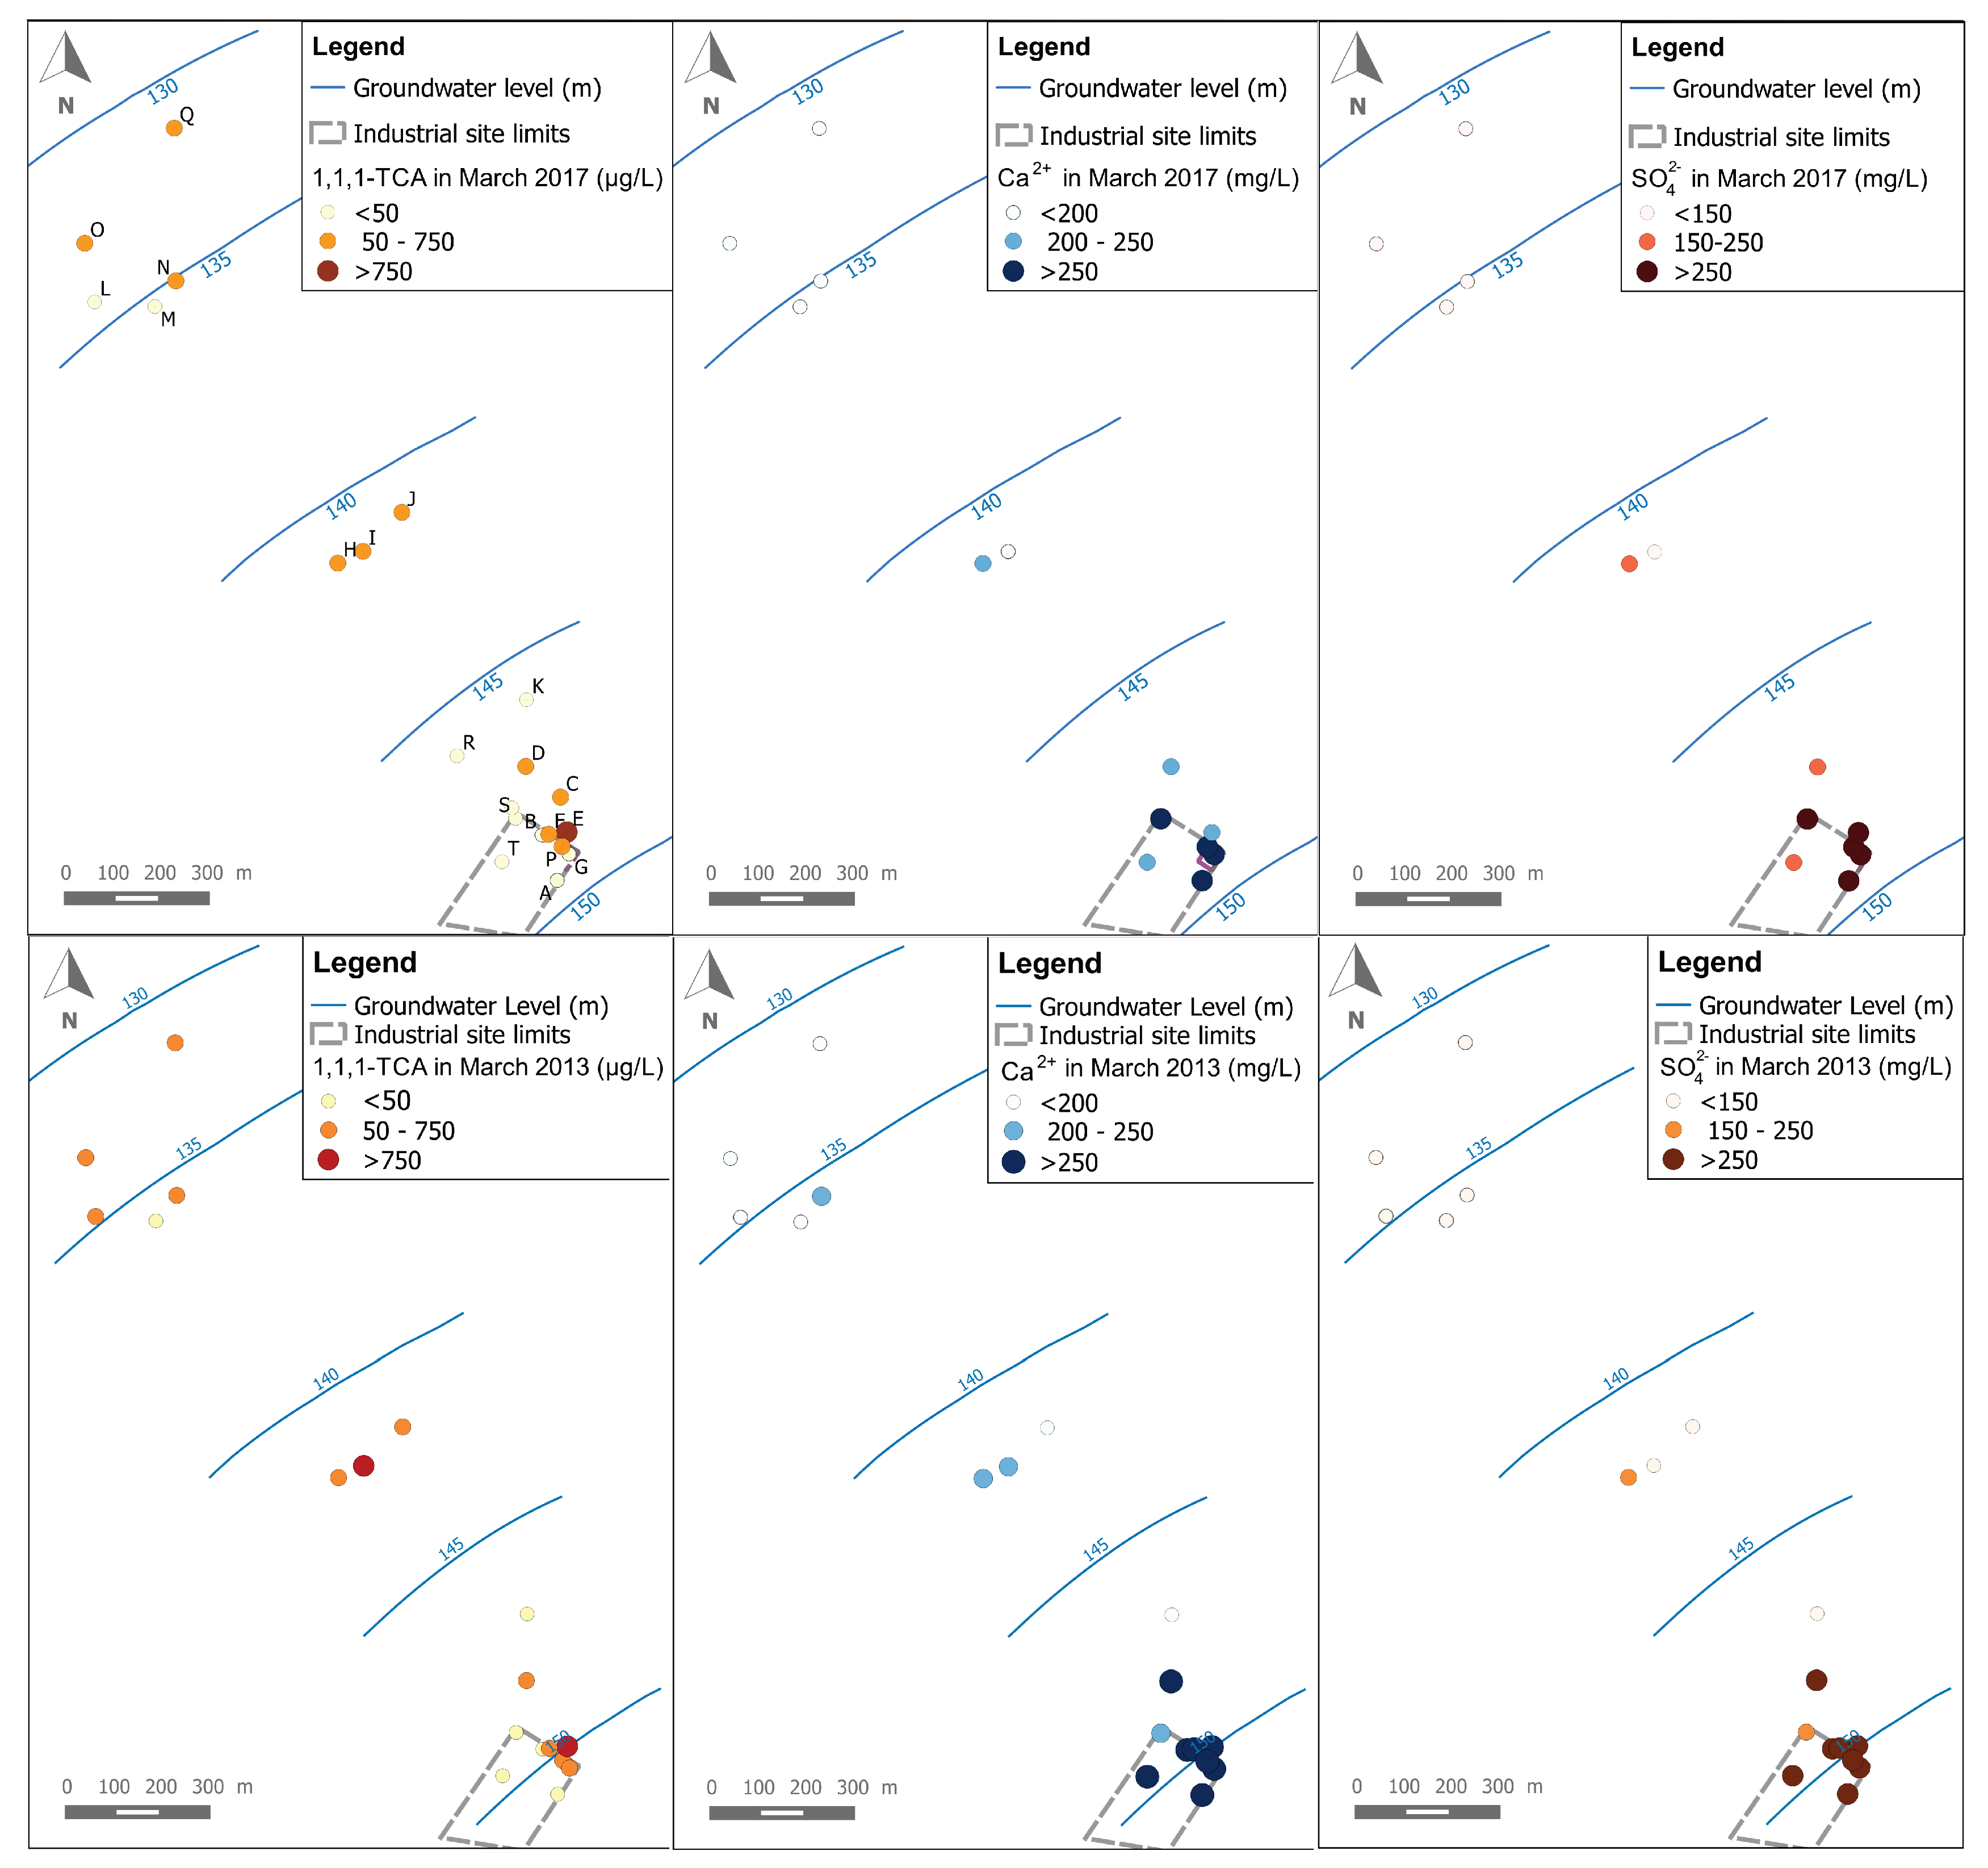
Figure 4 shows a comparison between 1,1,1-TCA, Ca2+ and SO42− spatial distributions for both campaigns of March 2013 and March 2017. As a first observation, the spatial distribution of 1,1,1-TCA (like other CAHs) is quite different than for Ca2+ and SO42−. It can be seen mainly at the industrial site where the highest concentrations of 1,1,1-TCA are detected in the north-eastern part of the industrial site (around well E), while the highest concentrations of Ca2+ and SO42− are observed in wells: A, B, F, G, P and S of the industrial site (i.e., where a backfill layer exists). This could be a sign of a difference between the source zone of the CAHs plume, and the actual source area of the Ca2+ and SO42− plumes. This observation is confirmed by data from both campaigns (i.e., 2013 and 2017).
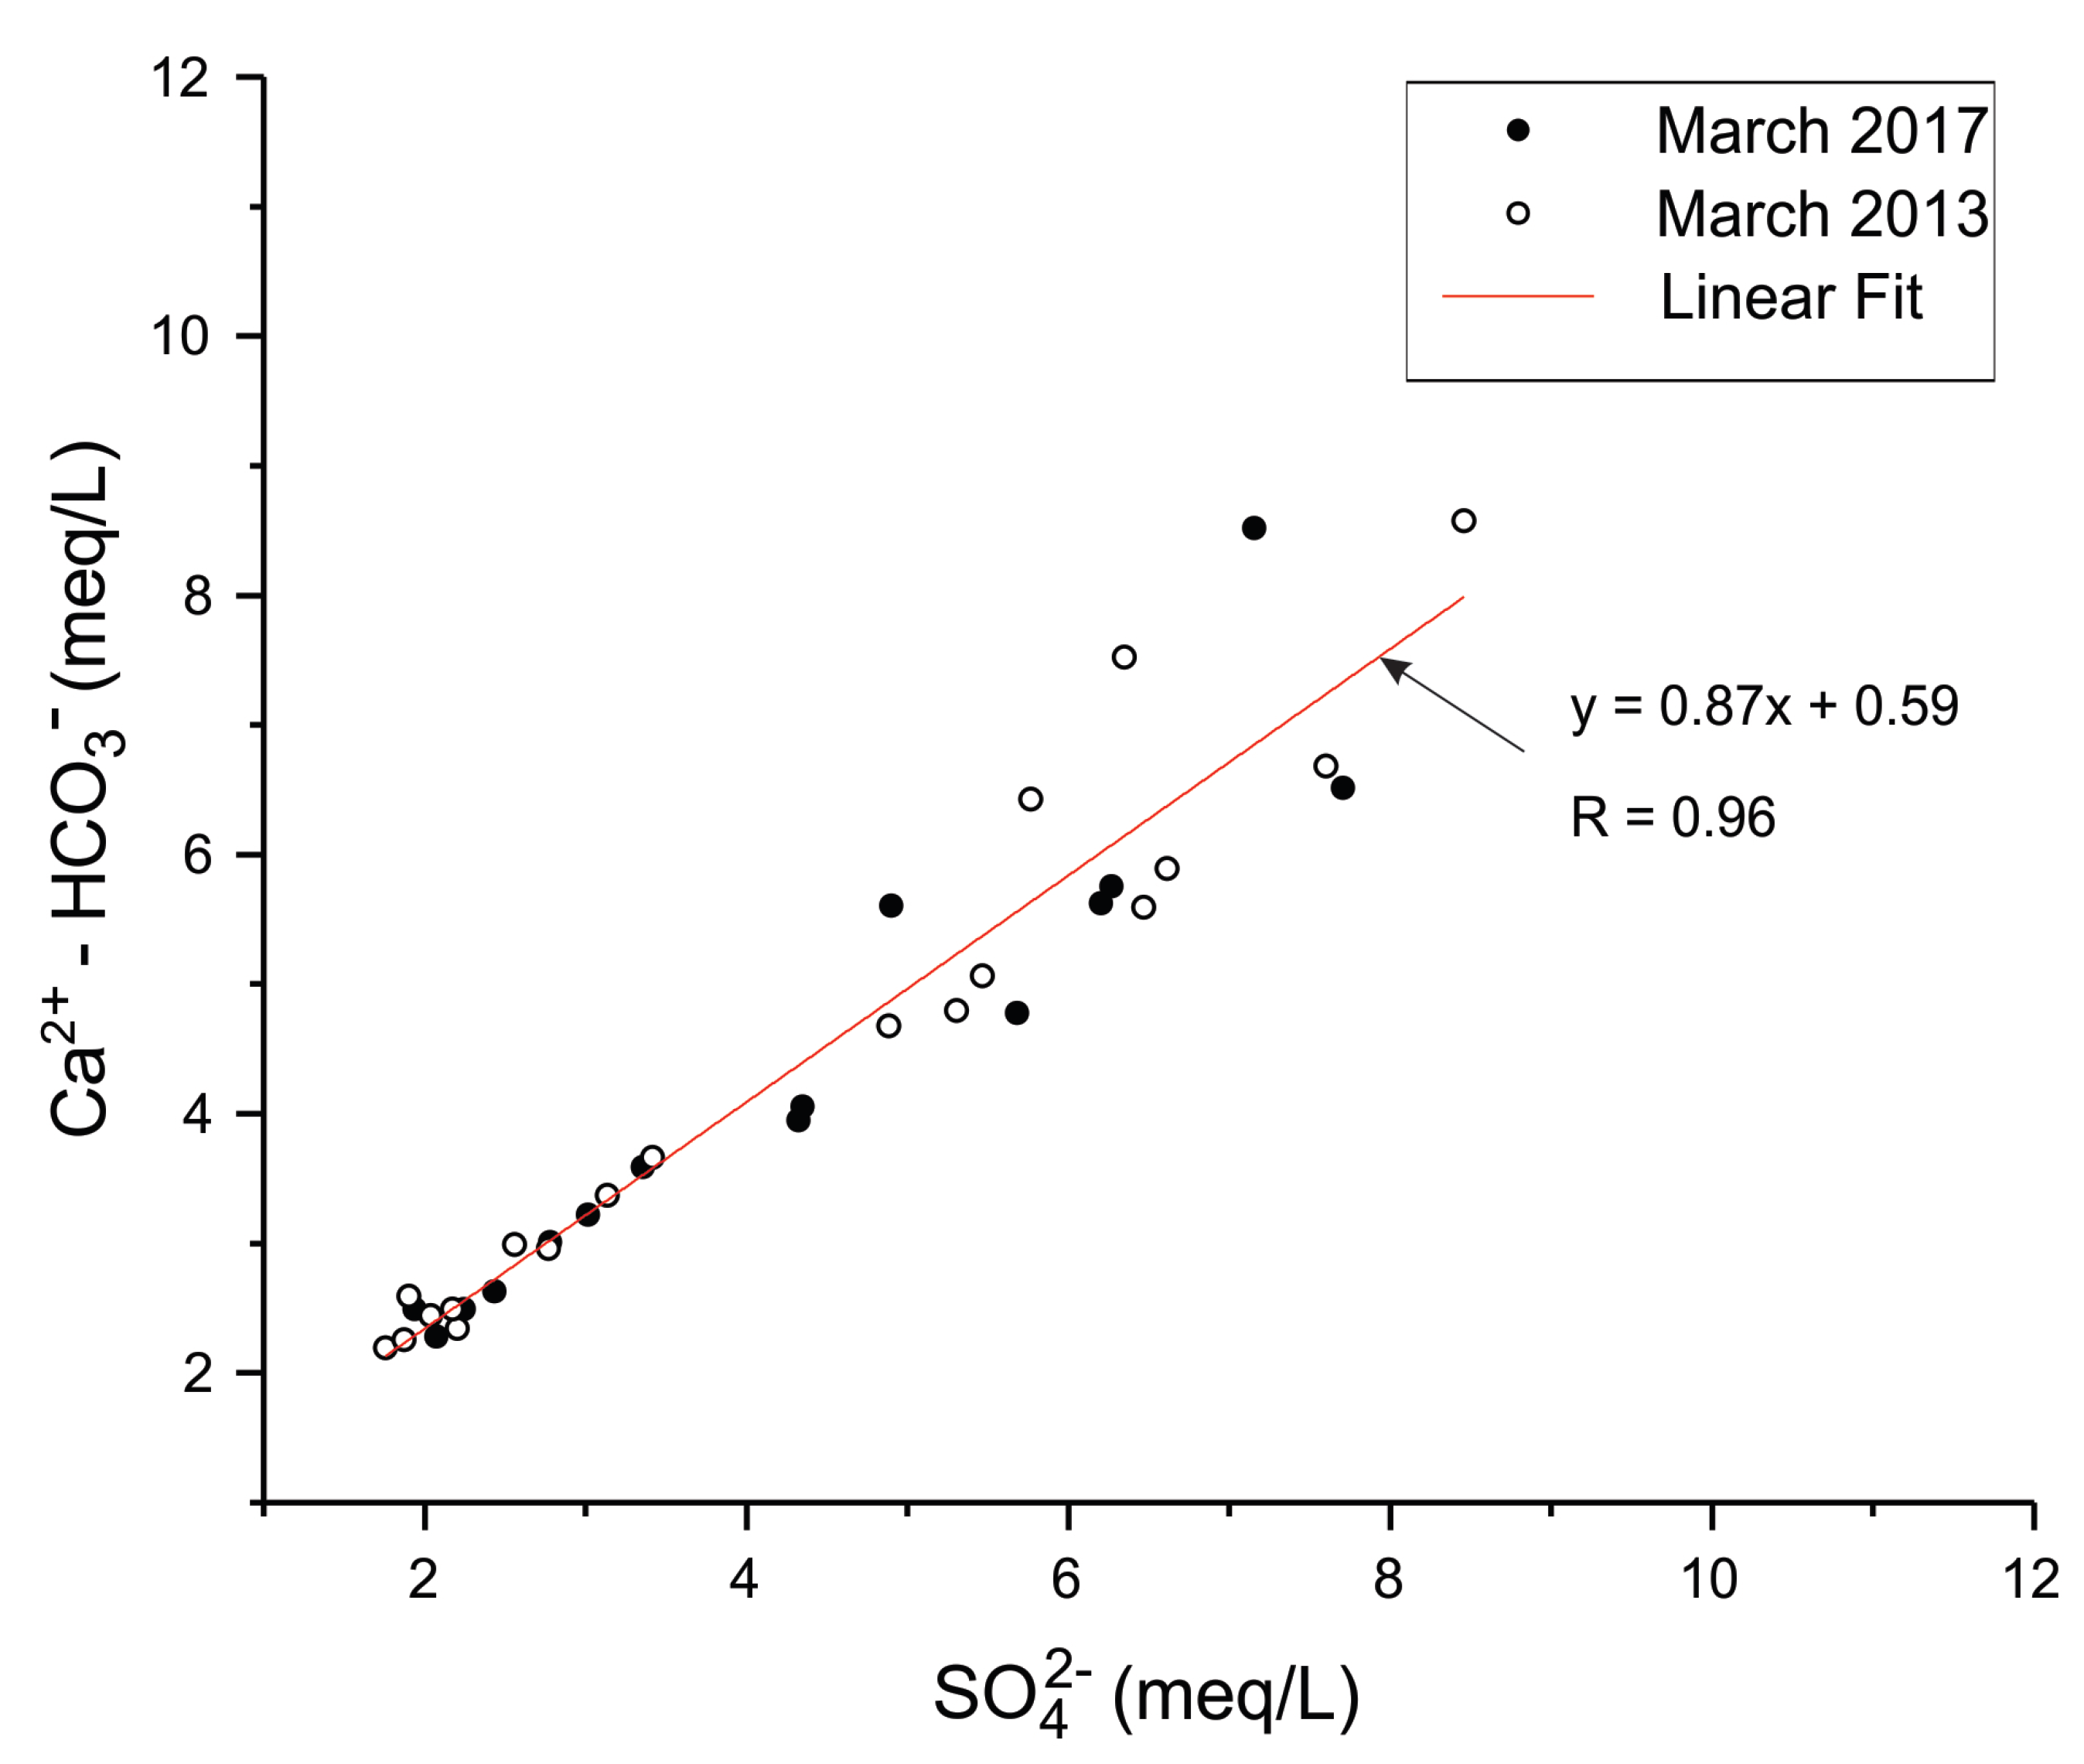
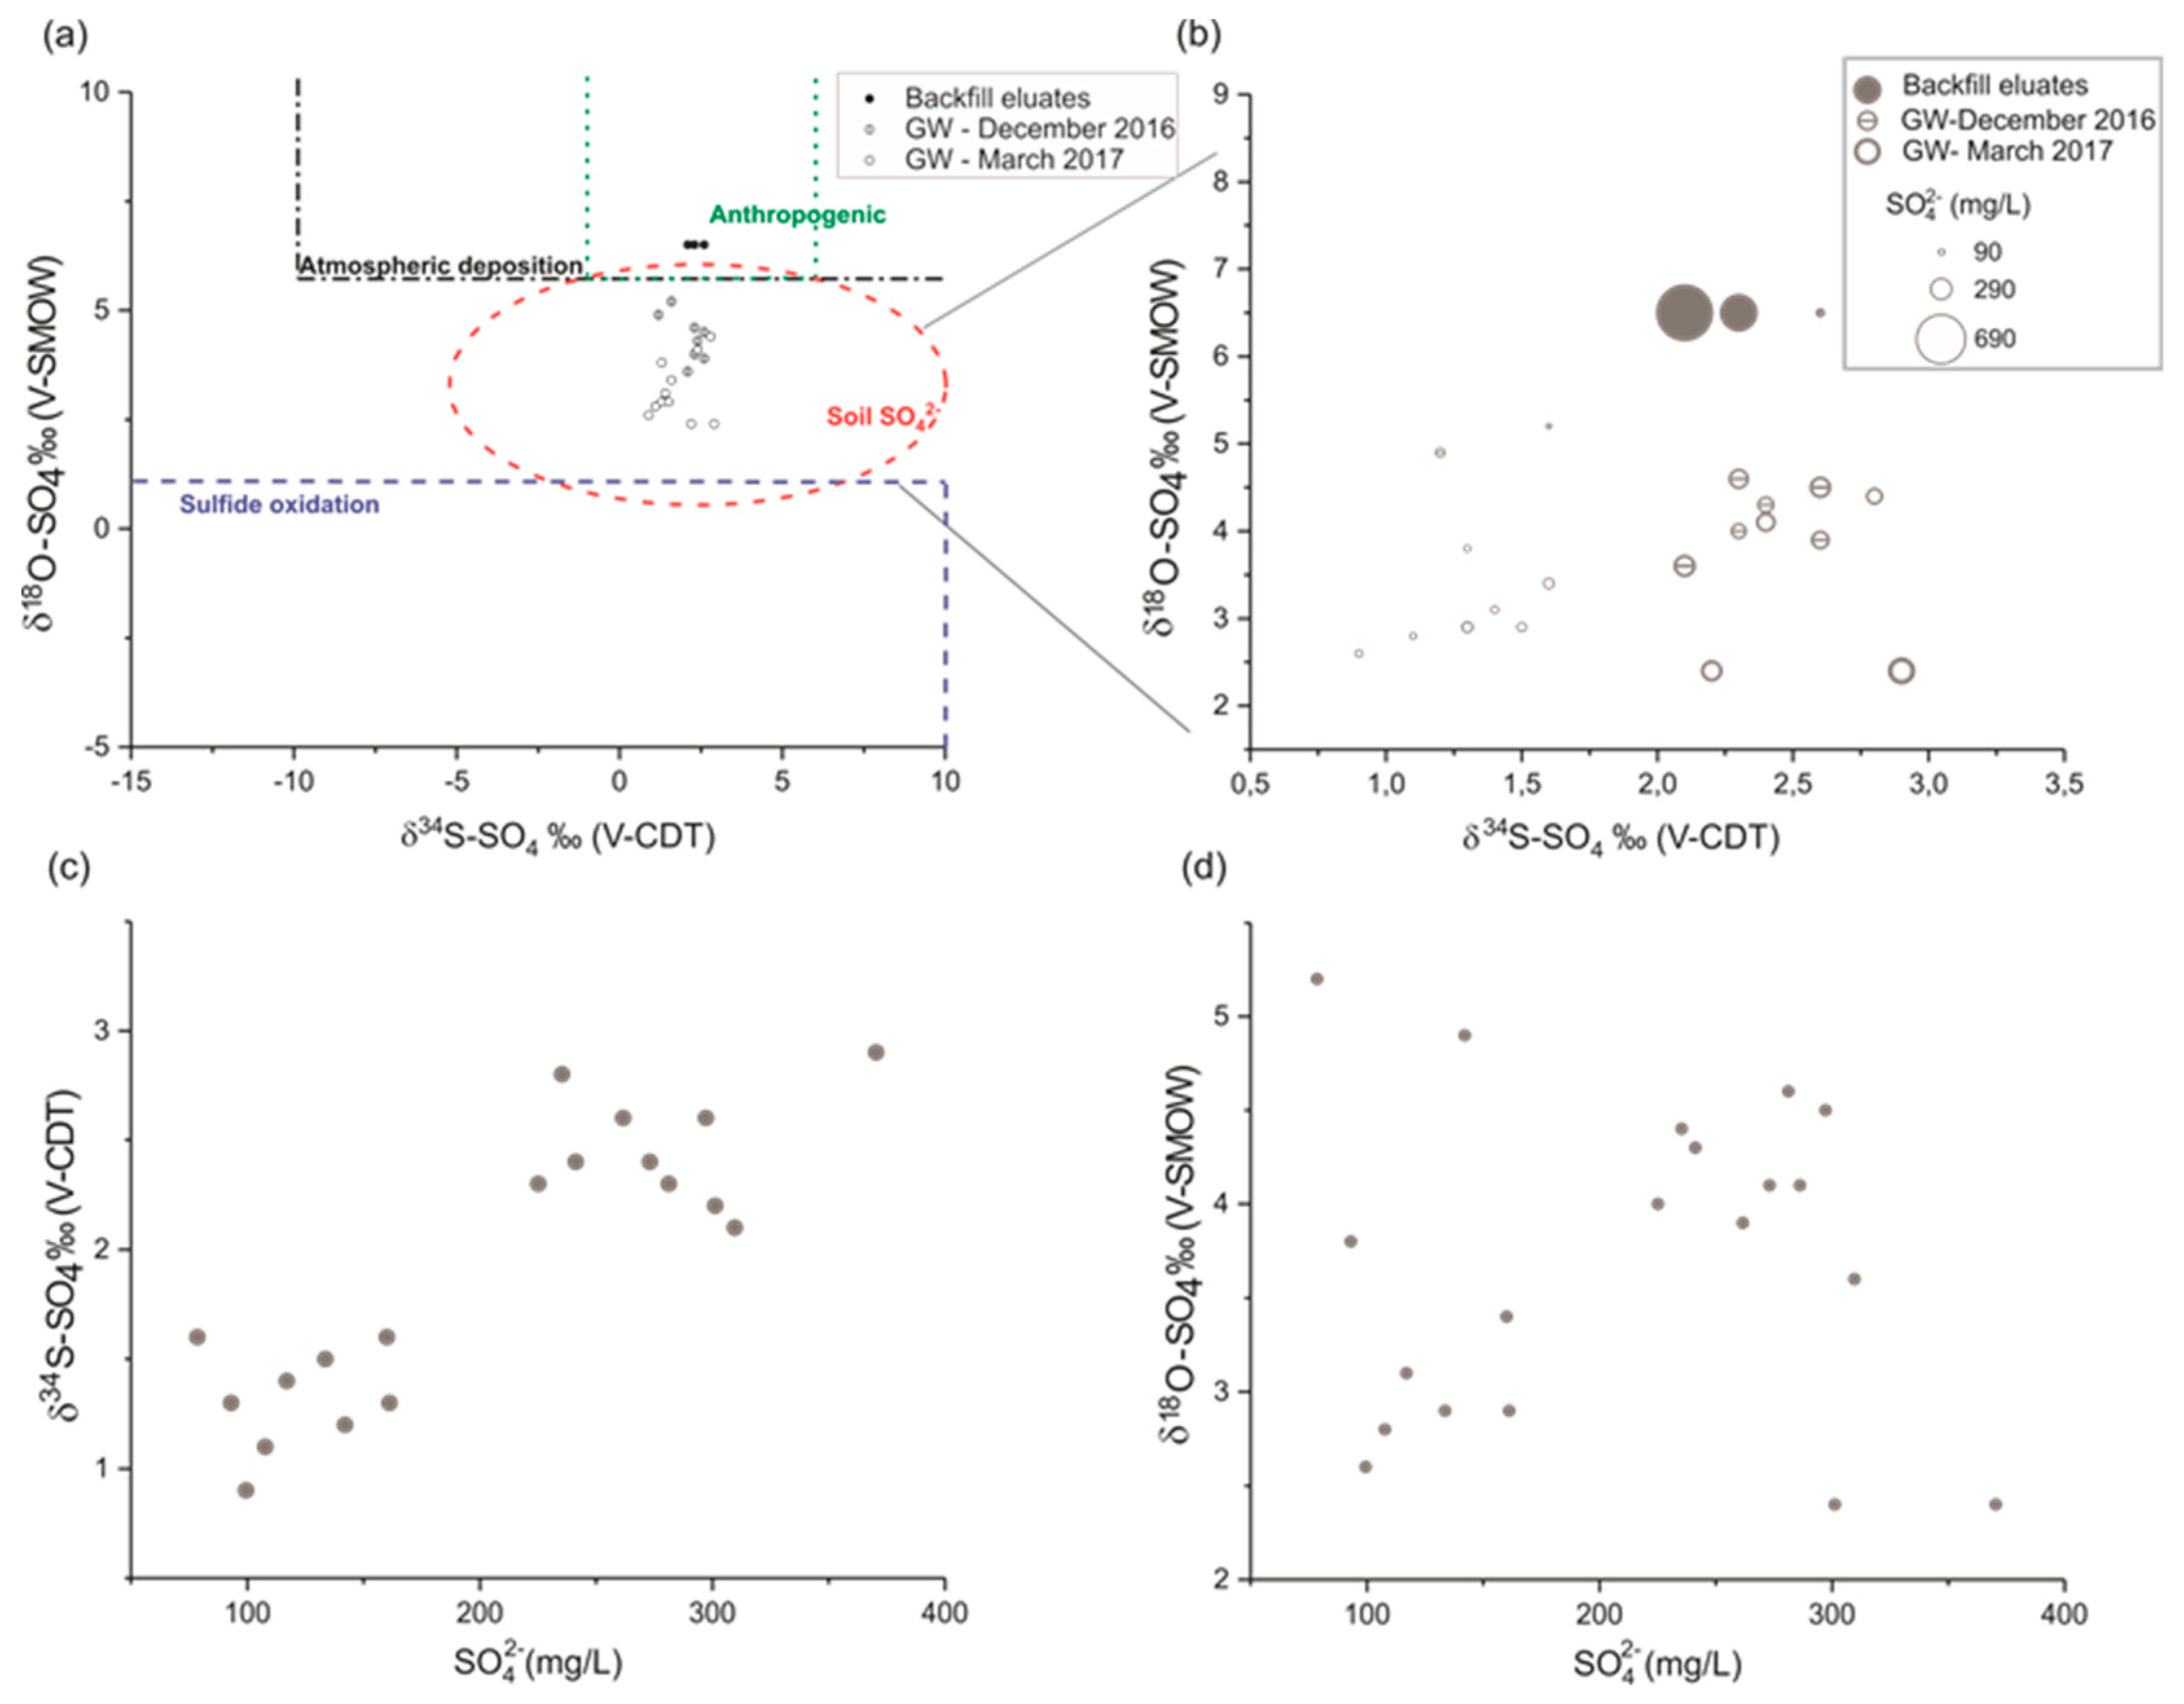
In order to confirm the calcium sulphate input in the groundwater, and to distinguish it from calcite dissolution in the chalk aquifer, both data of March 2013 and March 2017 were used to analyze the evolution of non-carbonated calcium (Ca2+-HCO3) concentrations as a function of SO42− concentrations (Figure 5). A similar approach was used by Kimblin [34] to investigate gypsum dissolution gypsum in the aquifer of Triassic Sherwood Sandstone Group (UK). The alignment of data points along a line close to the 1:1 line indicates a direct supply of calcium sulphate to the aquifer.
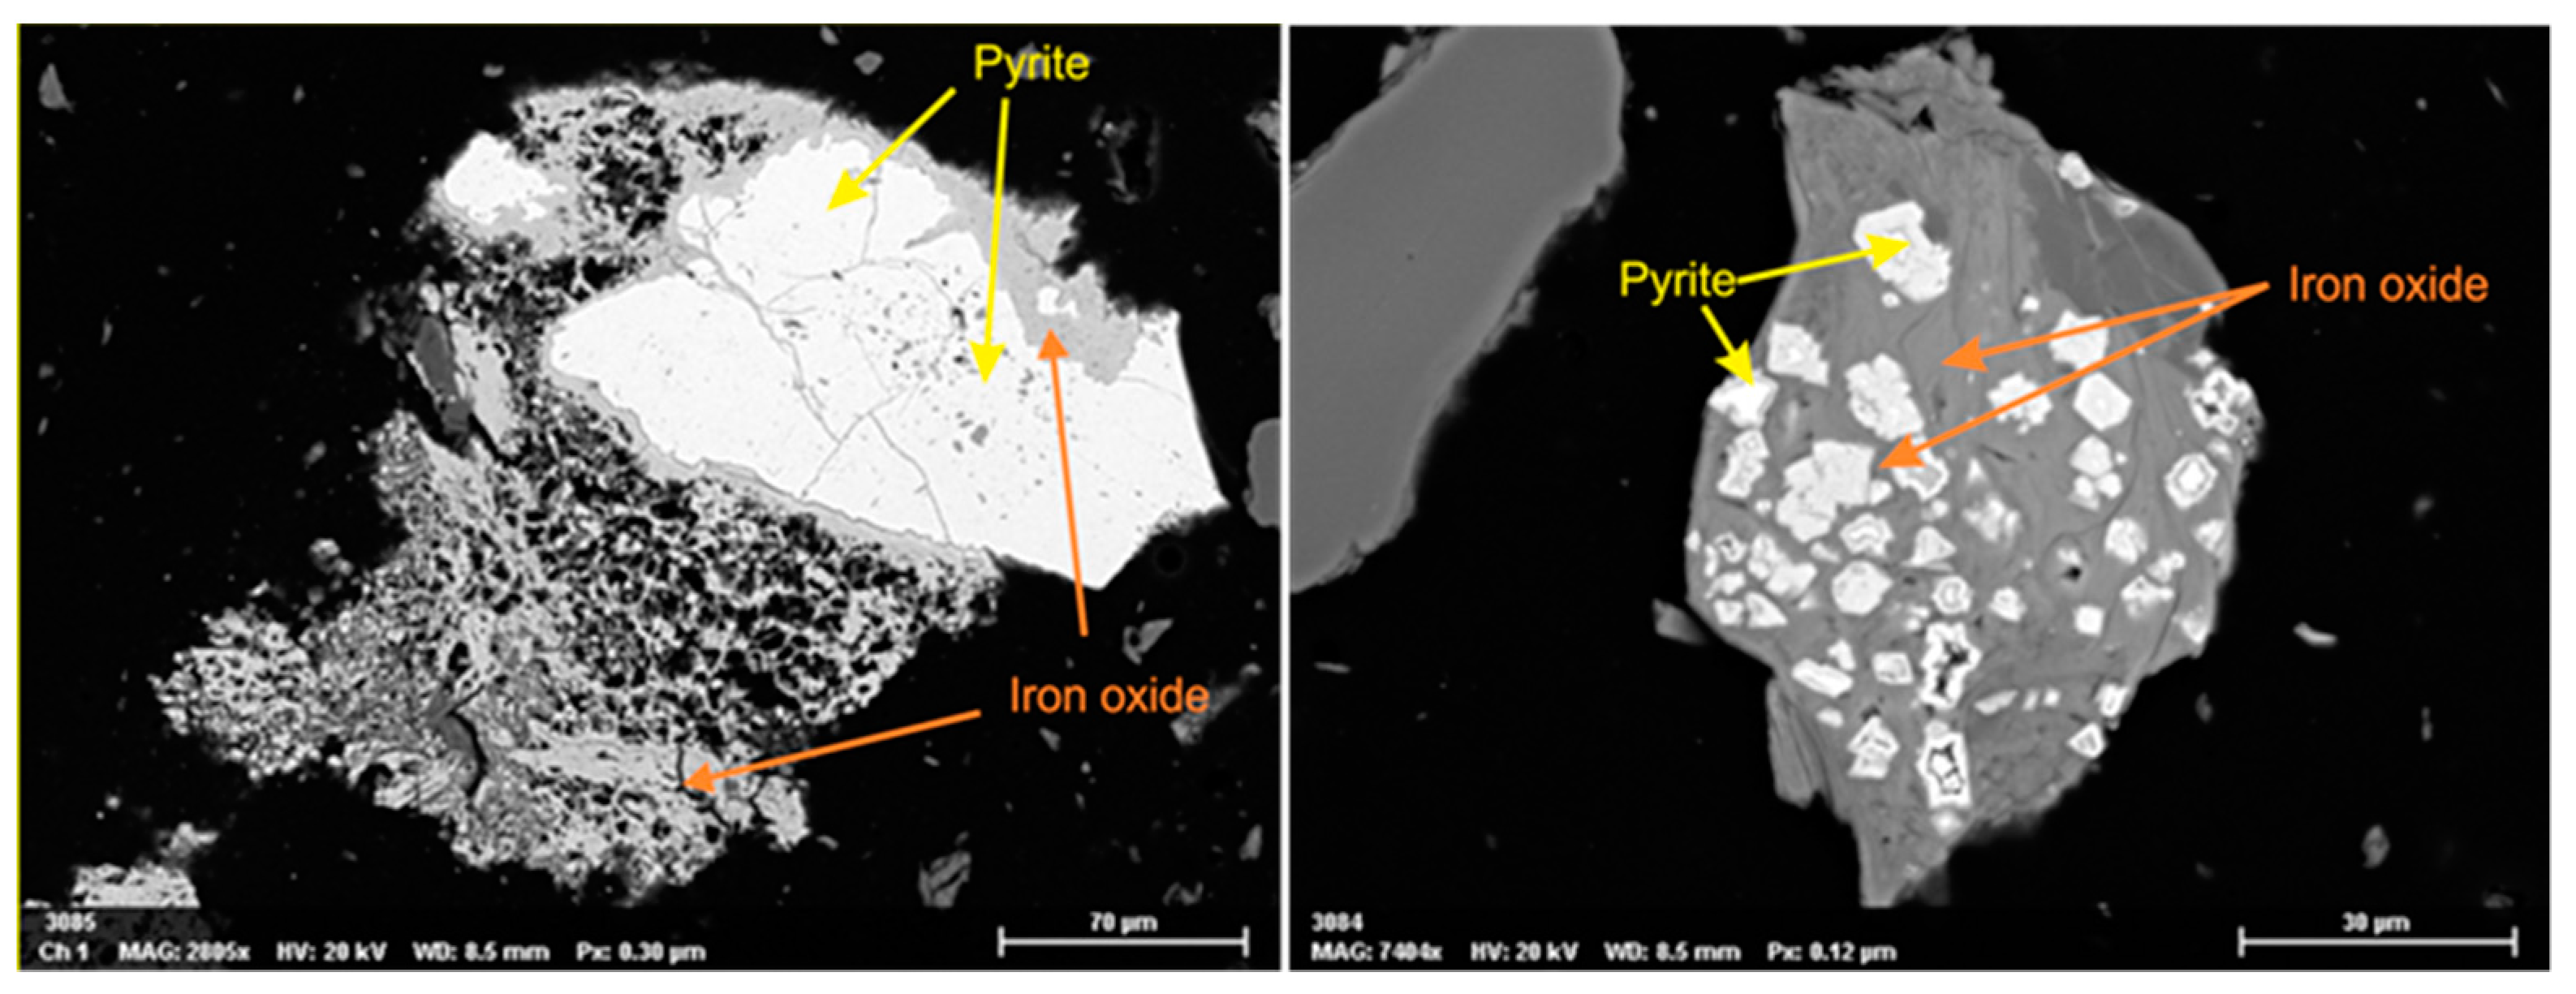
The presence of a backfill layer at the industrial site, above the observation wells that show the highest concentrations of sulphate and calcium, indicates that the backfill is the most probable source of the external input of calcium sulphate in groundwater.

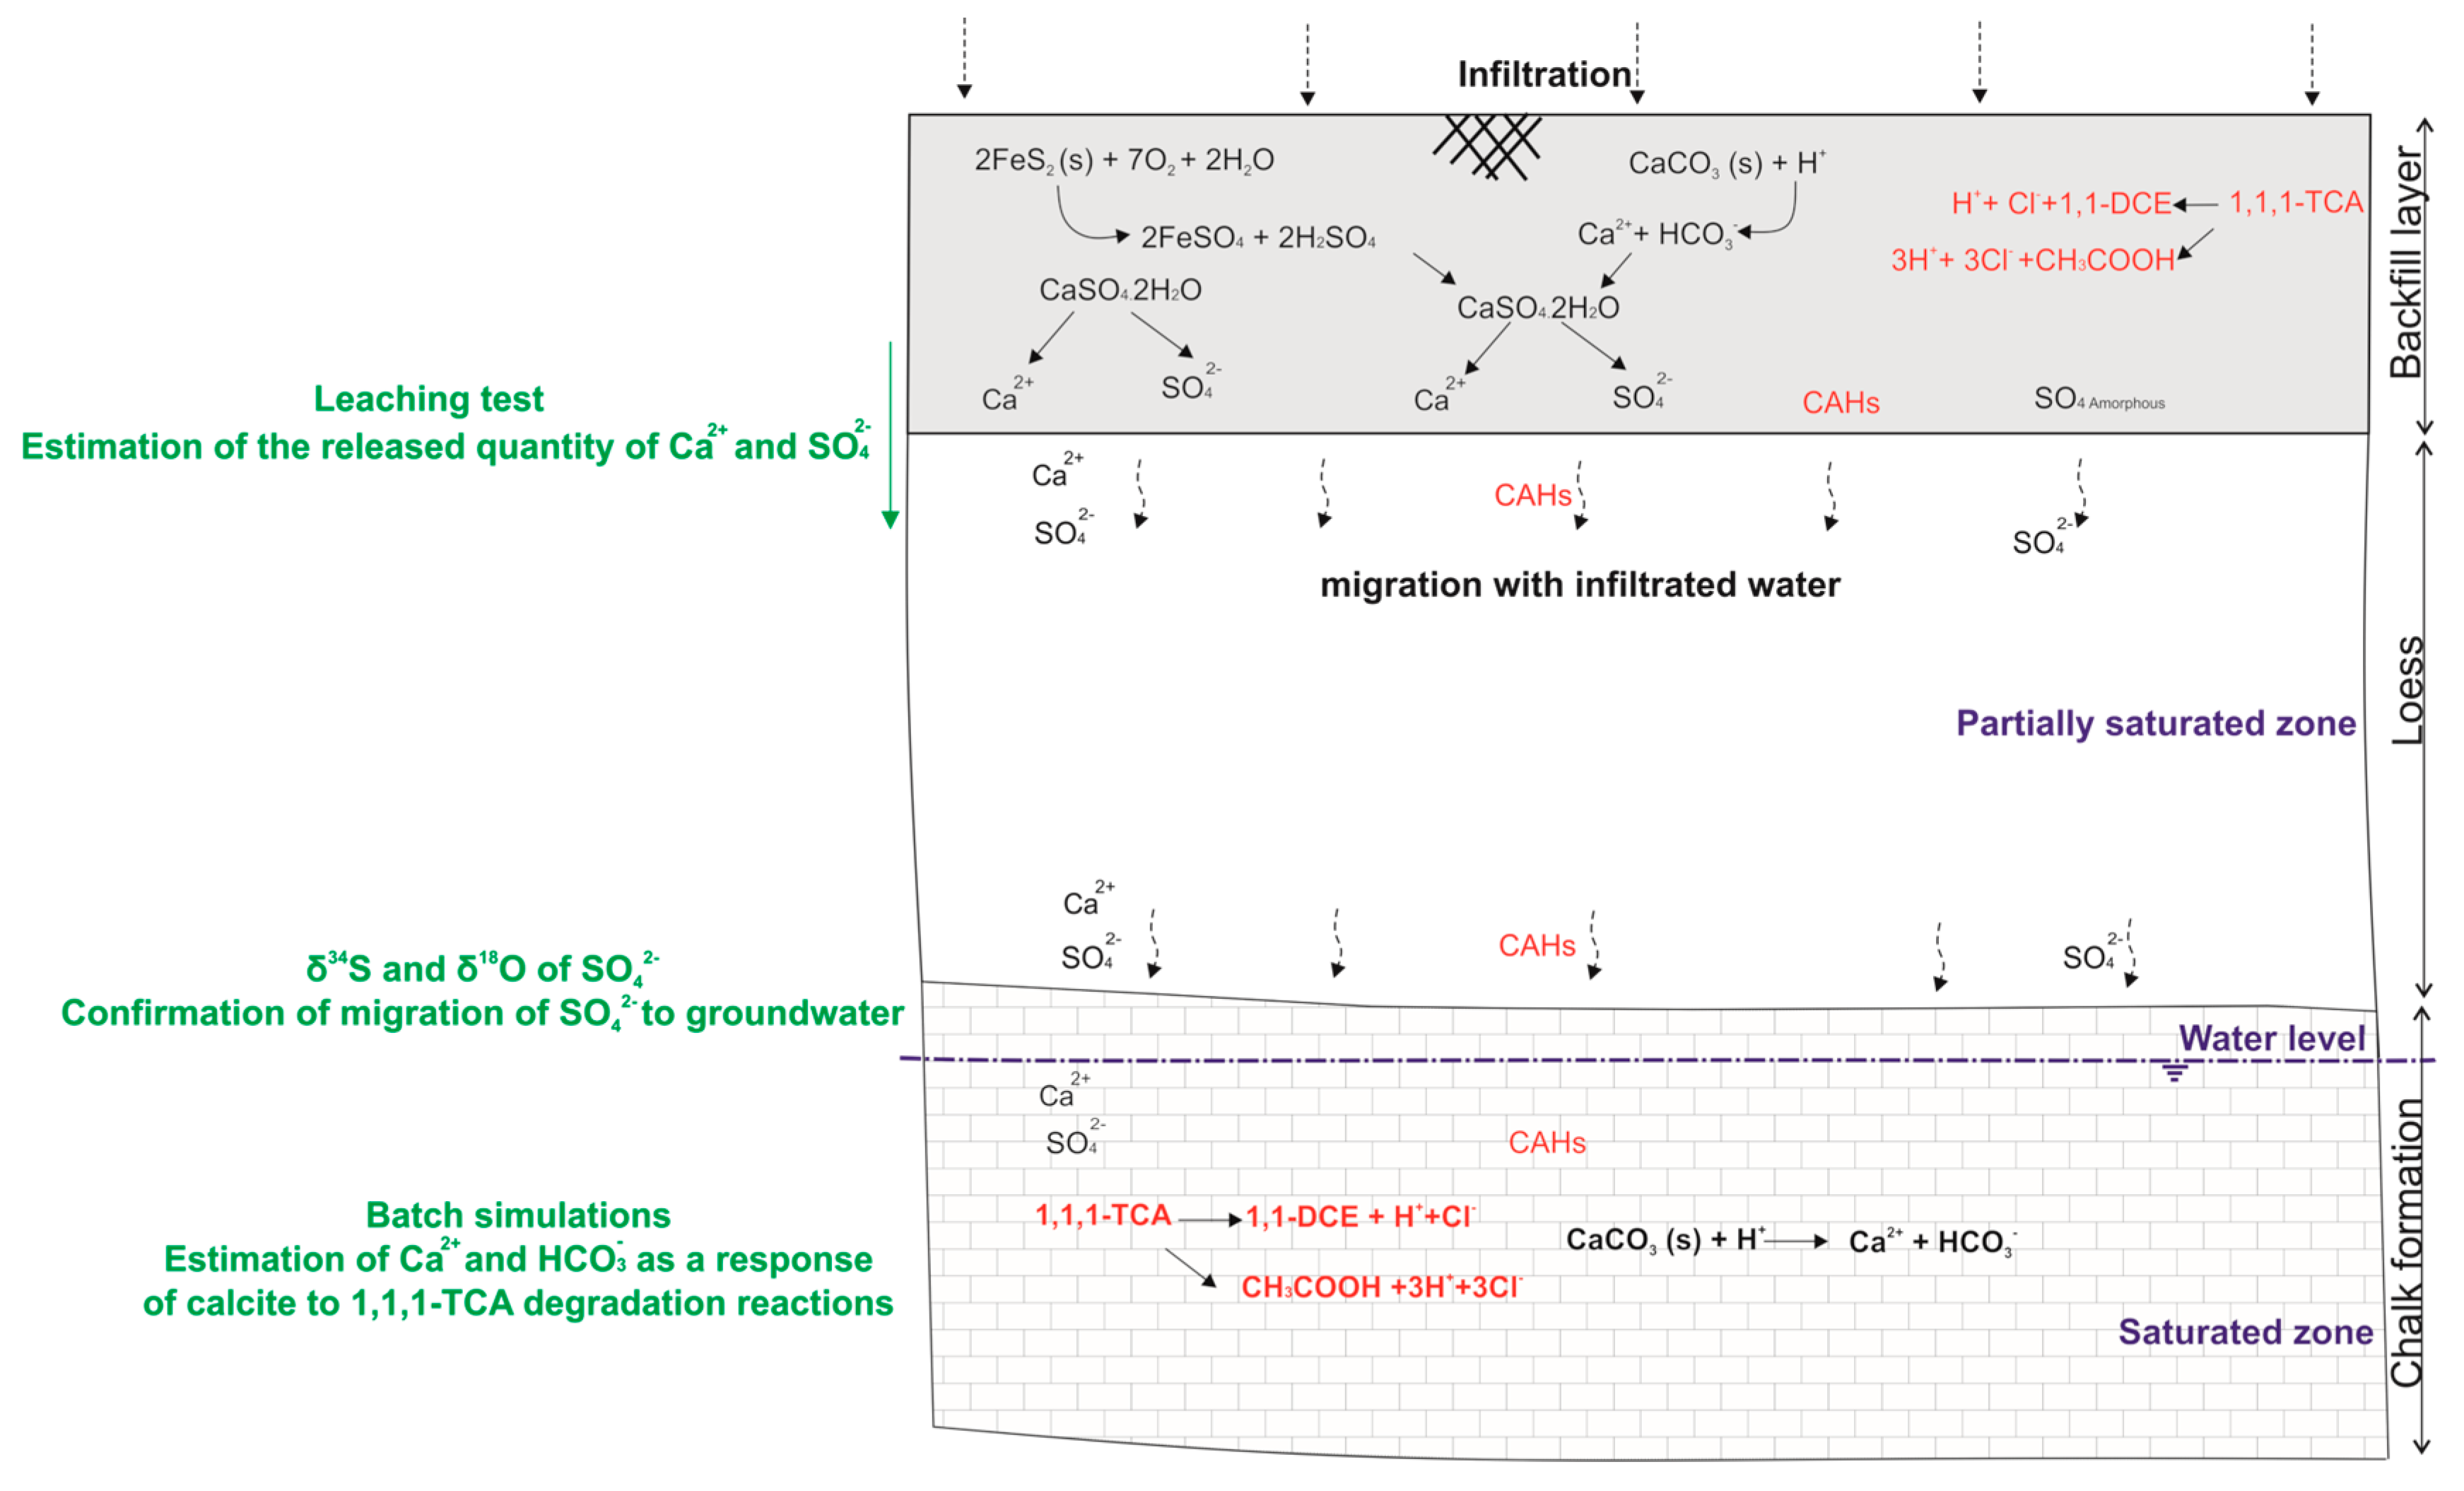
3.2. Simulation of Calcite Dissolution under Degradation Reactions

Geochemical batch simulations were performed to quantify the increase of calcite dissolution in the presence of 1,1,1-TCA degradation reactions:
CH   3 CCl   3 CH 2 = CCl   2 +   H + + Cl ( DH   reaction ) 1 , 1 , 1 TCA   1 , 1 DCE
CH   3 CCl   3 CH 3 COOH +   3 H + + 3 Cl ( HY   reaction ) 1 , 1 , 1 TCA   Acetic   acid
these two reactions show different yields due to the kinetics of HY, which is about 2.7 times faster than that of DH [35]. According to Palau et al. [36], the DH yield is about 27%. By using it with the molar balance, 1 mol of 1,1,1-TCA produces about 2.46 mol of HCl.
On the other hand, the degradation of 1,1,1-TCA by HY/DH are influenced by temperature [37]. Field temperatures enable the estimation of 1,1,1-TCA degradation rate according to Arrhenius equation:
k = A   . e x p ( E a / R T )
where k is the first order degradation constant (s−1), A is the frequency factor (s−1), R is the perfect gas constant (8.314 × 10⁻³ kJ mol−1K−1), Ea is the activation energy (kJ mol−1) and T the temperature (K). From Gauthier and Murphy [38], the constants Ea and A are assumed to be 122.8 kJ mol−1 and 8.7 × 10¹³ s−1 respectively. These values were obtained from several previous studies.
The quantity of HCl released in groundwater can be estimated for a given degradation time, using observed field concentrations, the reaction yields of Palau et al. [36], and the degradation rate obtained by the Arrhenius equation.
In order to quantify Ca2+ and HCO3 required to reach the equilibrium with calcite, the chemical composition of an assumed unpolluted sample is used by adding the estimated HCl quantity. Then, the solution is assembled with the calcite assuming equilibrium conditions in PHREEQC [29].
The half-life time was calculated from the Arrhenius equation (Equation (3)) with an average temperature of 11.92 °C obtained from observations in March 2017 (n = 27). The half-life time is 11.57 years, this means that for 1 year, 4.3% of the amount of 1,1,1-TCA degrades via HY/DH. The estimated groundwater pH changes with degradation of 1,1,1-TCA by HY/DH is summarized in Table 3.
Simulation results (Table 4) show that, for a degradation over a period of 1 year, and in the presence of only 200 µg/L of 1,1,1-TCA, the pH decreases by 0.46 units from the reference composition. Consequently, a supplement of 17.65 mg/L calcium and 53.64 mg/L bicarbonate must be released to maintain the solution in equilibrium with calcite. A concentration of 500 µg/L can decrease the pH by 0.75 unit and the equilibrium with calcite is obtained with a release of 48.14 mg/L of calcium and 146.50 mg/L of bicarbonate. To reach equilibrium with calcite for the maximum concentration 1100 µg/L of 1,1,1-TCA (observed in March 2017), the pH decreases by 0.98 unit and the dissolution of calcite increases groundwater concentrations of calcium by 95.28 mg/L and bicarbonates by 289.93 mg/L.
Using 1,1,1-TCA concentrations with observed field temperatures, these simplified simulations provide an estimation of Ca2+ and HCO3 releases in the presence of HY/DH of 1,1,1-TCA in the chalk aquifer.

4. Tests and Analyses on Backfill Soil in the Source Area

In December 2016, after remediation of the CAHs source, the backfill layer of the source zone was excavated over an area of approximately 1034 m2 and an average depth of 1.5 m. During this excavation, a backfill sample of 35.2 kg was taken in the center of the excavated zone over an area of about 10 m2 to perform two laboratory tests: (1) A leaching test according to CEN/TS 14405: 2004 [39] and, (2) a mineralogical analysis by X-ray diffraction (XRD) and scanning electron microscopy (SEM).

4.1. Leaching Test

A column leaching test was performed to characterize the backfill soil and study the release of inorganic substances. The test was carried out according to CEN/TS 14405: 2004 that is similar to ISO/TS 21268-3: 2007 [40]. After homogenization of the sample by quartering, crushing to a grain size of less than 10 mm was carried out, 4 samples were used to carry out a similar test on 4 columns. The average dry mass of one column is 3875 ± 43 g.
Due to the grain size (27.73% of the mass represents grains exceeding 10 mm), an inner diameter of 10 cm was selected for the column. The filled height for each column is about 32 cm with a quartz filtration layer (1 cm thick) and a filter paper (pores size <8 µm) at both extremities of the column. Demineralized water (0.1 µS/cm) is used as eluent, the flow in the column is ascending with a linear velocity of 15 ± 2 cm/day. Equilibrium time (i.e., the time at rest between the column saturation and the beginning of the test) was 96 h to reach the equilibrium between the solid grains and the water.
The collected ‘liquid to solid fractions’ (L/S) were: 0.1 ± 0.02, 0.2 ± 0.04, 0.5 ± 0.08, 1 ± 0.15, 2 ± 0.3, 5 ± 0.4, and 10 ± 1 L/kg. Eluates were filtered off-line with 0.45 µm membrane filters and analyzed for the same hydrochemical elements and using methods described in Section 3.1. The pH and the electrical conductivity were measured twice for each L/S fraction, first during the test and second during the chemical analyses.
For each analyzed element, the results are expressed as an average (on the 4 columns) with standard deviation (Figure 6). After a 96-h period, equilibrium conditions (pH difference < 0.5 unit) were reached without the need for water recirculation. pH and electrical conductivity measured during the test are shown in Figure 6a,b. The pH values are ranging between 7.38 and 8.7 with a slight increase from the beginning to the end of the test. Electrical conductivity decreases significantly from 1585 µS/cm to 92.35 µS/cm due to the depletion of leachable elements of the backfill during the test.
For each analyzed element, a decrease in concentrations was observed during the test with very low concentrations in the last L/S fractions.
Figure 6c,d shows the average concentrations of SO42− and Ca2+ in mg/L. The maximum concentration of SO42− was 984.62 mg/L, it was obtained for the first fraction of one of the columns. Although this concentration is below the inert waste acceptance limit of the European Directive 2003/33/EC (1500 mg/L for the 0.1 L/kg fraction) [41], it is significant in the present case because the tested samples were taken on site where the backfill was exposed to a partial leaching by the natural infiltration water for years (before being excavated).
In the beginning of the test, between 0.1 and 1 L/kg fractions, the relative chemical composition of eluates shows that (in meq/L) sulphate dominates the anions while calcium dominates the cations. Sulphate concentration declines from 844.26 mg/L to 126.80 mg/L. After 1 L/S fraction, it decreases following a different slope to reach 3.68 mg/L in the final test fraction. Calcium concentrations decrease from 276.48 mg/L at the beginning of the test to a concentration of 11.71 mg/L at the final test fraction. The other elements show lower concentrations compared to sulphate and calcium. HCO3 concentrations decrease from 96.61 mg/L for the first fraction to 38.60 mg/L at the end of the test. Whereas Na+ concentrations decrease from 76.68 to 0.35 mg/L. The other elements, not presented in this section, show lower concentrations that have limited influence on the global ionic balance.
Ca-SO4 is the dominant hydrochemical facies in eluates between fractions 0.1 and 1 L/kg. Further, eluates are less charged with SO42− and the facies changed into a calcium bicarbonate Ca-HCO3.
The average cumulative releases in mg/kg are shown in Figure 6e,f. Values are obtained using the equation [39]:
U i = ( V i × C i ) / m 0
i: index of the eluate fraction, Ui: average cumulative released quantity of a component per mass of the sample at the fraction i, expressed in milligram per kilogram of solid mass (mg/kg solid mass); Vi: volume of the eluate fraction i expressed in liters (L), Ci: concentration of the component concerned in the eluate fraction i (mg/L), mo: solid mass of the test sample expressed in kilogram (kg).
The most important quantities of sulphate are released during the first four fractions. The cumulative quantities gradually increase from 85 mg/kg for the 0.1 L/S fraction to 302.5 mg/kg for the 1L/kg fraction. Further, the increase is less important, and the cumulative value reaches 400.06 mg/kg at the end of the test. This value is lower than the inert waste acceptance limit for sulphate waste according to European Directive 2003/33/EC (1000 mg/kg for L/S = 10 L/kg) [41] but it remains considerable for a backfill layer that was placed 40 years ago.
The calcium evolution is different from that of sulphate. After the fraction 1 L/kg, the slope is steeper than before, meaning that more calcium is dissolved at the end of the test with a final released quantity of 235.01 mg/kg for the last fraction.

Application at the Site Scale

To contextualize the results of the test, we estimated the actual time required to reach the L/S ratios, the total mass released from the entire backfill and the concentration in the recharge water for SO42− and Ca2+ (Table 5). Cumulative release estimated from the test were used for extrapolation at the scale of the entire backfill using the following data: an area of 1034 m2, an average thickness of 1.5m, a bulk density of 1500 kg/m³, an average infiltration of 260 mm/year [26].
Considering an average recharge of 260 mm/year, the 0.1 L/kg ratio is reached after a period of around 0.86 year. Based on the calculation assumptions made for this specific site, for this ratio, the total mass of SO42− leaching from the backfill is approximately 198 kg and the concentration in the infiltrated water is about 849.79 mg/L. Ca2+ quantity is about 66.45 kg and its concentration in the groundwater is about 285.62 mg/L. The 2 L/kg ratio is reached after 17.18 years and the cumulative total leaching mass is 806.83 kg for SO42− and 303.05 kg for Ca2+. At this time, the corresponding average concentrations in infiltration water is decreased to 173.40 mg/L and 65.13 mg/L respectively. The last fraction of the test (10 L/kg) corresponds to a period of 85.88 years. The cumulative leached mass is then 930.71 kg for sulphate and 546.76 kg for calcium. Concentrations in infiltration water are low for this fraction because it is the one with the lowest dissolved solutes, with 40 mg/L of SO42− and 23.5 mg/L of Ca2+.
During the four first fractions (from 0.1 to 1 L/kg) which correspond to a duration of about 8.6 years, practically 76% of the total sulphate mass is leached and the rest is leached over a period of about 77 years.
The results of this test, mainly for the four first fractions, have confirmed that the backfill is potentially an important source of calcium and sulphate that can be released in the infiltrating water to reach the saturated zone. Transport time in the unsaturated loess layer, between the backfill layer and the saturated zone (1 m/year, see above), is not considered in this assessment. This means that, on the one hand, pollutants has got enough time to be transferred by infiltration through the whole thickness of the unsaturated zone (about 18 m), and on the other hand, the released quantities were most probably higher in the past than what we estimated from the leaching tests (i.e., performed on recent and somehow depleted backfill samples).

4.2. Mineralogical Analysis

A mineralogical analysis was carried out to identify the main mineral phases that are present in the backfill. First, XRD analyses were carried out. After quartering, 4 sub-samples of few grams, crushed and sieved to less than 150 µm, were placed in a sample holder by simple pressure to limit any preferential orientation of the minerals according to the Moore and Reynolds method [42]. The diffraction spectrum is recorded for diffraction angles between 2 and 70° 2 theta on the Bruker D8-Advance diffractometer (copper Kα1 radiance, λ = 1.5418 Å). Mineral identification was done by using the EVA 3.2 software and is then quantified via Topas the Bruker’s software using Rietveld’s refinement method [43].
Second, to complete the XRD analysis, SEM analysis were performed on one sample obtained after quartering and crushing to less than 1000 µm. A sample of few grams was used to obtain a polished section impregnated in an epoxy resin. Initially, an optical microscope analysis was carried out with the Zeiss Axio Imager.M2m microscope to pre-select areas of interest for advanced analysis of minerals under the electronic microscope (SEM). The individual stoichiometry of minerals was determined with a SEM (Zeiss Sigma 300) equipped with two energy dispersive spectrometers (EDS, Silicon Drift Detector XFlash by Bruker, 30 mm2) with operating conditions: 20 keV, ~200 µA and a work distance of 8.5 mm.
For the four backfill samples, XRD results show almost identical diffractograms. The detected minerals are quartz, calcite, silicates (micas, plagioclase, chlorite, orthoclase, kaolinite, amphibole) and hematite. No sulphate nor sulphide minerals have been detected. Table 6 summarizes mineral quantification for the four analyzed samples.
Minerals proportions are very similar in all samples; the standard error is less than 1% for all detected minerals. Quartz is the dominant mineral with an average quantity of 50.2%, followed by 38% of silicates (including 14.3% of micas). Detected calcite quantity is 10.5%, and hematite corresponds to 1.4%. The presence of calcite can be explained by the recycled construction materials in the backfill layer and by the nature of the underlying loess that may also contain calcite. Micaceous shales are present in local Carboniferous formations locally called ‘Houiller’ formations [44]. Those formations were intensively exploited in the past for coal production, producing a lot of shaly waste at that time (i.e., often used as backfill materials in different places). In addition, micaceous sandstones have been widely used in construction [45]. The presence of mica in the backfill is therefore most likely from those ‘Houiller’ shales wastes and from recycled construction materials.
SEM results showed traces of pyrite with an advanced oxidized state surrounded by iron oxide (Figure 7). This explains the detection of hematite (Fe2O3) in backfill samples by XRD. The presence of Hematite in cases of pyrite oxidation under room temperature conditions were reported in different studies [46].
Our results confirm that the backfill shales contained initially pyrites that oxidized in the presence of oxygen and infiltrating water, releasing sulphate in the environment (Reaction (5)):
  2 FeS 2 ( s ) + 7 O 2 + 2 H 2 O 2 FeSO 4 + 2 H 2 SO 4
Gypsum is often associated with recycled construction materials in Belgium [47]. In our case, even if gypsum was not detected, it could be initially present in the backfill within the recycled construction materials. On the other hand, it can be formed in the presence of SO42− ions (Reactions (7) and (8)) and calcite in acidic conditions (Reaction (6)) created by pyrite oxidation and by HY/DH of 1,1,1-TCA (Reactions (1),(2) and (5)). In addition, the presence of a clear input of calcium and sulphate in groundwater (see Section 3.1) also supports this interpretation.
Acidity neutralization by calcite dissolution:
CaCO 3 ( s ) + H + Ca 2 + + HCO 3
Gypsum resulting from reaction between sulphuric acid and calcite:
H 2 SO 4 + CaCO 3 ( s ) + 2 H 2 O CaSO 4 .2 H 2 O + CO 2
Gypsum formation from sulphate and calcium ions:
Ca 2 + + SO 4 2 + 2 H 2 O CaSO 4 .2 H 2 O ( s )
The dominance of sulphate in the ionic balance of the leaching test eluates and the significant released quantities, combined with XRD results, allow to conclude that it is very likely that some sulphate in the backfill existed under an amorphous form that is not identifiable correctly by mineralogical analyses.

5. δ34S and δ18O of SO42− in Backfill Eluates and in Groundwater

The isotopic composition of dissolved sulphate (δ34S et δ18O de SO42−) was studied to identify the origin of sulphate concentration increases in the study area. This was done by performing analyses on groundwater samples as well as on backfill eluates.
For groundwater, 8 points were sampled in December 2016 near the CAHs source zone. In March 2017, during the measurement and sampling campaign presented in Section 3.1, 11 samples were collected from the monitoring network. For backfill eluates, analyses were performed on the first four fractions (0.1, 0.2, 0.5, and 1 L/kg), taken from the same column. Polyethylene vials of 500 mL were used with a pinch of zinc acetate to stabilize the solution. Isotopic analyses were carried out in the laboratory of the Centre for Environmental Research Leipzig (UFZ). The method is based on the precipitation of BaSO4 first, and then analyzing each isotopic ratio in this BaSO4 precipitate. For the sulphur isotope, BaSO4 is converted to SO2 by a continuous flow combustion technique coupled with isotope ratio mass spectrometry (delta S, Thermo Finnigan). The result is expressed in ‰ of δ34S of the deviation from Cañon Diablo Troilite (CDT). For the oxygen isotope, the used technique consists in a pyrolysis at high temperature (1450 °C) in a TC/EA connected to a delta plus XL mass spectrometer (Thermo Finnigan, Bremen, Germany). The result is expressed in ‰ of δ18O of the deviation from the Vienna Standard Mean Ocean Water (VSMOW) standard. The analytical error is ±0.3‰ for δ34S and ±0.5‰ for δ18O.
The results showed that for the eluate, δ34S is quantified between 2.1 and 2.6‰ while δ18O is the same for the 4 samples at 6.5‰. For groundwater in December 2016, δ34S ranged between 1.2 and 2.6‰ while δ18O ranged between 3.6 and 5.2‰. For March 2017 campaign, δ34S was between 0.9 and 2.9 ‰ while δ18O varied between 2.4 and 4.4‰.
δ34S results versus δ18O for all analyzed samples are shown in Figure 8a where they can be compared to typical domains of known sulphate sources reported by Mayer [48]. Results are also shown with regards to sulphate concentrations in Figure 8b (where the point size represents the relative sulphate concentration). The isotopic signature of leachate sulphate from the backfill eluates is close to that observed in groundwater. Compared to Mayer’s sulphate sources [48], groundwater samples match with the ‘soil SO4 ’ zone, which includes organic (ester and CS-mineralization) and inorganic sulphides. The eluate samples from the backfill are within the anthropogenic source zone of atmospheric deposition near the boundary of the ‘soil SO4 ’ zone.
As described previously, the studied backfill soil may be highly heterogeneous: a mixture of sandy loamy soil with recycled construction and mining wastes that contain shale and coal in small quantities. The isotopic signature of sulphate in this backfill therefore represents the signature of different anthropogenic sources.
In an urban context, Bottrell et al. [17] studied, using isotopes, sulphate sources around the city of Birmingham. Sulphate isotopic signature, for a group of wells in the city center and some industrial sites, was quite similar to our study results with δ34S between 0.2‰ and 3.2‰ and δ18O between 2.8‰ and 7.73‰. This isotopic signature was interpreted as from SO42− urban pollution resulting from artificial (made ground) soils and/or from wastewater.
The isotopic signature obtained in our study reflects a mixture between background sulphate in the aquifer and additional sulphate released from the backfill layer. In the study by Jurado et al. [49], the isotopic signature of SO42− in the same aquifer for points with low sulphate concentrations (between 34.54 and 71.49 mg/L) was between −2.08‰ and −0.13‰ for δ34S, and between 2.1‰ and 4.3‰ for δ18O. These results are similar to our sampling points with low SO42− concentrations, and therefore we can consider these values as the natural background signature of sulphate in the chalk aquifer.
Locally, in the study area, the higher the sulphate concentrations increase, the more we have an enrichment of SO42− in groundwater at δ34S and δ18O, and a trend towards the isotopic signature of backfill eluates Figure 8c,d. Sampling wells showing the highest SO42− concentrations are located below the backfill of the industrial site.
The increase in sulphate concentration is clearly accompanied by an increase of δ34S-SO4. For δ18O-SO4, this trend is not so evident because of the background isotopic signature of sulphate in groundwater comes mainly from the mineralization of organic matter which causes a depletion in δ18O-SO4 but not of δ34S-SO4 which does not show significant fractionation through this process [50].

6. Synthesis of Process Leading to Groundwater Mineralization Changes

The main processes explaining groundwater mineralization changes that occurs at the industrial site are conceptually summarized in Figure 9:
The investigated backfill layer had been in place for more than 40 years prior the present study. It is made of a mixture of materials with considerable calcium sulphate release capacity. The detected traces of oxidized pyrite with hematite indicate that the backfill soil contained pyrite in the past. Gypsum was also present, either with recycled building materials or formed as a result of calcite reaction to acidity. Some sulphate in the backfill soil were in amorphous form. In addition, the improper handling of products containing CAHs has produced a contamination of soil and groundwater. The mixture of pollutants had enough time to percolate across the unsaturated zone with the infiltrated water to reach the saturated zone.
The current groundwater hydrochemistry changes have resulted from the combination of an increase of calcite dissolution along with the migration of calcium and sulphate from the backfill soil, as verified by the correlation of sulphate concentrations with non-carbonated calcium (Ca-HCO3). Furthermore, isotopic analyses results confirm the mixing between the sulphate released from the backfill soil with the background sulphate in the aquifer.
Considering the leaching test results for the first 4 fractions, where easily leachable components are leached quite extensively, calcium and sulphate are the dominant compounds in the backfill eluates. Results extrapolation at the field scale shows that for a period between 0.86 to 8.59 years, the infiltrated water passing through the backfill layer produces leachate with sulphate concentrations between 9.2 and 3.3 times the background concentrations of sulphate in the aquifer. While for calcium, for the same duration, concentrations in infiltrated water correspond to values between 1.9 and 0.7 times the background concentration of calcium in the aquifer.
On the other hand, geochemical simulations provided an assessment of calcite dissolution in groundwater in the presence 1,1,1-TCA degradation reactions. Results showed that for the maximum concentration of 1,1,1-TCA (1100 µg/L) observed in groundwater, HY/DH degradation reactions decrease the pH by a value of 1.01 units for a 1-year degradation time. Consequently, the calcite dissolution produces an additional amount of 0.64 times the background calcium concentration, and 0.93 times the background bicarbonates concentration.

7. Conclusions

Through this study, the understanding of a pollution problem in the considered chalky aquifer was improved. Using a combination of tests on the backfill material extracted from the site and groundwater quality analyses, the mechanisms that lead to changes in groundwater mineralization at this site was clarified. These changes are mainly due to two sources. The first is the increase in calcite dissolution as a buffer reaction to the acidity released by the degradation of 1,1,1-TCA by HY/DH. Geochemical simulation results showed that calcite can release up to 95.28 mg/L of calcium and 289.93 mg/L of bicarbonate during one year of 1,1,1-TCA degradation.
The backfill layer at the industrial site represents a second source that affected the hydrochemistry by releasing calcium sulphate that migrated to the saturated zone with recharge water. Leaching test results showed that for a period between 0.86 and 8.59 years, the average concentration in backfill leachate is 302.52 mg/L for sulphate and 104.39 mg/L calcium.
Thus, in the present case study, the improper backfill materials quality caused an additional pollution source influencing groundwater mineralization. A better control of backfilling materials would have prevented a part of the groundwater contamination. Furthermore, the advanced characterization of backfill soil and groundwater hydrochemistry provided an appropriate estimation of the effect of 1,1,1-TCA degradation reactions on the hydrochemistry compared to backfill leachates effect, leading to a more correct conceptual site model that will improve the remediation plan.
The current research demonstrated also the benefits of analyzing major inorganic chemical elements in cases of local pollution with organic pollutants such as CAHs. These analyses not only make it possible to identify other potential pollutions, but also to improve the understanding of CAHs degradation reactions in groundwater.

Author Contributions

Conceptualization, Y.B., S.B. and A.D.; methodology, Y.B., S.B., P.O. and A.D.; investigation, Y.B. and D.G.; resources, P.J., D.G. and A.D.; writing—original draft preparation, Y.B.; writing—review and editing, S.B. and A.D.; supervision, S.B. and A.D.

Funding

This research was partly funded by the research unit Hydrogeology and Environmental Geology at the University of Liège.

Acknowledgments

Many thanks to Joël Otten for XRD analysis on soil samples and for the analysis of inorganic chemical elements performed on water samples at the University of Liège. The authors are grateful to Dr. Kay Knöller from UFZ for the isotopic analysis. Many thanks to Dr. Mohammed Tayeb Sadani and to Youcef Hakimi for their enriching discussions.

Conflicts of Interest

The authors declare no conflict of interest.

References

  1. Westrick, J.J.; Mello, J.W.; Thomas, R.F. The Groundwater Supply Survey. J. Am. Water Work. Assoc. 1984, 76, 52–59. [Google Scholar] [CrossRef]
  2. Lawrence, S.J. Description, Properties, and Degradation of Selected Volatile Organic Compounds Detected in Ground Water—A Review of Selected Literature. U.S. Geol. Surv. Open-File Rep. 2006, 2006–2133, 65. [Google Scholar] [CrossRef]
  3. Higgo, J.J.W.; Nielsen, P.H.; Bannon, M.P.; Harrison, I.; Christensen, T.H. Effect of geochemical conditions on fate of organic compounds in groundwater. Environ. Geol. 1996, 27, 335–346. [Google Scholar] [CrossRef]
  4. Wiedemeier, T.H.; Rifai, H.S.; Newell, C.J.; Wilson, J.T. Natural Attenuation of Fuels and Chlorinated Solvents in the Subsurface; John Wiley & Sons, Inc.: Hoboken, NJ, USA, 1999; ISBN 9780470172964. [Google Scholar]
  5. Stroo, H.F.; Ward, C.H. (Eds.) In Situ Remediation of Chlorinated Solvent Plumes; Springer: New York, NY, USA, 2010; ISBN 1441914013. [Google Scholar]
  6. Chapelle, F.H. The significance of microbial processes in hydrogeology and geochemistry. Hydrogeol. J. 2000, 8, 41–46. [Google Scholar] [CrossRef]
  7. Azadpour-Keeley, A.; Keeley, J.W.; Russell, H.H.; Sewell, G.W. Monitored Natural Attenuation of Contaminants in the Subsurface: Processes. Groundw. Monit. Remediat. 2001, 21, 97–107. [Google Scholar] [CrossRef]
  8. Wiedemeier, T.H.; Swanson, M.A.; Moutoux, D.E.; Gordon, E.K.; Wilson, J.T.; Wilson, B.H.; Kampbell, D.H.; Haas, P.E.; Miller, R.N.; Hansen, J.E. Technical protocol for evaluating natural attenuation of chlorinated solvents in groundwater. Cincinnatiohiousa: Usepa Natl. Risk Manag. Res. Lab. Off. Res. Dev. 1998. Available online: https://clu-in.org/download/remed/protocol.pdf (accessed on 21 August 2019).
  9. Field, J.; Sierra-Alvarez, R. Biodegradability of chlorinated solvents and related chlorinated aliphatic compounds. Rev. Environ. Sci. Bio/Technol. 2004, 3, 185–254. [Google Scholar] [CrossRef]
  10. Doherty, R.E. A History of the Production and Use of Carbon Tetrachloride, Tetrachloroethylene, Trichloroethylene and 1,1,1-Trichloroethane in the United States: Part 2—Trichloroethylene and 1,1,1-Trichloroethane. Environ. Forensics 2000, 1, 83–93. [Google Scholar] [CrossRef]
  11. McCarty, P.L. Biotic and abiotic transformations of chlorinated solvents in ground water. In Proceedings of the Symposium on Natural Attenuation of Chlorinated Organics in Ground Water, Dallas, TX, USA, 11–13 September 1996; pp. 5–9. [Google Scholar]
  12. Tobiszewski, M.; Namieśnik, J. Abiotic degradation of chlorinated ethanes and ethenes in water. Environ. Sci. Pollut. Res. 2012, 19, 1994–2006. [Google Scholar] [CrossRef] [Green Version]
  13. Scheutz, C.; Durant, N.D.; Hansen, M.H.; Bjerg, P.L. Natural and enhanced anaerobic degradation of 1,1,1-trichloroethane and its degradation products in the subsurface—A critical review. Water Res. 2011, 45, 2701–2723. [Google Scholar] [CrossRef]
  14. Foster, S.S.D.; Morris, B.L.; Chilton, P.J. Groundwater in urban development-a review of linkages and concerns. Iahs Publ. 1999, 259, 3–12. [Google Scholar]
  15. Foster, S.S.D. The interdependence of groundwater and urbanisation in rapidly developing cities. Urban Water 2001, 3, 185–192. [Google Scholar] [CrossRef]
  16. Chambel, A.; Duque, J.; Madeira, M.M. HYDROCHEMICAL QUALITY OF GROUNDWATER IN URBAN AREAS OF SOUTH PORTUGAL. In Urban Groundwater Management and Sustainability; Springer: Dordrecht, The Netherlands, 2006; pp. 241–250. [Google Scholar]
  17. Bottrell, S.; Tellam, J.; Bartlett, R.; Hughes, A. Isotopic composition of sulfate as a tracer of natural and anthropogenic influences on groundwater geochemistry in an urban sandstone aquifer, Birmingham, UK. Appl. Geochem. 2008, 23, 2382–2394. [Google Scholar] [CrossRef]
  18. Howard, K.W. Urban Groundwater Issues—An Introduction. In Current Problems of Hydrogeology in Urban Areas, Urban Agglomerates and Industrial Centres; Howard, K.W.F., Israfilov, R.G., Eds.; Springer: Dordrecht, The Netherlands, 2002; pp. 1–15. ISBN 978-94-010-0409-1. [Google Scholar]
  19. Maes, E. Methodological Manual: Management of Local Soil Pollution-Notice Méthodologique: Gestion de la Pollution Locale des sols (in French). Direction de l’Etat Environnemental (DEE)-Service Public de Wallonie (SPW). Available online: http://etat.environnement.wallonie.be/files/indicateurs/SOLS/SOLS 5/Notice_methodologique_Gestion pollution locale des sols.pdf (accessed on 4 March 2019).
  20. Orban, P.; Brouyère, S.; Compère, J.; Six, S.; Hallet, V.; Goderniaux, P.; Dassargues, A. Aquifère crayeux de Hesbaye. In Watervoerende Lagen en Grondwater in Belgïe-Aquifères et eaux Souterraines en Belgique; Dassargues, A., Walraevens, K., Eds.; Academia Press: Gent, Belgium, 2014; partie 1-Chapitre 12; pp. 143–159. [Google Scholar]
  21. Palau, J.; Jamin, P.; Badin, A.; Vanhecke, N.; Haerens, B.; Brouyère, S.; Hunkeler, D. Use of dual carbon-chlorine isotope analysis to assess the degradation pathways of 1,1,1-trichloroethane in groundwater. Water Res. 2016, 92, 235–243. [Google Scholar] [CrossRef] [PubMed]
  22. Commission, E. Council Directive 98/83/EC of 3 November 1998 on the quality of water intended for human consumption. Off. J. Eur. Communities 1998, 41, 32–54. [Google Scholar]
  23. Brouyère, S.; Dassargues, A.; Hallet, V. Migration of contaminants through the unsaturated zone overlying the Hesbaye chalky aquifer in Belgium: A field investigation. J. Contam. Hydrol. 2004, 72, 135–164. [Google Scholar] [CrossRef]
  24. Dassargues, A.; Monjoie, A. The chalk in Belgium. In The Hydrogeology of the Chalk of North-West Europe; Downing, R.A., Price, M., Jones, G.P., Eds.; Clarendon Press: Oxford, UK, 1993; pp. 153–269. ISBN 0198542852. [Google Scholar]
  25. Hallet, V. Etude de la Contamination de la Nappe Aquifere de Hesbaye par les Nitrates: Hydrogéologie, Hydrochimie et Modélisation (Contamination of the Hesbaye Aquifer by Nitrates: Hydrogeology, Hydrochemistry and Mathematical Modeling). Ph.D. Thesis, University of Liege, Liege, Belgium, 1998. [Google Scholar]
  26. Orban, P. Solute Transport Modelling at the Groundwater Body Scale: Nitrate Trends Assessment in the Geer Basin (Belgium). Ph.D. Thesis, University of Liege, Liege, Belgium, 2009. [Google Scholar]
  27. Dassargues, A. Hydrogeology: Goundwater Science and Engineering; Taylor & Francis CRC Press: Boca Raton, FL, USA, 2018; ISBN 9781498744003. [Google Scholar]
  28. Brouyère, S.; Hallet, V.; Dassargues, A. Effets de retard et de piégeage des polluants dus à la présence d’eau immobile dans le milieu souterrain: Importance de ces effets et modélisation. In Proceedings of the Nat. Colloquium van de BCIG/CBGI; KULeuven: Leuven, Belgium, 1997; pp. 21–27. Available online: https://orbi.uliege.be/handle/2268/2363 (accessed on 21 August 2019).
  29. Parkhurst, D.L.; Appelo, C.A.J. Description of input and Examples for PHREEQC Version 3: A Computer Program for Speciation, Batch-Reaction, One-Dimensional Transport, and Inverse Geochemical Calculations; US Geological Survey: Reston, VA, USA, 2013. [Google Scholar]
  30. Rodier, J.; Legube, B. L’analyse de l’eau; Dunod: Paris, France, 2009; ISBN 2100072463. [Google Scholar]
  31. Orban, P.; Brouyère, S.; Batlle-Aguilar, J.; Couturier, J.; Goderniaux, P.; Leroy, M.; Maloszewski, P.; Dassargues, A. Regional transport modelling for nitrate trend assessment and forecasting in a chalk aquifer. J. Contam. Hydrol. 2010, 118, 79–93. [Google Scholar] [CrossRef]
  32. Szczucińska, A.; Dłużewski, M.; Kozłowski, R.; Niedzielski, P. Hydrochemical Diversity of a Large Alluvial Aquifer in an Arid Zone (Draa River, S Morocco). Ecol. Chem. Eng. S 2019, 26, 81–100. [Google Scholar] [CrossRef] [Green Version]
  33. Wiejaczka, Ł.; Prokop, P.; Kozłowski, R.; Sarkar, S. Reservoir’s Impact on the Water Chemistry of the Teesta River Mountain Course (Darjeeling Himalaya). Ecol. Chem. Eng. S 2018, 25, 73–88. [Google Scholar] [CrossRef]
  34. Kimblin, R.T. The chemistry and origin of groundwater in Triassic sandstone and Quaternary deposits, northwest England and some UK comparisons. J. Hydrol. 1995, 172, 293–311. [Google Scholar] [CrossRef]
  35. Gerkens, R.R.; Franklin, J.A. The rate of degradation of 1,1,1-trichloroethane in water by hydrolysis and dehydrochlorination. Chemosphere 1989, 19, 1929–1937. [Google Scholar] [CrossRef]
  36. Palau, J.; Shouakar-Stash, O.; Hunkeler, D. Carbon and Chlorine Isotope Analysis to Identify Abiotic Degradation Pathways of 1,1,1-Trichloroethane. Environ. Sci. Technol. 2014, 48, 14400–14408. [Google Scholar] [CrossRef] [PubMed] [Green Version]
  37. Cline, P.V.; Delfino, J.J. Transformation kinetics of 1, 1, 1-trichloroethane to the stable product 1, 1-dichloroethene. In Biohazards of drinking water treatment; Larson, R.A., Ed.; Lewis Publishers, Inc.: Chelsea, MI, USA, 1989; pp. 47–56. [Google Scholar]
  38. Gauthier, T.D.; Murphy, B.L. Age Dating Groundwater Plumes Based on the Ratio of 1,1-Dichloroethylene to 1,1,1-Trichloroethane: An Uncertainty Analysis. Environ. Forensics 2003, 4, 205–213. [Google Scholar] [CrossRef]
  39. European Committee for Standardization. CEN-TS 14405: Characterization of waste-Leaching behaviour tests-Up-flow percolation test (under specified conditions); CEN: Brussels, Belgium, 2004. [Google Scholar]
  40. International Organization for Standardization. ISO/TS 21268-3 Soil quality—Leaching procedures for subsequent chemical and ecotoxicological testing of soil and soil materials—Part 3: Up-flow percolation test; ISO: Geneva, Switzerland, 2007. [Google Scholar]
  41. Council, E.U. Council Decision 2003/33/EC of 19 December 2002 establishing criteria and procedures for the acceptance of waste at landfills persuant to Article 16 of and Annex II to Directive 1999/31/EC. Off. J. Eur. Commun. 2003, 16, L11. [Google Scholar]
  42. Moore, D.M.; Reynolds, R.C. X-ray Diffraction and the Identification and Analysis of Clay Minerals; Oxford University Press: Oxford, UK, 1989; Volume 322. [Google Scholar]
  43. Coelho, A.A. TOPAS User’s Manual, Version 3.0; Bruker AXS GmbH: Karlsruhe, Germany, 2003. [Google Scholar]
  44. Stainier, X. Matériaux pour la faune du Houiller de Belgique (note 3). Available online: http://biblio.naturalsciences.be/rbins-publications/bulletin-de-la-societe-belge-de-geologie/007-1893/bsbg_07_1893_mem_p135-160.pdf (accessed on 9 April 2019).
  45. Ruthy, I.; Dassargues, A. Carte Hydrogéologique de Wallonie, Jehay-Bodegnée-Saint-Georges-sur-Meuse 41/7-8. Notice explicative: Première édition: Mai 2003-Actualisation partielle: Décembre 2010; Namur, Belgium, 2010. Available online: http://environnement.wallonie.be/cartosig/cartehydrogeo/document/Notice_4178.pdf (accessed on 20 August 2019).
  46. Evangelou, V.P.; Zhang, Y.L. A review: Pyrite oxidation mechanisms and acid mine drainage prevention. Crit. Rev. Environ. Sci. Technol. 1995, 25, 141–199. [Google Scholar] [CrossRef]
  47. Vrancken, K.C.; Laethem, B. Recycling options for gypsum from construction and demolition waste. Waste Manag. Ser. 2000, 1, 325–331. [Google Scholar] [CrossRef]
  48. Mayer, B. Assessing sources and transformations of sulphate and nitrate in the hydrosphere using isotope techniques. In Isotopes in the Water Cycle; Springer: Dordrecht, The Netherlands, 2005; pp. 67–89. [Google Scholar]
  49. Jurado, A.; Borges, A.V.; Pujades, E.; Hakoun, V.; Otten, J.; Knöller, K.; Brouyère, S. Occurrence of greenhouse gases in the aquifers of the Walloon Region (Belgium). Sci. Total Environ. 2018, 619–620, 1579–1588. [Google Scholar] [CrossRef]
  50. Krouse, H.R.; Mayer, B. Sulphur and Oxygen Isotopes in Sulphate. In Environmental Tracers in Subsurface Hydrology; Springer: Boston, MA, USA, 2000; pp. 195–231. [Google Scholar]
Figure 1. Stiff diagrams for groundwater samples: comparison between the contaminated area in March 2013 (orange diagrams) and the groundwater quality before contamination (blue diagrams) in the aquifer. The 1,1,1-TCA concentrations are taken Palau et al. [21].
Water 11 02009 g001
Figure 2. Total concentration (sum of 1,1,1-TCA, 1,1-DCE and TCE) (right y-axis, line) and concentration of 1,1,1-TCA, 1,1-DCE and TCE normalized by the total concentration (left y-axis, bars).
Water 11 02009 g002
Figure 3. Piper Diagram for data collected in March 2017 compared to data in March 2013 and to initial (non-polluted) groundwater composition.
Water 11 02009 g003
Figure 4. Spatial distribution of concentrations of 1,1,1-TCA, Ca2+ and SO42− for data of March 2017 and March 2013.
Water 11 02009 g004
Figure 5. Concentrations (meq/L) of non-carbonate calcium vs sulphate; non carbonate calcium is Ca2+-HCO3, for samples of March 2017 and March 2013.
Water 11 02009 g005
Figure 6. Parameters: (a) pH and (b) EC with concentrations of (c) SO42− and (d) Ca2+ as a function of the liquid-to-solid ratio of the backfill soil. Cumulative releases of: (e) SO42− and (f) Ca2+ as a function of liquid-to solid ratio for the backfill soil.
Water 11 02009 g006
Figure 7. Traces of oxidized pyrite observed by SEM in the backfill analyzed sample.
Water 11 02009 g007
Figure 8. δ34S versus δ18O values of sulphate from groundwater and eluates samples compared to typical values depending on: (a) Sulphate sources and (b) with regards to SO42− concentrations. The isotopic composition for the sulphate sources are taken from Mayer [48]. Concentration of SO42− in groundwater versus: (c) δ34S and (d) δ18O.
Water 11 02009 g008
Figure 9. Conceptual scheme summarizing the obtained results with the main process controlling the groundwater mineralization under the industrial site (Scale not respected).
Water 11 02009 g009
Table 1. Local geology in the study area.
Geological MaterialTop of Formation (m Below Surface)Bottom of Formation (m Below Surface)DescriptionComments
Backfill layer01.5Loamy and sandy soil, with recycled construction materials, shale and coal wasteHeterogeneous backfill only at the industrial site
Loess1.54.8/10Loess, sandy and clayey loessVariable thickness, higher thickness in piezometers located out of the contamination site
Flint conglomerate4.8/1010/18Flint conglomerate in loamy and/or sandy and/or clayey matrix/
Chalk10/18-White chalk with observed fractured chalk in boreholesLocally, the bottom of chalk was not reached. Average thickness 30 m from regional data mapping
Table 2. Data from groundwater chemical analyses in the different wells of the monitoring network in March 2017.
SampleTemperature (In Situ) (°C)Dissolved Oxygen mg/LpH (In Situ) - EC (In Situ) µS/cmCa2+ mg/LK+ mg/LMg2+ mg/LNa+ mg/LCl mg/LNO3 mg/LSO42− mg/LHCO3 mg/LSiO2 mg/L
G10.62.956.68848310.091.2831.1359.40160.9790.36343.63423.994.22
P12.51.046.121525255.461.1521.0765.6994.7357.99301.15426.2710.25
E11.82.826.271120241.671.0223.0945.88144.5558.81273.00298.286.29
A12.11.46.471847304.430.9327.2086.56125.4047.13370.35528.9511.42
S-2514.63.256.95858252.120.7925.6250.3874.6664.94298.01423.964.95
S-4014.93.197.11914203.860.9918.3641.9865.6476.83144.96423.905.13
T15.14.717.251056242.092.0222.6853.70102.6395.20235.28394.661.59
D10.82.086.751110227.430.7720.4337.2360.4450.61208.97444.674.56
D_210.82.086.751110226.860.8020.2636.5859.9951.27207.79449.26n.d.
I12.12.136.861190189.580.8117.8324.9361.7347.06133.61393.23n.d.
H10.11.246.721293208.411.0020.0137.1168.4075.68161.21415.2012.54
M9.24.086.9787173.141.0718.1622.3649.4168.0399.50387.7213.75
N11.33.16.831124184.810.9819.1625.7552.9271.59116.95401.77n.d.
O10.53.756.61286179.591.1418.4924.2553.4264.51107.73394.413.21
Q12.23.476.451054168.390.8714.8419.9348.3063.7093.06360.327.63
Table 3. Estimation of pH changes in groundwater with degradation of 1,1,1-TCA by HY/DH.
1,1,1-TCA1,1,1-TCAHalf LifeDegradation Time Coefficient of HCl for 1 mol of 1,1,1-TCAConcentration of Hydrochloric AcidInitial pHpH with Degradation
µg/Lmol/Lyearyear-mol/L--
2001.50×10-611.5712.46 × 0.0431.59×10-77.076.61
3002.25×10-611.5712.46 × 0.0432.38×10-77.076.49
5003.75×10-611.5712.46 × 0.0433.96×10-77.076.32
11008.25×10-611.5712.46 × 0.0438.72×10-77.076.02
Table 4. Results of batch simulations with concentrations of Ca2+ and HCO3 after equilibrium with calcite.
1,1,1-TCApH after DegradationpH EquilibriumCa2+HCO3∆ Ca2+ ∆ HCO3
µg/L--mg/Lmg/Lmg/Lmg/L
Unpolluted water7.07-149.40309.98--
2006.626.76167.05363.6217.6553.64
3006.496.70178.11397.2428.7187.26
5006.326.60197.54456.4848.14146.50
11006.026.42244.68599.9195.28289.93
Table 5. Estimation of the total released quantities of SO42− and Ca2+ with average concentrations in recharge water (the different liquid to solid ratios are considered).
L/S Ratio (L/kg)Estimated Time (Year)SO42− Released Quantity (mg/kg) from the Test SO42− Total Mass (kg) SO42− Concentration in Water Recharge (mg/L)Ca2+ Released Quantity (mg/kg) from the Test Ca2+ Total Mass (kg) Ca2+ Concentration in Water Recharge (mg/L)
0.10.8684.98197.70849.7928.5666.45285.62
0.21.72146.67341.23733.3647.20109.81236.01
0.54.29238.71555.35477.4178.58182.81157.15
18.59302.52703.82302.52104.39242.87104.39
217.18346.80806.83173.40130.26303.0565.13
542.94381.85888.3776.37175.91409.2535.18
1085.88400.05930.7140.00235.01546.7623.50
Table 6. Relative quantification of minerals (in %) based on XRD analysis of backfill soil samples.
SamplesQuartzMicasCalcitePlagioclaseChloriteOrthoclaseKaoliniteHematiteAmphibole
%%%%%%%%%
153.112.77.310.34.65.33.71.21.9
249.715.410.88.25.64.34.41.60.0
349.714.411.68.95.05.14.01.30.0
448.114.812.38.35.25.64.31.40.0
Average50.214.310.58.95.15.14.11.40.5
Standard error0.90.51.00.40.20.20.10.10.4

