Article

Scouring of Replenished Sediment through Reservoir Flood Discharge Affects Suspended Sediment Concentrations at Downstream River Water Intake

1
Hydrotech Research Institute, National Taiwan University, Taipei 10617, Taiwan
2
National Science and Technology Center for Disaster Reduction, New Taipei City 23143, Taiwan
3
Water Resources Research Center, Disaster Prevention Research Institute, Kyoto University, Goka-sho, Uji-shi 611-0011, Japan
*
Author to whom correspondence should be addressed.
Water 2019, 11(10), 1998; https://doi.org/10.3390/w11101998
Submission received: 5 August 2019 / Revised: 17 September 2019 / Accepted: 20 September 2019 / Published: 25 September 2019
(This article belongs to the Special Issue Experimental, Numerical and Field Approaches to Scour Research)

Abstract

:
Dredging is a commonly used sedimentation management strategy to remove mechanically deposited sediment from reservoirs. However, dredged sediment disposal is costly. Dredged sediment can be considered a beneficial resource and used for riverbed replenishment to prevent downstream riverbed degradation and improve aquatic habitats. This study investigated the feasibility of using dredged deposits with cohesive sediment for replenishment at the Shihmen Reservoir. Using the criterion of critical scour velocity, we conducted hydraulic assessments and identified the feasible replenishment area as the experimental domain. A physical model was developed to mimic the scouring process in the replenishment area. By applying dynamic similarity for scouring fine replenished sediment, we derived the regression relationship between flow-critical velocity and sediment-dry density, and used it for model ratio scaling of the grain size, dry density, and concentration in the physical model. Scoured sediment concentrations were measured to study the scour ratio at various flood discharges. Experimental results indicated that the scour ratio was related to factors such as flood discharge, flood duration, and water content of the replenished sediment. The reduction ratio of the concentration of sediment scoured from the replenishment area to the concentration of sediment at the downstream water intake was approximately 90% in the present study.

1. Introduction

For reservoirs worldwide, storage preservation through sustainable sediment management operations is a critical issue due to the severe problem of reservoir sedimentation. The available total storage capacity of global reservoirs has been decreasing in recent years because of the lack of effective sediment management practices [1]. Sediment trapping in a reservoir or dam interferes with the course of sediment transport through a river system; such interference exerts a considerable influence on the sustainability of future water supplies from the reservoir, engenders channel erosion, and negatively affects the downstream ecosystem. Morphological effects on downstream river channels include riverbed incision, riverbank instability, damage to embankments and levees, and channel width variation [2,3,4,5].
Studies have investigated many management strategies and efficient countermeasures for reducing the influence of sedimentation [3,6,7,8]. Dredging is a commonly used measure to remove mechanically deposited sediment from reservoirs. The disposal of dredged sediment is costly due to the involved engineering, permission, and placement site requirements. However, dredged sediment can be considered as a resource that provides effective environmental benefits and may be added to the downstream river of a dam to compensate for the lack of sediment supply. Accordingly, an approach called sediment replenishment (sediment augmentation) can be adopted for the effective replenishment due to dam interruption. [3,9,10]. Since the 1980s, sediment has been added into rivers to replenish the downstream river reaches of dams. The sediment replenishment method has been implemented to prevent downstream riverbed degradation and to improve the suitable living habitat of aquatic animals. Field investigations and laboratory experiments have been conducted for rivers in America, Europe, Japan, and Taiwan to improve knowledge about the transport processes during sediment replenishment [11,12,13].
In field practice, the sediment replenishment method can be planned and practiced in specific hydrological and geographic areas. Okano et al. (2004) [14] investigated reservoir sedimentation management by depositing coarse sediment (mainly sand and gravel sizes) with a volume of 0.3–25 × 103 m3 for replenishing downstream areas. They summarized sediment replenishment projects conducted at eight dams in Japan from 1999 to 2003. Moreover, researchers have investigated the influences of sediment replenishment conducted using appropriate grain sizes on the downstream river of Yahagi dam and the upper basin of Kizu river [15,16]. Researchers also analyzed the interaction between the relative flow field and morphological evolution during field experiments of sediment replenishment [13]. The conceptual idea of the replenishment method is to place sediment in the downstream floodplain before the arrival of floods. If the replenishment areas experience floods, the replenished sediment can be scoured and transported further downstream. As mentioned, field tests in Japan have focused on the deposition of coarse materials in reservoirs to subsequently replenish downstream rivers of the dams in order to create a suitable environment for aquatic organisms. The applied replenishment method requires a sufficient amount of discharge in order to scour replenished sediment; replenished sediment is thus always placed on floodplains before the discharge of water from a reservoir during the wet season. Sediment deposited in a reservoir can be periodically dredged or excavated and then temporarily deposited on the floodplain for transportation to the downstream river of a dam. Moreover, the replenished volume is based on the sediment transport capacity of the channel and environmental conditions. According to reports in Japan regarding the replenished volume, up to 10% of the annual deposition volume in a reservoir could be successfully executed [6,7]. Ock et al. (2013) [17] reviewed methods in the context of sediment replenishment and compared implementation activities undertaken in the Nunome river of Japan and Trinity river of California, USA. According to sediment placement or injection types, sediment replenishment methods were implemented with mechanical rehabilitation for re-creating gravel or sand bar features through fluvial processes. This comparative study provided useful information to adopt proper methods corresponding to river specific high-flow and sediment regimes. In 2009, a field test for coarse sediment replenishment was conducted at the downstream floodplain of Shihkang dam across the Dachia river in Central Taiwan [12]. The total replenished volume of the coarse sediment excavated (median grain size: 80 mm) from the Shigang Reservoir was approximately 50 × 103 m3. The field experiment revealed that the replenished sediment was entirely scoured further downstream in a typhoon flood event with a peak discharge of 5400 m3/s in 2009.
On the basis of the aforementioned studies, field and laboratory experiments for sediment replenishment have mainly focused on coarse materials, with few fine sediment examples being provided. In fact, fine replenished sediment dredged from reservoirs is valuable for coastline or estuary restoration and for the respiration of aquatic organisms. However, if a high concentration of fine replenished sediment is scoured by a reservoir flood discharge, the water quality of water treatment plants connected to the relevant reservoir may deteriorate.
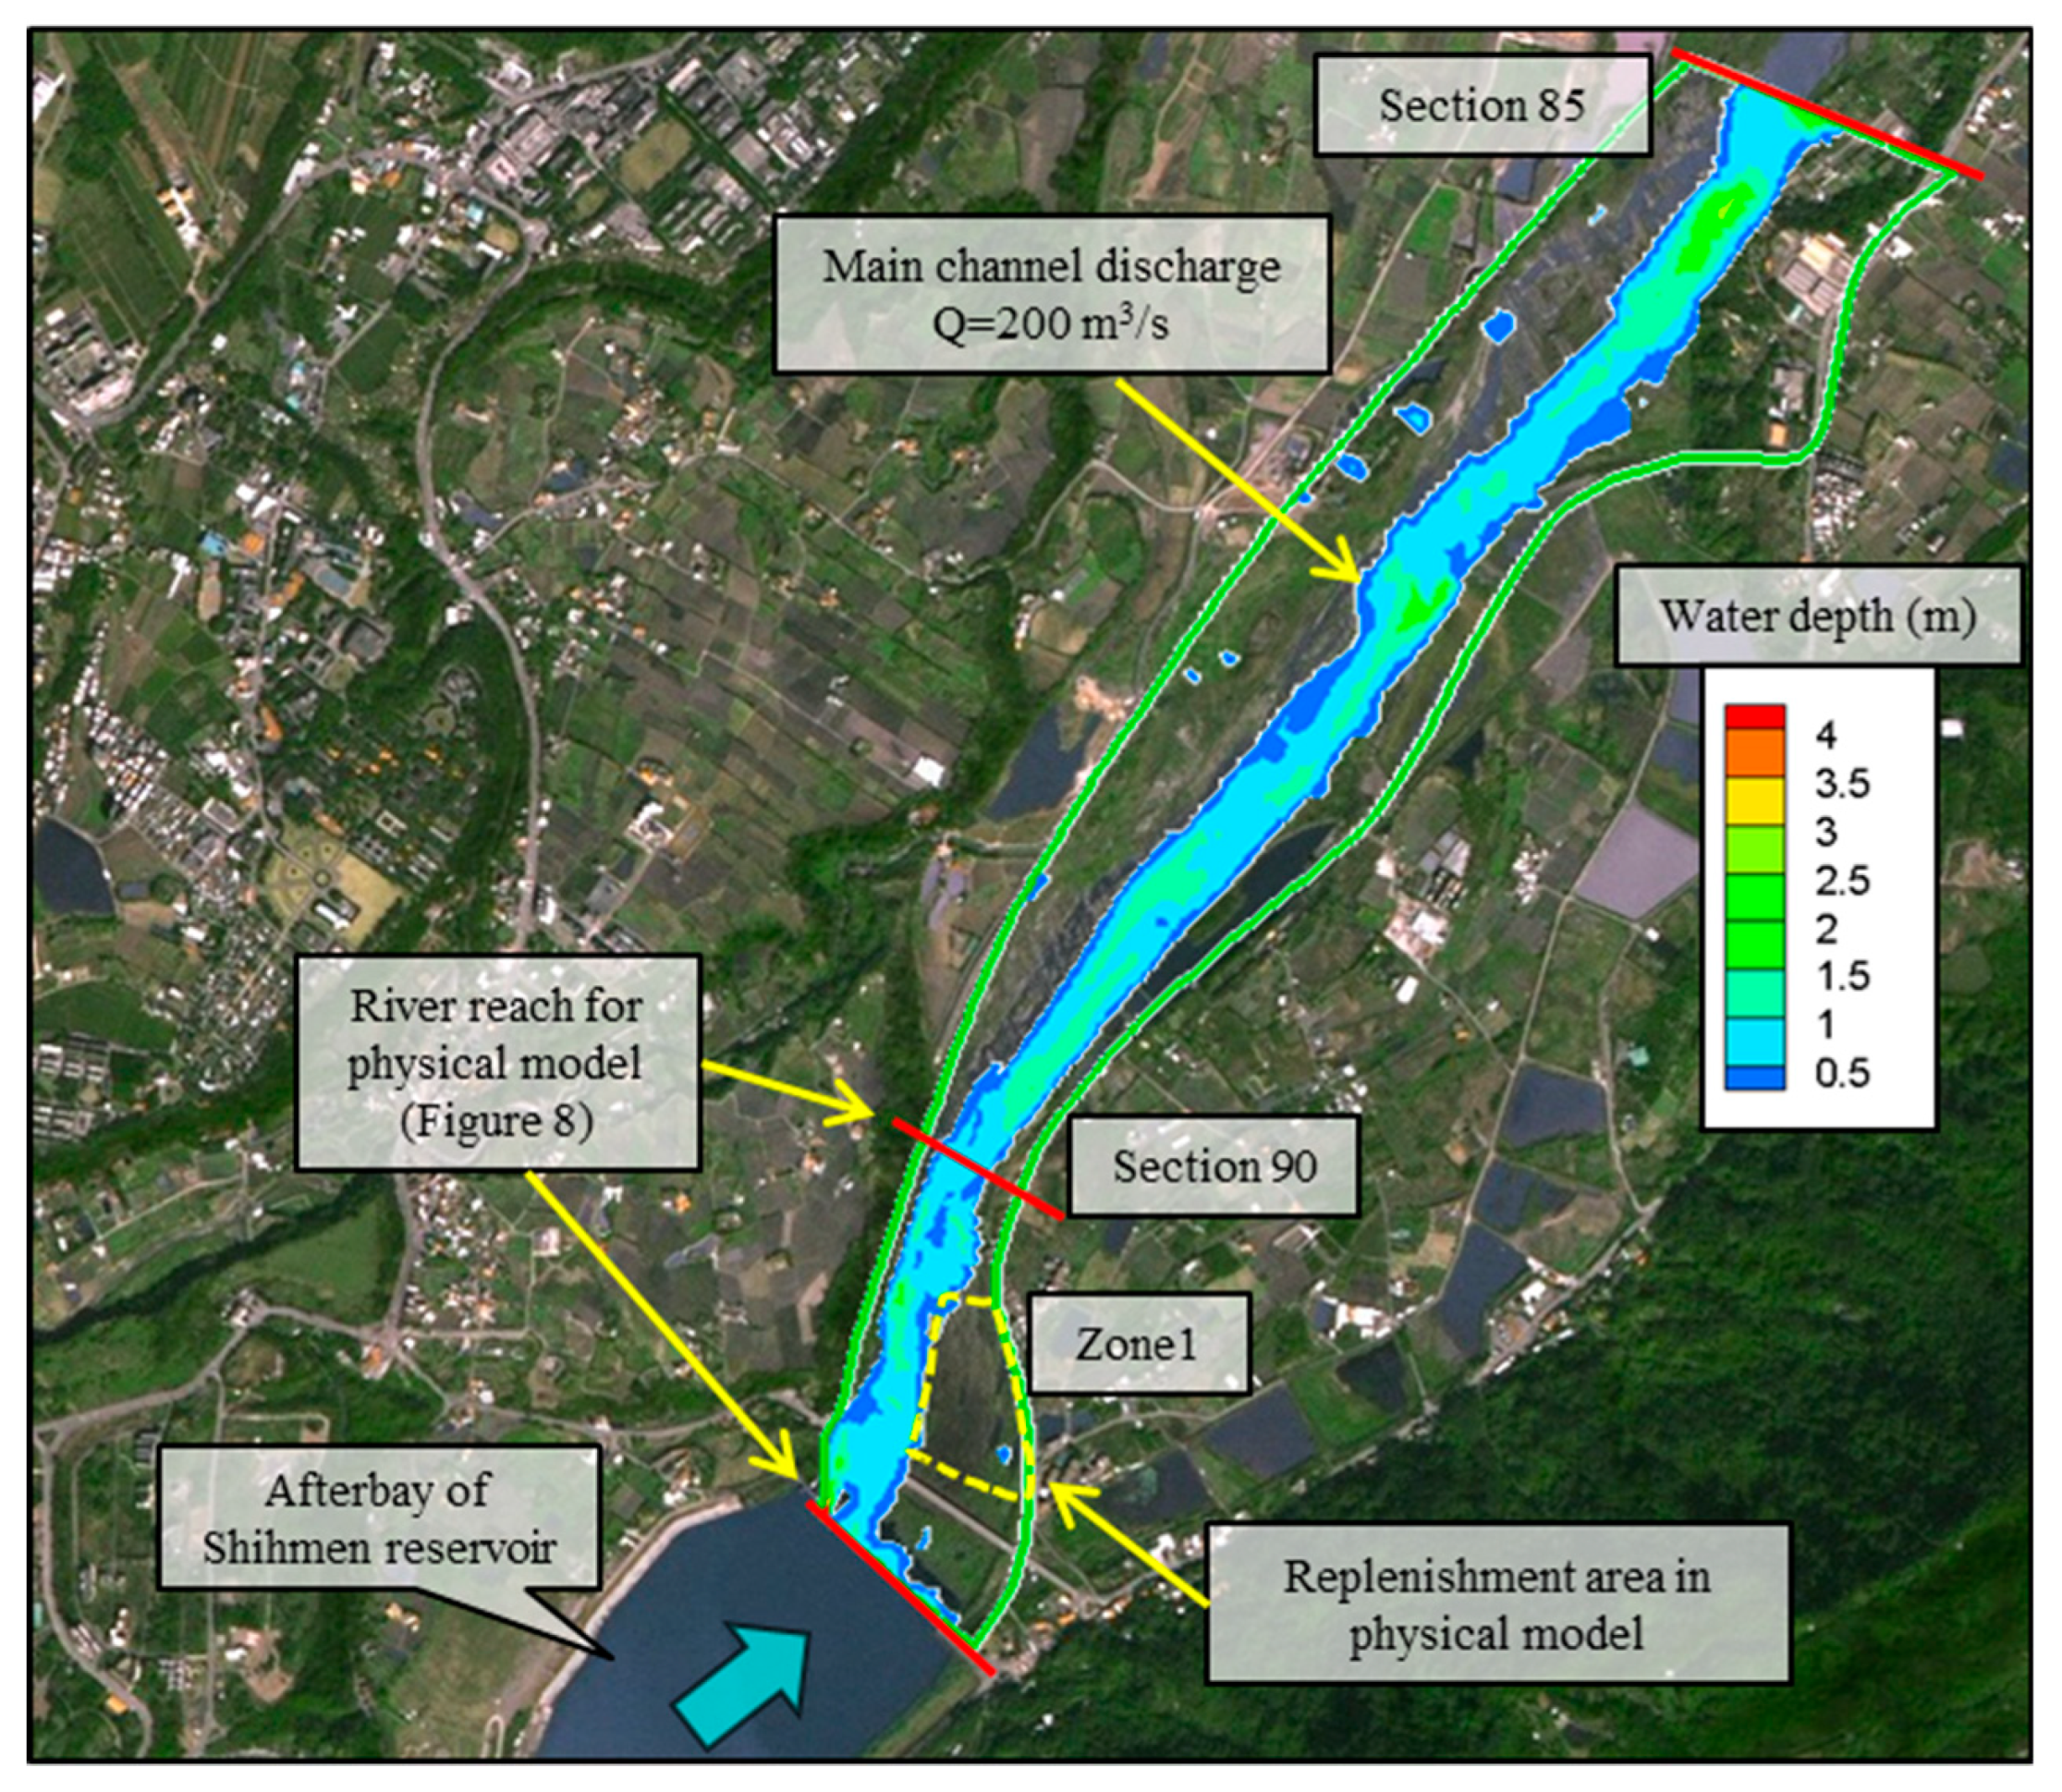
In the present study, the Shihmen Reservoir was used as the study site to investigate the feasibility of fine-sediment replenishment. First, possible areas for replenishment were analyzed through a numerical simulation conducted using a two-dimensional (2D) numerical model [18]. On the basis of the framework of the finite volume method, the 2D numerical model was used to solve the shallow water equations coupled with the advection–diffusion equation in order to simulate the suspended sediment transport phenomenon in the river. A physical model was built to mimic the scouring process of replenished sediment in the downstream river reach of Shihmen dam. Experiments involving different water content levels of dredged fine sediment were conducted in the physical model to investigate the incipient motion of the replenished sediment with cohesiveness. Through the experiments, the scour ratio was analyzed using relevant factors such as flood discharge, flood duration, and water content of the replenished sediment. The effect of the scouring of fine sediment from the replenishment area on the downstream water intake was also investigated.

2. Description of Study Site

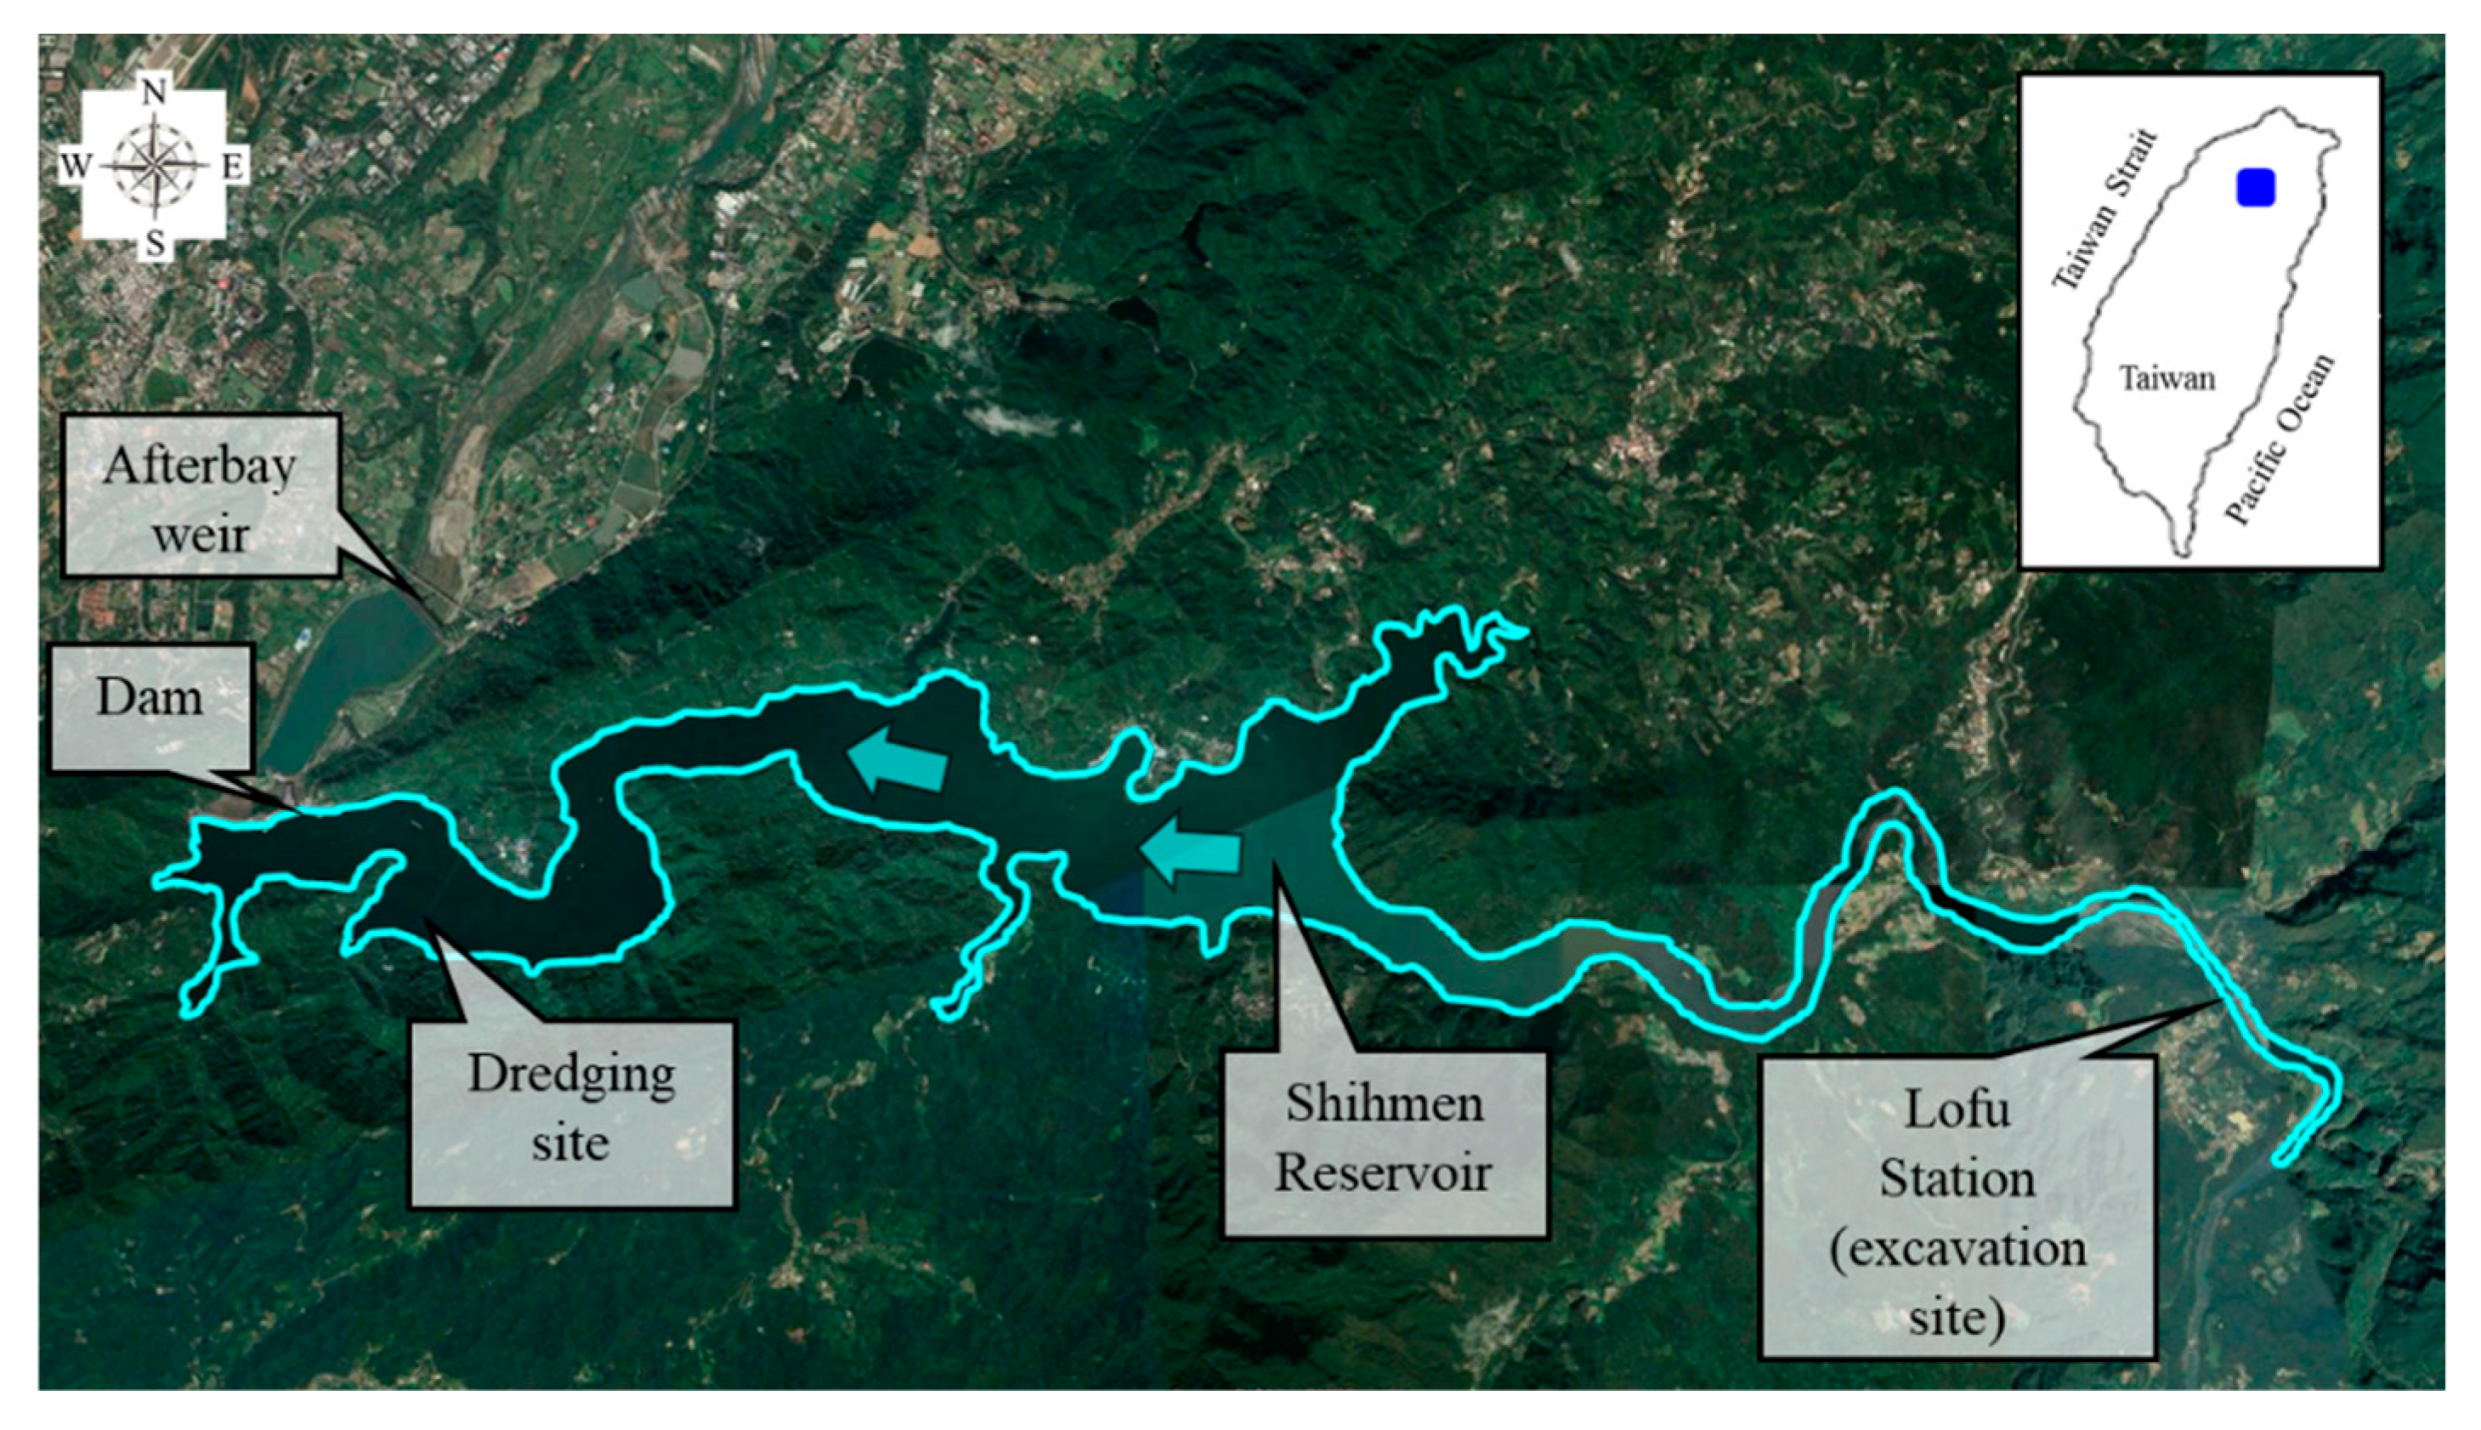
The Shihmen Reservoir was built in 1964 in northern Taiwan (Figure 1). Shihmen dam is a 133.1-m-high embankment dam and is equipped with spillways, flood diversion tunnels, a bottom outlet, a power plant inlet, a sediment-sluicing tunnel, and an irrigation inlet. The design capacity of the three spillways is 11,400 m3/s, that of the flood diversion tunnels is 2400 m3/s, that of the bottom outlet is 34 m3/s, that of the power plant inlet is 56 m3/s, that of the sediment-sluicing tunnel is 300 m3/s, and that of the irrigation inlet is 18.4 m3/s. At a normal water level of EL. 245 m, the reservoir pool is approximately 16.5 km in length and forms a water surface area of 8 km2. The initial storage capacity is 30.9 × 10⁶ m3. The reservoir is multifunctional and is used for water supply, irrigation, electric power generation, and flood mitigation; it is also a tourist attraction. In particular, the reservoir supplies water to 2.1 million people in Taoyuan City and New Taipei City for daily use.
According to the data of a survey conducted in 2018, the reservoir’s storage capacity was estimated to be 65.72% of its initial capacity. The average annual deposited sediment volume from 1963 to 2018 was approximately 1.93 × 10⁶ m3/year. Except for hydraulic desilting measures, mechanical excavation constitutes the strategies adopted for maintaining the Shihmen Reservoir. The mechanical excavation includes the dredging and dry excavation. The dredging is mainly performed under the water surface, and the main purpose of dry excavation is to remove exposed sediment. The dry excavation site in this study is located at the Lofu gauge station, and the averaged exaction volume between 2009 and 2018 was approximately 0.47 × 10⁶ m3/year. The dredging site is near the dam, and the dredged sediment volume between 2009 and 2018 was nearly 0.36 × 10⁶ m3/year. Fine sediment deposited in front of Shihmen Dam is typically removed through a pipeline by a hydraulic dredging system that applies siphon dredging; before executing the dredging process, the system calculates the head difference between the reservoir water surface and the pipeline outlet. However, finding a disposal location for the dredged sediment is a problem. Therefore, one of the implemented reservoir-desilting strategies entails conducting sediment replenishment by placing the reservoir deposits on the downstream floodplain, which may be used in the Shihmen Reservoir.
Referring to the particle size distribution presented in Figure 2, the dredged sediment near the dam site is almost entirely composed of silt and clay; thus, it is classified as a cohesive material. The sediment excavated at the Lofu gauge station is coarse sand. In this study, sediment obtained from both dredging and dry excavation was used for sediment replenishment investigation on the downstream floodplain. According to the regulation of the water pollution control action [
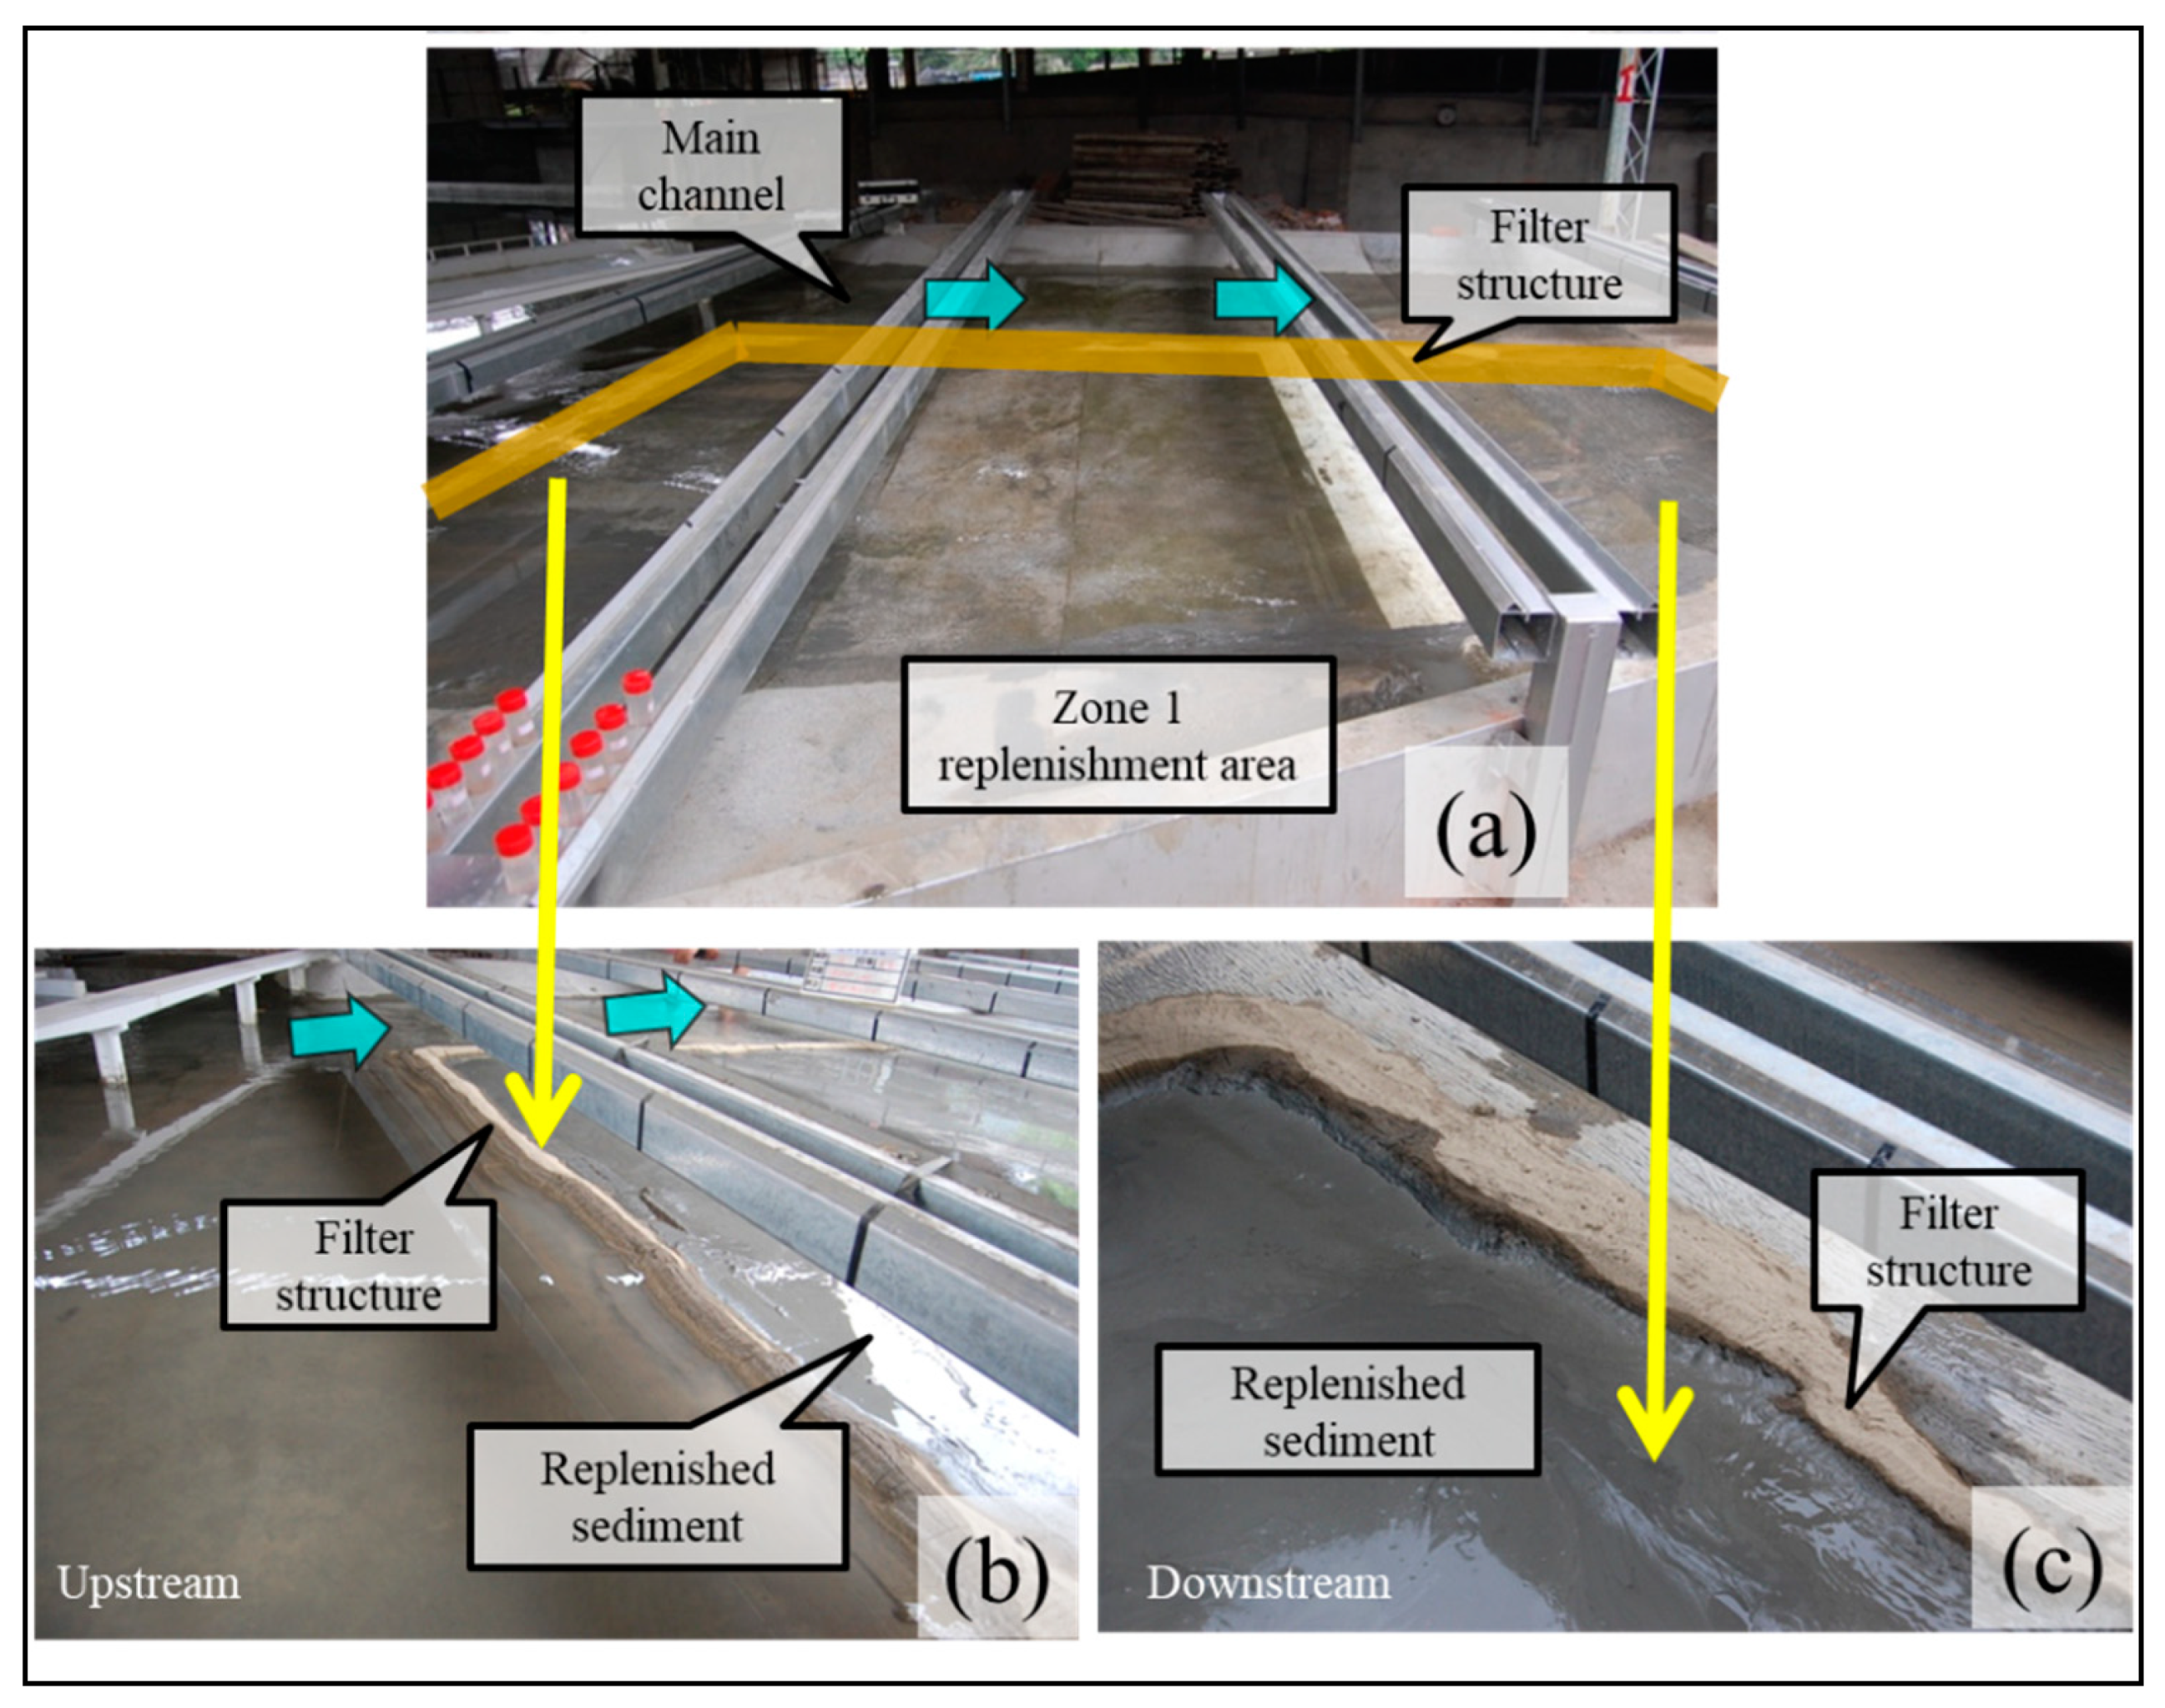
19], the replenished material should be placed at the floorplan and confined by a filter structure that serves as a permeable barrier to avoid the replenished fine sediment from polluting the water in nearby main channels during low-flow periods.
The available flood discharges from the reservoir and the flood duration are key factors for implementing sediment replenishment. Based on historical records from 1911 to 2017, three typhoons hit Taiwan each year on average. According to a frequency analysis, the 2-, 10-, and 20-year return period floods have peak discharges of 1700, 3500, and 6100 m3/s, respectively [20].

3. Hydraulic Assessment of Sediment Replenishment

If the flow intensity exceeds a specific value and sediment particles begin to move, the flow condition that corresponds to a critical value is called incipience. The main parameters of the incipience condition are usually related to the flow velocity and water depth. Therefore, in this study, the flow velocity fields and water depths were simulated using the 2D numerical model developed by Guo et al. (2011) [18]. The advection–diffusion equation is commonly used to describe the suspended sediment transport phenomenon. For determining the process of suspended sediment transport using the developed numerical model, the 2D shallow water equations coupled with the advection–diffusion equation served as the governing equations. Flow velocity fields and water depths in the candidate replenishment areas were compared, as described in this section. Subsequently, the feasible area for the physical model test was identified and selected.

3.1. 2D Numerical Model

The conservation form of the governing equations is expressed as follows:
Q v t + F adv x + G adv y = F diff x + G diff y + S s
Here,
Q v = [ h h u h v h C ] ,   F adv = [ h u h u 2 + g h 2 / 2 h u v h u C ] ,   G adv = [ h v h u v h v 2 + g h 2 / 2 h v C ] , F diff = [ 0 h T x x / ρ h T x y / ρ D x ( h C ) / x ] ,   G diff = [ 0 h T x y / ρ h T y y / ρ D y ( h C ) / y ] ,   S s = [ 0 g h ( s 0 x s f x ) g h ( s 0 y s f y ) q s e q s d ]
where Q v is the conserved physical vector; F adv and G adv are the advection flux vectors in the x and y directions, respectively; F diff and G diff are the diffusion flux vectors in the x and y directions, respectively; S s is the source term; h is the water depth; u and v are the depth-averaged velocity components in the x and y directions, respectively; ρ is the density of water; T x x ,   T x y , and T y y are the depth-averaged turbulent stresses; C is the depth-averaged suspended sediment concentration; g is the gravitational acceleration; D x and D y are the diffusion coefficients. s 0 x and s 0 y are the bed slopes in the x and y directions, respectively, and they are expressed as:
s 0 x = z b / x   and   s 0 y = z b / y
z b is the bed elevation; s f x and s f y are the friction slopes in the x and y directions, respectively; and T x x , T x y , and T y y are the depth-averaged turbulent stresses. On the basis of Manning formulas, the friction slopes can be expressed as:
s f x = u n M 2 u 2 + v 2 h 4 3 ,   s f y = v n M 2 u 2 + v 2 h 4 3
where n M is the Manning roughness coefficient.
According to the particle size ranges, suspended sediment particles can be divided into cohesive and non-cohesive particles [21]. For cohesive sediment, the deposition flux (depositional rate) can be determined using the following relation [22].
q s d = P w s C ,   P = 1 τ b x 2 + τ b y 2 / τ c d
where P is the probability of deposition and τ c d is the critical shear stress of deposition. Moreover, w s is the settling velocity and defined as:
w s = 250   d m 0.2
where d m is the median particle size (µm). The entrainment flux (erosion rate) for cohesive materials was given by Liu et al. (2002) [23] and can be computed from:
q s e = E ( τ b x 2 + τ b y 2 / τ c e 1 )
where E is the erosion parameter and τ c e is the critical shear stress of erosion. In general, the critical shear stresses of deposition and erosion differ in various study areas. Based on the experimental data and model calibration, Liu et al. (2002) [23] provided the suggested values of τ c d (= 0.05 N/m2) and τ c e (= 0.1 N/m2) for modeling cohesive sediment transport in Equations (5) and (7), respectively.
For the numerical discretization in the framework of the finite volume method, the finite-volume multi-stage (FMUSTA) scheme was adopted to estimate the numerical flux through each cell interface in order to solve Equation (1) [24]. In the treatment of source terms, the hydrostatic reconstruction method was employed to prevent the imbalance between flux gradients and source terms. The presented 2D numerical model is practically suitable for complex flow conditions (mixed regimes) and is appropriate for special problems related to wetting and drying. A detailed description of the numerical formulation was provided by Guo et al. (2011) [18].

3.2. Numerical Model Validation

For the validation of the numerical model, the simulation domain was selected as the downstream river reach. The reach is approximately 16.5 km long from the Shihmen afterbay weir to the Yuanshan weir, as shown in Figure 3. The water intake is located on the right-hand-side bank of the Yuanshan weir, which delivers withdrawal water to the Bansin water treatment plant and supplies water. Field data collected at the Dasi bridge gauge station during two historical typhoon flood events—Typhoon Changmi and Typhoon Krosa—were used for model validation. By comparing the measured water level and suspended sediment concentration hydrographs, this study determined that the simulated results obtained using the adopted 2D numerical model were highly consistent with the measured data (Figure 4), despite the existence of some discrepancy; for example, a discrepancy was observed in the peak sediment concentration, for which the average relative error was 2.2% for Typhoon Changmi. Accordingly, the adopted 2D numerical model can model velocity and concentration fields in natural rivers with irregular topography.
After the validation of the numerical model, this study evaluated the most feasible replenishment area for placing the dredged sediment. As presented in Figure 3, the approximately 3.6-km river reach located between the Shihmen afterbay weir (Section 91) and Section 85 may be a suitable area for sediment replenishment due to the cost constraints of dredging pipelines. In part of the simulation domain, the simulated results pertaining to the flow velocity and water depth in the river reach between Section 91 and Section 85 were analyzed, as discussed in the following section.

3.3. Hydraulic Assessment of the Feasible Replenishment Area

During the selection of suitable replenishment areas, locations near a dam should be considered to reduce the implementation cost of the dredging pipeline system and maintenance work. Moreover, the replenishment areas should be designed for construction on a floodplain. Accordingly, in this study, the candidate replenishment areas were tentatively selected and marked as Zone 1, Zone 2, and Zone 3 (Figure 5).
To resolve the problem associated with the unavailability of suitable sites for the disposal of materials dredged from reservoirs, the replenishment method is typically considered for disposing fine sediment dredged from reservoirs. Hjulstrom (1935) [25] found that the critical scour (or erosion) velocity is proportional to the particle size, and resistance to scour increases for sediment finer than 50 µm; these findings indicate that factors other than particle size and weight influence scour phenomena [26,27]. Sediment dredged from around the dam site exhibited a finer level of cohesiveness than the median particle size ( d 50 = 0.006 mm; Figure 2); therefore, we used d 25 (0.0023 mm) to represent the replenished sediment particle size, signifying that a critical velocity of approximately 1.5 m/s would be required to initiate the scouring process [28]. Moreover, according to the regulation of water pollution control action [19], the replenishment area should be confined by a filter structure that serves as a permeable barrier to avoid the replenished fine sediment from polluting the water in nearby main channels during low-flow periods. Therefore, sediment that was excavated from the Lofu site and had a median particle size d 50 of 1.76 mm (classified as coarse sand; Figure 2) was used as the filter material. We used d 75 (9.5 mm, classified as medium gravel) to represent the replenished sediment particle size; hence, a critical velocity of approximately 1.05 m/s would be required to initiate scouring for the filter structure [28]. On the basis of the preceding analysis, we may adopt a higher critical scour velocity (e.g., 1.5 m/s) with sufficient flow depth to evaluate the incipient motion of both fine sediment and coarse sediment. Although the concept of critical scour velocity is used herein for illustrative purposes, it indeed provided the preliminary criterion to assess the feasible replenishment area.
The validated 2D numerical model was used to model the flow velocity distribution field in the candidate replenishment areas. The simulated results for water depth (Figure 6) revealed that the flow current was confined within the main channel at a discharge of 200 m3/s. Accordingly, the 2-, 10-, and 20-year return period floods were determined to have peak discharges of 1700, 3500, and 6100 m3/s, respectively [20]. We adopted the flood discharges of 1700 and 6100 m3/s in two test cases separately to execute the 2D numerical model for the preliminary selection of the feasible replenishment areas.
According to the simulated results obtained from the test case that involved the flood discharge of 1700 m3/s, the water depth was lower than 1 m in both Zone 2 and Zone 3 (Figure 7a). In Zone 1, the water depth was higher than 1 m in most portions of the replenishment area. In addition, the velocity was lower than 1 m/s in both Zone 2 and Zone 3. However, most portions of Zone 1 had the velocity of more than 1 m/s, whereas the velocity near the main channel was higher than 2 m/s. In the test case that involved the discharge of 6100 m3/s, the water depth was still lower than 1 m in most portions of Zone 2 and Zone 3, whereas the depth in Zone 1 increased to more than 3 m in most portions of the replenishment area (Figure 7b). The velocity in most portions of Zone 1 was more than 1.5 m/s. However, the velocities in most portions of Zone 2 and Zone 3 were lower than 1 m/s, except for the portion near the main channel. The simulated flow velocities in Zone 1 in the two test cases (involving flood discharges of 1700 and 6100 m3/s separately) satisfied the critical scour velocity criterion (1.5 m/s) for incipient motion of both fine sediment and coarse sediment. Moreover, the simulated water depths ranged from 1.5 to 4 m in Zone 1 of the replenishment area in the two test cases. The height of the filter structure was 2 m, and that of the replenished material was 1.6 m in the replenishment area, which were determined to be subject to flooding. Consequently, Zone 1 was selected as the location for sediment replenishment. The feasible replenishment area—Zone 1—was determined to be on the right-hand-side floodplain (Figure 6). Moreover, for the experimental river reach for the physical model, we considered the reach between the Shihmen afterbay weir (Section 91 as upstream boundary) and Section 90 (downstream boundary) with a narrow cross section.

4. Physical Model Layout and Scaling

4.1. Layout of Physical Model

On the basis of the results of the numerical simulations that were performed for determining candidate replenishment areas, we selected the replenishment area located on the floodplain just downstream of the afterbay weir (Figure 6). For an undistorted model, the geometrical ratio between the prototype and model was set to 64:1 in both the vertical and horizontal directions due to space constraints at the construction site.
The model layout is sketched in Figure 8. The upstream boundary was set at the cross section of the afterbay weir, and the downstream boundary was set at Section 90 with a relatively straight reach and a narrow cross section further downstream of the replenishment area. Water was recirculated using a pump at various desired steady flow rates and was controlled by the valve of the pipeline, which was connected to the head tank. A sediment-settling basin was constructed at the downstream end to settle part of the outflow sediment, and the inflow sediment concentration was monitored to control the background sediment quantity. Two monitoring points were set at the downstream end for measuring outflow sediment concentrations, from which the average was derived. According to the prototype dimension, the volume of replenished sediment was nearly 100 × 103 m3, which was estimated to be one-fourth of the annual volume of dredged sediment. Accordingly, the thickness of replenished sediment was approximately 1.6 m. To confine the dredged materials inside the selected replenishment area, a permeable barrier with a height of 2 m was constructed. The permeable barrier functioned as a filter to prevent the replenished material containing very fine sediment from polluting the water in the main channel during low-flow periods. Moreover, the barrier was composed of coarse sediment materials with relatively large particle sizes (Figure 2); the materials were obtained from the field dry excavation site near the Lofu gauge station at the upstream end of the Shihmen Reservoir.

4.2. Similitude for Model Scaling

A physical model should satisfy the similarity theory of geometrical, kinematic, and dynamic conditions. In open-channel flow, flow patterns under a free-surface condition follow the Froude number ( F r ) similarity. Therefore, the following relationship is involved in the scaling of model dimensions for flow patterns: λ F r = λ u / λ g λ h = 1 , where λ is the ratio of the model to the prototype; λ u is the velocity scale ratio; λ h is the vertical length scale ratio; and g is the acceleration of gravity, with λ g = 1 . Hence, the flow velocity ratio of the model to the prototype can be derived as follows: λ u = λ h 1 / 2 . Note that the flow discharge scale is λ Q = λ u λ A = λ h 5 / 2 , and the time scale is λ t = λ h 1 / 2 . The subscripts u, Q, A, and t denote the velocity dimension, discharge dimension, cross-sectional area dimension, and time dimension, respectively.

4.2.1. Initiation of Sediment Movement

Similarities in sediment transport mechanisms engender difficulties in combining coarse and fine materials because of the difference in sediment particle sizes. In this study, criteria for the similitude of sediment movements were required to assess coarse sediment for modeling the permeable barrier and to assess cohesive sediment for the dredged material placed in the replenishment area. For coarse sediment, we could adopt the Shields diagram for the condition involving incipient riverbed particle motion [29].
For satisfying the similitude of model scaling, the dimensionless shear parameter in the Shields diagram was employed and can be expressed as follows:
λ τ c r λ ( γ s γ ) λ d c = 1
where τ c r is the critical shear stress ( λ τ c r = λ ρ λ g λ R λ s ), γ s is the specific density of sediment, γ is the specific density of water, d c is the grain size of coarse sediment, ρ is the density of water, R is the hydraulic radius, and S is the energy slope. The energy slope ratio λ s is equal to 1. If we substitute λ τ c r with λ ρ λ g λ R λ s and substitute λ R with the vertical length scale ratio λ h , Equation (8) becomes λ d c = λ ρ λ h λ ( ρ s ρ ) 1 , where ρ s is the sediment density. If we use the same sediment material in the physical model as that in the field, the density scale would be equal to 1. Then, the scale ratio for the particle size of coarse sediment can be expressed as λ d c = λ h .
As the scouring process acts on the surface of replenished materials, fine sediment with cohesiveness can be washed away when picked up by running flow, which may behave as a wash load [30]. The scour potential with respect to the flow shear strength can be related to the dry density of cohesive deposits in exponential form, and this relationship has been derived by several researchers [31]. Although this relationship is rather an approximate and is site specific, it is useful for estimating the critical shear stress generated by a flood flow to characterize the structures of replenished sediment as deposits with cohesiveness. Based on flume experiments, the regressed relationship between critical velocity u c and dry density ρ d can be expressed as follows:
u c = a ρ d b   or   ρ d = ( u c / a ) 1 / b
where the coefficient a and exponent b can be determined by conducting a flume experiment [32]. According to the preceding expressions regarding the similarities in the scouring mechanisms of fine sediment and similarities in the Froude number of flows, the scale ratio of dry density can be expressed as follows:
λ ρ d = λ u c 1 / b = λ h 1 / 2 b
Using sediment sampled from the Agongdian Reservoir located in Southern Taiwan, Lai (1998) [33] conducted experiments by setting the value of a to 1.65 and the value of exponent b to 1.96. As shown in Figure 2, the particle size distribution of the sediment sample (with 22% of clay) from the Agongdian Reservoir is highly similar to the particle size distribution of the sediment sample from the Shihmen Reservoir. Thus, the relationship presented in Equation (9) for fine sediment from the Agongdian Reservoir is analogous to relationship for fine sediment from the Shihmen Reservoir. From the field data regarding dredged sediment properties provided by the Northern Region Water Resources Office (2010) [20], the water content of dredged material ranges from 39.9% to 45.2% at 1 year after deposition and from 81.8% to 98.5% at 16 days after deposition. Therefore, this study adopted water content levels of 40% and 80% to conduct tests in the physical model for sediment replenishment. Based on dredged sediment sample property, the dry densities corresponding to water content levels of 40% and 80% were 1.2 and 0.84 t/m3, respectively.

4.2.2. Sediment Concentration and Transport Time

Flood flow from the reservoir generates a bed shear force that acts on the surface of replenished sediment. The scouring depth over time for the entire amount of replenished sediment can be denoted as ρ d V S , where V S is the volume of sediment eroded. The total amount of eroded sediment in the water column is denoted as S V , where S represents the sediment concentration in water of volume V . The amount of sediment scoured from the riverbed approximately equals that suspended in the water column, that is, S V = ρ d V S . Because of the requirement of dynamic similarity during scouring, the sediment concentration ratio of the model to the prototype λ s can be written as follows:
λ S = λ ρ d λ V S λ V = λ ρ d λ L 3 λ L 3 = λ ρ d
Equation (11) indicates that the scale ratio of the model to the prototype for the sediment concentration is equal to the scale ratio of dry density.
Bed elevation variations during river scouring can be described by the sediment continuity equation:
( q S ) x + ρ d z b t = 0
where q is the discharge per unit width, x is the distance along the river, z b is the bed elevation, and t is the time required for bed variation. On the basis of model similarity, Equation (13) can be derived from Equation (12) and expressed as follows:
λ q λ S λ x = λ ρ d λ z b λ t
where λ x = λ z b = λ h and λ q = λ u λ h = λ h 3 / 2 for the undistorted model. Based on the relationship between Equations (10), (12), and (13), the time scale ratio of bed elevation variations due to scouring is λ t = λ h 1 / 2 . In particular, the ratio is the same as the time scale of flow similarity derived from the Froude number. This indicates that the scouring time scale of flood flow is equal to that of sediment transport.
According to the physical model ratio of the prototype to the model (64:1), the model scale ratios could be derived from similarity theory (Table 1). The installation of replenished sediment and the filter structure to serve as the permeable barrier in the physical model is illustrated in Figure 9. Experimental results and analysis are described on the prototype scale in the following section.

5. Experimental Results and Analysis

Flood discharges from a reservoir and flood duration are key factors for investigating scouring processes in the sediment replenishment area. On the basis of data regarding flood discharges from the Shihmen Reservoir in the past 10 years, we observed that the flood discharges were higher than 500 and 1000 m3/s for 38 and 22 h, respectively, in all flood events. Apart from 2-, 10-, and 20-year return period flood discharges, we considered lower discharges of 500 and 1000 m3/s as the inflow discharges for practical purposes in the physical model tests. These discharges generated overbank flow to flood over the replenishment area on the floodplain.
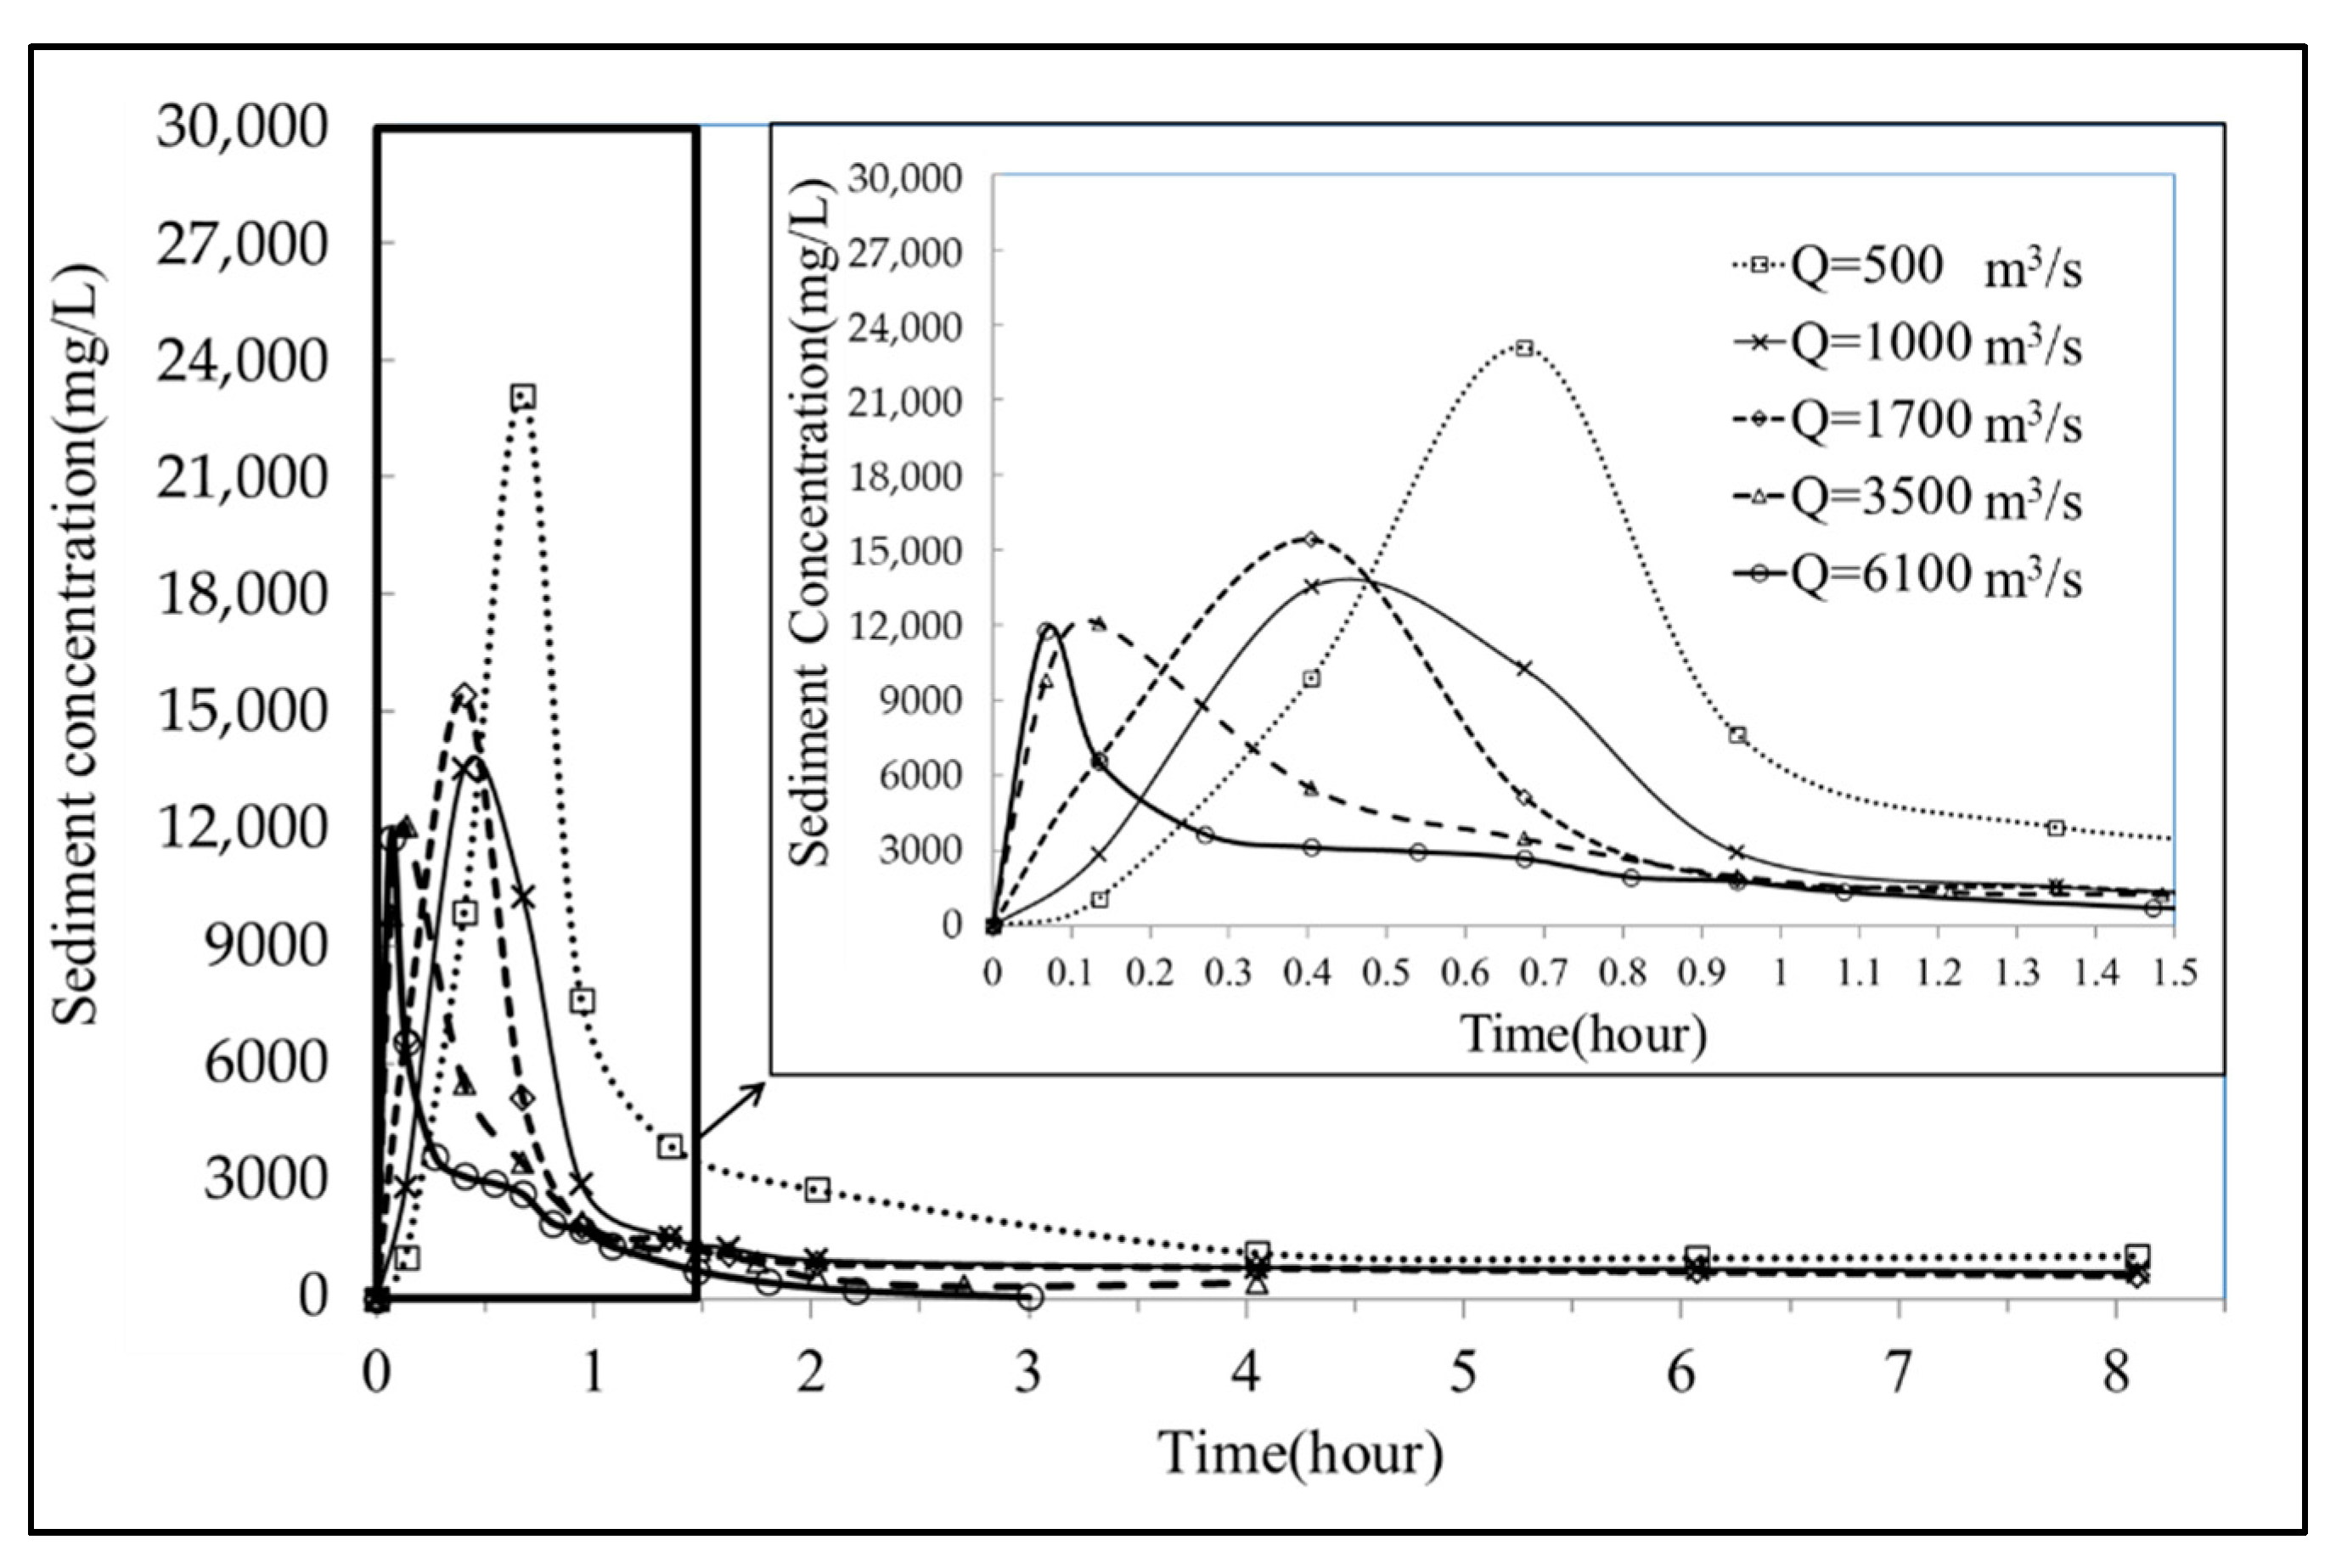
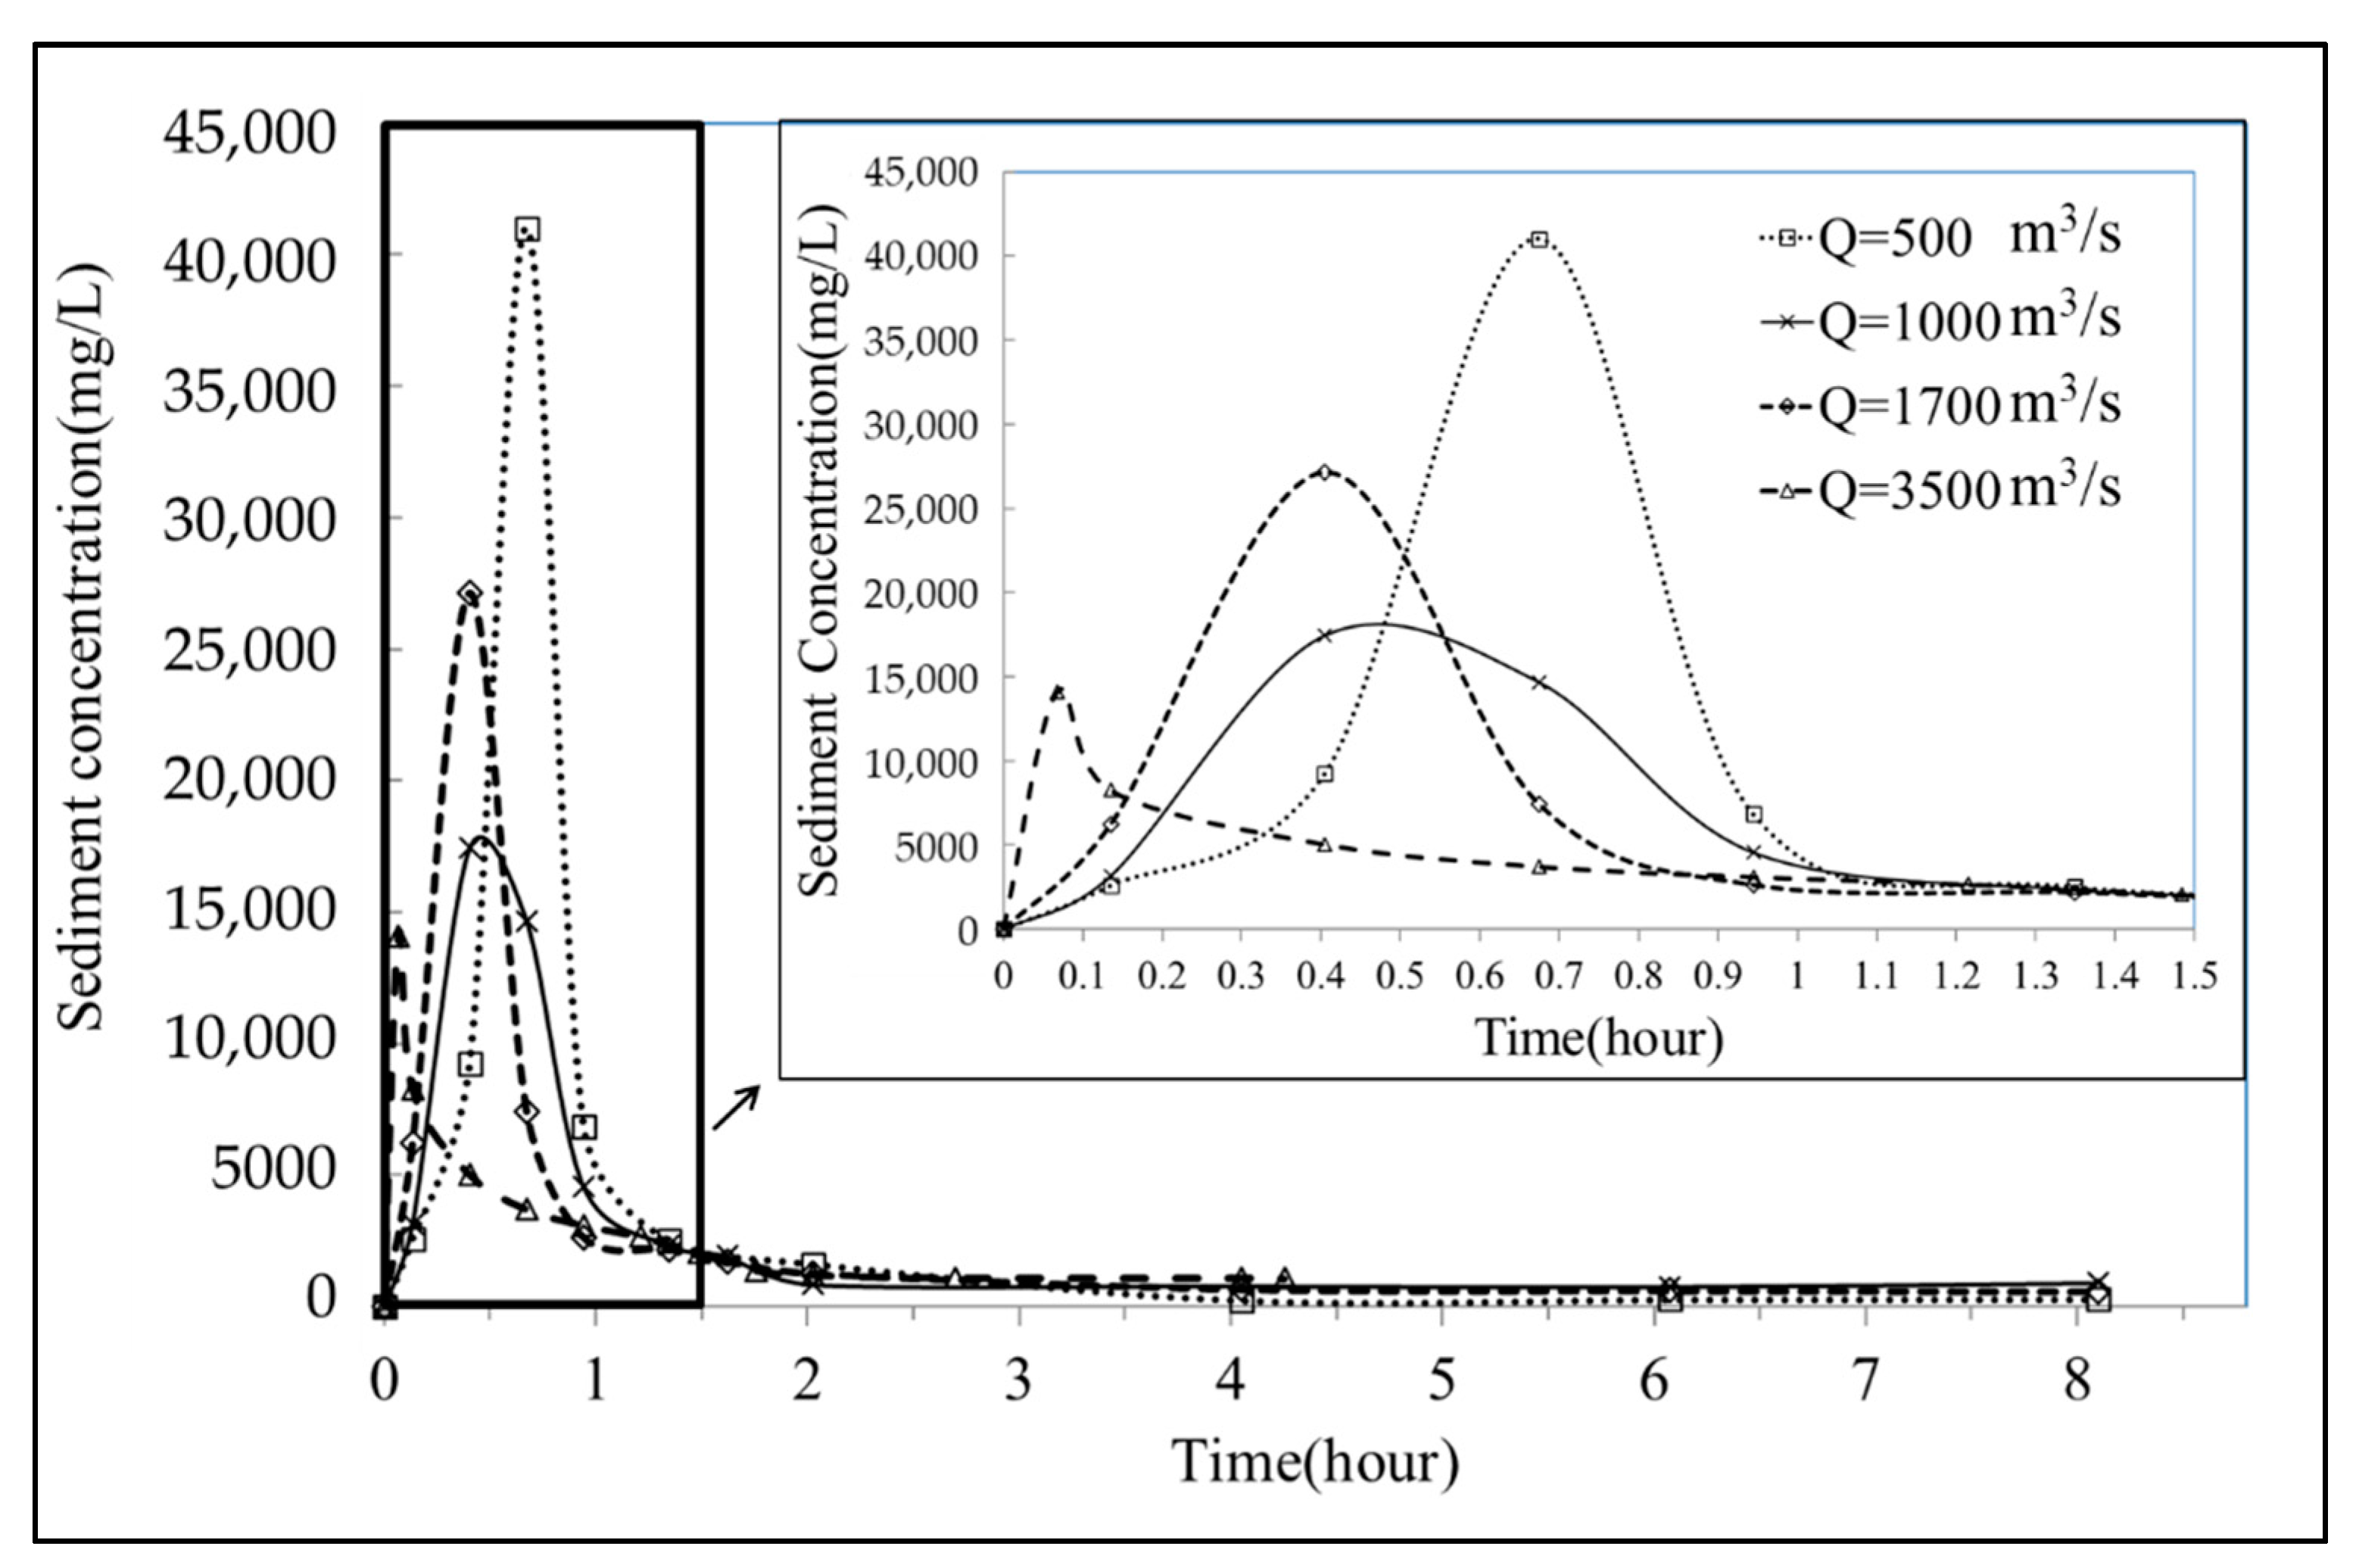
Figure 10 illustrates the outflow sediment concentration measured against time in test cases involving various inflow discharges (from 500 to 6100 m3/s) at the downstream end (Section 85) of the physical model. In this figure, the hydrographs in the first 1.5-h period are enlarged to enhance the visualization of changes in the measured sediment concentration. In the test case that involved a Q value of 6100 m3/s, the peak sediment concentration (12,000 mg/L) was observed at 0.07 h because a higher discharge could generate a higher flow velocity to scour most of the replenished sediment. For comparison, in the test case that involved a Q value of 500 m3/s, the peak sediment concentration (24,000 mg/L) occurred at 0.7 h. Although a higher discharge could generate a higher flow velocity to scour the replenished sediment, the concentration of suspended sediments may not have increased further due to the larger water volume. The peak sediment concentration for the test case that involved the Q value of 6100 m3/s was lower than that for the test case that involved the Q value of 500 m3/s. However, the peak sediment discharge (product of flow discharge and sediment concentration) should be considerably increased due to higher flow discharge. Moreover, the hydrographs revealed that major variations obviously occurred in the first 1.5 h. After 1.5 h, the measured sediment concentrations of all the test cases were lower than 6000 mg/L. This concentration can be managed by the Bansin water treatment plant. Consequently, only the first 1.5 h would be required for complete scouring in the replenishment area.
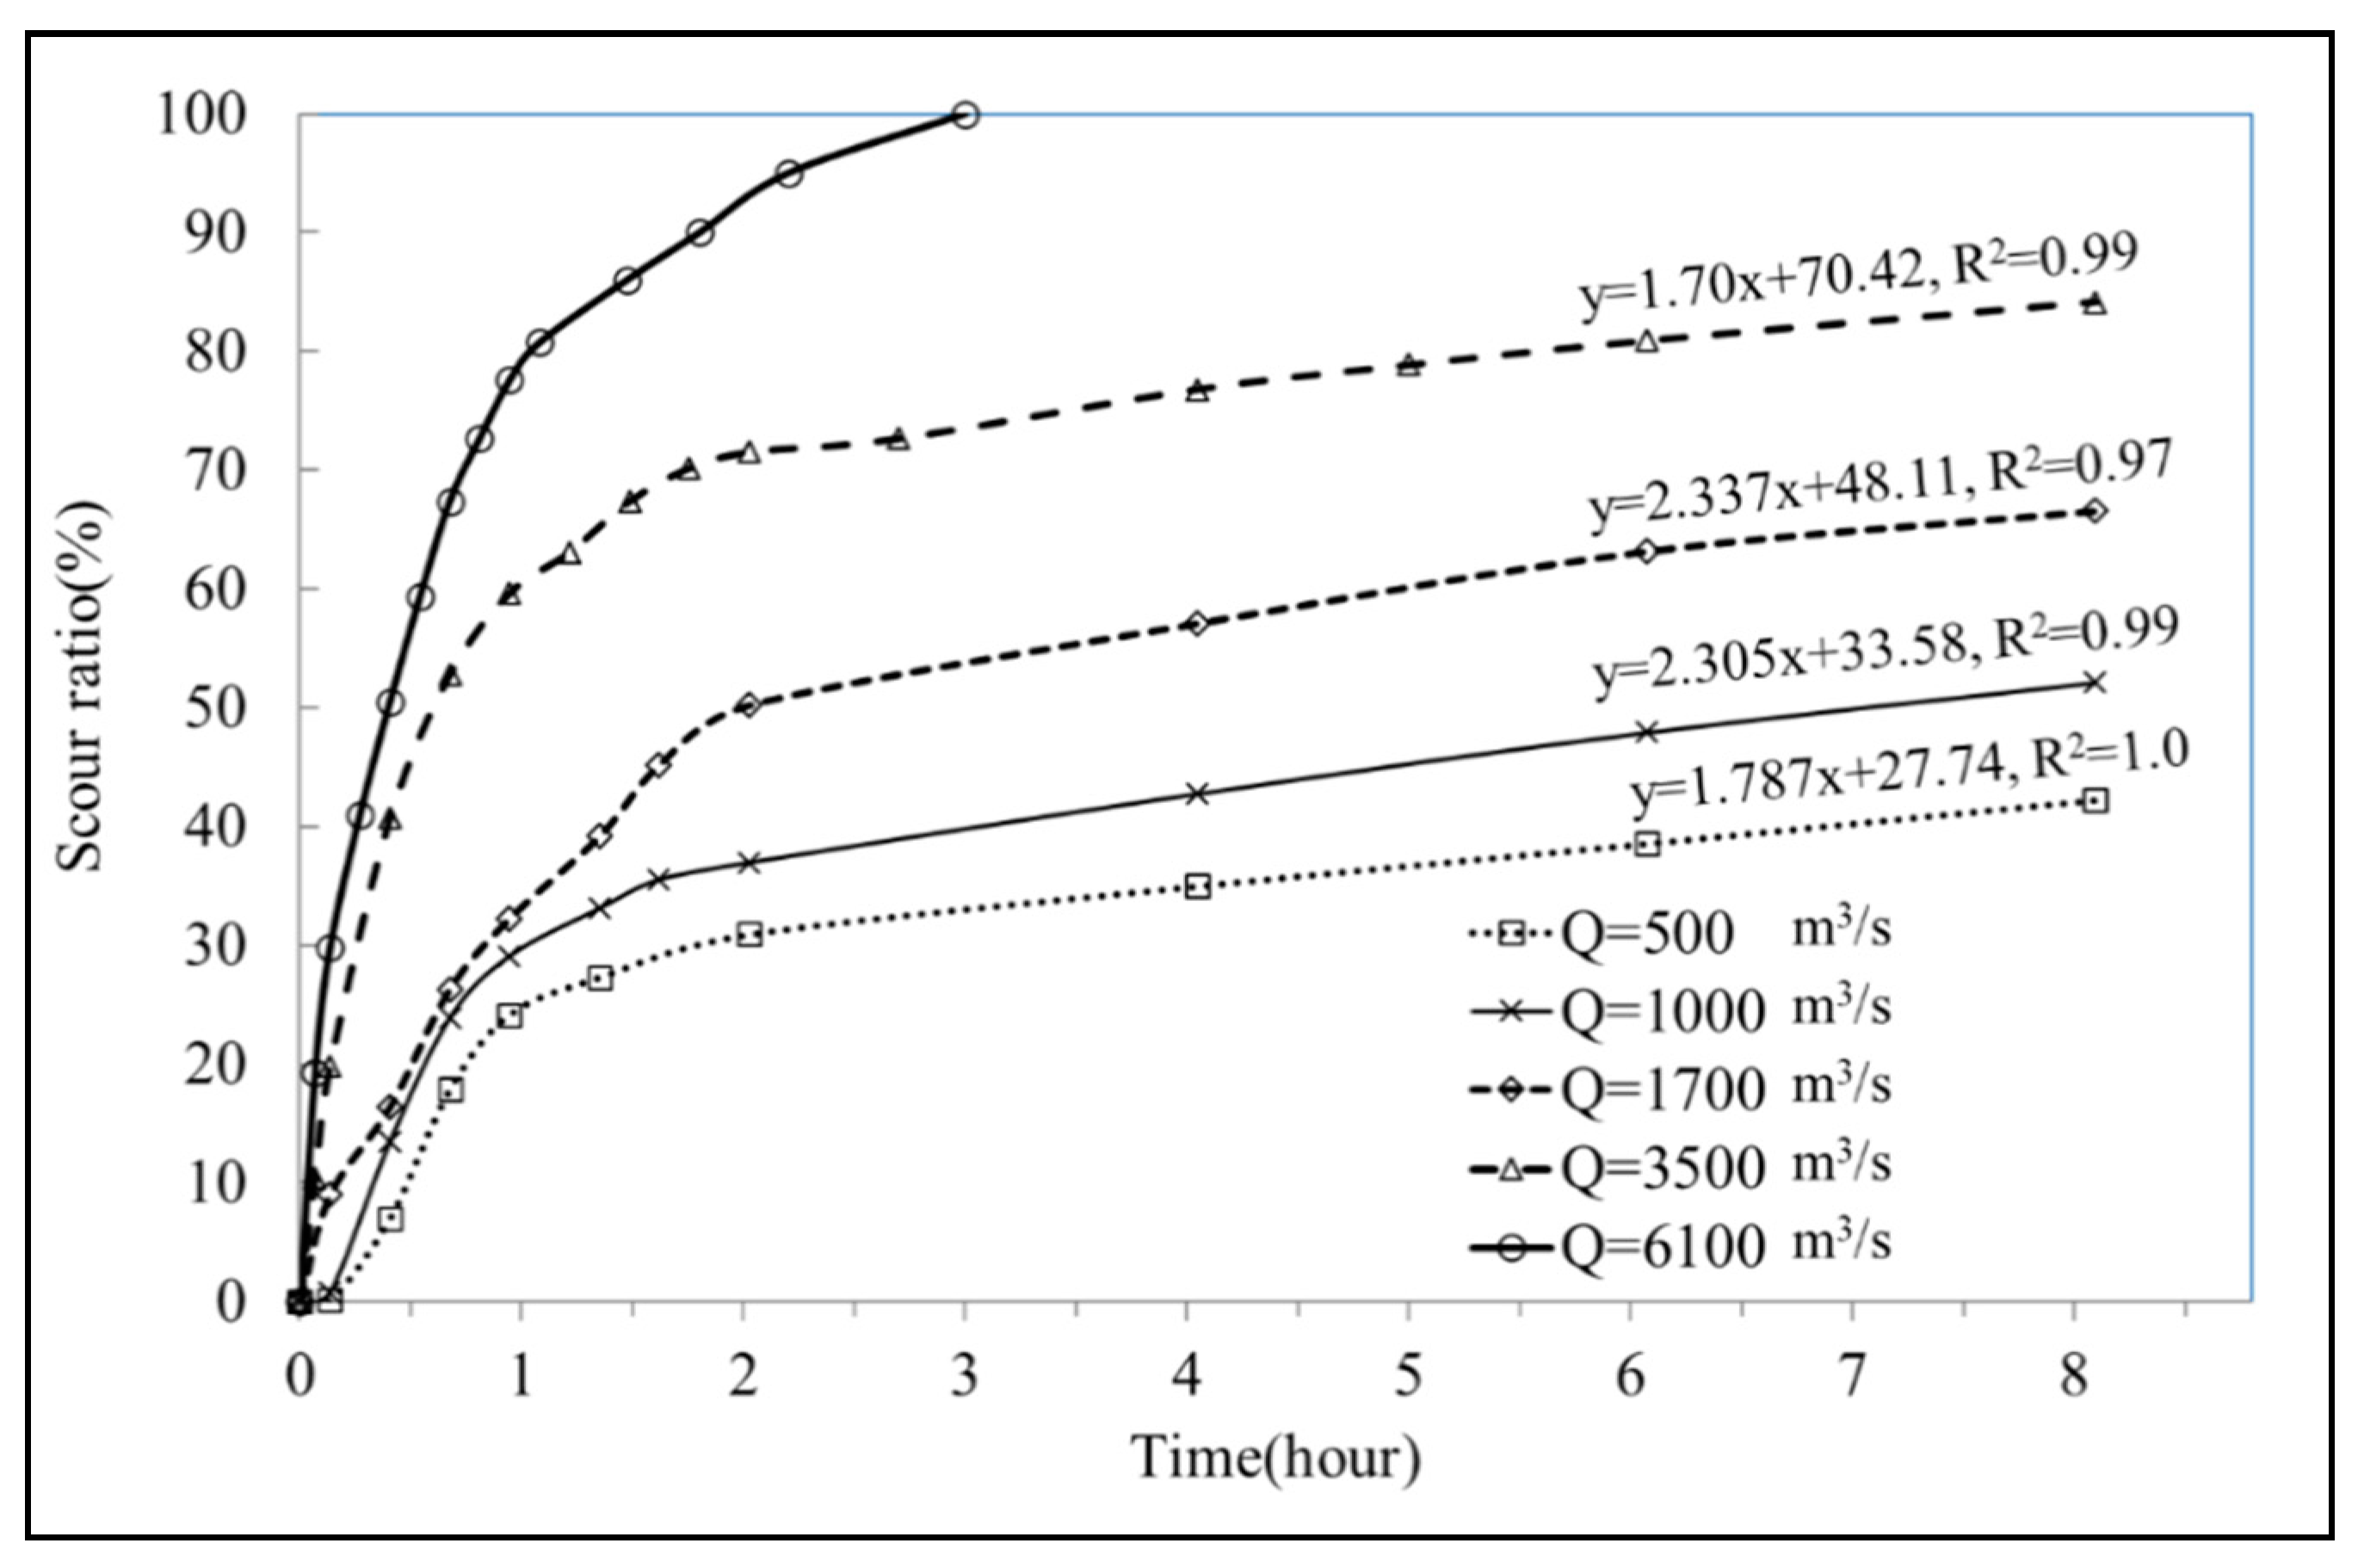
The volume of scoured sediment could be obtained from the sediment concentration measured at the downstream boundary in the physical model. The scour ratio could be defined as the ratio of the cumulative volume of the scoured sediment to the total amount of replenished sediment. As plotted in Figure 11 for each given discharge, except for 6100 m3/s, the variations in the scour ratio exhibited a linear trend approximately after 3 h. This indicates that the replenished sediment was scoured at a constant rate with time. According to the observed linear trend, the regression equation could be derived (Figure 11), and the corresponding R-squared value revealed good agreement. By using the regression equation for each given discharge, we estimated the time required for complete scouring (i.e., 100% scour ratio) of replenished sediment (with water content of 40%); the estimation results are listed in Table 2. The results indicated that the scour ratio increased with the discharge; complete scouring was achieved within 8 h. Moreover, when the Q value was 6100 m3/s, the entire amount of the replenished sediment was scoured (i.e., scour ratio = 100%) within 3 h. These results demonstrate that the scour ratio depends on the flood discharge and scour duration.
Figure 12 illustrates hydrographs of the measured sediment concentration against time for the test cases that involved replenished sediment with a water content level of 80%. Because of the lower erodibility of the replenished sediment, the experimental duration was too short to execute the physical model for a Q value of 6100 m3/s. Therefore, the test cases were conducted under only discharge values ranging from 500 to 3500 m3/s. In the test case that involved a Q value of 3500 m3/s, the peak sediment concentration (14,500 mg/L) was observed at 0.07 h. For comparison, in the test case that involved a Q value of 500 m3/s, the peak sediment concentration (42,000 mg/L) was observed at 0.7 h. Similarly, the peak sediment concentration observed in the test case that involved the Q value of 3500 m3/s was lower than that observed in the test case that involved the Q value of 500 m3/s; however, the peak sediment discharge in the test case of 3500 m3/s was higher. Furthermore, as revealed in the hydrographs, major variations obviously occurred in the first 1.5 h. After 1.5 h, the measured sediment concentrations for all test cases were lower than 3000 mg/L.
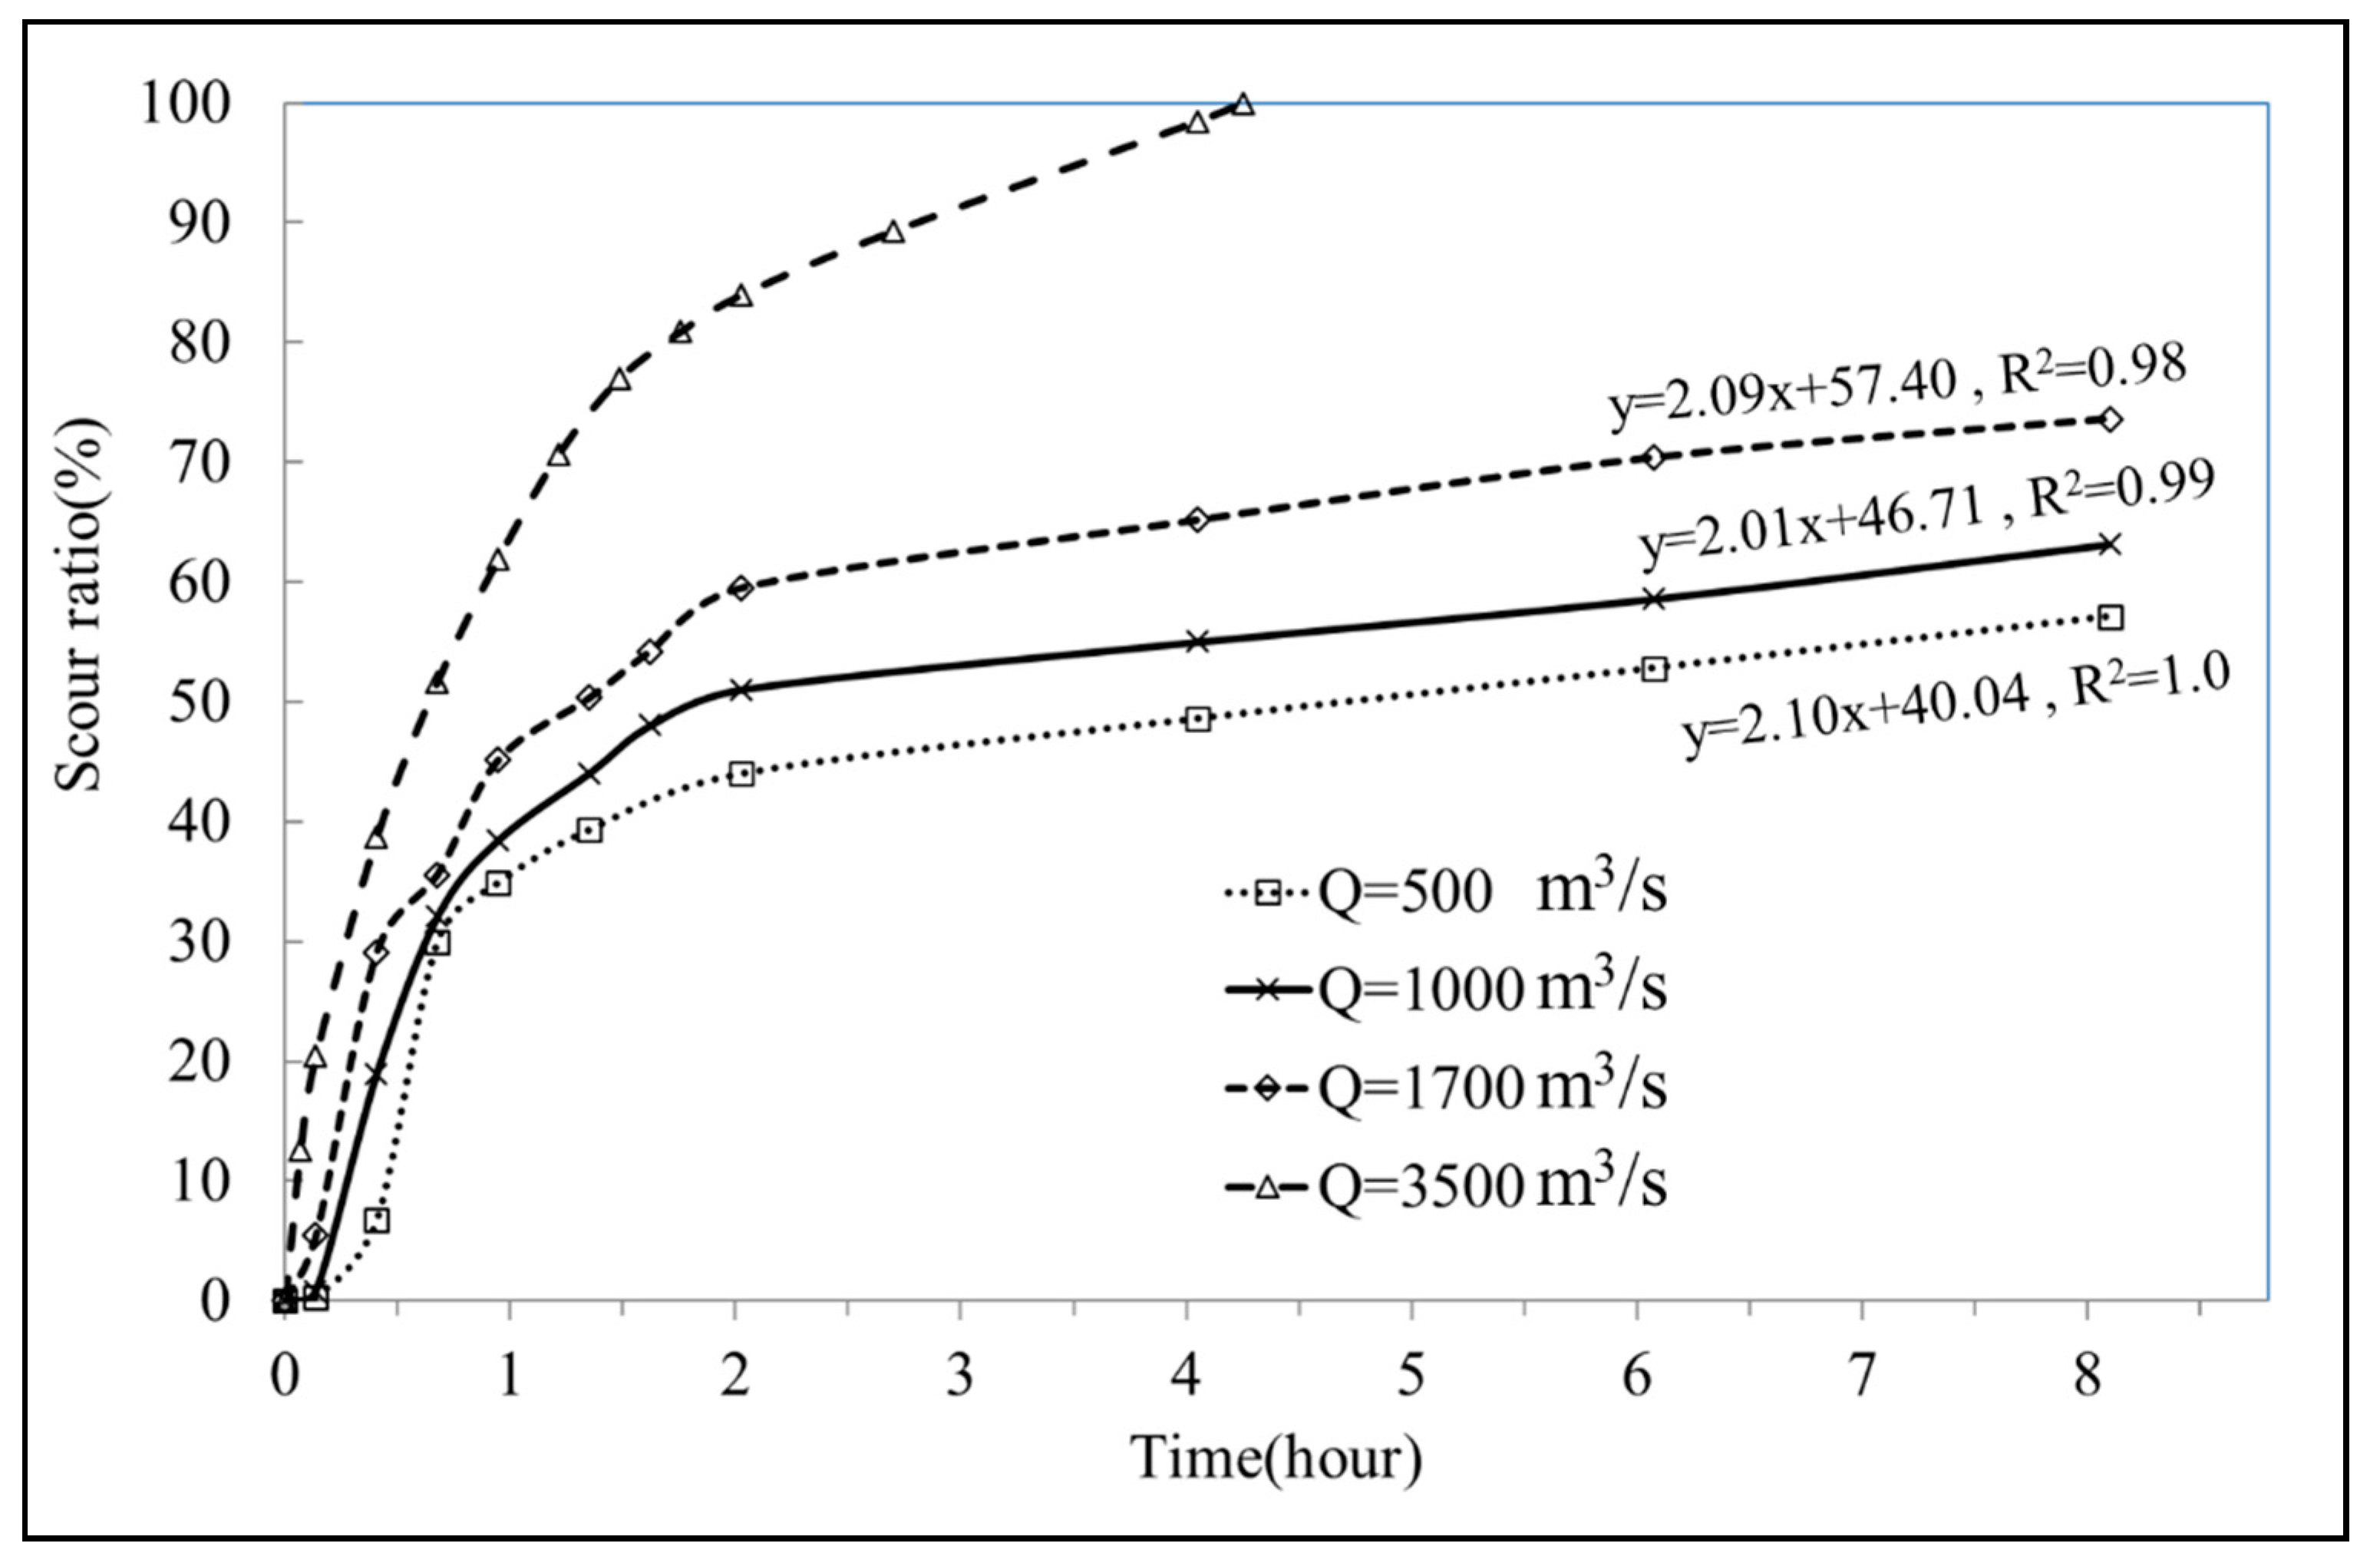
As plotted in Figure 13, the variations in the scour ratio after approximately 2 h presented a linear trend, indicating the steady rate of the scour ratio at each given discharge with time. Accordingly, the regression equation at each given discharge could be obtained, and the corresponding R-squared values demonstrated good agreement with the measured data. By applying the regression equation to each given discharge value, we estimated the time required for complete scouring of the replenished sediment (with water content of 80%); the estimation results are presented in Table 2. Except for the test case that involved the Q value of 3500 m3/s, the experiments were conducted within 8 h, and the scour ratio increased with the discharge. When Q was 3500 m3/s, 4.25 h was required to scour the entire amount of the replenished sediment (i.e., scour ratio = 100%). The experimental results reveal that a higher water content was associated with a higher scour ratio. The estimated time required to achieve a scour ratio of 100% was also longer when the water content was lower. On the basis of these experimental results, we can conclude that the scour ratio depends on the flood discharge, flood duration, and water content of replenished sediment.

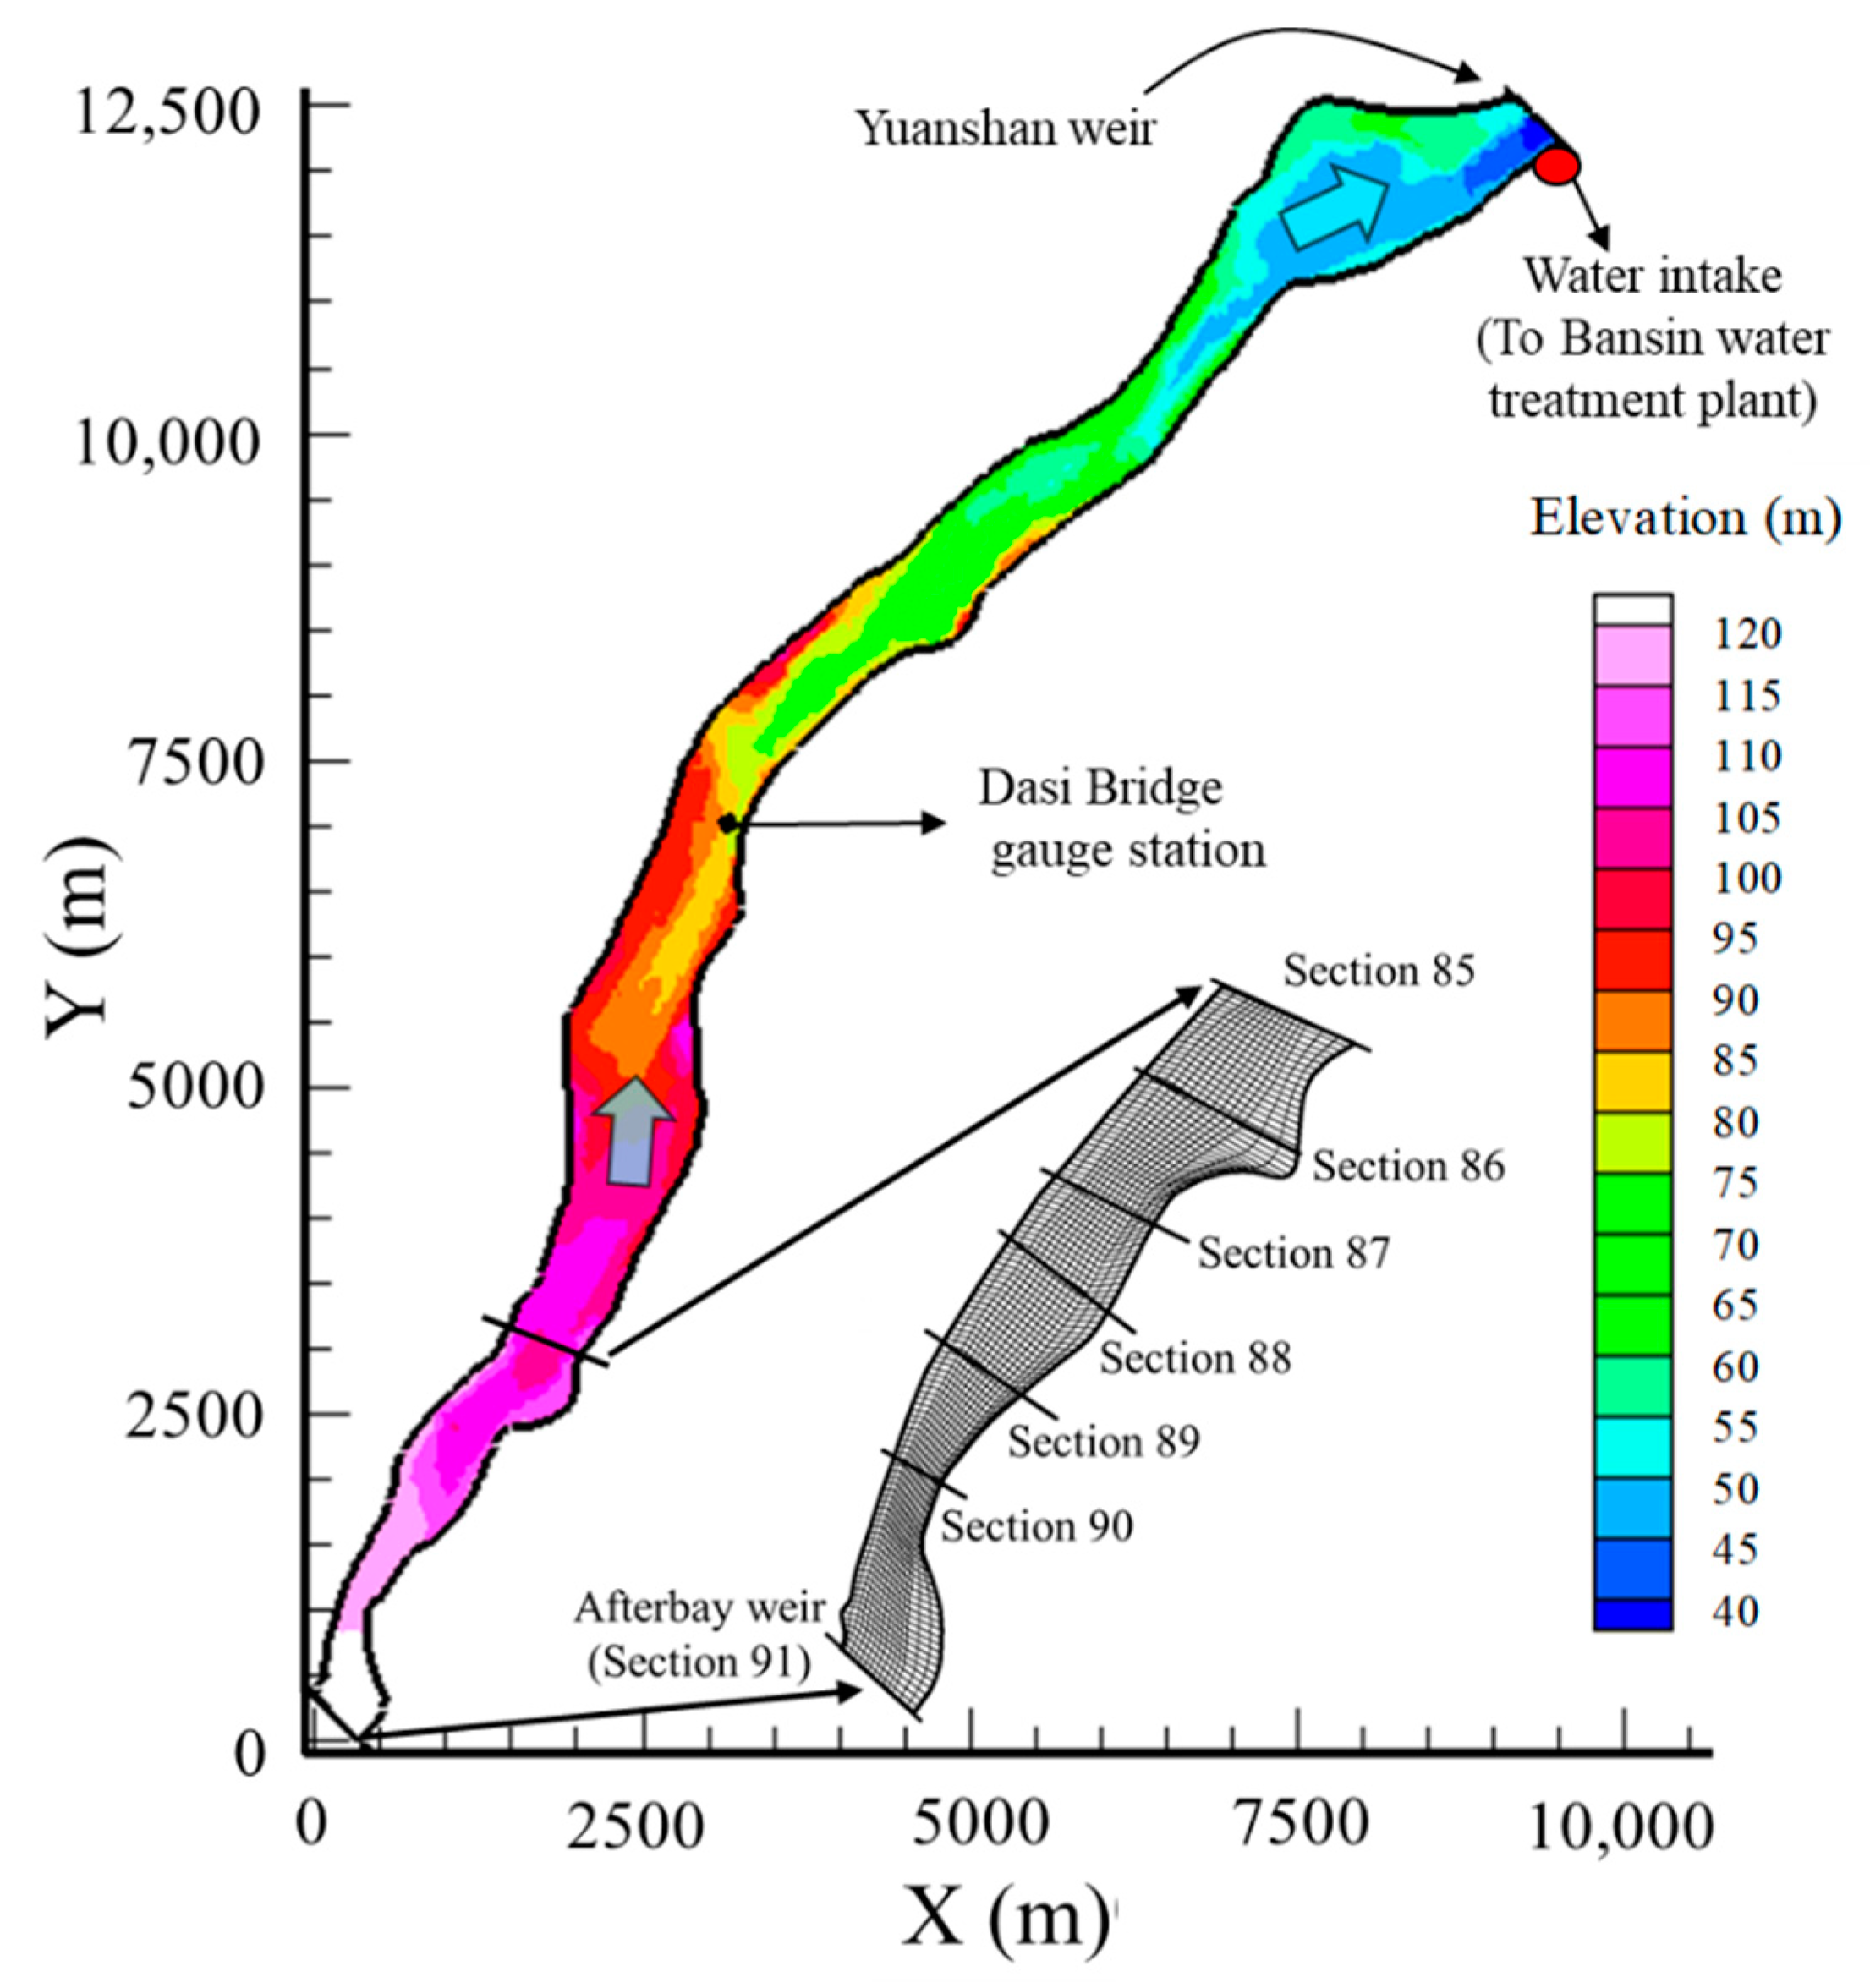
6. Influence of Scouring on Downstream Water Intake

Scouring replenished sediment may influence the water quality at the downstream water intake section. Using the derived experimental data regarding outflow sediment concentrations, we investigated the influence of scouring on downstream water intake by conducting a 2D numerical simulation of suspended sediment transport in the downstream river. The Yuanshan weir is located downstream the Shihmen Reservoir, which is approximately 16.5 km away from the replenishment area. Water is typically withdrawn from the water intake section at the Yuanshan weir to the Bansin water treatment plant, which has a concentration limit of 6000 mg/L. According to the experimental results, the outflow sediment concentrations measured in all the test cases when the water content was 40% were rather high during the first 1.5 h. This may affect the suspended sediment concentration at the water intake and exceed the concentration limit stipulated by the Bansin water treatment plant. Considering the facilities of the treatment plant, the water turbidity can be treated if the sediment concentration decreases to 6000 mg/L or lower [34].
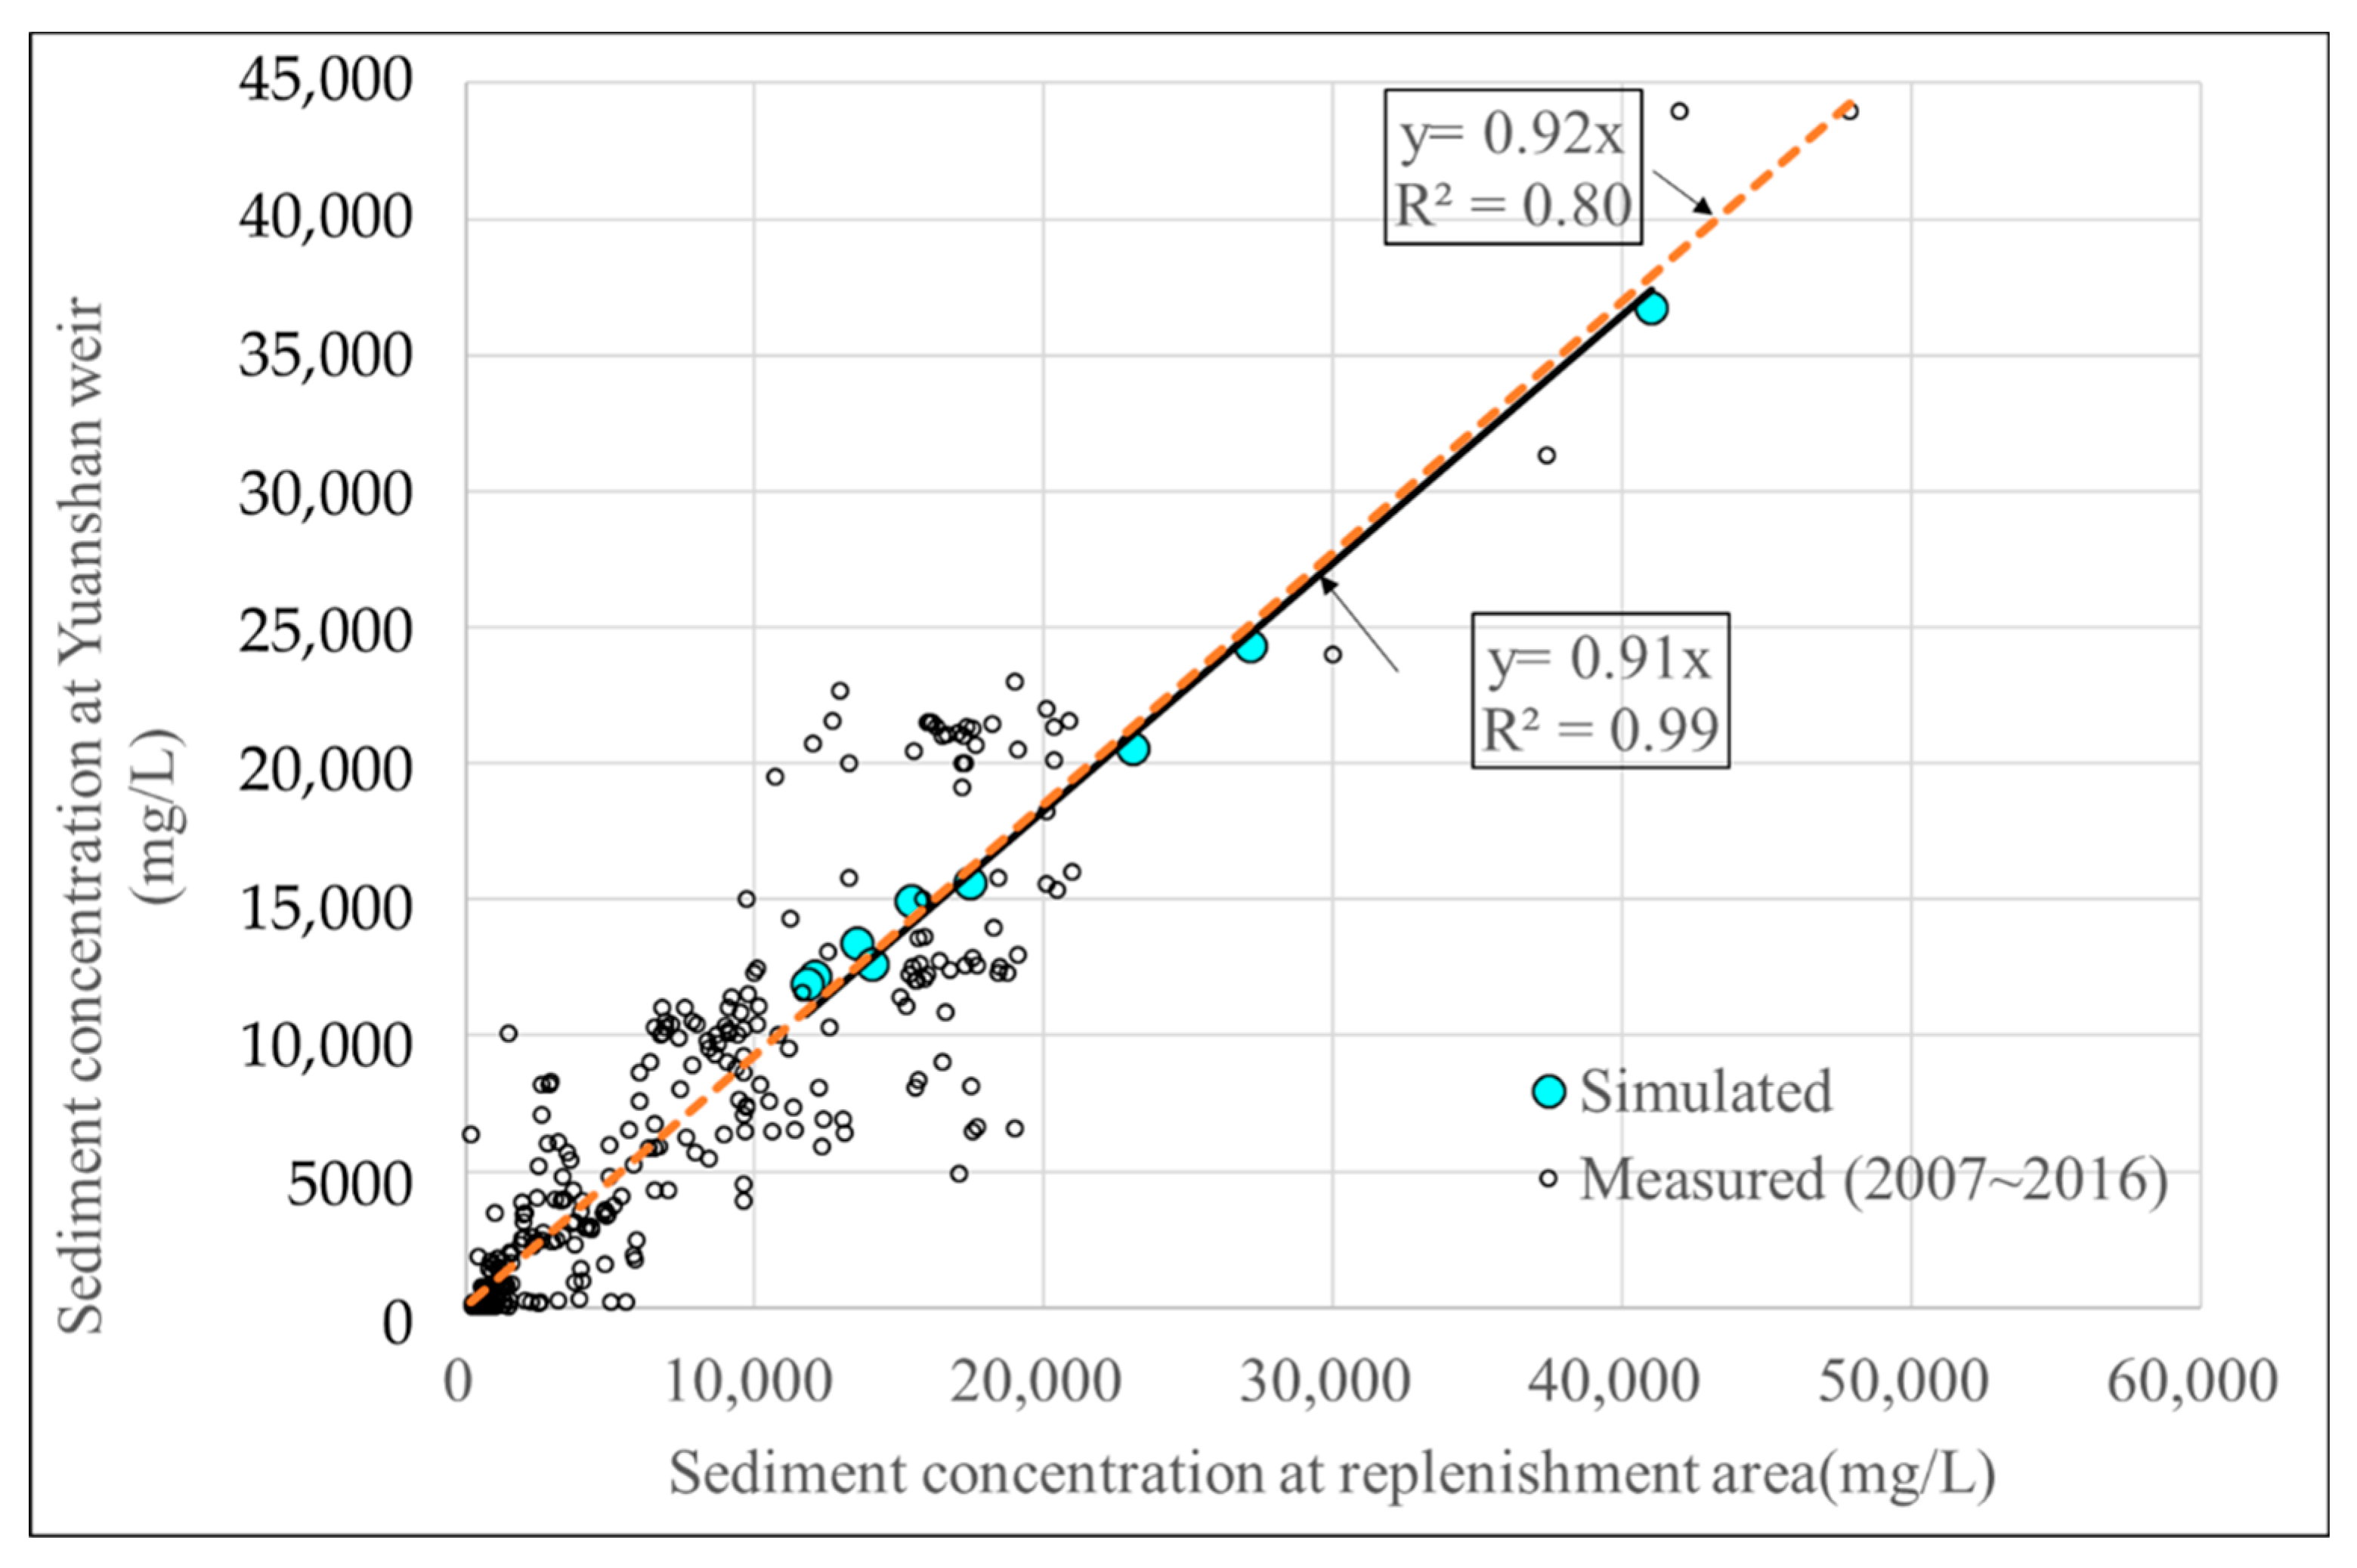
To understand the effect of the scouring of replenished sediment on the downstream water intake, the reduction ratio of sediment concentration should be investigated. By using field measurement data obtained from 2007 to 2016, we derived the relationship between the suspended sediment concentrations at the Yuanshan weir and afterbay weir (nearby replenishment area), and the results are plotted in Figure 14. For modelling suspended sediment transport along the downstream river reach, we applied the 2D numerical model to solve the shallow water equations coupled with the advection–diffusion equation. According to the peak sediment concentration observed for each test case, we simulated the transport of suspended sediment and dissipation of replenished sediment under steady-flow conditions within the river reach, as described in Section 3.2. Figure 14 shows a plot of the simulated sediment concentration in the water intake section of the Yuanshan weir against the concentration in the replenishment area; the figure also shows a plot of the regressed relationship between the field data measured during flood discharge at the Yuanshan weir and the afterbay weir (around the replenishment area). By comparing the regression equations, we observed the simulated results to be close to the measured results. Clearly, the sediment concentration reduction ratio ranged from 91% to 92%. Thus, the reduction ratio of the concentration of suspended sediment scoured from the replenishment area to the concentration of suspended sediment at the Yuanshan weir was approximately 90%. According to the suspended sediment concentration limit (6000 mg/L) imposed at the Bansin water treatment plant, the outflow sediment concentration from the replenishment area was limited to 6667 mg/L.

7. Summary and Conclusions

Many reservoir management strategies and countermeasures have been implemented for reducing sedimentation effects. Dredging is a commonly used measure to remove mechanically deposited sediment. However, the disposal of dredged sediment can be costly because of engineering, permission, or placement site problems. Nevertheless, dredged sediment can be considered a beneficial resource that can be added to downstream rivers to compensate for dam-induced interruptions of sediment supply. The sediment replenishment method is an experimentally determined strategy in which sediment dredged or excavated from a reservoir can be used for riverbed replenishment to prevent downstream riverbed degradation, reduce coastline erosion, and execute estuary restoration for aquatic habitats. Nevertheless, high concentrations of fine replenished sediment may be scoured during reservoir flood discharges, which may deteriorate the water quality at the water intake in downstream river reaches.
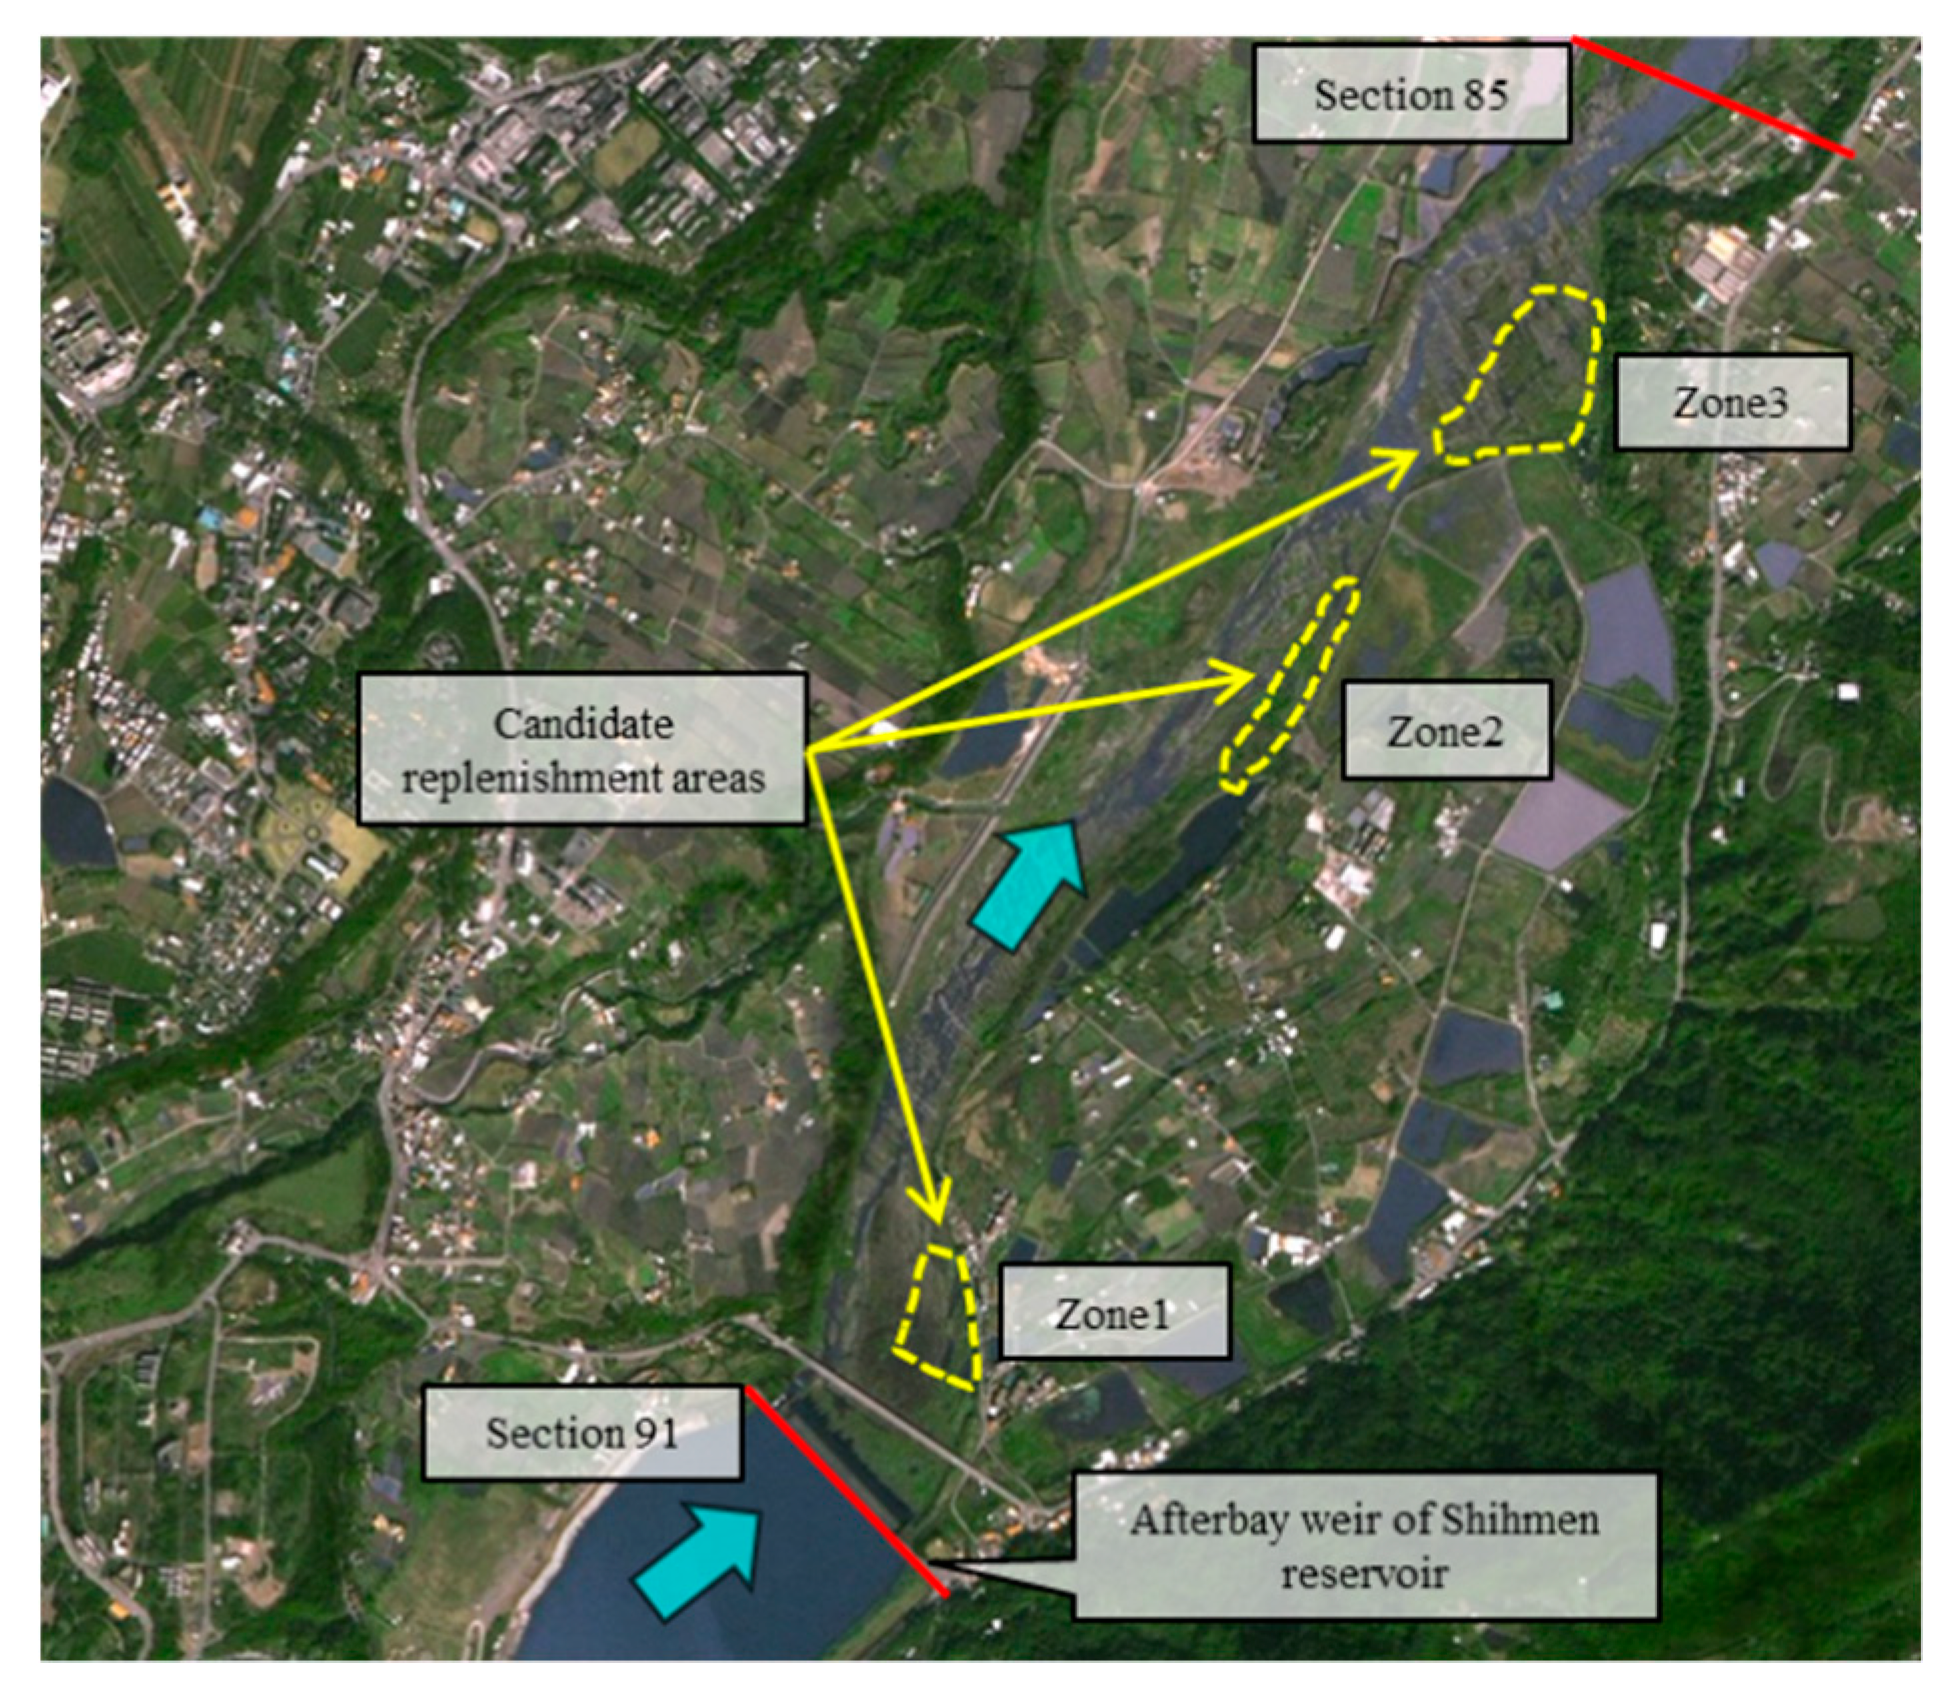
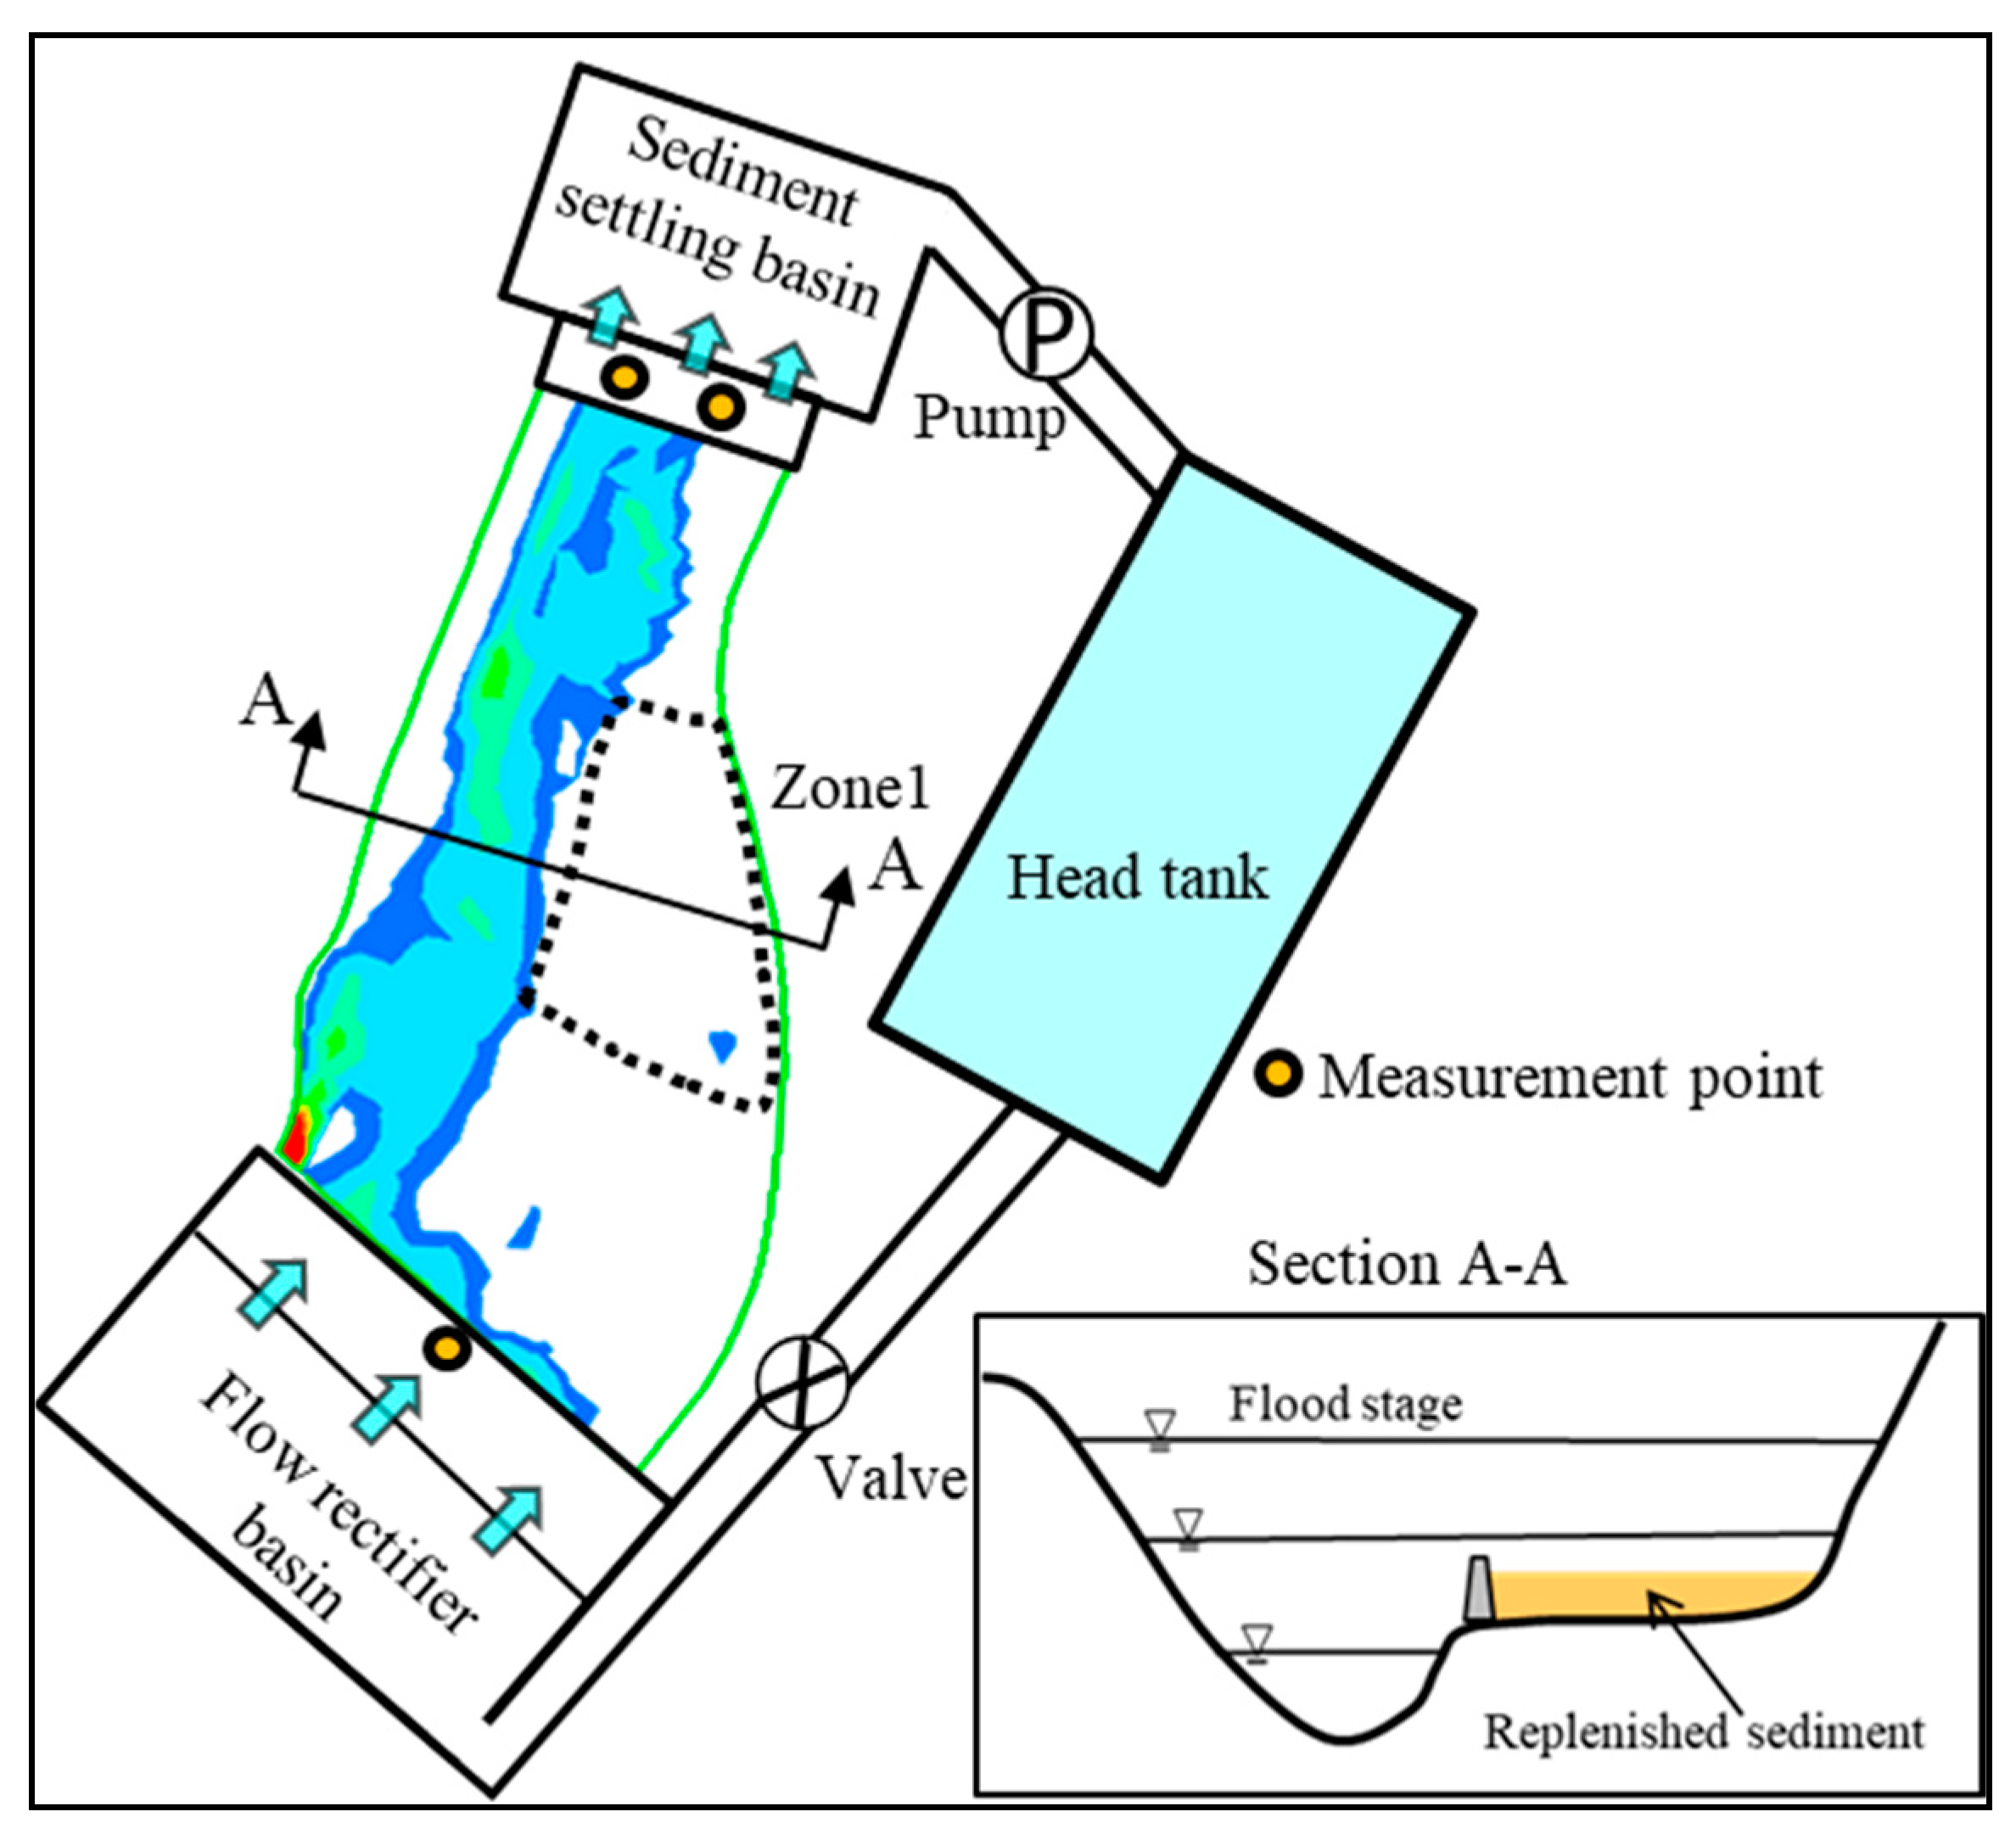
This study selected the Shihmen Reservoir located in Northern Taiwan to investigate the feasibility of reservoir replenishment using fine sediment. Previous studies on sediment replenishment in field or laboratory experiments have mainly focused on coarse materials, with few studies providing examples for fine sediment. In this study, candidate replenishment areas were first analyzed using a validated 2D numerical model to simulate flow velocity fields and water depths. To simulate suspended sediment transport in the model, the 2D shallow water equations along with the advection–diffusion equation was solved numerically in the framework of the finite volume method. On the basis of the analysis of the critical scour velocity, we adopted a flow velocity of 1.5 m/s along with a sufficient water depth to evaluate the incipient motion of both very fine and coarse replenished sediment. Although the concept of critical scour velocity is used herein for illustrative purposes, it indeed provided the preliminary criterion to assess the most feasible replenishment area. By comparing the simulated velocity fields and water depths in the candidate replenishment areas through hydraulic assessment, we identified the most feasible replenishment area, namely Zone 1, as the experimental domain (Figure 6) for the physical model.
For satisfying the similitude of model scaling, the physical model was developed to mimic the scouring process of replenished sediment in the downstream river reach of Shihmen dam. As mentioned, similarities in sediment transport mechanisms engender difficulties in combining coarse and fine materials because of the difference in sediment particle sizes. The dimensionless shear parameter in the Shields diagram was employed for scaling the incipient particle motion by using Equation (8) for coarse sediment in the filter structure. For determining the scouring similarity of the fine replenished sediment, the relationship between flow-critical velocity and sediment dry density was regressed through flume experiments by using Equation (10). Using different water content levels (40% and 80% corresponding to dry densities of 1.2 and 0.84 t/m3, respectively) of the dredged fine sediment, we performed experiments in the physical model to investigate the incipient motion of replenished sediment with cohesiveness. On the basis of dynamic similarity during scouring, the sediment concentration scale ratio was equal to the dry density scale ratio presented in Equation (11). The time scale ratio of the scouring process was the same as that of the flow similarity derived from the Froude number. This indicates that the scouring time scale of flood flow is equal to that of sediment transport.
According to flood discharge data and frequency analysis data available for the Shihmen Reservoir, five inflow discharge values ranging from 500 to 6100 m3/s were used in the physical model tests as the upstream boundary conditions, which generated overbank flow during a flood in the replenishment area on the floodplain. The hydrographs obtained from the test cases that involved the water content of 40% (Figure 10) revealed that the variations in the sediment concentration apparently occurred in the first 1.5 h. After 1.5 h, the measured sediment concentrations for all test cases were lower than 6000 mg/L. This concentration value was determined to be suitable for the downstream water intake stipulated by the Bansin water treatment plant. For the test cases that involved the water content of 80% (Figure 12), the measured sediment concentrations after 1.5 h were lower than 3000 mg/L for all test cases. Thus, for all test cases, the entire scouring operation took less than 1.5 h in the replenishment area to affect the downstream water treatment plant.
In the scouring process, the scour ratio was defined as the cumulative amount of scoured volume to the total amount of replenished sediment. Through experiments, the scour ratio was analyzed using relevant factors, including flood discharge and duration and water content of the replenished sediment. The scour ratio presented a linear trend, which provided the basis for obtaining the regression equation for each given discharge value (Figure 11 and Figure 13). Using the regression equation, we estimated the time required to scour the entire amount of the replenished sediment (i.e., scour ratio = 100%), as presented in Table 2. As the scour ratio increased, the inflow discharge increased, and the time required to scour the entire amount of the replenished sediment decreased.
According to the experimental results obtained for the study site, high concentrations of replenished sediment in the outflow could affect the suspended sediment concentrations at the water intake and exceed the concentration limit stipulated by the Bansin water treatment plant. The reduction ratio of sediment concentration was investigated by establishing the relationship between the suspended sediment concentration data obtained at the Yuanshan weir and those obtained at the afterbay weir near the replenishment area (Figure 14). Through the use of the 2D numerical model, the peak sediment concentration in each test case was provided as the input to obtain the simulated sediment concentration at the water intake of the Yuanshan weir. By comparing the regression equations, it was found that the sediment concentration reduction ratio ranged from 91% to 92%. The reduction ratio of the concentration of the suspended sediment scoured from the replenishment area to the concentration of the sediment at the Yuanshan weir was approximately 90%. Thus, the concentration of the outflow sediment produced at the replenishment area was limited to 6667 mg/L, thus matching the concentration limit of 6000 mg/L stipulated by the Bansin water treatment plant.

Author Contributions

F.-Z.L. developed the study methodology, conducted the experiments, and wrote the manuscript. J.-S.L. provided research directions and comments and revised the manuscript. W.-D.G. assisted in the numerical simulations and result analysis. T.S. was responsible for data collection regarding sediment replenishment and for providing practice suggestions.

Funding

This study was funded by the Ministry of Science and Technology, Taiwan, under grant numbers MOST 107-2625-M-002-002, MOST 105-2221-E-002-063-MY3, and MOST 105-2625-M-002-025-MY2.

Acknowledgments

The authors acknowledge the Northern Region Water Resources Office, Water Resources Agency, and Ministry of Economic Affairs, Taiwan, for the valuable data provided for this study. The authors also appreciate the Hydrotech Research Institute of National Taiwan University for providing facilities and technical support.

Conflicts of Interest

The authors declare no conflict of interest.

References

  1. Annandale, G.W.; Morris, G.L.; Karki, P. Extending the Life of Reservoirs: Sustainable Sediment manAgement for Dams and Run-of-River Hydropower; World Bank Group: Washington, DC, USA, 2016. [Google Scholar]
  2. Kondolf, G.M. Hungry water: Effects of dams and gravel mining on river channels. Environ. Manag. 1997, 21, 533–551. [Google Scholar] [CrossRef]
  3. Kondolf, G.M.; Gao, Y.X.; Annandale, G.W.; Morris, G.L.; Jiang, E.H.; Zhang, J.H.; Cao, Y.T.; Carling, P.; Fu, K.D.; Guo, Q.C.; et al. Sustainable sediment management in reservoirs and regulated rivers: Experiences from five continents. Earth’s Future 2014, 2, 256–280. [Google Scholar] [CrossRef]
  4. Shields, F.D.; Simon, A.; Steffen, L.J. Reservoir effects on downstream river channel migration. Environ. Conserv. 2000, 27, 54–66. [Google Scholar] [CrossRef] [Green Version]
  5. Wilcock, P.R.; Kondolf, G.M.; Matthews, W.V.; Barta, A.F. Specification of sediment maintenance flows for a large gravel-bed river. Water Resour. Res. 1996, 32, 2911–2921. [Google Scholar] [CrossRef]
  6. Sumi, T.; Kantoush, S.A. Comprehensive sediment management strategies in Japan: Sediment bypass tunnels. In Proceedings of the 34th IAHR World Congress, Brisbane, Australia, 26 June–1 July 2011; pp. 1803–1810. [Google Scholar]
  7. Sumi, T.; Kantoush, S.A. Sediment replenishing measures for revitalization of Japanese rivers below dams. In Proceedings of the 34th IAHR World Congress, Brisbane, Australia, 26 June–1 July 2011; pp. 2838–2846. [Google Scholar]
  8. Wang, H.W.; Kondolf, G.M.; Desiree, T.; Kuo, W.C. Sediment management in Taiwan’s reservoirs and barriers to implementation. Water 2018, 10, 1034. [Google Scholar] [CrossRef]
  9. Stähly, S.; Franca, M.J.; Robinson, C.T.; Schleiss, A.J. Sediment replenishment combined with an artificial flood improves river habitats downstream of a dam. Nat. Sci. Rep. 2019, 9, 5176. [Google Scholar] [CrossRef] [PubMed]
  10. Sumi, T.; Lee, F.Z.; Lai, J.S.; Tan, Y.C.; Huang, C.C. Flushing replenished sediment on floodplain downstream of a reservoir. In Proceedings of the International Symposium on Dams for a Changing World, Kyoto, Japan, 5 June 2012. [Google Scholar]
  11. Battisacco, E.; Franca, M.J.; Schleiss, A.J. Sediment replenishment: Influence of the geometrical configuration on the morphological evolution of channel-bed. Water Resour. Res. 2016, 52, 8879–8894. [Google Scholar] [CrossRef]
  12. Central Region Water Resources Office. Report of Implementation and Efficiency of Replenishment in Shigang Dam Downstream River; Water Resources Agency, Ministry of Economic Affairs: Taichung, Taiwan, 2009. (In Chinese)
  13. Kantoush, S.A.; Sumi, T.; Kubota, A. Geomorphic Response of Rivers Below Dams by Sediment Replenishment Technique. In Proceedings of the River Flow 2010, Braunschweig, Germany, 8–10 September 2010; Dittrich, A., Koll, K., Aberle, J., Geisenhainer, P., Eds.; Japan Water Agency: Tokyo, Japan, 2010. [Google Scholar]
  14. Okano, M.; Kikui, M.; Ishida, H.; Sumi, T. Reservoir sedimentation management by coarse sediment replenishment below dams. In Proceedings of the Ninth International Symposium on River Sedimentation, Yichang, China, 18–21 October 2004; pp. 1070–1078. [Google Scholar]
  15. Seto, K.; Sakamoto, T.; Suetsugi, T. Sediment control measures and improvement effects of physical condition and environment by sediment flushing—A case study in the Yahagi dam. In Proceedings of the International Congress on Large Dams, Brasilia, Brazil, 22–29 May 2009. Q.89-R.3. [Google Scholar]
  16. Sumi, T.; Kobayshi, K.; Yamaguchi, K.; Takata, Y. Study on the applicability of the asset management for reservoir sediment management. In Proceedings of the International Congress on Large Dams, Brasilia, Brazil, 22–29 May 2009. Q.89-R.4. [Google Scholar]
  17. Ock, G.; Sumi, T.; Takemon, Y. Sediment replenishment to downstream reaches below dams: Implementation perspectives. Hydrol. Res. Lett. 2013, 7, 54–59. [Google Scholar] [CrossRef]
  18. Guo, W.D.; Lai, J.S.; Lin, G.F.; Lee, F.Z.; Tan, Y.C. Finite-volume multi-stage scheme for advection-diffusion modeling in shallow water flow. J. Mech. 2011, 27, 415–430. [Google Scholar] [CrossRef]
  19. Environmental Protection Administration (EPA). Water Pollution Control Act, Taiwan. 2018. Available online: https://law.moj.gov.tw/ENG/LawClass/LawAll.aspx?pcode=O0040001 (accessed on 13 June 2018).
  20. Northern Region Water Resources Office. Research of Arrangement and Planning on Deposition Sediment in Shihmen Reservoir; Water Resources Agency, Ministry of Economic Affairs: Taoyuan, Taiwan, 2010. (In Chinese)
  21. Ziegler, C.K.; Nisbet, B.S. Long-term simulation of fine-grained sediment transport in large reservoir. J. Hydraul. Eng. 1995, 121, 773–781. [Google Scholar] [CrossRef]
  22. Teisson, C. Cohesive suspended sediment transport: Feasibility and limitations of numerical modeling. J. Hydraul. Res. 1991, 29, 755–769. [Google Scholar] [CrossRef]
  23. Liu, W.C.; Hsu, M.H.; Kuo, A.Y. Modelling of hydrodynamics and cohesive sediment transport in Tanshui river estuarine system, Taiwan. Mar. Pollut. Bull. 2002, 44, 1076–1088. [Google Scholar] [CrossRef]
  24. Guo, W.D.; Lai, J.S.; Lin, G.F. Finite-volume multi-stage schemes for shallow-water flow simulations. Int. J. Numer. Methods Fluids 2008, 57, 177–204. [Google Scholar] [CrossRef]
  25. Hjulstrom, F. Decay of Pressure Fluctuation in the Hyporheic Zone around a Cylinder. World J. Mech. 1935, 6, 159–168. [Google Scholar]
  26. Fortier, S. Permissible canal velocities. Proc. Am. Soc. Civil Eng. 1923, 51, 1398–1414. [Google Scholar]
  27. Garey, W.P.; Simon, A. Physical Basis and Potential Estimation Basis and Potential Estimation Techniques for Soil Erosion Parameters in the Precipitation-Runoff Modeling System (PRMS); Water-Resources Investigations Report 84-4218; U.S. Geological Survey: Reston, VA, USA, 1984.
  28. Graf, W.H. Hydraulics of Sediment Transport; Water Resources Publications, LLC.: Highlands Ranch, CO, USA, 1984. [Google Scholar]
  29. Ettema, R.; Arndt, R.; Roberts, P.; Wahl, T. Hydraulic Modeling: Concepts and Practice. ASCE Manuals and Reports on Engineering Practice; American Society of Civil Engineers: Reston, VA, USA, 2000. [Google Scholar]
  30. Wang, Z.; Zhang, S. Model study on emptying flushing in a reservoir with cohesive deposits. J. Sediment Res. 1989, 2, 62–68. (In Chinese) [Google Scholar]
  31. Mehta, A.J.; Hayter, E.J.; Parker, W.R.; Krone, R.B.; Teeter, A.M. Cohesive sediment transport. I: Process description. J. Hydraul. Eng. 1989, 115, 1076–1093. [Google Scholar] [CrossRef]
  32. Lai, J.S.; Chang, F.J. Physical modeling of hydraulic desiltation in Tapu Reservoir. Int. J. Sediment Res. 2001, 16, 363–379. [Google Scholar]
  33. Lai, J.S. Research of threshold velocity on fine sediment in Agongdian Reservoir. J. Taiwan Water Conserv. 1998, 46, 76–83. [Google Scholar]
  34. Lee, F.Z.; Lai, J.S.; Guo, W.D.; Huang, C.C.; Chang, F.C.; Tan, Y.C. The Impacts of water withdraw at Yuanshanyan during sediment venting in Shihmen Reservoir. J. Taiwan Agric. Eng. 2012, 58, 80–94. [Google Scholar]
Figure 1. Location map and geometry of Shihmen Reservoir.
Water 11 01998 g001
Figure 2. Sediment grain size distribution sampled in the field and used in the physical model.
Water 11 01998 g002
Figure 3. Simulation domain along the downstream river from Shihmen afterbay weir to Yuanshan weir; some of the grid meshes also displayed.
Water 11 01998 g003
Figure 4. Model validation using data of two typhoon flood events at the Dasi bridge gauge station.
Water 11 01998 g004
Figure 5. Candidate sediment replenishment areas.
Water 11 01998 g005
Figure 6. Downstream river reach for evaluation with a discharge of 200 m3/s.
Water 11 01998 g006
Figure 7. Simulated water depth and flow velocity distributions at flood discharges of (a) 1700 and (b) 6100 m3/s.
Water 11 01998 g007
Figure 8. Layout of the physical model.
Water 11 01998 g008
Figure 9. Installation of replenished sediment and filter structure (serving as a permeable barrier): (a) Zone 1 in the physical model, (b) view from the upstream side, and (c) view from the downstream side of the replenishment area.
Water 11 01998 g009
Figure 10. Hydrographs of concentrations of sediment with a water content of 40% at various reservoir flood discharges.
Water 11 01998 g010
Figure 11. Trend of the scour ratio against time for sediment with the water content of 40% at various reservoir flood discharges.
Water 11 01998 g011
Figure 12. Hydrographs of the concentrations of sediment with a water content of 80% at various reservoir flood discharges.
Water 11 01998 g012
Figure 13. Trends of scour ratio against time for sediment with a water content of 80% at various reservoir flood discharges.
Water 11 01998 g013
Figure 14. Relationship between sediment concentration in replenishment area and that at the downstream water intake at Yuanshan weir.
Water 11 01998 g014
Table 1. Scale ratio of the flow patterns and sediment properties.
ItemLength (m)Velocity (m/s)Discharge (m3/s)Time (s)Coarse Sediment Size (m)Dry Density (kg/m3)Sediment Concentration (mg/L)
Scale λ h λ h 1 / 2 λ h 5 / 2 λ h 1 / 2 λ h λ h 1 / 3.92 λ h 1 / 3.92
Ratio648327688642.892.89
Table 2. Scour ratio, experimental duration, and estimated duration for achieving a scour ratio of 100% for each given discharge at different water contents.
Discharge (m3/s)5001000170035006100
Water content (%)40804080408040804080
Scour ratio (%)/Experimental duration (h)42/857/852/863/867/874/884/898/4100/3-
Estimated duration at scour ratio (100%) (h)40.4428.5528.8226.5122.2020.3817.404.253.00-

