A Low-Cost Water Quality Monitoring System for the Ayeyarwady River in Myanmar Using a Participatory Approach


Department Water Management, Faculty of Civil Engineering and Geosciences, Delft University of Technology, PO. Box 5048, 2600 GA Delft, The Netherlands
*
Author to whom correspondence should be addressed.
Water 2019, 11(10), 1984; https://doi.org/10.3390/w11101984
Submission received: 7 June 2019
/
Revised: 26 August 2019
/
Accepted: 20 September 2019
/
Published: 23 September 2019
(This article belongs to the Section Water Quality and Contamination)
Abstract
:Newly developed mobile phone applications in combination with citizen science are used in different fields of research, such as public health monitoring, environmental monitoring, precipitation monitoring, noise pollution measurement and mapping, earth observation. In this paper, we present a low-cost water quality mobile phone measurement technique combined with sensor and test strips, and reported the weekly-collected data of three years of the Ayeyarwady River system by volunteers at seven locations and compared these results with the measurements collected by the lab technicians. We assessed the quality of the collected data and their reliability based on several indicators, such as data accuracy, consistency, and completeness. In this study, six local governmental staffs and one middle school teacher collected baseline water quality data with high temporal and spatial resolution. The quality of the data collected by volunteers was comparable to the data of the experienced lab technicians for sensor-based measurement of electrical conductivity and transparency. However, the lower accuracy (higher uncertainty range) of the indicator strips made them less useful in the Ayeyarwady with its relatively small water quality variations. We showed that participatory water quality monitoring in Myanmar can be a serious alternative for a more classical water sampling and lab analysis-based monitoring network, particularly as it results in much higher spatial and temporal resolution of water quality information against the very modest investment and running costs. This approach can help solving the invisible water crisis of unknown water quality (changes) in river and lake systems all over the world.
1. Introduction
Citizen science is basically the participation of local stakeholders in research design, data collection, data interpretation, and reporting, or any other related task [1]. Building a system to monitor the water quality of a large river system is an enormous investment in terms of logistic, organization, and finance. Simultaneously, it is crucial to raise awareness of the importance of good water quality among the general public and local authorities. These can be sustained by citizen science with a participatory approach.
Newly developed mobile phone applications in combination with citizen science are used in different fields of research, such as public health monitoring [2], water resources management [3], environmental monitoring [4,5,6], noise pollution measurement and mapping [7], earth observation [8], precipitation monitoring [9]. Mobile phones are widely used in the water domain [3,10,11].
Myanmar is facing big water-related challenges. Quality and availability of the sufficient water resources is the main factor of the income of the people and economy of Myanmar. [12]. The Ayeyarwady River, one of the largest rivers of the world and one the few remaining free-flowing rivers in Asia and the world [13], having the basin area of 413,710 km2 and maximum discharge of 30,000 m3/s [14], is the major river in Myanmar providing water resources for irrigation, agriculture, fishing, and drinking, and at the same time serving as one of the most important transport corridors. Contaminants from industry, agriculture, mining, and local communities are a potential threat to the river water quality [15]. The Chindwin River is the largest tributary of the Ayeyarwady [16] and there is extensive logging and mining in the upstream basin causing noticeable increases in sedimentation and turbidity [17]. Water quality monitoring of the Ayeyarwady is vital to safeguard the river as a resource. At present, despite of the obvious needs, there is a very limited amount of data available on the water quality in Myanmar [18,19].
The overarching purpose of our project is to set up a multi-objective surface water quality-monitoring program, which will take the current socio-economic situation of Myanmar into account. The specific main aim of this research is to investigate the potential of low-cost water quality monitoring of one of the largest rivers in the world, the Ayeyarwady River, using a participatory approach with the help of mobile phone applications. We have set up a citizen science-based participatory water quality monitoring network in the Ayeyarwady River and in the Chindwin tributary. In this paper, we present the low-cost water quality mobile phone measurement technique and report the weekly-collected data of three years. In this paper, we present and discuss the general water quality based on collected data and their potential for water quality management. We assess the quality of the collected data and its reliability based on several indicators, such as data accuracy, completeness, and consistency and answer the question: can volunteers do as accurate a job as trained lab technicians and are water quality data collected by volunteers reliable?
2. Methodology
2.1. The Monitoring Network and the Organisation of Volunteers
Most water quality monitoring networks are designed as multi-objective projects [20,21]. In our study, we focused on the identification of the baseline water quality condition of the Ayeyarwady River, finding possible trends in changes of the water quality, and identify sources of contamination. In Myanmar, it is logistically and financially unfeasible to monitor the water quality of the entire 2000 km of the Ayeyarwady River, which only includes the main channel. In this case, citizen science can significantly contribute to the monitoring program [1,6,8]. In such cases, the measurement methods should be simple and easy, so that everyone can use it. In our study, we used a mobile phone application in combination with simple indicator strip tests, a sensor connected to the mobile phone, and a transparency tube. The sampling sites were selected following the international guidelines [20,21,22]. Dry season field survey (preliminary survey) has been performed before deciding on the location of the sampling stations. In the preliminary survey, grab samples from 33 sampling stations (21 stations on the Ayeyarwady and 12 stations on the Chindwin River) have been collected from the main stream of the rivers from 10 cm below the water surface and in situ water quality testing was performed. In order to understand the spatial water quality and long-term trends, we chose the sampling stations based on the preliminary results of this survey and also took care to locate the sampling sites relatively nearer to existing water level stations. We initiated our monitoring program with 7 sampling stations, which can easily be extended or replaced after two to three years of monitoring. Additionally, the availability of volunteers and Internet access were considered. It is generally advised to collect composite water samples in a large river [20]. Taking a composite sample is a risk and a challenge in the Ayeyarwady for volunteers, since it would require a boat to cross the river and a special water sampler to obtain a depth-integrated water sample. As a consequence, the composite sample was eventually omitted and the volunteers were requested to take water samples from a distance of just two meters from the river shore. Generally, a frequency of once a month is acceptable in water quality monitoring over a longer time period [21]. However, in this study the frequency was increased to once a week in order to trade off the expected lower accuracy against a higher frequency.
To check the quality of the measurements executed by the volunteers several approaches were followed (see also Section 2.6). First, the volunteer-based results were compared to the in situ, annual water quality survey in the dry season done by technicians from the laboratory of the Directorate of Water Resources and Improvement of River Systems (DWIR). Second, monthly water samples were taken by the volunteers which were transported to DWIR lab for analysis. These samples were not filtered and buffered before being stored for EC and transparency analysis. Lastly, the results of the volunteers were visually checked from photos stored simultaneously with the results in the database.
2.2. Volunteers Recruitment
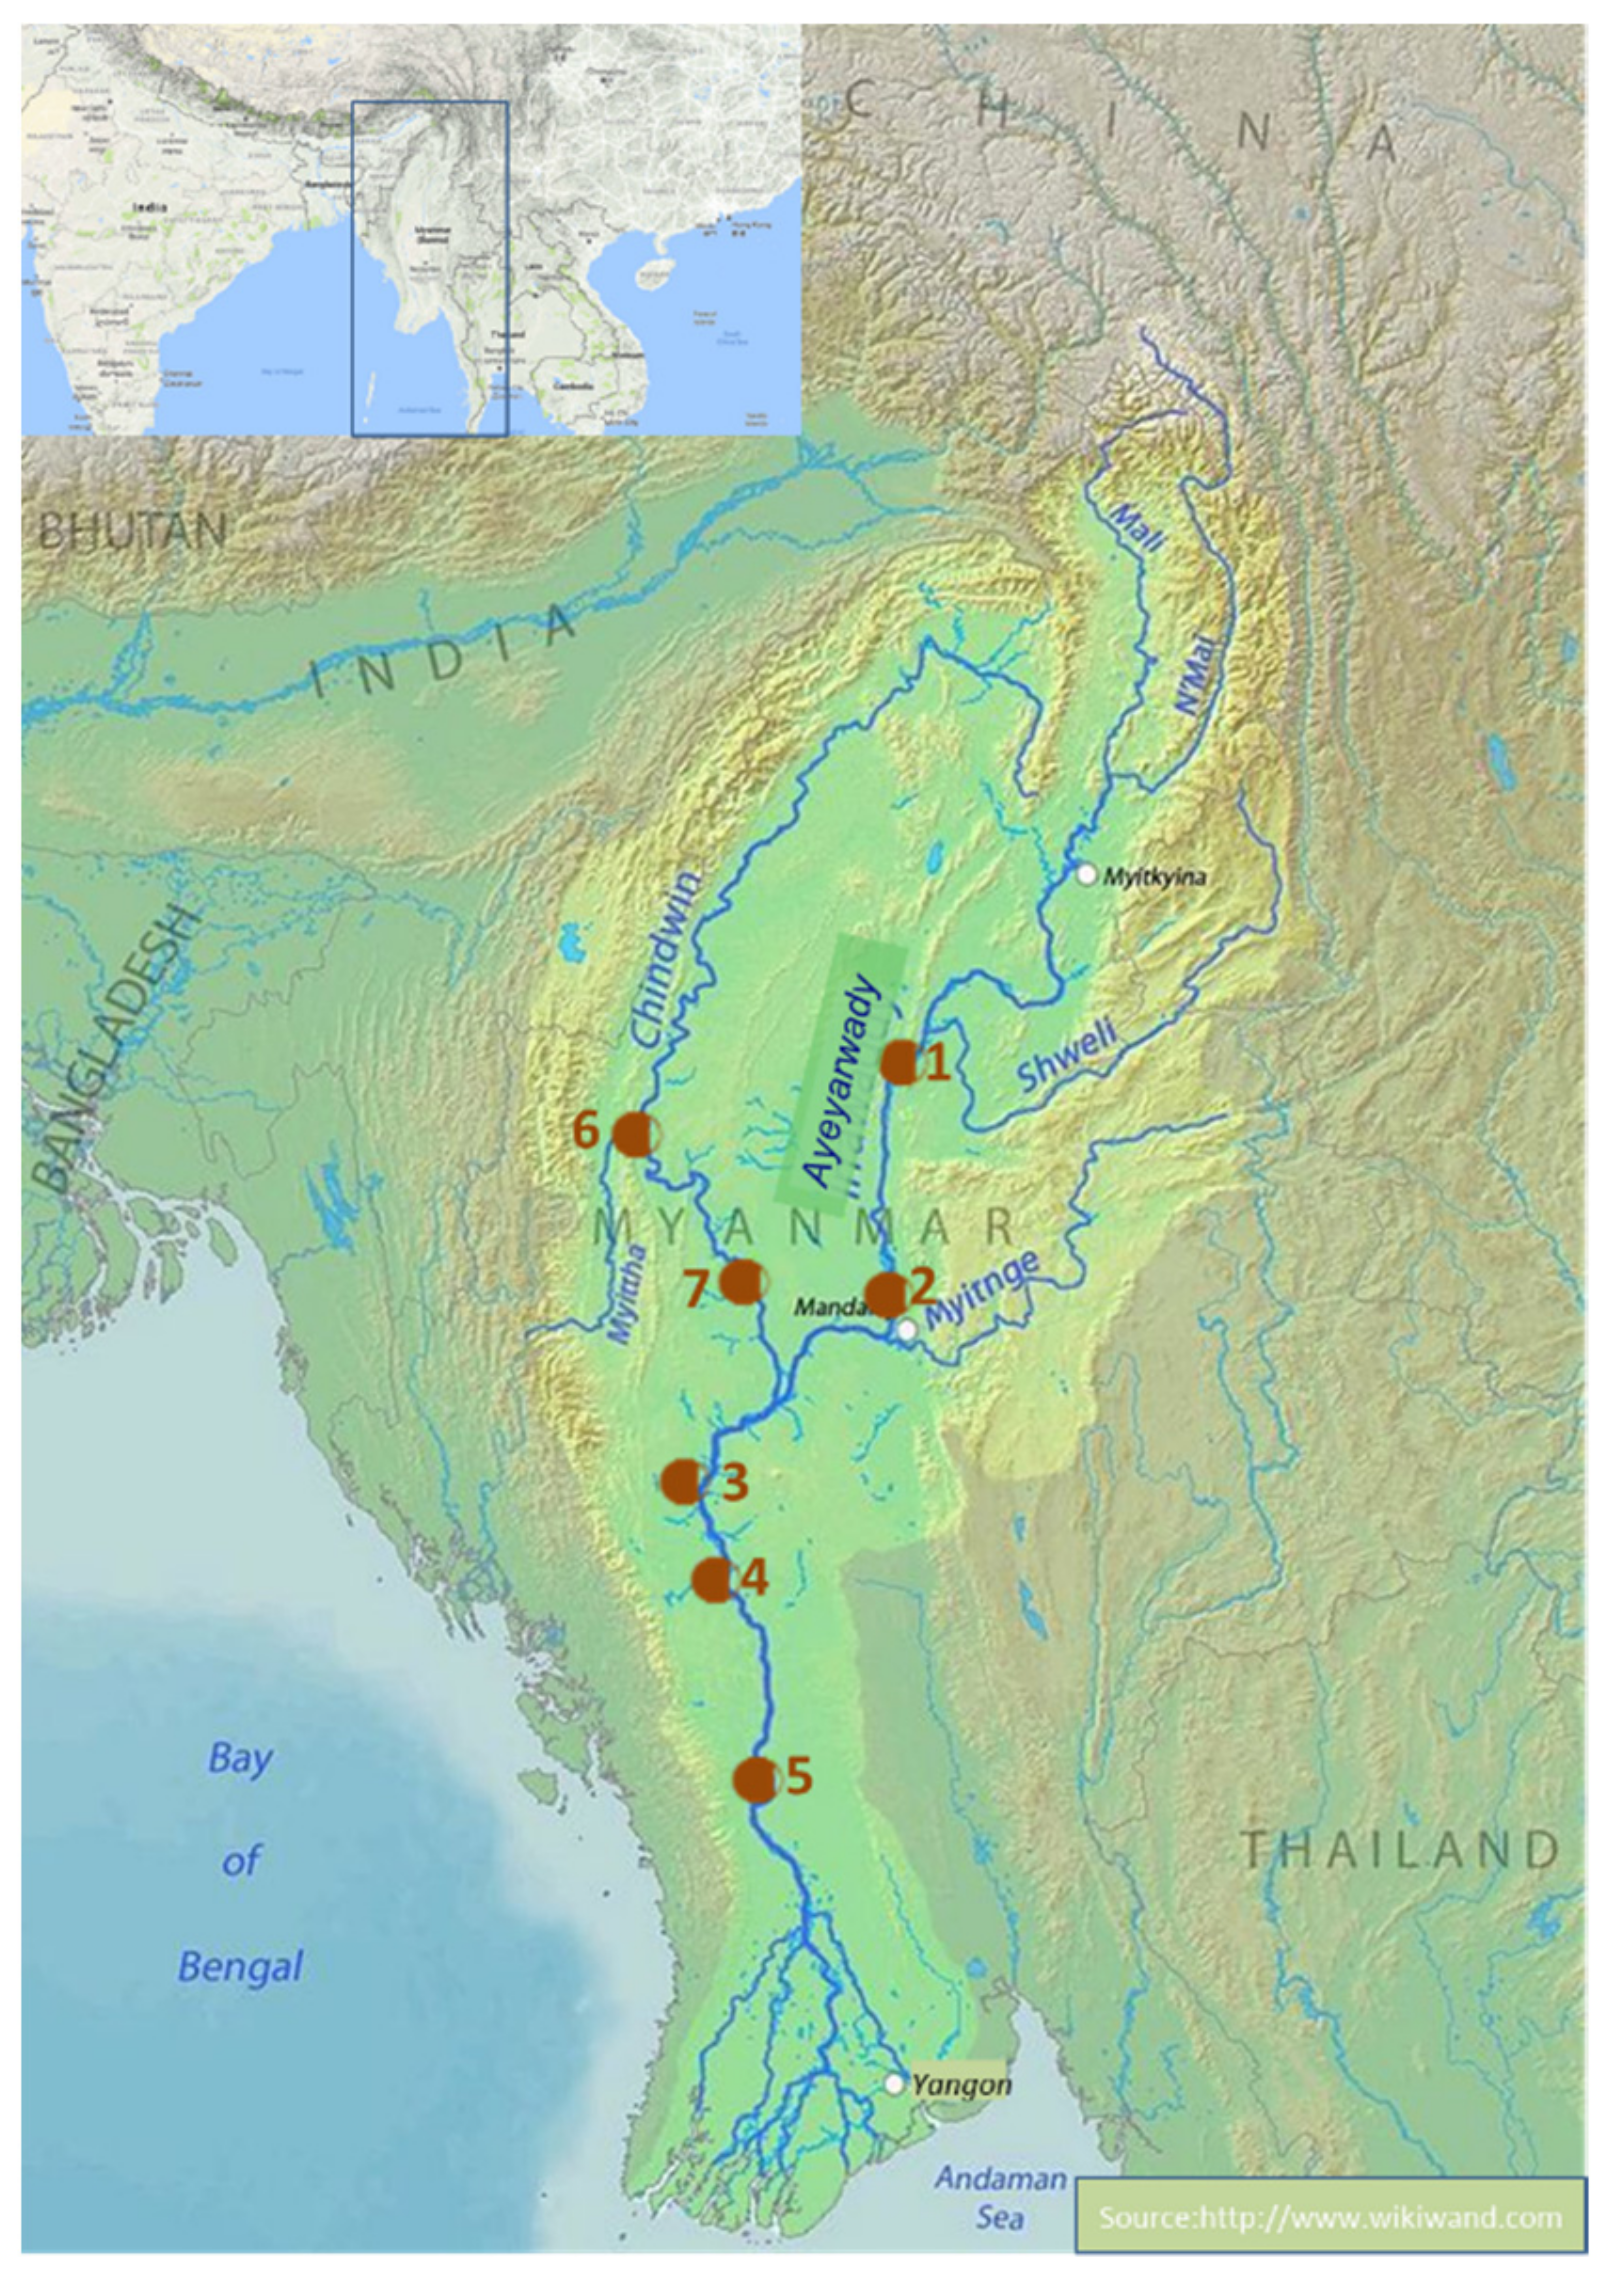
The selection of volunteers is an important and quite sensitive task [23,24,25]. In our study we recruited local governmental and administrative staff without a background in water quality monitoring, but who are working in the regional offices of the DWIR. As the volunteers did their weekly water quality measurements as part of their other tasks, the continuity of data collection was guaranteed. One of the volunteers selected was a local teacher from the Basic Education High School. After being recruited, the volunteers were trained during a one-day field training by the first author. There were seven volunteers in total, recruited for five stations in the Ayeyarwady River and for two stations in the Chindwin River respectively (see Figure 1). The data collection campaign has continuously been running since March 2016.
2.3. Water Quality Parameters
In standard water quality monitoring programs, the following set of indicators are advised (see Table 1) [20,21,22]:
In case of very limited resources, a minimum list of parameters could be as follows [14]:
- Water discharge/level;
- Total suspended solids/turbidity;
- Temperature and pH;
- Electrical conductivity (EC);
- Dissolved oxygen;
- Nitrate, ammonia, and ortho-phosphate; periodically: total N and P.
In this phase of the study the emphasis for the weekly measurements was on the general water quality parameters, such as electrical conductivity, nitrate and nitrite nitrogen, phosphate, pH. Electrical conductivity was selected to be included since it is a useful indicator of total dissolved salt content, which often enters into the river from geogenic origin, from sea water intrusion, irrigation but also because of wastewater effluents, municipal storm water drainage, and industrial effluents [19,26]. Nitrate and nitrite nitrogen and phosphate are important indicators of pollution residues from agricultural land [19,27]. pH was chosen at the same time since it is an essential indicator for the survival of aquatic life [28], especially fish, which is the major fresh water resource of the Ayeyarwady River for the fishing industry. Adding to the general parameters, iron was measured as an indicator for possible heavy metal pollution, since mercury contamination was found in the Chindwin River [29,30]. Adding to this, water transparency was measured in order to assess the presence of suspended particles which are mainly suspended sediments and organic influents. The dissolved oxygen parameter was at present excluded, since it is not a sensitive parameter in the very large Ayeyarwady River, as shown in earlier studies [31].
2.4. Equipment for In Situ Water Quality Measurements and Monthly Lab Measurements
For the annual dry season in situ measurements and monthly lab measurements, which were performed by lab technicians, the following equipment was used (see Table 2). Temperature and pH of the river were measured using the pH meter (Hanna Instruments), for turbidity a Palintest Turbidity Tube 26 were used with a range of 5–500 NTU (Nephelometric Turbidity Unit). Transparency was measured by using a transparency tube with black and white Secchi plate and a range of 0–60 cm. Dissolved oxygen, iron, calcium hardness, ammonia, nitrate, alkalinity, and fluoride were measured by using HI 83,200 Photometer (Hanna Instruments, Woonsocket, RI, USA). Lastly, electrical conductivity was measured using Eureka Manta2 Sub3 (Eureka WaterProbes, Austin, TX, USA) in February 2016 and March 2017, and the GMH3400 EC meter (Greisinger, Regenstauf, Germany) was used during the surveys of 2018 onward.
Additionally, electrical conductivity, pH, dissolved oxygen (%), turbidity, and temperature were measured in situ with the Eureka Manta2 Sub3 multiprobe sensors at station 2 (Mandalay) at six-hourly measurements from the 17 March to the 15 June 2017.
2.5. Water Quality Measurements Using a Mobile Phone Application
In our study, water quality measurements and data storage were performed using mobile phone applications called Caddisfly and Flow (see Supplement Material I). The measurements were executed using standard strip tests, or by using sensors attached to the mobile phone. In our study, we used the strips to measure pH (HACH AquaChek of Range 4–9), nitrate-nitrogen (HACH AquaChek of Range 0–50 mg/L), and iron (HACH AquaChek of Range 0–5 mg/L). For data management and posterior data quality control, a survey form has been designed in the Flow app (Figure 2). In the survey form, the date and location of the water sampling site was automatically included using the mobile phone clock and GPS. To investigate the weather condition at the time of sampling, we added a weather condition question. Furthermore, to check the performance of the volunteers and the automated interpretation of the mobile phone application strips, a photo of each measurement and of the water-sampling site was taken by the smartphone camera and stored in the database. All measurements were carried out offline. All data were uploaded to a server when an Internet connection became available.
2.6. Criteria to Assess the Quality of the Data Collected by the Volunteer
When working with non-technical persons on data collection, the quality of the collected data can be uncertain. Quality assurance is therefore the most critical aspect of citizen science [32]. Clearly, the design and the measurement procedure may affect the quality of the measurement results. However, there is no general agreement on selecting the data quality criteria dimensions [33]. In describing the quality of a data set, there are many possible dimensions [34]. The primary dimensions are accuracy, completeness, consistency, and timeliness [34]. The choice of data quality dimensions may differ from each other according to the nature of the project. Moreover, the definitions of the data quality dimensions cannot be stated universally [35] as these are very location specific and, thus, we had to define the particular data quality dimensions for our own volunteer water quality monitoring network. In “RiverWatch” (a European River Watch network), reliability, accuracy, and consistency were used as data quality dimensions. In the “Stream Study” program of United States Environmental Protection Agency (US EPA), the data quality is measured in five dimensions: accuracy, precision, completeness, representativeness, and comparability. The latter two are more useful when the monitoring is to assess pollution impacts or to compare stream sites. Moreover, often timeliness is included as well. However, in our experimental setup we intended to look into the baseline water quality condition of the river and the performance of the volunteer within the monitoring network. Moreover, as we worked with a fixed-date data collection by local governmental staff, the criterion of timeliness was less relevant in our study and was therefore not included.
In our study, the following data quality dimensions were selected and defined to describe the quality of the volunteers reported data: (1) completeness, (2) accuracy, and (3) consistency.
- Completeness is a measure of the actual collected data compared to the originally expected data in the plan of the monitoring network [36]. In our study we define both completeness of volunteer data collections (how often measurements were done) and completeness of gathered data (quantifying the (mal)functioning of the used equipment).
- Accuracy is the degree of agreement between the volunteer measured result and the true or expected result [36].
- Consistency is the data quality dimension in terms of the practices used in collecting the data. It is critical that the data are collected according to the same procedure every time, so that comparisons can be made with the data collected at different times and places or by different people [35]. In our volunteer network, the volunteers were trained by the same person to follow the same procedure of sampling and measurement and to perform the measurement at the same time in order to reach consistency.
3. Results and Analysis of Water Quality Data Collected by Volunteers
3.1. Overall Description of Results
The weekly water quality results, as measured in situ by participatory monitoring, the annual in situ measurements by DWIR technicians, and the results of the monthly water quality measurements analyzed in the lab, are presented in Supplement Material II. Weekly EC measurements (n = 145) range between 31–600 µS/cm with the exception of 1 sample with very low EC at sampling location 6 (Kalaywa), 4 samples with very low EC at sampling location 1 (Hteegying), and 9 samples with very high EC at sampling location 4 (Magway). The pH ranges between 5.5 and 9 with the exception of one value of pH of 4 at the location 1 and 4.2 at the location 6. The transparency ranges between 1.2 and 53.8 cm visibility corresponding to 5 to 500 NTU. Nitrate nitrogen varies between 0 and 7 mg/L with few exceptions in locations 1, 3 (Chauk), 5 (Pyay), 6, and 7 (Monywa). Iron ranges between 0 to 5 mg/L, equal to the range of the strip. In station 7 (Monywa), the upper limit of 5 mg/L is found regularly. In situ annual dry season measurements of 2016, 2017, and 2018 have EC ranging from 97.3 to 220.6 µS/cm, the transparency ranges from 10 to 39 cm, nitrate nitrogen from 0.1 to 1.6 mg/L, and iron ranges from 0.02 to 1.65 mg/L. Lastly, the monthly samples have EC ranging between 55 and 325 µS/cm, the transparency ranges between 2.3 and 55 cm, nitrate nitrogen between 0 and 10 mg/L, and iron ranges between 0 and 4.4 mg/L.
3.2. Analysis of Water Quality Network
3.2.1. Completeness
a) Volunteers’ In Situ Data
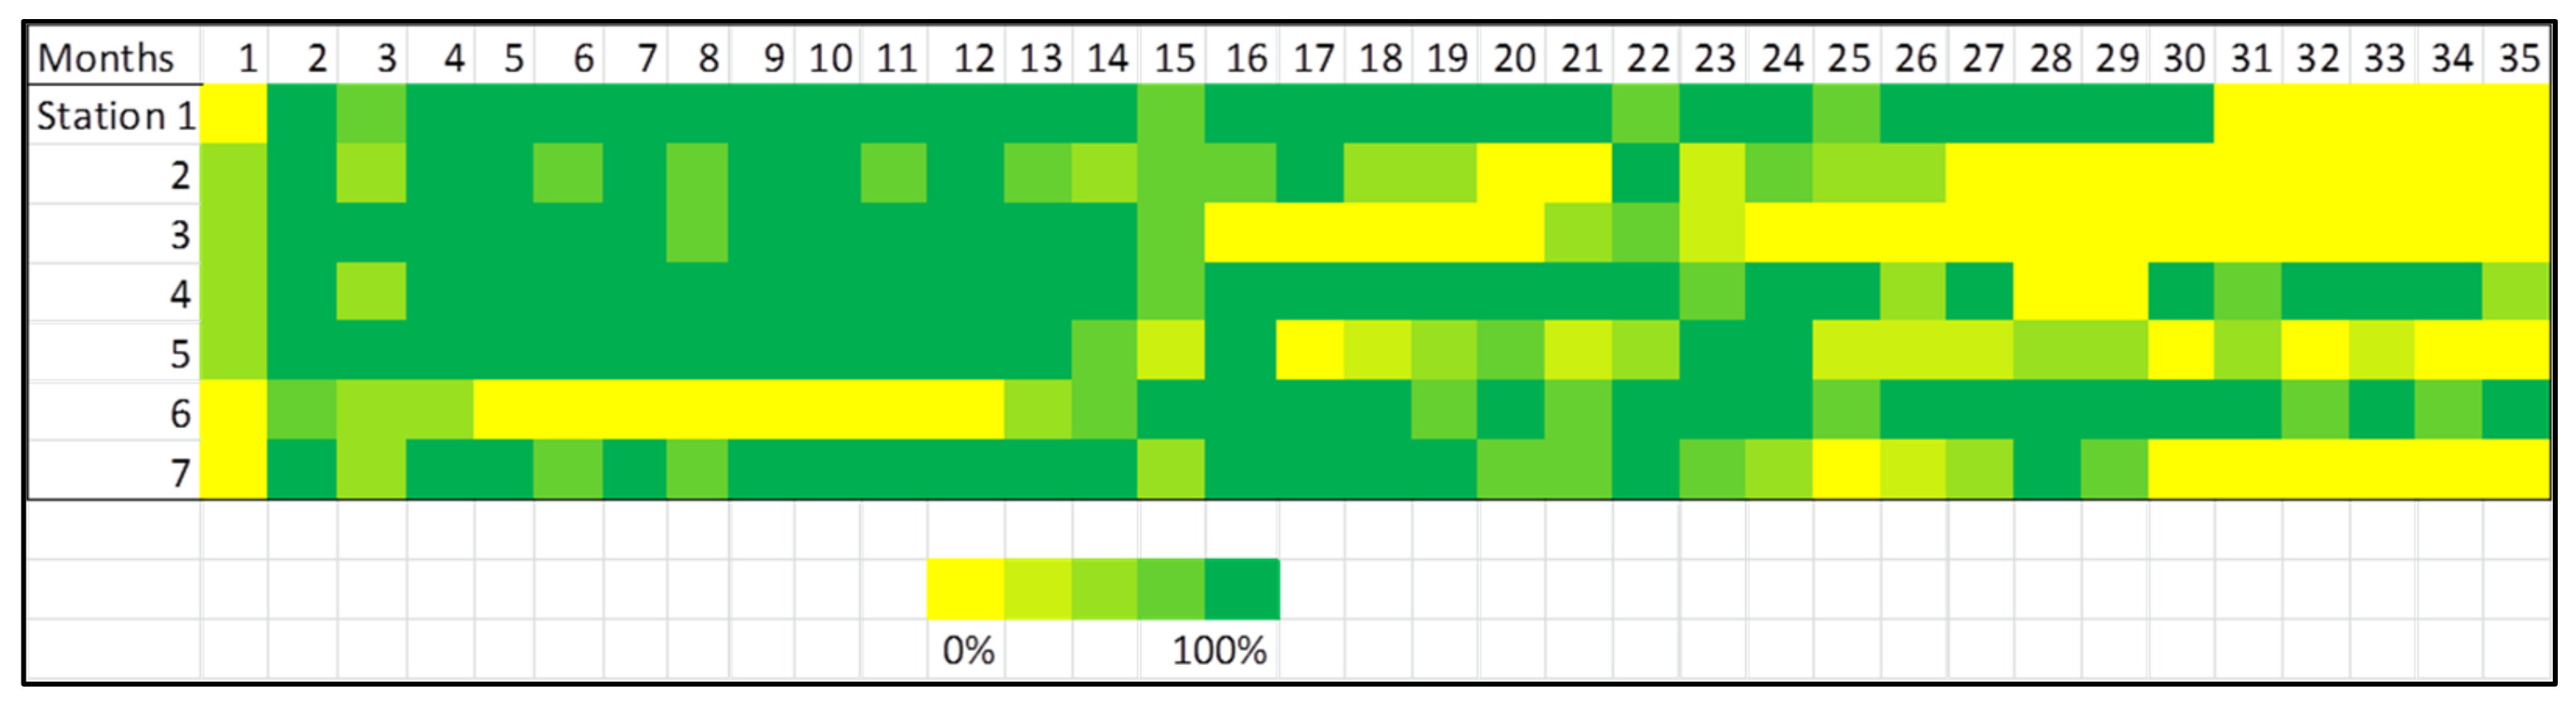
In three years of data collection, in our volunteer network, three stations (1, 4, and 6) out of seven had a completeness of more than 70% (see Figure 3). Three stations (2, 5, and 7) had completeness of between 51 and 66% and one station (3) shows 48%. But 17% of all volunteers’ data measured with strips, i.e., excluding EC and transparency, were discarded since expired strips were used without notice for about 6 months. This was discovered only after in-depth analysis of various erroneous and questionable results.
b) Laboratory Monthly Data and In Situ Sensors’ Data
The completeness of the laboratory analysis of the monthly samples for all seven stations was more than 80%. On the contrary, the high-end in situ sensors installed at station 2 (Mandalay) only returned 3 months of 6-hourly measurements because of recurrent technical problems with the battery energy source which could not be solved locally and finally the disappearance of the sensor during the rainy season. Such technical and logistical problems are not uncommon in countries like Myanmar.
3.2.2. Accuracy
Quality Control of Automatic App Reading of Field Data
Before any accuracy analysis could be done using the indicator strip results that were automatically read by the Akvo Caddisfly app, we visually checked the results. We randomly selected 37 weeks of measurements of pH, nitrate nitrogen, and iron and compared the results obtained by the app (indicator strip reading) with a visual reading of the photographed strip by the first author that was simultaneously stored in the database. As described in the previous section, the photos were uploaded specifically for such quality control.
Indicator strips were read using a reference color chart on the storage cylinder and contain typically 5 to 7 classes in linear (Iron and pH) or log-scale values (nitrate nitrogen). The indicator strips have a known error margin of 25–35% (see Supplement I) which made direct correlation of the results not so meaningful. Therefore, we plotted the app reading of the strip and the corresponding eye reading in a scatterplot where we also indicated the 1:1 line and upper and lower boundaries. The latter two are the halfway values coming from the reference reading strip. As an example, nitrate nitrogen has the reference color of 0, 1, 2, 5, 10, 20, and 50 mg/L which corresponds to “classes” 0–0.5, 0.5–1.5, 1.5–3.5, 3.5–7.5, 7.5–15, 15–35, and 35–50 mg/L. This means that the value of 10 mg/L has a lower range of 7.5 and upper range of 15 mg/L. We then evaluated whether eye and app reading fall within the same range.
The analysis showed that roughly half of the readings plot in similar range; 46% of the reading of pH, 54% of nitrate nitrogen, and 51% of iron. Further analysis shows that respectively 49%, 32%, 38% and 30% of the readings are in the directly adjacent class. Furthermore, although the results have clear scatter, the plots in Figure 4 do not indicate systematic errors albeit the measurement ranges are quite small compared to the strip measurement range except pH.
Accuracy of Volunteers’ Results Compared to In Situ Measurements by Lab Technicians
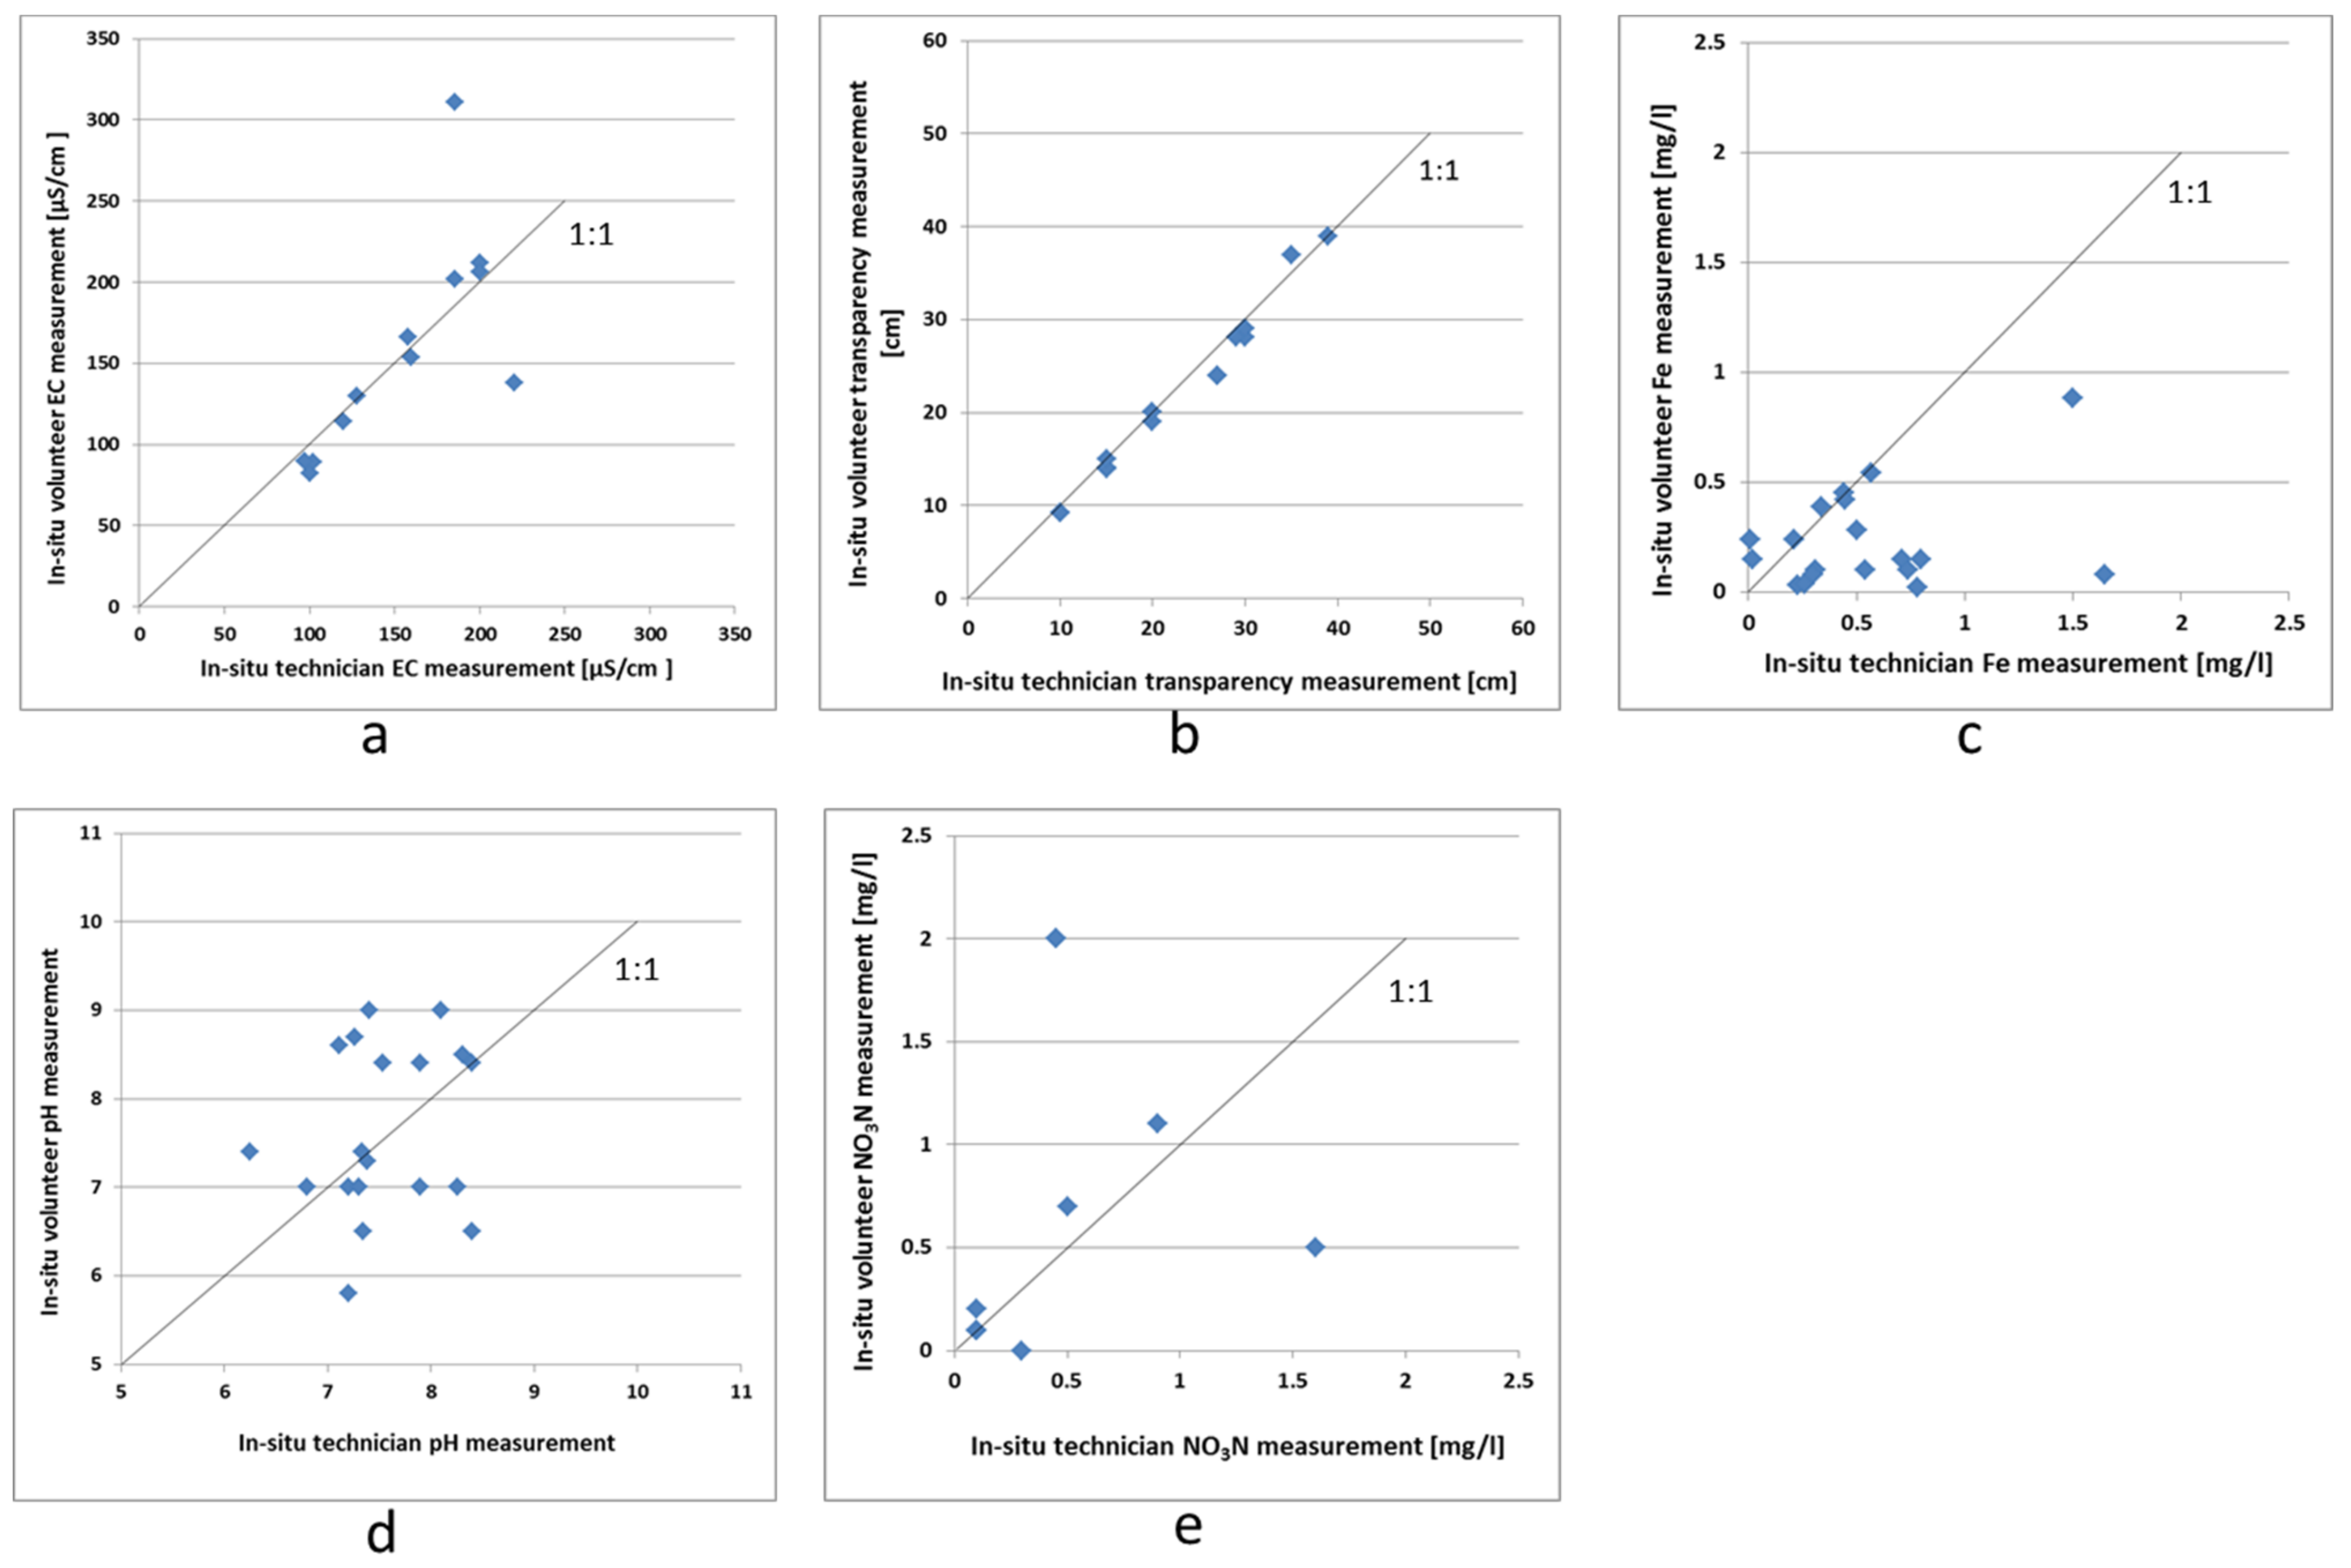
The annual water quality survey of DWIR overlapped with the weekly water quality measurements of the volunteers. This resulted in a maximum of 19 overlapping data points for five water quality variables which were a good measure of accuracy of the data collected by the volunteers (Figure 5).
The sensor-based EC measurements have a very good similarity (Figure 5a). Also, the visual measurements of water transparency using the transparency tubes show similar results (Figure 5b). However, the indicator strip measurements by volunteers (iron, pH, and nitrate nitrogen) deviate from the photometer measurements (iron, nitrate nitrogen) and pH-sensor measurements used by the lab technician during the annual in situ survey. Iron measurements using a photometer systematically give higher values when compared to the indicator strips. This could be due to the use of unfiltered river water for the photometer measurements during the annual low-flow survey. Nitrate-nitrogen values are all in the lower ranges, with only a limited number of values available for comparison, since only for a few stations nitrate-nitrogen has been measured during the seasonal survey.
Accuracy of EC and Transparency Measurement of Monthly Grab Samples
Taking a grab water sample (“volunteer sample”) and sending it to a lab is a simple and straightforward way of involving volunteers in water quality measurements. We tested the quality (accuracy) of these samples compared to the annual in situ measurements and by comparing the monthly lab results with the corresponding in situ measurements by volunteers performed while taking the grab sample.
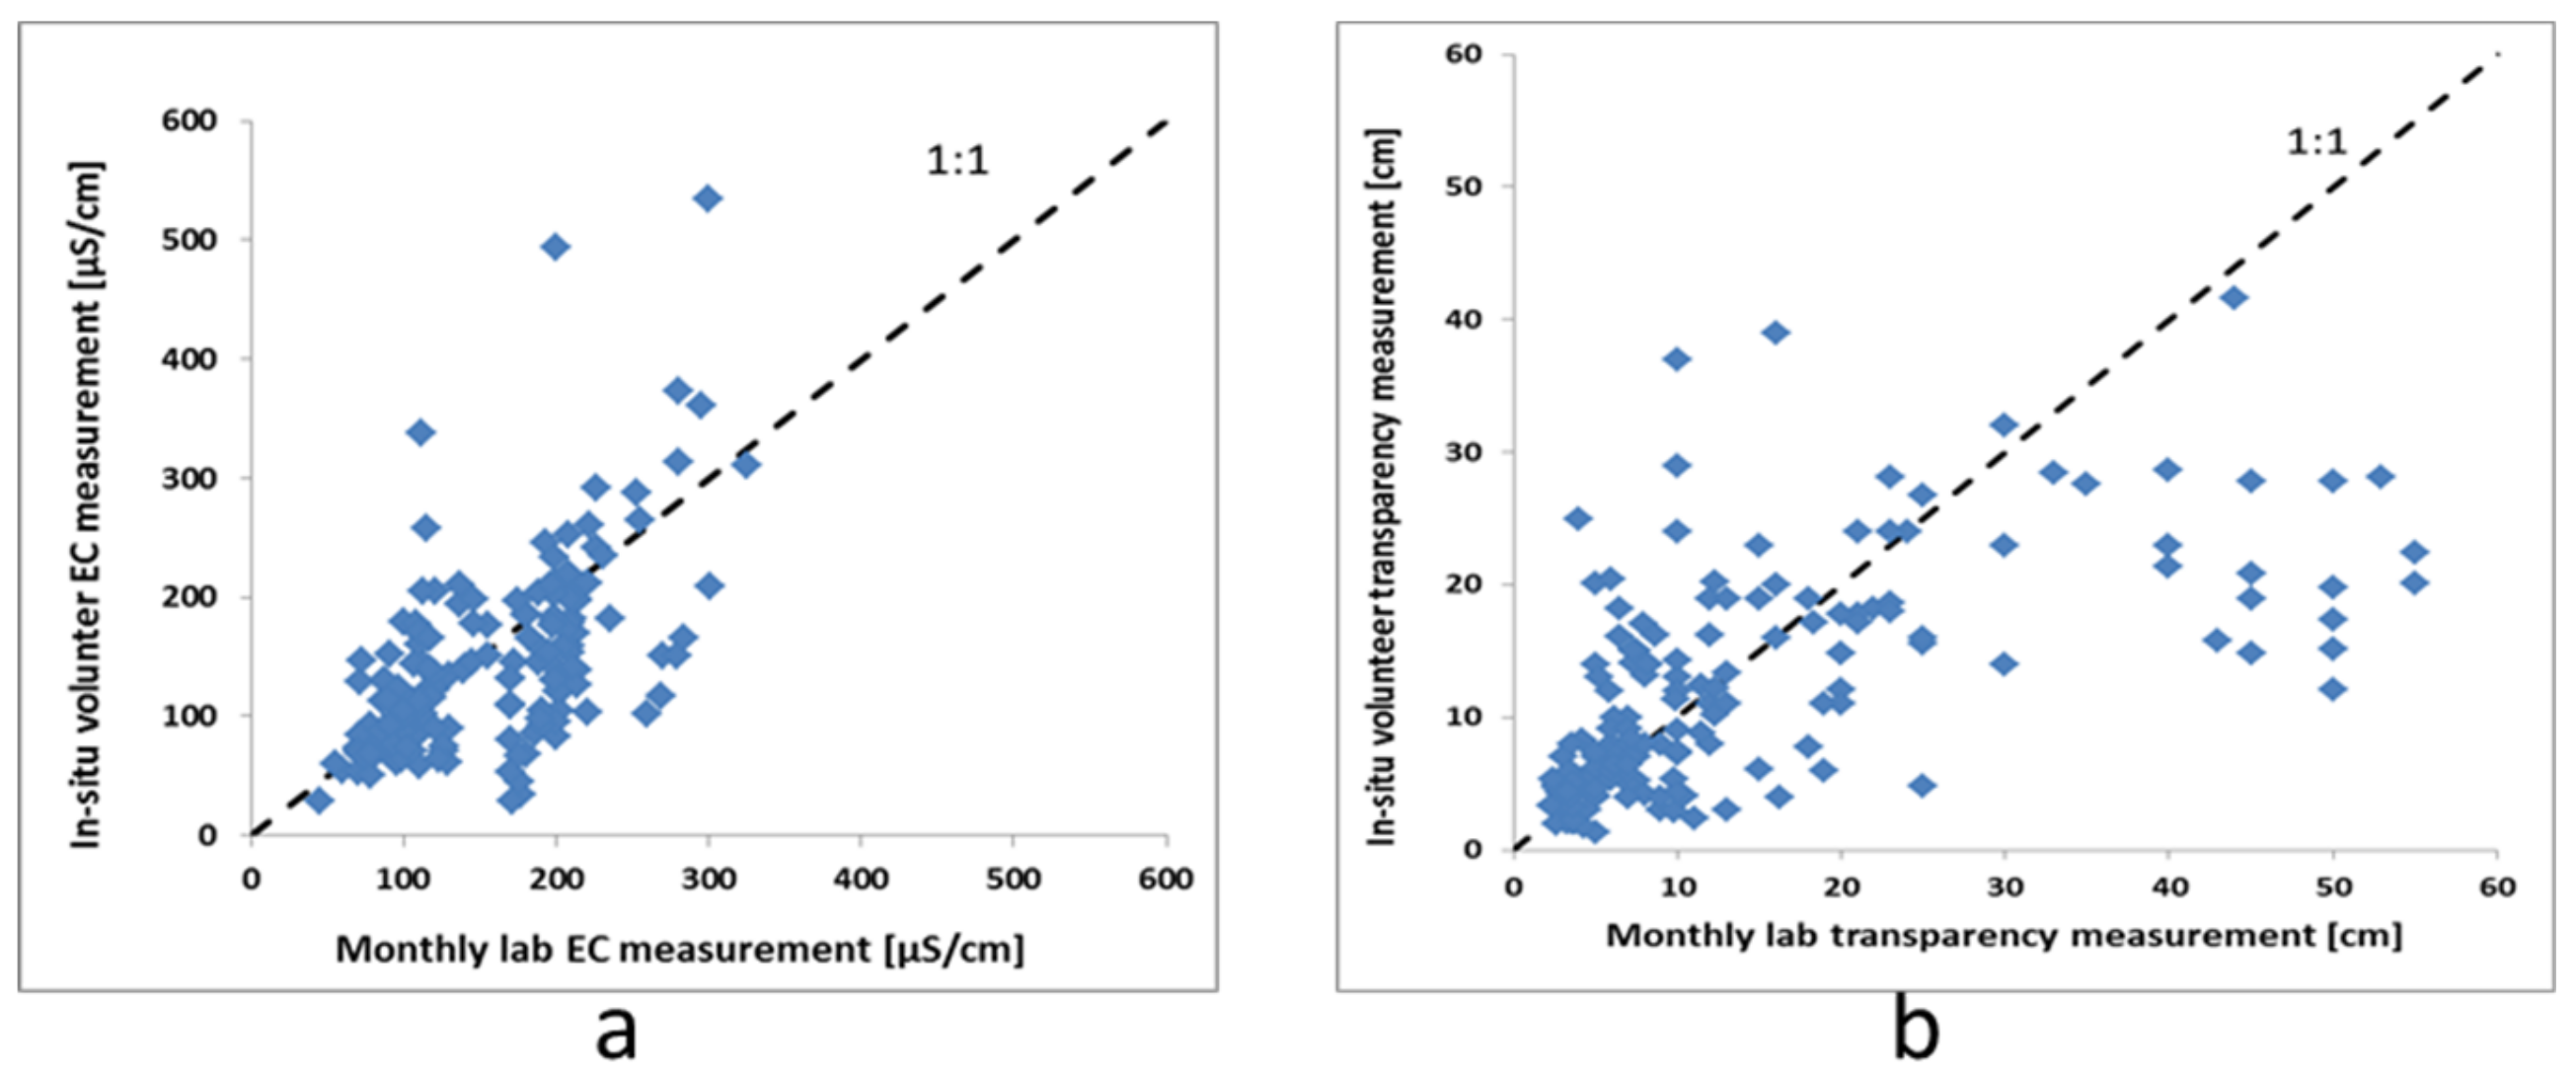
The EC and transparency results of both annual in situ measurements by technician and the analysis of the monthly grab sample taken by the volunteer and analyzed by a technician in the lab are compared in Figure 6. The EC measurements show good agreement but with some scatter. The transparency of the volunteer sample tends to be lower than those of the in situ measurements. The transparency reading is a visual observation which to some extent depends on the observer and the local light conditions. These are not identical as lab measurements were mostly done indoors and volunteers observed it in the field. However, the exact reason for differences in transparency measurements remains unknown.
Plotting monthly laboratory analyses on the volunteer grab sample against the corresponding in situ measurements by volunteers show significant scatter (Figure 7). In the EC-plot both measurements devices have a positive correlation close to the 1:1 line, however, the spread is large.
The results of the transparency measurements show a very large scatter, whereas identical measurement devices (the transparency tube) were used. The more striking as the results of volunteers versus the annual in situ measurements are excellent (Figure 5).
3.2.3. Consistency
In our study, the consistency of collecting the data within the group of volunteers was safeguarded by following a measurement protocol and consistent use of materials. In the 3 years of data collection no changes were made to the sampling and measurement protocol. But volunteers of stations 2 and 6 were replaced by new volunteers because the volunteers changed jobs. For the lab measurements, the consistency was less. The equipment used has not been changed except for the laboratory EC meter. However, in total three different lab technicians have performed the measurements.
3.3. Seasonal Water Quality Trends
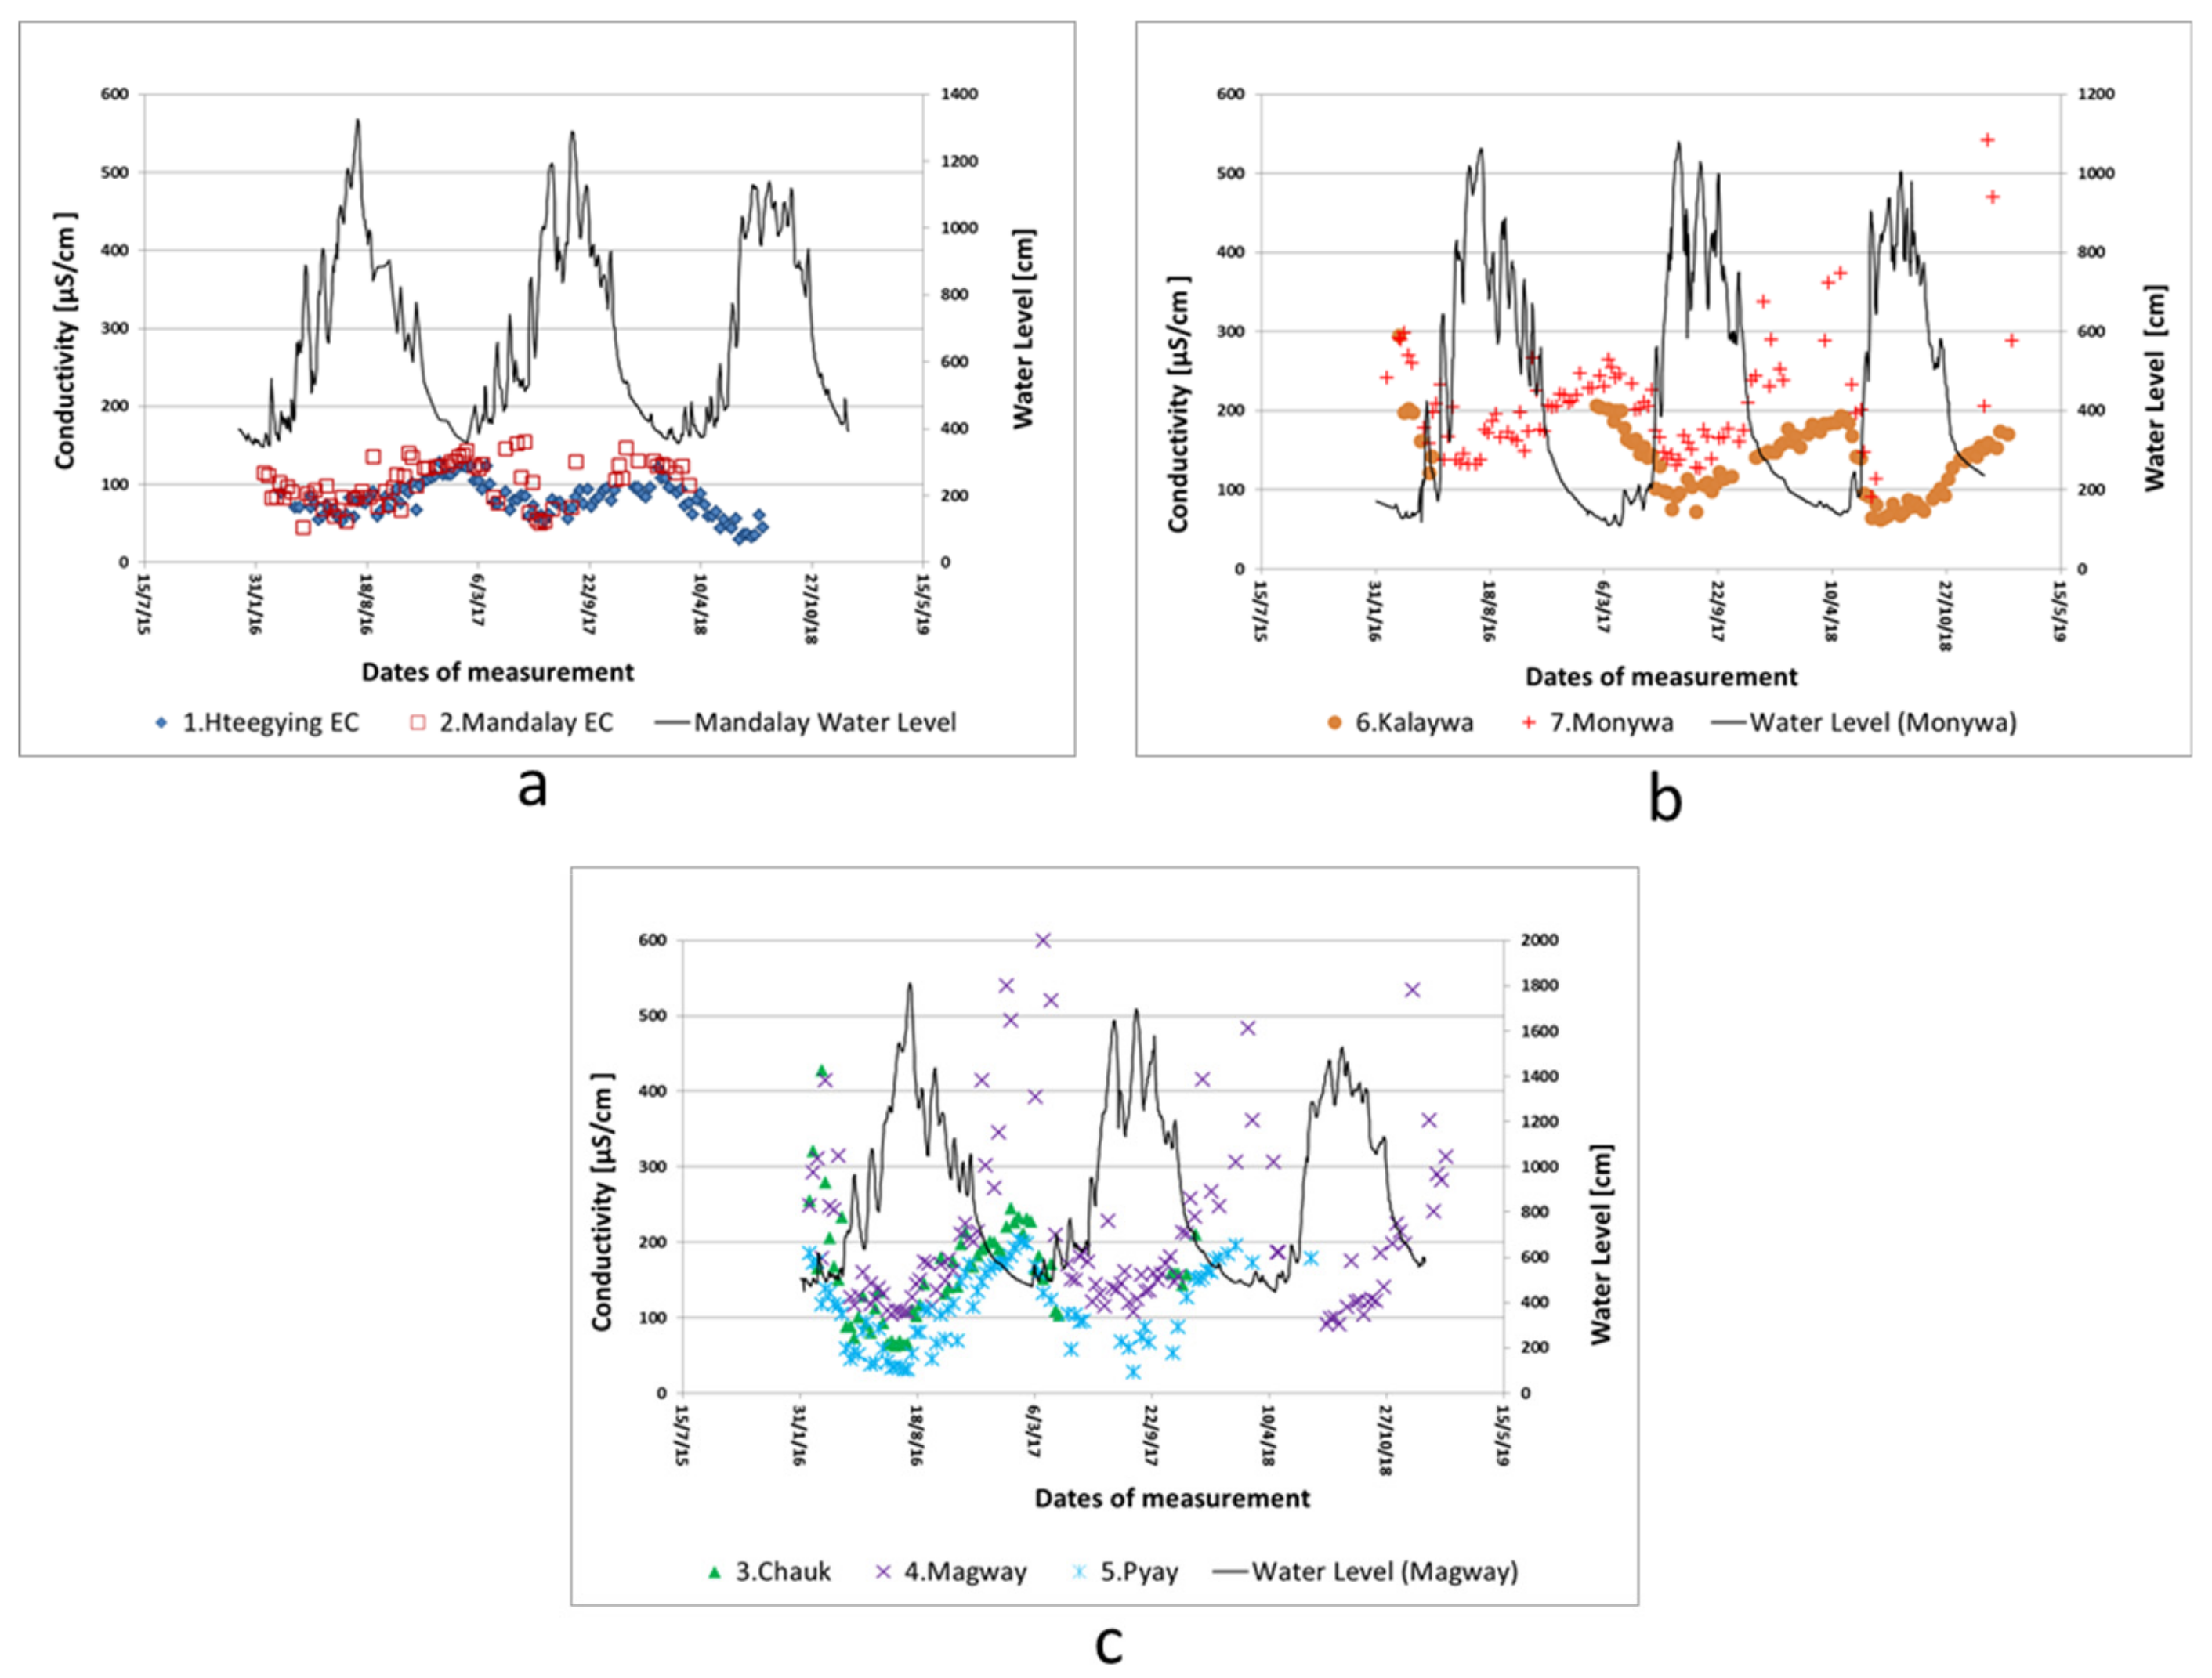
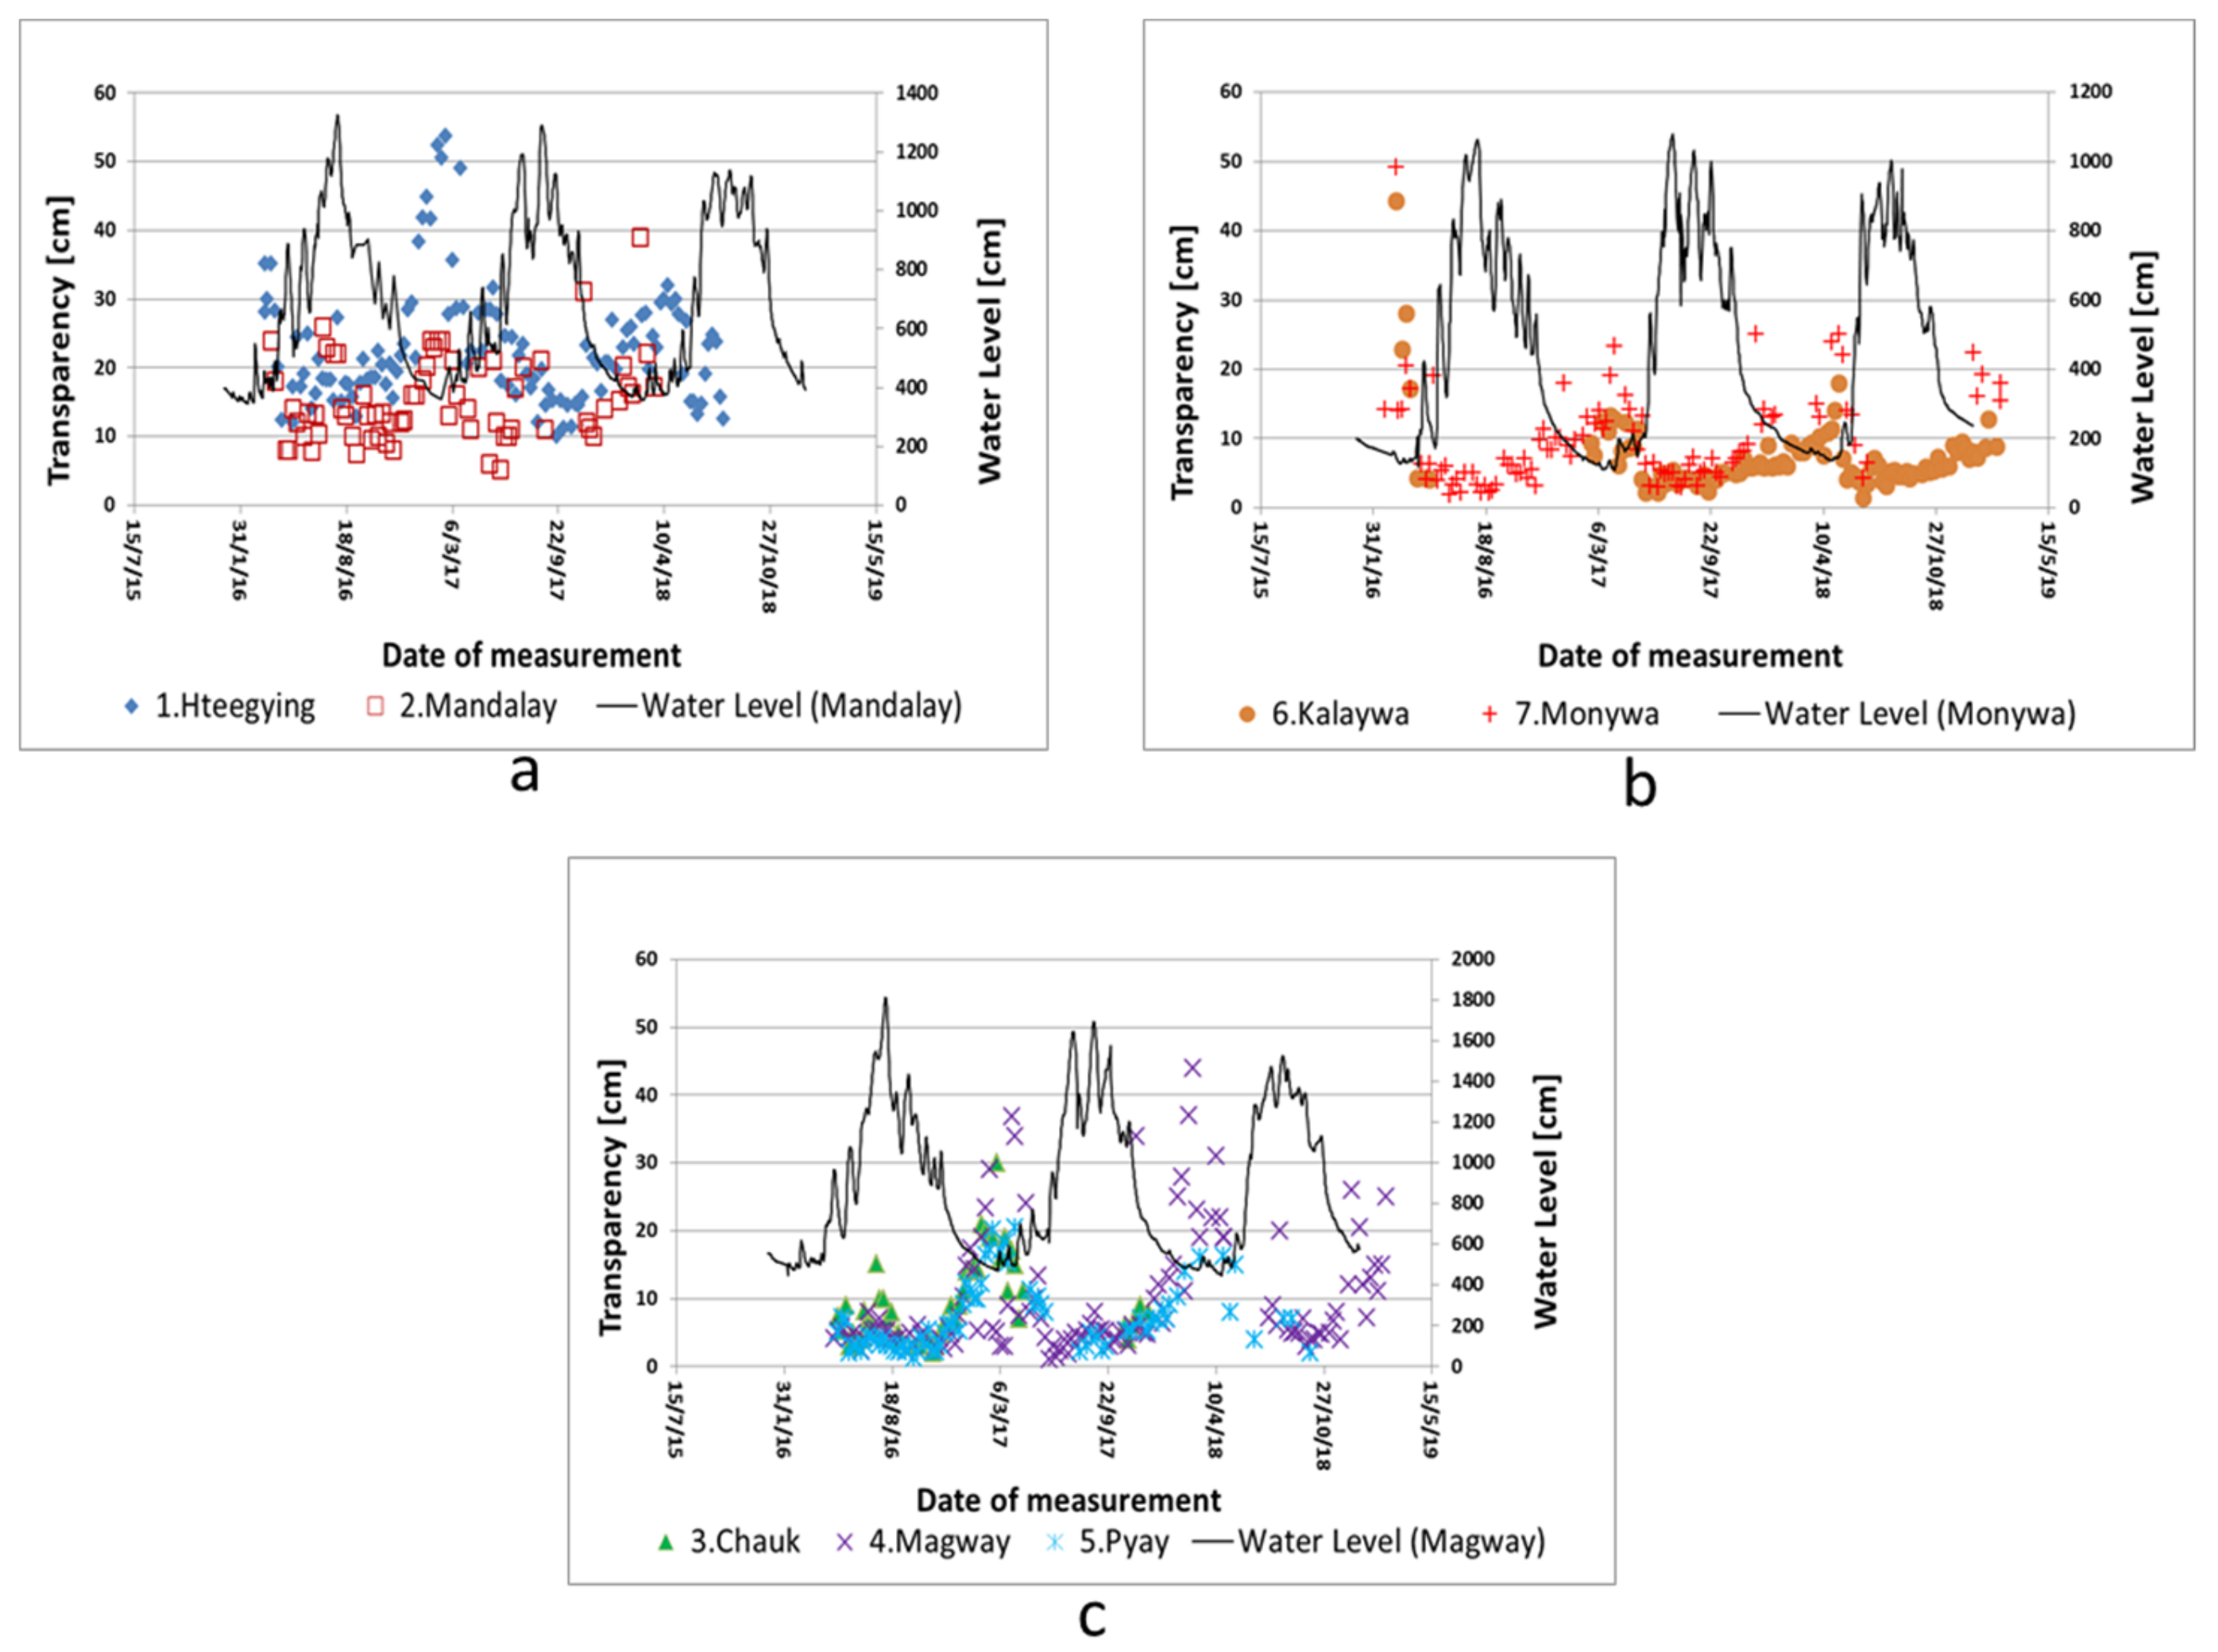
An in-depth analysis of the origin of the water quality is out of scope of this paper, however, analyzing the water quality trends is presented here to show the potential of detecting water quality changes using our setup. We compared all measurement with the seasonal water level changes as measured by three river gauges: Mandalay (2), Magway (4), and Monywa (7) (see Figure 1). Figure 8 shows the electrical conductivity in (µS/cm) and corresponding water levels from 2015 till 2018. There is a clear inversed relation visible of EC and water level. All stations showed minimum EC values during the wet season and highest at the end of the low season. Figure 9 shows the transparency results for the Ayeyarwady and Chindwin from 2015 till 2018. Also here, an inversed relationship with water level is easily distinguishable.
4. Discussion on Water Quality Data Collected by Volunteers
This research aims to assess the reliability and usefulness of the water quality data of the Ayeyarwady and Chindwin Rivers measured in situ using low-cost and simple measurement techniques. Our results show that the in situ measurements by volunteers were accurate, especially for the sensor-based EC measurement and the transparency measurement using the manual transparency tube. The indicator strip-based measurements have a larger range of uncertainty so significant variability in order of the range of the used indicator strip is required before change can be detected. The quality of the data collected by the volunteers is comparable to that of the experienced lab technicians doing the in situ measurements during the annual water quality survey (see Section 3.2), whereas the temporal frequency of the in situ collected data by volunteers was weekly against only one measurement per year for the in situ measurements performed by the lab technicians. Furthermore, the volunteers proved to be very reliable. Data were collected at the agreed time and day in a consistent and accurate manner. This is in line with results found in other studies [37,38]. The involvement of non-expert can have barriers for the quality of the data and the continuity of their involvement [12]. Our data show that working with an intuitive mobile phone application and some basic training resulted in very reliable data collection. Working with non-experts who have a direct link to the topic (in our case working for DWIR and a local school teacher) safeguards involvement and continuity. It is encouraging that in Myanmar the population has a strong link to their water resources and willingness to participate in water and environmental monitoring [12,39].
The recruitment of volunteers was not an easy task, especially in a developing country like Myanmar, as public awareness on the importance of fresh water quality needs to be raised. Van Hamel (2018) found that in Myanmar, people, in particular the young, are open toward joining a participatory scientific project [39]. In our case, however, we worked with volunteers who had a job at the local office of the department of DWIR and one local head of school. A volunteer should preferably live near the river stretch to reduce the logistics and encourage long-term participation. Volunteers need to receive a sound training in the local language, have an easy way to contact the project coordination for support, and have a clear understanding of using the application in order to submit the required measurement results. In our experience, the leading scientist and the citizens should have a strong working relationship, excellent interaction and communication. It has been found very important to allow volunteers to contact the lead scientists with the mode they prefer (e.g., phone, social media, e-mail) and prompt, clear help is very important to keep the motivation high and the quality of the data collection high.
For the 3 years of water quality measurements, both EC and transparency measurements were consistent over time and trends could easily be detected while rudimentary equipment was used and the measurements were performed by seven non-specialists in the very large river system of the Ayeyarwady. It is encouraging to see that the modest temporal variation is easily detectable. Transparency dynamics were inversely related to water level showing that the suspended load in the river increases with increasing discharge, as was to be expected as, generally, in the rainy season, the sediment transport increases. Moreover, the suspended sediment in the Chindwin River (Figure 9b, stations Kalaywa and Monywa) was much higher than in upstream Ayeyarwady (Figure 9a) and after the confluence values were logically in-between Chindwin and northern Ayeyarwady as shown previously [40] where remote sensing was used to assess the suspended sediment load in the Ayeyarwady and Chindwin. Our results can be of great help in improving remote sensing products for monitoring suspended sediment. With 3 years of weekly turbidity data a more reliable local calibration curve can be established [40]. This will greatly improve the usefulness.
The time series of indicator strip measurements of pH, nitrate nitrogen, and iron do not show a clear relation with water level (see Supplement Material III). In most stations we can see rising nitrate concentrations with the onset of the monsoon and lower nitrate levels in the dry season (except for Chindwin). It is obvious that the uncertainty in the indicator strips is larger than the observed variations in water quality parameters and thus do not allow a more in-depth interpretation of e.g., the temporal and spatial variability. If higher accuracy of these parameters is required, advanced lab analysis or colorimeter measurements are required [20]. To have colorimeter measurements covering the entire Ayeyarwady and Chindwin Rivers, recent availability of practical and affordable colorimeter analysis tools (like color reference disks) or single parameter photometers could be of value. However, the use of reagents, and correct storage of reagents, remains both an economic and practical challenge when working in the Myanmar [18,41].
Based on our results of EC, transparency, nitrate, and iron, one could conclude the Ayeyarwady to be relatively clean and a healthy river as also was indicated in a global survey [19]. However, this does not include pharmaceuticals, fertilizers, microorganisms, oil, and heavy metals to name a few. Some pilot studies mentioned pollution in some particular location; metallic constituents (e.g., Al, Cd, Cr, Cu, Pb) and toxic metal such as Tl, V, Sb, Li, etc., in suspended solid and AOX, POX, and bacteriological organisms of coliform, e-coli and salmonella in the Ayeyarwady and Chindwin [17,31]. Also, the state of the basin assessment [18] reported recently that microbial contamination, heavy metals such as copper, zinc, manganese, nickel, mercury, and uranium have been detected. These water quality parameters cannot be assessed using the simple methods we applied in our study with volunteers. For a complete analysis of the health of the Ayeyarwady River system these parameters should be included [42,43].
In many citizen science projects for water quality, the number of water quality indicators measured is limited or only grab samples are taken [38]. For example, Zheng et al. [6] collected four water quality indicators, i.e., color, smell, turbidity, and floated material which are all physical parameters. MPCA [36] measured only the transparency with volunteers. In many projects measuring water quality using citizen science the volunteers collect water samples which are then analyzed in high-end laboratories [37]. This situation is not possible in Myanmar or many other countries [19] because of the absence of (the resources for) a water quality analysis infrastructure. In our study, we did send monthly grab samples following the common practice that the water samples were sent via public transportation to the laboratory, without preservation and specific storage. Our results in Myanmar confirmed that even for the quite basic measurements, like EC and transparency, the field-based measurements performed by non-experts outperform the laboratory measurements on water samples send from the field to the lab.
Contrary to the successful use of simple sensors, the high-end automatic water quality sensors were not successful in our experiment. Technical problems could often not be solved locally, leading to data loss and longer periods of non-functioning. Also, the (protected) installation of such sensors requires significant investment which is often not available. The total investment of high-end, sensor-based water quality monitoring is too high and maintenance costs are often not budgeted. As shown for low-costs rain gauges in a case study in Nepal [9], modern, low-cost sensors combined with a participatory approach could be a very attractive alternative as it showed to be economic and reliable for water quality data collection.
5. Summary and Conclusions
In this paper, we presented a novel, low-cost water quality mobile phone measurement technique and reported the weekly-collected data of three years of the Ayeyarwady River system by volunteers at seven locations and compared these results with in situ measurements of lab technicians and analysis of grab samples shipped to a lab. We showed that the results were of similar high quality for the sensor-based measurements and transparency. The automatic reading of the water quality indicator strips also showed to work equally well as eye readings. However, the lower accuracy (higher uncertainty range) of the strips made them less useful in the Ayeyarwady with its relatively small water quality variations.
We showed that participatory water quality monitoring in Myanmar can be a serious alternative for a more classical water sampling and lab analysis-based monitoring network, particularly as it results in much higher spatial and temporal resolution of water quality information against very modest investment and running costs. Especially in developing countries where the availability of data and the financial resources are limited, such approach allows to expand the monitoring network. For the Ayeyarwady and Chindwin monitoring setup, it is recommended to test by extending the data collection using basic colorimeter or simple (single parameter) photometer. Second, as the current results are quite encouraging, it is advised to try to expand the monitoring to smaller tributaries and streams. The rapid developments of affordable robust water quality sensors can easily be included in our water quality monitoring program mobile phone app and help Myanmar build up the necessary data collection and monitoring of their important natural waters. This will be a significant help solving the invisible water crisis for Myanmar and many other countries.
Supplementary Materials
The following are available online at https://www.mdpi.com/2073-4441/11/10/1984/s1, Figure S1: Colour calibration card and Caddisfly mobile app, Figure S2: pH Validation, Figure S3: Nitrate Nitrogen Validation, Figure S4: Total Iron Validation, Figure S5: Phosphate Validation, Figure S6: Electrical Conductivity Validation, Figure S7. Measurement of Electrical Conductivity by Akvo Caddisfly application, Figure S8: Comparison of iron results from both eye and mobile phone reading to lab test results, Figure S9: Comparison of observed pH results to lab reference results, Figure S10: Comparison of observed phosphate results to lab test results, Figure S11: Comparison of observed nitrate nitrogen results to lab test results, Table S4. Correlation and average error of Phosphate, Figure S12: Comparison of Electrical conductivity measurement (app vs lab), Figure S13: Light Sensitivity analysis, Figure S14, Trends of nitrate nitrogen a) Upper Ayeyarwady, b) Chindwin and c) Ayeyarwady (after confluence with Chindwin), Figure S15: Trends of pH a) Upper Ayeyawardy, b) Chindwin and c) Ayeyarwady (after confluence with Chindwin), Figure S16: Trends of iron a) Upper Ayeyarwady, b) Chindwin and c) Ayeyarwady (after confluence with Chindwin), Table S1: Dependency of pH reading on sunlight, Table S2: Dependency of Nitrate Nitrogen reading on sunlight, Table S3: Correlation and average error of Total Iron, Table S4: Correlation and average error of Phosphate.
Author Contributions
Conceptualization, T.T.N.W., T.B., N.v.d.G.; methodology, T.T.N.W., T.B., N.v.d.G. formal analysis, T.T.N.W., T.B.; investigation, T.T.N.W.; resources, T.B., N.v.d.G.; writing—original draft preparation, T.T.N.W.; writing—review and editing, T.T.N.W., T.B., N.v.d.G.; visualization, T.T.N.W.; supervision, T.B., N.v.d.G.; project administration, T.B.; funding acquisition, N.v.d.G.
Funding
This research was funded by Shell International Exploration and Production B.V: Grant number UI43981. Scholarship trust related to integrated water resources management in Myanmar.
Acknowledgments
We are grateful for the constructive feedback of the three anonymous reviewers and the academic editor of MDPI which helped improving the paper considerably.
Conflicts of Interest
The authors declare no conflict of interest.
References
- Cooper, C.B.; Dickinson, J.; Phillips, T.; Bonney, R. Citizen Science as a Tool for Conservation in Residential Ecosystems. Ecol. Soc. 2007, 12, 11. [Google Scholar] [CrossRef]
- Tsai, C.C.; Lee, G.; Raab, F.; Norman, G.J.; Sohn, T.; Griswold, W.G.; Patrick, K. Usability and Feasibility of PmEB: A Mobile Phone Application for Monitoring Real Time Caloric Balance. Mob. Netw. Appl. 2007, 12, 173–184. [Google Scholar] [CrossRef]
- Minkman, E.; Rutten, M.M.; Van Der Sanden, M.C.A. Acceptance of Mobile Technology for Citizen Science in Water Resource Management. J. Irrig. Drain. Eng. 2016. [Google Scholar] [CrossRef]
- Davids, J.C.; Rutten, M.M.; Pandey, A.; Devkota, N.; Van Oyen, W.D.; Prajapati, R.; van de Giesen, N. Citizen Science Flow: An Assessment of Simple Streamflow Measurement Methods. Hydrol. Earth Syst. Sci. 2019, 23, 1045–1065. [Google Scholar] [CrossRef]
- Storer, J.J.; Chao, J.T.; Torelli, A.T.; Ostrowski, A.D. KnoWare: A System for Citizen-Based Environmental Monitoring. Inf. Sci. Int. J. Emerg. Transdiscipl. 2016, 19, 125–139. [Google Scholar]
- Zheng, H.; Yang, H.; Long, D.; Jing, H. Monitoring Surface Water Quality Using Social Media in the Context of Citizen Science. Hydrol. Earth Syst. Sci. 2017, 21, 949–961. [Google Scholar] [CrossRef]
- Nicolas, M.; Stevens, M.; Niessen, M.E.; Steels, L. Noise Tube: Measuring and Mapping Noise Pollution with Mobile Phones. In Information Technologies in Environmental Engineering; Athanasiadis, I.N., Rizzoli, A.E., Mitkas, P.A., Gomez, J.M., Eds.; Springer: Berlin/Heidelberg, Germany, 2009; pp. 215–228. [Google Scholar]
- Kotovirta, V.; Toivanen, T.; Tergujeff, R.; Hame, T.; Molinier, M. Citizen Science for Earth Observation: Applications in Environmental Monitoring and Disaster Response. Int. Arch. Photogramm. Remote Sens. Spat. Inf. Sci. 2015, 40, 1221. [Google Scholar] [CrossRef]
- Davids, J.C.; Devkota, N.; Pandey, A.; Prajapati, R.; Ertis, B.A.; Rutten, M.M.; Lyon, S.W.; Bogaard, T.A.; van de Giesen, N. Soda Bottle Science: Citizen Science Monsoon Precipitation Monitoring in Nepal. Front. Earth Sci. 2019. [Google Scholar] [CrossRef]
- Jonoski, A.; Almoradie, A.; Khan, K.; Popescu, I.; Andel, S.J. Google Android Mobile Phone Applications for Water Quality Information Management. J. Hydroinform. 2013, 15, 1137–1149. [Google Scholar] [CrossRef]
- Tauro, F.; Selker, J.; van de Giesen, N.; Abrate, T.; Uijlenhoet, R.; Porfiri, M.; Manfreda, S.; Caylor, K.; Moramarco, T.; Beneveniste, J.; et al. Measurements and Observations in the XXI Century (MOXXI): Innovation and multi-disciplinarity to sense the hydrological cycle. Hydrol. Sci. J. 2017, 63, 169–196. [Google Scholar] [CrossRef]
- Taft, L.; Evers, M. A Review of current and possible future human-water dynamics in Myanmar’s river basins. Hydrol. Earth Syst. Sci. 2016, 20, 4913–4928. [Google Scholar] [CrossRef]
- Grill, G.; Lehner, B.; Thieme, M.; Geenen, B.; Tickner, D.; Antonelli, F.; Babu, S.; Borrelli, P.; Cheng, L.; Crochetiere, H.; et al. Mapping the world’s free-flowing rivers. Nature 2019, 569, 215–221. [Google Scholar] [CrossRef] [PubMed]
- Van der Velden, J. Understanding River Dynamics of the Ayeyarwady River, Myanmar. Master’s Thesis, Faculty of Geosciences, Utrecht University, Utrecht, The Netherlands, 2015. [Google Scholar]
- Drury, L. Hydrogeology of the Dry Zone—Central Myanmar; Australian Water Partnership: Canberra, Australia, 2017. [Google Scholar]
- Hedley, P.J.; Bird, M.I.; Robinson, R.A.J. Evolution of the Irrawaddy delta region since 1850. Geogr. J. 2010, 176, 138–149. [Google Scholar] [CrossRef]
- Piman, T.; Krittasudthacheewa, C.; Apirumanekul, C.; Vasconcelos, V.; Bouckaert, F.; Maung, W.; Aung, M.T.; Ohnmar Htwe, K. Impacts of Changing Landscapes on Water Quality in Chindwin River. In Proceedings of the 3rd International Conference on the Status and Future of the World’s Large Rivers, New Delhi, India, 18–21 April 2017. [Google Scholar]
- SOBA. Ayeyarwady State of the Basin Assessment: Water Pollution Survey. Available online: https://airbm.org/downloads/SOBA%201.3_water_pollution_2017_F.pdf (accessed on 26 August 2019).
- Damania, R.; Desbureaux, S.; Rodella, A.-S.; Russ, J.; Zaveri, E. Quality Unknown, the Invisible Water Crisis; World Bank: Washington, DC, USA, 2019. [Google Scholar]
- Bartram, J.; Balance, R. Water Quality Monitoring a Practical Guide to the Design and Implementation of Freshwater Quality Studies and Monitoring Programmes; E & FN Spon. United Nations Environment Programme, and World Health Organization: London, UK; New York, NY, USA, 1996. [Google Scholar]
- World Meteorological Organization (WMO). Planning of Water Quality Monitoring Systems. In Technical Report Series No.3; WHO: Geneva, Switzerland, 2013. [Google Scholar]
- Chapman, D.V. Water Quality Assessments: A Guide to the Use of Biota, Sediments, and Water in Environmental Monitoring; UNESCO, World Health Organization, and United Nations Environment Programme. E & FN Spon.: London, UK; New York, NY, USA, 1996. [Google Scholar]
- Clary, B.B. Volunteer Management in Community Currency Systems. In Challenges in Volunteer Management; Liao-Troth, M., Ed.; Information Age Publishing, Inc.: Charlotte, NC, USA, 2008; pp. 91–120. [Google Scholar]
- Deutsch, W.G.; Ruiz-Cordova, S.S. Trends, Challenges, and Responses of a 20-Year, Volunteer Water Monitoring Program in Alabama. Ecol. Soc. 2015, 20. [Google Scholar] [CrossRef]
- Wales Council for Voluntary Action (WCVA). Available online: https://www.wcva.org.uk/ (accessed on 26 August 2019).
- Morrison, G.; Fatoki, O.S.; Persson, L.; Ekberg, A. Assessment of the Impact of Point Source Pollusion from the Keiskammahoek Sewage Treatment Plant on the Keiskamma river pH, Electrical Conductivity, Oxygen-Demanding Substance (COD) and Nutrients. Water SA 2001, 27, 475–480. [Google Scholar] [CrossRef]
- Carvalho, F.P.; Villeneuve, J.P.; Cattini, C.; Tolosa, I.; Thuan, D.D.; Nhan, D.D. Agrochemical and Polychlorobyphenyl (PCB) Residues in the Mekong River Delta, Vietnam. Mar. Pollut. Bull. 2008, 56, 1476–1485. [Google Scholar] [CrossRef] [PubMed]
- Cailfornia Waterboards. Technical memorandum. pH Requirements of Freshwater Aquatic Life. 2004. Available online: https://www.waterboards.ca.gov/centralvalley/water_issues/basin_plans/ph_turbidity/ph_turbidity_04phreq.pdf (accessed on 22 September 2019).
- Ekstrom, S.M.; Regnell, O.; Reader, H.E.; Nilsson, P.A.; Lofgren, S.; Kritzberg, E.S. Increasing Concentrations of Iron in Surface Waters as a Consequence of Reducing Conditions in the Catchment Area. J. Geophys. Res. Biogeosci. 2016, 121, 479–493. [Google Scholar] [CrossRef]
- Stockholm Environment Institute (SEI) Asia Centre: Water Quality Monitoring in the Chindwin River Basin. Policy Brief; Bangkok, Thailand. 2007. Available online: https://www.myanmarwaterportal.com/storage/eb/articles/913/WaterQMPB_small_font_15Sep2017.pdf (accessed on 22 September 2019).
- Thazin, L. Assessment of Water Quality from Some Selected Regions of the Ayeyarwady River. Ph.D. Thesis, Department of Chemistry, University of Yangon, Yangon, Myanmar, 1998. [Google Scholar]
- Environmental Protection Agency (EPA) United Stated: Citizen Science: Quality Assurance and Documentation. Available online: https://www.epa.gov/sites/production/files/2019-03/documents/508_csqapphandbook_3_5_19_mmedits.pdf (accessed on 22 September 2019).
- Loperfido, J.V.; Beyer, P.; Just, C.L.; Schnoor, J.L. Uses and Biases of Volunteer Water Quality Data. Environ. Sci. Technol. 2010, 44, 7193–7199. [Google Scholar] [CrossRef]
- Wang, R.Y.; Strong, D.M. Beyond Accuracy: What Data Quality Means to Data Consumers. J. Manag. Inf. Syst. 1996, 12, 5–33. [Google Scholar] [CrossRef]
- Sheppard, A.S.; Terveen, L. Quality is a Verb: The Operationalization of Data Quality in a Citizen Science Community. In Proceedings of the 7th International Symposium on Wikis and Open Collaboration, Mountain View, CA, USA, 3–5 October 2011; pp. 29–38. [Google Scholar]
- Minnesota Pollution Control Agency (MPCA): Volunteer Surface Water Monitoring Guide. 2003. Available online: https://www.pca.state.mn.us/water/resources-volunteers (accessed on 26 August 2019).
- Breuer, L.; Hiery, N.; Kraft, P.; Bach, M.; Aubert, A.H.; Frede, H.G. HydroCrowd: A citizen science snapshot to assess the spatial control of nitrogen solutes in surface waters. Sci. Rep. 2015, 5, 16503. [Google Scholar] [CrossRef]
- Buytaert, W.; Zulkafli, Z.; Grainger, S.; Acosta, L.; Alemie, T.C.; Bastiaensen, J.; DeBièvre, B.; Bhusal, J.; Clark, J.; Dewulf, A.; et al. Citizen science in hydrology and water resources: Opportunities for knowledge generation, ecosystem service management, and sustainable development. Front. Earth Sci. 2014, 2, 26. [Google Scholar] [CrossRef]
- Van Hamel, A. Participatory Monitoring Myanmar: A Research on the Motivation of People in Myanmar to Participate in ‘Participatory Monitoring’ by Making Use of Q Methodology. Bachelor’s Thesis, Delft University of Technology, Delft, The Netherlands, January 2018. [Google Scholar]
- Ko, N.T.; Rutten, M.; Conallin, J. Remote Sensing Analysis of Temperature and Suspended Sediment Concentration in the Ayeyarwady in Myanmar. Glob. J. Eng. Technol. Rev. 2017, 2, 30–47. [Google Scholar]
- Sliwka-Kaszynska, M.; Kot-Wasik, A.; Namiesnik, J. Preservation and Storage of Water Samples. Crit. Rev. Environ. Sci. Technol. 2003, 33, 31–34. [Google Scholar] [CrossRef]
- Zhao, Y.W.; Zhou, L.Q.; Dong, B.Q.; Dai, C. Health assessment for urban rivers based on the pressure, state and response framework—A case study of the Shiwuli River. Ecol. Indic. 2019, 324–331. [Google Scholar] [CrossRef]
- Rutten, M.; Minkman, E.; Van der Sanden, M. How to get and keep citizens in mobile crowd sensing for water management? A review of key success factors and motivational aspects. Wiley Interdiscip. Rev. Water 2017, 4, e1218. [Google Scholar] [CrossRef]
Figure 1.
Locations of the seven water quality stations on the Ayeyarwady and Chindwin Rivers.

Figure 2.
Flow application and survey form.

Figure 3.
Completeness of volunteers’ stations.

Figure 4.
Comparison of the automatic app reading with the eye reading of the corresponding picture stored in the database. Indicated are the 1:1 line (solid line) and the lower and upper boundaries (class range) of the indicator strips readings (dashed line).
Figure 4.
Comparison of the automatic app reading with the eye reading of the corresponding picture stored in the database. Indicated are the 1:1 line (solid line) and the lower and upper boundaries (class range) of the indicator strips readings (dashed line).

Figure 5.
Comparison of the results of the annual in situ measurements by lab technicians with the corresponding in situ measurement done by the volunteers; (a) electrical conductivity (EC), (b) transparency, (c) iron, (d) pH, and (e) nitrate nitrogen.
Figure 5.
Comparison of the results of the annual in situ measurements by lab technicians with the corresponding in situ measurement done by the volunteers; (a) electrical conductivity (EC), (b) transparency, (c) iron, (d) pH, and (e) nitrate nitrogen.

Figure 6.
Comparison of annual in situ measurement by the technician with the results of the monthly lab measurement using the volunteer grab sample; (a) EC, (b) transparency.
Figure 6.
Comparison of annual in situ measurement by the technician with the results of the monthly lab measurement using the volunteer grab sample; (a) EC, (b) transparency.

Figure 7.
Comparison of the results of the monthly in situ measurements of volunteers and the corresponding laboratory analysis on the volunteer grab sample of (a) electrical conductivity, (b) transparency.
Figure 7.
Comparison of the results of the monthly in situ measurements of volunteers and the corresponding laboratory analysis on the volunteer grab sample of (a) electrical conductivity, (b) transparency.

Figure 8.
Trends of the electrical conductivity; (a) Upper Ayeyarwady, (b) Chindwin, and (c) Ayeyarwady (after confluence with Chindwin).
Figure 8.
Trends of the electrical conductivity; (a) Upper Ayeyarwady, (b) Chindwin, and (c) Ayeyarwady (after confluence with Chindwin).

Figure 9.
Trends of the transparency; (a) Upper Ayeyarwady, (b) Chindwin, and (c) Ayeyarwady (after confluence with Chindwin).
Figure 9.
Trends of the transparency; (a) Upper Ayeyarwady, (b) Chindwin, and (c) Ayeyarwady (after confluence with Chindwin).


Table 1.
Set of indicators in a standard water quality monitoring program.
| General Water Quality | Dissolved Salt | Nutrients | Organic Matter |
|---|---|---|---|
| Water discharge/level | Calcium | Nitrate plus Nitrite | Chlorophyll a |
| Total suspended solids | Magnesium | Ammonia | |
| Temperature | Sodium | Total phosphorus, dissolved | |
| pH | Potassium | Total phosphorus, particulate | |
| Electrical conductivity | Chloride | Total phosphorus, unfiltered | |
| Dissolved oxygen | Sulphate | ||
| Alkalinity |
Table 2.
Elements and frequency of measurement.
| Weekly (Volunteers) Mobile Phone App | Monthly (in Lab) | Yearly In-situ (Low Water Season) Photometer | 6 hourly by Eureka Sensor (only at Station 2) |
|---|---|---|---|
| Electrical conductivity | Electrical conductivity | Electrical conductivity | Electrical conductivity |
| pH | pH | pH | |
| Nitrate Nitrogen and Nitrite Nitrogen | Nitrate Nitrogen | ||
| Alkalinity | Temperature | ||
| Iron | Iron | ||
| Transparency | Transparency | Transparency | Turbidity |
| Dissolved Oxygen | Dissolved oxygen (%) | ||
| Ammonia | |||
| Fluoride |
© 2019 by the authors. Licensee MDPI, Basel, Switzerland. This article is an open access article distributed under the terms and conditions of the Creative Commons Attribution (CC BY) license (http://creativecommons.org/licenses/by/4.0/).
Share and Cite
MDPI and ACS Style
Thatoe Nwe Win, T.; Bogaard, T.; van de Giesen, N. A Low-Cost Water Quality Monitoring System for the Ayeyarwady River in Myanmar Using a Participatory Approach. Water 2019, 11, 1984. https://doi.org/10.3390/w11101984
AMA Style
Thatoe Nwe Win T, Bogaard T, van de Giesen N. A Low-Cost Water Quality Monitoring System for the Ayeyarwady River in Myanmar Using a Participatory Approach. Water. 2019; 11(10):1984. https://doi.org/10.3390/w11101984
Chicago/Turabian StyleThatoe Nwe Win, Thanda, Thom Bogaard, and Nick van de Giesen. 2019. "A Low-Cost Water Quality Monitoring System for the Ayeyarwady River in Myanmar Using a Participatory Approach" Water 11, no. 10: 1984. https://doi.org/10.3390/w11101984
Note that from the first issue of 2016, this journal uses article numbers instead of page numbers. See further details here.