Variation of the Relative Soil Moisture of Farmland in a Continental River Basin in China

1
College of Geography and Environment Science, Northwest Normal University, Lanzhou 730070, China
2
State Key Laboratory of Cryosphere Science, Northwest institute of Eco-Environment and Resources, Chinese Academy of Sciences, Lanzhou 730070, China
3
Gansu Engineering Research Center of Land Utilization and Comprehension Consolidation, Lanzhou 730070, China
*
Authors to whom correspondence should be addressed.
Water 2019, 11(10), 1974; https://doi.org/10.3390/w11101974
Submission received: 8 August 2019
/
Revised: 14 September 2019
/
Accepted: 17 September 2019
/
Published: 22 September 2019
(This article belongs to the Special Issue Global Changes in Drought Frequency and Severity)
Abstract
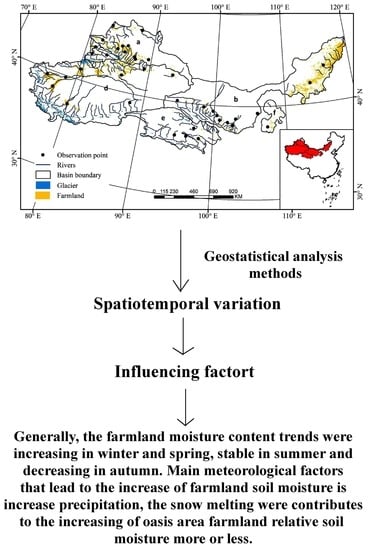
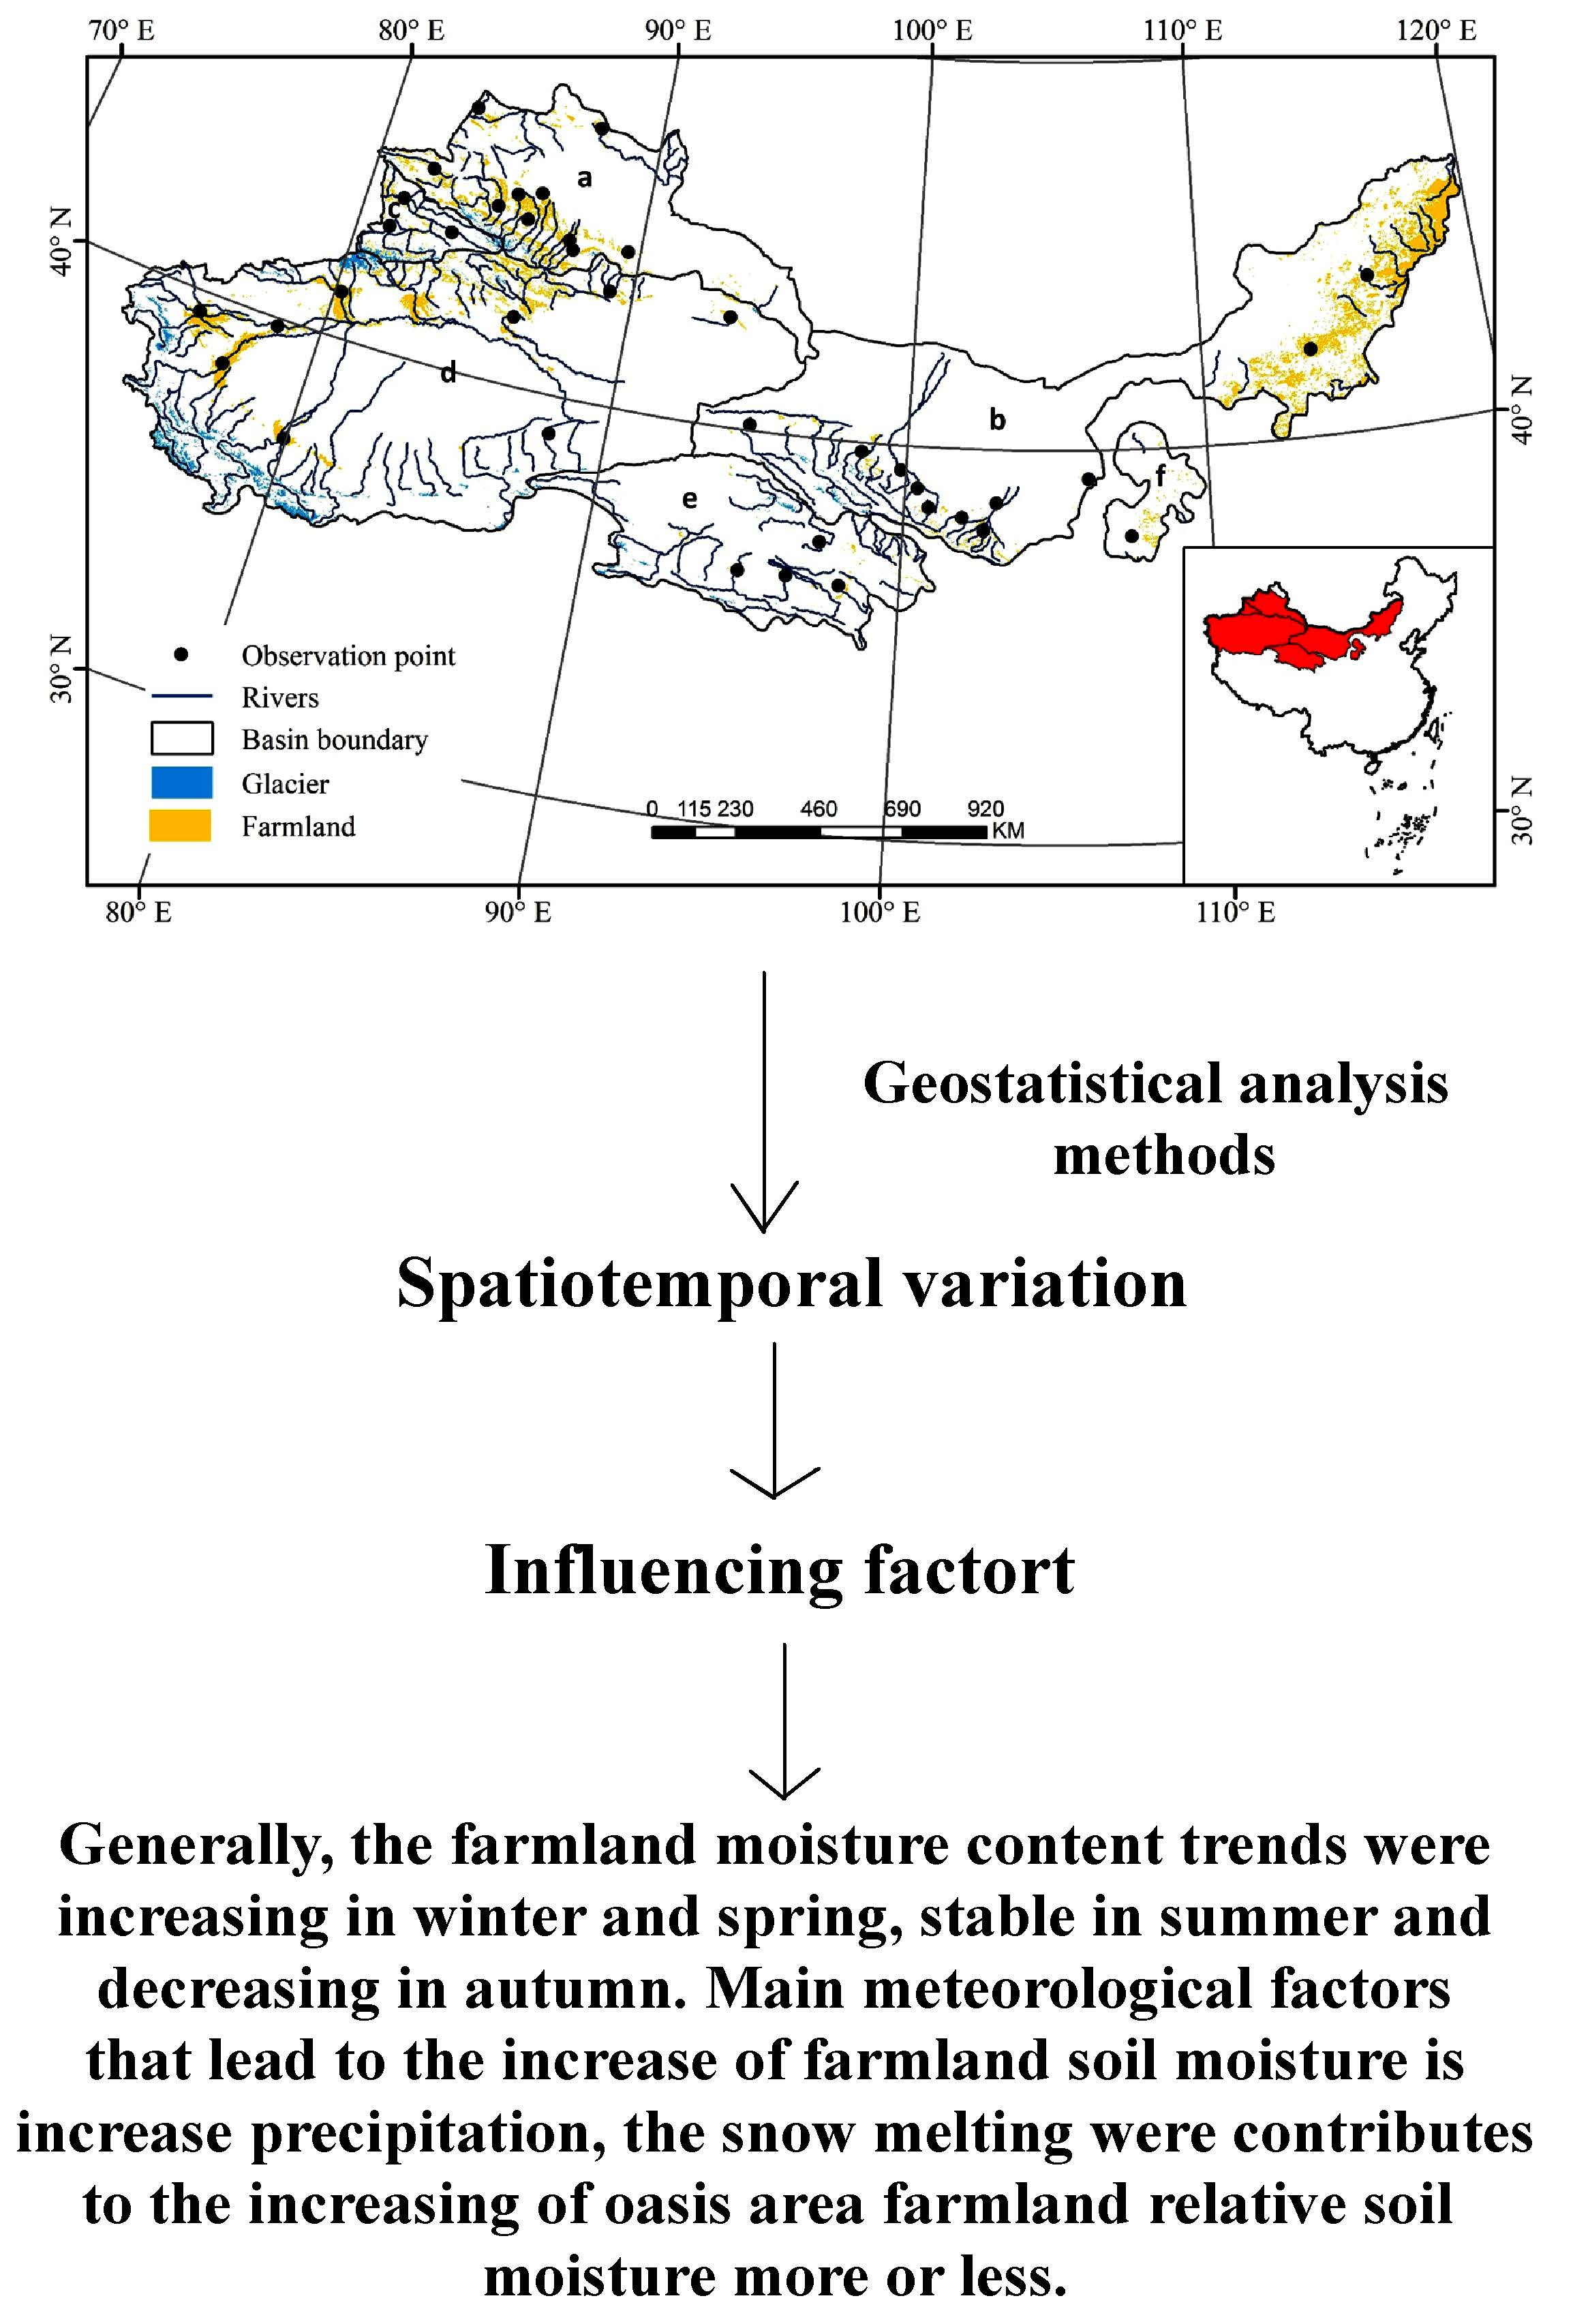
:The reduction of grain production caused by drought is one of the most serious problems caused by natural disasters. The relative soil moisture of farmland is the most important monitoring indicator for agricultural drought. This study investigated the relative soil moisture of farmland data from 38 agrometeorological stations in a continental river basin area in China from 1992 to 2012. Spatial and temporal variations of the relative soil moisture of farmland were studied using geostatistical analysis. The results show that, from 1992 to 2012, the average annual relative soil moisture of farmland in the continental river basin ranged from 62.5 to 86.1%, and the relative soil moisture of farmland was high in the marginal areas of basins and low in the central areas of basins and plateau areas. The relative soil moisture of farmland was high in the Tarim Basin and the Hexi Corridor, which are located in the northern Tianshan Mountains and the southern and northern Qilian Mountains, and was low from the northern Altun Mountains to the south of Lop Nor, the Turpan Depression, and the Tarbagatai Mountains. From 1992 to 2012, the annual average relative soil moisture of farmland in the continental river basins showed an increasing trend, with a growth rate of 0.57% yr−1. The variation tendency of the relative soil moisture of farmland was different in different river basins; the relative soil moisture showed a decreasing trend in the Mongolian Plateau and an increasing trend in other basin areas. The relative soil moisture of farmland increased in summer, spring, and winter, and decreased in autumn. The change in relative soil moisture of farmland was due to a combination of climatic factors, such as precipitation and temperature, as well as topography and glacial meltwater.
1. Introduction
Variability in relative soil moisture plays an important role in the interactions between the land surface and climate in the earth system, as well as in biogeochemical and hydrological cycling, vegetation, ecosystems, and agriculture in the landscape [1,2,3]. Relative soil moisture content is determined by soil water conditions, and can reflect most of the surface hydrological processes. As an important physical quantity in land surface processes, relative soil moisture content affects climate by changing the surface albedo, heat capacity, and the transport of sensible heat and latent heat into the atmosphere. Additionally, regional runoff and surface energy balance are significantly affected by changes in relative soil moisture [4]. Therefore, it is very important to analyze the spatial and temporal characteristics of relative soil moisture in order to determine changes in relative soil moisture and to allow for the appropriate use of soil water resources to cope with climate change.
In recent years, many experts have discussed the spatial distribution of relative soil moisture and its influencing factors. Based on observed relative soil moisture, most scholars analyzed the spatial and temporal distribution of relative soil moisture in the horizontal and vertical directions at different regional scales [5,6,7]. Relative soil moisture is affected by many factors. Atmospheric precipitation, groundwater, irrigation, and water vapor condensation all increase the relative soil moisture content, while soil evaporation, soil transpiration, and the uptake of leakage and runoff by plants reduce the relative soil moisture content. The relationship between soil moisture and topography, climate, and soil properties has been discussed in previous studies. In particular, land use, slope, relative elevation, soil characteristics, rainfall, solar radiation, etc. [8,9,10,11,12,13], are important for understanding the spatial distribution of relative soil moisture. In the past century, great changes have taken place in various factors that have influenced relative soil moisture. Observational data show that, in the past five decades, temperature has greatly increased and precipitation has decreased, while the runoff in continental river basins has clearly increased in the past 30 years [14]. An assessment of drought and desertification by the Intergovernmental Panel on Climate Change (IPCC) showed that aridification around the world is likely to continue in the next 30–50 years [15,16]. Additionally, glacier melting and soil erosion intensified, which caused changes to the soil eco-environment and hydrological processes in oasis areas, etc.
Relative soil moisture is the most important parameter for determining inland surface hydrological processes; however, it is also the most difficult to establish [17,18]. Due to the lack of measurements of relative soil moisture, the physical description of soil moisture is rough in land surface processes models. Furthermore, due to the limited number of research sites, few studies have analyzed relative soil moisture at the national scale, and there are some limitations in the study of relative soil moisture at a large scale [7]. However, interpolation methods can effectively solve this problem. Kriging interpolation is an effective interpolation method; as an important part of geostatistical analysis, it has been widely applied in geology, meteorology, geography, cartography, etc. Compared with traditional interpolation methods, Kriging interpolation provides an optimal unbiased estimation with very high precision [9]. Therefore, the Kriging interpolation method can be applied to the study of relative soil moisture. Relative soil moisture is the most important monitoring index for agricultural drought [19]. Droughts, floods, and snowstorms have seriously affected food production all over the world, and consequently food security has become a globally important issue [20]. Serious drought events frequently occur in the world’s main grain-producing areas and have a serious impact on grain production. Research on drought has produced some important findings related to precipitation, runoff, etc. [21,22]. The relative soil moisture of farmland needs to be further studied since it is of great significance for ensuring the safety of food production.
In this study, we combined data collected regarding the relative soil moisture of farmland in continental river basin areas using the Kriging interpolation method in order to study the spatiotemporal changes in farmland soil moisture at various soil depth levels and determine the influencing factors, mechanisms, and characteristics of changes in relative soil moisture of farmland at a large scale.
2. Materials and Method
2.1. Materials
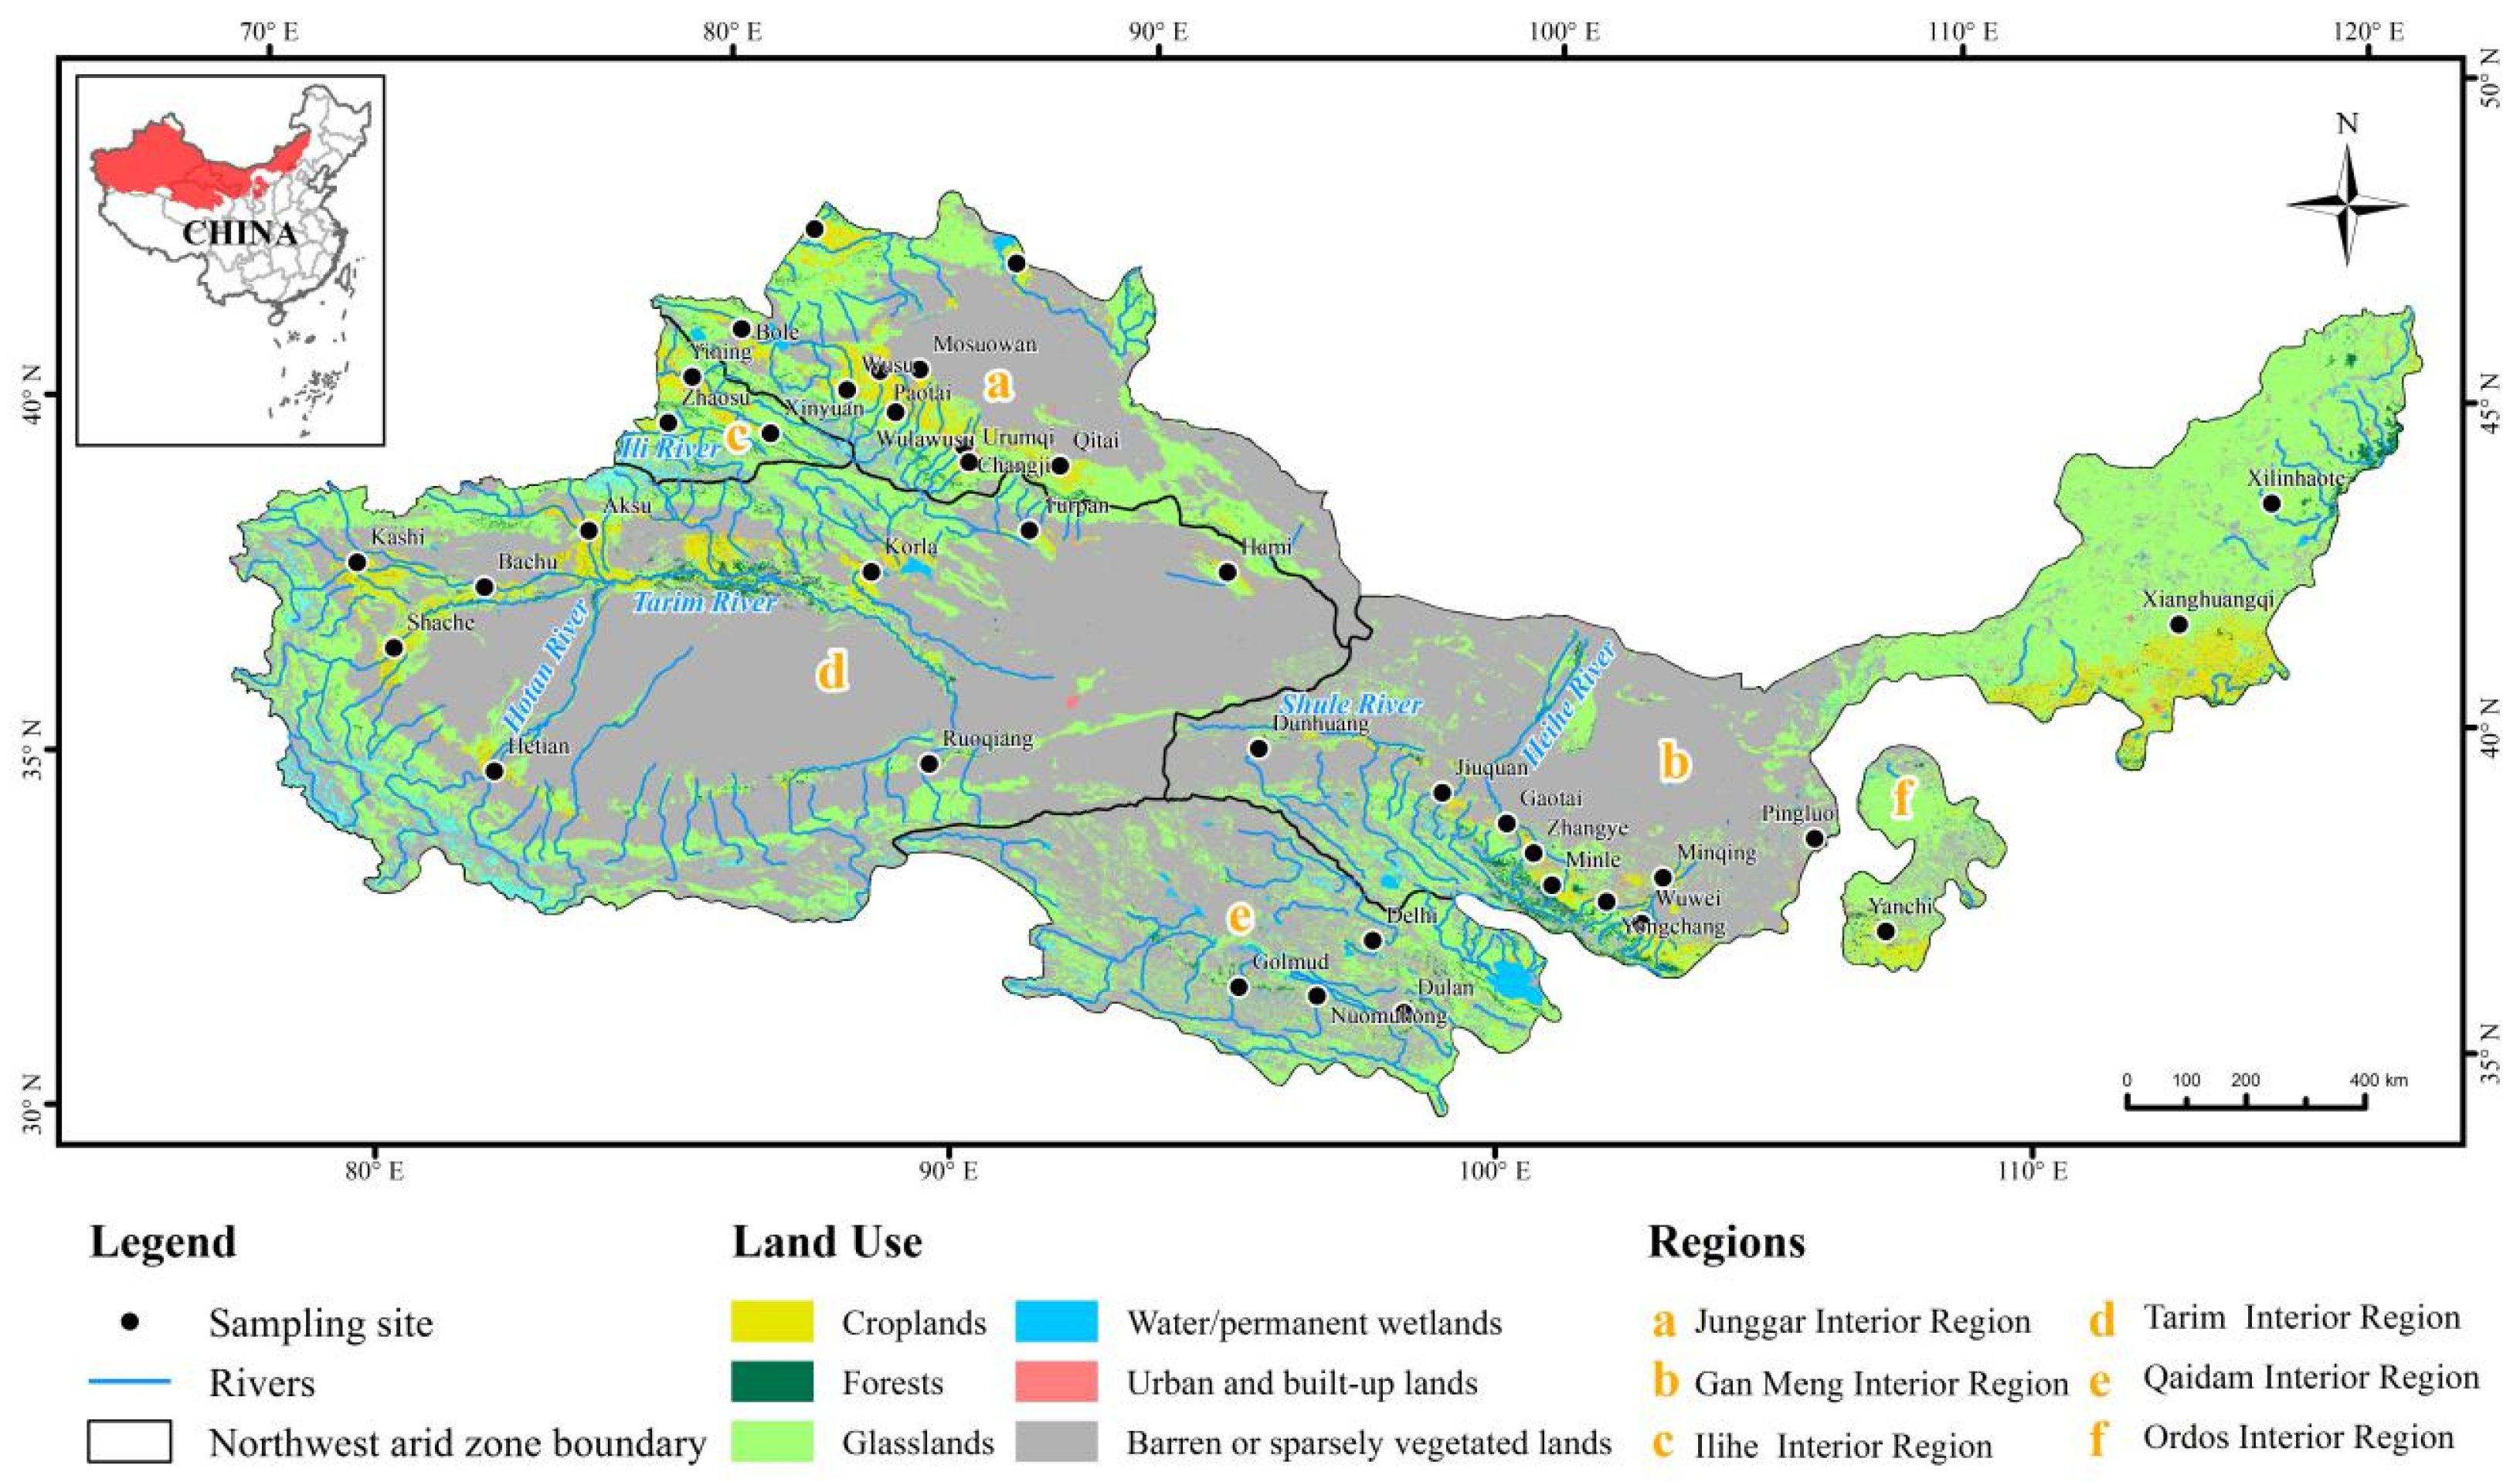
Data from 38 agricultural meteorological stations (Table 1, Figure 1) from 1992 to 2010 were acquired from the website of the China National Meteorological Administration (http://data.cma.cn/site/index.html). The data were not affected by farming methods or other human factors. This article defines winter as December to February, autumn as September to November, summer as June to August, and spring as March to May. The data were acquired on the 8th, 18th, and 28th day of the month at soil depths of 10, 20, and 50 cm, respectively. The samples were placed in an aluminum box and then baked in an oven for 12 h at 105 °C. Soil with a soil water content of less than 3% was defined as dry soil, and soil from a depth of less than 10 cm was defined as the shallow layer.
The oven drying method was used to determine the soil moisture, and the Mann–Kendall trend test [23,24] was used to verify the homogeneity of the observations. Two observation sites, namely Pingluo and Delhi, were located on the edge of the monsoon area, whereas most other sites were located in the oasis of the arid area. The average temperature, precipitation, sunshine hours, relative humidity, and wind speed of 50 stations during 1992–2011 were selected to analyze the meteorological factors that affect the variation in relative soil moisture of farmland. The data for inland river runoff and change in glacier volume was obtained from the literature.
The relative soil moisture of farmland (R) was calculated as follows:
where Mwater is the soil water content and Swater is the field water capacity.
2.2. Methods
Kriging Interpolation
Kriging interpolation is the ideal geostatistical method for analyzing the spatial variation of meteorological factors [12,22,25]. The advantages of this interpolation are: (1) the degree of spatial similarity can be assessed using the mean variance based on spatial statistics, and the error can be theoretically estimated point by point, thereby avoiding the boundary effects of regression analysis; and (2) using the structural characteristics of the relative moisture data, missing data can be added using the method of linear unbiased optimal estimation, and the influence of topography on relative soil moisture can be considered at the same time (whereas the inverse distance weighted (IDW) and spline interpolation methods cannot).
The Kriging interpolation assumptions were based on prior spatial analysis models [22,25]. The assumed spatially random variables either have second-order stationary characteristics or they obey the intrinsic spatial statistical assumptions. The formula is shown in Equations (2)–(5):
where z(xi) is the observed value at point xi; x0 is a non-sampling point; and is the true value and is equal to 1, i.e.,
The parameter was selected to ensure that the estimation of was unbiased and that the variance was less than the variance of the linear combination of any observed value.
The minimum variance is given by Equation (4):
Equation (4) is obtained using Equation (5):
where is the semi-variance of z between the sampling points xi and xj, is the semi-variance of z between the sampling points xi and an unknown point x0. These values were obtained from the corresponding variation function. The parameter φ is the Lagrange multiplier in the minimization process.
3. Results and Analysis
3.1. Spatial Distribution of Relative Soil Moisture of Farmland
The average annual relative soil moisture of farmland in the inland river basin was between 62.5% and 86.1% (Table 2), and was obviously different in different seasons. Overall, the relative soil moisture of farmland was high in the Tarim Basin, northern and southern Qilian Mountains, and Hexi Corridor, with an average value of 70–85%. The relative soil moisture of farmland was low in the region from northern Altun to Lop Nur, Turpan Basin, and southern Taishan, with an average value of 50–70%. The relative soil moisture of farmland at a depth of 10 cm was between 62.5% and 83.6%, with an average value of 69.7%; the value at 20 cm was between 67.5% and 86.2%, with an average value of 74.7%; and the value at 50 cm was between 69.3% and 77.7%, with an average value of 73.7%. The seasonal and annual average thickness of the dry layer was both more than 3 cm, and the dry layer was thicker in autumn and winter. Precipitation and evaporation greatly impacted the relative soil moisture of farmland at different depths. In summer and autumn, the relative soil moisture of farmland at different depths, in ascending order, was 10 cm < 20 cm < 50 cm; in spring it was 10 cm < 50 cm < 20 cm; and in winter it was 50 cm < 10 cm < 20 cm. In spring, there was less precipitation, and the relative soil moisture of deep soil was obviously higher than that of shallow soil. In summer and autumn, when there was more precipitation, shallow soil absorbed more water from precipitation. As the study area received very little precipitation and the shallow soil layer soil was more vulnerable to the impact of evapotranspiration, the maximum relative soil moisture of farmland occurred at a depth of 50 cm.
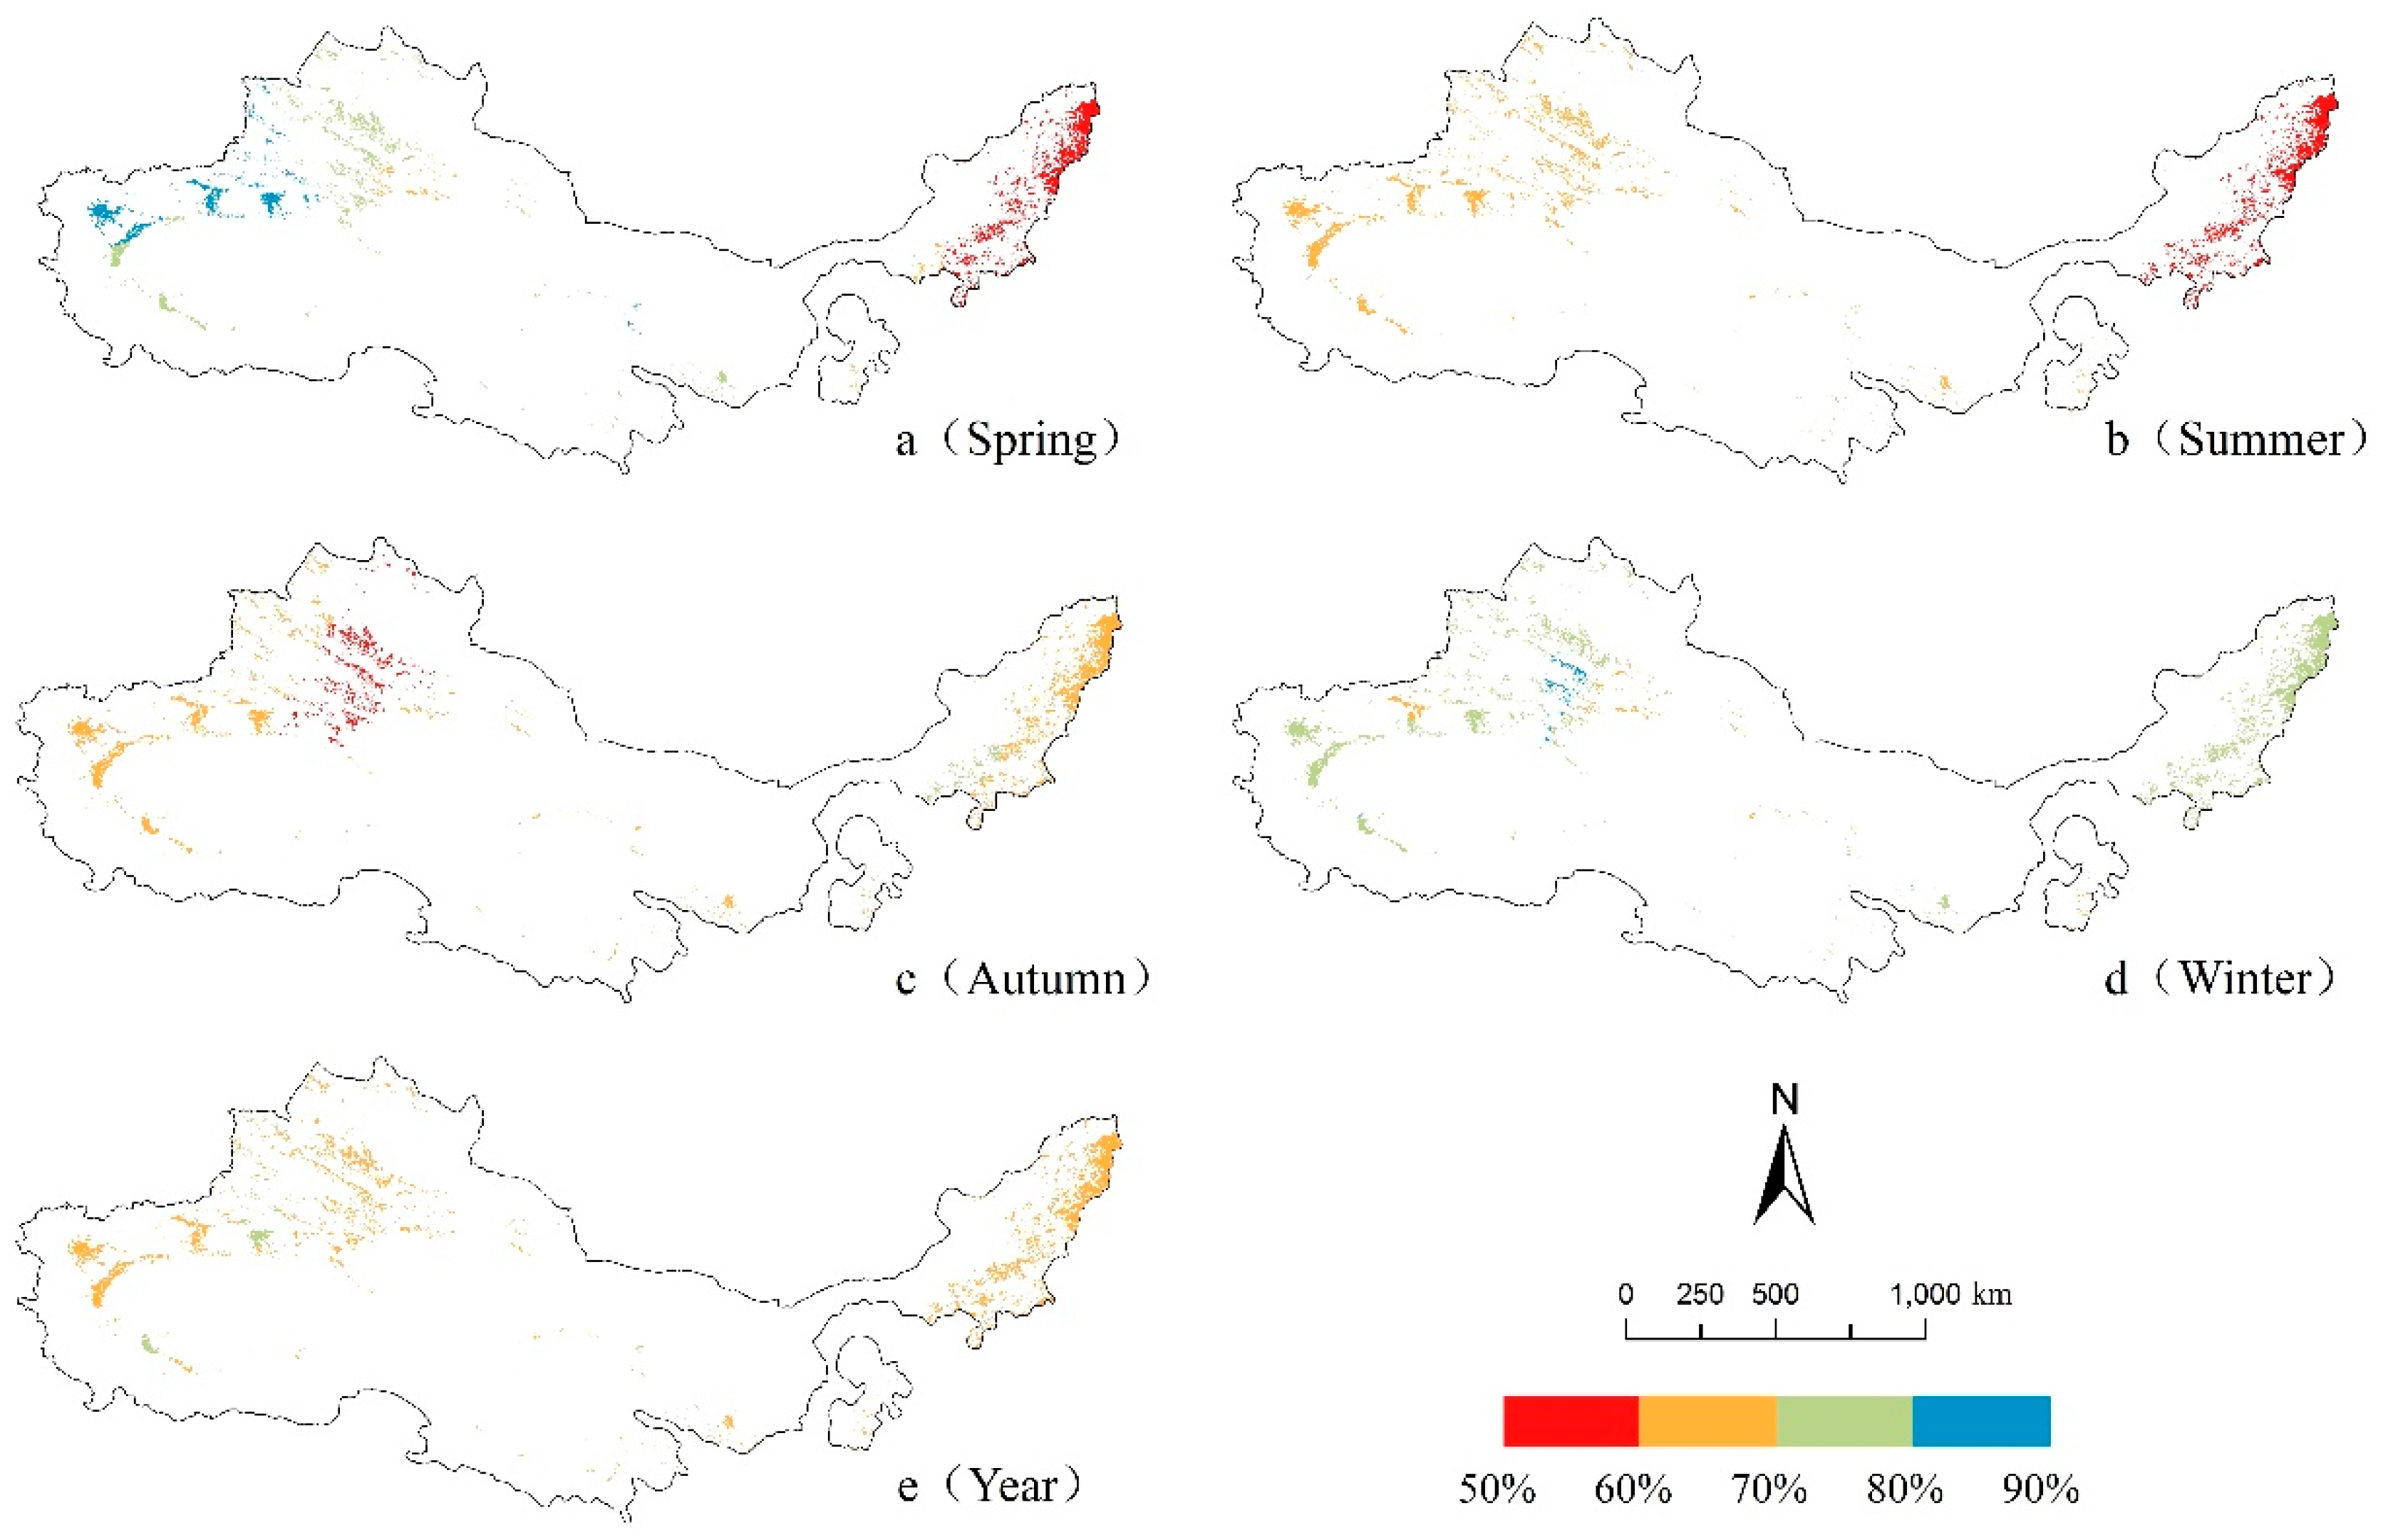
In spring (Figure 2a), there was an obvious variation in the spatial distribution of the relative soil moisture of farmland. In the eastern Qaidam Basin and the northern and southern Tianshan and Qilian Mountains, the relative soil moisture of farmland was relatively high, ranging from 80–85%; in the Helan Mountains, eastern Yinshan, the Turpan Basin, and the southwestern Taklimakan Desert, the relative soil moisture of farmland was relatively low, ranging from 50–70%; while in the rest of the study areas, the relative soil moisture ranged from 70–80%. In summer (Figure 2b), the distribution pattern of the relative soil moisture of farmland was similar to that in spring; however, the spatial differentiation was not as obvious as in the spring. In the eastern Qaidam Basin and the southern and northern Qilian Mountains, the relative soil moisture of farmland was relatively high, between 70–75%; in the Mongolian Plateau, which is located in the east of Yinshan, the relative soil moisture of farmland was between 50–60%; while the relative soil moisture of farmland in the rest of the study areas ranged from 60–70%. In autumn (Figure 2c), the relative soil moisture of farmland was significantly different to that in the spring and summer. In the central Mongolian Plateau, the southern foothills of the Qilian Mountains, and the southern foothills of Altun, the relative soil moisture of farmland was high, between 70–80%; in the central Junggar Basin and the central Badan Jaran Desert, the relative soil moisture of farmland was low, between 50–60%; while in the rest of the study area, the relative soil moisture of farmland ranged from 60–70%. That is, the relative soil moisture of farmland was not high in summer and autumn, when precipitation was more concentrated but evaporation was stronger. However, conditions were quite different in non-arid regions. In winter (Figure 2d), the relative soil moisture of farmland in the southern Tianshan Mountains, the eastern Qilian Mountains, and the Helan Mountains was high, between 80–90%; in the western Junggar Basin, the Turpan Basin, and the Badan Jaran Desert, the relative soil moisture of farmland was low, between 60–70%; in the rest of the study areas, the relative soil moisture of farmland was between 70–80%. The annual average relative soil moisture of farmland of northern and southern Tianshan and the eastern Qilian Mountains was high, between 79–80%, while the annual relative soil moisture of farmland in the rest of the study area was between 60–70%. The seasonal and annual average relative soil moisture of farmland were high in the southern and northern Tianshan Mountains and the eastern Qilian Mountains and low in the Junggar Basin, the BadanJaran Desert, the Tengger Desert, and the Turpan Basin (Figure 2e). The spatial distribution of areas with a relatively high relative soil moisture of farmland was consistent with the distribution of precipitation and runoff, showing that rainfall and meltwater had a decisive influence on the distribution of the relative soil moisture of farmland in the continental river basin. In the relative soil moisture of farmland-equivalent areas, including the continental river basin, the relative soil moisture was patchily distributed, unlike in other areas where the distribution had a striped pattern [12]. This shows that the factors that affected the relative soil moisture of farmland in the continental river basin were very complex. The eastern Qilian Mountains and the southeastern Inner Mongolian Plateau were affected by the southeast monsoon in summer and autumn. Meanwhile, northern and southern Tianshan were under the influence of warm water vapor from the Atlantic Ocean, and precipitation was high, within the range of 300–600 mm. In other areas of the continental river basin, precipitation was generally lower, being less than 200 mm in many areas, and evaporation was strong. Generally, the potential evaporation was greater than 800 mm.
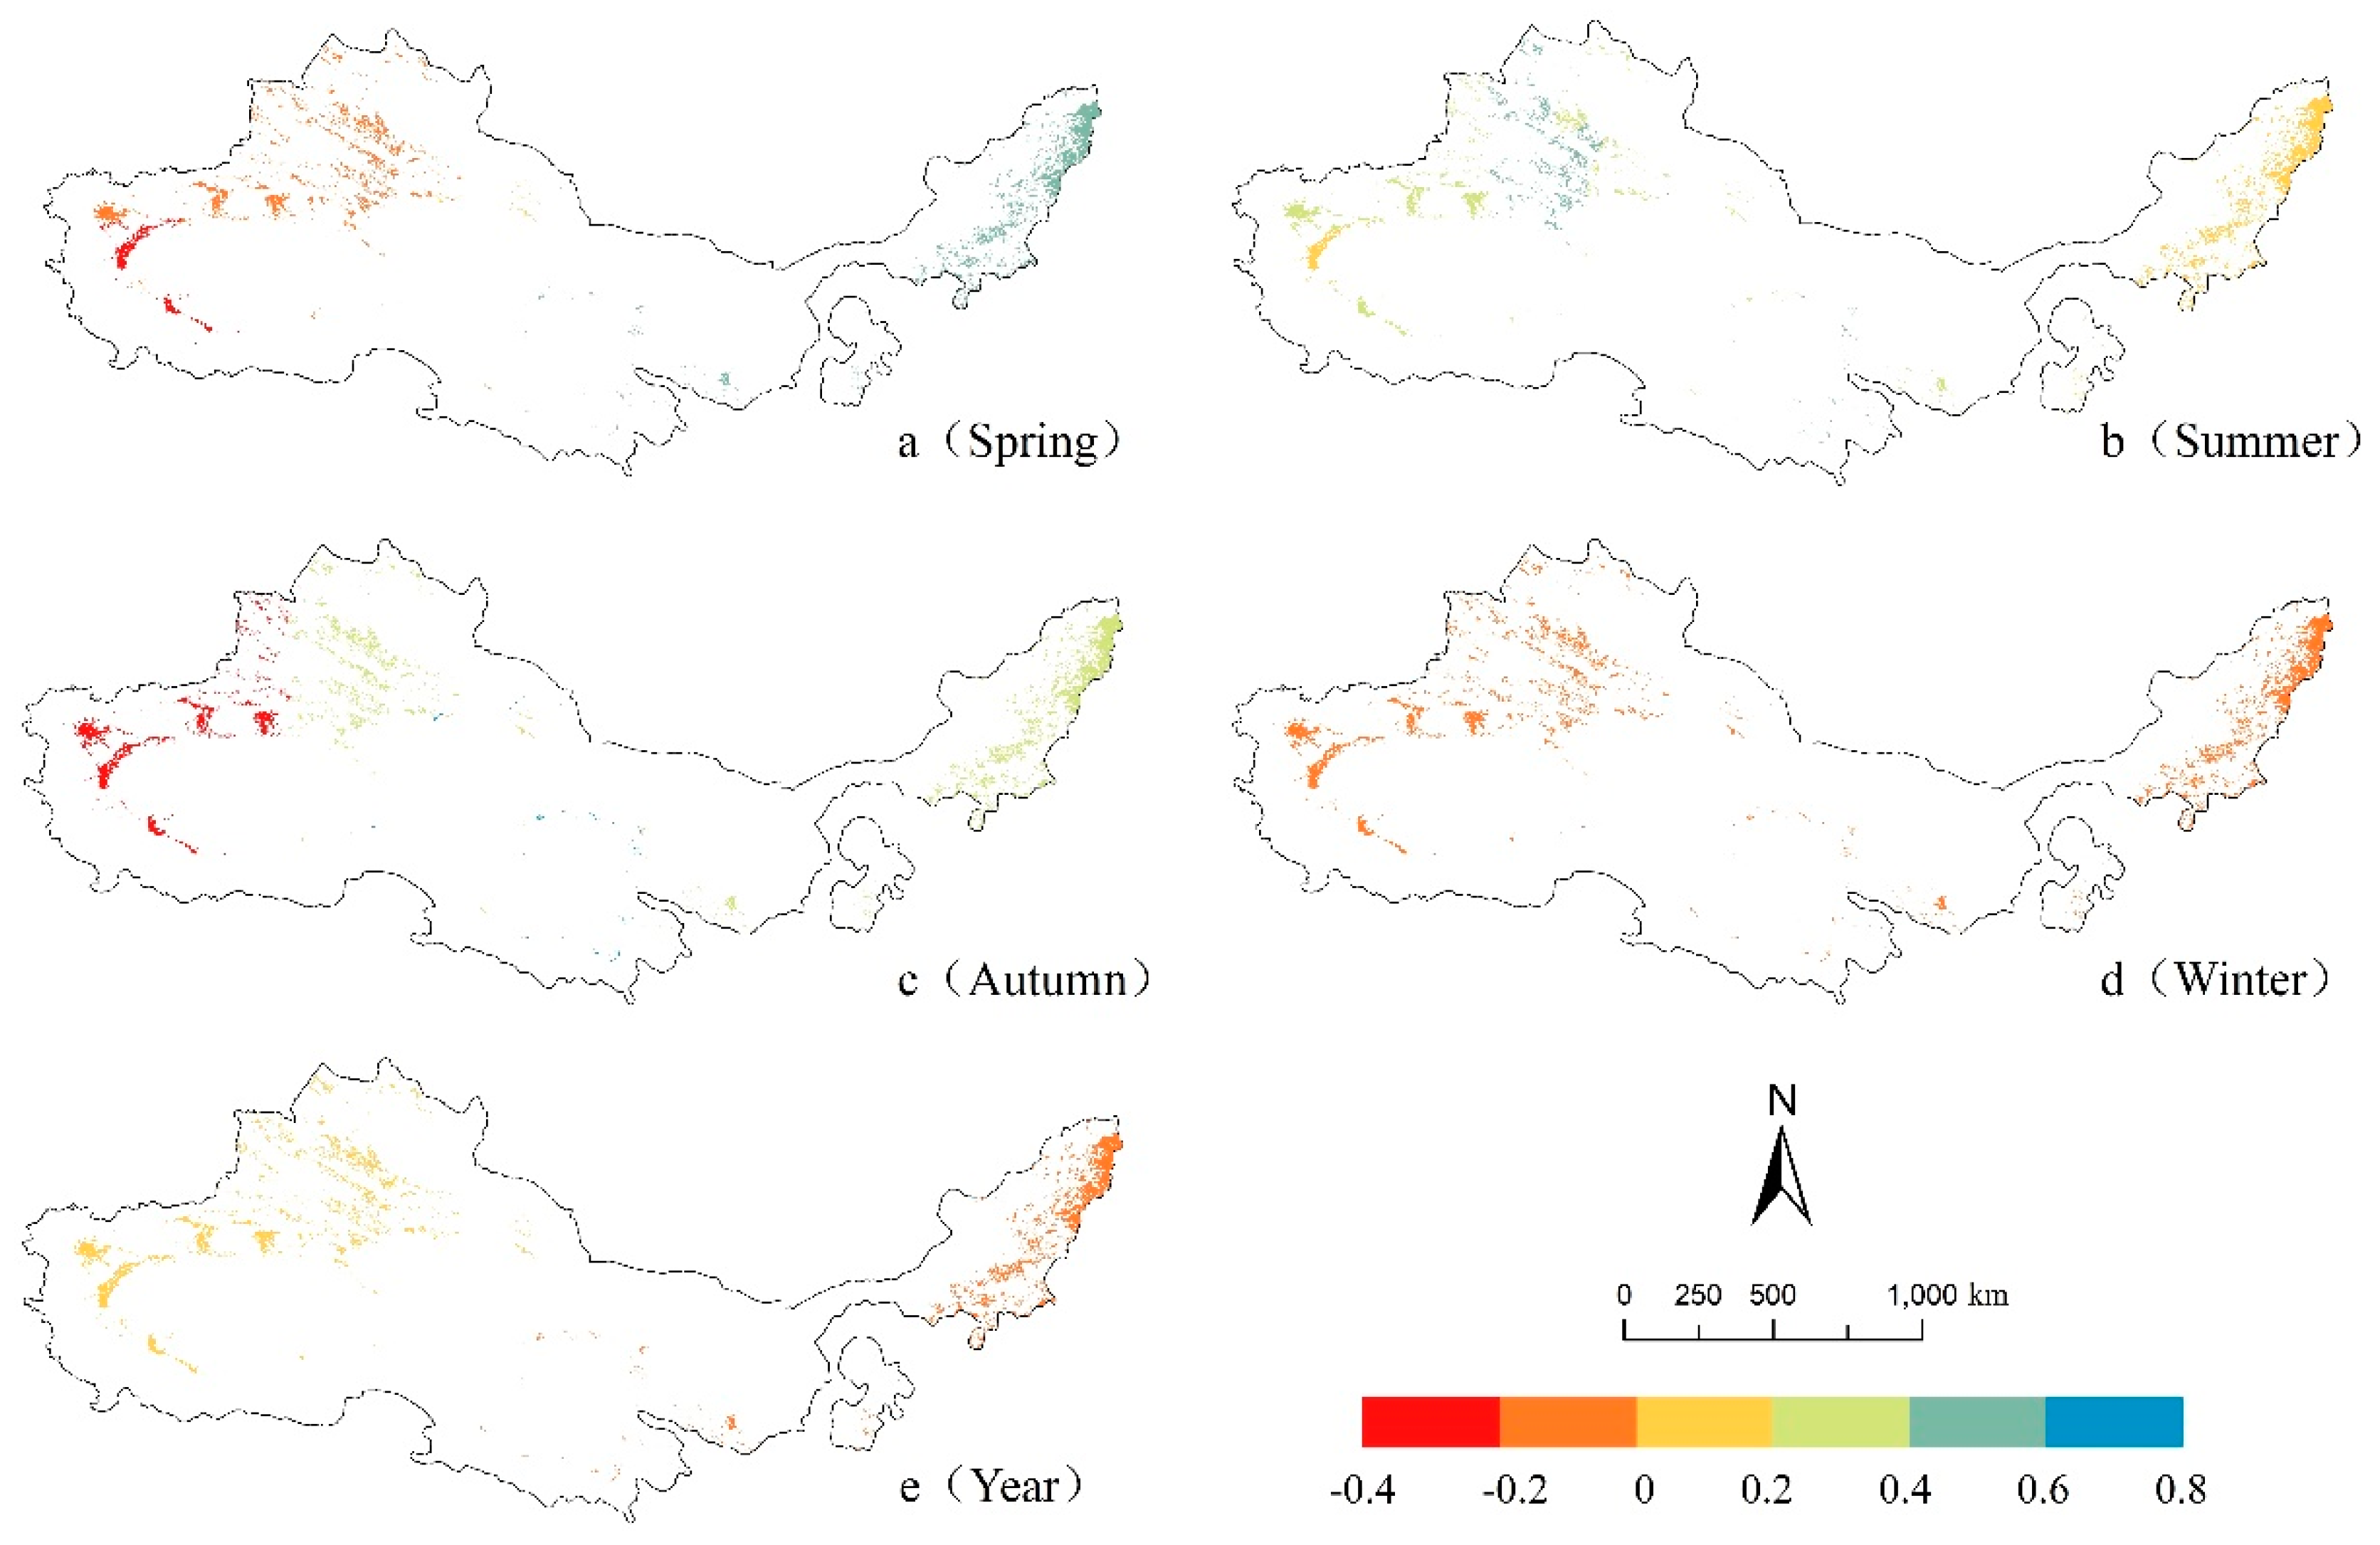
The northwestern arid area contains mountains, basins, and plateaus. The alternating and complex terrain affects the spatial distribution of the relative soil moisture of farmland by affecting the temperature, wind, precipitation, and other meteorological factors. The spatial distribution of the seasonal variation of the relative soil moisture of farmland in continental river basin varied significantly (Figure 3). Overall, the average annual relative soil moisture showed an increasing trend, while no obvious variation in the relative soil moisture of farmland was observed in the eastern margin of the Qaidam Basin or the western Badan Jaran Desert, where the inter-annual increase rate was 0–0.1% yr−1. In the west of the study area, the relative soil moisture showed an obvious increasing trend of 0.15–0.17% yr−1. The relative soil moisture of farmland of the western Tarim Basin increased slightly, with an increase rate of 0.1–0.15% yr−1. In spring, the relative soil moisture of farmland clearly increased in the eastern margin of the Qaidam Basin and the western edge of the Badan Jaran Desert, with an inter-annual increase rate of 0.4–0.65% yr−1 (Figure 3a). Two bands of increasing relative soil moisture of farmland running north to south were distributed along the western edge of the Qaidam Basin, Shule, the eastern Badan Jaran Desert, and the eastern Badain Jaran Desert, with an inter-annual increase rate of 0.2–0.5% yr−1. In the southwestern Tarim Basin, the relative soil moisture decreased, with an inter-annual variation rate of −0.4 to 0.2% yr−1, while in the rest of the regions, the inter-annual variation rate was −0.2 to 0% yr−1. In summer (Figure 3b), the relative soil moisture of farmland showed an overall upward trend in the eastern Qilian Mountains, the Badan Jaran Desert, western Yinshan, the Qaidam Basin to the Shule line, the eastern Junggar Basin, the western and eastern Tarim Basin, and the Qaidam Basin, forming three belts of high relative soil moisture of the farmland running north to south with an inter-annual increase rate of 0.4–0.6% yr−1. In the western Tarim Basin and the Mongolian Plateau, the relative soil moisture of farmland increased less, with an inter-annual increase rate of −0.2% yr−1. The rest of the study area had an inter-annual increase rate of 0.2–0.4% yr−1. In autumn (Figure 3c), the relative soil moisture of farmland increased significantly in the eastern Qaidam Basin, the eastern Qilian Mountains, the Badan Jaran Desert, the Tengger Desert, and from the western margin of the Qaidam Basin to the Shule River Basin, with an inter-annual increase rate of 0.4–0.8% yr−1. In the eastern Tarim Basin, the eastern edge of the Tianshan Mountains, and the eastern edge of the western Junggar Basin, the relative soil moisture of farmland showed a downward trend, with an inter-annual decrease rate of −1 to 0% yr−1, while the rest of the study area showed an upward trend, with an inter-annual increase rate of 0–0.4% yr−1. In winter (Figure 3d), the relative soil moisture of farmland changed to a lesser extent; in the boundary between the Helan Mountains and Yinshan, the east of the Maowusu sand, and the Mongolian Plateau, the relative soil moisture slightly decreased, with an inter-annual variation of −0.2 to 0% yr−1. The trend rate increased from west to east and increased slightly in the vast western area. In southern Tianshan and the northern foot, the increase trend was clear, with an inter-annual increase rate of about −0.2% yr−1, and the relative soil moisture of farmland increased from south to north.
3.2. The Inter-Decadal and Inter-Annual Variability of Relative Soil Moisture
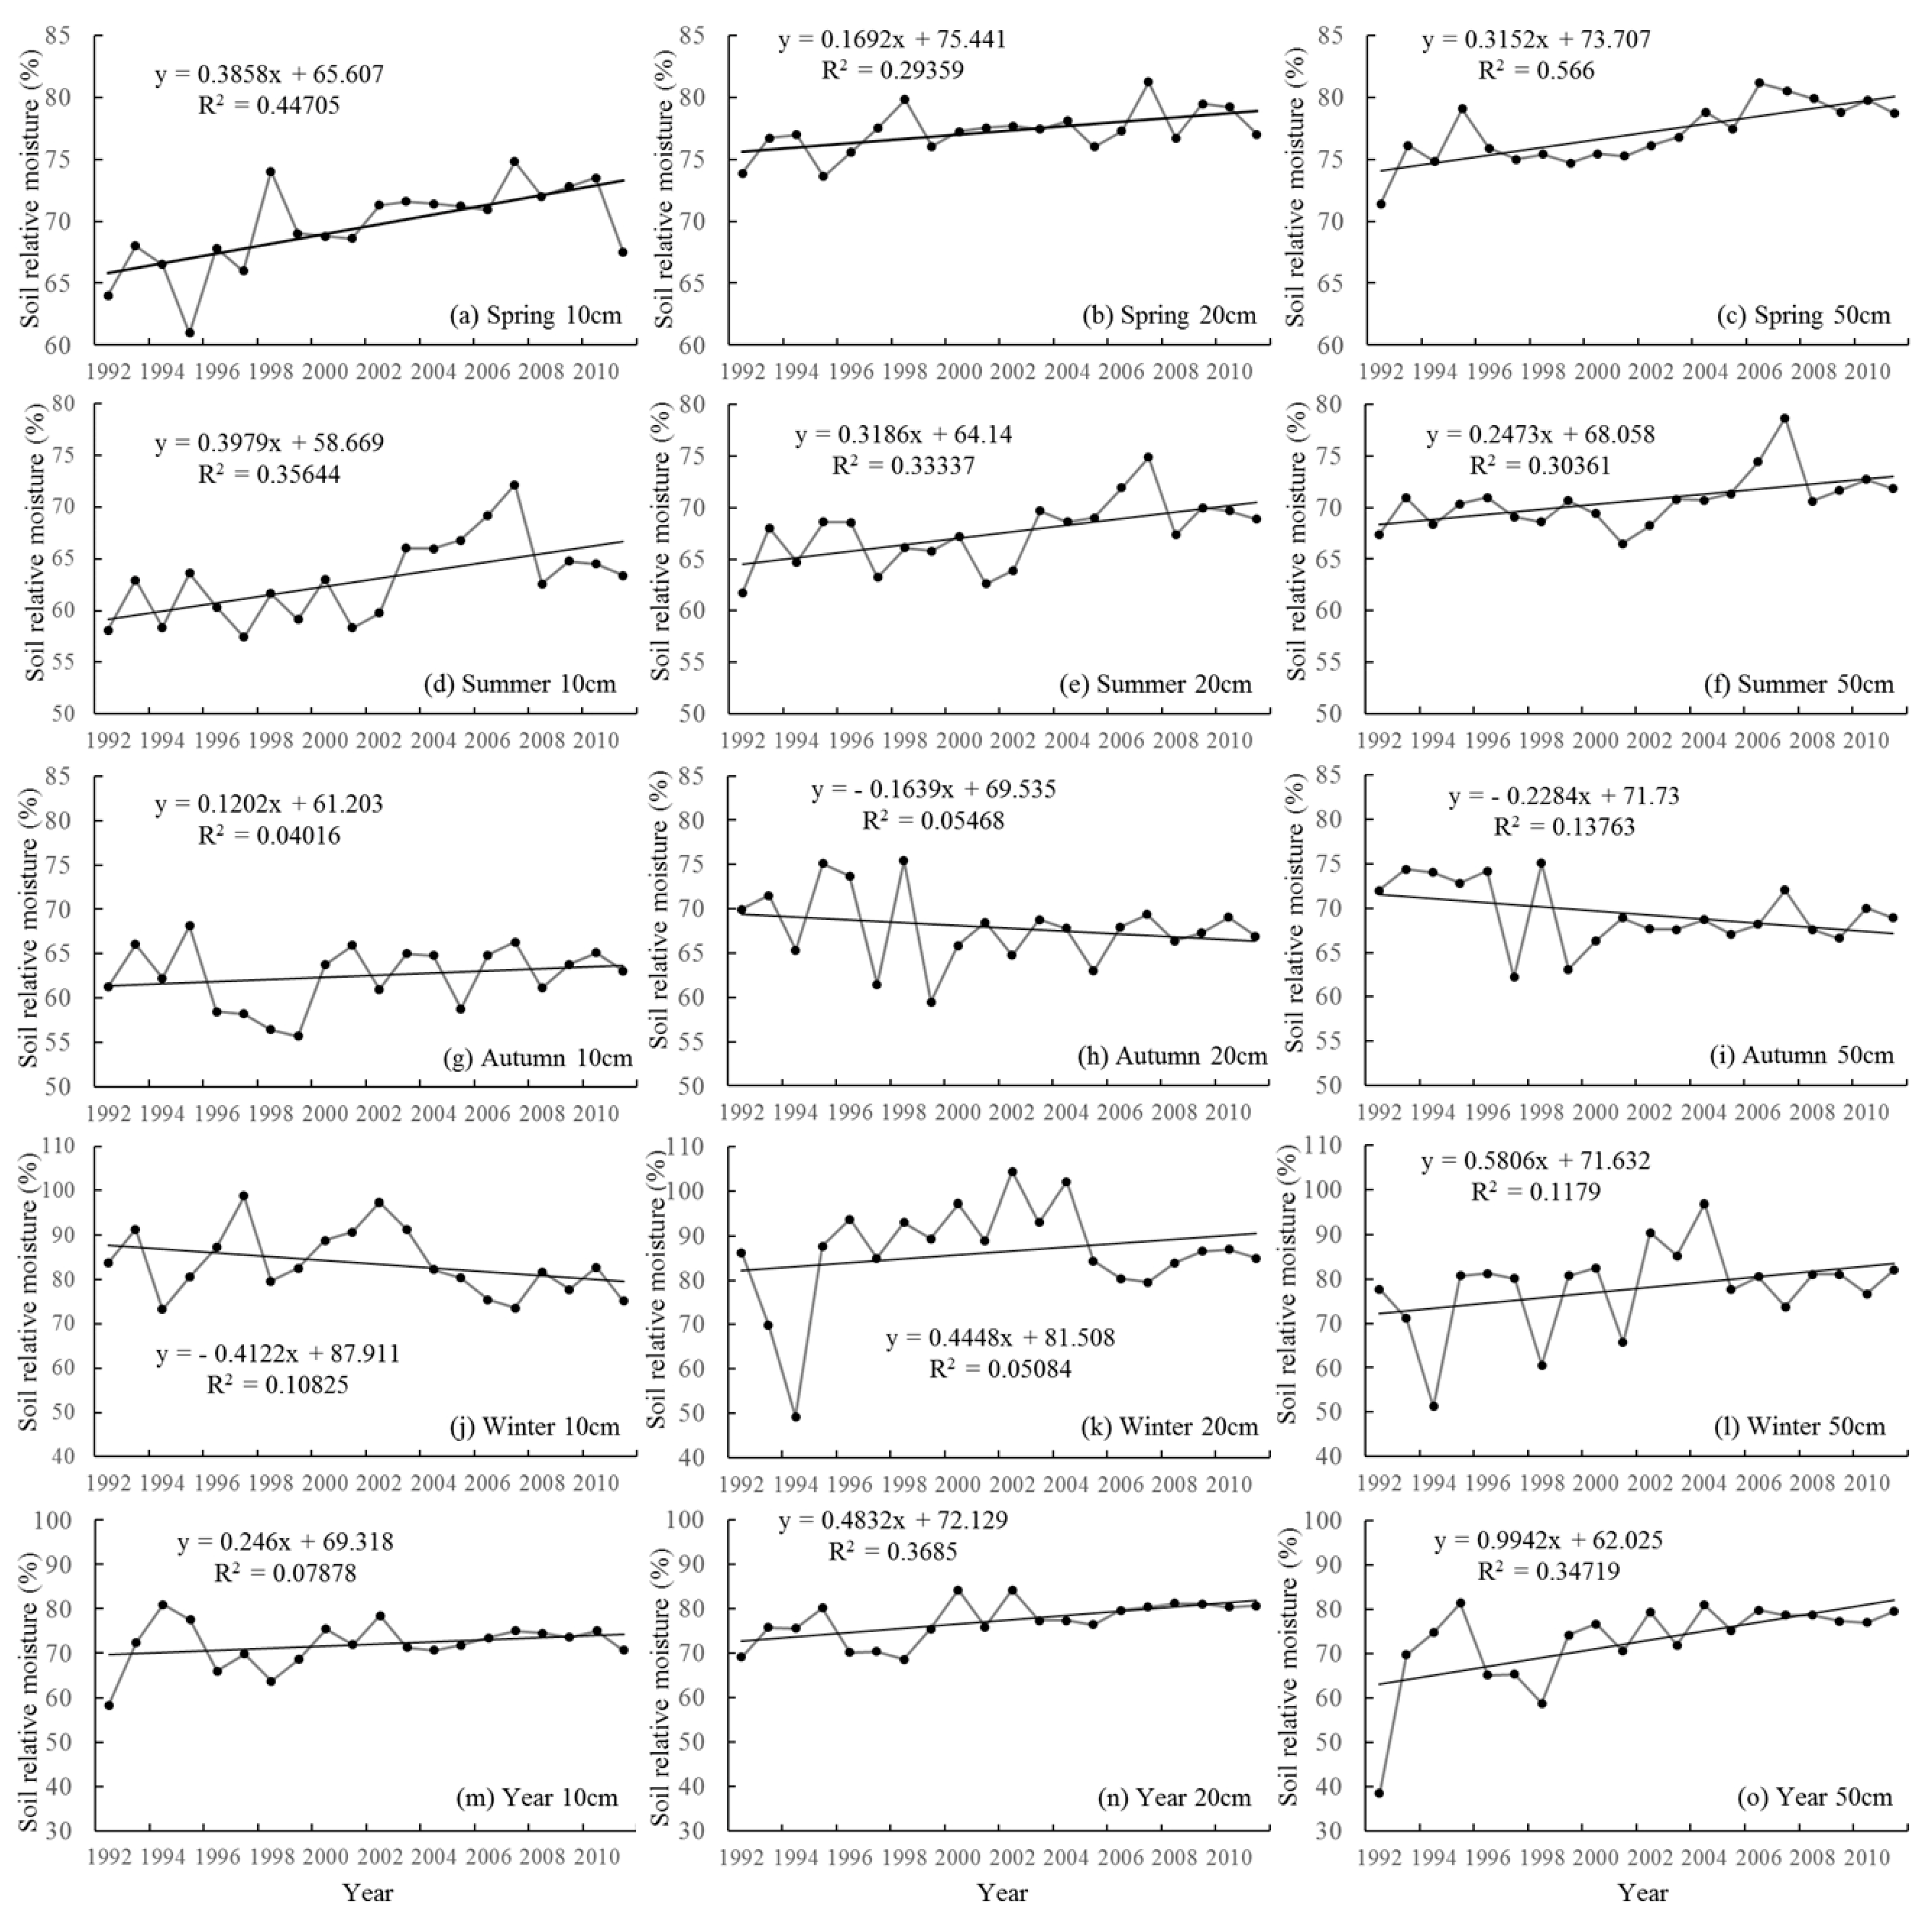
In autumn, the relative soil moisture of farmland at a depth of 10, 20, and 50 cm showed a downward trend, while in the 1990s and early 2000s, the relative soil moisture of farmland in inland river basins showed an overall increasing trend (Figure 4), with average annual relative soil moisture of farmland showing increase rates of 0.15%, 0.25%, and 0.38% yr−1 at depths of 10, 20, and 50 cm, respectively. In 1994, 1998, and 2007, when precipitation and evaporation underwent significant fluctuations, the relative soil moisture of farmland also fluctuated significantly, suggesting that fluctuations in meteorological factors significantly influenced the relative soil moisture of farmland. In spring, the relative soil moisture of farmland increased at depths of 10, 20, and 50 cm, with increase rates of 0.39%, 0.17%, and 0.32% yr−1; that is, the soil layers showed a similar trend. In 1992–1999, the relative soil moisture of farmland fluctuated greatly, though it did show an overall upward trend. In 2000–2006, the relative soil moisture of farmland steadily increased, while in 2006–2011, the soil moisture fluctuated and showed a downward trend. In summer, the relative soil moisture of farmland showed increase rates of 0.40%, 0.32%, and 0.25% yr−1 at depths of 10, 20, and 50 cm, respectively, and the variation in the relative soil moisture of farmland variation was different to that in spring. In 1992–2001, the relative soil moisture of farmland fluctuated and had an overall downward trend. In 2001–2007, the relative soil moisture of farmland showed a strong increasing trend, and a downward trend was observed in 2007–2011. In autumn, unlike in spring and summer, the tendency rates of the relative soil moisture of farmland were 0.12, −0.16, and −0.23% yr−1 at depths of 10, 20, and 50 cm, respectively. The relative soil moisture increased slightly at a depth of 10 cm and increased significantly at depths of 20 and 50 cm. During 1999–2000, the relative soil moisture of farmland experienced large fluctuations, while after 2000, it was stable at around 65%. In winter, the variation rates of the relative soil moisture of farmland were −0.41%, 0.44%, and 0.58% yr−1 at depths of 10, 20, and 50 cm, respectively. The relative soil moisture of farmland at a depth of 10 cm showed a downward trend, increasing in volatility in 1992–2005, and then showed a downward trend in 2006–2012. The relative soil moisture of farmland at depths of 20 and 50 cm showed an overall upward trend, increasing in volatility in 1992–2005 and showing a downward trend in 2006–2012. In winter, autumn, summer, and spring, the overall tendency rates of the relative soil moisture of farmland were 0.20%, −0.09%, 0.32%, and 0.29% yr−1, respectively. Relative soil moisture increased in summer, spring, and winter, and decreased in autumn. In spring and summer, the increasing trend was more obvious, and the increase was larger in shallow soil than in deep soil. In autumn and winter, the variation of the relative soil moisture of farmland was larger in deep soil than in shallow soil.
The inter-decadal variability of the relative soil moisture of farmland was less complex than the inter-annual variability (Figure 4), indicating that the relative soil moisture variation in the inland river basin will show more obvious variation over a longer timescale. Over a shorter timescale, the relative soil moisture was sensitive to changes in external conditions. In winter and autumn, in the same study region, the relative soil moisture at different depths showed different trends.
3.3. Intra-Year Variation of Relative Soil Moisture
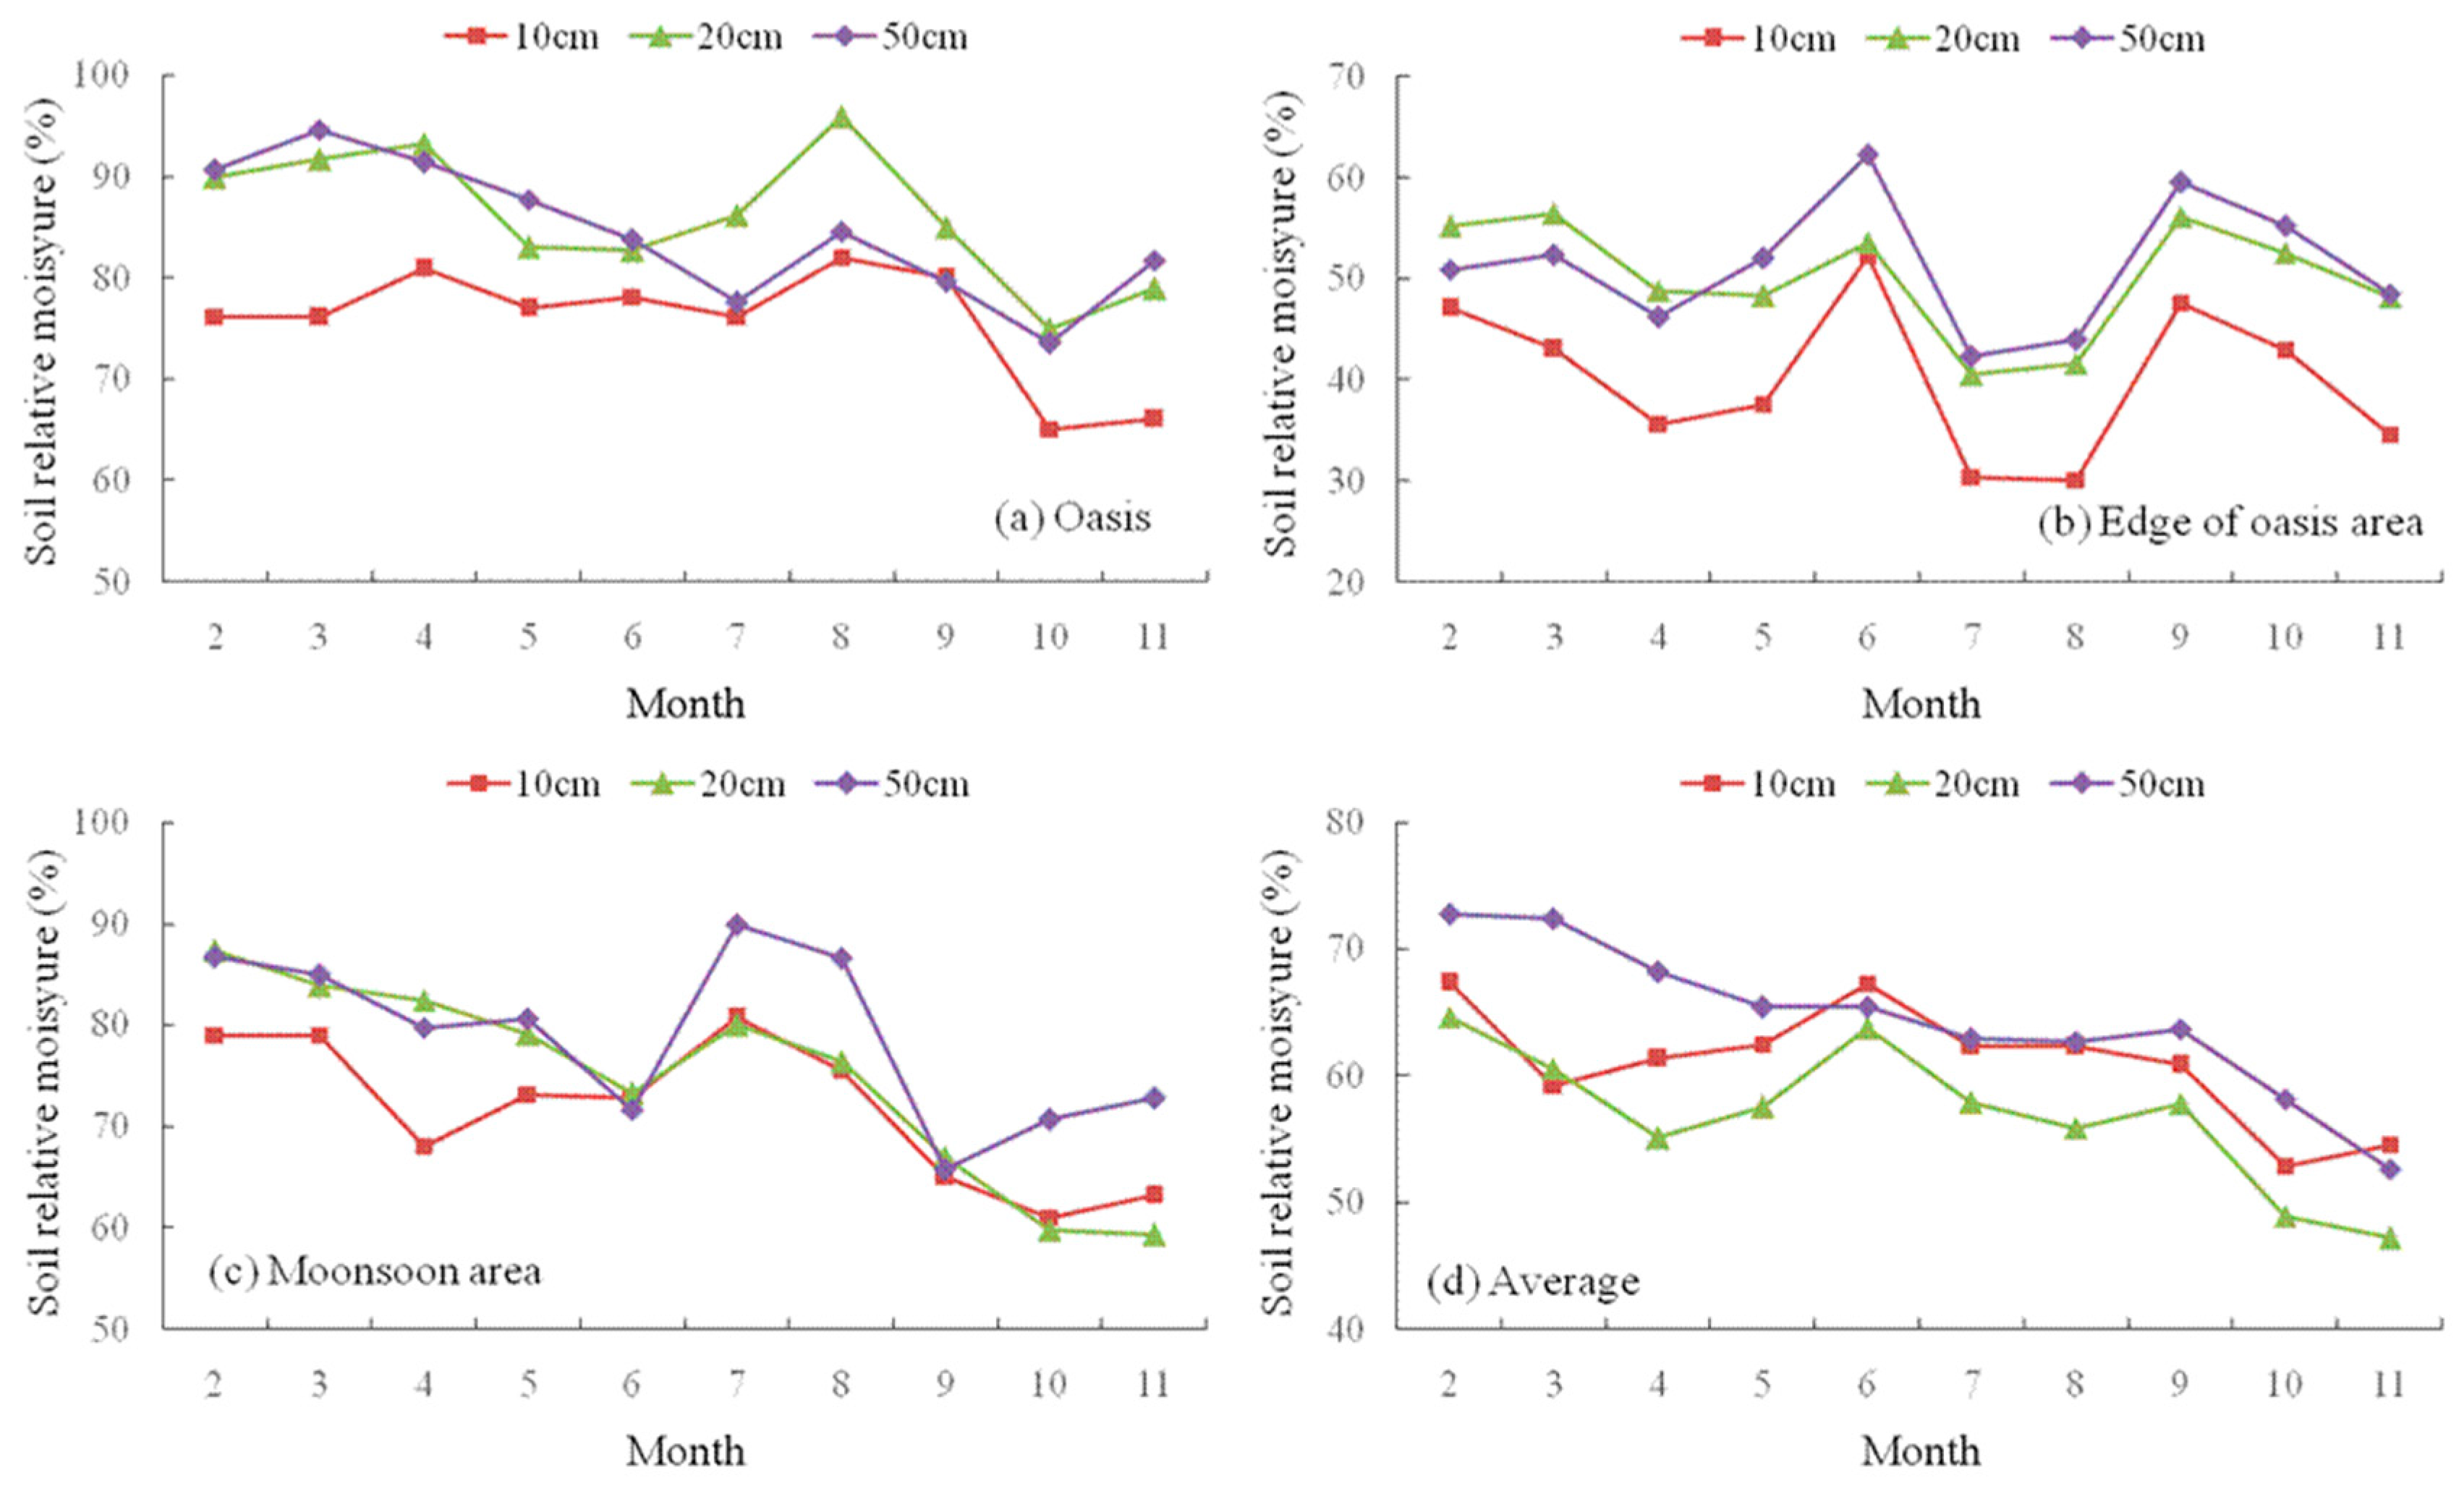
The intra-year variation of relative soil moisture of farmland ranged from 31–94.5% (Figure 5). The maximum value was in the oasis region at a depth of 20 cm (Figure 5a) and the minimum value was at the edge of the oasis region at a depth of 10 cm (Figure 5b). The relative soil moisture of farmland for different seasons was, in ascending order, autumn < summer < spring, and the relative soil moisture of farmland at different depths was, in ascending order, 10 cm < 20 cm < 50 cm. With increasing soil depth, the relative soil moisture of farmland increased significantly and the fluctuation decreased. In summer, the southeastern monsoon arrived at the edge of the monsoon area, leading to an increase in precipitation. In spring, meltwater greatly increased the relative soil moisture of farmland. Precipitation was low in early summer and gradually increased afterward. Evaporation was strongest during the summer, which resulted in the low relative soil moisture of farmland. For inland rivers in the Gobi Desert, the seasonal fluctuations of the relative soil moisture of farmland were more volatile, and the relative soil moisture of farmland was significantly lower in autumn than in spring and summer; the reason for this was that meltwater from snow cover and permafrost infiltrated into the soil in spring and there was little precipitation in summer. However, due to the temperature rise in summer, strong evaporation continued, which resulted in the lowest relative soil moisture of farmland values appearing in autumn in the inland rivers. Around August, the relative soil moisture of farmland was high, precipitation was high, and evaporation had declined. Different soil depths basically showed the same trends, and relative soil moisture was significantly larger in deep soil than in shallow soil. After March, the relative soil moisture of farmland gradually increased in mountainous areas of inland river basins; it was high in May and relatively low in June. The relative soil moisture of farmland changed greatly at a depth of 10 cm and changed little at depths of 20 and 50 cm. In the northwestern interior regions, there are large mountains where many glaciers are distributed, and snowmelt runoff flows in the foothills. With the temperature rise in spring, snow and ice ablation and the melting of seasonal permafrost began, which caused water to infiltrate into the soil and the relative soil moisture of farmland to gradually increase. Around June, ice and snow melt, precipitation does not reach the highest value during the year, and evaporation increases significantly, which caused the relative soil moisture of farmland to significantly reduce. From July to early September, the relative soil moisture was mainly from precipitation, while after September, as precipitation decreased, relative soil moisture of farmland significantly reduced.
The seasonal variations of the relative soil moisture of farmland had spatial and temporal differences in inland river basins. The relative soil moisture of farmland increased in spring, was stable in summer, and declined in autumn, indicating that relative soil moisture in inland river basins was mainly affected by glacier and snow meltwater and precipitation. In spring, the melting of ice and snow caused the relative soil moisture of farmland to gradually increase, while in summer, precipitation maintained the relative soil moisture of farmland at a stable level. From a spatial perspective, the relative soil moisture of farmland in the foothills and monsoonal marginal zone was much higher than that in the Gobi Desert. Fluctuations of the relative soil moisture of farmland were weaker in deep soil than shallow soil throughout the year, suggesting that the relative soil moisture of farmland in shallow soil was more sensitive to the impact of the external environment than that in deep soil.
4. Discussion
4.1. Influence of Meteorological Factors on Relative Soil Moisture Content
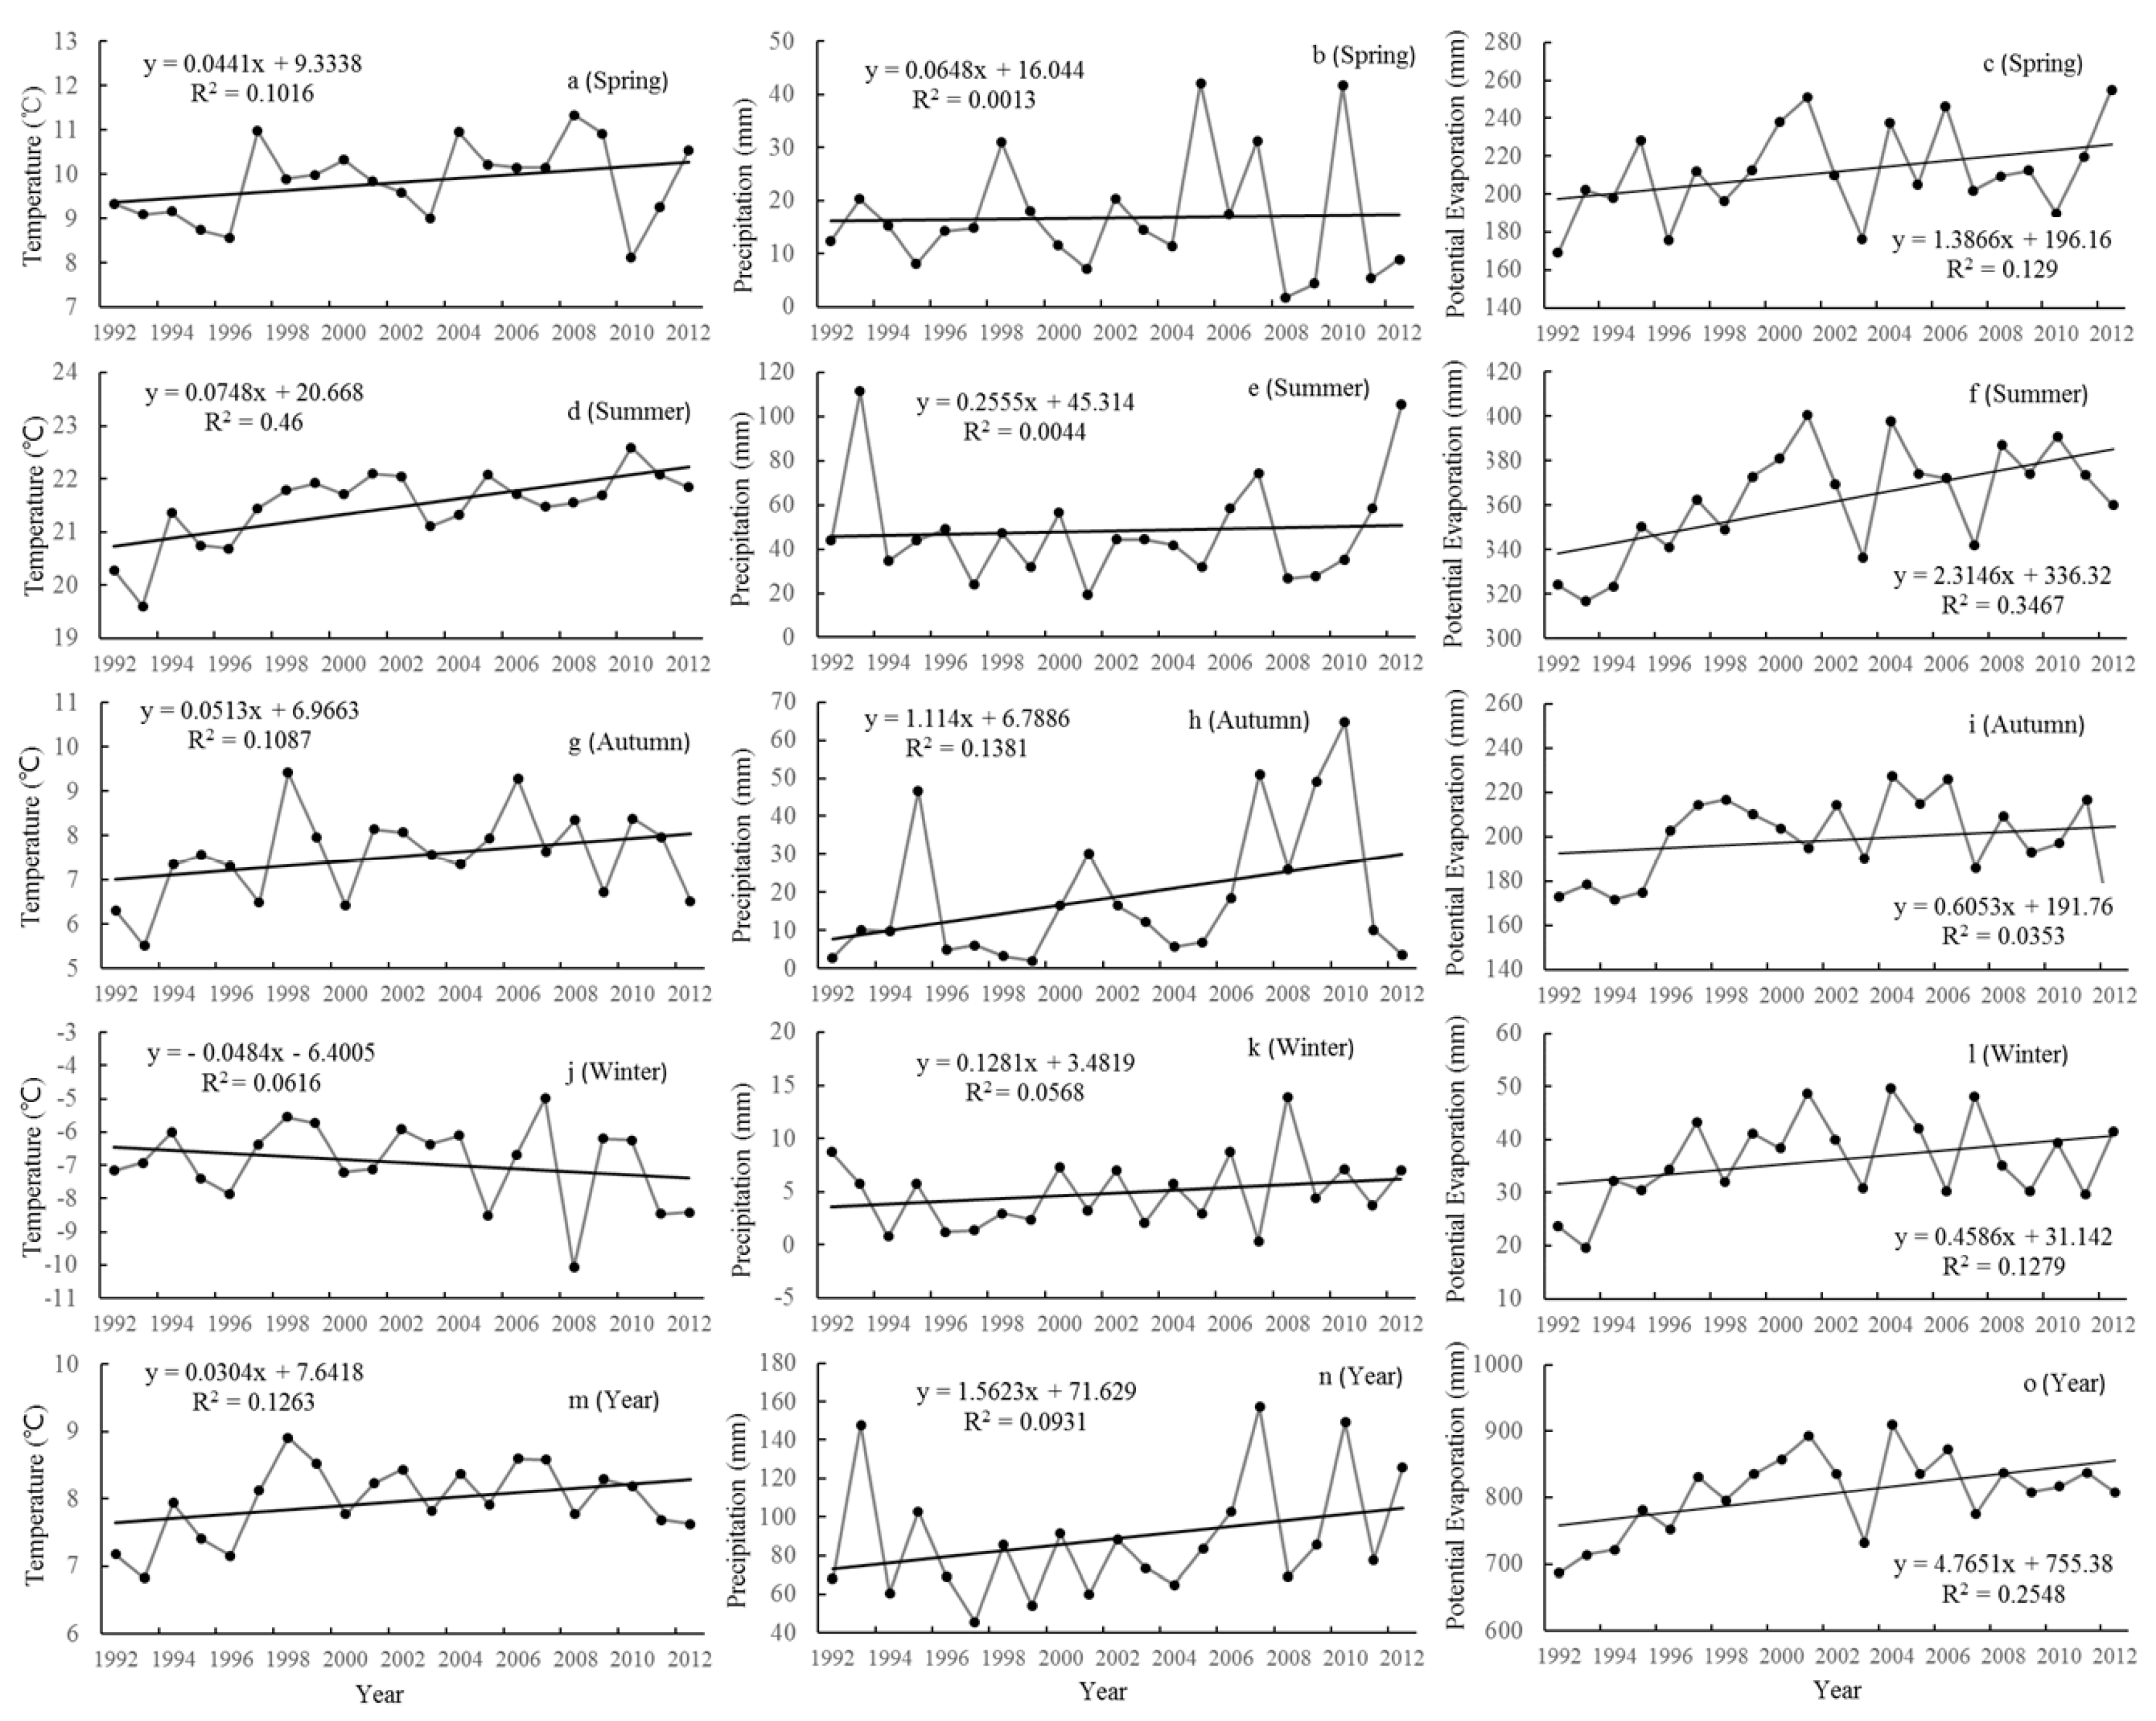
We selected six meteorological factors to study the effects of meteorological factors on the relative moisture content of farmland soil (Table 3). The results show that, in spring, there was a strong positive correlation between precipitation, potential evapotranspiration, temperature, and the relative soil moisture of farmland (Table 3). The largest inter-annual increase in the relative soil moisture of farmland occurred in spring (Figure 4), with an increase rate of 0.29% yr−1; additionally, in spring, the temperature and precipitation increased at a rate of 0.078% yr−1 and 0.917% yr−1, respectively (Figure 6). The main reasons for the increase in relative soil moisture of farmland in spring were: (1) the temperature rise produced meltwater, which caused the relative soil moisture increase; and (2) precipitation increased in this season. In summer (Figure 4), the relative soil moisture of farmland clearly increased (0.321 mm yr−1) and the correlation between climatic factors and relative soil moisture of farmland was low. In summer, in the past 18 years, precipitation decreased at a rate of −0.899 mm yr−1 (Figure 6), and temperature and potential evaporation increased. In theory, meteorological factors caused the relative soil moisture of farmland to decrease in summer; however, the temperature rise accelerated the melting of snow and ice, and thus increased the relative soil moisture.
In 1992–2012, the wind speed showed a downward trend (−0.013 m yr−1). The decrease of wind speed hindered the evaporation of soil water, which in turn caused the relative soil moisture of farmland to increase. In autumn (Table 2; Figure 4), the relative soil moisture of farmland showed a downward trend (−0.130 mm yr−1). Precipitation, temperature, and relative humidity were positively correlated with the relative soil moisture of farmland. In autumn, the temperature gradually rose between 1992 and 2012 (0.052 °C yr−1) (Figure 6), precipitation showed a decreasing trend (−0.238 mm yr−1), potential evaporation showed an increasing trend (2.699 mm yr−1) (Figure 6). The precipitation decrease and potential evaporation increase counteracted the contribution of meltwater to relative soil moisture, meaning that the relative soil moisture showed an overall downward trend. In winter (Table 2, Figure 4), the increase in the relative soil moisture was small, and precipitation, temperature, and potential evaporation showed increasing trends of 0.032 °C yr−1, 0.148 mm yr−1, and 0.355 mm yr−1, respectively (Figure 6), which indicates that the increase in precipitation was a major factor behind the increase in the relative soil moisture in winter. In winter, the relative soil moisture at a depth of 10 cm showed a decreasing trend, while that at depths of 20 and 50 cm, it showed an increasing trend; this was due to the fact that the increase in evaporation and wind speed could only affect the surface relative soil moisture in winter, whereas permafrost was hardly affected. Over the whole year, temperature and potential evaporation showed increasing trends of 0.059 °C yr−1 and 2.159 mm yr−1, respectively, while precipitation showed a decreasing trend of −0.072 mm yr−1 (Figure 6). In theory, the main reason for the decrease of relative soil moisture of farmland was the decrease in precipitation and the increase in potential evapotranspiration and temperature. However, the relative soil moisture in the inland river basin generally showed an increasing trend between 1992 and 2012. This was due to the fact that since 1980, the temperature increase had caused a great increase in glacial melting and runoff, and consequently, also an increase in relative soil moisture levels [26]. Under these conditions, increasing temperature caused the relative soil moisture to increase, and meltwater runoff counteracted the decrease in relative soil moisture caused by the decrease in precipitation and the increase in potential evaporation, causing an overall upward trend in relative soil moisture.
4.2. Influence of Glacial Changes on Relative Soil Moisture
Chinese river basins can be roughly divided into the Hexi interior river basin, Qaidam basin, Tarim basin, Junggar basin, Khovd River Basin, and Turpan-Ham basin. As the glacier water resources occupied a very large proportion of the total water resources in this area, glaciers and climate change have an obvious impact on this region [27,28]. A total of 22,086 glaciers are distributed in this area, covering a total area of 27,922 km2 with 2814 km3 ice reserved. Most of these are sub-continental glaciers; however, polar continental glaciers are also distributed in this area [28].
Rivers were divided into different basins using a digital elevation model (DEM) with a 30-m resolution using the ArcGIS software (Environmental Systems Research Institute, USA). In the interior river region where glaciers are distributed, the relative soil moisture of farmland was 65.85%, and its change rate was 0.61% yr−1. In the interior river region without glaciers, the relative soil moisture of farmland was 63.07%, and its change rate was 0.4% yr−1. There was no clear difference in the relative soil moisture of farmland between the region with glaciers and that without glaciers; however, between 1992 and 2012, the increasing trend of relative soil moisture in the region with glaciers was significantly higher than that in the region without glaciers. Due to the temperature rise, the runoff and relative soil moisture showed an upward trend between 1992 and 2012. Many observations and studies have confirmed that over the past 50 years, the glaciers of the interior river basin have been melting at an increasing rate (Table 4). Between 1960 and 2012, the area of glaciers in the region reduced by 12,481 km2, accounting for 38% of the total glacier area in the region; most of this reduction has taken place since the end of the 1980s, when the global climate experienced a transition [29].
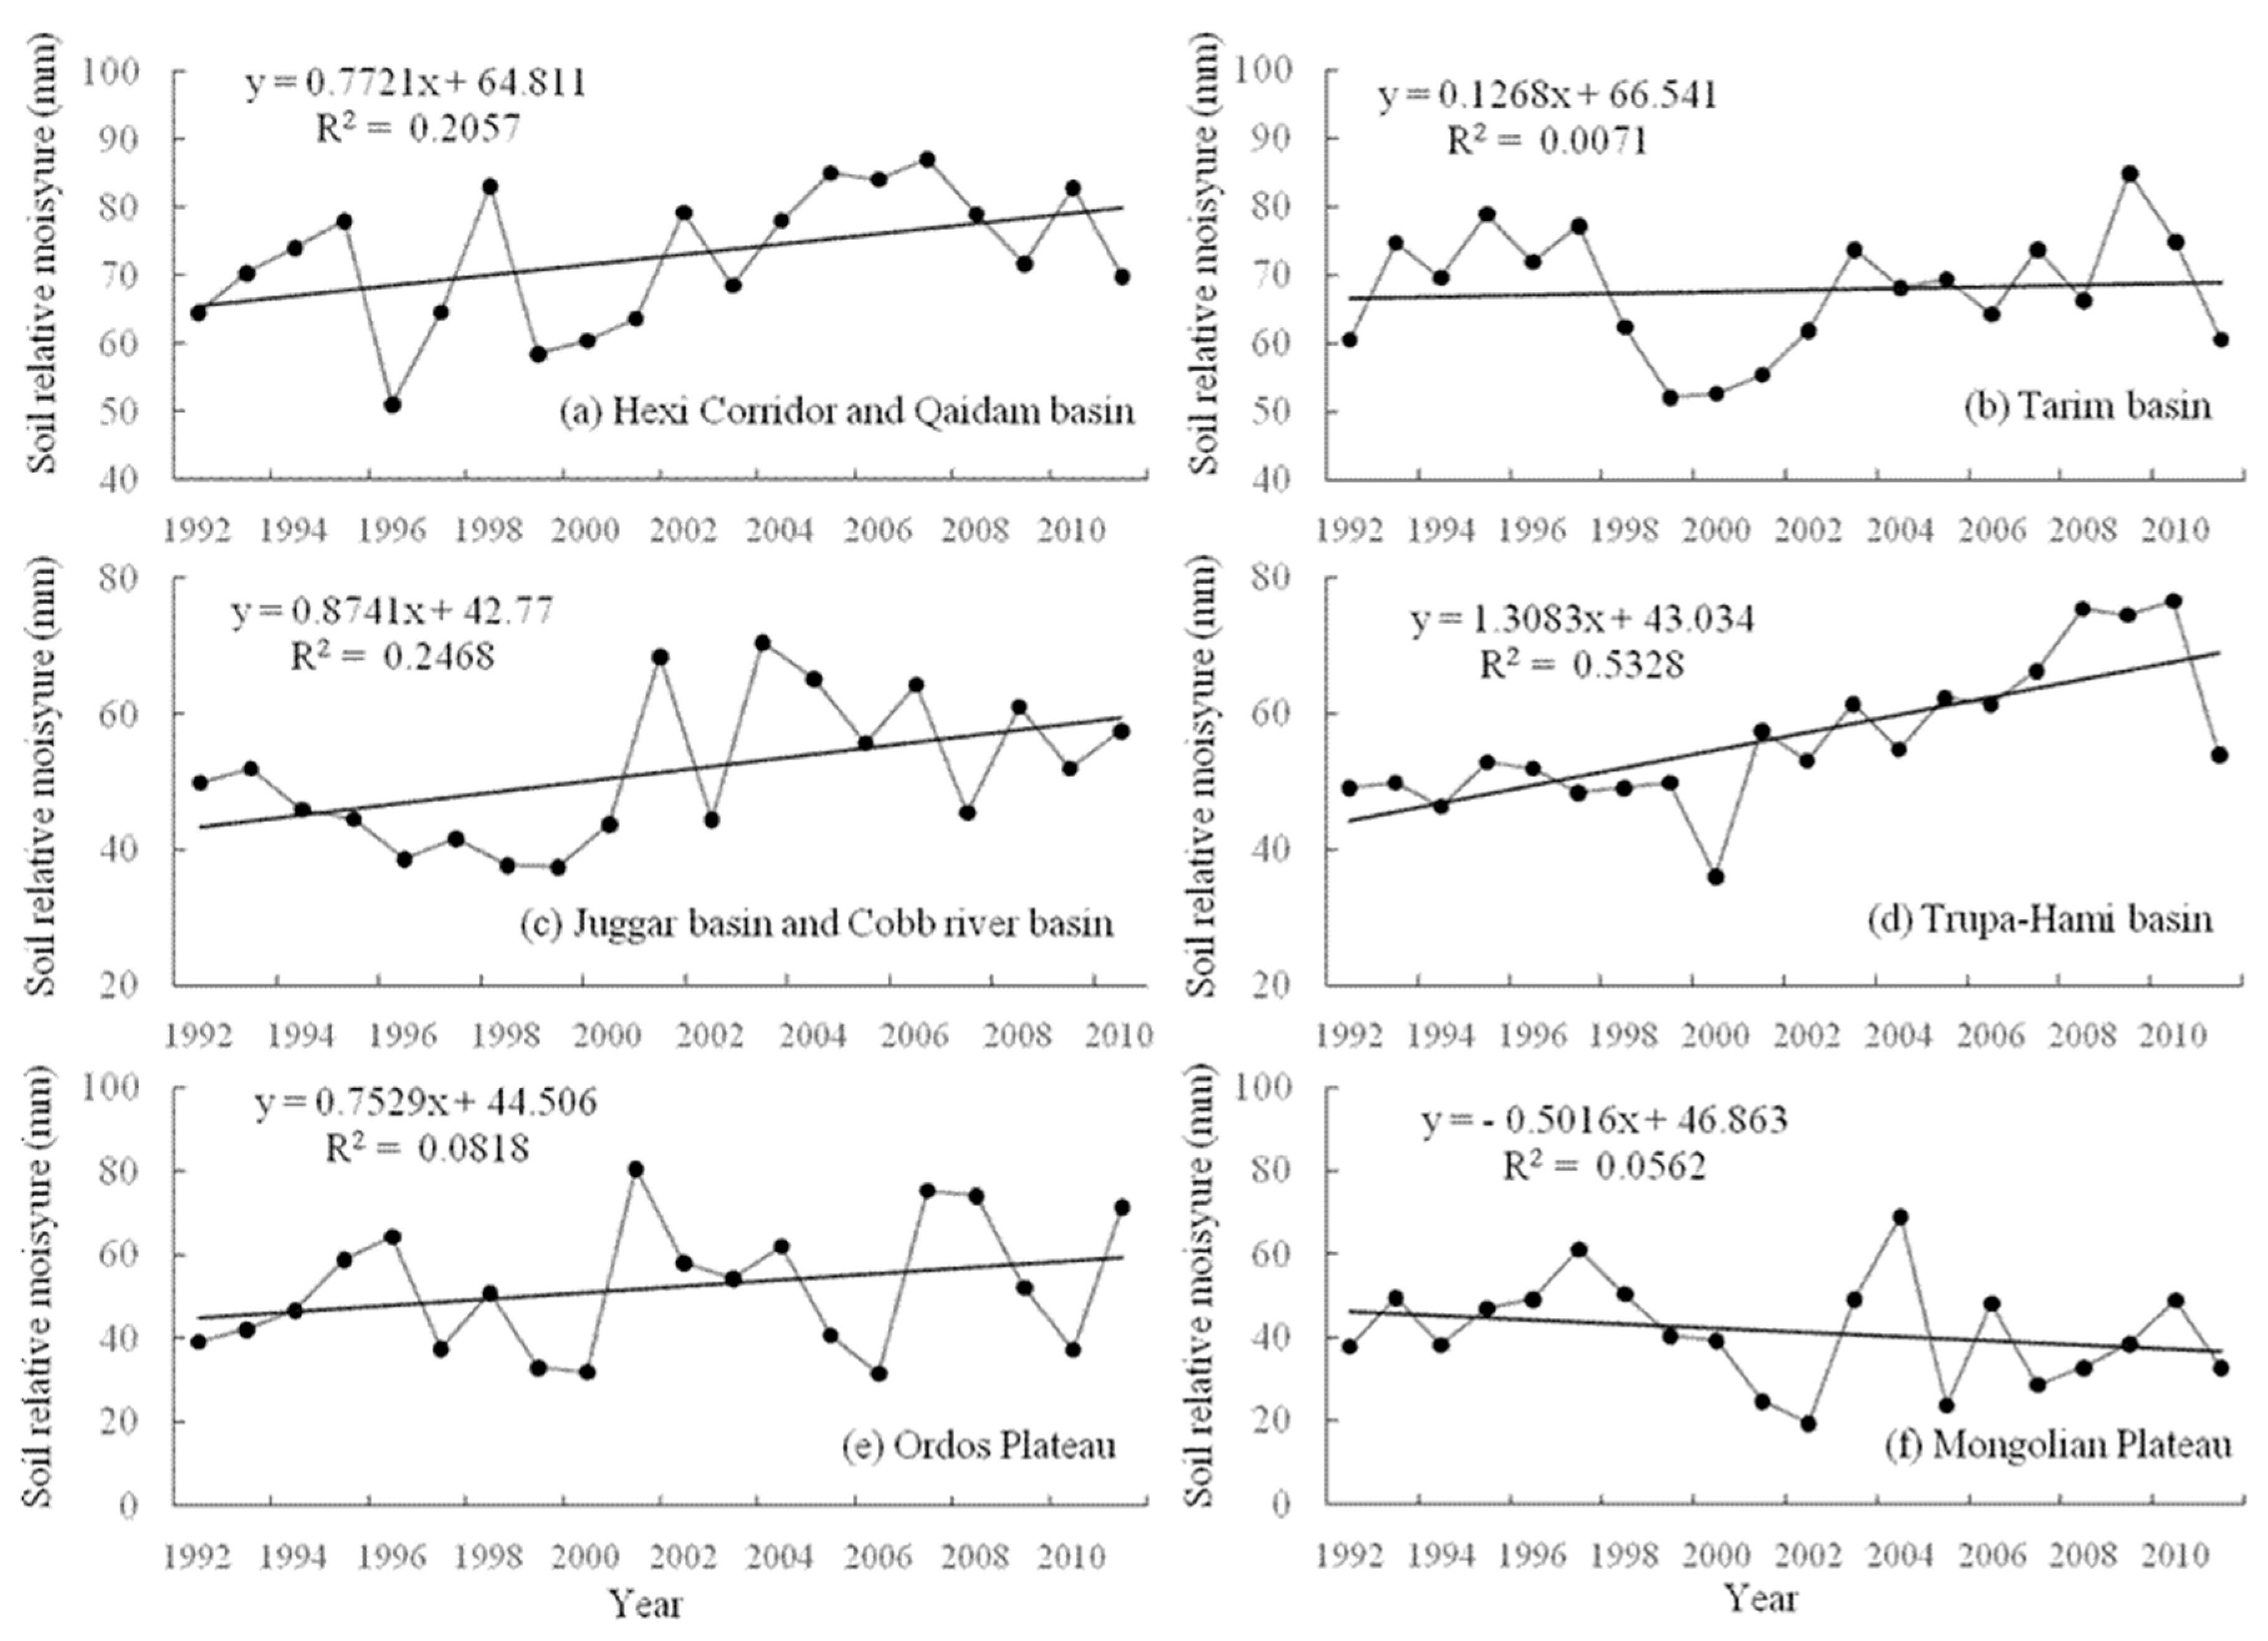
In the Hexi Corridor and the Qaidam basin, the relative soil moisture increased significantly between 1992 and 2012 (Figure 7a). In the Qilian Mountains, observational records show that glaciers retreated by an average of 22.4% over the past 50 years, while observational records also show that the runoff of most rivers showed an increasing trend during the same period [21,23]. The glacier in the Tarim area was small and retreated by a large amount over the past 50 years (Figure 7b), while relative soil moisture in this region showed a clear upward trend. Glacier retreat and relative soil moisture increase in the Junggar basin and Khovd River Basin were the lowest in the interior river basin (Figure 7c), with rates of 14.1 and 0.26% yr−1 respectively. The variation of the relative soil moisture of farmland in the Turpan-Hami Basin was high (Figure 7d). Over the past 50 years, in the Turpan-Hami Basin, glacier retreat and relative soil moisture increase were the highest in the study area, with values of 62.6% and 1.13% yr−1, respectively. In 1992–2012, there was only seasonal snow and no glaciers in the Mongolian Plateau and Ordos Plateau, and the relative soil moisture showed a relatively small increase.
4.3. Characteristics of Changes in Relative Soil Moisture Content
During 1992–2011, the relative soil moisture of farmland showed a statistically significant increase in the inland river basin (Figure 4). The results are consistent with previous studies [10,30]. The spatial distribution of the relative soil moisture was not uniform in this region, with significant differences being observed (Figure 2 and Figure 3). The spatial distribution of the increase rate of relative soil moisture indicates that the terrain had a significant influence on relative soil moisture; the variation rate of the relative soil moisture of farmland varied along the meridional direction. The distribution of climatic factors, such as temperature, precipitation, and wind speed, was greatly affected by the typical mountains–basin–plateau terrain in the inland river basin, and this distribution influenced the spatial distribution of the relative soil moisture of farmland in this region as well. The distribution of the relative soil moisture of farmland was not continuous under the unique alternating mountain–basin distribution pattern; the relative soil moisture was high at the edge of the basin and low in the center of the basin and plateau. This effect was clearly observed in the inland river area in the Mongolian Plateau and the Ordos Plateau.
There were significant spatiotemporal differences in the variation of relative soil moisture of farmland in inland rivers; relative soil moisture of farmland increased in spring, was stable in summer, and decreased in autumn (Figure 5). In spring, ice and snow melt caused the relative soil moisture to gradually increase, while in summer, precipitation maintained the relative soil moisture of farmland at a stable level. The relative soil moisture in the foothills and monsoonal marginal zone was much higher than in the Gobi Desert area (Figure 7). The relative soil moisture of deep soil was higher than that of shallow soil. The results are consistent with those of Zhang et al. [7]. Fluctuations in deep soil were smaller than those in shallow soil; this can be attributed to the fact that, compared to deep soil, the relative moisture in shallow soil was more sensitive to the impact of the external environment.
5. Conclusions
From 1992 to 2012, the average annual relative soil moisture of farmland in inland river basins ranged from 62.5% to 86.1%, and the relative soil moisture content of farmland was different in different basins; the relative soil moisture of farmland was high in the marginal areas of basins and low in the central areas of basins and the plateau areas. The relative soil moisture of farmland was high in the Tarim Basin and the Hexi Corridor, both of which are located in the northern Tianshan Mountains and the southern and northern Qilian Mountains, and was low from the northern Altun Mountains to Lop Nor, the Turpan Depression, and the southern Tarbagatai Mountains. The moisture in deep soil was clearly higher than that in shallow soil. From 1992 to 2012, the annual average relative soil moisture of farmland in the continental river basin showed an increasing trend, with a growth rate of 0.57% yr−1. The variation of relative soil moisture of farmland was different in different river basins; the relative soil moisture of farmland showed a decreasing trend in the Mongolian Plateau and an increasing trend in other basin areas.
The relative soil moisture of farmland increased significantly in summer and spring, increased in winter, and decreased in autumn. In winter and autumn, the variation of the relative soil moisture of farmland was larger in deep soil than in shallow soil.
Relative soil moisture of farmland remained high from May to October, remained low from November to April, increased from April, and decreased from November.
The change in relative soil moisture of farmland resulted from a combination of climatic factors such as precipitation and temperature, as well as topography and glacier meltwater. The reasons for the change in the relative soil moisture of farmland were different in different seasons. Overall, based on the increase in potential evaporation and the decrease in precipitation, the main reason for the increase in relative soil moisture of farmland was the increase in the amount of meltwater caused by the increase in temperature. From 1992 to 2012, the growth trend of relative soil moisture of farmland in glacial areas was clearly higher than that in non-glacial areas.
Author Contributions
Data curation, G.Z.; Formal analysis, H.P.; Funding acquisition, G.Z.; Investigation, H.P.; Methodology, J.Z.; Software, M.H. and Q.L.; Writing-original draft, G.Z.; Writing-review & editing, G.Z., J.Z. and Q.L.
Funding
This research was funded by the National Natural Science Foundation of China (grant numbers 41761047, 41661005, 41867030, 41971036and 41861040), and the Chinese Postdoctoral Science Foundation (2016T90961, 2015M570864).
Acknowledgments
We would like to thank the colleagues in the Northwest Normal University for their help in the writing process. We are grateful to anonymous reviewers and editorial staff for their constructive and helpful suggestions. We gratefully acknowledge the China Meteorological Bureau National Climatic Data Center provision of the meteorological station observation Data.
Conflicts of Interest
The authors declare no conflict of interest.
References
- Richard, M.; Petrone, J.S.; Price, S.K.; Waddington, J.J. Statistical Characterization of the Spatial Variability of Soil Moisture in a Cutover Peatland. Hydrol. Process. 2004, 18, 41–52. [Google Scholar]
- Etin, J.K.; Robock, A.; Vinnikov, K.Y.; Hollinger, S.E.; Liu, S.X.; Namkhai, A. Temporal and Spatial Scales of Observed Soil Moisture Variation in the Extratropics. J. Geophys. Res. 2000, 105, 865–877. [Google Scholar]
- Thornthwaite, C.W. The Water Balance in Tropical Climates. Bull. Am. Meteorol. Soc. 1951, 32, 166–173. [Google Scholar] [CrossRef]
- Verstraeten, W.W.; Veroustraete, F.; Sande, C.J.; Grootaers, L.; Feyen, J. Soil Moisture Retrieval Using Thermal Inertia, Determined with Visible and Thermal Spaceborne Data, Validated for European Forests. Remote Sens. Environ. 2006, 101, 299–314. [Google Scholar] [CrossRef]
- Zhao, W.J.; Li, X.P.; Fan, Y.W.; Yu, W.; Tang, X.F. Spatial-Temporal Stability Distribution Characteristics of Soil Moisture in Gravel-Sand Mulched Field in Northwestern Arid Area. Trans. Chin. Soc. Agric. Eng. 2015, 31, 144–151. [Google Scholar] [CrossRef]
- Yu, J.H.; Liu, X.S.; Luo, T.X.; Zhang, L. Seasonal Variations of Soil Temperature and Moisture at the Upper Limit of Alpine Meadow in North-facing Slope of the Nianqingtanggula Mountains. Acta Geogr. Sin. 2012, 67, 1246–1254. [Google Scholar] [CrossRef]
- Zhang, L.; Lu, H.Q.; Wang, L.Y.; Yang, B.Y. Spatial-Temporal Characteristics of Soil Moisture in China. Acta Geogr. Sin. 2016, 71, 1495–1508. [Google Scholar] [CrossRef]
- Pangaluru, K.; Velicogna, I.; Geruo, A.; Mohajerani, Y.; Ciracì, E.; Charakola, S.; Basha, G.; Rao, S.V.B. Soil Moisture Variability in India: Relationship of Land Surface–Atmosphere Fields Using Maximum Covariance Analysis. Remote Sens. 2019, 11, 335. [Google Scholar] [CrossRef]
- Pan, Y.X.; Wang, X.P.; Jia, R.L.; Chen, Y.W.; He, M.Z. Spatial Variability of Surface Soil Moisture Content in a Re-Vegetated Desert Area in Shapotou, Northern China. J. Arid Environ. 2008, 72, 1675–1683. [Google Scholar] [CrossRef]
- Zhu, G.F.; Pan, H.X.; Zhang, Y.; Guo, H.W.; Yong, L.L.; Wan, Q.Z.; Ma, H.Y.; Li, S. Relative Soil Moisture in China’s Farmland. J. Geogr. Sci. 2019, 29, 334–350. [Google Scholar] [CrossRef]
- Zhou, Q.W.; Sun, Z.Y.; Liu, X.L.; Wei, X.C.; Peng, Z.; Yue, C.W.; Luo, Y.X. Temporal Soil Moisture Variations in Different Vegetation Cover Types in Karst Areas of Southwest China: A Plot Scale Case Study. Water 2019, 11, 1423. [Google Scholar] [CrossRef]
- Zhu, G.F.; Shi, P.J.; Pu, T.; He, Y.Q.; Zhang, T.; Wang, P.Z.; Pan, M.H. Changes of Surface Soil Relative Moisture Content in Hengduan Mountains, China, During 1992–2010. Quat. Int. 2013, 298, 161–170. [Google Scholar] [CrossRef]
- Chen, S.D.; She, D.X.; Zhang, L.P.; Guo, M.Y.; Liu, X. Spatial Downscaling Methods of Soil Moisture Based on Multisource Remote Sensing Data and Its Application. Water 2019, 11, 1401. [Google Scholar] [CrossRef]
- Wang, Z.Y.; Ding, Y.H.; He, J.H. An Updating Analysis of the Climate Change in China in Recent 50 Years. Acta Meteorol. Sin. 2004, 62, 228–236. [Google Scholar]
- IPCC. Climate Change 2013: The Physical Science Basis, Summary for Policymakers, Contribution of WGI to the Fifth Assessment Report of the Intergovernmental Panel on Climate Change; Cambridge University Press: Cambridge, UK; New York, NY, USA, 2013. [Google Scholar]
- IPCC. Climate Change 2007: The Physical Science Basis, Summary for Policymakers; IPCC WGI Fourth Report; IPCC: Paris, France, 2007. [Google Scholar]
- Chen, B.; Ding, Y.G.; Liu, J.M. The Soil Humidity Predition Model Experiment Research of the Climatic Humid Zone. Scientia. Meteorologica. Sinica 2005, 25, 231–237. [Google Scholar]
- Xu, Y.; Chen, Y.X.; Wang, J.S.; Liu, Q.M. Using Indicator Kriging to Analyze and Evaluate Spatial Distributions of Soil Water and Salt in Field. Adv. Water Sci. 2006, 17, 477–482. [Google Scholar]
- Wang, S.P.; Zhang, J.; Song, L.C.; Li, Y.H.; Feng, J.Y.; Wang, J.S. Relationship Between Soil Relative Humidity and the Multiscale Meteorological Drought Indexes. J. Glaciol. Geocryol. 2013, 34, 865–873. [Google Scholar] [CrossRef]
- Wang, H.Y. Food Security from a Non-Traditional Perspective; Minzu University of China: Beijing, China, 2013. [Google Scholar]
- Zhou, J.J.; Li, Q.Q.; Wang, L.Y.; Lei, L.; Huang, M.H.; Xiang, J.; Feng, W.; Zhao, Y.R.; Xue, D.X.; Liu, C.F.; et al. Impact of Climate Change and Land-Use on the Propagation from Meteorological Drought to Hydrological Drought in the Eastern Qilian Mountains. Water 2019, 11, 1602. [Google Scholar] [CrossRef]
- Zhu, G.F.; Yang, L.; Qin, D.H.; Tong, H.l.; Liu, Y.F.; Li, J.F. Spatial and Temporal Variation of Drought Index in a Typical Steep Alpine Terrain in Hengduan Mountains. J. Mt. Sci. 2016, 13, 1186–1199. [Google Scholar] [CrossRef]
- Hamed, K.H. Exact Tistribution of the Mann-Kendall Trend Test Statistic for Persistent Data. J. Hydrol. 2009, 365, 86–94. [Google Scholar] [CrossRef]
- Liu, M.; Shen, Y.J.; Zeng, Y.; Liu, C.M. Changing Trend of Pan Evaporation and Its Cause over the Past 50 Years in China. Acta Geogr. Sin. 2009, 64, 259–269. [Google Scholar] [CrossRef]
- Yamamoto, J.K. Correcting the Smooth Effect of Ordinary Kriging Estimates. Math. Geol. 2005, 37, 69–94. [Google Scholar] [CrossRef]
- Yao, J.Q.; Liu, Z.H.; Yang, Q.; Liu, Y.; Li, C.Z.; Hu, W.F. Temperature Variability and its Possible Causes in the Typical Basins of the Arid Central Asia in Recent 130 years. Acta Geogr. Sin. 2014, 69, 291–302. [Google Scholar] [CrossRef]
- Shi, Y.F.; Liu, C.H.; Wang, Z.T. Short Glacier Invetory of China; Shanghai Popular Science Press: Shanghai, China, 2005. [Google Scholar]
- Shi, Y.F.; Shen, Y.P.; Li, D.L.; Zhang, G.W.; Ding, Y.J.; Hu, R.J.; Kang, E.S. Discussion on the Present Climate Change from Warm-Dry to Warm-Wet in Northwest China. Quat. Sci. 2003, 23, 152r164. [Google Scholar]
- Zhang, M.J.; Wang, S.J.; Li, Z.Q.; Wang, F.T. Glacier Area Shrinkage in China and its Climatic Background During the Past Half Century. J. Geogr. Sci. 2012, 22, 15–28. [Google Scholar] [CrossRef]
- Pan, H.X.; Zhu, G.F.; Zhang, Y.; Guo, H.W.; Yong, L.L.; Wan, Q.Z.; Ma, H.Y.; Li, S. Spatial and Temporal Variations of Relative Soil Moisture in China’s Farmland. Acta Geogr. Sin. 2019, 74, 117–130. [Google Scholar] [CrossRef]
Figure 1.
Spatial distribution of soil moisture recording stations in the continental river basin area.
Figure 1.
Spatial distribution of soil moisture recording stations in the continental river basin area.

Figure 2.
Interpolation of the annual relative soil moisture of farmland in inland river basin areas during 1992–2011.
Figure 2.
Interpolation of the annual relative soil moisture of farmland in inland river basin areas during 1992–2011.

Figure 3.
Mean relative soil moisture and the tendency interpolation in arid inland river basin areas during 1992–2011.
Figure 3.
Mean relative soil moisture and the tendency interpolation in arid inland river basin areas during 1992–2011.

Figure 4.
The variation of the relative soil moisture of farmland in arid inland river basin areas during 1992–2011.
Figure 4.
The variation of the relative soil moisture of farmland in arid inland river basin areas during 1992–2011.

Figure 5.
Seasonal variation of the relative soil moisture of farmland in the arid inland river basin areas.
Figure 5.
Seasonal variation of the relative soil moisture of farmland in the arid inland river basin areas.

Figure 6.
Variation of meteorological factors during 1992–2011 in arid inland river basin areas.

Figure 7.
Variation in relative soil moisture in different inland river basins.


Table 1.
Relative soil moisture measured at agrometeorological stations in a continental river basin area in China.
Table 1.
Relative soil moisture measured at agrometeorological stations in a continental river basin area in China.
| Station | Longitude (°E) | Latitude (°N) | Station | Longitude (°E) | Latitude (°N) |
|---|---|---|---|---|---|
| Aksu | 80.23 | 41.16 | Paotai | 85.25 | 44.85 |
| Altay | 88.08 | 47.73 | Pingluo | 106.50 | 38.91 |
| Bachu | 78.57 | 39.80 | Qitai | 89.57 | 44.02 |
| Bole | 82.06 | 44.90 | Ruoqiang | 88.17 | 39.03 |
| Changji | 87.43 | 44.01 | Shache | 77.27 | 38.43 |
| Delhi | 97.37 | 37.37 | Tacheng | 83.00 | 46.73 |
| Dulan | 98.10 | 36.30 | Turpan | 89.20 | 42.93 |
| Dunhuang | 94.68 | 40.15 | Wulawusu | 85.81 | 44.28 |
| Gaotai | 99.83 | 39.37 | Urumqi | 87.62 | 43.78 |
| Golmud | 94.90 | 36.42 | Wusu | 84.66 | 44.43 |
| Hami | 93.52 | 42.82 | Wuwei | 102.60 | 37.91 |
| Hetian | 79.93 | 37.13 | Xilinhaote | 116.10 | 43.95 |
| Jiuquan | 98.48 | 39.77 | Xianghuangqi | 113.80 | 42.25 |
| Kashi | 75.98 | 39.47 | Xinyuan | 83.30 | 43.45 |
| Korla | 86.13 | 41.75 | Yanchi | 107.40 | 37.78 |
| Minle | 100.80 | 38.45 | Yining | 81.33 | 43.95 |
| Minqing | 103.00 | 38.63 | Yongchang | 101.90 | 38.23 |
| Mosuowan | 86.10 | 45.02 | Zhangye | 100.40 | 38.93 |
| Nuomuhong | 96.41 | 36.43 | Zhaosu | 81.13 | 43.15 |
Table 2.
Spatial distribution of relative soil moisture (%) in a continental river oasis area during 1992–2011.
Table 2.
Spatial distribution of relative soil moisture (%) in a continental river oasis area during 1992–2011.
| Soil | Spring | Summer | Autumn | Winter | Year |
|---|---|---|---|---|---|
| Dry soil | 4.40 | 3.65 | 7.24 | 7.20 | 5.62 |
| 10 cm | 69.66 | 62.85 | 62.47 | 83.58 | 69.64 |
| 20 cm | 77.22 | 67.49 | 67.81 | 86.18 | 74.67 |
| 50 cm | 77.02 | 70.65 | 69.33 | 77.73 | 73.68 |
Table 3.
Correlation analysis between the relative soil moisture of farmland and meteorological factors.
Table 3.
Correlation analysis between the relative soil moisture of farmland and meteorological factors.
| Soil Moisture | Temperature | Precipitation | Potential Evaporation | Wind Speed | Relative Humidity | Sunshine Duration |
|---|---|---|---|---|---|---|
| Spring | 0.527(**) | 0.094 | 0.169 | 0.205 | 0.299 | −0.035 |
| Summer | 0.277 | 0.059 | 0.185 | −0.106 | 0.043 | −0.225 |
| Autumn | 0.020 | 0.203 | −0.405 | 0.461(*) | 0.002 | −0.182 |
| Winter | 0.222 | −0.029 | 0.205 | −0.131 | 0.160 | 0.137 |
| Annual | 0.319 | −0.280 | 0.0385 | 0.107 | 0.126 | −0.076 |
** p < 0.01; * p < 0.05.
Table 4.
Changes to glaciers and the relative soil moisture of farmland in inland river basins.
| Basin | Recession Ratio (%) | Recession Area (km2) | Time (Year) | Relative Soil Moisture of Farmland (%) | Tendency Rate (% yr−1) |
|---|---|---|---|---|---|
| Hexi Corridor and Qaidam Basin | 22.4 | 715 | 1950s–2003 | 71.70 | 0.77 |
| Tarim Basin | 56.8 | 11,290 | 1961–2006 | 62.33 | 0.13 |
| Junggar and Cobb River Basin | 14.1 | 318 | 1962–2006 | 70.29 | 0.87 |
| Turpa-Hami Basin | 62.6 | 158 | 1962–2000s | 59.09 | 1.31 |
| Mongolian Plateau | 47.02 | 0.72 | |||
| Ordos Plateau | 79.14 | −0.50 |
© 2019 by the authors. Licensee MDPI, Basel, Switzerland. This article is an open access article distributed under the terms and conditions of the Creative Commons Attribution (CC BY) license (http://creativecommons.org/licenses/by/4.0/).
Share and Cite
MDPI and ACS Style
Zhu, G.; Li, Q.; Pan, H.; Huang, M.; Zhou, J. Variation of the Relative Soil Moisture of Farmland in a Continental River Basin in China. Water 2019, 11, 1974. https://doi.org/10.3390/w11101974
AMA Style
Zhu G, Li Q, Pan H, Huang M, Zhou J. Variation of the Relative Soil Moisture of Farmland in a Continental River Basin in China. Water. 2019; 11(10):1974. https://doi.org/10.3390/w11101974
Chicago/Turabian StyleZhu, Guofeng, Qiaoqiao Li, Hanxiong Pan, Meihua Huang, and Junju Zhou. 2019. "Variation of the Relative Soil Moisture of Farmland in a Continental River Basin in China" Water 11, no. 10: 1974. https://doi.org/10.3390/w11101974
Note that from the first issue of 2016, this journal uses article numbers instead of page numbers. See further details here.