Article Text

Abstract
Background Our previous studies revealed a critical role of a novel CTLA4-protein kinase C-eta (PKCη) signaling axis in mediating the suppressive activity of regulatory T cells (Tregs) in antitumor immunity. These studies have employed adoptive transfer of germline PKCη-deficient (Prkch−/−) Tregs into Prkch+/+ mice prior to tumor implantation. Here, we extended these findings into a biologically and clinically more relevant context.
Methods We have analyzed the role of PKCη in antitumor immunity and the tumor microenvironment (TME) in intact tumor-bearing mice with Treg-specific or CD8+ T cell-specific Prkch deletion, including in a therapeutic model of combinatorial treatment. In addition to measuring tumor growth, we analyzed the phenotype and functional attributes of tumor-infiltrating immune cells, particularly Tregs and dendritic cells (DCs).
Results Using two models of mouse transplantable cancer and a genetically engineered autochthonous hepatocellular carcinoma (HCC) model, we found, first, that mice with Treg-specific Prkch deletion displayed a significantly reduced growth of B16–F10 melanoma and TRAMP-C1 adenocarcinoma tumors. Tumor growth reduction was associated with a less immunosuppressive TME, indicated by increased numbers and function of tumor-infiltrating CD8+ effector T cells and elevated expression of the costimulatory ligand CD86 on intratumoral DCs. In contrast, CD8+ T cell-specific Prkch deletion had no effect on tumor growth or the abundance and functionality of CD8+ effector T cells, consistent with findings that Prkch−/− CD8+ T cells proliferated normally in response to in vitro polyclonal or specific antigen stimulation. Similar beneficial antitumor effects were found in mice with germline or Treg-specific Prkch deletion that were induced to develop an autochthonous HCC. Lastly, using a therapeutic model, we found that monotherapies consisting of Treg-specific Prkch deletion or vaccination with irradiated Fms-like tyrosine kinase 3 ligand (Flt3L)-expressing B16–F10 tumor cells post-tumor implantation significantly delayed tumor growth. This effect was more pronounced in mice receiving a combination of the two immunotherapies.
Conclusion These findings demonstrate the potential utility of PKCη inhibition as a viable clinical approach to treat patients with cancer, especially when combined with adjuvant therapies.
- CD8-positive T lymphocytes
- combined modality therapy
- CTLA4 antigen
- melanoma
- tumor microenvironment
Data availability statement
Data are available in a public, open access repository. Data are available upon reasonable request. All data relevant to the study are included in the article or uploaded as supplementary information. Data are available on reasonable request.
This is an open access article distributed in accordance with the Creative Commons Attribution Non Commercial (CC BY-NC 4.0) license, which permits others to distribute, remix, adapt, build upon this work non-commercially, and license their derivative works on different terms, provided the original work is properly cited, appropriate credit is given, any changes made indicated, and the use is non-commercial. See http://creativecommons.org/licenses/by-nc/4.0/.
Statistics from Altmetric.com
Introduction
Recent advances and successes in cancer immunotherapy have resulted in its increasing use as a highly promising therapeutic strategy, based on its generally less toxic and more durable effects. In particular, regulatory T cells (Tregs), a subpopulation of CD4+Foxp3+ T cells that maintain immune homeostasis and prevent overactive, potentially pathological immune responses but mediate the undesired effect of suppressing antitumor immunity, have been extensively studied as a potential target for inhibition in order to promote tumor-specific immunity.1–3 For example, increased numbers of tumor-infiltrating Tregs are associated with poor prognosis in various patients with solid cancers, including prostate,4 breast,5 ovarian cancer,6 hepatocellular carcinoma (HCC),7 8 and melanoma.9 Antibodies (Abs) specific for the inhibitory receptor CTLA4, which is constitutively expressed on Tregs and is required for their ability to suppress antitumor immunity,10 11 have shown promising results, including complete tumor regression, in melanoma and other solid cancers,12 13 acting primarily by depleting intratumoral Tregs.14 Consequently, inhibition of Tregs represents an attractive strategy to enhance antitumor immunity. However, some current methods to deplete or inhibit Tregs in cancer, such as the use of anti-CD2515 or anti-CCR416 17 Abs, suffer from a lack of specificity and, in the case of anti-CTLA4 Abs, from undesirable immune-related adverse events (irAE).18 19
Our previous studies have reported a novel Treg-intrinsic signaling pathway consisting of a physical complex between CTLA4 and the enzyme protein kinase C-eta (PKCη), which is recruited to the immunological synapse of stimulated Tregs.20 21 This CTLA4–PKCη signaling pathway plays an important role in regulating the contact-dependent suppressive activity of human and mouse Tregs.20 22 Furthermore, the presence of PKCη-deficient (Prkch−/−) Tregs in the tumor microenvironment (TME) of tumor-bearing mice was associated with increased expression of the costimulatory ligand CD86 on the surface of dendritic cells (DCs),22 revealing the important role of this signaling pathway in the Treg-mediated depletion of CD86 from DCs via a process of transendocytosis, an established mechanism for the Treg inhibition of DC stimulatory function.23 24 Additionally, we demonstrated that the CTLA4–PKCη complex induced by Treg stimulation recruits a trimolecular complex (GPP complex) consisting of the ARF GTPase-activating protein-2 (GIT2), the p21-activated protein kinase 2 (PAK2), and the PAK-interacting guanine nucleotide exchange factor alpha (αPIX).20 22 This complex has been shown to promote focal adhesion disassembly and cell motility,25 including the disassembly of Treg–antigen presenting cell (APC) contacts. The relevance of this complex for the suppressive function of Tregs in antitumor immunity was demonstrated by our finding that GIT2-deficient Tregs mimicked the functional phenotype of Prkch−/− Tregs in that they also demonstrated defective contact-dependent suppressive activity in vitro and in vivo.22
In our previous studies, we have used Tregs purified from Prkch−/− mice, which were adoptively transferred into tumor-bearing recipient mice, to demonstrate that these Tregs have a severe defect in inhibiting antitumor responses and CD8+ T effector cell proliferation in the B16 melanoma model.20 22 Interestingly, this pathway was required for the Treg-mediated contact-dependent suppressive activity, but not required for Treg development, production of suppressive cytokines such as interleukin-10 (IL-10) and tumor growth factor-β, and Treg-mediated suppression of autoimmune colitis,20 an effect largely mediated by the suppressive cytokine IL-10.26 Furthermore, Prkch−/− mice did not display the severe lymphoproliferative, fatal early age disease20 that CTLA4-deficient mice display.27 28 Therefore, selective inhibition of CTLA4–PKCη pathway provides a potential therapeutic target for Treg inhibition with less toxic and autoimmune-related side effects.
In this report, we analyzed intact Prkch−/− mice, including mice with conditional Treg-specific or CD8-specific Prkch deletion, to investigate the impact of the CTLA4–PKCη signaling pathway on tumor growth, the TME, and antitumor immunity in three different solid tumor models, including B16–F10 melanoma, TRAMP-C1 prostate adenocarcinoma, and an autochthonous HCC. We also established and analyzed a therapeutic model, in which Prkch was selectively deleted from the Treg compartment after tumor implantation. Our findings further establish the significant therapeutic potential of inhibiting or deleting PKCη in Tregs in cancer immunotherapy in a manner likely associated with fewer irAE as compared with the clinical use of checkpoint blockade using anti-CTLA4 Abs.
Materials and methods
Mice
Foxp3-IRES-eGFP (FIG) C57BL/6 mice (B6.Cg-Foxp3tm2Tch/J, JAX #006772), Prkch−/− mice (B6.Cg-Prkchtm1.2Gasc/J, JAX #018988, backcrossed to a C57BL/6 background for at least five generations), and chicken ovalbumin (OVA)257-264-specific TCR transgenic OT-I mice (C57BL/6-Tg(TcraTcrb)1100Mjb/J, JAX #003831) were purchased from the Jackson Laboratories. To generate mice with a conditional Prkch deletion in Tregs or CD8+ cells, we crossed Prkchfl/fl mice (Knockout Mouse Phenotyping Program, Prkchtm1a(EUCOMM)Hmgu) with Foxp3-IRES-YFPCre mice (B6.129(Cg)-Foxp3tm4(YFP/icre)Ayr/J, JAX #016959) or with Cd8aCre mice (C57BL/6-Tg(Cd8a-cre)1Itan/J, JAX #008766), respectively. OT-I Prkch−/− mice were generated by crossing OT-I CD45.1+ mice (gift of Dr M von Herrath, La Jolla Institute for Immunology (LJI)) with Prkch−/− mice. For tamoxifen (TAM)-induced therapeutic models, Prkchfl/fl mice were crossed with Foxp3eGFP− ERT2Cre mice (Foxp3tm9(EGFP/cre/ERT2)Ayr/J, JAX #016961). All mice were maintained and housed in the LJI under specific pathogen-free conditions with controlled temperature and humidity. Animal experiments were performed with mice of 8–14 weeks old (male mice for TRAMP-C1 prostate carcinoma tumor model; female mice forHCC and B16–F10 melanoma tumor models) according to guidelines approved by the LJI Animal Care Committee.
Antibodies
Abs used in this study are listed in table 1. (I want to move Table 1 to the end of figures.)
Antibodies used in this study
Cell culture and tumor inoculation
B16–F10 and TRAMP-C1 tumor cell lines were obtained from American Type Culture Collection (ATCC). B16–F10 melanoma cells were cultured in Iscove’s modified Dulbecco’s medium (IMDM) containing 10% heat-inactivated fetal bovine serum (FBS), 2 mM glutamine, 1 mM sodium pyruvate, 1 mM Minimum Essential Medium (MEM) non-essential amino acids, and 100 U/mL each of penicillin and streptomycin (Life Technologies). TRAMP-C1 tumor cells were maintained in Dulbecco’s Modified Eagle’s Medium (DMEM) containing bovine insulin (5 µg/mL, Millipore Sigma), dehydroisoandrosterone (10 nM, Millipore Sigma), 10% heat-inactivated FBS, 2 mM glutamine, 1 mM sodium pyruvate, 1 mM MEM non-essential amino acids, and 100 U/mL each of penicillin and streptomycin. The B16 cell line expressing Fms-like tyrosine kinase 3 ligand (B16–Flt3L) (gift of Dr Stephen Schoenberger, LJI) were maintained in DMEM containing 8% heat-inactivated FBS, 2 mM glutamine, and 100 U/mL each of penicillin and streptomycin. All cell lines were maintained at 37°C under 5% CO2. Cells were harvested for injection by a brief incubation with 0.25% trypsin-EDTA (Gibco) followed by mechanical disruption. B16–F10 or TRAMP-C1 cells were inoculated intradermally or subcutaneously, respectively, on the left flank. Tumor length and width were measured three times a week using an electronic digital caliper to calculate tumor volume (mm3) using the following formula: width2×length×0.5. Tumor sizes were measured when tumors have reached a size of >2 mm.
B16–F10 tumor implantation and vaccination therapeutic model
Mice were implanted on the left flank with B16–F10 tumor cells (5×10⁵ cells, intradermal). On days 3, 6, and 9, the mice were injected with TAM (2 mg/mouse intraperitoneal, Sigma) to induce Treg-specific deletion of PKCη. On the same days, the mice were also vaccinated with 1×10⁶ irradiated (150 Gy) Flt3L-expressing B16 cells injected on the same flank ~1 cm from the site of the primary tumor, as described.29 Tumors were collected and weighed on day 15. Intratumoral immune cell isolation, intracellular staining (ICS), sample acquisition, and analysis were performed as described further.
Isolation of intratumoral immune cells and cytokine ICS
For B16–F10 melanoma, single-cell suspensions were prepared by cutting the tumors into small pieces, followed by digestion in RPMI-1640 medium containing TL Liberase (100 µg/mL, Roche) and DNase I (200 µg/mL, Sigma) for 25 min at 37°C. Digestion was quenched by adding 10 mL 10% FBS/RPMI-1640 medium and the cell suspension was passed through a 40 µm cell strainer. The suspension was centrifuged at 500×g with the high brake setting for 5 min at 4°C. The pellet was resuspended in 5 mL of 40% Percoll (GE Healthcare Life Sciences) in phosphate buffered saline (PBS) and was layered slowly above 5 mL of 80% Percoll in PBS. Samples were centrifuged at 325×g with the low brake setting for 23 min at room temperature (RT). After centrifugation, cells consisting mostly of leukocytes were collected at the interface between 40% and 80% Percoll, and passed through a 40 µm cell strainer again. The cell suspension was centrifuged at 500×g for 5 min at 4°C, and the pellet was incubated with 2 mL RBC lysis buffer for 5 min at RT. After quenching the RBC lysis buffer by adding 10 mL 10% FBS/RPMI-1640 medium, leukocytes were washed and resuspended in PBS before use. For TRAMP-C1 adenocarcinoma, tumors were cut into small pieces and dissociated into single-cell suspensions using the gentleMACS Octo Dissociator (Miltenyi-Biotec) and the mouse tumor dissociation kit (Miltenyi-Biotec) according to the manufacturer’s instructions. The cells were then surface stained for 15 min at RT using Zombie Aqua fixable viability kit (BioLegend) and labeled with Abs (table 1) for 30 min on ice, followed by fixation with Cytofix fixation buffer (BD Biosciences) for 35 min. For cytokine analysis on ex vivo restimulation, cells were plated in complete medium (RPMI-1640 supplemented with 10% FBS, 5 mM Hepes, pH 7.2–7.6, 100 mM non-essential amino acid, 1 mM sodium pyruvate, 100 U/mL each penicillin and streptomycin, 50 μM 2-mercaptoethanol, and 2 mM L-glutamine) and stimulated with phorbol 12-myristate 13-acetate (PMA, 50 ng/mL) plus ionomycin (1 µM) in the presence of GolgiStop (BD Biosciences, 1:1500) for 4 hours at 37°C. ICS was performed using the Cytofix/Cytoperm kit (BD Biosciences) at a 1:100 dilution of Abs (table 1). Samples were acquired on LSR-II cytometers (Becton Dickinson) and analyzed using FlowJo software (Tree Star).
CellTrace Violet (CTV) labeling and in vitro mouse CD8+ T-cell stimulation
CD8+ T cells were purified from spleen suspensions of wild-type (WT) or CD8-specific Prkch−/− mice using a mouse CD8+ T-cell isolation kit (Miltenyi-Biotec). To measure cell proliferation, purified CD8+ T cells were labeled with 2 µM CTV (Thermo Fisher Scientific) in prewarmed PBS at 37°C for 15 min under dark incubation. Labeling was stopped by adding FBS at 37°C for 5 min. Cells were washed twice with 5% FBS/PBS, and seeded at 1×10⁵ cells/well in 96-well flat-bottom plates. The cells were stimulated with the indicated concentrations of immobilized anti-CD3 and soluble anti-CD28 monoclonalAbs in complete medium for 3 days (d). To quantify antigen-specific CD8+ T-cell proliferation, irradiated (30 Gy) CD4+ and CD8+ T cell-depleted splenocytes (2×10⁵ cells) used as APCs were pulsed with the indicated concentrations of the OVA peptide SIINFEKL (OVA257-264) at 37°C for 1 hour. After two washes in PBS, the peptide-loaded APCs were cocultured with purified CTV-labeled OT-I WT or Prkch−/− CD45.1+ CD8+ T cells (1×10⁵ cells) in complete medium for 3 days. Samples were acquired on LSR-II cytometers (Becton Dickinson) and analyzed using FlowJo software (Tree Star).
In vitro stimulation of spleen cells
Splenocytes were collected from WT or Prkch−/− mice. To measure cell proliferation, cells were labeled with CTV as described previously. The cells (1×10⁵ cells/well) were stimulated with plate bound anti-CD3 (1 µg/mL) plus soluble anti-CD28 monoclonalAbs (1 µg/mL) or with lipopolysaccharides (LPS-EB, 10 µg/mL, Invivogen) in complete medium for 3 days. Samples were acquired on LSR Fortessa (Becton Dickinson) and analyzed using FlowJo software (Tree Star).
Induction and analysis of genetically engineered HCC model
For Pten/p53 CRISPR-Cas9-driven HCC model,30 60 µg pX330-Pten (Addgene), 60 µg pX330-p53 (Addgene), and 5 µg pGL4-SV40-Luc (gift of Dr Catherine Hedrick, LJI) DNA plasmids suspended in 2 mL saline (~10% of body weight) were applied by hydrodynamic tail vein (HTV) injection over 5–7 s into 8–14 week old female mice (WT, Prkch–/–, Treg, or CD8-specific conditional KO (cKO)). Plasmids were prepared using ZymoPURE Plasmid Maxiprep Kit (Zymo). One day after injection, the plasmid transfection efficiency was assessed using in vivo bioluminescent imaging (Xenogen IVIS Spectrum). Mice were injected intraperitoneally with 100 mM D-Luciferin (Invitrogen, L2916) in 100 µL of PBS. Ten to fifteen minutes later, mice and organs were imaged with 30 s exposure, medium binning and f/stop 1 setting. Bioluminescent images were analyzed using Living Image software V.4.3.1. Only mice with confirmed liver localization were used.
Mice under isoflurane anesthesia were perfused with 25 mL PBS and 25 mL zinc formalin (Polyscience) and immediately euthanized with cervical dislocation. Livers were removed and postfixed with zinc formalin overnight at RT. After cryopreservation with 30% sucrose in PBS at 40C for 3 days, the liver left lateral lobe (LLL) and medial lobe (ML) were embedded in Tissue Plus OCT compound (Fisher Healthcare) and sliced into 6 µm thick sections using a cryostat (Leica CM 1850). Sections were fixed in 90% alcohol for 5 min and, after rinsing in distilled water, were incubated in hematoxylin for 4 min and in Scott’s water for 2 min. After washing twice, sections were transferred to 70% EtOH for 1 min, eosin solution for 3 s, destained with 90% EtOH and dehydrated in 100% EtOH-Pro par. Slices were mounted with Refrax mounting media and visualized with an AxioScan Z1 slide scanner (Carl Zeiss) equipped with a ×20 objective lens. Areas of normal and abnormal liver cell were quantified using the open source digital pathology software QuPath V.0.2.0.31 Data were averaged for 7–10 slices each of LLL or ML.
For Oil Red O (ORO) staining, 6 μm-thick sections were placed in propylene glycol for 2 min and incubated with preheated ORO stain at 60°C for 20 min. Tissues were immersed in 85% propylene glycol solution for 1 min. After washing with distilled water, sections were incubated in hematoxylin for 4 min and in Scott’s water for 2 min. Slices than were rinsed in distilled water and mounted using an aqua-mount slide mounting media (Thermo). Slides were visualized with a slide scanner equipped with a ×10 objective lens as described earlier, and the ORO-stained area was quantified by Zen software (Carl Zeiss).
For immunofluorescence, slices were treated with antigen retrieval buffer (10 mM sodium citrate buffer, pH 6.0, 0.05% Tween-20) at 95–980C for 20 min. After washing with 0.05% Tween-20 in PBS (PBST), the sections were permeabilized with 0.5% Triton X-100 in PBS for 30 min at RT and were incubated with 3% H2O2 in PBS containing 20 mM NaOH, pH 9.5–10.0, for 1 hour to reduce autofluorescence background. Slices were then washed with PBST and blocked with 5% bovine serum albumin (BSA) in PBS for 1 hour. Samples were incubated with the following primary Abs (table 1): rat anti-CD4 (GK1.5; Invitrogen MA1-146), rat anti-CD8α (4SM15; eBioscience 14–0808), and rabbit anti-FoxP3 (ab54501, Abcam), diluted in 5% BSA/PBS buffer overnight at 40C. After washing, the sections were incubated with Alexa Fluor 555- and Alexa Fluor 647-conjugated secondary antibodies for 1 hr and Hoechst dye for 10 min at RT. Samples were mounted with Vectashield mounting medium (H-1000; Vector Laboratories) and visualized with a slide scanner equipped with a ×20 objective lens as described above. CD4+, CD8+, and FoxP3+ cells were classified and quantified by QuPath software.
Autoantibody ELISA
Auto-Abss specific for histone were determined using plates coated with 10 µg/mL calf thymus histone (Sigma) in PBS. After blocking with 1% BSA in PBS at RT for 1 hour, sera diluted 1:250 were added and the plates were incubated at 40C overnight. Detection was carried out using horseradish peroxidase (HRP)-conjugated anti-mouse IgG (1:500, NA931V; GE Healthcare) and the single-component TMB substrate kit (Bio-Rad). The reaction was stopped with 0.16 M sulfuric acid, and absorbance at 450 nm was determined in microplate reader (Spectramax M2E, Molecular Devices). For anti-IgG1 rheumatoid factor, microtiter plates were coated with 2 µg/mL mouse IgG1 κ light chain (clone P3, eBioscience) at 40C overnight and blocked as described previously. The plate was then incubated with diluted serum at 4°C overnight. After PBST washing, biotin-F(ab)2 anti-mouse IgM (ab5929, Abcam) was added at RT for 2 hours, followed by HRP-conjugated streptavidin (1:1,000) for 1 hour. Assays were visualized as described earlier. Anti-double-stranded DNA (dsDNA) or anti-single-stranded DNA (ssDNA) Abs were determined using plates precoated with 1% protamine sulfate at RT for 90 min or with 10 µg/mL methyl-BSA (Sigma), respectively, at 370C for 1 hour. Then, calf thymus DNA (10 µg/mL, Sigma) in PBS or boiled denatured calf thymus DNA (5 µg/mL) were coated at 4°C. For anti-dsDNA determination, after overnight incubation, the plate was treated with nuclease S1 (100 U/mL in 0.1 M sodium acetate buffer, pH 4.5; Thermo Fisher Scientific) at 37°C for 1 hour to degrade the ssDNA. Both plates were blocked with gelatin (1 mg/mL, Sigma) in PBS at RT for 2 hours and incubated with diluted serum at 4°C overnight. Detection was carried out as described previously.
Statistics
All graphs were plotted and analyzed using GraphPad Prism V.7.0. For two group comparisons, the normality of each group was analyzed using a Shapiro-Wilk normality test. Statistical analysis of the normally distributed groups was performed using unpaired t-tests. Statistical analysis of non-normally distributed groups was performed using the two-tailed non-parametric Mann-Whitney test. For multiple group comparisons, we applied the one-way analysis of variance (ANOVA) or two-way ANOVA test with Bonferroni’s correction. Data are presented as mean±SEM (n≥5) or ±SD (n<5). n indicates the number of mice in each group.
Results
Tumor growth and TME analysis in germline Prkch−/− (KO) and conditional Treg-specific Prkch−/− (cKO) mice
In our earlier studies, we adoptively transferred GFP+ Prkch−/− Tregs isolated from reporter mice into mice inoculated with transplantable tumors in order to evaluate the role of Treg-expressed PKCη in tumor immunity.20 22 Here, we aimed to understand the intrinsic role of PKCη in a more physiological setting by analyzing tumor growth and the composition of the TME in intact tumor-bearing mice with germline Prkch deletion (KO) or with conditional, Treg-specific Prkch deletion (cKO). We used two transplantable tumor models, that is, the B16–F10 melanoma and the TRAMP-C1 prostate adenocarcinoma. Growth of the B16–F10 tumor was reduced significantly and to a similar degree in both KO and cKO mice (figure 1A), indicating that the reduced tumor growth is primarily due to Prkch deletion from the Treg compartment.

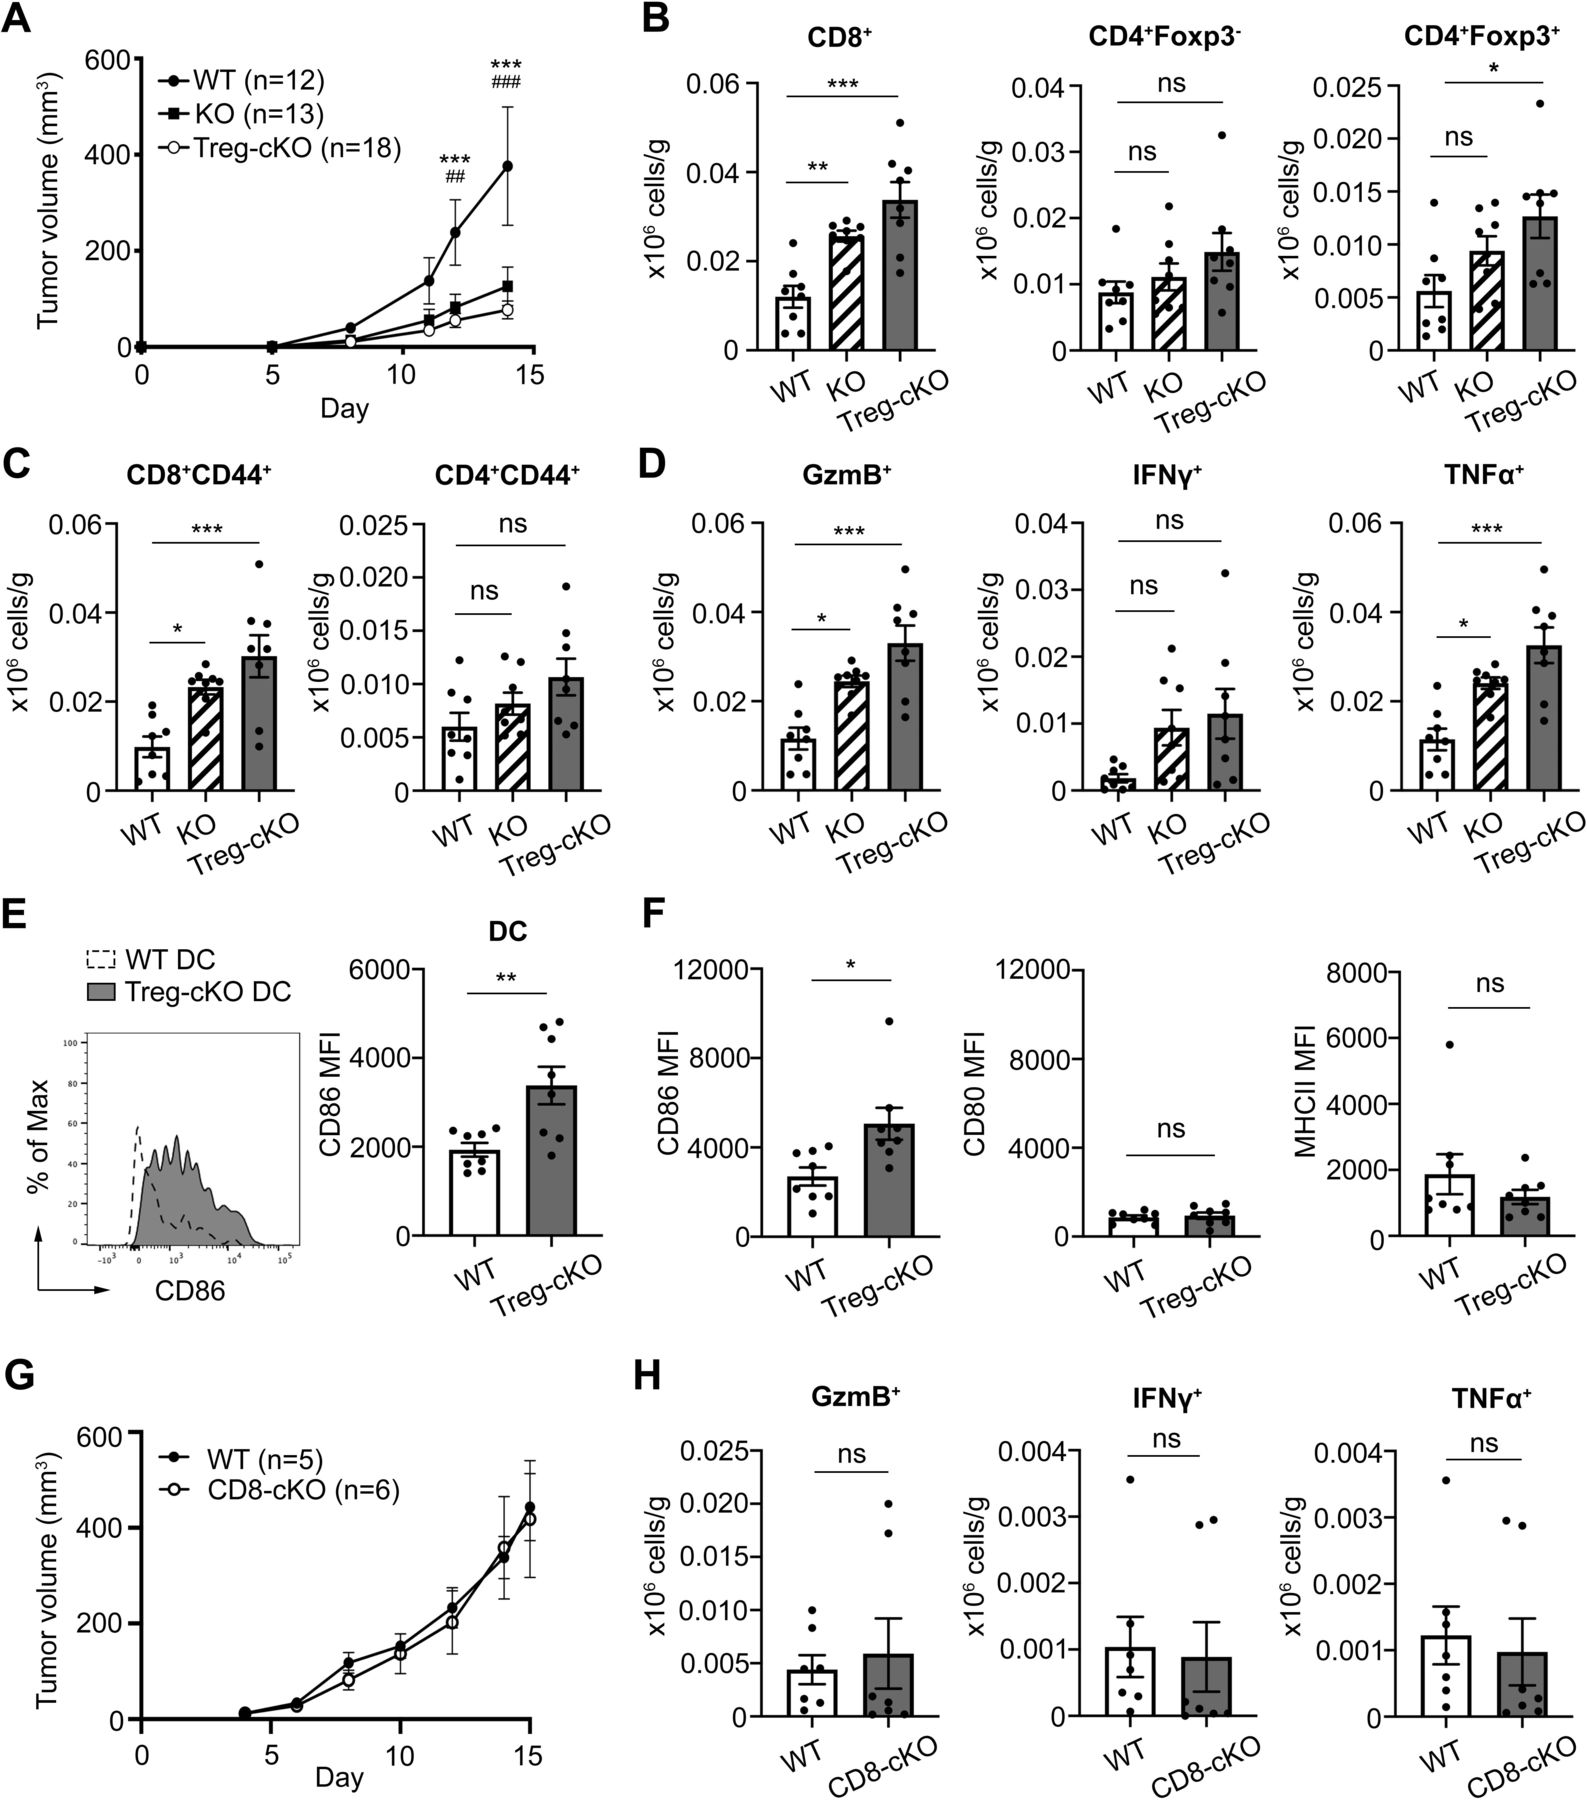
Analysis of B16–F10 tumor growth and the TME in germline Prkch−/−, Treg-specific Prkch−/−, and CD8-specific Prkch−/− mice. B16–F10 melanoma cells (5×10⁵) were implanted intradermally into WT (FIG), germline Prkch−/− (KO, Prkch−/− FIG), conditional Treg-specific Prkch−/− (Treg-cKO, Prkchfl/fl×Foxp3-IRES-YFPCre), or CD8-specific Prkch−/− (CD8-cKO, Prkchfl/fl×Cd8aCre) mice. (A) B16–F10 tumor growth in WT, KO, and Treg-cKO mice. Tumor growth was analyzed at different time points. Cumulative data from four independent experiments are shown. Statistical analysis by two-way repeated-measures ANOVA test with Bonferroni post-test. WT versus KO: ##p<0.01, ###p<0.001. WT versus Treg-cKO: ***p<0.001. (B) Number of intratumoral CD8+, CD4+Foxp3−, and CD4+Foxp3+ T cells were enumerated. Intratumoral CD4+CD44+ and CD8+CD44+ cells (C), and GzmB+, IFN-γ+, or TNF-α+ CD8+ T cells (D) were enumerated. (B–D) Data representative of two independent experiments are shown (WT, n=8; KO, n=8; Treg-cKO, n=8). Data are presented as mean±SEM. Statistical analysis by one-way ANOVA. *P<0.05, **P<0.01, ***P<0.001. (E) Histograms (left) and quantitation (right) of CD86 expression (MFI) on tumor-infiltrating DCs in WT and Treg-cKO mice. Statistical analysis by unpaired Student’s t-test. **P<0.01. (F) Quantitation of CD86, CD80, and MHC class II expression on CD103+ DCs. Statistical analysis by unpaired Student’s t-test. *P<0.05. Data are representative of two independent experiments. (G) B16–F10 tumor growth in WT (C57BL/6) and CD8-cKO mice. Pooled data are from two independent experiments. Data were analyzed by two-way repeated-measures ANOVA and are presented as mean±SEM. (H) Enumeration of intratumoral GzmB+, IFN-γ+, or TNF-α+ CD8+ T cells performed as in (D) in WT mice or mice with CD8-specific Prkch deletion. Statistical analysis by unpaired Student’s t-test. (B–F,H) Each dot indicates an individual mouse. ANOVA, analysis of variance; DC, dendritic cell; FIG, Foxp3-IRES-eGFP; MFI, median fluorescence intensity; Treg, regulatory T cell; ns, non-significant; TME, tumor microenvironment; WT, wild type.
We further analyzed the intratumoral infiltration of T lymphocytes, including CD8+, CD4+Foxp3−, and CD4+Foxp3+ (Treg) T cells, and found that both KO and Treg-cKO mice displayed significantly increased numbers of tumor-infiltrating total (figure 1B) and activated/memory CD44+ (figure 1C) CD8+ cells relative to WT mice, but no significant increases in total or CD44+ CD4+ cells. Although we observed a significant increase in tumor-infiltrating Tregs in the cKO (but not KO) mice (figure 1B), this did not translate into a significantly different CD8+:Treg cell ratio (data not shown) due to the parallel increase in the number of CD8+ T cells. We further analyzed the functional attributes of the intratumoral CD8+ by stimulating the isolated cells in vitro with a combination of phorbol ester (PMA) plus Ca2+ ionophore, ionomycin, and assessing the expression of three hallmarks of the effector function of CD8+ CTLs, that is, GzmB, interferon gamma (IFN-γ), and tumor necrosis factor alpha (TNF-α), using ICS. We found a significant increase in GzmB+ and TNF-α+ tumor-infiltrating CD8+ T cells from both KO and Treg-cKO mice compared with WT mice; although there was also a tendency for a similar increase in the number of CD8+IFN-γ+, this was not statistically significant (figure 1D).
We previously found that tumors containing adoptively transferred Prkch−/− Treg displayed increased surface expression of the costimulatory ligand CD86 on intratumoral DCs,22 consistent with the defective ability of these Tregs to deplete CD86 via a process of transendocytosis.23 24 Consistent with this finding, intratumoral total major histocompatibility complex (MHC)-II+CD11c+ DCs (figure 1E) as well as CD103+ DC (figure 1F)—a DC subset representing the most potent tumor antigen-processing and presenting cells32 33—from Treg-cKO mice similarly expressed significantly higher levels of surface CD86 compared with those from control, WT mice. However, the surface expression levels of CD80, another costimulatory ligand, and MHC class II were not significantly different between WT and Treg-cKO mice (figure 1F). Taken together, these results support our working model that loss of PKCη in Tregs reduces their ability to deplete costimulatory molecule, particularly CD86, from tumor-infiltrating DCs, thereby resulting in a less immunosuppressive TME and stronger antitumor immunity.
As noted previously, our results (figure 1A) imply that the reduced tumor growth observed in germline Prkch−/− is primarily due to Prkch deletion from the Treg compartment, but these results did not rule out the possibility that PKCη deletion in other cells besides Tregs may have adverse effects on tumor immunity.
To determine the effect of PKCη deletion on other immune cells, CTV-labeled WT or KO splenocytes were stimulated in vitro for 3 days with anti-CD3 plus anti-CD28 monoclonalAbs to stimulate T cells and natural killer T (NKT) cells, or with LPS to stimulate B cells. Proliferation was assessed by CTV dilution after gating on CD4+ or CD8+ T cells, B cells, and NKT cells. We found that Prkch−/− CD8+ T cells (online supplemental figure S1A), CD4+Foxp3− T cells (online supplemental figure S1C), B cells (online supplemental figure S1E) or NKT cells (online supplemental figure S1G) proliferated to the same extent as their control, WT counterparts. We also determined the expression of the activation antigen CD69 on the gated cells and found that there was no significant difference in CD69 expression levels between the WT and Prkch−/− subsets (online supplemental figure S1B,D,F,H). We also examined the expression level of costimulatory molecules (CD86, CD80, and CD40) and inhibitory molecules (indoleamine 2,3-dioxygenase 1 (IDO1)) in MHC-II+CD11c+ DCs from WT and KO mice, and found that there were no significant changes in the expression level of all these molecules after LPS stimulation (data not shown). These results indicate that PKCη deletion does not alter the activation and/or proliferation of conventional T cells, B cells, NKT cells or DCs, all of which play direct or indirect roles in antitumor immunity. We can therefore conclude that the enhancement of antitumor immunity in germline Prkch−/− mice reflects predominantly (if not exclusively) the lack of PKCη in Tregs, rather than in other immune cells.
Supplemental material
Despite these results (online supplemental figure S1), we wished to determine more definitively whether PKCη deletion has any deleterious effects on the function of CD8+ T cells, which play a key role as tumor-specific CTLs that mediate effective antitumor immunity. To address this question, we generated CD8-specific PKCη cKO mice by crossing mice expressing a germline floxed Prkch allele (Prkchfl/fl) with Cd8aCre mice. Using ICS, we confirmed that CD8-cKO mice lacked expression of PKCη in splenic CD8+ T cells, but not in CD4+Foxp3− or Treg cells (online supplemental figure S2A). When we stimulated purified Prkch−/− or WT CD8+ T cells with different concentrations of anti-CD3 plus -CD28 monoclonalAbs in vitro, we observed no significant difference in the proliferation index and percentage of divided cells between these two sources of CD8+ cells (online supplemental figure S2B–D). We extended this analysis by stimulating purified OVA-specific CD8+ T cells from MHC class I-restricted TCR-transgenic Prkch+/+ or Prkch−/− OT-I mice with different concentrations of OVA peptide presented by splenic APCs. Both Prkch+/+ and Prkch−/− CD8+ OT-I T cells displayed similar proliferative ability (online supplemental figure S2E–G). To directly investigate the importance of CD8+ T cell-expressed PKCη in antitumor immunity in vivo, we analyzed tumor growth and the TME in WT and CD8-specific Prkch cKO mice. Tumor growth was essentially identical in both mouse strains (figure 1G) and, furthermore, intratumoral WT and cKO CD8+ T cells displayed similar proportions of GzmB+, IFN-γ+ and TNF-α+ cells (figure 1H). Thus, CD8-specific PKCη deletion does not impair T-cell activation in vitro or CD8+ T cell-mediated antitumor immunity in vivo, conceptually supporting therapeutic strategies aimed at inhibiting PKCη in patients with cancer without impacting the CD8+ CTL-mediated antitumor and antiviral effects.
To generalize our findings, we conducted a similar analysis using a different transplantable mouse tumor model, that is, the slow-growing TRAMP-C1 prostate adenocarcinoma. Similar to what we found in the B16–F10 melanoma model, we observed a significantly reduced growth of this tumor in KO and Treg-cKO mice as compared with WT mice (online supplemental figure S3A). In addition, we observed an increased number of intratumoral GzmB+, IFN-γ+, and TNF-α+ CD8+ T cells in the Treg-cKO mice (online supplemental figure S3B). Lastly, there was no difference in tumor growth (online supplemental figure S3C) or in the number of intratumoral GzmB+, IFN-γ+ and TNF-α+ CD8+ T cells (online supplemental figure S3D) between WT and CD8-cKO mice, indicating again that PKCη is dispensable for CD8+ T cell-mediated antitumor immunity, in contrast to Tregs, in which PKCη expression is obligatory for their ability to suppress antitumor immunity.
Treg-expressed PKCη is required for effective suppression of immunity against a genetically engineered HCC
Compared with transplantable tumor models, tumor development and progression, the TME and antitumor immune responses against autochthonous tumors better represent the progression of human cancers.34 Therefore, in order to extend our findings documenting the in vivo relevance of the Treg-intrinsic CTLA4–PKCη signaling pathway, we next used a genetically engineered mouse model of HCC induced by CRISPR-Cas9-driven combined loss of Pten and p53,30 which is based on human HCC genomic studies.35–37 Plasmids encoding HCC drivers were delivered into mice by HTV injection using a non-viral DNA delivery system to avoid a confounding host immune response directed against viral carriers38 (figure 2A). Together with these plasmids, we coinjected into WT or Treg-cKO mice a luciferase-encoding reporter plasmid, which allowed us to apply non-invasive In Vivo Imaging Systems (IVIS) bioluminescent imaging in order to confirm successful intrahepatic localization and expression of the plasmids (figure 2B).

Analysis of Pten/p53 CRISPR-Cas9-driven HCC tumors in WT and Treg-cKO mice. (A) Scheme of the protocol used to induce and analyze HCC tumors. Livers were collected for analysis 3 months post-tumor induction. (B) Luciferase expression in representative livers of WT (FIG, n=14) and Treg-cKO (n=15) mice imaged by IVIS 24 hours postplasmid injection. Quantification of the bioluminescence signal is shown on the right as a measure of efficient liver targeting. (C) Tumor incidence. (D) Reduced number of liver tumor nodules in Treg-cKO mice. Liver images (left) and quantitation (right) of tumor nodules. Tumor nodules are marked by arrows. Scale bar=1 cm. (E) Representative H&E staining of liver sections. Scale bar=1 mm. Squared area in top images is enlarged in the middle images (a,b). (c,d) Enlarged images of middle row. (a-d) Scale bar=100 µm. (F) Images (left) and quantitation (right) of abnormal tissue (corresponding to tumor area) in H&E-stained liver sections analyzed using the QuPath software. Sections were analyzed from the LLL and ML. (G) Representative ORO staining of liver sections. Scale bar=100 µm. Squared area in top images is enlarged in the bottom images. (H) Percentage of ORO-stained area (indicative of steatosis) in LLL and ML liver sections was analyzed using the Zen Pro software and displayed in false color. (G,H) WT (n=14) and Treg-cKO (n=14). Scale bar, 100 µm. Pooled data are from four independent experiments. (B,D,F,H) Statistical analysis by unpaired Student’s t-test. Data are presented as mean±SEM. *P<0.05, ***P<0.001. BI, bioluminescent imaging; CL, caudate lobe; FIG, Foxp3-IRES-eGFP; HCC, hepatocellular carcinoma; HTV, hydrodynamic tail vein injection; LLL, liver left lateral lobe; ML, medial lobe; ns, non-significant; ORO, Oil Red O; PP, papillary process; RLL, right lateral lobe; Treg, regulatory T cell; WT, wild type.
Three months post-tumor induction, we observed that only 3/15 (20%) Treg-cKO mice developed detectable liver tumors, in contrast to 10/14 (71%) control, WT mice (figure 2C). Furthermore, significantly fewer tumor nodules were found in the livers of the Treg-cKO mice than in the WT mice (figure 2D). Liver sections of tumor-bearing WT and Treg-cKO mice were further examined using histological analysis. H&E-stained liver sections clearly showed that hepatocytes with a larger cytoplasm containing microvesicular vacuoles were more prominent in tumor regions of WT mice when compared with Treg-cKO mice (figure 2E). We used the QuPath software to define and analyze the abundance of these abnormal tissue (tumor) areas and found that Treg-cKO mice displayed a significantly lower tumor area compared with WT mice (defined by false red color, figure 2F). The accumulation of lipid droplets (steatosis) within hepatocytes is a phenotype highly associated with Pten mutation in liver tumors.39 40 ORO staining used for staining of fat in frozen liver sections also revealed a less prominent lipid staining in liver sections of Treg-cKO mice compared with WT mice (figure 2G). Analysis using the Zen Pro software revealed that this reduction was statistically significant (figure 2H, quantitated in the right panel).
Immunohistochemistry analysis of representative liver sections revealed a significantly larger number of infiltrating total CD4+ T cells was found in Treg-cKO compared with WT mice (figure 3A). We also observed clear tendency for increased numbers of intratumoral CD8+ T cells (figure 3B) and Foxp3+ Tregs (figure 3C) in the Treg-cKO mice, although these differences were not statistically significant, reflecting the very low numbers of these intratumoral T cells that were present in the analyzed sections. Taken together, these results indicate that Treg-selective deletion of PKCη reduces tumor burden and likely promotes a more immunogenic TME in this autochthonous HCC model.

Analysis of intratumoral T cells in WT and Treg-cKO mice in Pten/p53 CRISPR-Cas9-driven HCC tumor model. Representative immunohistology of a liver section from WT (FIG) or Treg-cKO tumor-bearing mice stained with a fluorescent anti-CD4 Ab (green) (A), with a fluorescent anti-CD8 Ab (green) (B), or anti-Foxp3 Ab (green) (C). All sections were also stained with Hoechst (blue). Tumor areas are highlighted with a broken line in the left row. Squared tumor areas in the left row are enlarged in the middle row (a, WT) and the right row (b, Treg-cKO). CD4+, CD8+, or Foxp3+ labeled T cells are marked by yellow arrowheads. The right panels show quantification of CD4+ (top), CD8+ (middle), and Treg (bottom) cells in tumor areas. Tumors were analyzed in sections from liver LLL and ML. Scale bar, 100 µm. Pooled data are from four independent experiments (WT, n=5; Treg-cKO, n=3). Data are presented as mean±SD. Statistical analysis by unpaired Student’s t-test. *P<0.05. FIG, Foxp3-IRES-eGFP; HCC, hepatocellular carcinoma; LLL, liver left lateral lobe; ML, medial lobe; ns, non-significant; Treg, regulatory T cell; WT, wild type.
We extended this analysis to similar CRISPR/Cas9-induced autochthonous HCC tumors in germline Prkch−/− mice. Similar to the Treg-cKO tumor-bearing mice, we again observed that these mice displayed reduced tumor incidence and number of liver tumor nodules (online supplemental figure S4A,B). Unexpectedly, the tumor incidence in germline Prkch−/− mice (52%, online supplemental figureS4A) was higher than that in Treg-cKO mice (20%, figure 2C), suggesting that PKCη deficiency may influence other cell types besides Tregs, which play important roles in suppressing tumor growth. Therefore, we first investigated the importance of CD8+ T cell-expressed PKCη in tumor development using CD8-cKO mice. Although CD8-cKO mice appeared to display minor reduction in tumor incidence (online supplemental figure S4C), there was no statistical difference in the number of tumor nodules between WT and CD8-cKO mice (online supplemental figure S4D). This result is consistent with our previous observation in the transplantable mouse tumor models (figure 1G,H, and online supplemental file 1 S3C,D) showing that PKCη is not essential for the CD8+ T cell-mediated antitumor immunity.
Effect of inducible Treg-specific PKCη deletion in therapeutic models of preclinical cancer
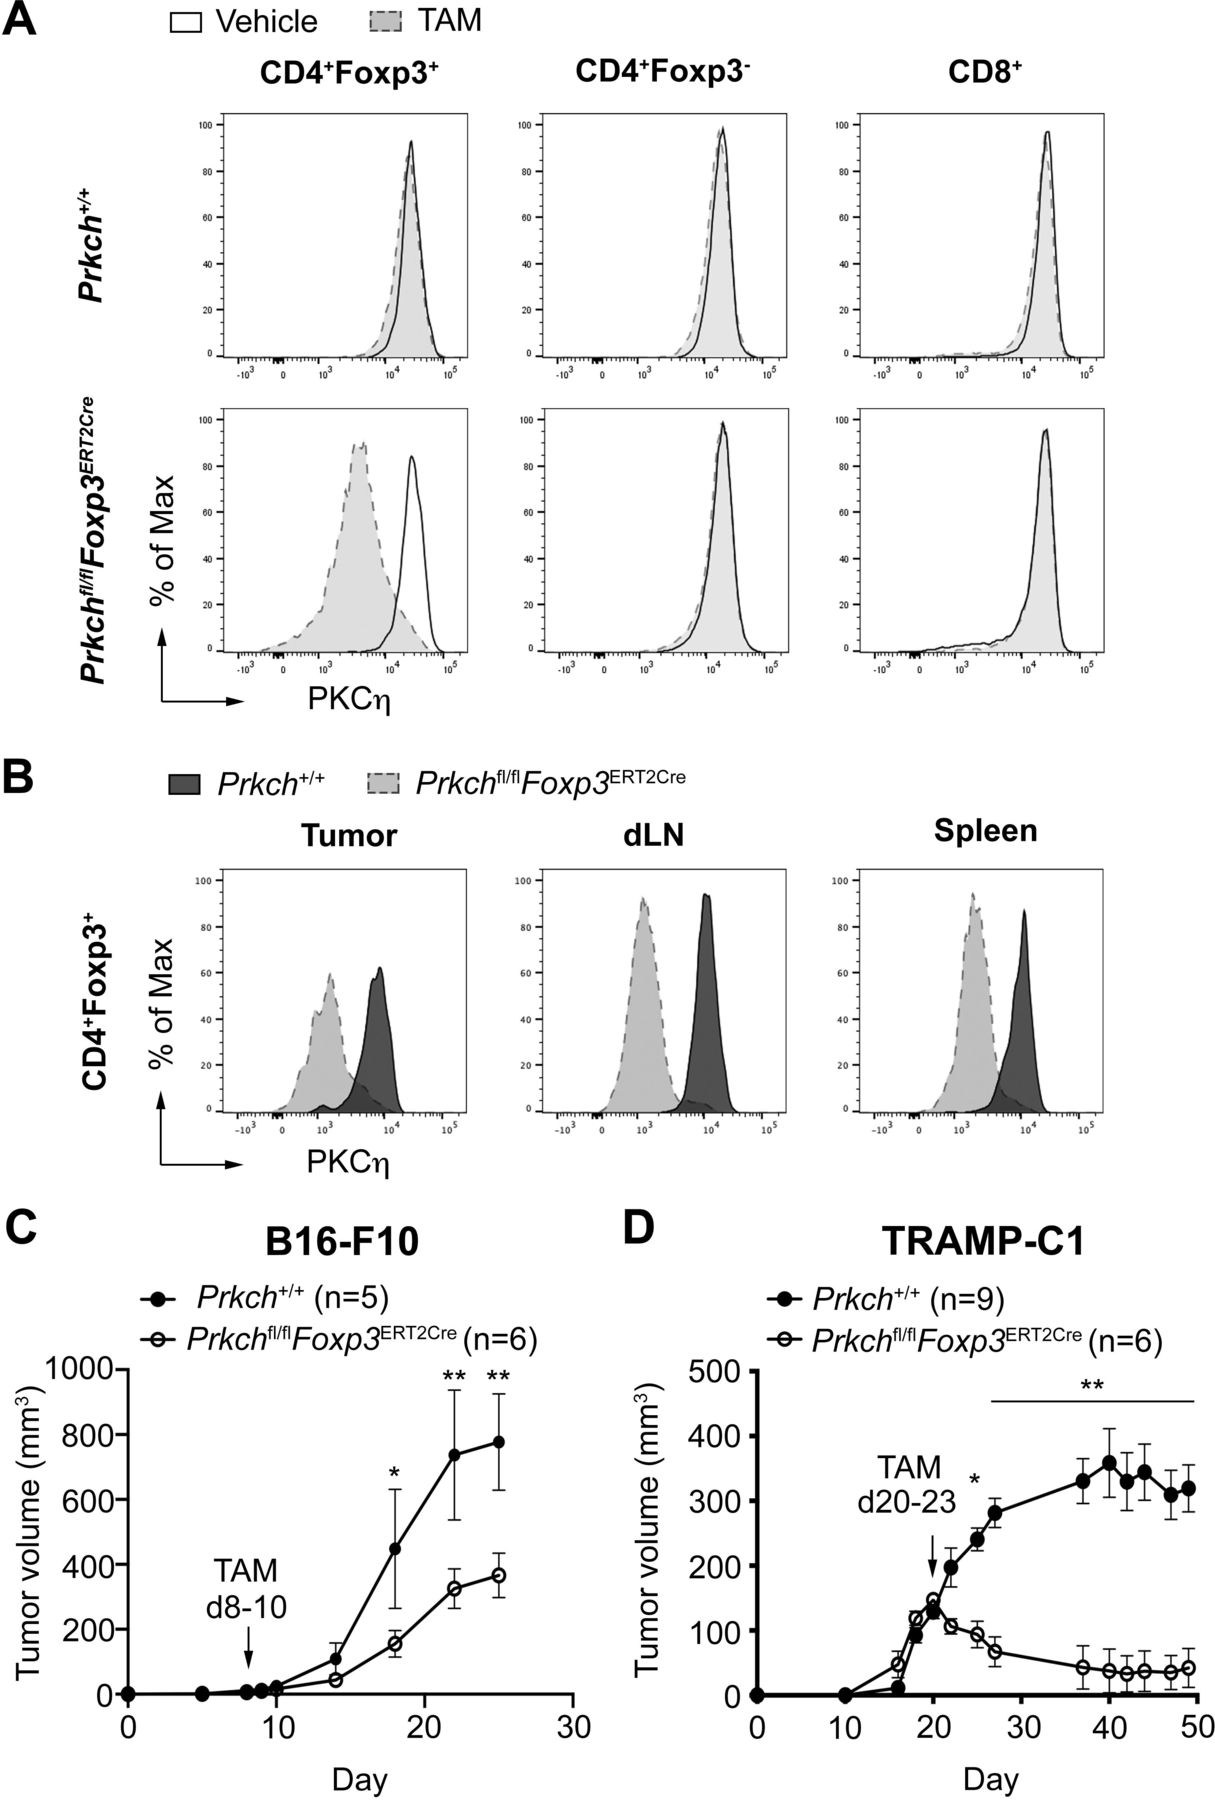
The aforementioned results suggested that targeting the Treg-intrinsic CTLA4–PKCη pathway might represent a promising approach for tumor immunotherapy in patients with cancer. However, given the fact those studies involved germline or Treg-specific PKCη deletion prior to tumor implantation or induction, we wished to determine whether Treg-specific PKCη deletion, either as a single treatment or in combination with another immunotherapy regimen, would provide a therapeutic effect when applied after tumor implantation. To establish a therapeutic model with potential clinical relevance, we crossed Prkchfl/fl mice with Foxp3ERT2Cre mice to generate mice, in which PKCη can be specifically deleted from Tregs by TAM treatment at any desired time point. First, we confirmed the Treg-specific deletion of PKCη in the progeny of this cross by using ICS to demonstrate that intraperitonealinjection of TAM led to loss of PKCη expression in splenic Tregs, but not in CD4+Foxp3− or CD8+ T cells (figure 4A). A similar, efficient reduction of PKCη expression was also observed in Tregs isolated from the tumor and draining lymph node after TAM treatment (figure 4B). Initial experiments, in which mice were treated with TAM for 4 consecutive days starting on day 8 after tumor implantation of B16–F10 melanoma cells (5×10⁵ cells intradermal), did not reveal any beneficial therapeutic effect (data not shown), likely reflecting the highly aggressive nature and rapid growth of this tumor and/or the relatively late time of TAM treatment. We therefore performed another similar experiment (mice were treated with TAM for 3 consecutive days) with the tumor cell number reduced to 5×10⁴ cells intradermally. At this lower tumor dose, we observed a significant reduction in tumor growth after TAM treatment (figure 4C). We also performed a similar analysis in mice bearing the slow-growing TRAMP-C1 adenocarcinoma. In this tumor model, a significant and remarkable reduction in tumor growth was again observed after TAM treatment (figure 4D).

Reduced growth of B16–F10 and TRAMP-C1 tumors in a therapeutic model of Treg-cKO mice. (A) Histograms of PKCη expression (MFI) determined by ICS in CD4+Foxp3+ Tregs, non-Treg CD4+, and CD8+ T cells from the spleens of Prkch+/+ (Foxp3 ERT2Cre) or Prkchfl/fl×Foxp3 ERT2Cre mice treated with vehicle control (corn oil) or TAM (2 mg) intraperitoneally for 4 consecutive days. (B) Histograms of PKCη expression in CD4+Foxp3+ Tregs isolated from tumor, dLN, and spleen of Prkch+/+ and Prkchfl/fl×Foxp3 ERT2Cre mice treated with TAM intraperitoneally for 3 consecutive days. (C) B16–F10 melanoma tumor growth (5×10⁴ cells i.d.) in Prkch+/+ and Prkchfl/fl×Foxp3 ERT2Cre mice. Cumulative data of two experiments are shown. (D) TRAMP-C1 tumor growth (5×10⁶ cells subcutaneously) in vehicle-treated Prkch+/+ and TAM-treated Prkchfl/fl×Foxp3 ERT2Cre mice. Cumulative data of two experiments are shown. Data are presented as mean±SEM. Statistical analysis by two-way repeated-measures analysis of variance test with Bonferroni post-test. *P<0.05, **P<0.01. dLN, draining lymph node; ICS, intracellular staining; MFI, median fluorescence intensity; PKCη, protein kinase C-eta; TAM, tamoxifen; Treg, regulatory T cell.
Since highly effective clinical immunotherapy is likely to require combination treatments involving more than a single immunotherapy regimen, we wanted to determine whether the therapeutic effect of Treg-specific PKCη deletion can be augmented by combining it with an additional treatment modality. Fms-like tyrosine kinase 3 ligand (Flt3L) is a hematopoietic cytokine that chemoattracts and induces the maturation of DCs and has been used in tumor vaccines to enhance antitumor responses.29 Thus, we combined TAM treatment applied to Prkchfl/fl×Foxp3ERT2Cre mice at 3, 6, and 9 days after B16–F10 melanoma implantation (5×10⁵ cells intradermal) with injection of a whole tumor cell-based vaccine consisting of irradiated B16–F10 cells stably expressing Flt3L.29 Treg-selective deletion of PKCη was confirmed at the experiment end point on day 15 (online supplemental figure S5). We observed a significant reduction in tumor growth after single TAM treatment or B16–Flt3L vaccination (figure 5A). Interestingly, combination treatment with TAM and B16–Flt3L resulted in a more pronounced reduction in tumor growth compared with monotherapy (figure 5A). In addition, mice receiving the combination treatment displayed a significant increase in tumor-infiltrating total CD8+ and CD4+Foxp3− T cells but not in CD4+Foxp3+ Tregs (figure 5B), as well as in CD8+GzmB+ and IFN-γ+ CTLs (figure 5C). Although not significant, there was also an apparent increase in CD8+TNF-α+ T cells. Consistent with our previous results (figure 1F), we also observed a significantly increased CD86 expression on intratumoral CD103+ DCs in the groups receiving the B16–Flt3L vaccine or the combination treatment (figure 5D) compared with the control group.

Analysis of tumor growth and intratumoral T cells in a combinatorial immunotherapy model. (A) Prkchfl/fl×Foxp3 ERT2Cre mice were implanted i.d. with B16–F10 cells (5×10⁵) and injected on days 3, 6, and 9 with irradiated (150 Gy) Flt3L-expressing B16 cells (1×10⁶) in an adjacent site on the same flank and with TAM (2 mg) intraperitoneally. Tumor growth was analyzed at different time points. Cumulative data of three experiments are shown (control, n=11; TAM, n=11; B16–Flt3L, n=9; TAM+B16–Flt3L, n=9). Data are presented as mean±SEM. Statistical analysis by two-way repeated measures ANOVA test with Bonferroni post-test. *P<0.05, ***P<0.001. (B) Enumeration of tumor-infiltrating CD8+, non-Treg CD4+, and Foxp3+ Tregs per gram of tumor tissue. (C) Enumeration of intratumoral GzmB+, IFN-γ+, and TNF-α+ CD8+ T cells. (D) Surface expression of CD86 on CD103+ intratumoral DCs. Expression is reported as MFI normalized to average MFI in the control group (non-TAM and non-B16–Flt3L treatment). (B–D) Each dot indicates an individual mouse. Data are presented as mean±SEM. Statistical analysis by one-way ANOVA. *P<0.05, **P<0.01. ANOVA, analysis of variance; DC, dendritic cell; MFI, median fluorescence intensity; TAM, tamoxifen.
We additionally examined the expression level of other costimulatory molecules (CD137L, OX40L, CD70, and CD40); inhibitory molecules (PDL1, PDL2, and IDO1); and IL-12 cytokine in intratumoral CD103+ DCs from Prkch+/+ and Prkchfl/fl×Foxp3 ERT2Cre mice, and found that there were no significant changes in the expression level of all these molecules after TAM treatment (online supplemental file S6).
In conclusion, Treg-specific PKCη deletion as a monotherapy was effective in all three tumor models that we have studied and, moreover, the efficacy of this treatment is further enhanced when it was combined with a tumor vaccine.
Effect of PKCη on autoantibody production
Patients with cancer treated with checkpoint blockade anti-CTLA4 Abs are known to develop pathological irAE that can be associated with the production of auto-Abs.19 41 Ctla4−/− mice develop an early fatal lymphoproliferative/inflammatory disease that involves multiorgan lymphocyte infiltration, destruction of tissues and an increase in serum immunoglobulins.27 28 We therefore wished to find out whether global or Treg-specific Prkch deletion would similarly result in autoimmune manifestations, that is, autoantibody production. We used an ELISA to determine the titer of auto-Abs specific for histone, IgG1 (rheumatoid factor), and double-stranded or single-stranded DNA (ssDNA) in Prkch KO or Treg-cKO mice at ages ranging between 6 and 12 months. Both lines of Prkch−/− mice displayed levels of serum auto-Abs that did not differ significantly from those found in the control mice (online supplemental figure S7A–D). In fact, the Treg cKO mice even displayed significantly lower levels of rheumatoid factor and anti-ssDNA auto-Abs at 12 months of age compared with the control (WT) mice (online supplemental file S7B,D). Thus, the deletion of PKCη, either germline or Treg-specific, in mice does not lead to the production of potentially pathogenic auto-Abs.
In our previous studies, we confirmed the impaired suppressive activity of PKCη-deficient Tregs sorted from both KO or Treg-cKO mice.20 42 Here, we also analyzed the number and typical Treg marker expression of splenic Tregs in the steady state. This analysis demonstrated no significant differences in the number of Tregs (online supplemental file S7E) or in the expression level of the Treg markers CTLA4 and GITR (online supplemental file S7E) among WT, KO, and Treg-cKO mice of 2–3 months old. However, there was moderate (~20%) but significant reduction in the Treg expression of CD25 in the Treg-cKO mice (online supplemental S7F). Thus, PKCη deletion, either germline or Treg-specific, had no effect or only minimal effect on the number and phenotype of Tregs.
Discussion
Our earlier studies have established the critical role of PKCη in mediating the contact-dependent suppressive activity of Tregs that inhibit antitumor immunity20 22 and antiviral immunity.42 However, PKCη was not required for the activation and effector functions of CD8+ T cells both in vitro and in vivo,42 which play a critical role in mediating both antitumor and antiviral immunity, thereby implicating PKCη as a potentially attractive target for inhibition of Treg-expressed PKCη in clinical settings in order to promote antitumor immunity in patients with cancer. Nevertheless, our previous studies left a number of open questions. First, our tumor studies used an adoptive transfer model, in which Prkch−/− Treg were adoptively transferred into recipient mice prior to tumor implantation,20 22 thus representing a preventive rather than a therapeutic model. Second, those studies did not rule out the possibility that PKCη expressed by other cell types besides Tregs affects directly or indirectly host immunity, especially given the ubiquitous expression of this enzyme in different cells and tissues. Several key aspects of this study now go a long way toward resolving these outstanding issues, further extending the potential clinical utility of PKCη inhibition in patients with cancer: (1) rather than adoptively transferring Prkch−/− Treg into normal recipients, we have now evaluated antitumor immunity in intact mice; (2) we analyzed for the first time antitumor immunity in mice with selective and highly specific deletion of PKCη in either the Treg or the CD8+ T-cell compartments; (3) we have also analyzed the importance of Treg-expressed PKCη in an autochtonous, genetically induced HCC tumor model, which more closely recapitulates the development and antitumor immunity in humans34; and lastly, (4) we assessed the effectiveness of combination immunotherapy consisting of Treg-specific Prkch deletion plus a tumor vaccine.
Using Treg-cKO mice side by side with germline Prkch−/− mice, we now demonstrate that the enhanced antitumor immunity observed in germline Prkch−/− mice results predominantly, if not exclusively, from PKCη expression in the Treg compartment. On the other hand, CD8+ T cell-expressed PKCη was fully dispensable for antitumor immunity, which we previously found to be CD8+ T cell-dependent,22 nor was it required for the in vitro TCR-mediated activation, proliferation or effector function of CD8+ T cells. This important distinction between the role of PKCη in Treg versus CD8+ T cells is a convincing argument that pharmacological inhibition of PKCη in patients with cancer is highly unlikely to diminish the effector function of tumor-specific CD8+ CTL. Given the additional role of natural killer (NK) cells in antitumor immunity43 and the high expression level of PKCη in these (and other) cells (http://biogps.org/%23goto=genereport&id=5583 and http://biogps.org/%23goto=genereport&id=18755), future studies are needed to determine whether NK-specific PKCη deletion will have any effect on the overall antitumor immunity. In this regard, we previously found that the reduced tumor growth following adoptive cotransfer of Prkch−/− Tregs plus splenic effector cells was reversed when CD8+ T cells were depleted from the spleen cell inoculum.22 This result suggests that CD8+ T cells play the predominant, if not exclusive, role in antitumor immunity and, therefore, tend to argue against a major role of NK cells.
Our findings regarding the importance of Treg-expressed PKCη in suppressing antitumor immunity are fully consistent with our recent report that Treg-expressed PKCη is also critical for CD8+ T cell-mediated antiviral immunity in a model of acute lymphocytic choriomeningitis virus infection.42 Importantly, Treg-specific deletion of PKCη after tumor inoculation was also effective in reducing tumor growth, indicating the potential beneficial effect of strategies designed to inhibit the activity of PKCη in patients with cancer. Consistent with our earlier findings,20 22 the increased antitumor immunity observed in mice lacking PKCη expression globally or only in Tregs was also associated with a significantly increased expression of the costimulatory ligand CD86 on the surface of tumor-infiltrating total DC or the CD103+ subset of DC known to play an important role in the cross presentation of processed tumor antigens.32 33 This increased CD86 expression most likely results from the inability of Prkch−/− Tregs to efficiently deplete this ligand from engaged DC via a process of transendocytosis.23 24
In addition to establishing the importance of Treg-expressed PKCη in antitumor immunity to transplantable tumors, we demonstrate here that germline or Treg-specific Prkch deletion also enhanced immunity against a de novo arising spontaneous HCC. This was reflected by reduced overall tumor incidence, a significantly lower number of liver tumor nodules, a reduction in liver inflammation, and an increase in intratumoral CD4+ and CD8+ T cells. Lastly, using a combinatorial immunotherapy model, we demonstrated that combination of Treg-specific Prkch deletion with a tumor vaccine applied after tumor implantation resulted in an additive (if not synergistic) effect manifested by further reduction in tumor growth, which correlated with increased numbers of intratumoral total and effector cytokine-positive CD8+ T cells. This latter result is clinically relevant as it is becoming clear that effective cancer immunotherapy would require combinatorial therapy that combines immunotherapy with another therapeutic modality, for example, a different immunotherapy arm, irradiation or chemotherapy.44
Patients with cancer treated with checkpoint blockade anti-CTLA4 Abs develop irAE, which can be severe.19 41 45 Although mice (unlike humans) do not develop irAE after treatment with anti-CTLA4 Abs,46 Ctla4−/− mice develop a fatal lymphoproliferative disease that involves multiorgan lymphocyte infiltration and damage and an increase in serum immunoglobulins.27 28 However, we found here that the level of auto-Abs in Prkch−/− mice that we followed up to 12 months of age did not differ from that found in control, WT mice. This finding is consistent with our earlier report that global deletion of PKCη does not result in overt pathology.20 CTLA4 uses several different mechanisms to deliver T-cell inhibitory signals, which may require its extracellular or intracellular domains, and may act in a conventional T cell-intrinsic or T cell-extrinsic (Treg-mediated) manner.47 48 We propose that, in contrast to blocking anti-CTLA4 Abs or Ctla4 deletion, which globally block all CTLA4-mediated signals, deletion of PKCη (or disruption of its interaction with CTLA4) disrupts only a subset of CTLA4-mediated signaling pathways, and this may likely account for the apparent lack of autoimmune manifestations, such as autoantibody production or over pathology. Consistent with this notion, we reported in an earlier study that Prkch−/− Tregs largely lose their ability to suppress antitumor immunity while retaining their ability to inhibit T cell-mediated experimental autoimmune colitis.20 Furthermore, germline Prkch deletion in mice did not affect T-cell development and had only relatively mild effects on T-cell activation.20 21 Thus, selective disruption of CTLA4–PKCη signaling could represent a new strategy to promote antitumor immunity while potentially minimizing irAE. In conclusion, our current findings reinforce the idea that, unlike previous, less specific and more toxic approaches to inhibit the suppressive activity of Tregs and, thus, promote antitumor immunity, inhibition of PKCη is likely to represent a more specific and less toxic approach to inhibit the function of immunosuppressive Tregs in antitumor immunity. Therefore, the development and characterization of highly specific PKCη inhibitors or strategies that would disrupt the interaction between CTLA4 and PKCη (eg, by allosteric inhibition) represent worthy and clinically relevant future endeavors.
Data availability statement
Data are available in a public, open access repository. Data are available upon reasonable request. All data relevant to the study are included in the article or uploaded as supplementary information. Data are available on reasonable request.
Ethics statements
Patient consent for publication
Acknowledgments
We thank Jiji Xie for scientific input, and the staff of the LJI animal, flow cytometry, imaging, and bioinformatics facilities for excellent support.
References
Supplementary materials
Supplementary Data
This web only file has been produced by the BMJ Publishing Group from an electronic file supplied by the author(s) and has not been edited for content.
Footnotes
Contributors H-YL: experimental design, investigation, validation, and writing of early drafts. CP: experimental design and investigation. K-FK: scientific input and advice. AJC-B: mice breeding and material preparation. WX: experience sharing of the Pten/ p53CRISPR-Cas9-driven hepatocellular carcinoma model and methodology. AA: project conceptualization, supervision, funding acquisition, reviewing early drafts, and editing.
Funding This is publication number 3328 from the La Jolla Institute for Immunology. This work was supported by National Institutes of Health grant CA233862 (AA) and fellowship award of Postdoctoral Research Abroad Program from the Ministry of Science and Technology, Taiwan (H-YL).
Competing interests None declared.
Provenance and peer review Not commissioned; externally peer reviewed.
Supplemental material This content has been supplied by the author(s). It has not been vetted by BMJ Publishing Group Limited (BMJ) and may not have been peer-reviewed. Any opinions or recommendations discussed are solely those of the author(s) and are not endorsed by BMJ. BMJ disclaims all liability and responsibility arising from any reliance placed on the content. Where the content includes any translated material, BMJ does not warrant the accuracy and reliability of the translations (including but not limited to local regulations, clinical guidelines, terminology, drug names and drug dosages), and is not responsible for any error and/or omissions arising from translation and adaptation or otherwise.