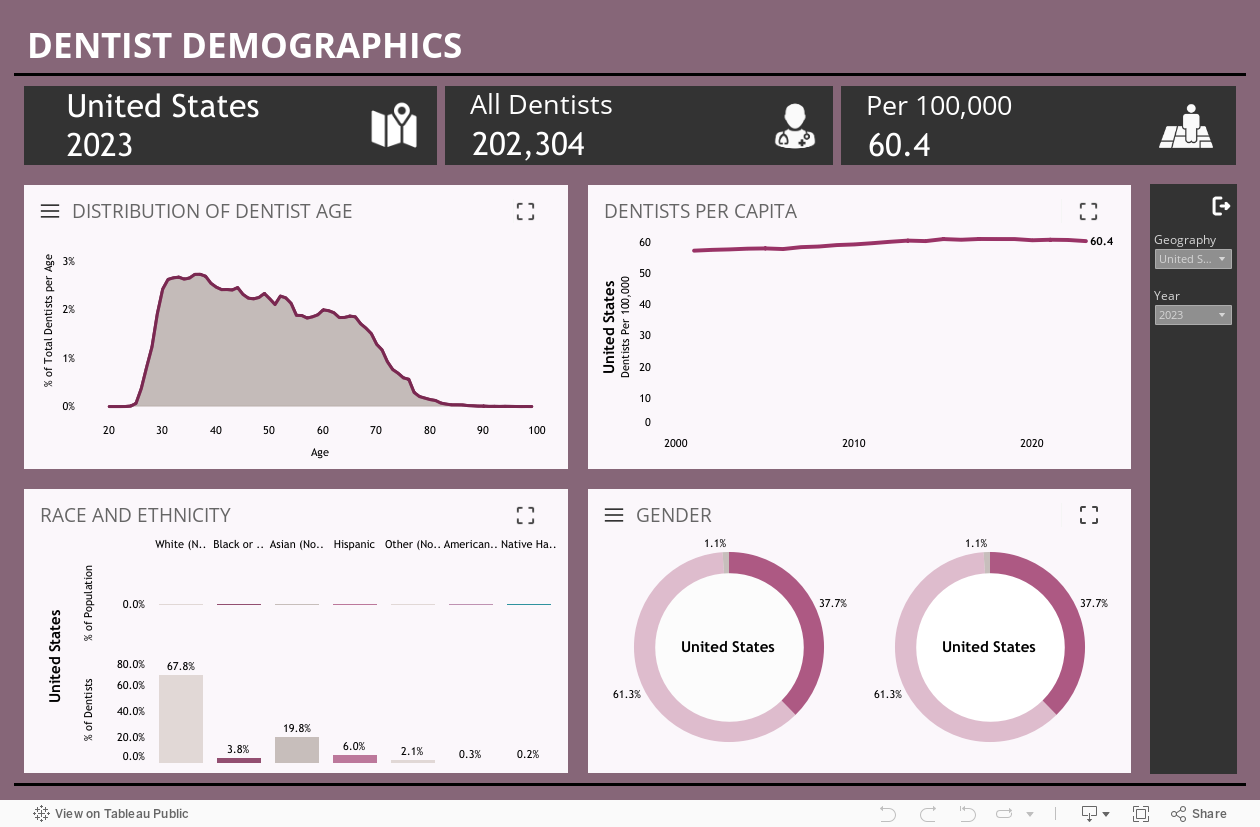
The dashboard data cover the years 2001 to 2023.
- Hover over any data point to reveal the tooltip for more information.
- Use the drop-down menus on the right to filter by state and data year.
- Download the results in PDF format for your presentation needs.
- Click on the rectangle icon in the bottom right corner to view a full-page version.
For complete instructions, download our help guide (PDF).
For supply of dentists data in Excel format, download our Supply of Dentists in the U.S., 2001-2023 (XLSX) report.
For data on wages and job counts of general practitioner dentists and dental hygienists and assistants, see our Wages and Job Count Dashboard.