
Current Term Enrollment Estimates: Spring 2024
May 22, 2024
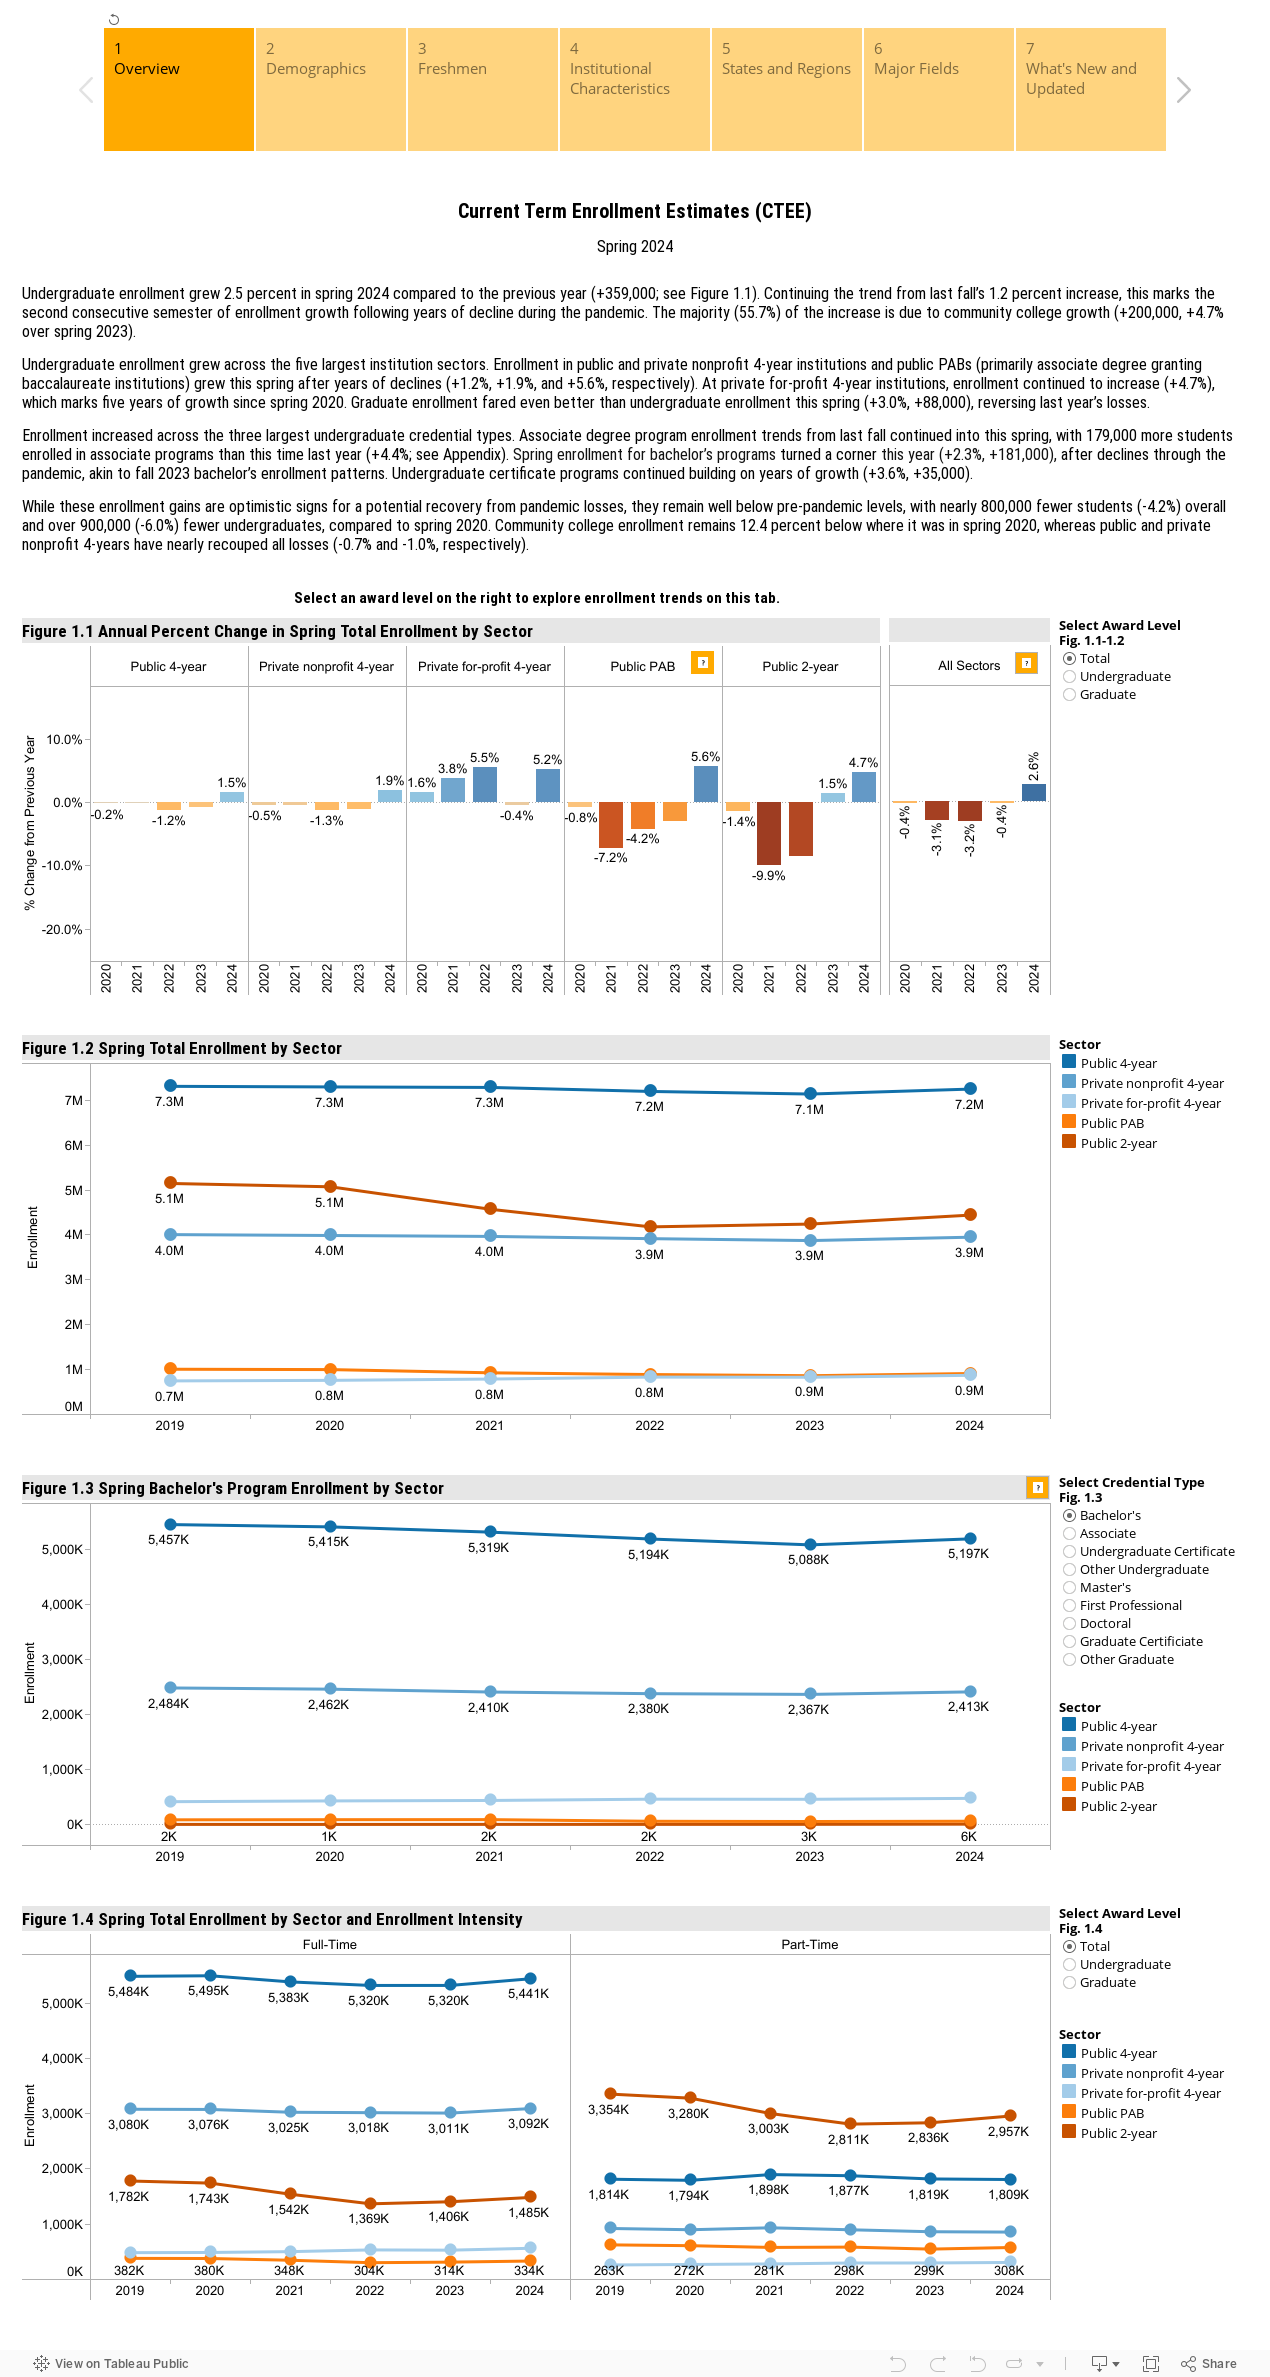
Undergraduate enrollment grew 2.5 percent (+359,000) in spring 2024, marking the second consecutive semester of enrollment growth following years of decline during the pandemic. Gains occurred across all major sector groups, but the majority (55.7%) of this increase is due to community college growth (+200,000, +4.7% over spring 2023). Graduate enrollment fared even better than undergraduate enrollment this spring (+3.0%, +88,000), reversing last year’s losses. Forty-four states saw enrollment growth this spring.
Freshman enrollment grew at a faster rate this spring than overall undergraduate enrollment (+3.9% compared to spring 2023). This growth was strongest at community colleges (+6.2%, +14,000) and public PABs (+11.0%, +5,000). Freshmen women grew at a faster rate than men in spring 2024 (+3.2% vs. +2.2% for men), a reversal of the trend reported for the two previous years where men were outpacing women’s enrollment growth.
The number of dual enrolled high school students (17 and younger) grew for the third year in a row (+10.0%, +100,000), accounting for nearly 28.1 percent of the undergraduate enrollment increases. Dual enrollment at public institutions saw double-digit increases this year – up 11.0 percent at 4-years, and 10.2 percent at both PABs and 2-years.
This is the first spring Current Term Estimates report to utilize a dashboard-based report which allows users to explore the longitudinal data through interactive visualizations. Additionally, this report features new analyses of enrollment at Historically Black Colleges and Universities (HBCUs), community college enrollment by transfer or vocational program focus, and trends by institution locale, along with more detailed information on enrollment by credential level, age, and major field. Full data are available in the Data Appendix for download.
Download the Data Appendix (xlsx) and Methodological Notes (pdf).
Navigate using the tabs at the top of the dashboard to see details for different institutions and students.
Difference from the Stay Informed report series
Current Term Enrollment Estimates (CTEE) series is published every January and May. It provides national enrollment estimates by credential type, institutional sector, enrollment intensity, age group, gender, major field as well as state-level enrollment estimates.
Enrollment estimates are adjusted for Clearinghouse data coverage rates by institutional sector, state, and year. This differs from the Stay Informed report series which is designed to quantify the effects of COVID-19 by analyzing year-over-year percent change in unadjusted preliminary data for fixed panels of institutions that reported data in the same month each year across all comparison years.
Enrollment estimates may differ between the CTEE and the Stay Informed reports due to the difference in methodology and institution coverage. Postsecondary institutions actively submitting enrollment data to the Clearinghouse account for 97 percent of the total enrollments at Title IV, degree-granting institutions in the U.S.
Past Reports
COVID-19 Supplement for Spring 2020 (June 2020): Full Report + Data Dashboard