State of Our Streams Report

UNDERSTANDING WATER QUALITY IN THE HEADWATERS OF DARBY, CRUM, AND RIDLEY CREEKS 2018 — 2021
LAUREN MCGRATH & ANNA WILLIG | AUGUST 2022

The work of Willistown Conservation Trust takes place on the ancestral lands of the Lenni Lenape. We honor the Lenape and other Indigenous caretakers of these lands and waters, the elders who lived here before, the Indigenous people today, and the generations to come. We acknowledge the Lenni Lenape as the original people of this land and their continuing relationship with their territory. In our acknowledgment of the presence of Lenape people in their homeland, we affirm the aspiration of the great Lenape Chief Tamanend, that there be harmony between the Indigenous people of this land and the descendants of the immigrants to this land, “as long as the rivers and creeks flow, and the sun, moon, and stars shine.” As we enjoy and protect the beauty of Willistown and surrounding areas, we cannot forget its original inhabitants and how their way of life echoes throughout the conservation of this land and its natural resources. While we preserve the land we must also preserve its history and the history of the Indigenous people. By sharing their story with the community, and working with local Native American organizations including the Lenape Nation of Pennsylvania, we can hope to ensure that their legacy lives on with the land.
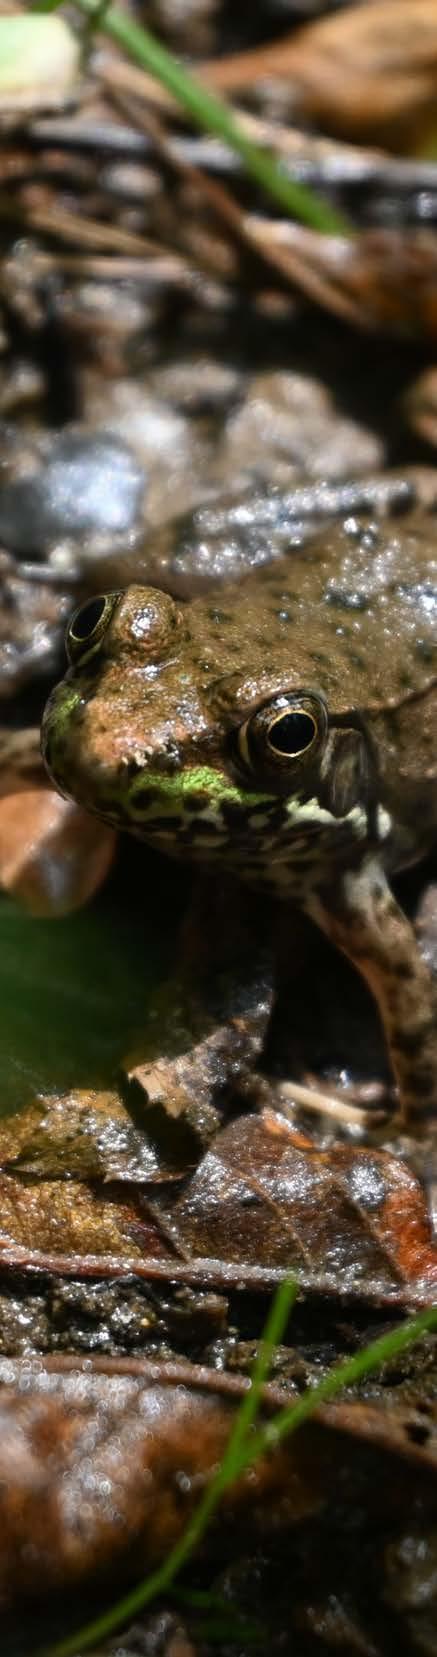
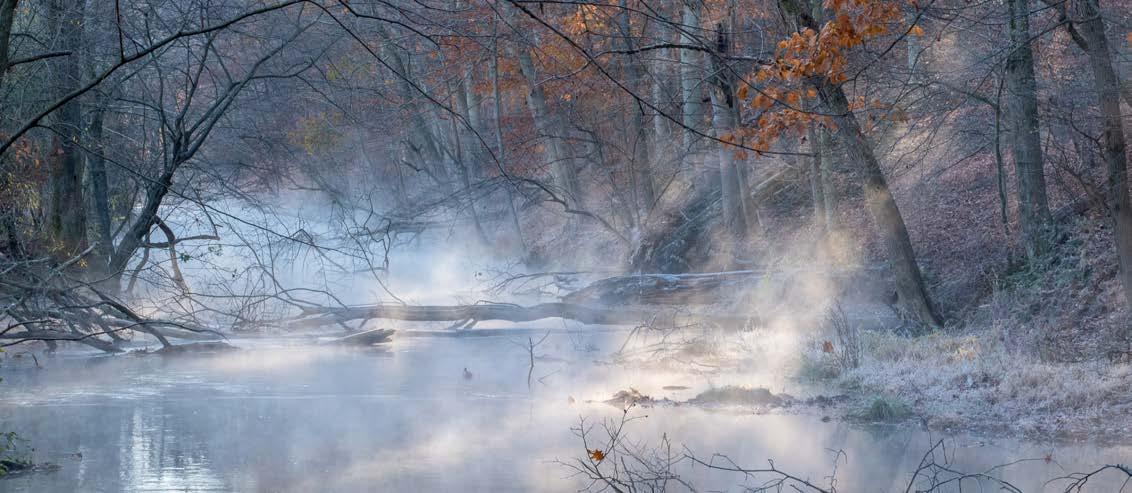
 GREEN FROG AT RIDLEY CREEK
| ANNA WILLIG
GREEN FROG AT RIDLEY CREEK
| ANNA WILLIG
In the Delaware River watershed, human life and the life of the waterways have always been closely connected. In what is now greater Philadelphia, the Lenni Lenape people once lived adjacent to the tributary streams of the then-heavilywooded region, relocating frequently along waterways in pursuit of fertile soils. Early Western European settlers used the Delaware River and its tributaries to ferry goods and agricultural products among settlements, and energy generated by the streams powered mills and tanneries. Today, reservoirs like Springton Lake are fed by these streams and in turn serve as a water source for many people. Weekend anglers flock to Ridley Creek State Park and local favorite fishing holes along streams and creeks, and the beauty of the waterways defines the vernacular of the local landscape, with towns, streets, and communities named for the picturesque streams that flow through them.
Critically valuable headwater streams originate in the far northern and western regions of Chester and Delaware counties, areas with strong legacies of protecting open space. As these streams fragment and branch in their reach toward the Delaware River, they traverse increasingly developed municipalities. Humans depend on these waterways, and yet human development and activity threaten the health and very existence of many of these streams and tributaries, with negative consequences for the Delaware River basin as a whole. Degraded water quality, impaired water flow, and regional flooding threaten the health of many plant and animal species.
The Delaware River Watershed Initiative (DRWI) was established to study existing water conditions within the Delaware River basin and to coordinate efforts, around both data collection and analysis, to develop best management practices for land use that can help reverse these negative trends. In 2017, a generous grant from the William Penn Foundation and a strong partnership with the Academy of Natural Sciences of Drexel University allowed Willistown Conservation Trust (WCT) to establish a Watershed Protection Program, with the goal of applying best practices from the DRWI to our regional watersheds. With the support of the Academy of Natural Sciences of Drexel University and Stroud Water Research Center, WCT Watershed Protection staff implemented a water quality monitoring program to understand how WCT’s conservation efforts have impacted local stream health.
This report provides a data-based analysis of the present conditions of our waterways in addition to recommendations for future watershed protection. Continued collaboration among watershed protection organizations and conservation organizations, with federal, state, municipal, and nongovernmental coordination, will be critical to protect healthy waterways and mitigate existing damage. In addition, the informed and concerted efforts of the citizens of this region, including their support for policies that protect watersheds, will be a critical component of any present and future watershed protection. Our hope is that this report will help community members understand the science behind the state of the streams and offer tangible suggestions for ways to improve watershed health. We know that we can improve the health of our streams when we work together. Life depends on it.

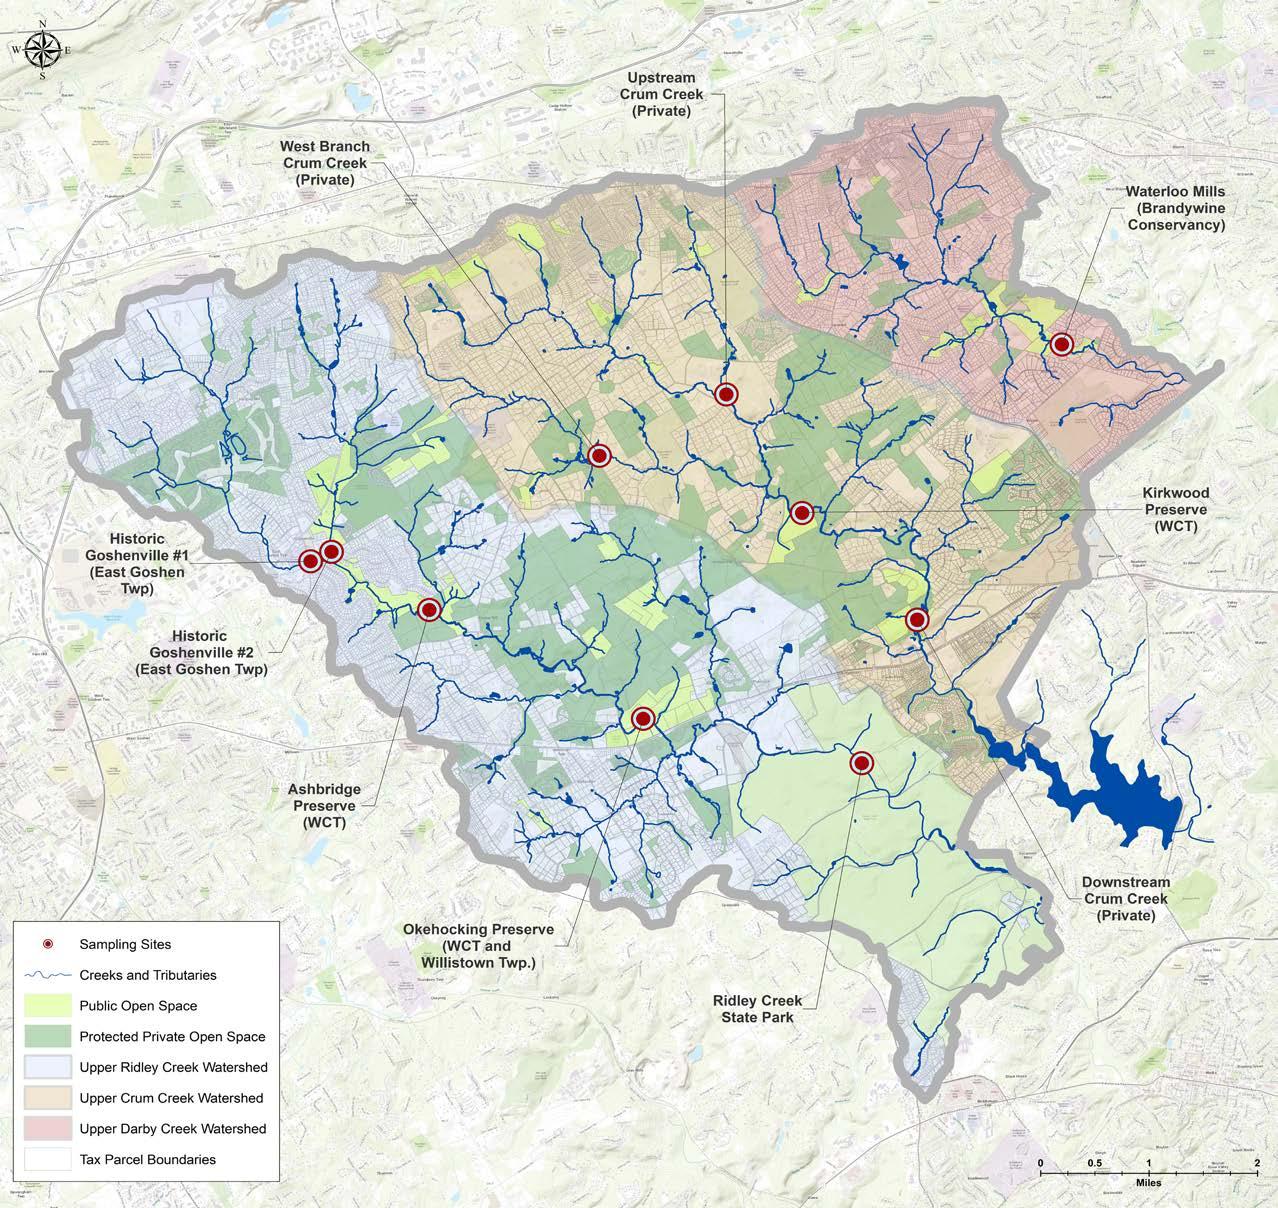
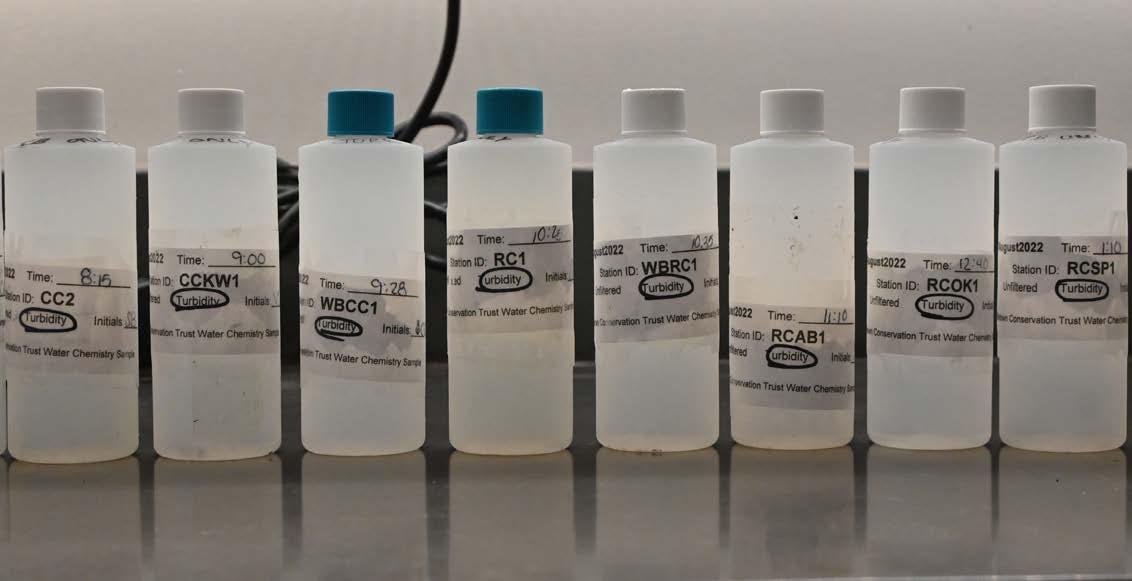
WBCC1: West Branch Crum Creek
WBRC1: West Branch Ridley Creek (East Goshen Twp)
RC1: Main Stem Ridley Creek (East Goshen Twp)
RCAB1: Ashbridge Preserve (WCT)
RCOK1: Okehocking Preserve (WCT & Willistown Twp)
CC2: Crum Creek Main Stem (Upstream)
DCWM1: Waterloo Mills (Brandywine Conservancy)
CCKW1: Kirkwood Preserve (WCT)
CC3: Crum Creek Main Stem (Downstream)
RCSP1: Ridley Creek State Park
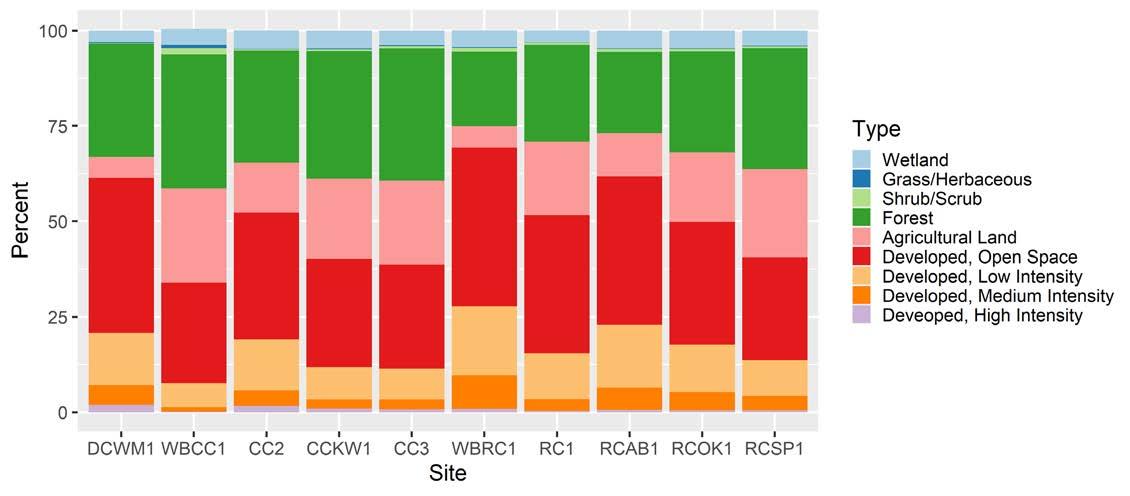
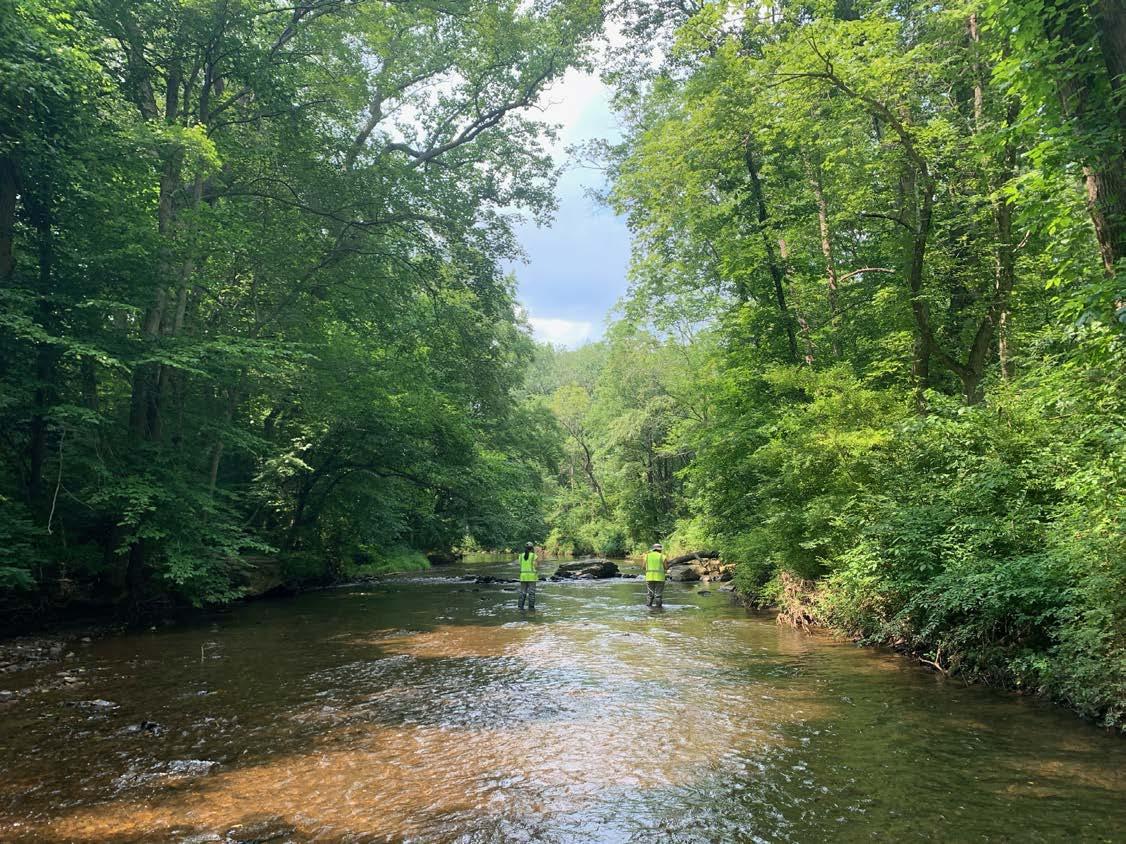
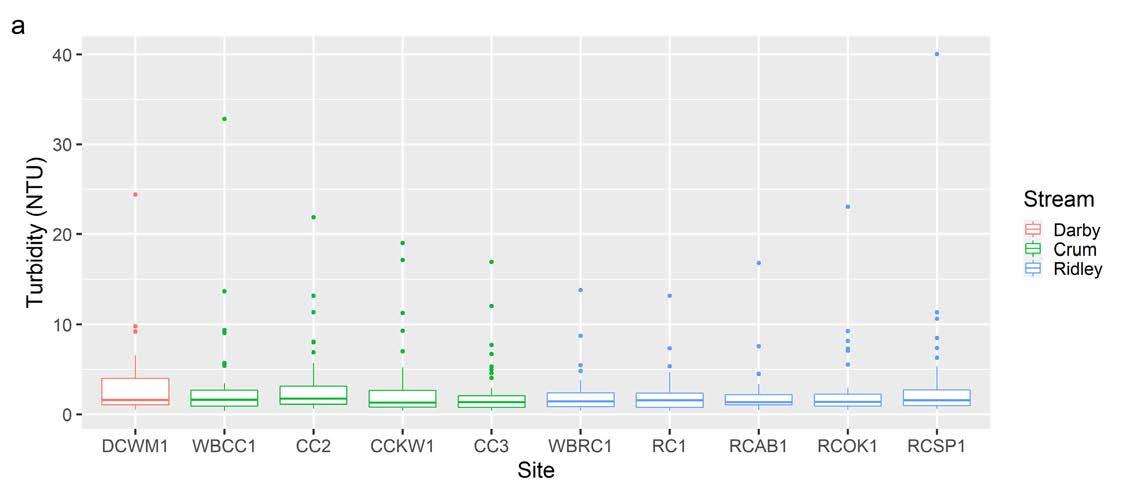
Figure 1. Willistown Conservation Trust’s sampling sites. Five sample locations are within the Ridley Creek Watershed, four are within the Crum Creek Watershed, and one is within the Darby Creek Watershed. Sampling was conducted at each site every four weeks from January 2018 through December 2021.From 2018 through 2021, the Watershed Protection Program conducted monthly monitoring at ten sample sites in the headwaters of Darby, Crum, and Ridley Creeks, which are all tributaries to the Delaware River (Figure 1). Due to the COVID-19 pandemic, the Watershed Protection Program paused monitoring and did not collect data from April 2020 through December 2020. Within this defined study area, catchments that drain into sample sites range in size from 5.25 km2 to 55 km2 (Table 1). In West Branch Crum Creek (WBCC1), Crum Creek at Kirkwood Preserve (CCKW1), Crum Creek Main Stem Downstream (CC3), and Ridley Creek State Park (RSCP1), forest is the dominant land use (Figure 2). In all other catchments, the dominant land use is developed open space — parcels that have a maximum of 20% impervious surface cover (Figure 2). An impervious surface is any surface that water cannot pass through, such as buildings, roads, parking lots, and sidewalks.

Results from analysis of our data, which includes 41 monitoring visits and over 7,500 different measurements, indicate that water quality is moderately impaired at all sample sites. Temperature is elevated at all sample sites, especially during summer months, stressing sensitive aquatic organisms such as trout and freshwater mussels. Specific conductivity (SPC) is elevated at all sample sites due to anthropogenic, or human-caused, inputs of ions, primarily in the form of salts and nutrients. Chloride concentrations are similarly elevated, likely due to applications of road salt in the winter. Nitrogen and phosphorus are present in concentrations above estimated natural background levels, likely from fertilizer runoff or leaky septic and sewer systems.
Water quality impairments in the headwaters of Darby, Crum, and Ridley Creeks are driven by human activities. Elevated temperature could be linked to increased development and the removal of the riparian canopy cover, which allows more sunlight to heat the water. Elevated SPC is linked to elevated chloride concentration, which is in turn related to impervious surface cover; the sites with the highest SPC and chloride concentration have the highest impervious surface cover in their surrounding catchments. These relationships suggest that road salt applied in winter persists in our streams throughout the year.
Our monitoring reveals the importance of land protection for maintaining and improving water quality in our area. Catchments with low impervious surface cover have better water quality, as demonstrated by lower SPC, than catchments with high impervious surface cover. The most impaired sites are Darby Creek at Waterloo Mills (DCWM1) and West Branch Ridley Creek (WBRC1), both of which have 20% impervious cover in their surrounding catchments and a high percentage of developed land (Table 1, Figure 2). The least impaired site is WBCC1, which has 9% impervious cover in its catchment, the lowest of all sites (Table 1). Generally, water quality in Ridley and Crum Creeks improves moving downstream through the study area. This is linked to the decrease in the percent impervious surface cover in downstream catchments as a result of the protection of substantial areas of open space.
Figure 2. Land use by sample site. Developed, Open Space indicates parcels where impervious surfaces account for less than 20% of total cover; Developed, Low Intensity indicates parcels where impervious surfaces account for 20% to 49% percent of total cover; Developed, Medium Intensity indicates parcels where impervious surfaces account for 50% to 79% of the total cover; Developed, High Intensity indicates parcels where impervious surfaces account for 80% to 100% of the total cover.1
Table 1
Watershed Site ID Site Name
Drainage Area (km2) Impervious Surface Cover (%)
Darby DCWM1 Darby Creek at Waterloo Mills 14.6 20.6 Crum
Ridley
WBCC1 West Branch Crum Creek 5.25 9.91
CC2 Crum Creek Main Stem Upstream 14.0 17.1 CCKW1 Crum Creek at Kirkwood Preserve 27.3 12.4
CC3 Crum Creek Main Stem Downstream 37.6 11.8
WBRC1 West Branch Ridley Creek 11.0 20.0 RC1 Main Stem Ridley Creek 8.32 14.1 RCAB1 Ridley Creek at Ashbridge Preserve 21.3 17.4
RCOK1 Ridley Creek at Okehocking Preserve 35.2 14.7
RCSP1 Ridley Creek State Park 55.0 12.2
Table 1. Impervious coverage percentage by sample site watershed.
This publication is designed for education and awareness purposes only. The information contained herein should be used to inform land use decisions and raise watershed literacy. A glossary of watershed terms is provided at the end of this document.
Statistical tests are used to determine if relationships between sites and variables are the result of random occurrences or if they are patterns with an underlying explanation. The key value that comes out of a statistical test is the p-value, which ranges from 0 to 1 and represents the likelihood that a relationship is the result of random variation. A p-value of 0.05 and below is considered statistically significant; there is a 5% chance or lower that the observed relationship is caused by randomness, meaning that there is likely a pattern with an explanation. For example, if a statistical test is run to compare water temperature at two sites and the p-value is 0.02, there is only a 2% chance that the difference between the sites is due to random variation. Rather, some other phenomenon is leading to statistically significant differences in water temperature at the two sites. Conversely, a p-value of 0.75 would indicate that there is a 75% chance that any difference between sites is caused merely by randomness and that there are no significant differences in water temperature between sites.
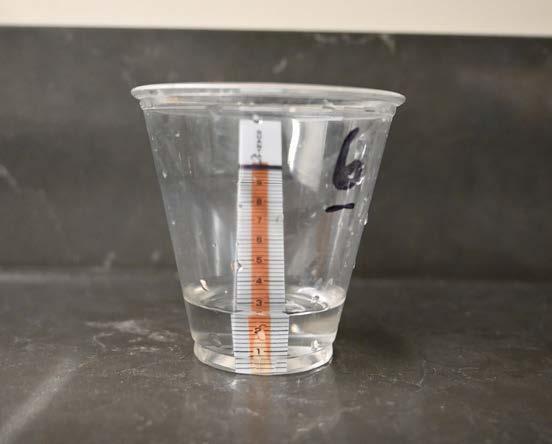
Scatterplots are graphs that show individual data points as dots (Figure 3). Each dot represents one data point — in this case, a measurement at a sample site — that is plotted against two variables, one on the horizontal axis (x-axis) and one on the vertical axis (y-axis). Scatterplots are useful for visualizing changes in a specific variable (such as water temperature) over time or for comparing two different variables. Many scatterplots in this document that show the change in a variable over time have a large gap with no data. This gap reflects a pause in sampling due to the COVID-19 pandemic.
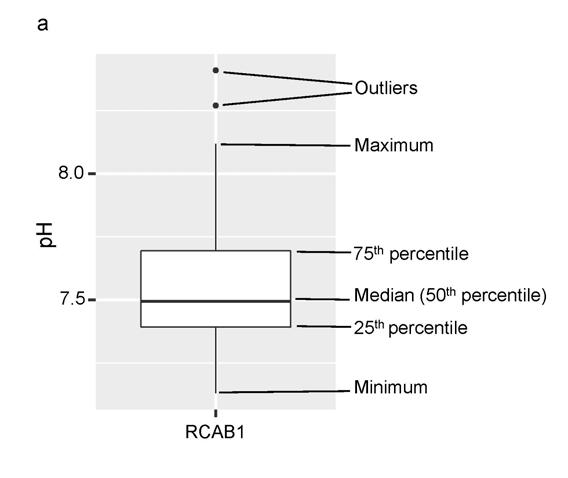
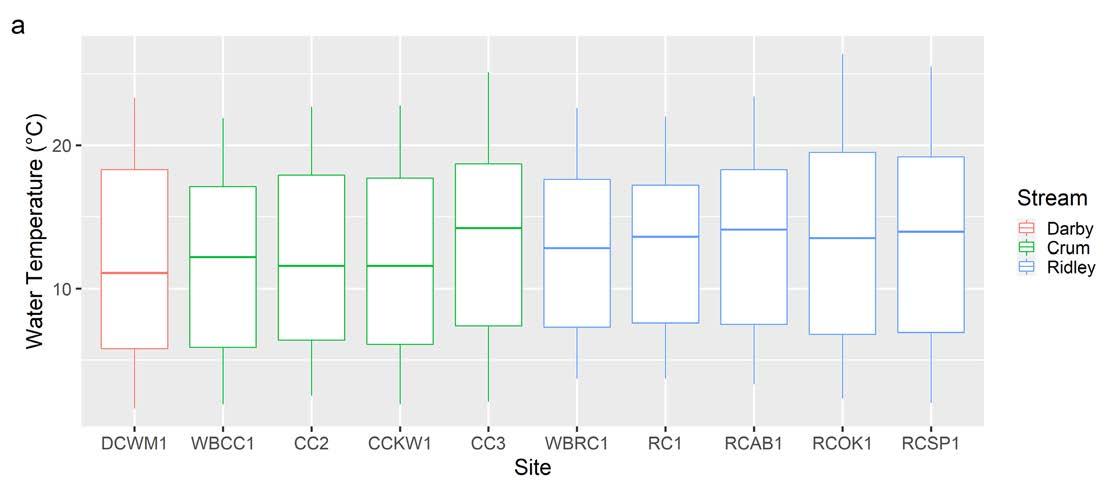
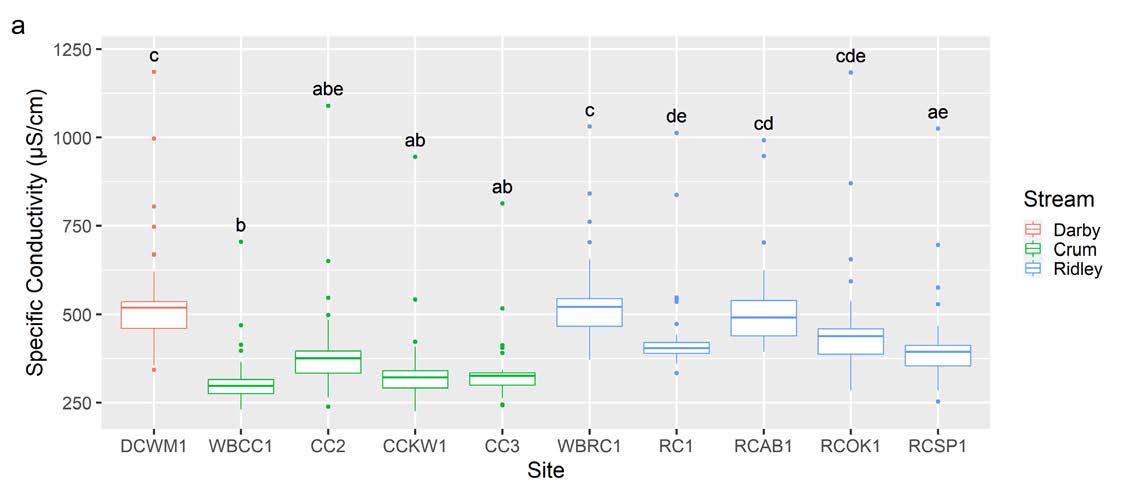
A boxplot is a chart that visualizes the distribution of all measurements of a specific variable and allows for comparisons between sample sites. Boxplots are made up of two parts, a box and whiskers (Figure 4a). The box represents the spread of the middle half of data points and shows the median. Whiskers extend to maximum and minimum values. Data points outside the whiskers can be considered outlier values. The size of the box represents the spread of the data: a small box indicates that most values are similar, while a large box signifies high variability.
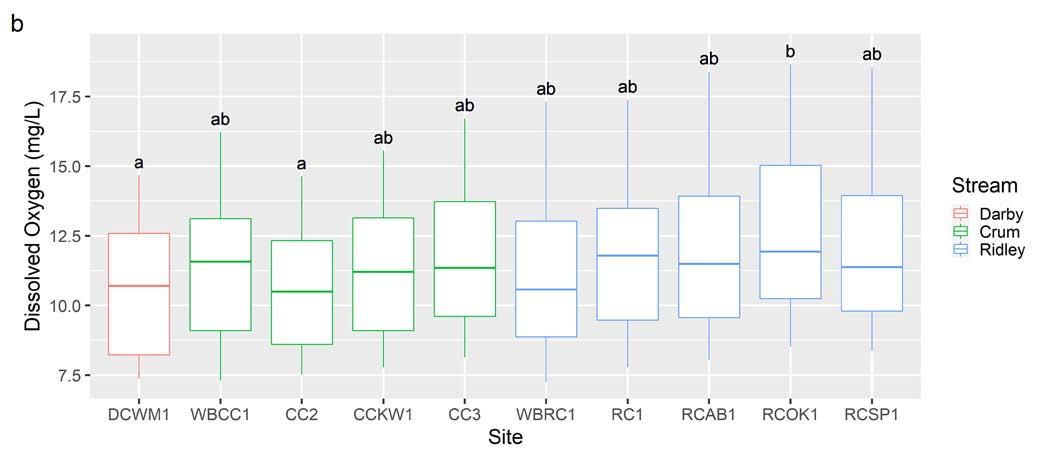
Letters above boxplots denote statistical relationships between sites; sites that share a letter have statistically similar means (or averages) and sites that do not share any letters have significantly different means at the p < 0.05 level (Figure 4b). If there are no letters, there are no statistically significant differences between any sample sites. For example, in Figure 4b, which shows dissolved oxygen, all sites are labeled with either an ‘a’, ‘b’, or ‘ab.’ DCWM1 and Crum Creek Main Stem Upstream (CC2) are labeled with an ‘a,’ meaning they are statistically similar to each other and to all sites that have an ‘ab.’ The only site that DCWM1 and CC2 are significantly different from is Ridley Creek at Okehocking Preserve (RCOK1), which is only labeled with a ‘b.’ However, RCOK1 is also statistically similar to all the sites that are labeled with an ‘ab,’ since these sites all share a ‘b.’
4a
4b.
Three main parameters form the backbone of water quality monitoring in streams: water temperature, dissolved oxygen (DO), and pH. In the headwater streams studied for this report, water temperature is tightly linked to air temperature, causing seasonal variation. Land use also influences water temperature. Removal of trees along streams allows sunlight to heat the water, and impervious surfaces can heat up rainfall before it enters the streams. Elevated water temperature is of concern due to its relationship with DO. All organisms, including stream organisms, need oxygen to breathe. In waterways, DO represents the amount of oxygen available for respiration. As temperature increases, water can hold less DO, meaning that there may not be enough DO available for all stream life. pH measures how acidic or basic water is and provides another benchmark for stream health. If water is too acidic or basic, it becomes toxic for many aquatic organisms, even if water temperature is not too high and there is enough DO. Thus, measuring water temperature, DO, and pH can quickly reveal how hospitable streams are for aquatic life.
Water temperature is the primary parameter by which the Pennsylvania Department of Environmental Protection (PADEP) designates protected uses for streams. Water temperature alters the amount of DO in the water, and consequently, different species can tolerate different temperatures. The three protected uses that have temperature criteria are Cold Water Fisheries (CWF), Warm Water Fisheries (WWF), and Trout Stocked Fisheries (TSF). A CWF supports the survival and reproduction of Salmonidae fish species (including Brook Trout, Salvelinus fontinalis) and other aquatic flora and fauna that require a cold water habitat, while a WWF supports the survival of fish and aquatic flora and fauna that can tolerate a warmer habitat.2 A TSF supports the survival of stocked trout from February 15 to July 31 in addition to all the species supported by a WWF.2
EASTERN ELLIPTIO (ELLIPTIO COMPLANATA) FOUND AT RIDLEY CREEK AT ASHBRIDGE PRESERVE | JENNIFER MATHES RIDLEY CREEK AT ASHBRIDGE PRESERVE5b.
Figure 5. Water temperature from January 2018 through December 2021 (a) across ten sample sites in the headwaters of the Darby, Crum, and Ridley Creeks and (b) over time. The lines represent maximum allowable temperatures for a Cold Water Fishery (CWF), Trout Stocked Fishery (TSF), and Warm Water Fishery (WWF).
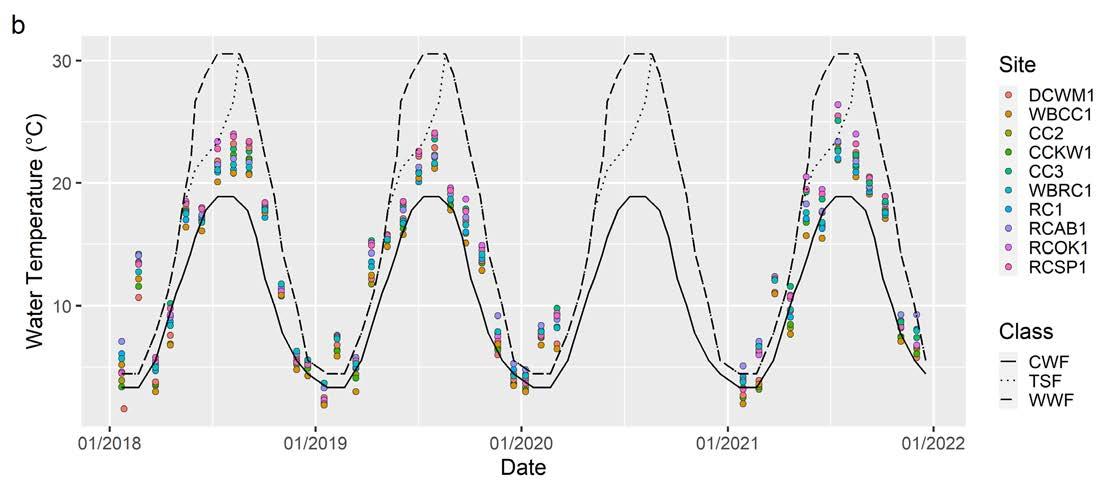
Water temperature is elevated at all sample sites and has exceeded CWF, WWF, and TSF standards (Figure 5b). Water temperatures are regularly above CWF maximums throughout the year. In winter and spring months, water temperatures can exceed WWF and TSF maximums during unseasonably warm days. During summer months, water temperatures are consistently below WWF maximums and occasionally exceed TSF maximums during heat waves. The frequency with which temperature exceeds CWF requirements and the occasional exceedance of WWF and TSF maximums signifies that all sites are impaired by elevated temperature. This stresses sensitive organisms such as Brook Trout, freshwater mussels, and stream insects like mayflies, stoneflies, and caddisflies.
Water temperature ranges from a low of 1.6˚C in DCWM1 to a high of 26.4˚C in RCOK1. The large range in water temperatures reflects the difference between low winter temperatures and high summer temperatures (Figure 5a). Since the streams are relatively small, they readily respond to changes in air temperature. High fluctuations between summer and winter temperatures can stress stream life, with sensitive organisms being unable to tolerate the warmer conditions. At a watershed scale, mean temperature is lowest in Crum Creek, at 12.3 ± 0.53˚C and highest in Ridley Creek, at 13.1 ± 0.46˚C, with Darby Creek in the middle at 12.4 ± 1.12˚C. There are no significant differences in temperature between sites (p = 0.92). The maximum temperatures at all sites were recorded on July 15, 2021, after a heat wave in which nine of the ten previous days reached over 32˚C (Figure 5b). Another day of note is February 21, 2018, when water temperatures were unseasonably warm as the air temperature reached 24˚C (Figure 5b).
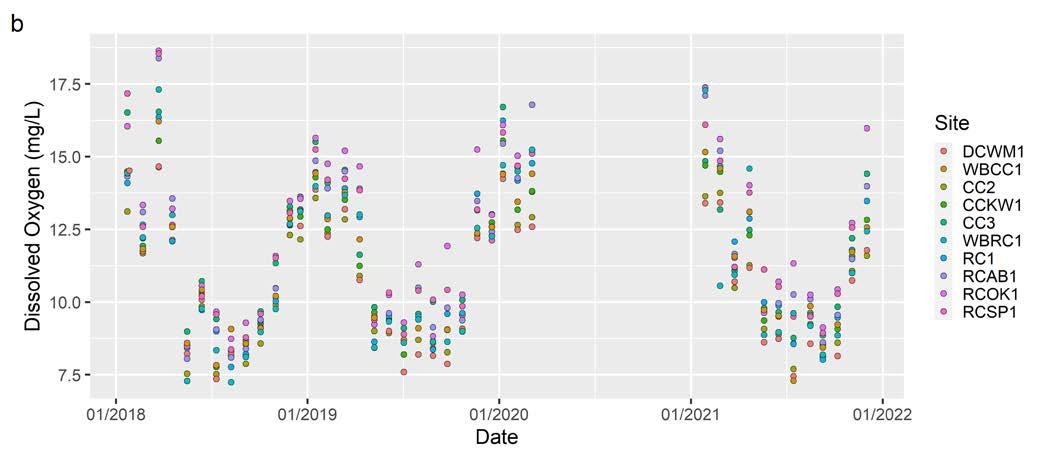
All living animals require oxygen to breathe, and stream-dwelling organisms like fish and aquatic insects are no exception. Dissolved oxygen (DO) is the amount of oxygen that is held in water and available to aquatic organisms for respiration. DO is temperature dependent. Cold water can hold a higher concentration of DO than warm water; consequently, DO is highest in the winter and lowest in the summer (Figure 6b). DO is also related to photosynthesis. As aquatic primary producers, or plants and algae, photosynthesize during the day, they increase the amount of DO in the water. Conversely, as these producers cease photosynthesis at night, they consume oxygen through respiration, decreasing the amount of DO in the water. As a result, DO follows a daily cycle, rising during the day and falling during the night.3
The amount of DO in the water impacts the reproduction and survival of many species. If DO drops below a certain level, aquatic organisms will be too stressed to reproduce. If it drops further, these organisms may suffocate and die. The DO standard for a CWF, according to the PADEP, depends on the presence or absence of naturally reproducing salmonids. To the best of our understanding, none of the sampled streams have naturally reproducing salmonids, so the DO standards for a CWF are at least 6.0 mg/L over a 7-day average with a minimum of 5.0 mg/L at any given time.4 DO has not dropped below 7.0 mg/L at any sample sites, but all measurements were taken during daylight hours and do not capture nighttime DO minimums. Consequently, it is unclear whether DO is within the range of a CWF at the sample sites.

In the study area, DO ranges from a low of 7.25 mg/L at WBRC1 to a high of 18.6 mg/L at RCOK1 (Figure 6a). Mean DO is lowest at CC2 (10.58 ± 0.34 mg/L) and highest at RCOK1 (12.5 ± 0.43 mg/L). At a watershed scale, mean DO is lowest in Darby Creek, at 10.6 ± 0.35 mg/L, slightly higher in Crum Creek, at 11.2 ± 0.18 mg/L, and highest in Ridley Creek, at 11.8 ± 0.19 mg/L. There are significant differences in DO between sites (p = 0.017), with DO significantly higher at RCOK1 than at CC2 (p = 0.028) and DCWM1 (p = 0.032, Figure 6b).
7a.
7b
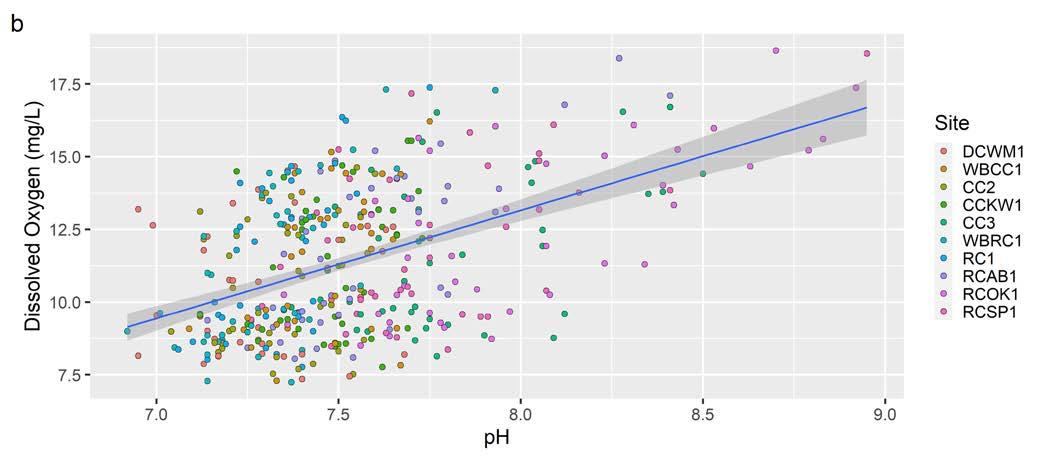
As stated above, DO is temperature dependent, and there is a significant negative relationship between water temperature and DO that drives seasonal variation, as expected (p < 2.2 * 10-16, Figure 7a). There is also a significant positive relationship between pH and DO (p < 2.2 * 10-16, Figure 7b). DO and pH do not influence each other, rather, the two are linked through photosynthesis; as aquatic plants and algae photosynthesize, they take up carbon dioxide, which increases pH, and they release oxygen, which increases DO.5–7 This relationship between DO and photosynthesis could explain why DO is higher at RCOK1 compared to DCWM1 and CC2 — RCOK1 is always sampled in the afternoon while DCWM1 and CC2 are sampled in the morning. However, RCSP1 and CC3 are also sampled in the afternoon and are not significantly higher than DCWM1 and CC2, suggesting that other factors, in addition to photosynthesis, may explain the differences in DO at these sites.
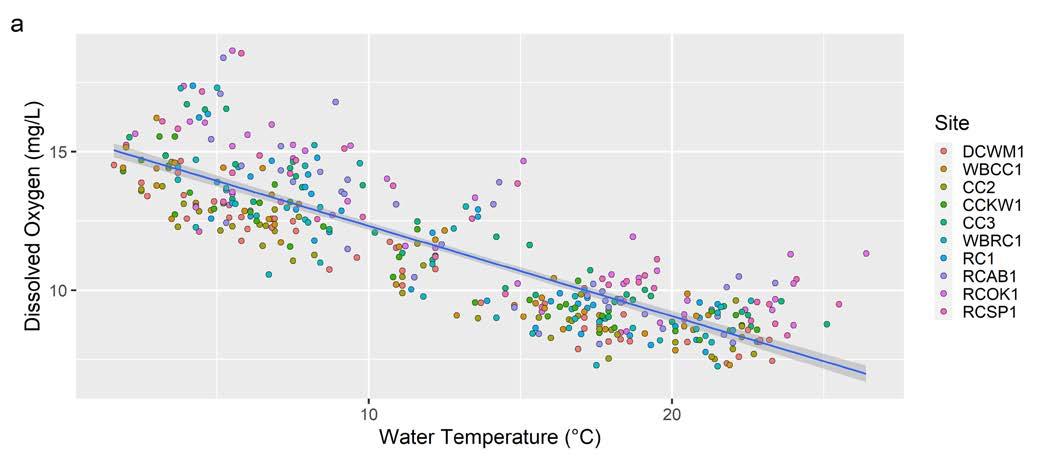 Figure 7. The relationship between dissolved oxygen and (a) water temperature and (b) stream pH at ten sample sites in the headwaters of the Darby, Crum, and Ridley Creeks from January 2018 through December 2021. The blue line is a linear trendline and the shaded region denotes the 95% confidence interval.
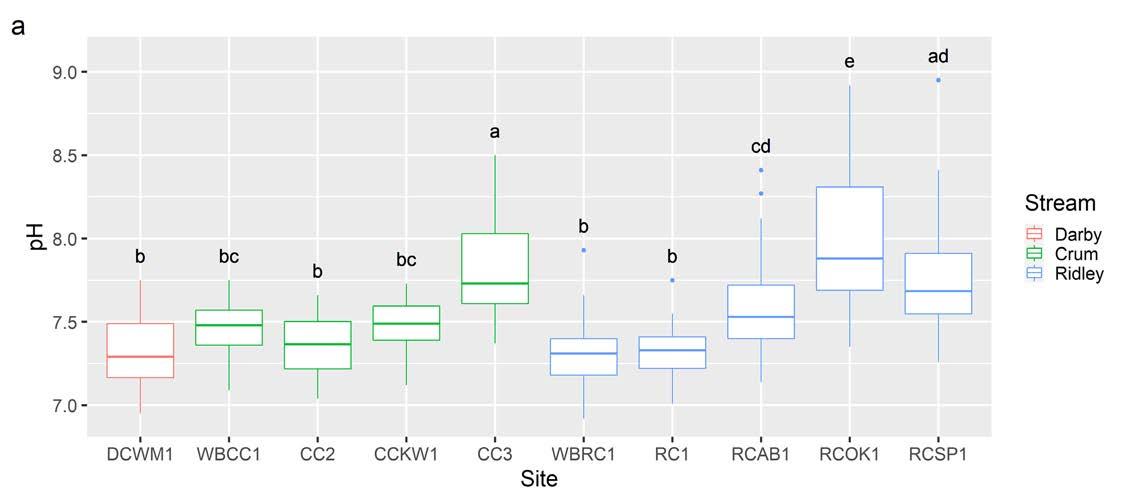
Another important water quality parameter is pH, which measures how acidic or basic water is. A pH of 7.0 is neutral, a pH below 7.0 is acidic, and a pH above 7.0 is basic. pH determines how easily an aquatic organism can use nutrients and indicates how toxic pollutants may be. To qualify as a protected fishery by the PADEP, a stream must have a pH between 6.0 and 9.0.4 When pH is outside this range, nutrients become difficult to absorb and pollutants become more toxic, stressing organisms and leading to a reduction in biodiversity. Stream pH is influenced by in-stream photosynthesis, local soil type, geology, and human-based pollution.
The pH of each stream in the study area tends to be slightly basic. The lowest pH value is 6.92, recorded at WBRC1, and the highest pH value is 8.95, recorded at RCSP1 (Figure 8a). Main Stem Ridley Creek (RC1) has the lowest mean pH (7.32 ± 0.02) and RCOK1 has the highest mean pH (8.00 ± 0.06). Mean pH shows little variation between watersheds, ranging from 7.33 ± 0.03 in Darby Creek to 7.59 ± 0.03 in Ridley Creek, with Crum Creek in the middle at 7.53 ± 0.02. No sites have pH measurements outside the 6.0 - 9.0 range designated by PADEP as a protected fishery, though RCOK1 and RCSP1 reach over 8.9.4 pH does not exhibit strong seasonal variation (Figure 8b).
There are significant differences in pH between sites (p < 2.2 * 10-16). pH is significantly higher at RCOK1 than at all other sample sites and is also elevated at CC3 and RCSP1 (Figure 8a). Some variation in pH between sites could be explained by the sampling time. As described in the previous section, the removal of carbon dioxide through photosynthesis increases stream pH. Photosynthesis peaks in the afternoon and, consequently, pH tends to be higher in the afternoon. RCOK1, RCSP1, and CC3 are always sampled in the afternoon, therefore, photosynthesis likely explains the elevated pH at these sites.
8b.
Figure 8. Stream pH from January 2018 through December 2021 (a) across ten sample sites in the headwaters of the Darby, Crum, and Ridley Creeks and (b) over time.
Monitoring the physical characteristics of streams, in addition to water chemistry, provides deeper insight into water quality and stream health. These characteristics include discharge, which is the volume of water flowing through the stream in a given time, turbidity, or cloudiness of water, and total suspended solids (TSS), which is the total mass of sediment and debris in the water. The physical characteristics of the stream are influenced by the landscape in the surrounding watershed. Impervious surfaces can increase the velocity and energy of water during storm events, allowing stormwater to pick up and carry more sediment into the nearest body of water. These surfaces also block the infiltration of water into the soil, leading to more stormwater entering the stream and greater flooding. The removal of trees and shrubs destabilizes soil, leading to more sediment in streams. Headwater streams, which are the origins of stream systems, can carry this sediment and pollution throughout the entire waterway, harming downstream ecosystems. Studying discharge and sediment dynamics can identify areas of rapid erosion that should be targeted for restoration.
9b.
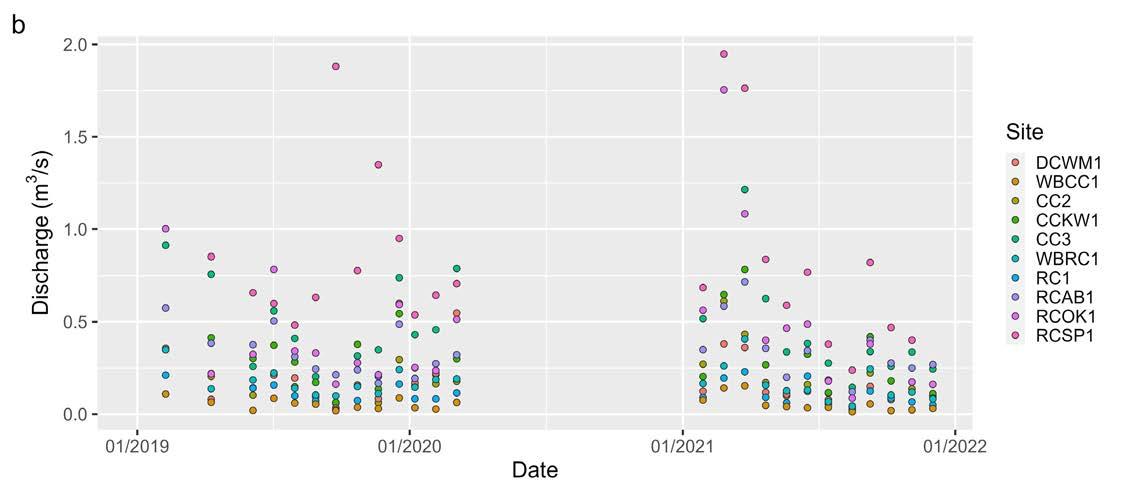
Figure 9. Stream discharge from February 2019 through December 2021 (a) across ten sample sites in the headwaters of the Darby, Crum, and Ridley Creeks and (b) over time. Starting June 2019, discharge measurements were recorded monthly. Prior to June 2019, measurements were recorded quarterly.
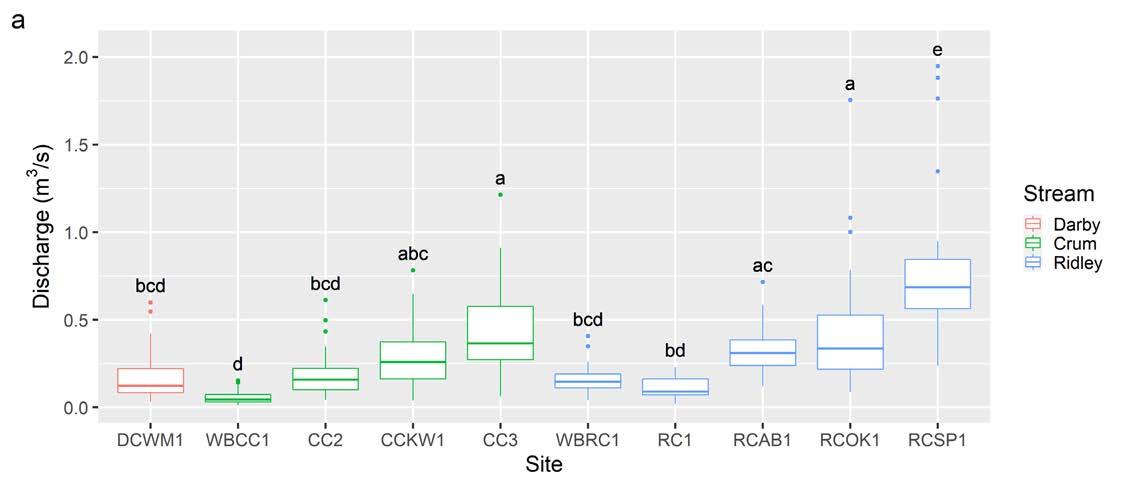
Discharge is the volume of water flowing through a stream over time and is measured in cubic meters per second (m3/s). Discharge reflects the size of the stream; as more tributaries and groundwater enter the stream, the stream becomes bigger, therefore discharge increases as well. Prior to June 5, 2019, discharge was not consistently measured on sample days. In the study area, discharge ranges from a low of 0.013 m3/s at WBCC1 to a high of 1.948 m3/s at RCSP1. Mean discharge is lowest at WBCC1 (0.057 ± 0.008 m3/s) and highest at RCSP1 (0.825 ± 0.098 m3/s). There are significant differences in discharge between sites (p < 2.2 * 10-16). Within each watershed, discharge is significantly higher at the most downstream site than it is at the most upstream sites, and discharge at RCSP1 is significantly greater than discharge at all other sample sites (Figure 9a).
Spikes in discharge are related to rainfall or snowmelt events, which increase the amount of water flowing through the stream. Changes can also be caused by debris that dams streams. For example, the abrupt increase in discharge at RCSP1 on September 25, 2019 was caused by downed trees that dammed Ridley Creek just downstream of the sample site (Figure 9b). By January 8, 2020, the blockage was cleared and discharge returned to normal (Figure 9b). Decreases in discharge during summer months are caused by lack of rainfall. The lowest discharge at all sites but CC3 was recorded on August 16, 2021, after an extended period with little rain (Figure 9b).
10a.
10b.
Figure 10. Turbidity from January 2018 through December 2021 (a) across ten sample sites in the headwaters of the Darby, Crum, and Ridley Creeks and (b) over time.
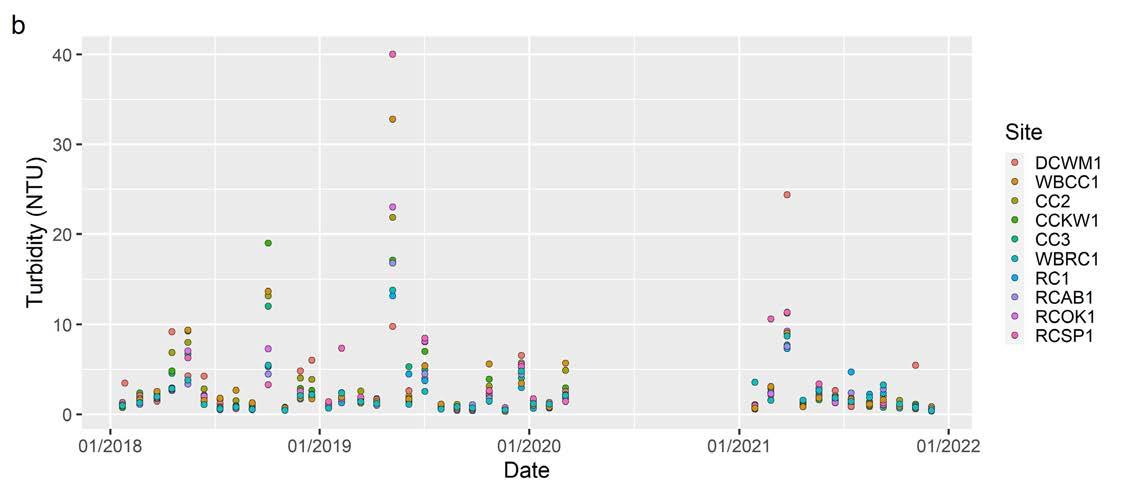
Turbidity measures the amount of light that can pass through a water sample. Clear water has low turbidity and cloudy water has high turbidity. Turbidity provides an estimate for the amount of sand, silt, and other sediment in the water; as the amount of sediment in the water increases, so does the turbidity. However, turbidity is sensitive to the type of sediment — differences in the size, texture, and shape of sediment particles affect turbidity measurements — and should be considered a gross approximation for sediment concentration.
Turbidity ranges from 0.35 NTU in WBCC1 to 40.03 NTU in RCSP1 (Figure 10a). At a watershed scale, mean turbidity is lowest in Ridley Creek, at 2.53 ± 0.27 NTU, higher in Crum Creek at 2.99 ± 0.34 NTU, and highest in Darby Creek, at 3.12 ± 0.64 NTU. There are no significant differences in turbidity between sites (p = 0.79). Turbidity does not vary seasonally (Figure 10b). There is a significant but weak correlation between turbidity and discharge, suggesting that spikes in turbidity are related to influxes of sediment after rainfall or snowmelt events (p = 6.4 * 10-8). The weakness of the relationship is likely due to differences in the amount of erosion and the type of sediment at each sample site.
Closely related to turbidity is total suspended solids (TSS), or the mass of suspended particles, typically sediment, in a specified volume of water. While turbidity roughly estimates the amount of sediment in the water, TSS is a more exact approximation. Though the transport of sediment is a natural process in streams and rivers, excess or sudden movement of sediment can harm aquatic organisms. When sediment is deposited on stream beds, it can smother macroinvertebrates and cover crucial streambed habitat. In the water column, suspended solids absorb sunlight, heating up the water and limiting the ability of aquatic plants and algae to photosynthesize. Though TSS analysis helps understand erosion and sediment movement in waterways, there are no state or federal standards governing acceptable TSS levels.
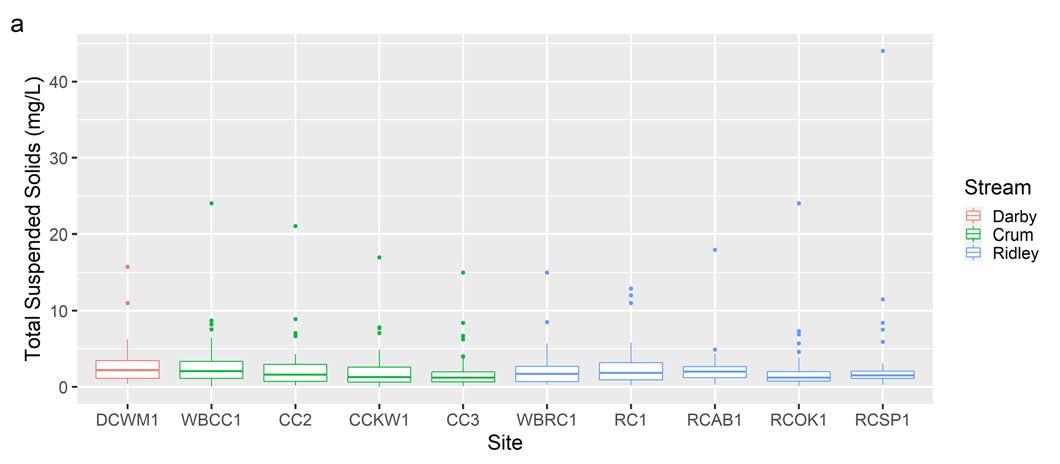
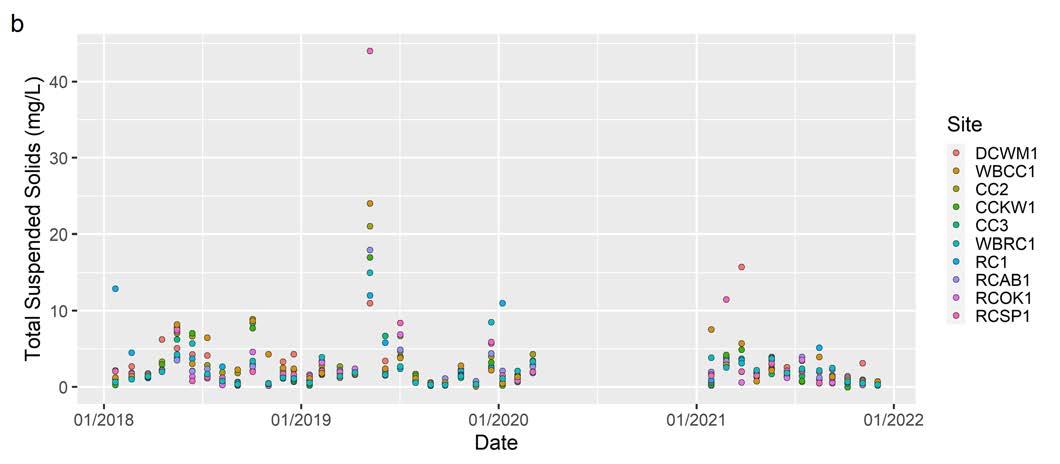
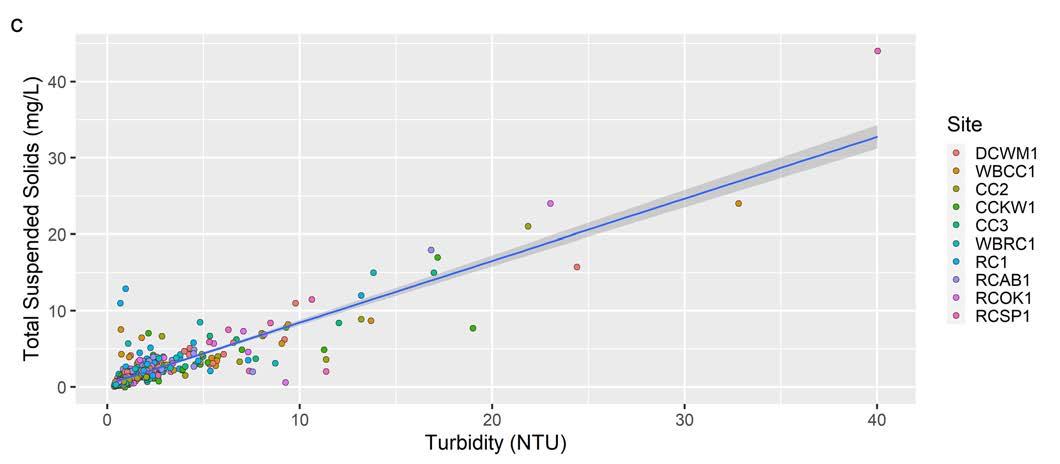
TSS ranges from 0.0 mg/L at CCKW1 to 44.0 mg/L at RCSP1 (Figure 11a). At a watershed scale, mean TSS is lowest in Crum Creek (2.57 ± 0.27 mg/L), higher in Ridley Creek (2.57 ± 0.29 mg/L), and highest in Darby Creek (3.12 ± 0.64 mg/L). There are no significant differences in TSS between sites (p = 0.94). TSS does not show strong seasonal variation; spikes in TSS are due to influxes of sediment after precipitation events (Figure 11b). There is a significant, but weak, correlation between discharge and TSS, suggesting influxes of sediment during storm events (p = 8.9 * 10-4). There is a significant correlation between turbidity and TSS, indicating that turbidity can reflect TSS (p < 2.2 * 10-16, Figure 11c). However, due to differences in sediment characteristics, turbidity should only be used to predict TSS at a site-specific scale.
Figure 11. Total suspended solids from January 2018 through December 2021 (a) across ten sample sites in the headwaters of Darby, Crum, and Ridley Creeks, (b) over time, and (c) the relationship between turbidity and total suspended solids. The blue line is the linear trend line and the shaded region represents the 95% confidence interval.
To better understand water chemistry dynamics and potential sources of pollution to the headwaters of Darby, Crum, and Ridley Creeks, we examined chloride (often an indicator of salt contamination), nutrients, and specific conductivity (SPC). Chloride (Cl ) is an ion that forms when salts and, to a lesser extent, fertilizers dissolve in water and is toxic to stream organisms at high concentrations. Nutrients, mainly nitrogen and phosphorus, enter streams from fertilizer runoff and leaky septic and sewer systems. High nutrient concentrations can disrupt normal ecological processes in streams. Cl , nitrogen, and phosphorus are all naturally present in low concentrations in streams. However, increases in development and impervious surface cover can increase the concentration of these compounds, threatening water quality.
SPC is a broad water quality measurement that reflects the presence of ions, including Cl and compounds that form when nutrients dissolve. Higher SPC measurements indicate a higher concentration of ions. However, SPC does not provide insight into the type or concentration of ions in the streams. Monitoring Cl and nutrient concentrations can explain changes in SPC over time or differences between sites.
 RIDLEY CREEK AT ASHBRIDGE PRESERVE | JENNIFER MATHES
Cl is naturally present in streams at low concentrations due to the weathering of rocks and soils. As previously mentioned, road salt (primarily in the form of sodium chloride, NaCl) is the main anthropogenic source of Cl in streams, though fertilizers can also contribute Cl . Long-term increases in Cl have been reported nation-wide.8 When present at elevated levels, Cl can disrupt ion transport in cells, stressing the microbes, plants, and animals that live in streams. Though much is still unknown about the effects of chronic exposure to elevated Cl , warmer temperatures can exacerbate the harm of Cl on a stream ecosystem.9
Cl concentration is analyzed every quarter via titration as mg/L and every month via Quantab strips as ppm. Monthly analysis began on January 16, 2019. The PADEP maximum for Cl is 250 mg/L (250.3 ppm) for a potable water supply (PWS).4
12a.
12b.
Figure 12. Quarterly analysis of chloride concentration via titration from January 2018 through April 2021 (a) across ten sample sites in the headwaters of the Darby, Crum, and Ridley Creeks and (b) over time.
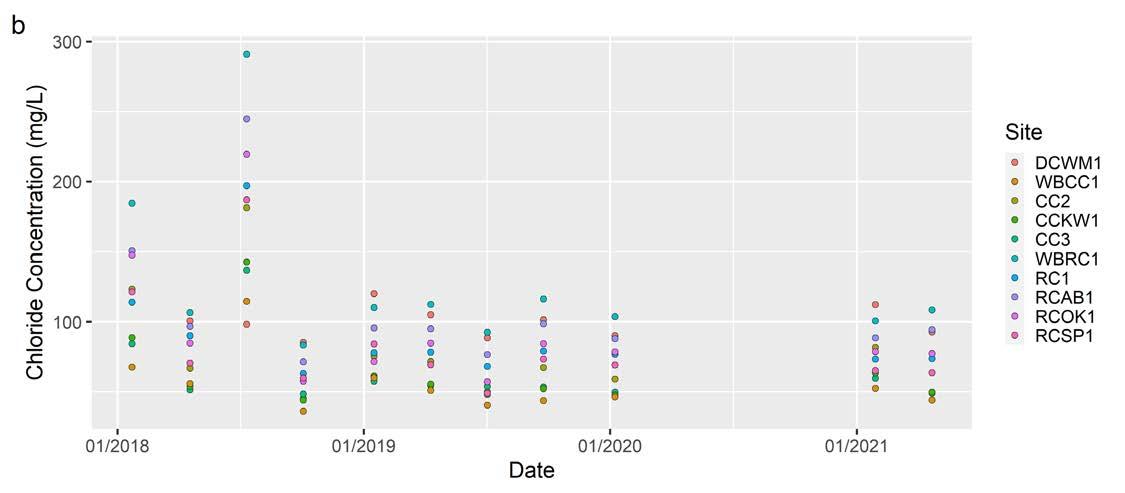
Based on quarterly analysis, Cl concentration remains below the PADEP standard of 250 mg/L, apart from one sampling visit, when Cl concentration reached 291 mg/L at WBRC1 and 245 mg/L at Ridley Creek at Ashbridge Preserve (RCAB1) (Figure 12b).4 Cl is expected to be highest during winter months when road salts are applied, but, interestingly, the highest Cl concentrations were measured on July 11, 2018 (Figure 12b).

Quarterly Cl concentration ranges from a low of 36 mg/L at WBCC1 to a high of 291 mg/L at WBRC1 (Figure 12a). Mean Cl concentration is lowest at WBCC1 (55 ± 6.5 mg/L) and highest at WBRC1 (128 ± 18 mg/L). At a watershed scale, mean Cl concentration is lowest in Crum Creek (66 ± 4.5 mg/L ), higher in Darby Creek (100 ± 3.4 mg/L), and highest in Ridley Creek (101 ± 6.5 mg/L). There are significant differences in Cl between sites (p = 5.6 * 10-4, Figure 12a), with significantly higher Cl concentration at WBRC1 than at all Crum Creek sites except CC2.
Cl- concentration measured by Quantab strips is strongly related to Cl concentration measured by titration, demonstrating that both analyses are valid (p < 2.2 * 10-16, Figure 13c). However, monthly analysis of Cl concentration provides a better understanding of seasonal Cl dynamics, capturing winter spikes in Cl (Figure 13b) that were not captured by quarterly analysis (Figure 12b). Based on monthly analysis, Cl concentration in the sample area has not exceeded the PADEP standard of 250.3 ppm for a PWS, though WBRC1 and DCWM1 have reached 247 ppm (Figure 13a).4
Cl concentration ranges from 27 ppm at WBCC1 to 247 ppm at DCWM1 and WBRC1 (Figure 13a). Mean Cl concentration is lowest at WBCC1 (45 ± 2.6 ppm) and highest at WBRC1 (98 ± 7.0 ppm). At a watershed scale, mean Cl concentration is lowest in Crum Creek (51 ± 1.7 ppm), higher in Ridley Creek (80 ± 3.8 ppm), and highest in Darby Creek (90 ± 7.2 ppm).
There are significant differences in monthly Cl concentration between sites (p = 2.2 * 10-16). Due to a higher frequency of measurement, monthly Cl reveals more significant differences between sites than quarterly analysis. There are no significant differences in monthly Cl concentration between Crum Creek sites (Figure 13a). However, in Ridley Creek, Cl concentration is significantly lower at RCSP1 than at WBRC1, indicating either a reduction in Cl entering the stream or dilution as discharge increases (Figure 13a). Cl concentration in Darby Creek is comparable to most Ridley Creek sites, with RCSP1 and all Crum Creek sites having lower concentrations (Figure 13a). Notably, Cl is significantly higher at WBRC1 than at RC1, despite their proximity (Figure 13a, Figure 1). Cl concentration is generally higher in winter months than in other seasons, likely due to road salt applications (Figure 13b).
Figure 13. Monthly analysis of chloride concentration via Quantab strips from January 2019 through December 2021 (a) across ten sample sites in the headwaters of the Darby, Crum, and Ridley Creeks and (b) over time. (c) The relationship between monthly analysis of chloride concentration (ppm) via Quantab strips and quarterly analysis of chloride concentration (mg/L) via titration.
Nutrients are chemical compounds that are essential to the growth and survival of living organisms. The two most common nutrients are nitrogen and phosphorus, which enter the water through animal waste, fertilizer runoff, and leaky septic and sewer systems and cycle through the environment in a complex system. Nutrients are considered limiting factors in the environment and an excess of nutrients in streams can trigger a process called eutrophication, which leads to rapid growth of vegetation and algae and ultimately depletes DO as vegetation dies and decomposes.10
14a. 14b.
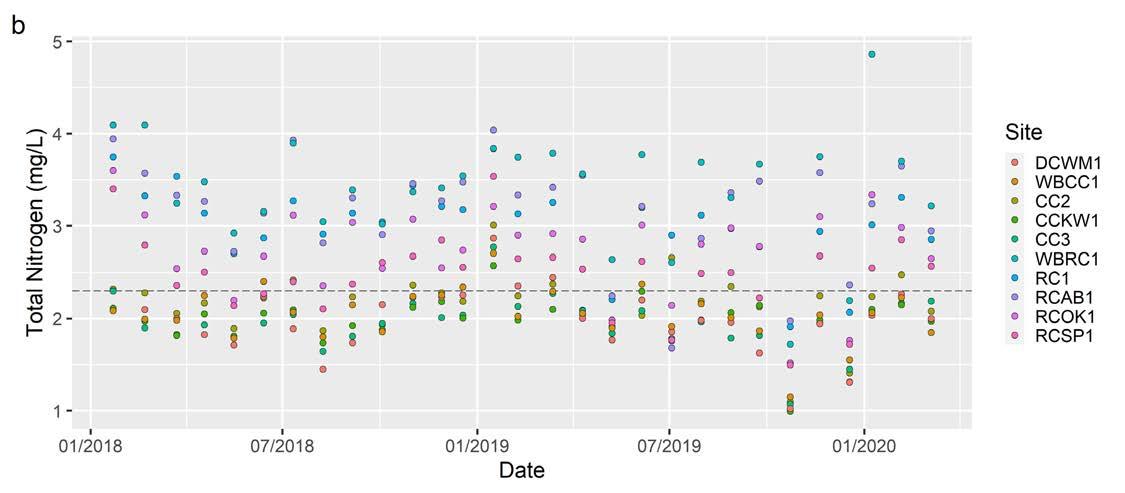
Figure 14. Total nitrogen from January 2018 through March 2020 (a) across ten sample sites in the headwaters of the Darby, Crum, and Ridley Creeks and (b) over time. The dashed line represents the recommended maximum total nitrogen threshold for streams in this ecoregion.
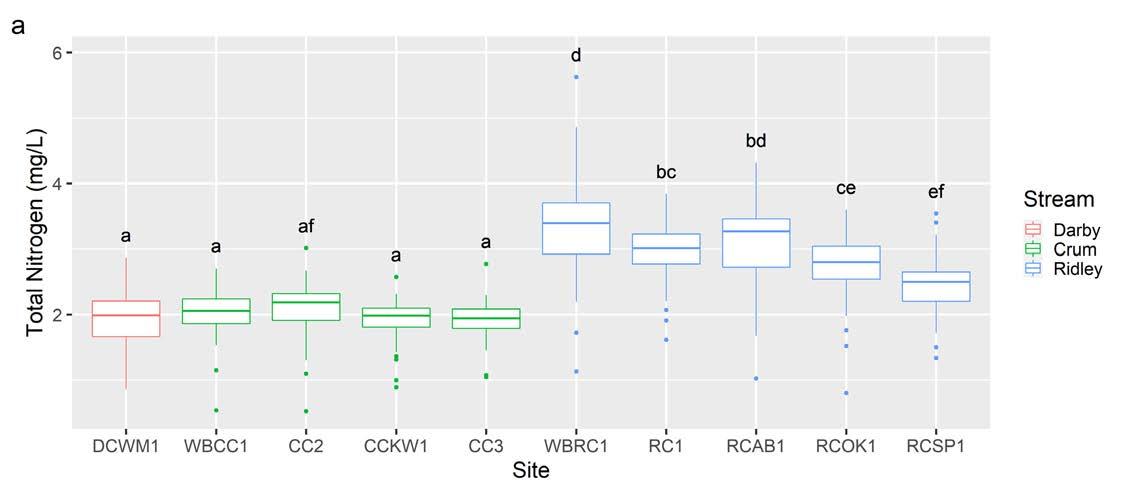
Total nitrogen (TN) is the concentration of nitrates, nitrites, and ammonia in the water. TN dynamics are mostly driven by nitrates, which are present in higher concentrations than nitrites and ammonia. The PADEP standard for the maximum concentration of nitrates and nitrites in a PWS is 10 mg/L.4 TN does not approach 10 mg/L at any sample sites. Nitrate concentration and ammonia concentration follow similar patterns as TN, and neither are present in high enough concentrations to be toxic (see Supplemental Data).
Though TN concentration is not high enough to be dangerous for human consumption, concentrations are high enough to impair streams. Based on an analysis of nutrient concentrations from 1990 to 1998, for a stream that is not impaired by nutrients in this ecoregion, the EPA recommended a TN threshold of 2.225 mg/L.11 More recent analysis, based on nutrient concentrations in Southeastern Pennsylvania streams from 2000 to 2019, raises this TN threshold slightly to 2.3 mg/L.12 In the sample area, the 2.3 mg/L threshold is exceeded in 141 out of 289 samples: at least 20 times by each Ridley Creek site and at most 8 times by each Darby and Crum Creek site (Figure 14b). Furthermore, natural background concentrations of TN are estimated to be 0.10 - 0.30 mg/L for this region, which is far lower than measured concentrations at all sites (Figure 14b).13 TN concentrations are much higher than natural background levels and regularly exceed recommended thresholds, indicating that excess nitrogen is an impairment.
TN ranges from a low of 0.996 mg/L in CCKW1 to a high of 4.86 mg/L at WBRC1 (Figure 14a). Mean TN is lowest at CC3 (1.96 ± 0.05 mg/L) and highest at WBRC1 (3.40 ± 0.11 mg/L). At a watershed scale, mean TN is much higher in Ridley Creek (2.96 ± 0.05 mg/L) than in Crum (2.04 ± 0.03 mg/L) and Darby Creeks (1.98 ± 0.06 mg/L).
There are significant differences in TN between sites (p < 2.2 * 10-16). In Ridley Creek, most downstream sites have significantly lower TN than most upstream sites, which could be due to dilution with greater volumes of water (Figure 14a). Despite close physical proximity, TN is significantly higher at WBRC1 than RC1 (Figure 14a, Figure 1). There are no significant differences in TN between sample sites in Crum Creek, and Crum Creek sites and DCWM1 tend to have significantly lower TN than Ridley Creek sites (Figure 14a). TN does not vary seasonally (Figure 14b).
15a.
15b.
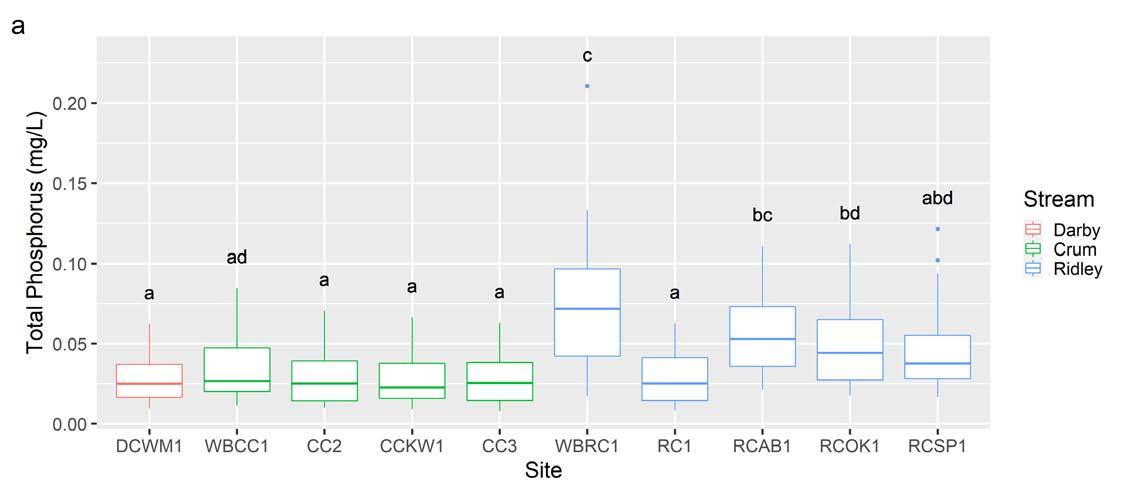
Figure 15. Total phosphorus concentration from January 2018 through March 2020 (a) across ten sample sites in the headwaters of the Darby, Crum, and Ridley Creeks and (b) over time. The shaded region represents estimated natural background concentrations of total phosphorus and the gray hashed line represents the recommended maximum total phosphorus threshold for streams in this ecoregion.
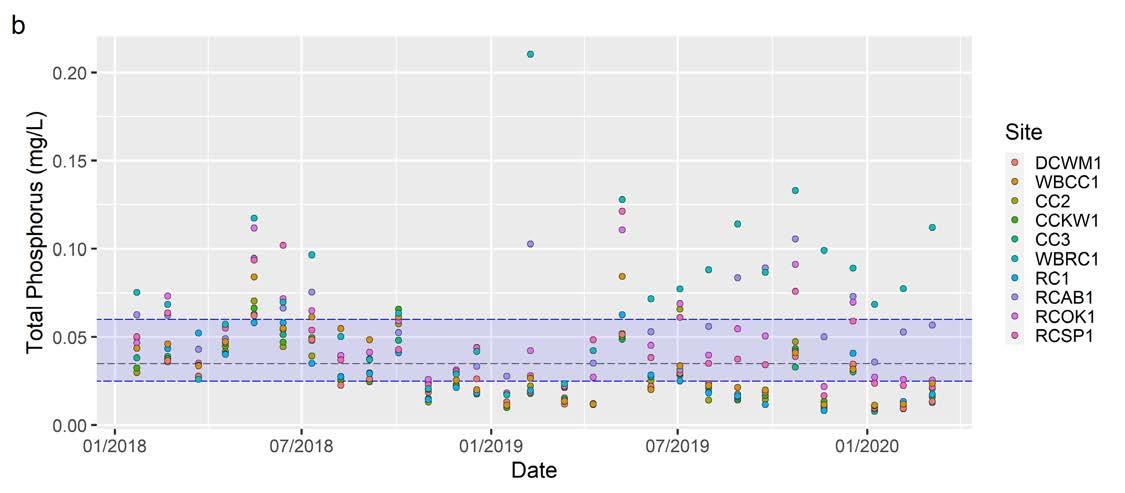
Total phosphorus (TP) is the total concentration of all phosphorus-containing compounds in streams. Natural background concentrations of TP are estimated to be 0.025 - 0.060 mg/L for this region.13 In the study area, 55 out of 289 measurements exceed the upper end of this range and 189 exceed the lower end, suggesting that phosphorus may be present in excess (Figure 15b). However, an analysis of nutrient concentrations from 2000 to 2019 in streams in Southeastern Pennsylvania found that the maximum TP concentration for a stream that is not impaired by nutrients is 0.035 mg/L.12 In the sample area, this threshold is exceeded in almost half of the samples collected (140 out of 289 samples: 24 times each by WBRC1, RCAB1, RCOK1, and RCSP1 and only up to 11 times each by all other sites), indicating that phosphorus is regularly present at high enough concentrations to impair Ridley Creek and is occasionally an impairment in Crum and Darby Creeks.
TP ranges from a low of 0.0079 mg/L at CC3 to a high of 0.210 mg/L at WBRC1 (Figure 15a). At a site scale, mean TP is lowest at CC3 (0.027 ± 0.003 mg/L) and highest at WBRC1 (0.076 ± 0.008 mg/L). Mean TP is lowest in Darby Creek (0.028 ± 0.003 mg/L), slightly higher in Crum Creek (0.030 ± 0.002 mg/L), and highest in Ridley Creek (0.052 ± 0.003 mg/L).
There are significant differences in TP between sites (p < 2.2 * 10-16). TP does not vary significantly between sites in Darby and Crum Creeks (Figure 15a). In Ridley Creek, WBRC1 has significantly higher TP than RCSP1 and RC1 (Figure 15a). Though TP does not show strong seasonal variation, TP trended higher and had a broader spread from mid-2019 through 2020 than in 2018 (Figure 15b).

16a.
16b.
Figure 16. Specific conductivity from January 2018 through December 2021 (a) across ten sample sites in the headwaters of the Darby, Crum, and Ridley Creeks and (b) over time.
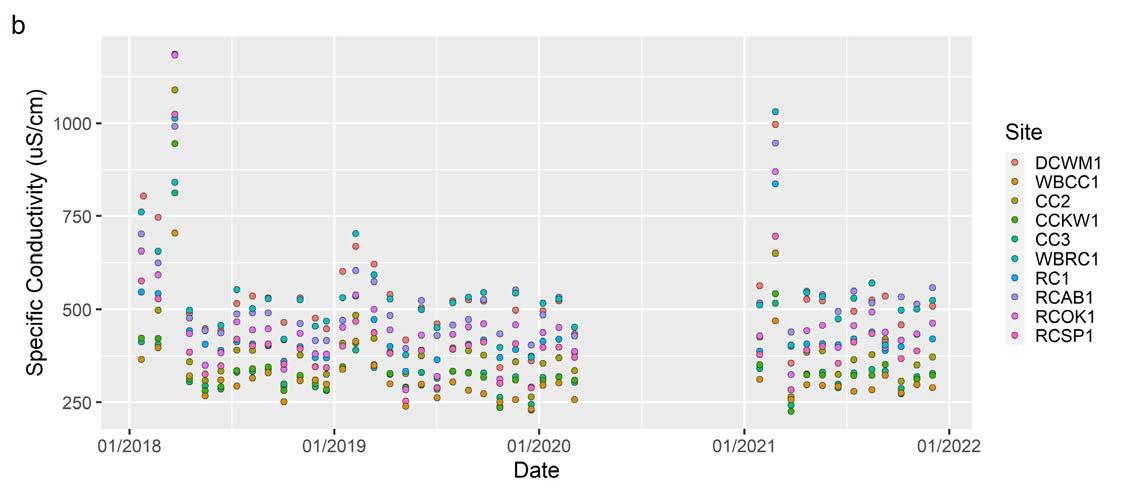
SPC measures how well electricity travels through water. Pure water is a poor conductor and has a low SPC. Ions, often from salts such as sodium chloride, nitrogen and phosphorus-based nutrients, and metal cations, all increase SPC. As many of these ions come from anthropogenic sources, SPC provides insight into the general impact of human activities on waterways. Higher SPC indicates a more heavily affected stream, but it does not indicate which compounds are entering waterways. Though there are no federal or state standards for SPC, natural background levels of SPC in the sampled stretches of stream are estimated to be between 75 and 95 µS/cm, which is far lower than any values measured.14 Elevated SPC is expected due to the long history of human activity and development within the study area.
In the study area, SPC ranges from 226 µS/cm at CCKW1 to 1186 µS/cm at DCWM1 (Figure 16a). Mean SPC is lowest at WBCC1 (312 ± 12.2 µS/cm) and highest at DCWM1 (540 ± 24.9 µS/cm). At a watershed scale, mean SPC is lowest at 345 ± 8.5 µS/cm in Crum Creek, higher at 471 ± 9.3 µS/cm in Ridley Creek, and highest at 540 ± 24.9 µS/cm in Darby Creek. SPC tends to spike during winter months (Figure 16b).
There are significant differences in SPC between sites (p < 2.2 * 10-16). SPC is significantly lower at all Crum Creek sites than at DCWM1 and most Ridley Creek sites (Figure 16a). Interestingly, mean SPC is significantly different at WBRC1 and RC1, despite their physical proximity (Figure 16a, Figure 1). 17.
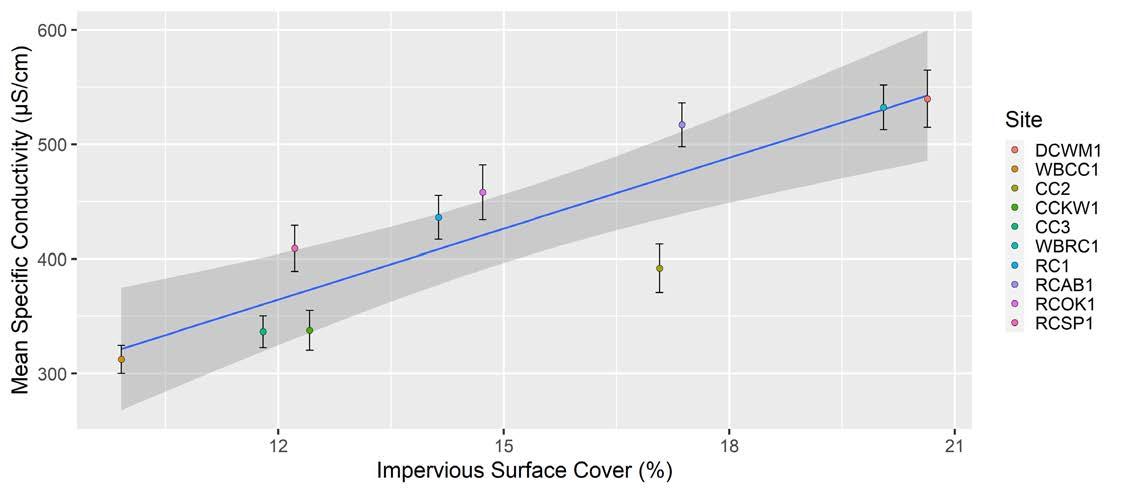
Figure 17. The relationship between percent impervious surface cover and mean specific conductivity at ten sample sites in the headwaters of Darby, Crum, and Ridley Creeks from January 2018 through December 2021. Error bars represent standard error. The blue line represents a linear trendline and the shaded region shows the 95% confidence interval.
Some spatial differences in SPC between sites can be explained by the percent impervious cover in the surrounding watershed (Table 1). There is a significant positive relationship between mean SPC and percent impervious surface cover (p = 5.8 * 10-4, Figure 17). As impervious surface cover reflects the density of human development and SPC reflects human influence on streams, this positive relationship is expected.
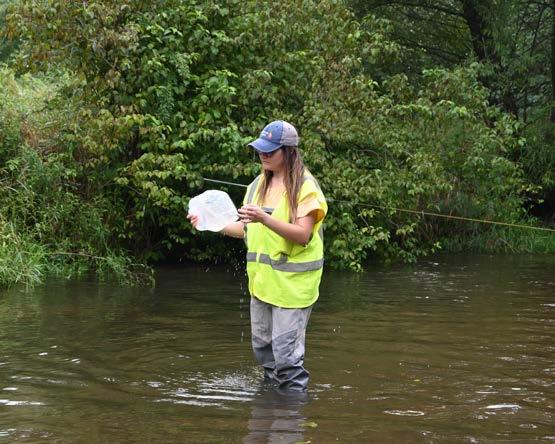
 WATER CHEMISTRY SAMPLING AT CRUM CREEK | ANNA WILLIG
18b. 18c.
Figure 18. The relationship between SPC and (a) chloride concentration from January 2019 through December 2021, (b) total nitrogen from January 2018 through March 2020, and (c) total phosphorus from January 2018 through March 2020 at ten sample sites in the headwaters of the Darby, Crum, and Ridley Creeks. The blue line represents a linear trendline and the shaded region shows the 95% confidence interval.
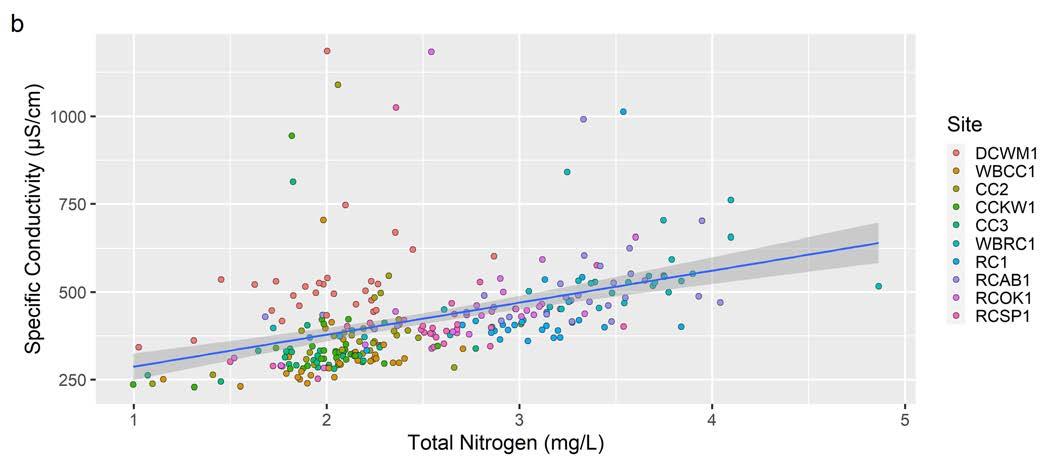
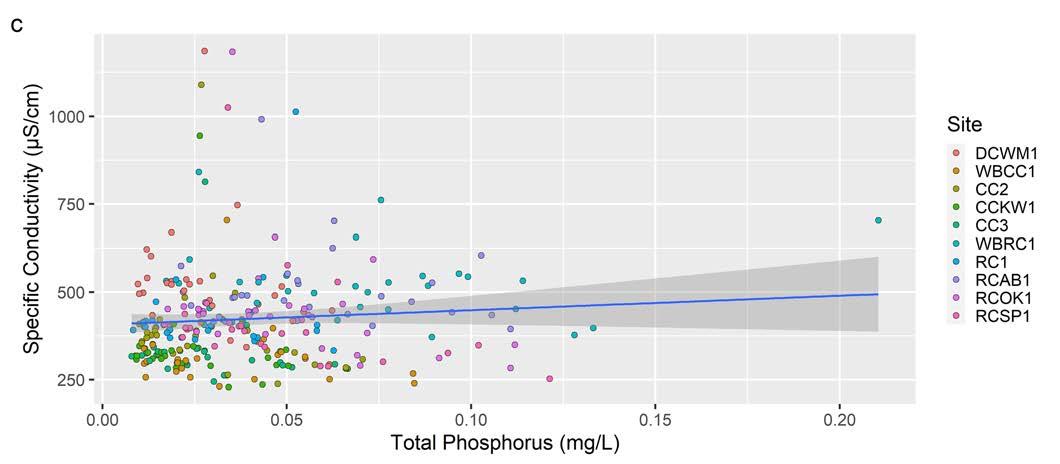
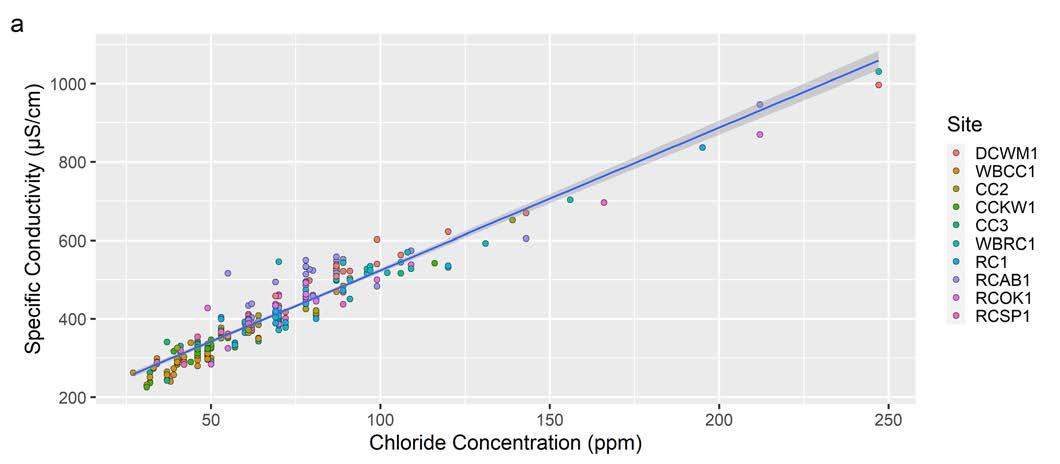
Though SPC is related to impervious surface cover, impervious surfaces do not directly affect SPC. Rather, the salts and fertilizers applied on and around impervious surfaces wash into streams, raising SPC. A multiple regression analysis reveals that SPC is best explained by a model that includes Cl concentration, TN, and TP (p < 2.2 * 10-16). Cl concentration, TN, and the interaction between Cl concentration and TN contribute significantly to the model (p = 3.75 * 10-15, p = 0.044, p = 0.0014, respectively). The strength of the relationship between Cl concentration and SPC (Figure 18a) compared to that of TN and SPC (Figure 18b) indicates that Cl concentration is the main driver of SPC, which is expected due to far higher concentrations of Cl than TN. TP does not contribute significantly to the model, which is unsurprising due to its high reactivity and its low concentration compared to Cl and TN (Figure 18c).
SPC remains fairly constant throughout the year, though it can spike in winter (Figure 16b). This dynamic is due to the relationship between SPC and Cl . Road salts, which are applied in the winter, form Cl when dissolved in water, increasing SPC. The maximum SPC at each site was recorded on days when there was notable snowmelt, indicating that road salt washing into streams is the most likely cause of SPC spikes.
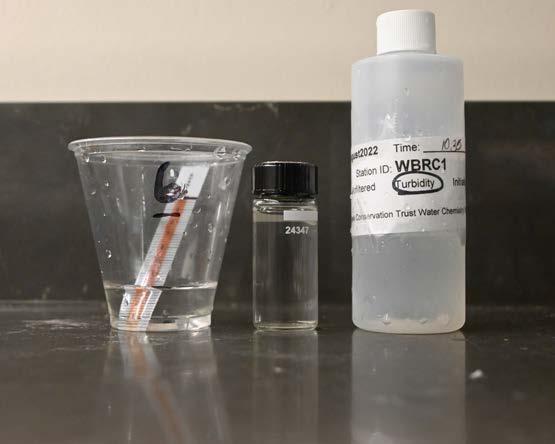
 WATER SAMPLE FROM WEST BRANCH RIDLEY CREEK ANALYZED FOR CHLORIDES AND TURBIDITY | ANNA WILLIG
SAMPLE WITH CHLORIDE STRIP | ANNA WILLIG
FILLING BOTTLES AT CRUM CREEK AT KIRKWOOD PRESERVE ANNA WILLIG
WATER SAMPLE FROM WEST BRANCH RIDLEY CREEK ANALYZED FOR CHLORIDES AND TURBIDITY | ANNA WILLIG
SAMPLE WITH CHLORIDE STRIP | ANNA WILLIG
FILLING BOTTLES AT CRUM CREEK AT KIRKWOOD PRESERVE ANNA WILLIG
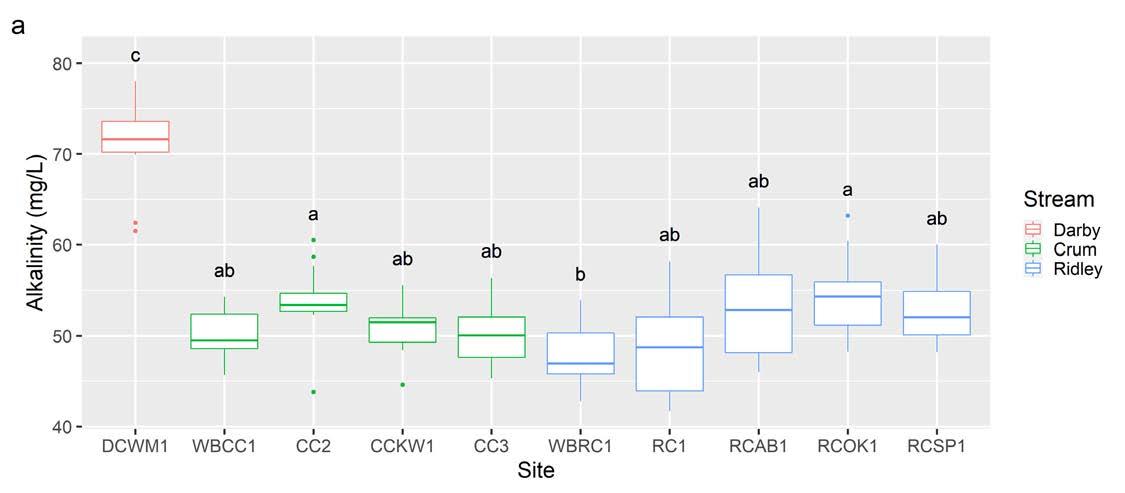
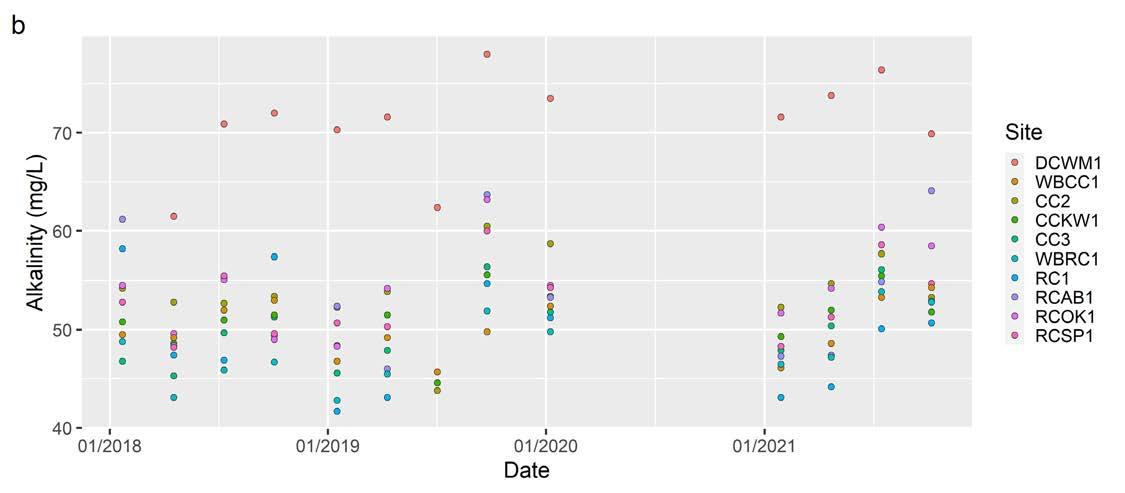
Two final parameters that enhance our understanding of water quality in the headwaters of Darby, Crum, and Ridley Creeks are alkalinity and hardness. Alkalinity measures the ability of water to neutralize acidic compounds and resist changes in pH. Higher alkalinity indicates a greater ability to withstand pH changes from pollutants such as wastewater effluent, protecting stream life from acidic or basic environments. Hardness is the concentration of calcium and magnesium ions in the water. Hard water has high concentrations of these ions and is more of a nuisance than a health concern for humans or stream life. When water is hard, it can leave behind residue on pipes, potentially leading to lower water pressure or clogging.

Alkalinity, analyzed quarterly, measures the ability of a body of water to resist changes in pH; higher alkalinity denotes a greater ability to counter pH changes.15 Local geology tends to be the primary driver of alkalinity, though accelerated weathering of natural materials and weathering of man-made materials, namely concrete, increases alkalinity.16 Alkalinity remains above the PADEP minimum of 20.0 mg/L at all sites.4
Alkalinity ranges from 41.7 mg/L at RC1 to 78.0 mg/L at DCWM1. Mean alkalinity is lowest at WBRC1 (47.9 ± 1.0 mg/L) and highest at DCWM1 (71.0 ± 1.4 mg/L). At a watershed scale, mean alkalinity is similar in Crum Creek (51.3 ± 0.5 mg/L) and Ridley Creek (51.5 ± 0.7 mg/L) and higher in Darby Creek (71.0 ± 1.4 mg/L). There is little seasonal variation in alkalinity (Figure 19b).
There are significant differences in alkalinity between sites (p < 2.2 * 10-16). Alkalinity is significantly higher at DCWM1 than at all other sites (Figure 19a). Alkalinity does not vary significantly with Crum Creek, but within Ridley Creek, alkalinity is significantly lower at WBRC1 than at RCOK1 (Figure 19a).
 CRUM CREEK AT KIRKWOOD PRESERVE | JENNIFER MATHES
20b.
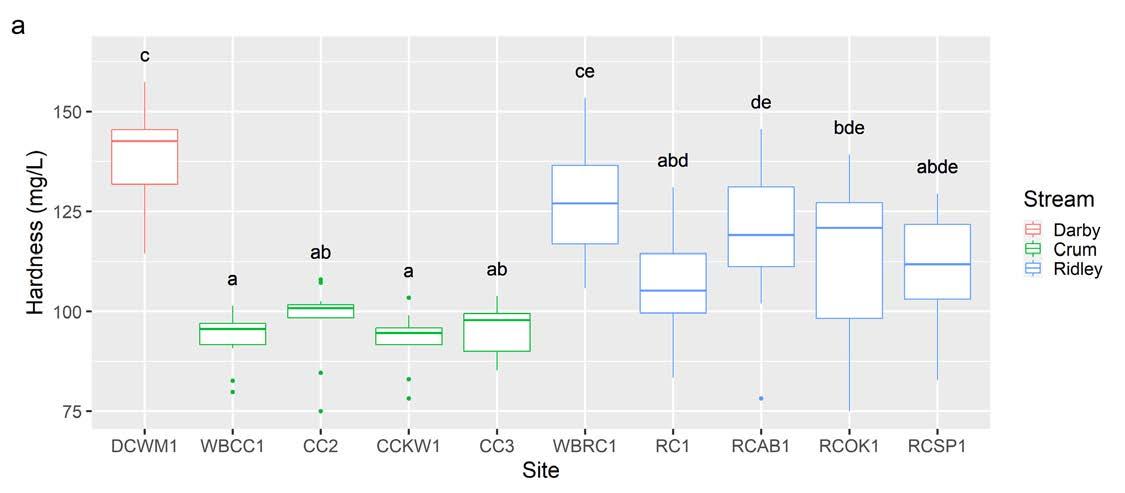
Figure 20. Hardness from January 2018 through March 2021 (a) across ten sample sites in the headwaters of the Darby, Crum, and Ridley Creeks and (b) over time.
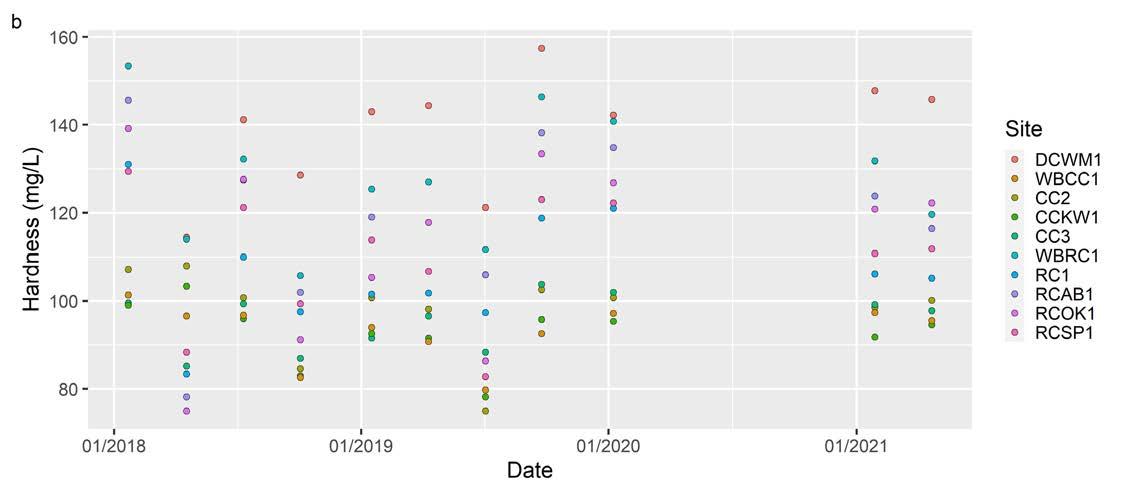
Hardness, analyzed quarterly, is the concentration of dissolved calcium and magnesium ions in water.17 Hardness is primarily governed by the geology of a region; water dissolves calcium and magnesium as it flows through rocks and soils. Based on USGS standards, water in Crum Creek is moderately hard, water in Ridley Creek ranges from moderately hard to hard, and water in Darby Creek is hard.17
Hardness ranges from 75.0 mg/L in RCOK1 and CC2 to 157.4 mg/L at DCWM1. Mean hardness is lowest at RCOK1 (92.8 ± 2.1 mg/L) and highest at DCWM1 (138.6 ± 4.2 mg/L). At a watershed scale, mean hardness is lowest in Crum Creek (94.9 ± 1.1 mg/L), higher in Ridley Creek (115.4 ± 2.4 mg/L), and highest in Darby Creek (138.6 ± 4.1 mg/L). Hardness exhibits little seasonal variation (Figure 20b).
There are significant differences in hardness between sites (p = 1.71 * 10-14). Hardness is significantly higher at DCWM1 than at all sites besides WBRC1 (Figure 20a). Hardness varies significantly within Ridley Creek but not within Crum Creek (Figure 20a).
Water quality is moderately impaired in Darby, Crum, and Ridley Creeks. At all sample sites, water temperature is elevated throughout the year, most notably during the summer. Though dissolved oxygen (DO) does not drop to dangerously low levels, low levels during the summer still stress sensitive organisms, such as brook trout and aquatic insects, limiting or even stopping reproduction. pH remains within safe levels at all sites, though it occasionally approaches unsafe levels at RCOK1 and RCSP1. Restoration in these watersheds should aim to lower water temperatures to increase DO, and pH should continue to be monitored.
The headwaters of Darby, Crum, and Ridley Creeks are highly responsive to rainfall events, as indicated by spikes in discharge. Turbidity and total suspended solids (TSS) analysis shows there is constant, though often low, movement of sediment through the sample sites. Turbidity and TSS are both related to discharge, signaling that sediment movement increases after rainfall or snowmelt events. Though there are no regulations governing acceptable amounts of sediment in streams, it is possible that sediment poses a risk to stream life during storm events. Analysis of sediment movement and erosion dynamics is ongoing to identify areas where restoration should target soil stabilization.
In addition to water temperature, all streams have elevated specific conductivity (SPC). Elevated SPC is driven by salts and nutrients, as indicated by high chloride (Cl ), total nitrogen (TN), and total phosphorus (TP) concentrations, though sites in Crum Creek are less impacted than Ridley and Darby Creek sites. While Cl and TN do not exceed levels deemed unsafe for human consumption (there are no such regulations for TP), they are still present in excess, potentially posing a threat to stream organisms. Warm water temperatures may exacerbate the hazards posed by elevated Cl to stream life. Improving water quality, especially in Darby and Ridley Creeks, will require a decrease in Cl and nutrient concentrations.
Alkalinity and hardness both remain within acceptable levels for waterways in this region. Alkalinity and hardness are significantly higher in Darby Creek than in Crum and Ridley Creeks. This is most likely due to differences in regional geology, as alkalinity and hardness are primarily affected by the types of rocks and soils that water flows through. However, weathering of man-made materials, particularly concrete, can alter these parameters, and any sudden changes should be investigated.
Land use is closely connected to water quality in the sampled streams. The most impaired sites, WBRC1 and DCWM1, both have over 20% impervious surface area in their catchments. Restoration in Darby and Ridley Creeks should target areas upstream of these sites to have the greatest possible benefit for downstream water quality. By contrast, the least impaired site, WBCC1, has less than 10% impervious surface cover in its catchment. Limiting development upstream of WBCC1 is crucial to protecting and maintaining the health of Crum Creek. The differences between these sites highlight the negative effect that impervious surfaces have on streams and the importance of protecting undeveloped areas to safeguard water quality.
 RIDLEY CREEK AT ASHBRIDGE PRESERVE | JENNIFER MATHES
We are continuing to monitor water chemistry in the headwaters of Darby, Crum, and Ridley Creeks and will update our data analysis periodically. Future analyses include developing a rating curve to estimate the amount of sediment moving through our streams and better understand erosion dynamics. This data set is also being used by the Academy of Natural Sciences to callibrate the Stream Reach Assessment Tool, which models how land use influences nutrient concentrations in streams. To elevate our understanding of water quality in Darby Creek, we established a community science project in partnership with Darby Creek Valley Association. Two sites were piloted in 2021, and we currently have a total of 17 sample sites, both upstream and downstream of DCWM1, that will help identify areas where restoration will most improve water quality.
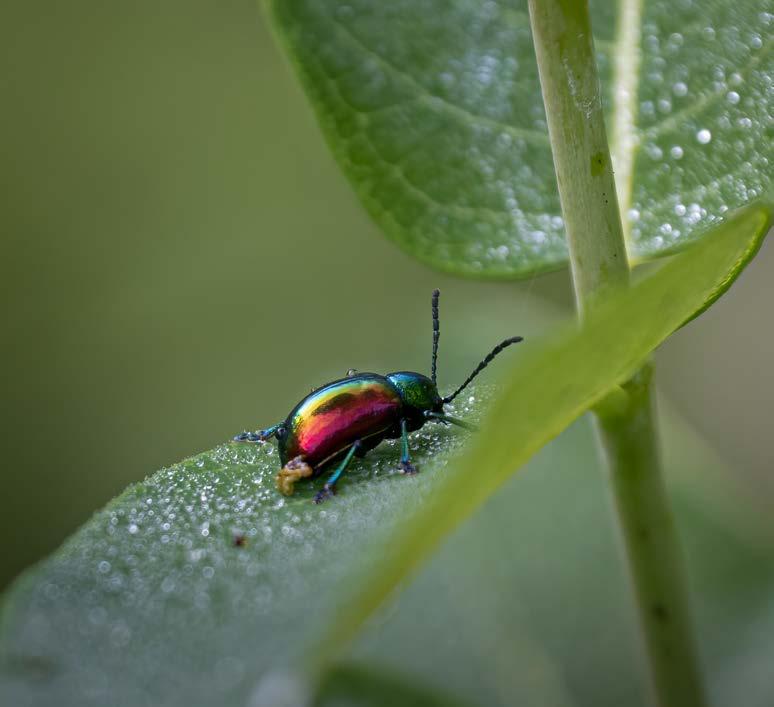
We are also studying how water chemistry affects the organisms living in Darby, Crum, and Ridley Creeks. We have collected aquatic macroinvertebrates annually at all ten sample sites since 2018 and are in the process of identifying insects and analyzing results. These stream insects exist on a spectrum of sensitivity to different stream conditions, and the presence or absence of different insects can tell us about what is happening in the stream over the course of a year. We also conducted surveys of freshwater mussels in Ridley Creek near RCAB1 and Crum Creek near CC2 in June 2022 and are studying relationships between water quality and mussel populations. Additional reports will be released as analyses are completed.
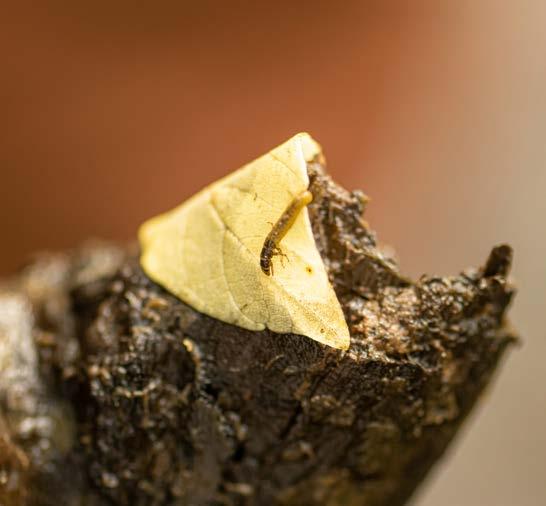
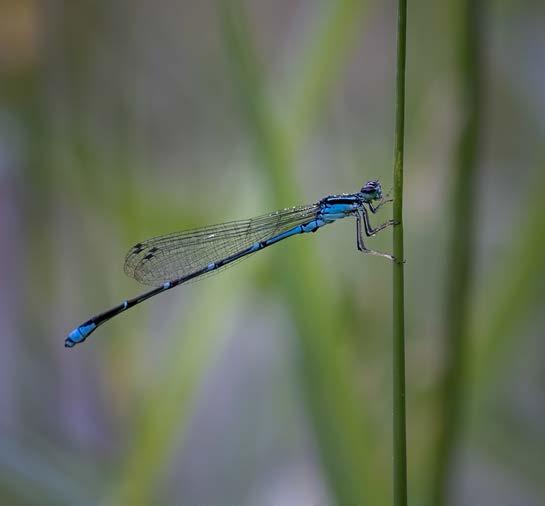
 CADDISFLY LARVA AT ASHBRIDGE PRESERVE | JENNIFER MATHES DAMSELFLY AT ASHBRIDGE PRESERVE | JENNIFER MATHES
This study has shown that, overall, the headwaters of Ridley, Crum, and Darby Creeks are moderately impaired, and maintaining and restoring these waterways will take time and effort throughout the watersheds. Compared to more urbanized watersheds in the Greater Philadelphia region, the concentration of open space within the study area — the product of over 40 years of land protection in the Willistown region — has resulted in only moderate impairments to water quality. Since 1996, the Land Protection Team at Willistown Conservation Trust has been dedicated to protecting open space in the region, and this has proven to be one of the most effective methods for preserving water quality. However, to see substantial improvements in downstream waterways, land protection must be paired with best management practice (BMP) recommendations, such as restoring degraded landscapes and improving stormwater management.
BMPs are methods that have been determined to be the most effective and practical means of preventing or reducing pollution to achieve water quality goals. BMPs include measures to both prevent and mitigate pollution and are site-specific, with different areas of the watershed or different sections of streams requiring specialized BMPs. Examples of BMPs include rain gardens, tree plantings, bioretention basins, and native meadow plantings. Recommendations in the following paragraphs are based on the data presented in this report and are general guidelines. For more specific recommendations, WCT’s Stewardship Program has excellent resources, including lists of native plants that will benefit water quality and wildlife as well as information on specific BMP recommendations.
Lowering water temperature and increasing DO is crucial to improving the health of our waterways. One of the best BMPs for improving temperature and DO, apart from limiting development entirely, is planting and enhancing riparian buffers, which are strips of vegetation, often native trees and shrubs, along the banks of a stream. Riparian buffers benefit streams by providing shade, which lowers water temperatures, filtering runoff, which can reduce nutrient and salt concentrations, and absorbing water, which limits flooding and erosion. Ideally, a healthy riparian buffer should extend 100 feet from the banks of a stream. In areas where 100 feet of riparian buffer is not possible, planting a diversity of native plants will still provide a multitude of benefits to the waterway as well as for pollinators and birds. To learn more about the importance of native plants for birds, please visit the Bird Conservation Program.
An example of a scientifically-informed BMP is the planting of a riparian buffer along Ridley Creek at WCT’s Ashbridge Preserve, just downstream of the RCAB1 sample site. In 2019, the Watershed Protection Program received a grant from the Pennsylvania Department of Conservation and Natural Resources to reforest the riparian area along Ridley Creek that was formerly Ashbridge Lake. Prior to planting, this area was composed of unconsolidated, rapidly eroding legacy sediment that had deposited behind a historic dam and was inhabited by invasive grasses. Baseline water quality data was collected in 2018. From 2019 to 2022, over 1,500 native trees and shrubs have been planted through volunteer efforts. As this tree planting is located in a public preserve, it serves as an educational resource for those interested in learning more about stream restoration. Monitoring of this tree planting is ongoing, and two EnviroDIY sensor stations, which record temperature, turbidity, depth, and SPC every five minutes, were installed above and below the planting to capture long-term effects on water quality.
 RIDLEY CREEK AT ASHBRIDGE PRESERVE | JENNIFER MATHES
Restoring waterways will also require lowering Cl concentrations. High levels of Cl in the winter are attributed to the use of road salts on roadways, sidewalks, and parking areas to melt ice and make winter travel safe. Unfortunately, few low-cost alternatives to road salt exist. However, sweeping up excess salt after snow and ice melt and reporting large piles left on roads to the local municipality can lessen the amount of road salt entering streams over the course of the winter, benefiting stream health.
Nitrogen and phosphorus-based nutrients will present significant issues in streams if concentrations increase. These nutrients originate from animal waste near waterways, leaking septic or sewer systems, and the application of chemical fertilizers. Nutrient inputs from animal waste can be decreased by preventing herd animals from directly accessing waterways and bagging dog waste. Regular maintenance and annual inspection of septic tanks will ensure that waste is not leaking from the tank and polluting waterways. Limiting fertilizer application (or stopping altogether) on lawns and gardens will also reduce nutrient pollution.
There are a number of options to limit the harm that fertilizers cause to streams. As fertilizers are often applied to maintain lawns, one approach is transforming all or part of a lawn to a native plant meadow, which does not require fertilizer. For areas that cannot be planted with native plants, shifting from chemical fertilizers that feed the plants to an organic compost that feeds the soil will also benefit water quality. Additionally, if chemical fertilizers or pesticides must be used, avoid application before rainfall, which will wash the treatment (as well as the investment) into the nearest waterway. Learning more about timing and types of fertilizers can ensure that anything being applied to the soil is efficiently being absorbed by the plants rather than polluting nearby waterways. The Farm Program staff are experts in the field of soil health and can provide resources and information on the benefits of nurturing soils.
While protecting and preserving open space is the best tool for addressing the impairments outlined in this report, every activity that takes place on the landscape has a direct consequence on the health of the waterways. Along with implementing recommendations to improve water quality, work must continue to increase watershed literacy for all those in Darby, Crum, and Ridley Creek Watersheds as well as in the broader Delaware River Watershed. This will ensure that residents of our watersheds are empowered to make land use decisions that benefit waterways, allowing future generations to enjoy and appreciate local water resources. Willistown Conservation Trust is one of many local organizations working through the Delaware River Watershed Initiative to better understand the impacts of human activities on the landscape and identify restoration priorities that will improve and protect the health of local waterways and the Delaware River Watershed as a whole. Support from the community through volunteering and donating is critical to the ongoing success of these efforts.
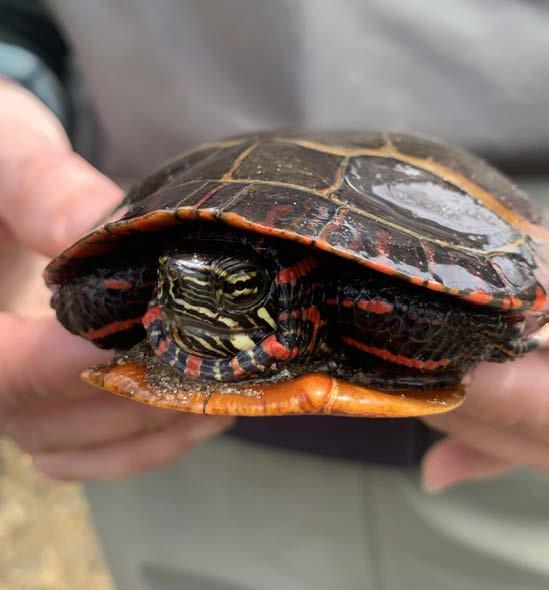
 PAINTED TURTLE (CHRYSEMYS PICTA MARGINATA ) AT RIDLEY CREEK AT ASHBRIDGE PRESERVE | ANNA WILLIG
This work was made possible through the generous support of the William Penn Foundation. We want to extend our thanks to Drexel University’s Academy of Natural Sciences for their support in selecting sample sites and running samples and to Stroud Water Research Center for their technical support. Special thanks to all of the landowners who graciously allowed us to sample on their properties. We are incredibly grateful to all those who contributed edits, insights, and feedback on the writing of this document. A final, huge thank you to the staff, committee members, board members, and volunteers who braved wind, rain, heat, and snow to collect this data and all those who have supported the efforts of the Watershed Protection Program throughout the last five years.
Willistown Conservation Trust
• Lauren McGrath, Director of Watershed Protection Program
• Anna Willig, Watershed Protection Program Conservation Associate + 2018 Watershed Conservation Intern
• Catherine Quinn, 2021 + 2022 Drexel University Watershed Protection Program Co-op
• Sarah Busby, 2022 Drexel University Watershed Protection Program Co-op
• Vincent Liu, 2022 Drexel University Watershed Protection Program Co-op
• Zack Smith, 2020 + 2021 Drexel University Watershed Protection Program Co-op
• Gloria Avila, 2021 Drexel University Watershed Protection Program Co-op
• Julianna Smith, 2020 Drexel University Watershed Protection Program Co-op
• Madeline Sabo, 2019 Drexel University Watershed Protection Program Co-op
• Kacy Reitenauer, 2019 Drexel University Watershed Protection Program Co-op
• Regan Dohm, Watershed Protection Program Conservation Associate
• Aishwarya Raja, Watershed Protection Program Volunteer
• Prem Trivedi, 2018 Drexel University Watershed Protection Program Co-op
• Katherine Gord, Watershed Protection Program Editorial Consulting Patrick Center for Environmental Research, Academy of Natural Sciences of Drexel University
• Marie Kurz, Ph.D., Senior Scientist & Biogeochemistry Section Leader, Patrick Center for Environmental Research
• Melissa Bross, Biogeochemistry Staff Scientist III
• David Velinsky, Ph.D. Department Head and Professor, Department of Biodiversity, Earth & Environmental Science; VP for Academy Science, ANS
• Roland Wall, Department of Biodiversity, Earth and Environmental Science Stroud Water Research Center
• David Bressler, Citizen Science Facilitator
• Shannon Hicks, Research Engineer
• Rachel Johnson, Research Engineer Technician
This report was made possible through a grant from the William Penn Foundation. The William Penn Foundation, founded in 1945 by Otto and Phoebe Haas, is dedicated to improving the quality of life in the Greater Philadelphia region through efforts that increase educational opportunities for children from low-income families, ensure a sustainable environment, foster creativity that enhances civic life, and advance philanthropy in the Philadelphia region. In 2021, the Foundation will grant more than $117 million to support vital efforts in the region. The opinions expressed in this report are those of the author(s) and do not necessarily reflect the views of the William Penn Foundation.
Ten sample sites were selected in the headwaters of Darby, Crum, and Ridley Creeks in the Delaware River Basin in Southeastern Pennsylvania (Figure 1). Sites were located on public and private properties within WCT’s program area, as outlined in 2017. Sites were all in headwater (third and fourth order) streams and were located near confluences. Sub-catchments that drained into sample sites ranged from 5 - 55 km2 in size (Table 1). Land use in each catchment is predominantly developed open space or forest (Figure 2).
Beginning on January 22, 2018, water chemistry sampling was conducted every four weeks at ten sample sites in headwaters of Darby, Crum, and Ridley Creeks. Due to the COVID-19 pandemic, sampling did not occur from April 2020 to December 2020. Regular sampling resumed in January 2021. Sampling began at 7:30 AM and ended between 3:30 and 5:30 PM. Sites were always sampled in the following order: DCWM1, CC2, CCKW1, WBCC1, RC1, WBRC1, RCAB1, RCOK1, RCSP1, CC3. Weather conditions were recorded at each site prior to sampling. Water temperature, DO, pH, and SPC were measured in-stream with a YSI Professional Plus, which was calibrated for DO, pH, and SPC no more than 24 hours prior to sampling. Discharge at each site was measured periodically during sampling using a Swoffer Model 3000, starting in the fall of 2018. Monthly discharge measurements began on June 5, 2019.
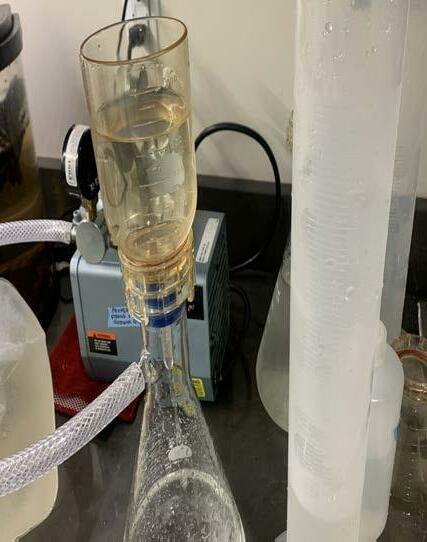
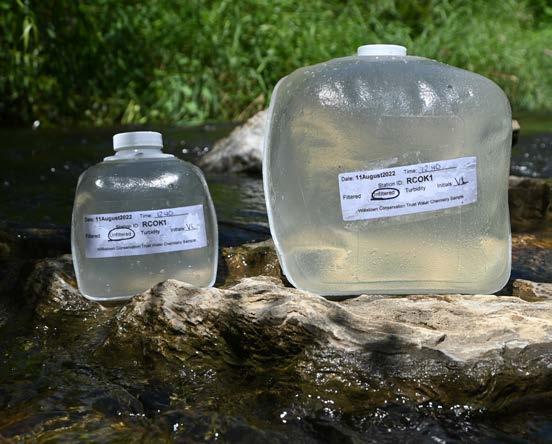
In addition to in-stream measurements, water samples were collected for analysis in the lab. All sample containers were rinsed with stream water prior to sample collection. Samples for TSS analysis were collected in 1 L and 4 L cubitainers. Samples for turbidity and monthly chloride analyses were collected in 125 mL bottles. Samples for unfiltered nutrient (UNUT) analyses were collected in new or acid-washed 125 mL bottles. For filtered nutrients (FNUT) analyses, samples were filtered through 25 mm Whatman Glass Microfiber Filters into new or acid-washed 125 mL bottles. FNUT samples were collected quarterly. An additional 1 L cubitainer of stream water was collected at each site on a quarterly basis for expanded analysis by Drexel Unversity’s Academy of Natural Sciences.
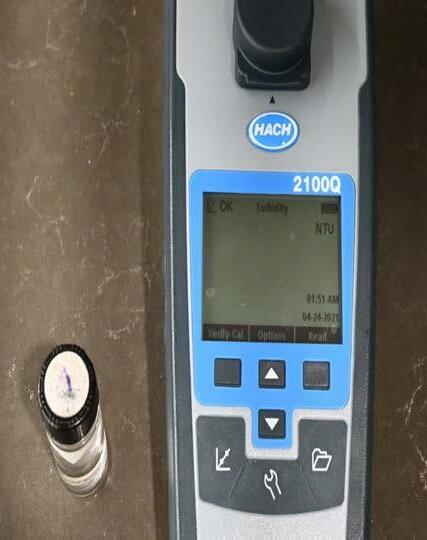
In the lab, turbidity was measured in triplicate using a Hach 2100Q portable turbidimeter. Cl concentration and sodium chloride concentration were measured using Hach Quantab strips every month beginning on January 16, 2019. To analyze TSS, 1 L of water was filtered through pre-weighed Whatman glass microfiber filters within 2 weeks of sample collection. Samples were dried overnight in an oven and weighed up to three times if the first two weights were not within 0.0005 g. Duplicates and blank samples were run every ten samples for quality control.
UNUT samples were sent to Drexel University’s Academy of Natural Sciences (ANS) for monthly analysis of TP and TN. Each quarter, in addition to UNUT samples, FNUT samples were analyzed for nitrate concentration, ammonia concentration and soluble reactive phosphorous concentration. An additional 1 L of water was collected at each site on a quarterly basis and analyzed by ANS for alkalinity, hardness and Cl concentration.

Watersheds were delineated using Model My Watershed 18 For all sites except CCKW1, watersheds were delineated using the Delaware River Basin high resolution stream network, which relies upon a 10m resolution model from the National Elevation Database. Due to errors in the Delaware River Basin high resolution network software, CCKW1 was delineated using the Continental US medium resolution stream network, which relies upon the National Hydrography Dataset at 30m resolution. Land use data were calculated in delineated watersheds by Model My Watershed using the USGS National Land Cover Database 2019 dataset.19 Delineated watershed shapefiles were uploaded to ArcGIS Pro.20 Impervious cover for each watershed was determined using impervious surface layers generated by the Delaware Valley Regional Planning Commission for Chester and Delaware Counties from 2015 aerial imagery.21,22
All data were analyzed and visualized in RStudio using the tidyverse and multcompView packages.23–25 Analysis of variance tests were used for statistical comparison of each of the measured parameters between sites. Differences between sites were identified using a Tukey post-hoc test. Relationships between parameters were characterized using Pearson correlation tests. All data are publicly available and can be accessed on Hydroshare
1. National Land Cover Database 2019 Legend. Multi-Resolution Land Characteristics (MRLC) Consortium https://www.mrlc.gov/data/legends/national-land-cover-database-class-legend-and-description.
2. Pennsylvania Department of Environmental Protection. 25 Pa. Code Chapter 93. Water Quality Standards § 93.3. Protected water uses. http://www.pacodeandbulletin.gov/Display/pacode?file=/secure/pacode/data/025/chapter93/chap93toc.html&d=reduce (2009).
3. Wilson, P. C. Dissolved Oxygen. 9 https://edis.ifas.ufl.edu/publication/SS525 (2019).
4. Pennsylvania Department of Environmental Protection. 25 Pa. Code Chapter 93. Water Quality Standards § 93.7. Specific Water Quality Criteria. http://www.pacodeandbulletin.gov/Display/pacode?file=/secure/pacode/data/025/chapter93/chap93toc.html&d=reduce (2020).
5. Kellner, E. & Hubbart, J. A. Advancing Understanding of the Surface Water Quality Regime of Contemporary MixedLand-Use Watersheds: An Application of the Experimental Watershed Method. Hydrology 4, 31 (2017).
6. Mealy, R. & Bowman, G. Importance of General Chemistry Relationships in Water Treatment. (2004).
7. Mesner, N. & Geiger, J. pH. (2005).
8. Kaushal, S. S. et al. Freshwater salinization syndrome: from emerging global problem to managing risks. Biogeochemistry 154, 255–292 (2021).
9. Jackson, J. K. & Funk, D. H. Temperature affects acute mayfly responses to elevated salinity: implications for toxicity of road de-icing salts. Philos. Trans. R. Soc. B Biol. Sci. 374, 20180081 (2019).
10. United States Geological Survey. Phosphorus and Water. Water Science School https://www.usgs.gov/special-topic/water-science-school/science/phosphorus-and-water?qt-science_center_ objects=0#qt-science_center_objects (2018).
11. USEPA. Ambient Water Quality Criteria Recommendations: Rivers and Streams in Ecoregion IX. 108 (2000).
12. Clune, J. W., Crawford, J. K. & Boyer, E. W. Nitrogen and Phosphorus Concentration Thresholds toward Establishing Water Quality Criteria for Pennsylvania, USA. Water 12, 3550 (2020).
13. Smith, R. A., Alexander, R. B. & Schwarz, G. E. Natural Background Concentrations of Nutrients in Streams and Rivers of the Conterminous United States. Environ. Sci. Technol. 37, 3039–3047 (2003).
14. Olson, J. R. & Cormier, S. M. Modeling spatial and temporal variation in natural background specific conductivity. Environ. Sci. Technol. 53, 4316–4325 (2019).
15. United States Geological Survey. Alkalinity and Water. Water Science School https://www.usgs.gov/special-topic/water-science-school/science/alkalinity-and-water?qt-science_center_ objects=0#qt-science_center_objects (2018).
16. Kaushal, S. S. et al. Human-accelerated weathering increases salinization, major ions, and alkalinization in fresh water across land use. Appl. Geochem. 83, 121–135 (2017).
17. United States Geological Survey. Hardness of Water. Water Science School https://www.usgs.gov/special-topic/water-science-school/science/hardness-water?qt-science_center_objects=0#qtscience_center_objects (2018).
18. Stroud Water Research Center. Model My Watershed. (2022).
19. Dewitz, J. & U.S. Geological Survey. National Land Cover Database (NLCD) 2019 Products. (2021) doi:10.5066/ P9KZCM54.
20. Environmental Systems Research Institute (ESRI). ArcGIS Pro. (2021). 21. Delaware Valley Regional Planning Commission Office of GIS. Impervious Surfaces 2015 Chester County. (2022). 22. Delaware Valley Regional Planning Commission Office of GIS. Impervious Surfaces 2015 Delaware County. (2022). 23. R Core Team. R: a language and environment for statistical computing. (2018). 24. Wickham, H. et al. Welcome to the Tidyverse. J. Open Source Softw. 4, 1686 (2019). 25. Graves, S., Piepho, H.-P., Selzer, L. & Dorai-Raj, S. multcompView: Visualizations of Paired Comparisons. (2019).
26. US EPA, O. Ammonia. https://www.epa.gov/caddis-vol2/ammonia (2015). 27. Office of Water. Aquatic Life Ambient Water Quality Criteria for Ammonia - Freshwater. (2013).
ALKALINITY: The ability of a body of water to resist changes in pH.
AMMONIA: A form of nitrogen that is found in chemical fertilizers, decomposing organic matter, and human and animal waste. Ammonia is a nutrient, though it can be toxic at high concentrations in streams. Ammonia takes two forms, NH3, and the ammonium cation, NH4+
ANION: An ion with a negative charge.
AQUATIC MACROINVERTEBRATE: An organism without a backbone that lives in water for at least part of its life and is visible with the naked eye. Examples include dragonflies, mayflies, and stoneflies.
BEST MANAGEMENT PRACTICE (BMP): Methods that have been determined to be the most effective and practical means of preventing or reducing pollution to achieve water quality goals. BMPs include both measures to prevent pollution and measures to mitigate pollution.
BIODIVERSITY: The variety of living organisms in a given area. The more species in an area, the more biodiversity that area has.
BOXPLOT: A chart that visualizes the distribution of all measurements of a specific variable, such as temperature.
CATION: An ion with a positive charge.
CATCHMENT: The area of land that drains into a given body of water. For example, any drop of rain that lands in the Delaware River Catchment will ultimately end up in the Delaware River (see watershed).
CHLORIDE (C l ): An anion that is naturally found in water due to weathering of rocks and soils. Chloride also forms when road salts and, to a lesser extent, fertilizers wash into water bodies and dissolve.
COLD WATER FISHERY (CWF): A body of water that supports the survival and reproduction of Salmonidae fish species and other aquatic organisms that are indigenous to a cold water habitat.
DISCHARGE: The volume of water moving through a stream or river at any given time, often measured as cubic meters per second (m3/s).
DISSOLVED OXYGEN (DO): The concentration of dissolved oxygen gas in water. Oxygen enters water either through direct absorption from the atmosphere or from photosynthesis by aquatic plants and algae.
DRWI: Delaware River Watershed Initiative.
EROSION : A natural process in which materials, such as rocks or soil, are broken down and moved, often by water. While weathering simply refers to the breakdown of material, erosion refers to the breakdown and movement of material. Development can increase the rate of erosion to unnaturally high levels.
EUTROPHICATION: The process by which a body of water becomes enriched with nutrients, often nitrogen and phosphorus-based compounds. Eutrophication leads to excessive algae and vegetation growth, which ultimately depletes dissolved oxygen as these producers die and are decomposed.
HARDNESS: The total concentration of calcium and magnesium ions in water.
HEADWATERS: The source of a stream or river.
IMPAIRMENT: A physical or chemical condition of a habitat that prevents the survival and reproduction of the organisms that live there.
IMPERVIOUS SURFACE: Any surface, often made by humans, that water cannot pass through, such as roads, parking lots, buildings, sidewalks, and driveways. Impervious surface cover refers to the amount of land covered by an impervious surface.
INFILTRATION: The movement of water from aboveground into the soil.
ION: An atom or molecule that carries a positive or negative electric charge.
MULTIPLE REGRESSION ANALYSIS: A statistical technique that can be used to analyze relationships between a single dependent variable and multiple independent variables.
NITRATE: A nitrogen-based nutrient, anion NO3 .
NITRITE: A nitrogen-based nutrient, anion NO2
NITROGEN: An element that is found in many nutrients. In streams, nitrogen-containing nutrients are present at a low concentration, though runoff from fertilizers can increase the concentration of these compounds.
NUTRIENT: A compound that is essential to the growth and development of an organism.
PADEP: Pennsylvania Department of Environmental Protection.
PERVIOUS SURFACE: A surface water can pass through, such as soil.
p H: A measure of how acidic or basic water is as indicated by the concentration of hydrogen ions. Pure water is neutral at pH 7. Water with a pH above 7 is considered basic. Water with a pH below 7 is considered acidic.
PHOSPHORUS: An element that is found in many nutrients. In streams, phosphorus-containing nutrients are present at a low concentration, even lower than nitrogen-containing compounds, though runoff from fertilizers can increase the concentration of these compounds.
PHOTOSYNTHESIS: The process by which green plants and some other organisms use sunlight to produce sugars and oxygen from carbon dioxide and water.
POTABLE: Water that is safe to drink.
POTABLE WATER SUPPLY (PWS): A body of water that is used by the public after treatment for drinking or other domestic uses. Potable Water Supplies are regulated at the federal and state levels.
PRIMARY PRODUCER: Any organism, such as a plant, that produces its own energy, most commonly through photosynthesis.
p-VALUE: A value that ranges from 0 to 1 and represents the likelihood that a relationship is the result of random variation. p-values of 0.05 and below are considered statistically significant. (See Statistical Significance).
SALMONIDAE : A family of fish that includes trout and salmon species as well as others. Fish that are part of the Salmonidae family are called salmonids. Species in this family are sensitive to changes in water quality, particularly temperature and dissolved oxygen, and are used as indicators of water quality.
SCATTERPLOT: A graph that shows individual data points as dots. Each dot represents one data point — in this case a measurement at a sample site — that is plotted against two variables, one on the horizontal axis (x-axis) and one on the vertical axis (y-axis).
SEDIMENT: A solid material, often soil, dirt, or sand, that is transported to a new location, usually by water. When present in high concentrations in water, sediment is considered a pollutant.
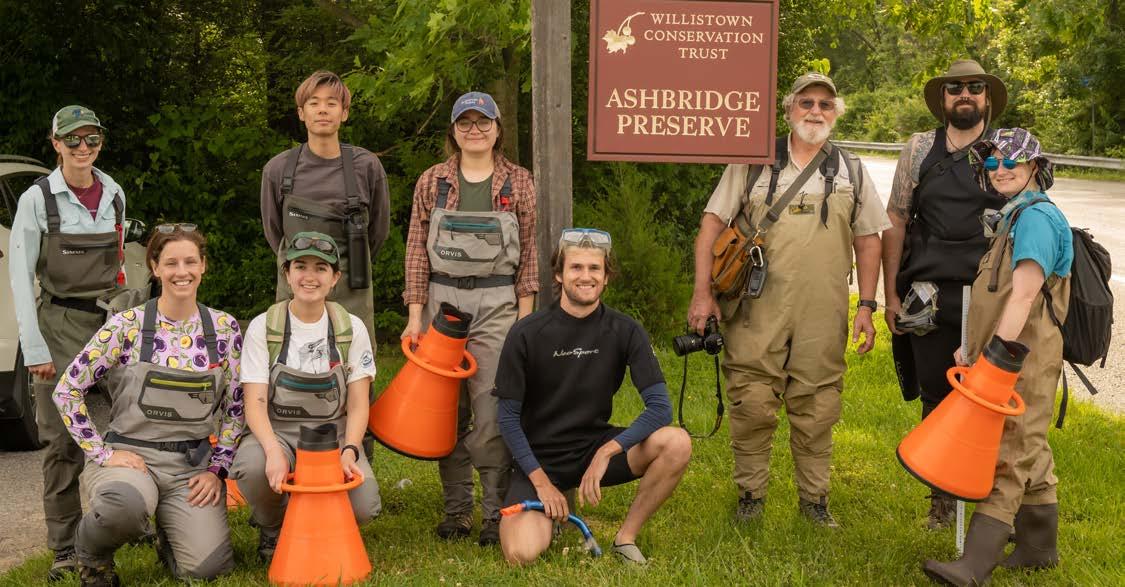
(SPC): A measure of how well an electrical current passes through water. Pure water cannot carry a current easily, and higher specific conductivity indicates the presence of ions.
STANDARD ERROR: A measure of the statistical accuracy of an estimate, equal to the standard deviation of the theoretical distribution of a large population of such estimates.
STATISTICAL SIGNIFICANCE: A claim that a result from data generated by testing or experimentation is likely to be attributable to a specific cause rather than randomness. An observation is considered statistically significant if there is less than a 5% chance of it occurring due to randomness (see p-Value).
STORMWATER: Water that comes from heavy rainfall or snowmelt events. If managed improperly, stormwater can wash high concentrations of pollutants into streams and cause severe flooding.
TITRATION: The process of slowly adding one solution to another until a desired chemical reaction occurs. Titrations are often used to measure the concentration of different compounds.
TOTAL NITROGEN (TN): The total concentration of three nitrogen-containing nutrients: nitrates, nitrites, and ammonia.
TOTAL PHOSPHORUS (TP): The total concentration of all phosphorus-containing compounds in streams.
TOTAL SUSPENDED SOLIDS (TSS): A measure of the amount of sediment and other debris in a given volume of water, often measured in milligrams of sediment per liter (mg/L).
TROUT STOCKED FISHERY (TSF): A body of water that supports the survival of stocked trout from February 15 to July 31 and the survival of other aquatic organisms that are indigenous to a warm water habitat.
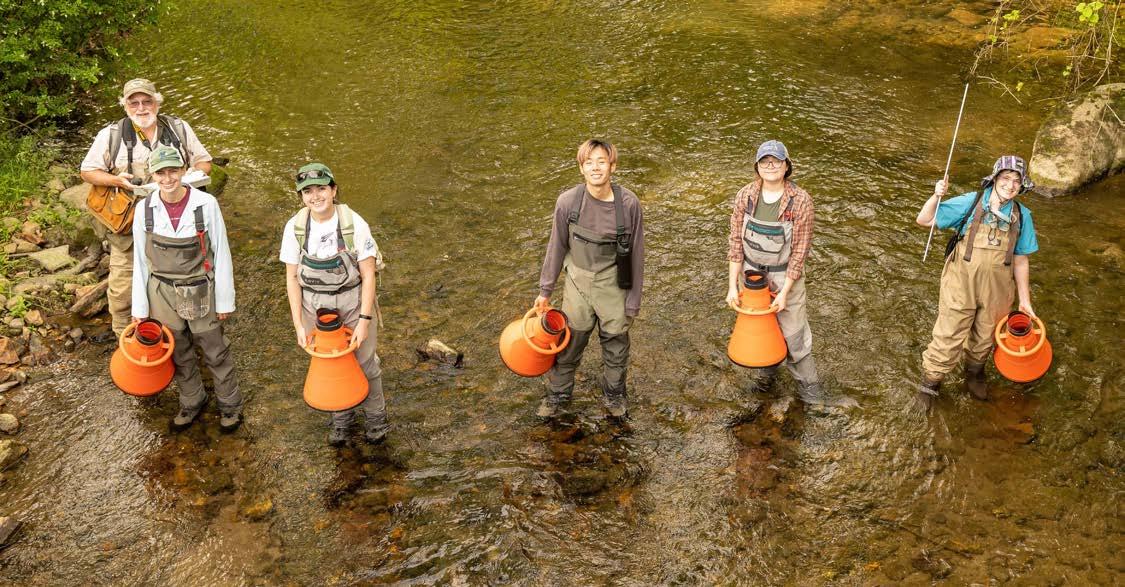
TURBIDITY: A measure of how light scatters when it passes through water. Higher turbidity indicates cloudier water.
WARM WATER FISHERY (WWF): A body of water that supports the survival and reproduction of fish species and other aquatic organisms that are indigenous to a warm water habitat.
WATERSHED: The area of land that drains into a given body of water. For example, any drop of rain that lands in the Delaware River Watershed will ultimately end up in the Delaware River (see catchment).
WEATHERING: The process by which natural materials, such as rocks or soil, are broken down.
Lauren McGrath has been the Director of the Watershed Protection Program at Willistown Conservation Trust since 2017. She has a Bachelor of Science from Ursinus College where she focused her independent research project on the impact fracking has on macroinvertebrate populations, and a Masters of Environmental Studies from the University of Pennsylvania where she studied the aquatic macroinvertebrates with Stroud Water Research Center. Lauren is passionate about studying the human impact on our waterways, and understanding how to protect freshwater resources to ensure clean, safe water for all.


As a Watershed Conservation Associate at Willistown Conservation Trust, Anna assists with monthly water chemistry sampling, maintains the tree planting at Ashbridge Preserve, and analyzes water quality data from sampling and from our EnviroDIY sensors. Additionally, Anna has experience conducting research on nitrogen fixation in mosses, as well as studying stream salamander ecology while at the Hubbard Brook Experimental Forest. Anna has a Bachelor of Arts in Conservation Biology from Middlebury College.
Found 20 miles west of Philadelphia,
Conservation Trust (WCT) focuses on 28,000 acres within the watersheds of Darby, Crum, and Ridley Creeks of Chester and Delaware Counties. Since 1996, WCT has helped permanently conserve over 7,500 acres, including three nature preserves open to the public: Ashbridge Preserve, Kirkwood Preserve, and Rushton Woods Preserve, which is home to Rushton Conservation Center and Rushton Farm. The Trust offers six renowned programs for public engagement and research: the Bird Conservation, Community Farm, Education and Outreach, Land Protection, Stewardship, and Watershed Protection Programs.