Study on the Single-Multi-Objective Optimal Dispatch in the Middle and Lower Reaches of Yellow River for River Ecological Health

 ,
,
Abstract
:1. Introduction
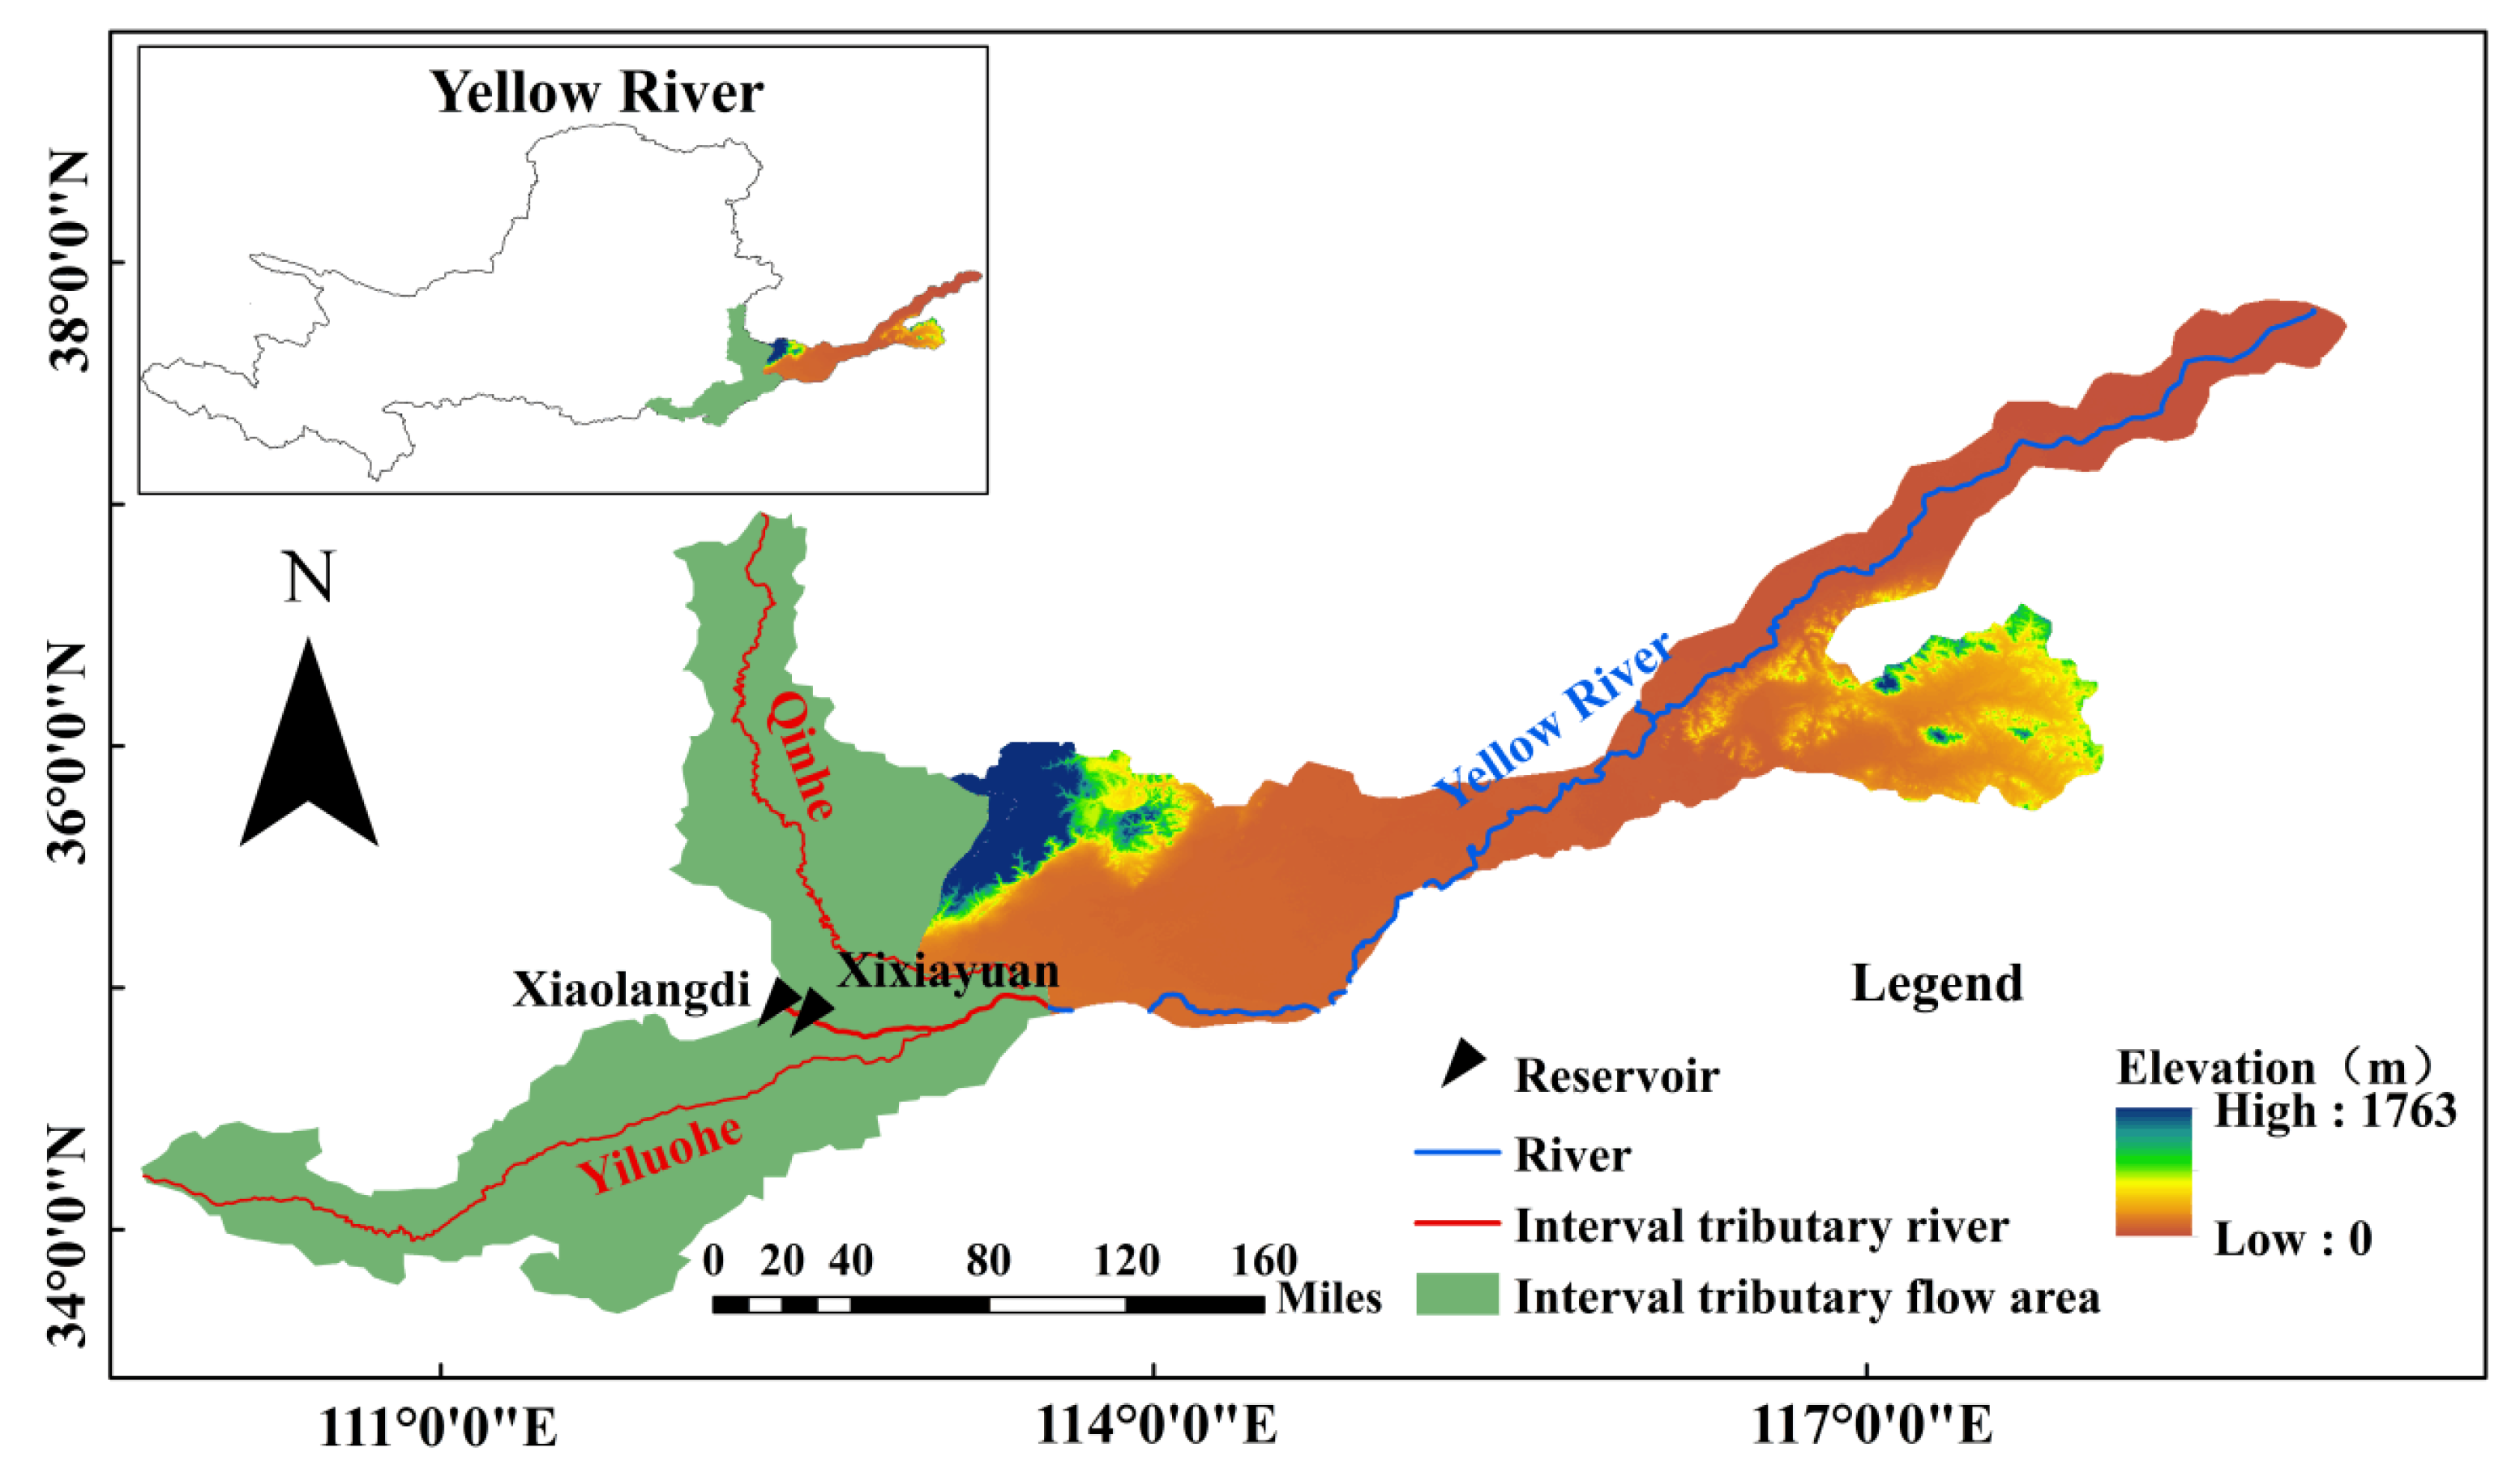
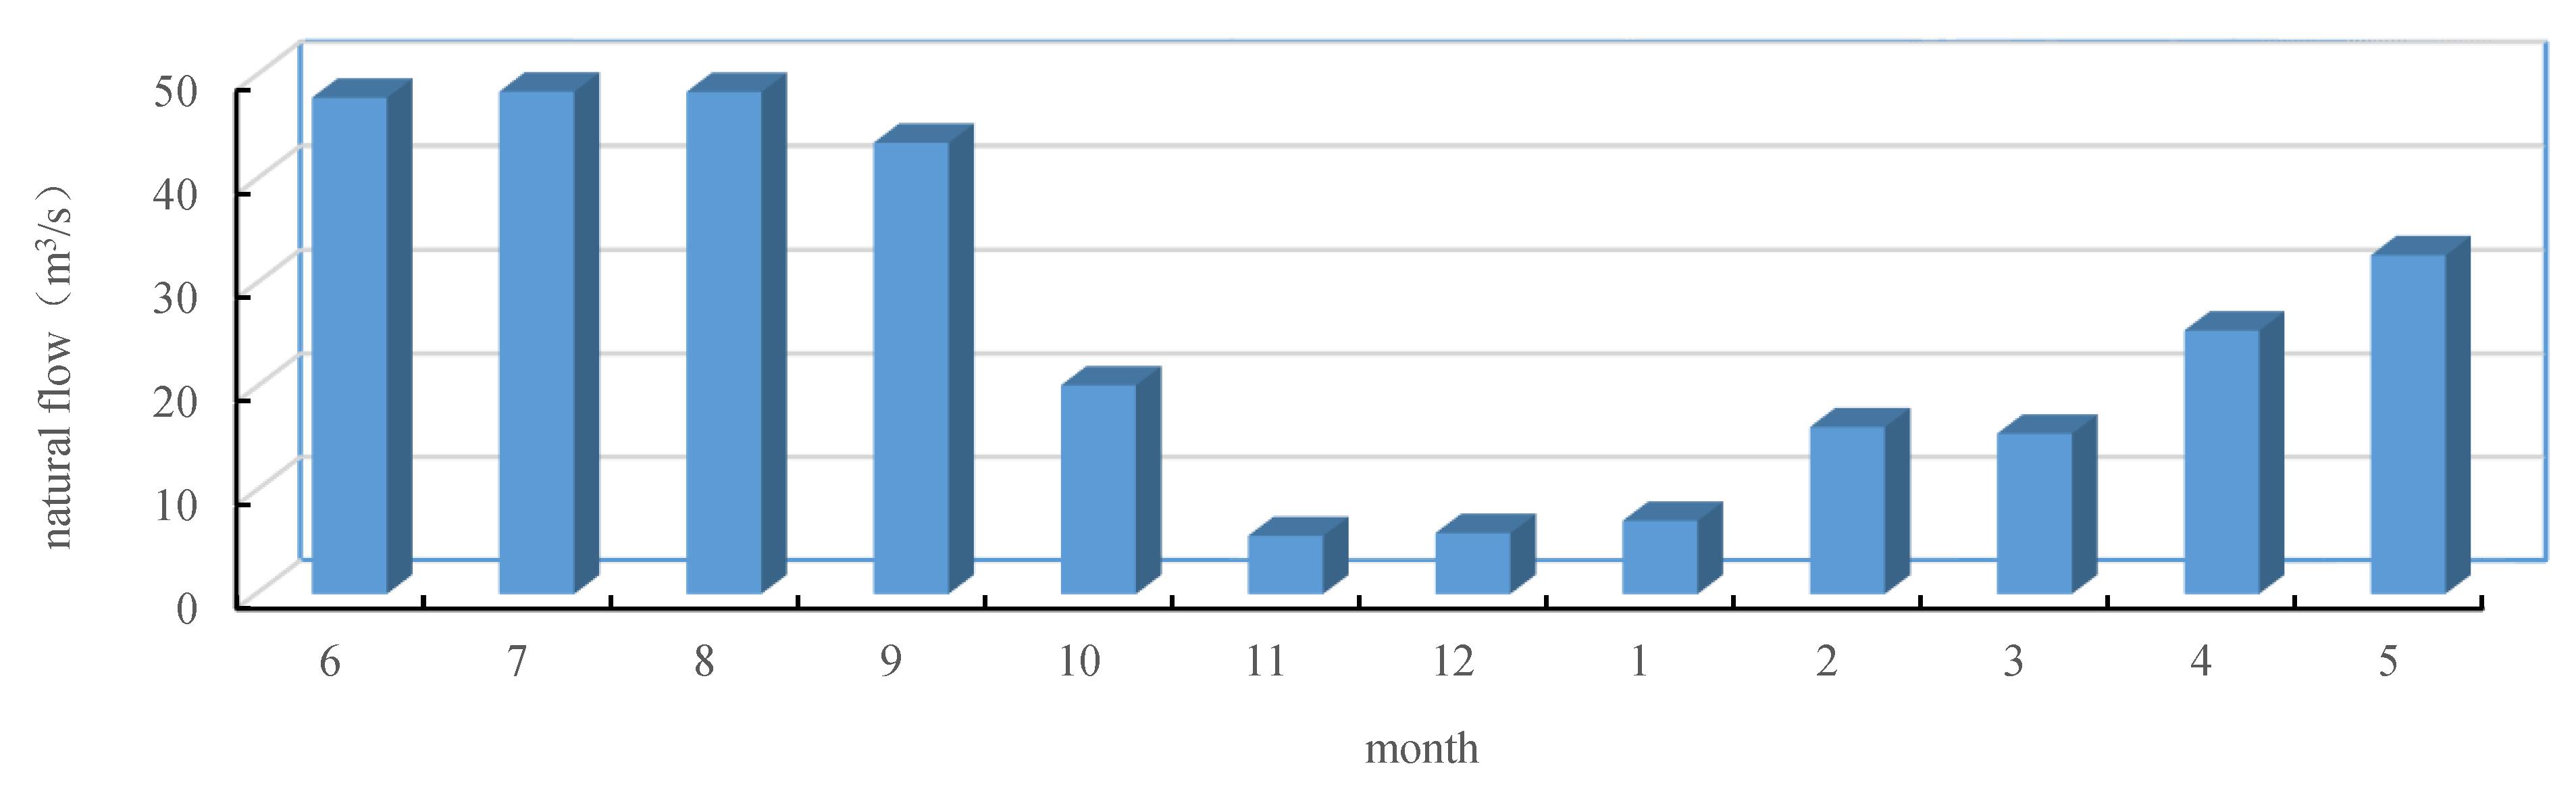
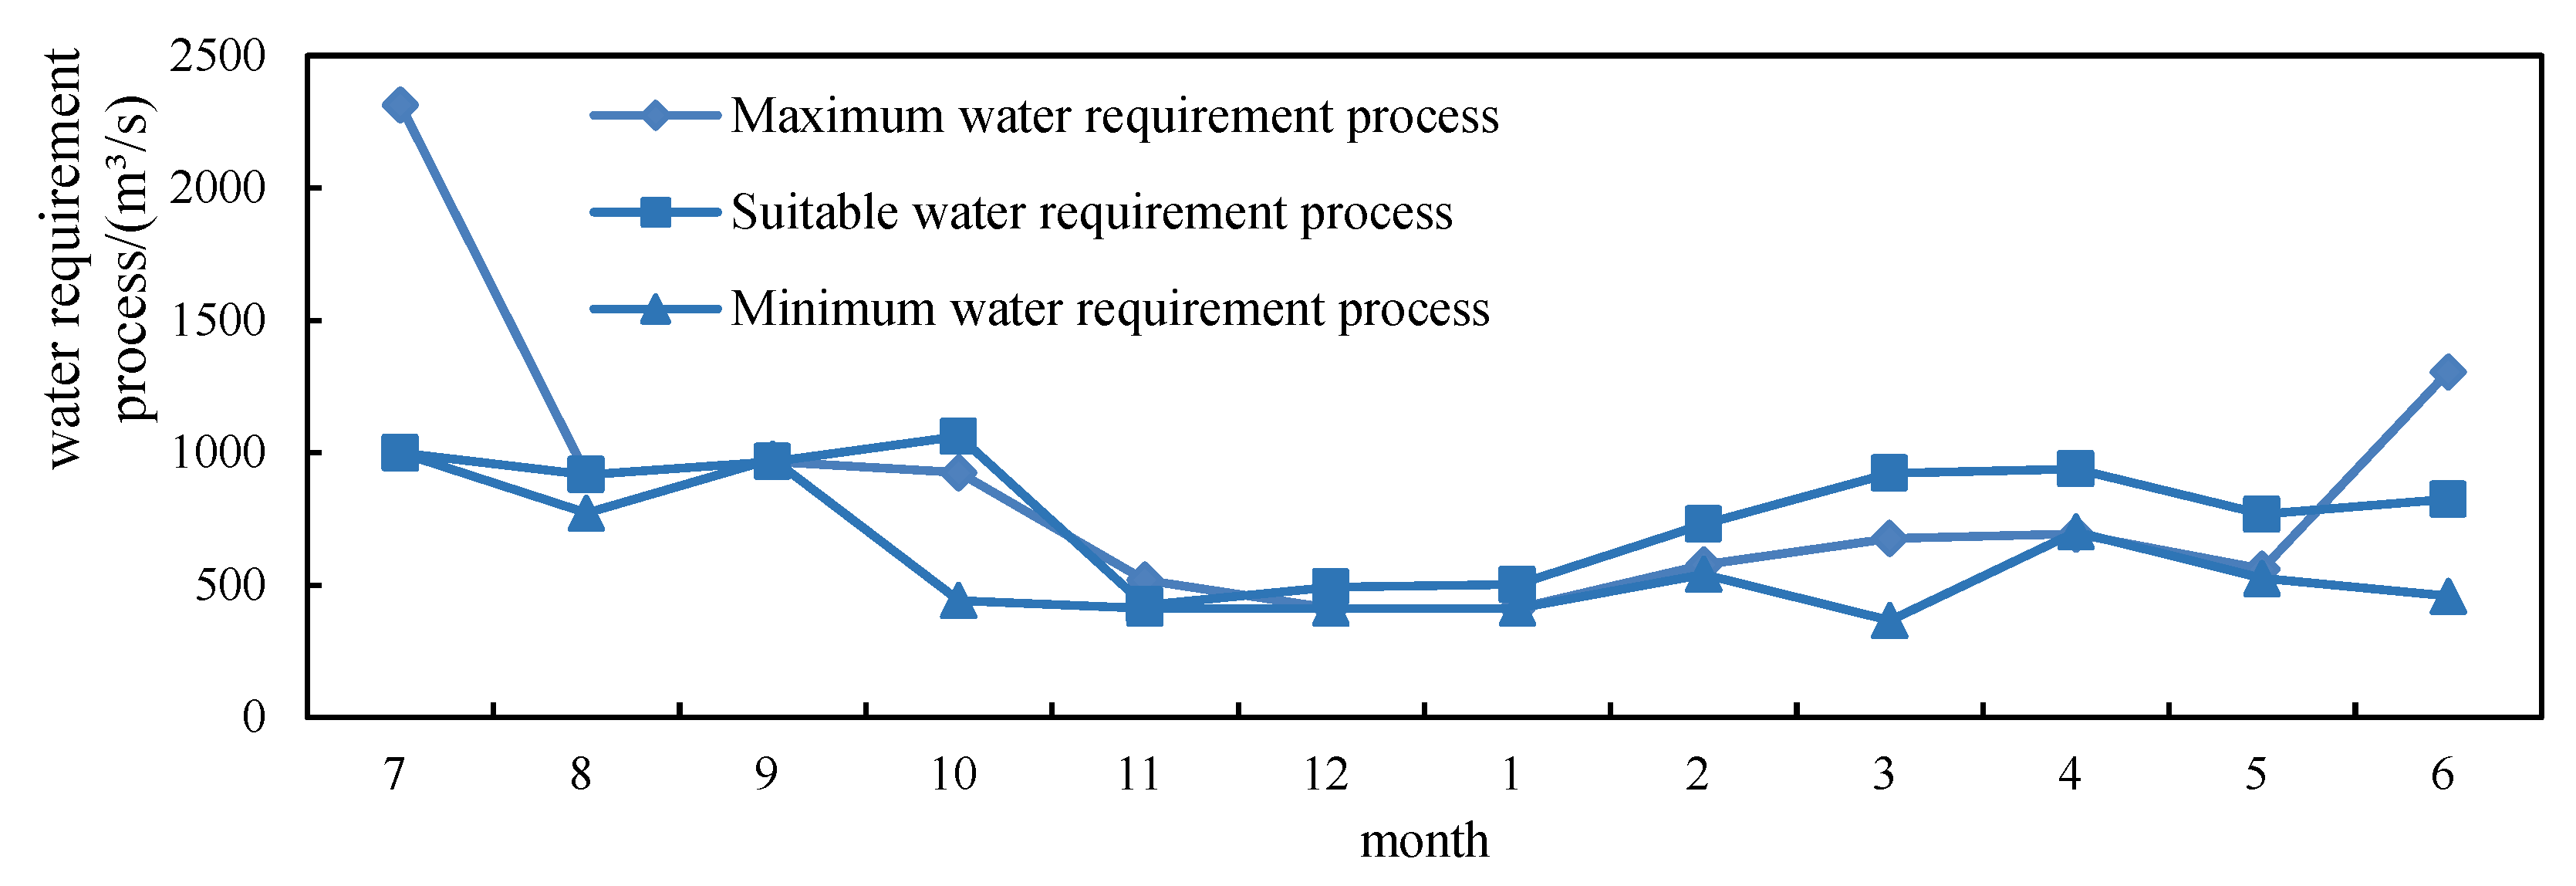
2. Research Area and Data
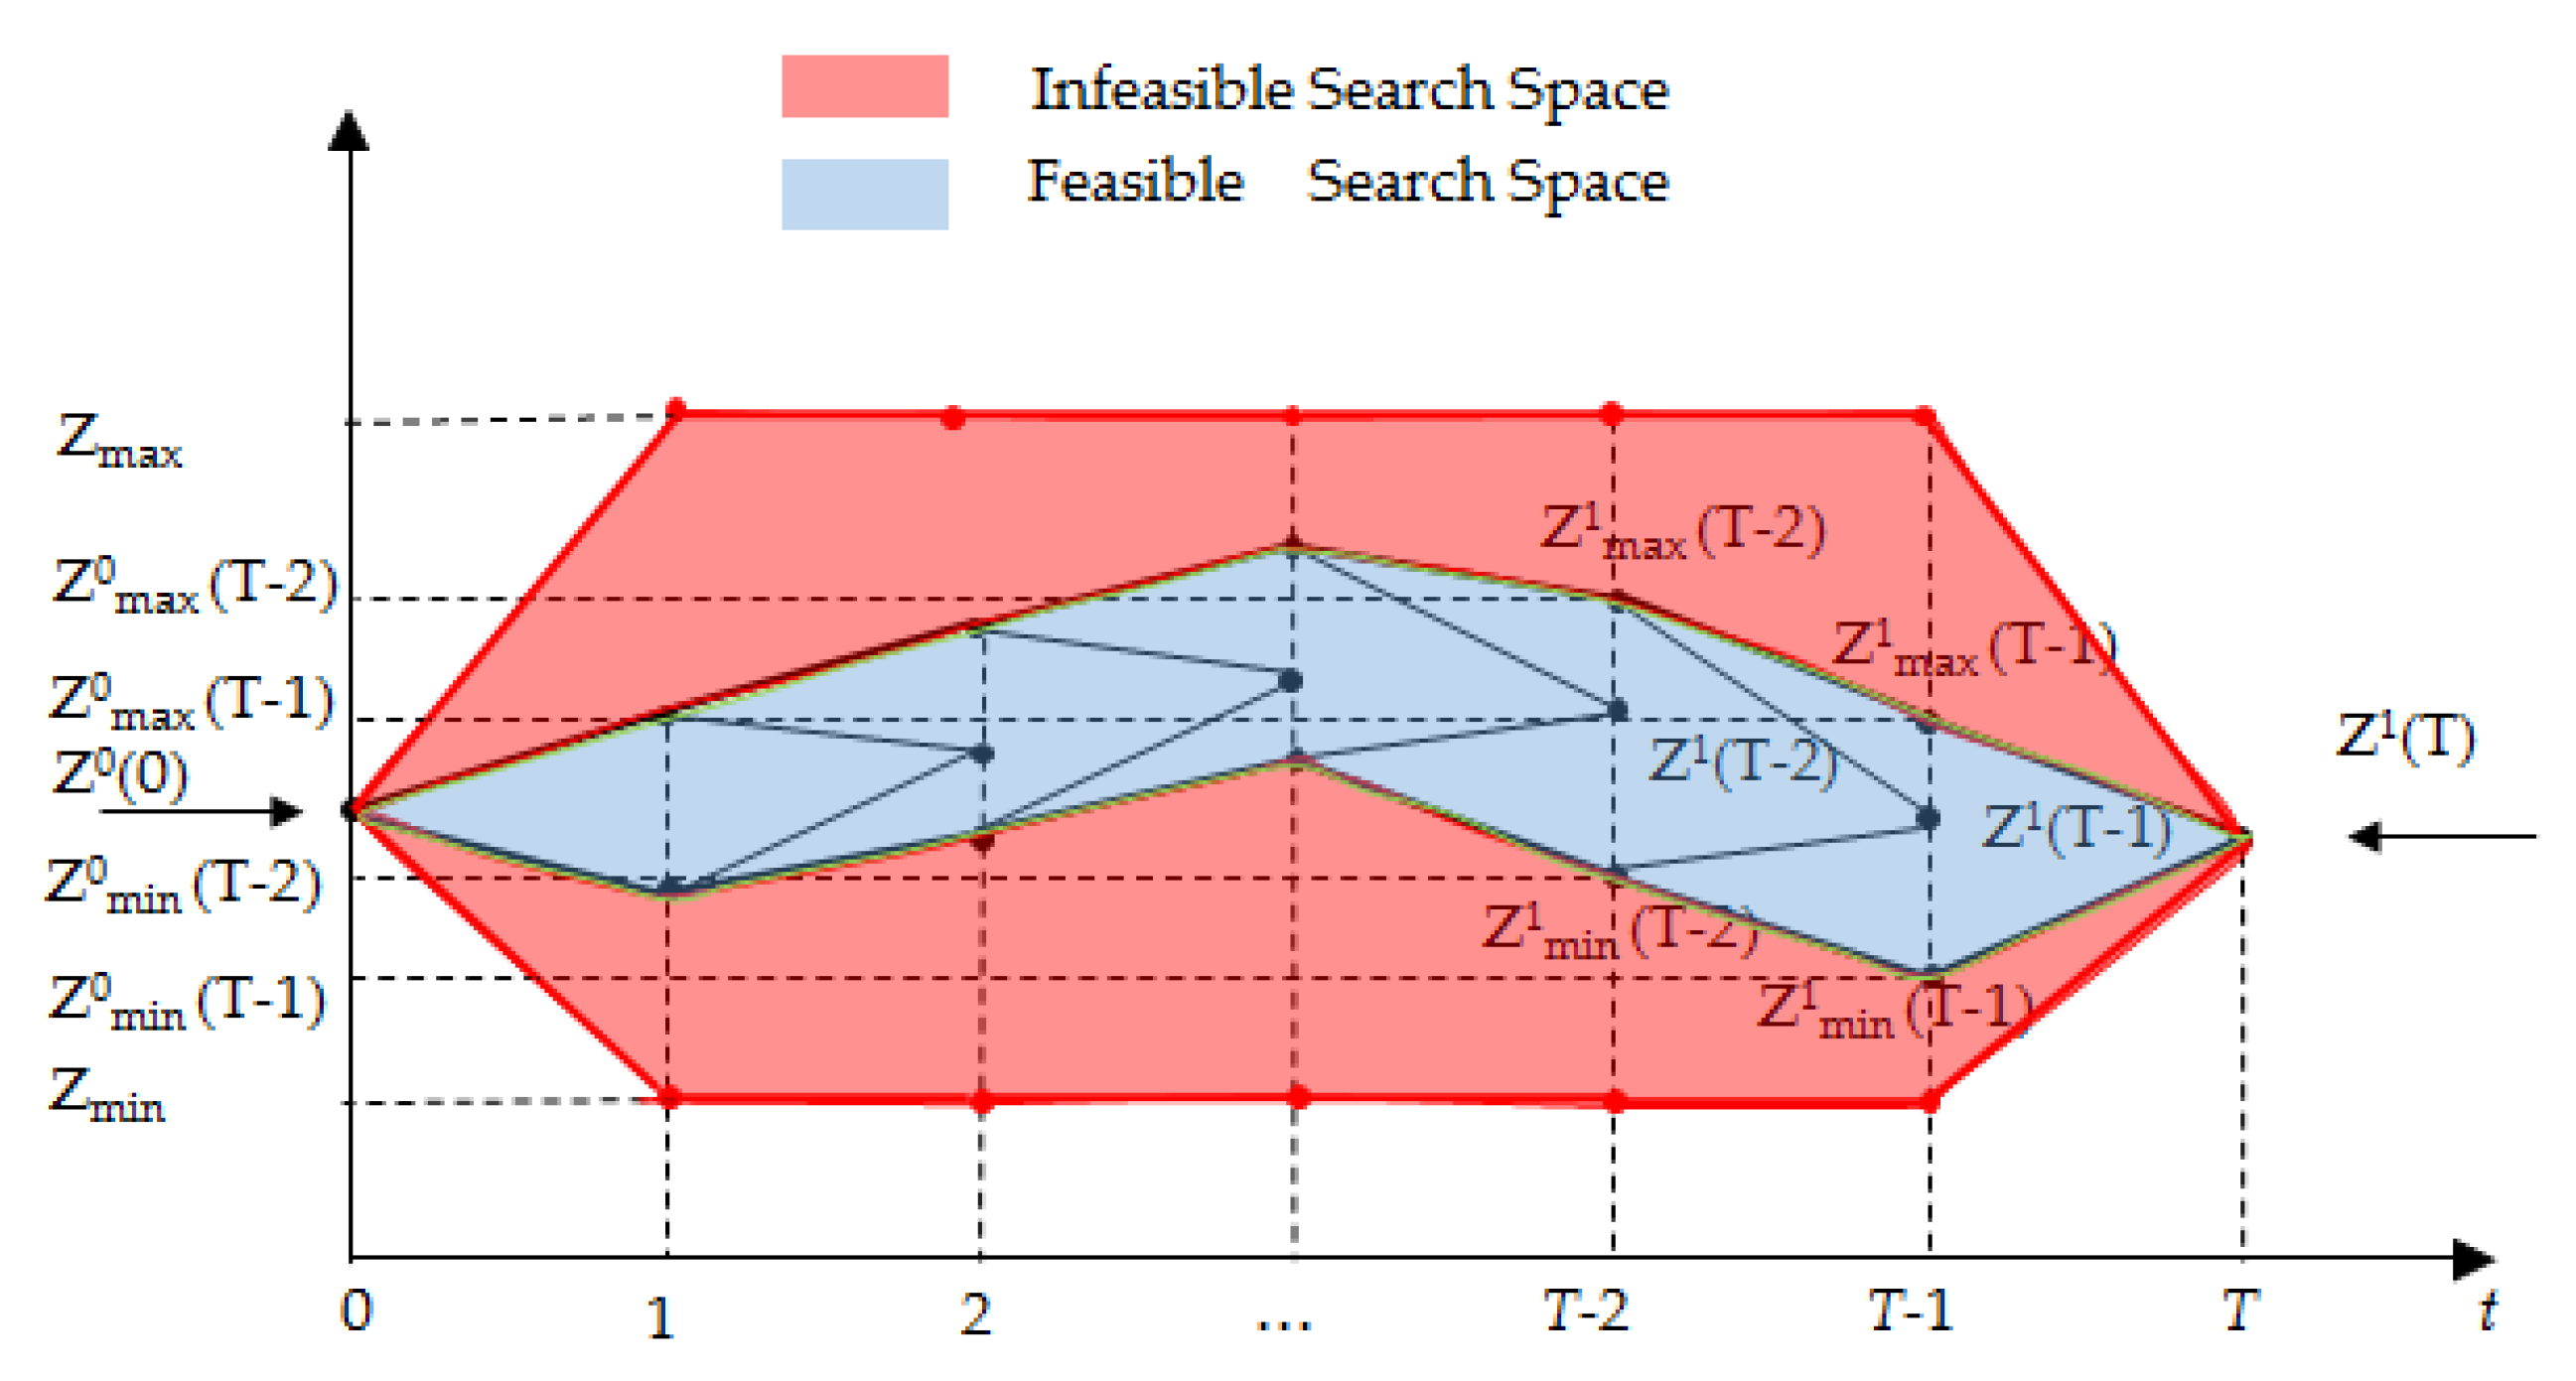
3. Modeling
4. Methodology
4.1. Single-Objective Solution
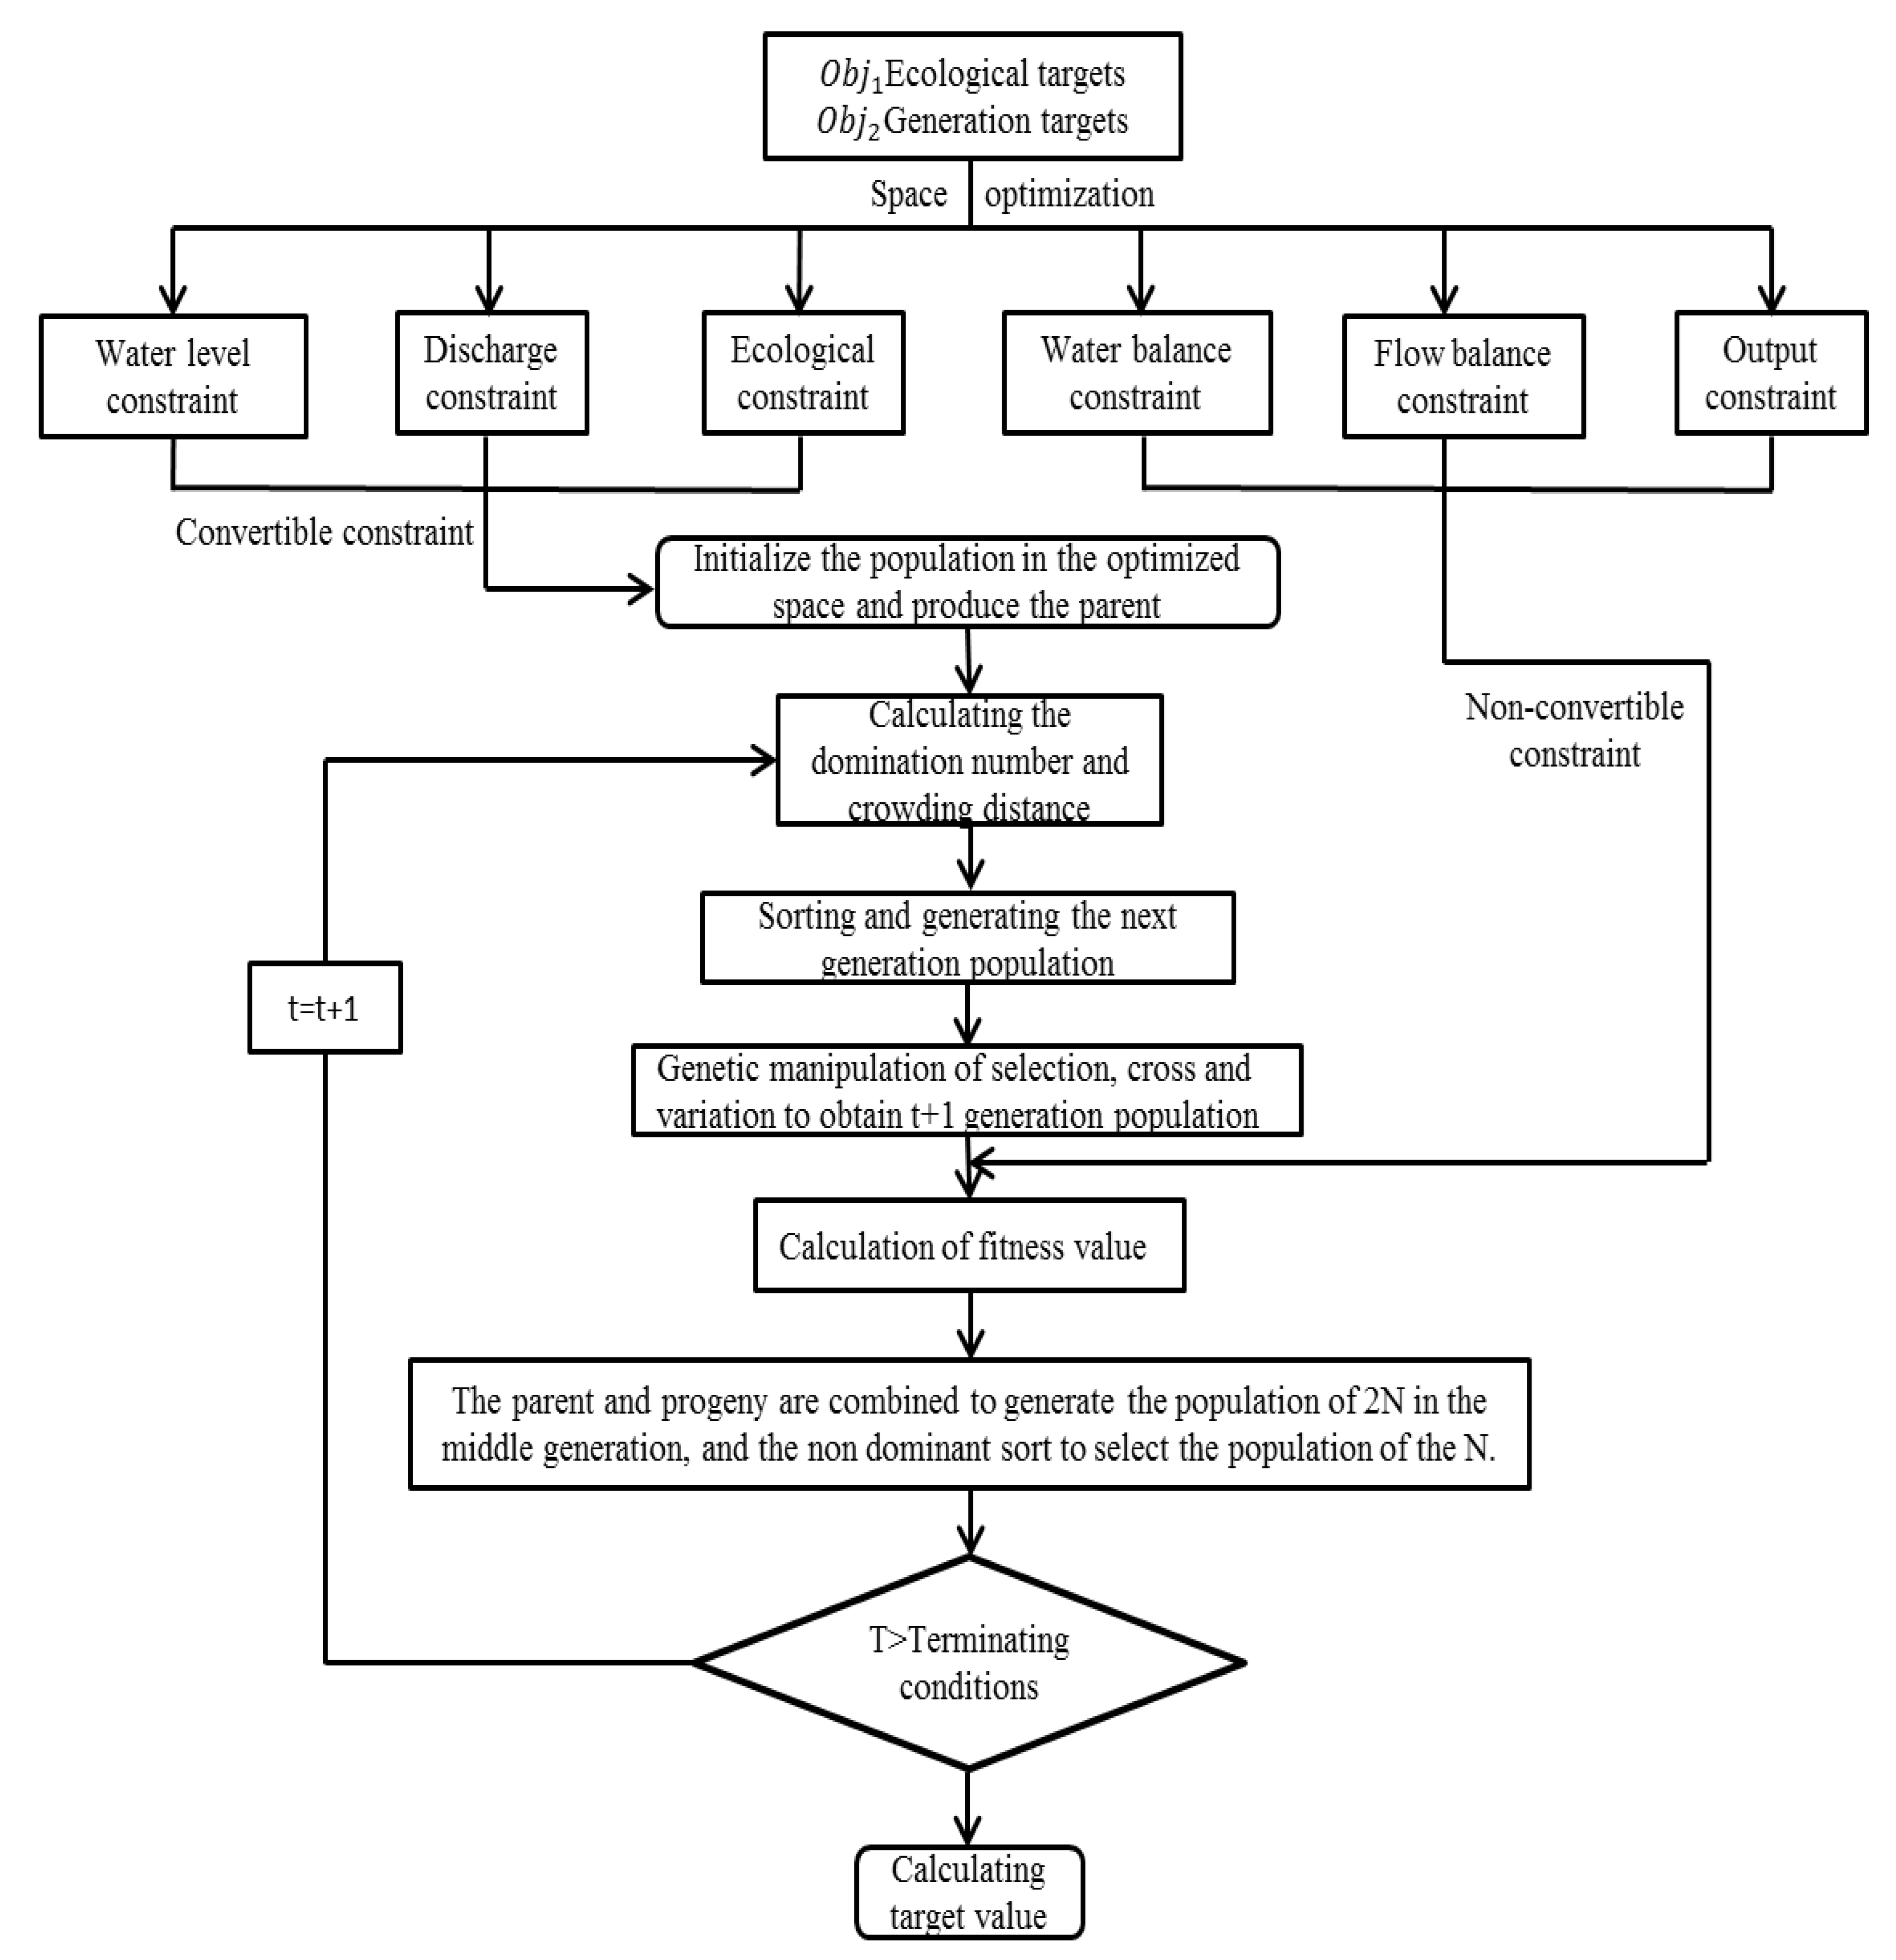
4.2. Multi-Objective Solution
5. Results and Discussion
5.1. Illustrate the Effectiveness of the NSGA-Ⅱ
5.2. Analysis of the Impact of Ecological Goals on Dispatching Results
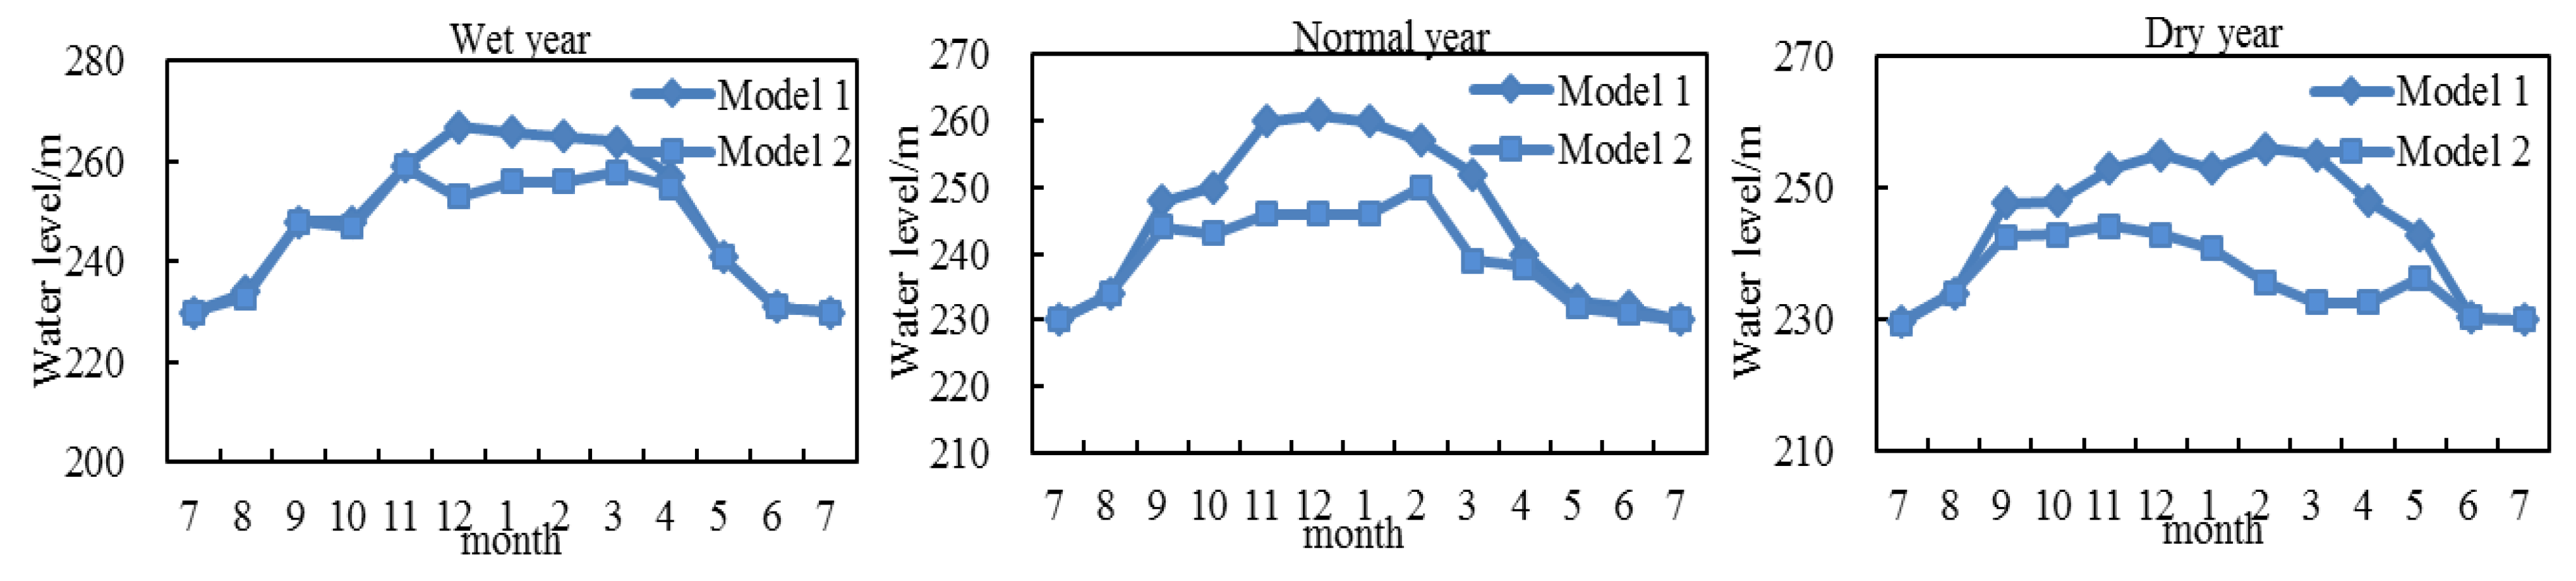
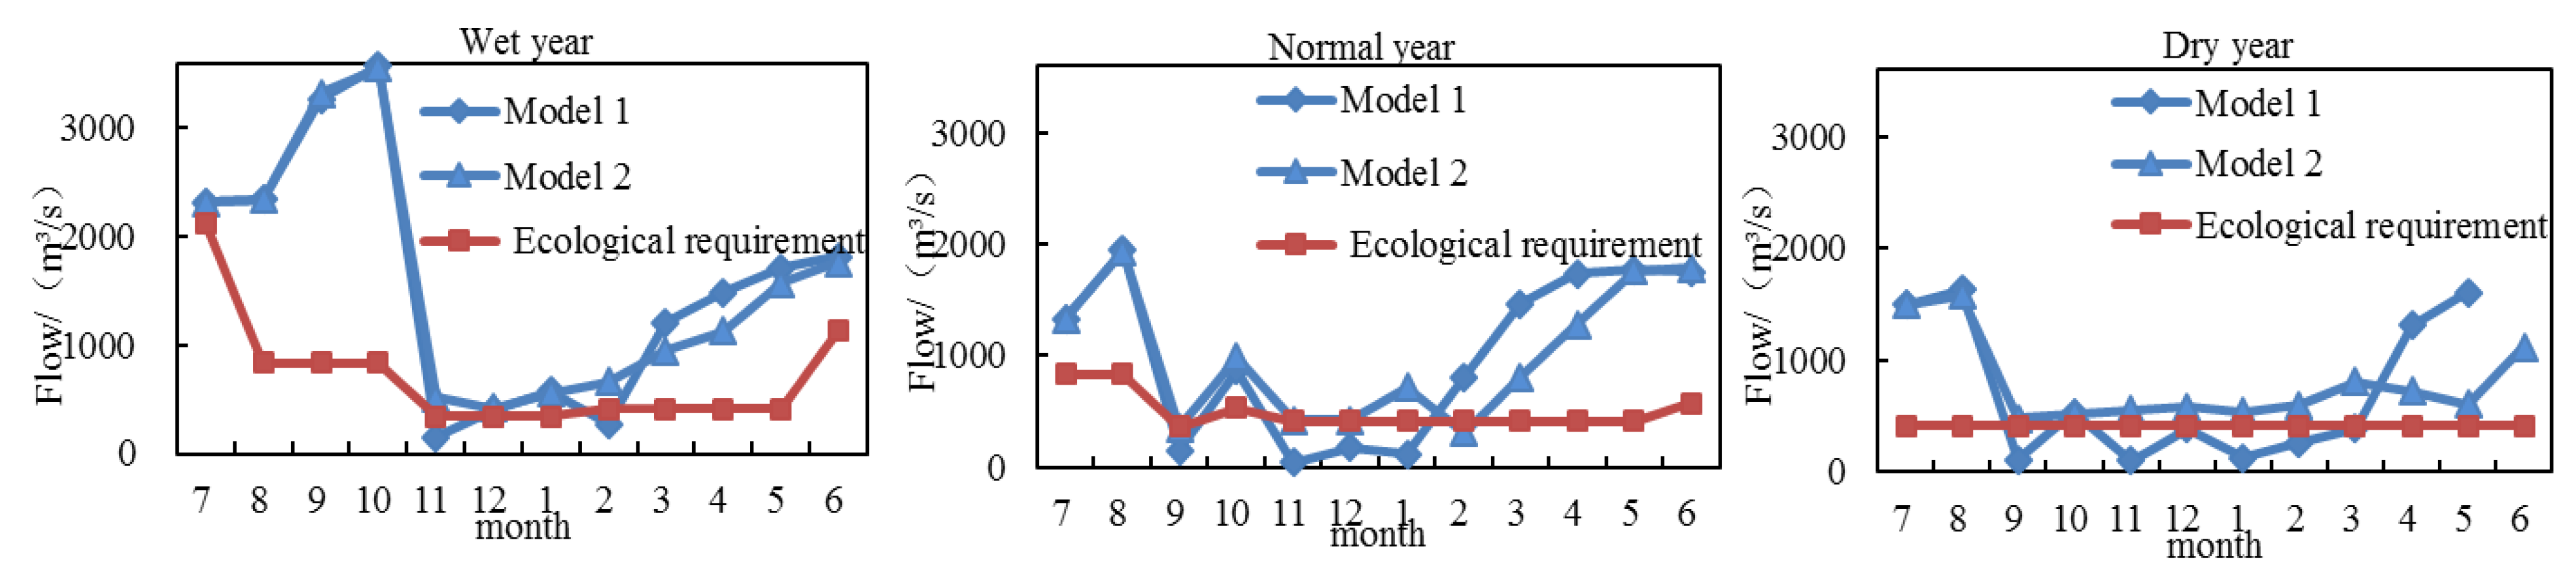
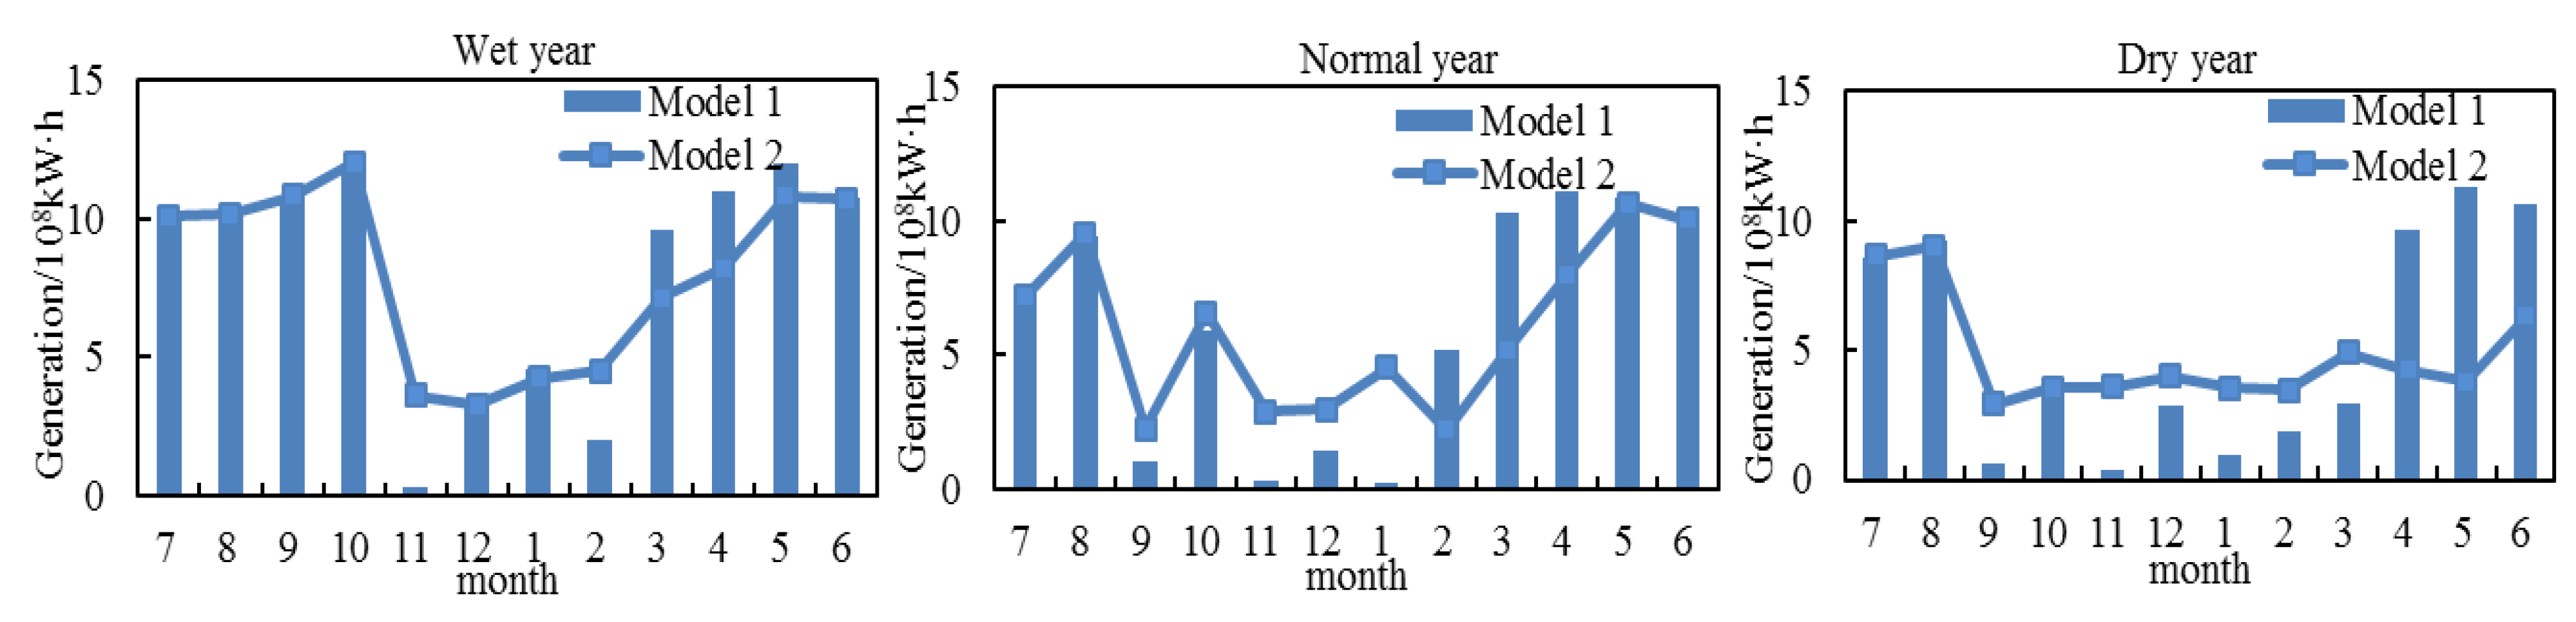
5.3. Result Analysis of the Multi-Objective Model
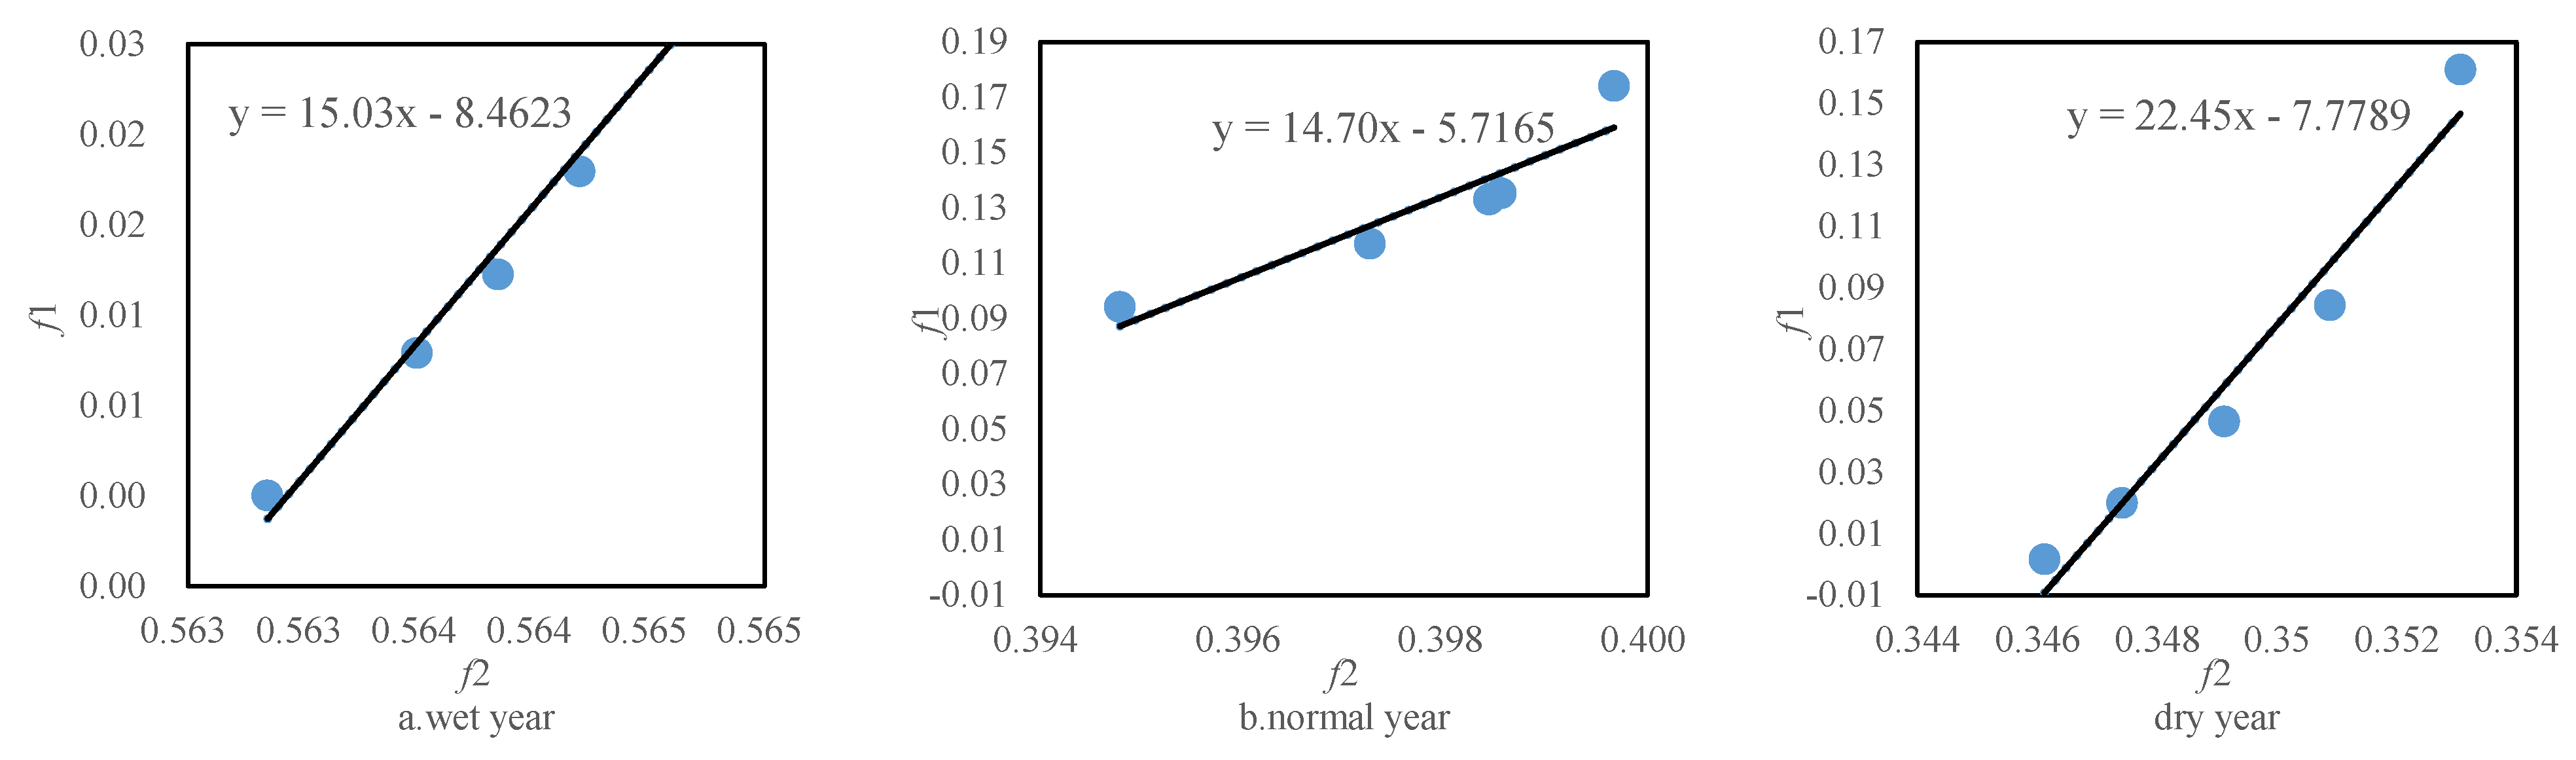
5.4. Sensitivity Analysis
6. Conclusions
Author Contributions
Funding
Acknowledgments
Conflicts of Interest
References
- Fu, C.L.; Li, Q.Y.; Wang, Q.B.; Li, Q. Influence of water and sediment regulation of the Xiaolangdi reservoir on the channel scouring and silting of lower reaches of the Yellow River. J. Water Resour. Water Eng. 2012, 23, 173–175. [Google Scholar]
- Jin, W.; Chang, J.; Wang, Y.; Bai, T. Long-term water-sediment multi-objectives regulation of cascade reservoirs: A case study in the Upper Yellow River, China. J. Hydrol. 2019, 577, 123978. [Google Scholar] [CrossRef]
- Bai, T.; Wu, L.; Chang, J.; Huang, Q. Multi-objective optimal operation model of cascade reservoirs and its application on water and sediment regulation. Water Resour. Manag. 2015, 29, 2751–2770. [Google Scholar] [CrossRef]
- Wan, Z.; An, C.; Yan, Z. Scouring Effect and Trend Predicting of Xiaolangdi Reservoir on Downstream River. Yellow River 2015, 34, 6–8. [Google Scholar]
- Pan, B.; Guan, Q.; Liu, Z.; Gao, H. Analysis of channel evolution characteristics in the hobq desert reach of the yellow river (1962–2000). Glob. Planet. Chang. 2015, 135, S0921818115300989. [Google Scholar] [CrossRef]
- Han, T. Problems and countermeasures for the conservation of aquatic biological resources in Xiaolangdi Reservoir. Henan Fish. 2014, 98, 11–12, 24. [Google Scholar]
- Cui, B.; Chang, X.; Shi, W. Abrupt Changes of Runoff and Sediment Load in the Lower Reaches of the Yellow River. Water Resour. 2014, 41, 252–260. [Google Scholar] [CrossRef]
- Shi, J.; Zhou, Y.; Mu, Y.; Zhang, N. Impact of Xiaolangdi Reservoir operation on the distribution of downstream water pollution. Yellow River 2006, 10, 41–42, 54. [Google Scholar]
- Liao, X.; Zhu, X.; Tian, W. Analysis on Increasing Power Generation Benefit of the Xiaolangdi Power Station. Water Conserv. Sci. Technol. Econ. 2014, 20, 100–102. [Google Scholar]
- Turgeon, A. A decomposition method for the long-term scheduling of reservoirs in series. Water Resour. Res. 1981, 17, 1565–1570. [Google Scholar] [CrossRef]
- Niewiadomska-Szynkiewicz, E.; Malinowski, K.; Karbowski, A. Predictive Methods for Real-Time Control of Flood Operation of a Multi-Reservoir System: Methodology and Comparative Study. Water Resour. Res. 1996, 32, 2885–2896. [Google Scholar] [CrossRef]
- Tian, Y.; Zhang, Z.; Chen, J. Real-time joint irrigation scheduling of reservoirs in central Liaoning. Water Resour. Manag Technol. 1994, 1, 47–49. [Google Scholar]
- Zhao, T.; Zhao, J.; Zhao, T. Optimizing Operation of Water Supply Reservoir: The Role of Constraints. Math. Probl. Eng. 2014, 2014, 1–15. [Google Scholar] [CrossRef]
- Ikhar, P.R.; Regulwar, D.G.; Kamodkar, R.U. Optimal reservoir operation using soil and water assessment tool and genetic algorithm. ISH J. Hydraul. Eng. 2017, 24, 249–257. [Google Scholar] [CrossRef]
- Wang, X.; Zhou, J.; Ou Yang, S.; Zhang, Y.-C. TGC eco-friendly generation multi-objective optimal dispatch model and its solution algorithm. J. Hydraul. Eng. 2013, 44, 154–163. [Google Scholar]
- Tabari, M.M.R.; Soltani, J. Multi-Objective Optimal Model for Conjunctive Use Management Using SGAs and NSGA-Ⅱ Models. Water Resour. 2013, 27, 37–53. [Google Scholar] [CrossRef]
- Abido, M.A. Multiobjective Evolutionary Algorithms for Electric Power Dispatch Problem. IEEE Trans. Evol. Comput. 2006, 10, 315–329. [Google Scholar] [CrossRef]
- Ahmadi, M.; Bozorg Haddad, O.; Marino, M.A. Extraction of flexible multi-objective real-time reservoir operation rules. Water Resour. Manag. 2014, 28, 131–147. [Google Scholar] [CrossRef]
- Shokri, A.; Haddad, O.B.; Mari, O.M.A. Algorithm for Increasing the Speed of Evolutionary Optimization and its Accuracy in Multi-objective Problems. Water Resour. Manag. 2013, 27, 2231–2249. [Google Scholar] [CrossRef]
- Afshar, A.; Sharifi, F.; Jalali, M.R. Applying the non-dominated archiving multi-colony ant algorithm for multi-objective optimization: Application to multi-purpose reservoir operation. Engng. Optimiz. 2009, 41, 313–325. [Google Scholar] [CrossRef]
- Alizadeh, M.R.; Nikoo, M.R.; Rakhshandehroo, G.R. Hydro-Environmental Management of Groundwater Resources: A Fuzzy-Based Multi-Objective Compromise Approach. J. Hydrol. 2017, 551, 540–554. [Google Scholar] [CrossRef]
- Afshar, A.; Shojaei, N.; Sagharjooghifarahani, M. Multiobjective Calibration of Reservoir Water Quality Modeling Using Multiobjective Particle Swarm Optimization (MOPSO). Water Resour. Manag. 2013, 27, 1931–1947. [Google Scholar] [CrossRef]
- Reddy, M.J.; Kumar, D.N. Optimal Reservoir Operation Using Multi-Objective Evolutionary Algorithm. Water Resour. Manag. 2006, 20, 861–878. [Google Scholar] [CrossRef] [Green Version]
- Bai, T.; Chang, J.X.; Chang, F.J.; Huang, Q.; Wang, Y.M.; Chen, G.S. Synergistic Gains from the Multi-Objective Optimal Operation of Cascade Reservoirs in the Upper Yellow River Basin. J. Hydrol. 2015, 523, 758–767. [Google Scholar] [CrossRef]
- Reddy, M.J.; Nagesh Kumar, D. Multi-Objective Particle Swarm Optimization for Generating Optimal Trade-Offs in Reservoir Operation. Hydrol. Process. 2010, 21, 2897–2909. [Google Scholar] [CrossRef]
- Wang, X.; Chang, J.; Meng, X.; Wang, Y. Research on Multi-Objective Operation Based on Improved Nsga-ii for the Lower Yellow River. J. Hydraul. Eng. 2017, 48, 135–145. [Google Scholar]
- Robin, W.; Mohd, S. Evaluation of genetic algorithm for optimal reservoir system operation. J. Water Resour. Plan. Manag. 1999, 125, 25–33. [Google Scholar]
- Wang, X.; Li, C. Research and application of genetic algorithm in short-term optimal power generation dispatching. J. Yangtze River Sci. Acad. (Eng. Ed.) 2003, 20, 28–31. [Google Scholar]
- Huang, C.; Wang, Z.; Li, S.; Chen, S.-L. A multi-reservoir operation optimization model and application in the upper Yangtze River Basin, I. Principle and solution of the model. J. Hydraul. Eng. 2014, 45, 1009–1018. [Google Scholar]
- Yang, N.; Mei, Y.; Yu, L. Multi-objective reservoir optimal operation model considering natural flow regime and its application. J. Hehai Univ. (Nat. Sci.) 2013, 41, 86–89. [Google Scholar]
- Jin, X.; Hao, C.; Wang, G.; Wang, L.H. Multi-objective ecological operation of water supply reservoir. South-North Transf. Water Sci. Technol. 2015, 13, 463–466. [Google Scholar]
- Shi, Z.; Luo, Y.; Qiu, J. Optimal dispatch of cascaded hydropower stations using Matlab genetic algorithm toolbox. Electr. Power Autom. Equip. 2005, 25, 30–33. [Google Scholar]
- Chang, J.; Huang, Q.; Wang, Y. Optimal Operation of Hydropower Station Reservoir by Using an Improved Genetic Algorithm. J. Hydroelectr. Eng. 2001, 3, 1–20. [Google Scholar]
- You, J.; Ji, C.; Fu, X. New method for solving multi-objective problem based on genetic algorithm. J. Hydraul. Eng. 2003, 34, 64–69. [Google Scholar]
- Deb, K.; Pratap, A.; Agarwal, S.; Meyarivan, T. A fast and elitist multiobjective genetic algorithm: NSGA-II. IEEE Trans. Evol. Comput. 2002, 6, 182–197. [Google Scholar] [CrossRef] [Green Version]
- Kim, T.; Heo, J.H.; Jeong, C.S. Multi-reservoir system optimization in the Han River basin using multi-objective genetic algorithms. Hydrol. Process 2006, 20, 2057–2075. [Google Scholar] [CrossRef]
- Li, H.; Zhang, Q. Multiobjective Optimization Problems With Complicated Pareto Sets, MOEA/D and NSGA-II. IEEE Trans. Evol. Comput. 2009, 13, 284–302. [Google Scholar] [CrossRef]
- Chang, L.C.; Chang, F.J. Multi-objective evolutionary algorithm for operating parallel reservoir system. J. Hydrol. 2009, 377, 12–20. [Google Scholar] [CrossRef]
- Tsai, W.P.; Chang, F.J.; Chang, L.C.; Herricks, E.E. AI techniques for optimizing multi-objective reservoir operation upon human and riverine ecosystem demands. J. Hydrol. 2015, 530, 634–644. [Google Scholar] [CrossRef]
- Chen, L.; Mc, P.J.; Yeh, W.W.G. A diversified multi-objective GA for optimizing reservoir Rule curves. Adv. Water Resour. 2007, 30, 1082–1093. [Google Scholar] [CrossRef]
- Yun, R.; Dong, Z.; Wang, H. Multiobjective optimization of a reservoir based on NSGA2. J. Shandong Univ. (Eng. Sci.) 2010, 40, 125–128. [Google Scholar]
- Zhu, J.; Chen, S.; Wan, B.; Huang, S.T.; Tu, J.J.; Fu, X. The Application of NSGA-II for Medium or Long-term Multi-Objective Optimal Scheduling in Zhanghe Reservoir. China Rural Water Hydropower 2013, 9, 60–62, 66. [Google Scholar]
- Vieira, J.; Cunha, M.C.; Luis, R. Integrated Assessment of Water Reservoir Systems Performance with the Implementation of Ecological Flows under Varying Climatic Conditions. Water Resour. Manag. 2018, 32, 5183–5205. [Google Scholar] [CrossRef]
- Ziyu, D.; Guohua, F.; Xin, W.; Tan, Q. A novel operation chart for cascade hydropower system to alleviate ecological degradation in hydrological extremes. Ecol. Model. 2018, 384, 10–22. [Google Scholar]
- Niu, W.J.; Feng, Z.K.; Cheng, C.T. Optimization of variable-head hydropower system operation considering power shortage aspect with quadratic programming and successive approximation. Energy 2018, 143, 1020–1028. [Google Scholar] [CrossRef]
- Williams, P.J.; Kendall, W.L. A guide to multi-objective optimization for ecological problems with an application to cackling goose management. Ecol. Model. 2017, 343, 54–67. [Google Scholar] [CrossRef] [Green Version]
- Xia, Y.; Feng, Z.; Niu, W.; Qin, H. Simplex quantum-behaved particle swarm optimization algorithm with application to ecological operation of cascade hydropower reservoirs. Appl. Soft Comput. 2019, 84, 105715. [Google Scholar] [CrossRef]
- Yang, Z.; Yang, K.; Su, L.; Hu, H. The multi-objective operation for cascade reservoirs using MMOSFLA with emphasis on power generation and ecological benefit. J. Hydroinf. 2019, 21, 257–278. [Google Scholar] [CrossRef]
- Bai, T.; Wei, J.; Chang, F.J.; Yang, W.; Huang, Q. Optimize multi-objective transformation rules of water-sediment regulation for cascade reservoirs in the Upper Yellow River of China. J. Hydrol. 2019, 577, 123987. [Google Scholar] [CrossRef]
- Qi, Z. Analysis on Environmental Impact of Xiaolangdi Reservoir Operation. Yellow River 2011, 33, 97–98. [Google Scholar]
- Lei, Y.; Zhang, S. Matlab Genetic Algorithm Toolbox and Its Application; Xidian University Press: Xi’an, China, 2014. [Google Scholar]


| Installed Capacity (MW) | Guaranteed Output (MW) | Total Storage Capacity (Billion m3) | Normal Water Level (m) | Dead Water Level (m) | Ecological Guarantee Rate (%) | Maximum Overflow (m3/s) | Adjustment Performance |
|---|---|---|---|---|---|---|---|
| 1800 | 354 | 126.5 | 275 | 230 | 90 | 1776 | Year |
| Parameter | GA | MOPSO | NSGA-Ⅱ | Optimized NSGA-Ⅱ [12] |
|---|---|---|---|---|
| Population size | 300 | 300 | 300 | 300 |
| Selection probability | 0.5 | - | 0.5 | 0.5 |
| Cross probability | 0.8 | - | 0.8 | 0.8 |
| Mutation probability | 0.05 | - | 0.05 | 0.05 |
| Maximum number of iterations | 200 | 200 | 200 | 200 |
| Algorithm | Target | 1 | 2 | 3 | 4 | 5 | Mean Value | Standard Deviation | Time | |||||||
|---|---|---|---|---|---|---|---|---|---|---|---|---|---|---|---|---|
| Lower Limit | Upper Limit | Lower Limit | Upper Limit | Lower Limit | Upper Limit | Lower Limit | Upper Limit | Lower Limit | Upper Limit | Lower Limit | Upper Limit | Lower Limit | Upper Limit | |||
| GA | Power generation | - | 103.15 | - | 103.17 | - | 103.15 | - | 103.15 | - | 103.13 | - | 103.15 | - | 103.15 | 1.63 |
| Water shortage | - | 5.00 | - | 5.07 | - | 5.05 | - | 5.06 | - | 5.05 | - | 5.04 | - | 5.04 | ||
| MOPSO | Power generation | 102.90 | 103.15 | 102.82 | 103.14 | 102.83 | 103.15 | 102.85 | 103.15 | 102.82 | 103.13 | 102.85 | 103.14 | 102.85 | 103.14 | 2.63 |
| Water shortage | 0.01 | 5.06 | 0.00 | 5.04 | 0.00 | 5.09 | 0.00 | 5.16 | 0.00 | 5.01 | 0.00 | 5.07 | 0.00 | 5.07 | ||
| NSGA-Ⅱ | Power generation | 102.80 | 103.17 | 102.82 | 103.06 | 102.78 | 103.16 | 102.78 | 103.17 | 102.80 | 103.13 | 102.80 | 103.14 | 102.80 | 103.14 | 2.65 |
| Water shortage | 0.00 | 5.04 | 0.00 | 3.35 | 0.00 | 5.06 | 0.00 | 5.06 | 0.00 | 5.06 | 0.00 | 4.71 | 0.00 | 4.71 | ||
| Improved NSGA-Ⅱ | Power generation | 102.83 | 103.14 | 102.81 | 103.17 | 102.77 | 103.16 | 102.83 | 103.15 | 102.80 | 103.13 | 102.80 | 103.15 | 102.80 | 103.15 | 2.40 |
| Water shortage | 0.00 | 5.06 | 0.00 | 5.06 | 0.00 | 5.05 | 0.00 | 5.06 | 0.00 | 5.06 | 0.00 | 5.06 | 0.00 | 5.06 | ||
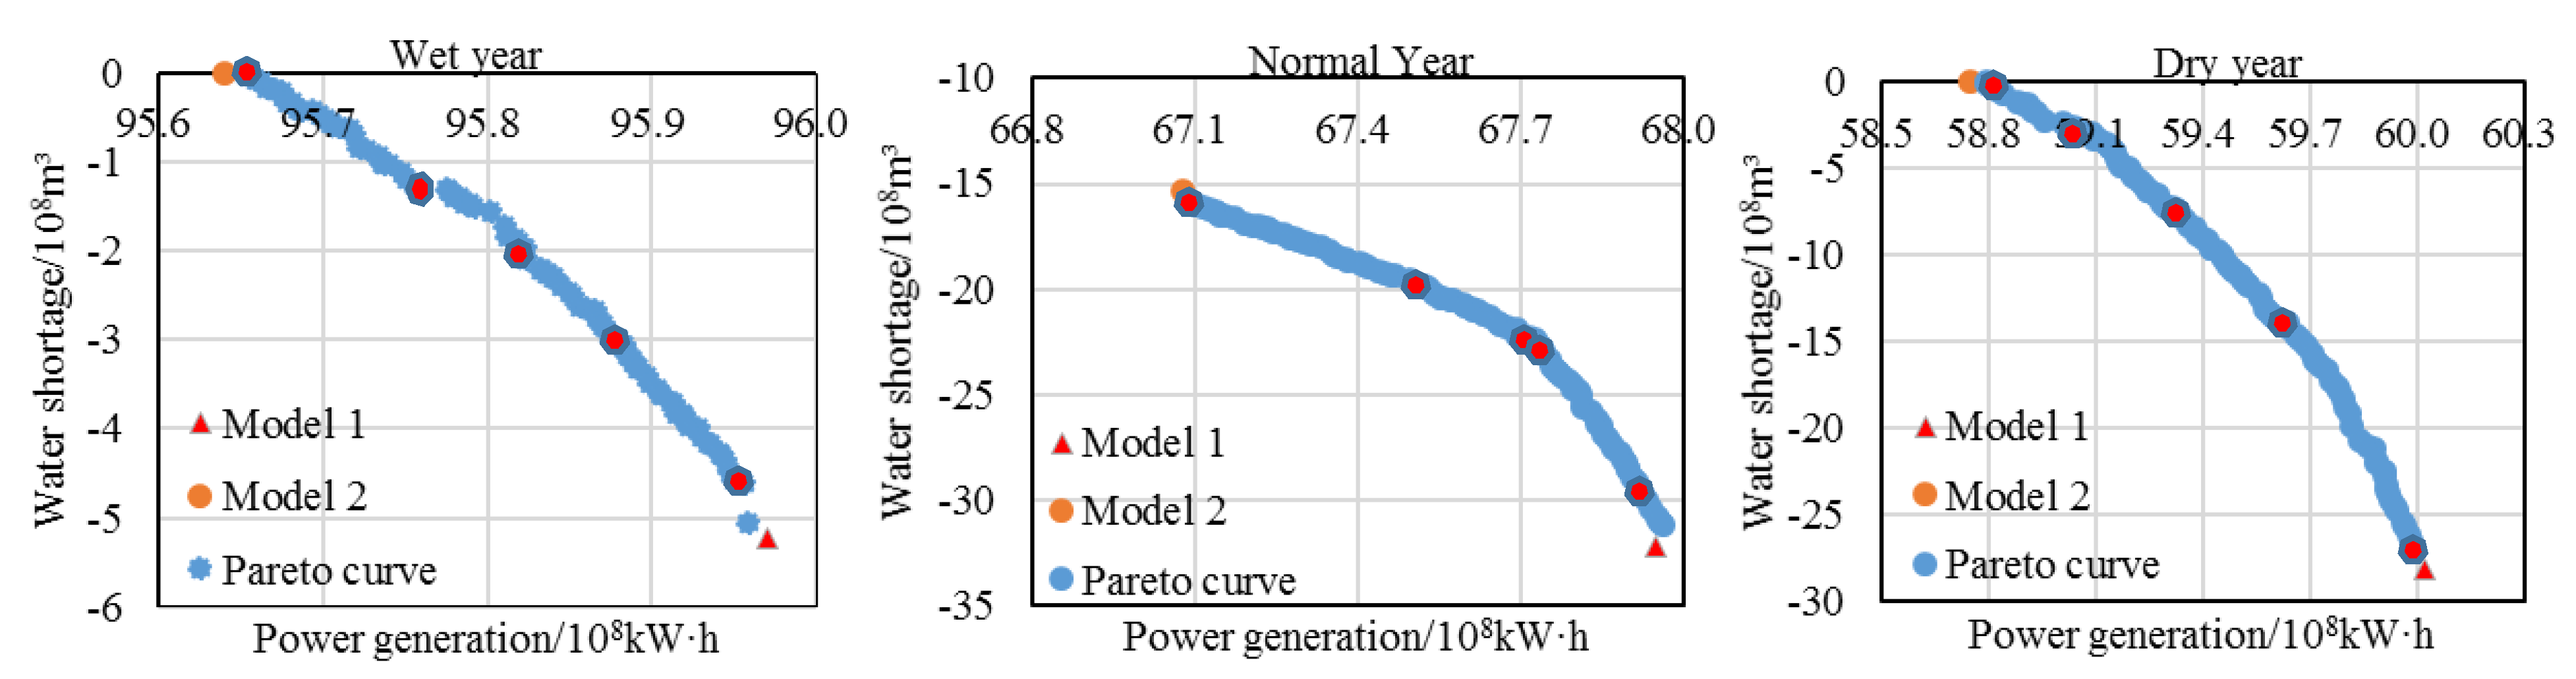
| Wet Year | Normal Year | Dry Year | ||||
|---|---|---|---|---|---|---|
| Model 1 | Model 2 | Model 1 | Model 2 | Model 1 | Model 2 | |
| Power generation/108 kW·h | 95.97 | 95.64 | 67.95 | 67.09 | 60.02 | 58.75 |
| The number of guarantee ecology | 10 | 12 | 8 | 12 | 8 | 12 |
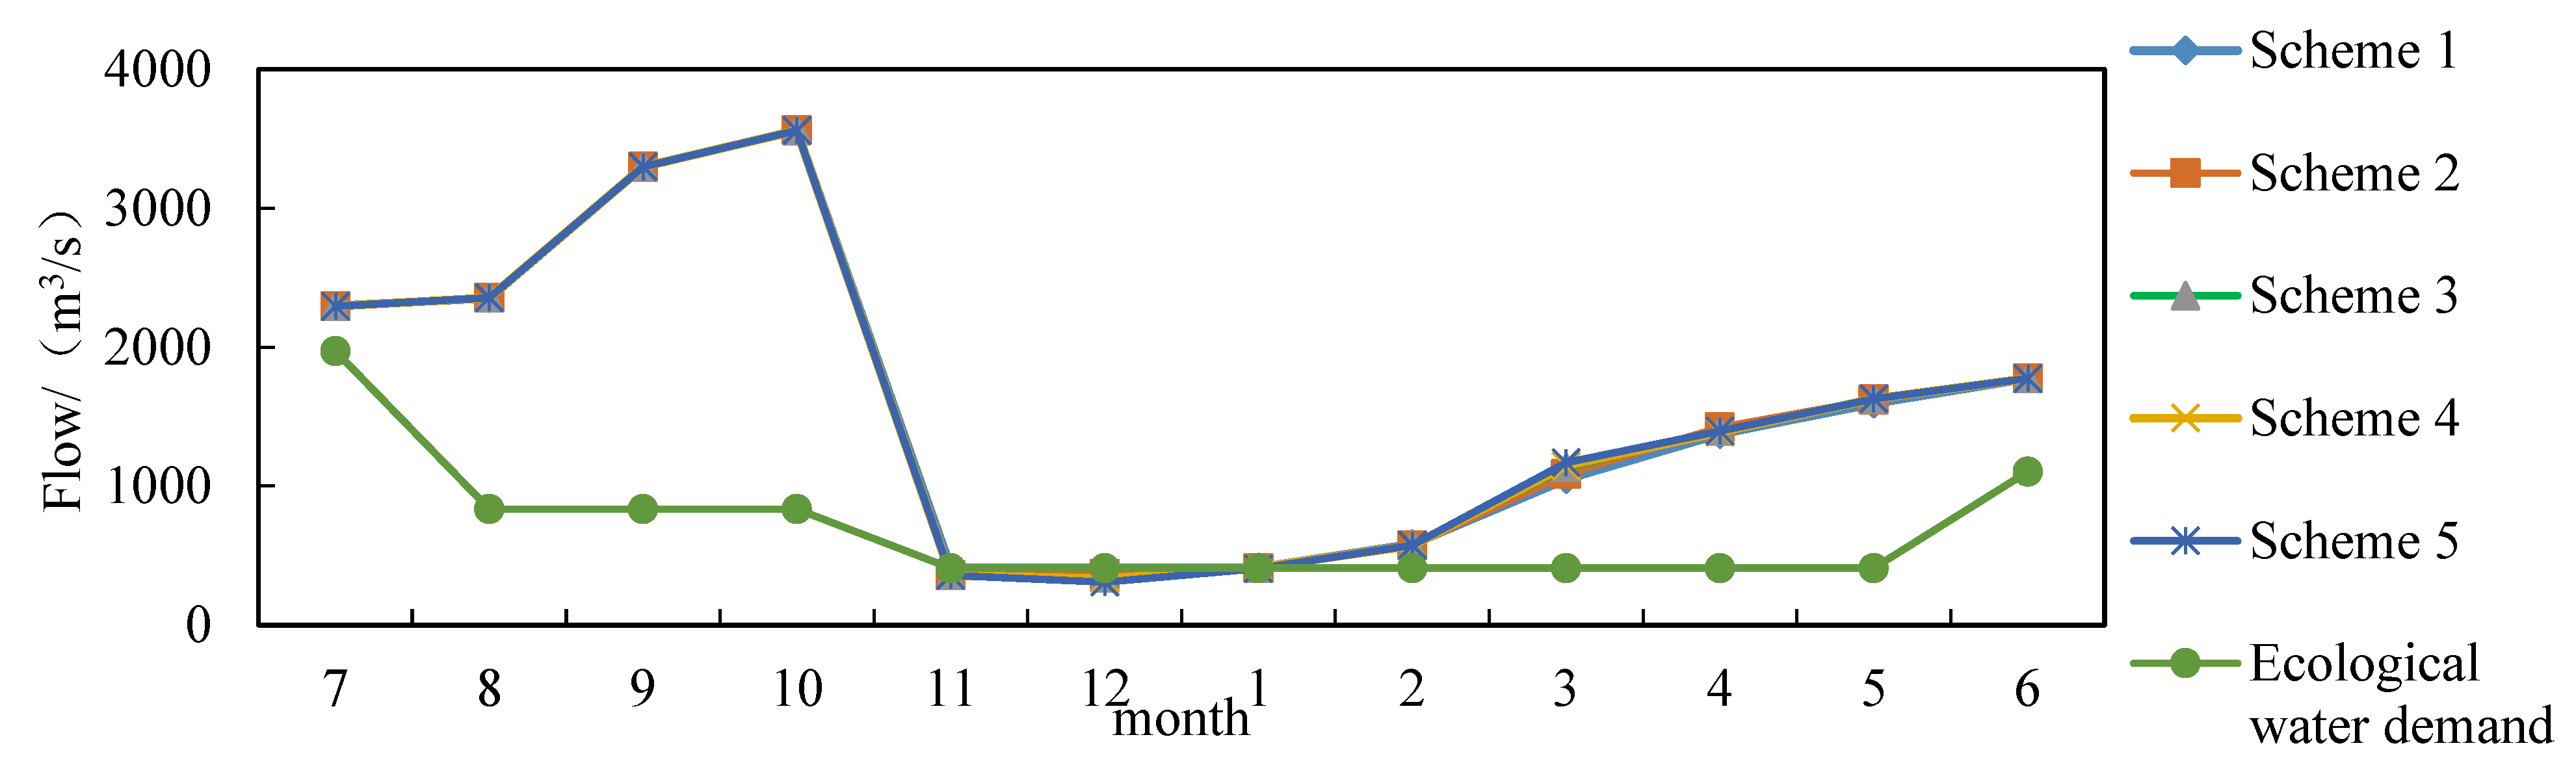
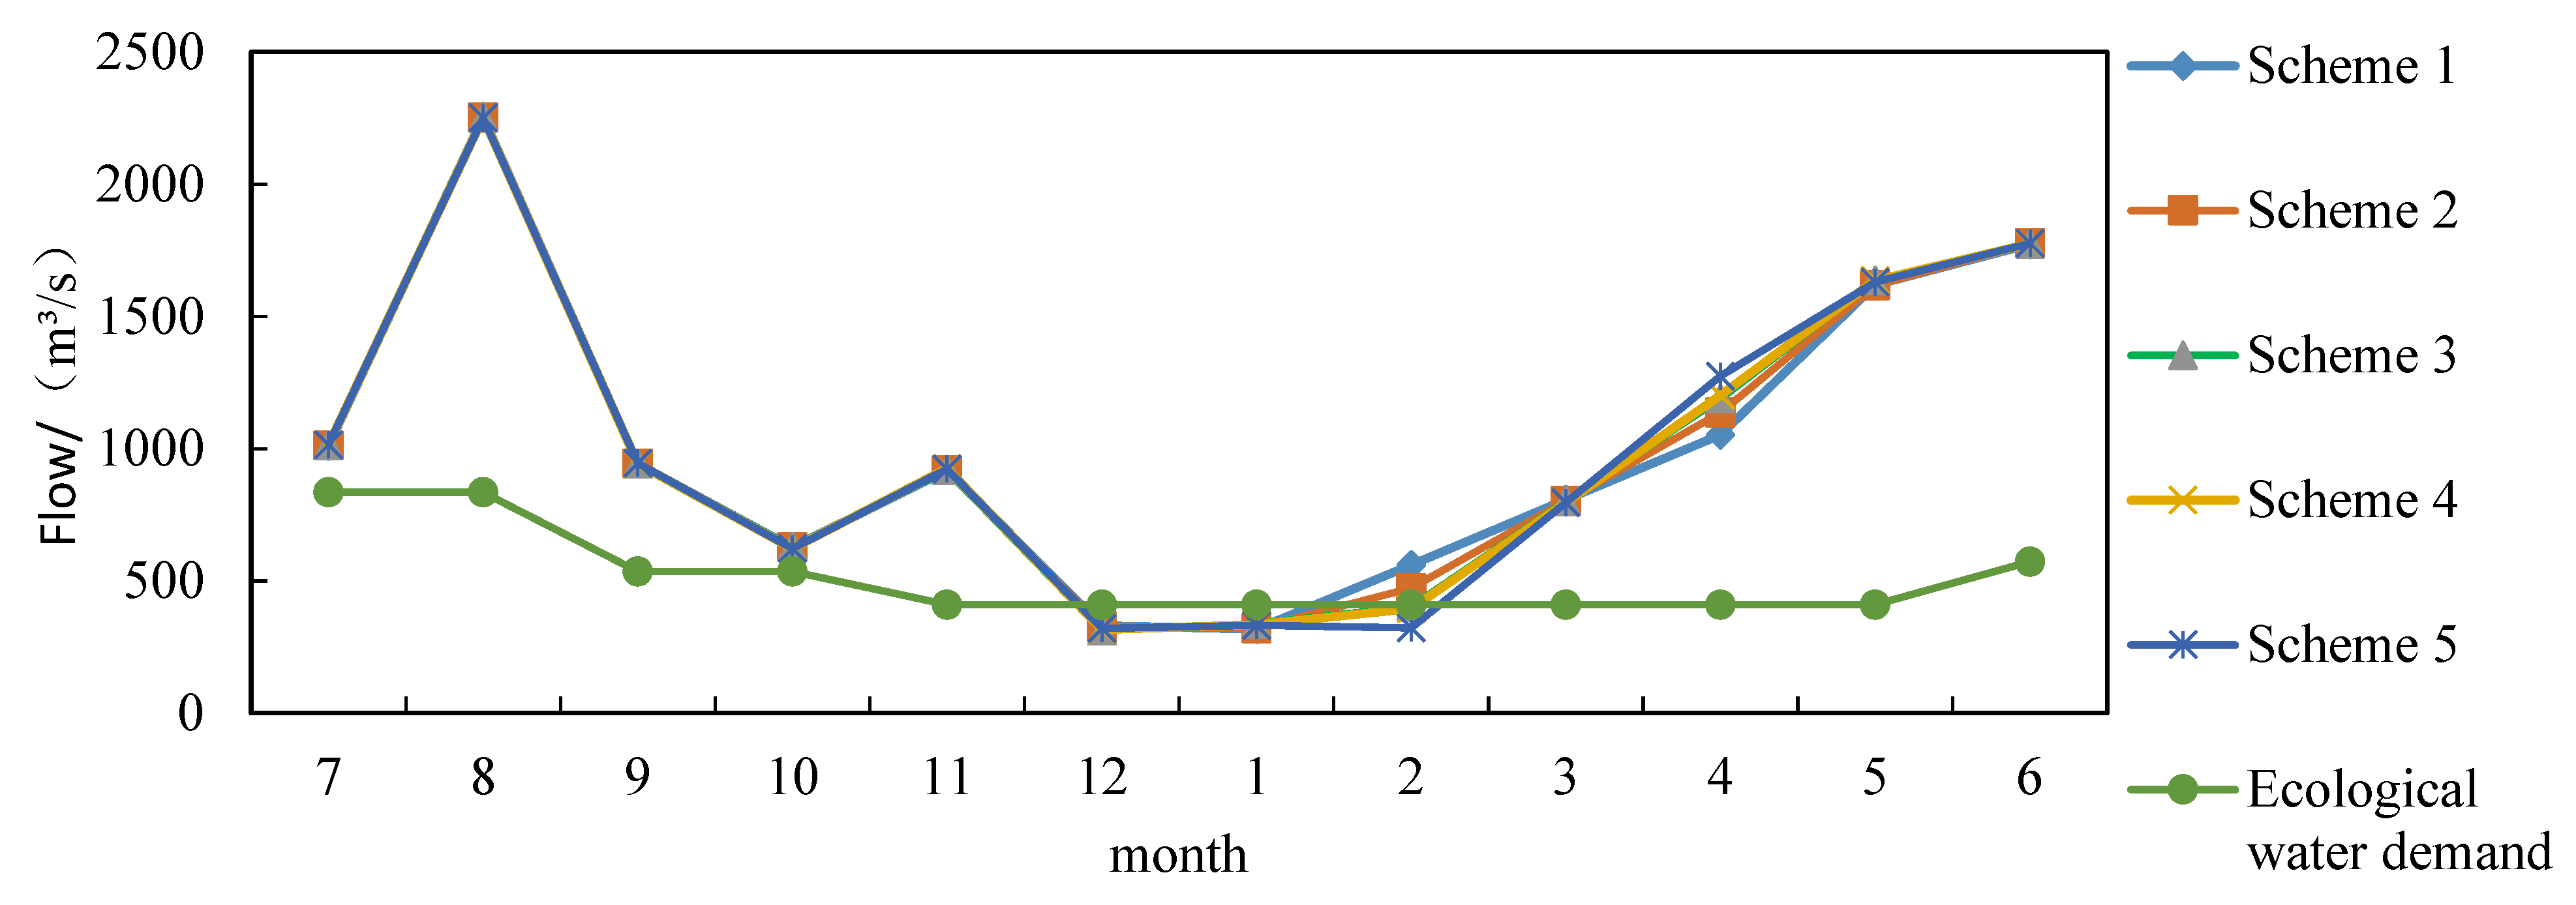
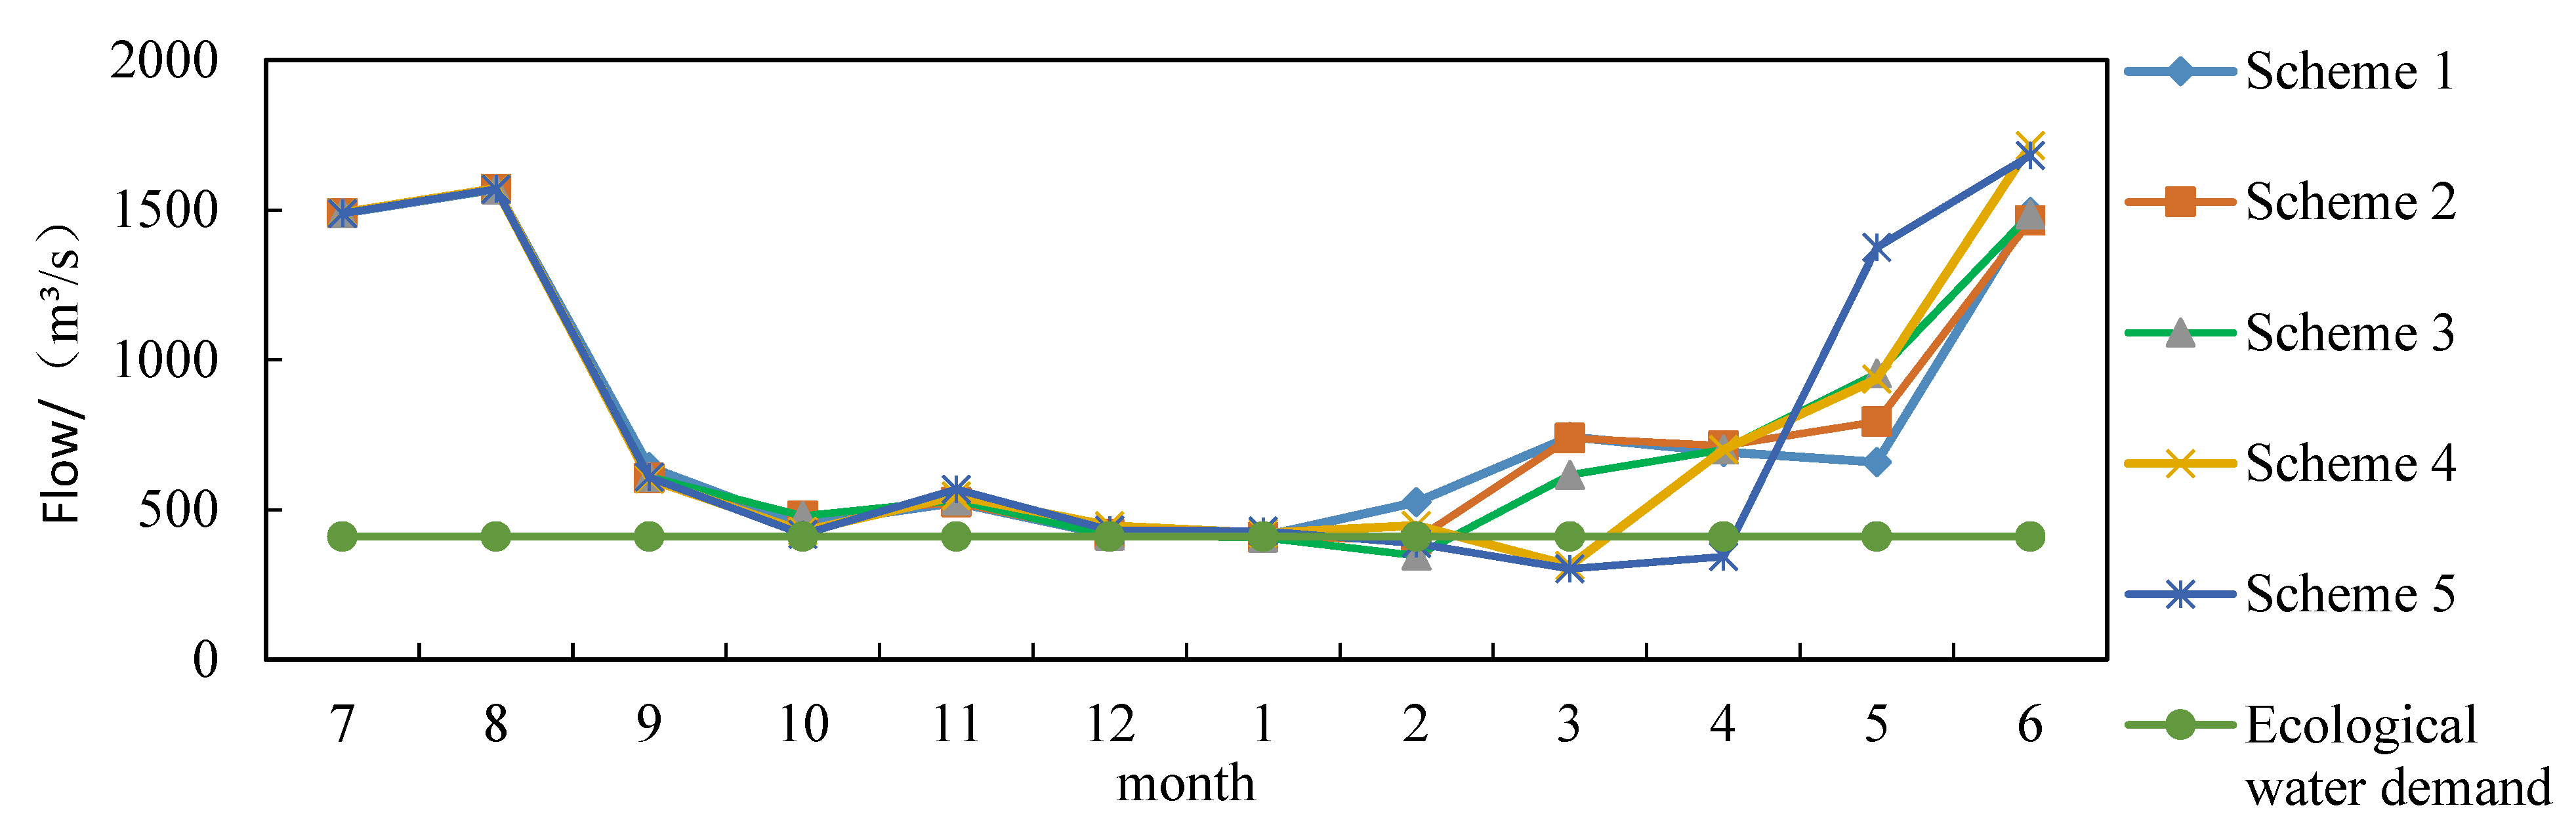
| Scheme | Wet Year | Normal Year | Dry Year | |||
|---|---|---|---|---|---|---|
| Power Generation/108kW·h | Eco-Water Shortage/108m3 | Power Generation/108kW·h | Eco-Water Shortage/108m3 | Power Generation/108kW·h | Eco-Water Shortage/108m3 | |
| Scheme 1 | 95.65 | 0 | 67.09 | 16.01 | 58.82 | 0.28 |
| Scheme 2 | 95.76 | 1.34 | 67.51 | 19.88 | 59.04 | 3.38 |
| Scheme 3 | 95.82 | 2.08 | 67.71 | 22.6 | 59.33 | 7.9 |
| Scheme 4 | 95.88 | 3.05 | 67.73 | 22.98 | 59.63 | 14.32 |
| Scheme 5 | 95.95 | 4.62 | 67.92 | 29.57 | 60 | 27.36 |
© 2020 by the authors. Licensee MDPI, Basel, Switzerland. This article is an open access article distributed under the terms and conditions of the Creative Commons Attribution (CC BY) license (http://creativecommons.org/licenses/by/4.0/).
Share and Cite
Bai, T.; Liu, X.; HA, Y.-p.; Chang, J.-x.; Wu, L.-z.; Wei, J.; Liu, J. Study on the Single-Multi-Objective Optimal Dispatch in the Middle and Lower Reaches of Yellow River for River Ecological Health. Water 2020, 12, 915. https://doi.org/10.3390/w12030915
Bai T, Liu X, HA Y-p, Chang J-x, Wu L-z, Wei J, Liu J. Study on the Single-Multi-Objective Optimal Dispatch in the Middle and Lower Reaches of Yellow River for River Ecological Health. Water. 2020; 12(3):915. https://doi.org/10.3390/w12030915
Chicago/Turabian StyleBai, Tao, Xia Liu, Yan-ping HA, Jian-xia Chang, Lian-zhou Wu, Jian Wei, and Jin Liu. 2020. "Study on the Single-Multi-Objective Optimal Dispatch in the Middle and Lower Reaches of Yellow River for River Ecological Health" Water 12, no. 3: 915. https://doi.org/10.3390/w12030915