Numerical Simulation of Unstable Preferential Flow during Water Infiltration into Heterogeneous Dry Soil


1
Department of Civil Engineering: Hydraulics, Energy and Environment, Universidad Politécnica de Madrid, 28006 Madrid, Spain
2
Department of Earth and Planetary Sciences, University of California Berkeley, Berkeley, CA 94720, USA
3
Department of Civil and Environmental Engineering, Massachusetts Institute of Technology, Cambridge, MA 02139, USA
*
Author to whom correspondence should be addressed.
Water 2020, 12(3), 909; https://doi.org/10.3390/w12030909
Submission received: 30 January 2020
/
Revised: 17 March 2020
/
Accepted: 18 March 2020
/
Published: 23 March 2020
(This article belongs to the Section Hydrology)
Abstract
:Water infiltration and unsaturated flow through heterogeneous soil control the distribution of soil moisture in the vadose zone and the dynamics of groundwater recharge, providing the link between climate, biogeochemical soil processes and vegetation dynamics. Infiltration into dry soil is hydrodynamically unstable, leading to preferential flow through narrow wet regions (fingers). In this paper we use numerical simulation to study the interplay between fingering instabilities and soil heterogeneity during water infiltration. We consider soil with heterogeneous intrinsic permeability. Permeabilities are random, with point Gaussian statistics, and vary smoothly in space due to spatial correlation. The key research question is whether the presence of moderate or strong heterogeneity overwhelms the fingering instability, recovering the simple stable displacement patterns predicted by most simplified model of infiltration currently used in hydrological models from the Darcy to the basin scales. We perform detailed simulations of constant-rate infiltration into soils with isotropic and anisotropic intrinsic permeability fields. Our results demonstrate that soil heterogeneity does not suppress fingering instabilities, but it rather enhances its effect of preferential flow and channeling. Fingering patterns strongly depend on soil structure, in particular the correlation length and anisotropy of the permeability field. While the finger size and flow dynamics are only slightly controlled by correlation length in isotropic fields, layering leads to significant finger meandering and bulging, changing arrival times and wetting efficiencies. Fingering and soil heterogeneity need to be considered when upscaling the constitutive relationships of multiphase flow in porous media (relative permeability and water retention curve) from the finger to field and basin scales. While relative permeabilities remain unchanged upon upscaling for stable displacements, the inefficient wetting due to fingering leads to relative permeabilities at the field scale that are significantly different from those at the Darcy scale. These effective relative permeability functions also depend, although less strongly, on heterogeneity and soil structure.
1. Introduction
Unsaturated flow through heterogeneous porous media controls the distribution of soil moisture in the vadose zone and the dynamics of groundwater recharge, providing the link between climate, biogeochemical soil processes, and vegetation dynamics [1]. Field and catchment-scale hydrological models assume piston-like wetting and drying infiltration fronts, which is consistent with the classical predictions of Richards’ equation and simplified conceptual approaches for homogeneous soils [2,3,4,5]. Soil structure and heterogeneity, as well as preferential flow due to fingering instabilities, render these simplifications invalid for most practical applications of infiltration into dry soils [6,7], hampering our ability to understand soil moisture dynamics and deep drainage in arid and semi-arid regions. Infiltration into soil with relatively small initial saturation is hydrodynamically unstable, even in the case of homogeneous soils, leading to the formation of preferential flow paths, or fingers [8,9,10,11]. Fingering due to wetting front instabilities has been identified as an important transport process in infiltration into snow [12] and has been proposed as a mechanism to explain the origin of columnar structures in arenitic caves [13].
Fingering during infiltration into homogeneous sands has been extensively studied in experiments [9,14,15,16,17,18,19,20,21,22,23,24], in numerical simulations in homogeneous soils [6,25,26,27,28,29,30], and observed in field settings [31,32]. Controlled experiments in heterogeneous and layered soils suggest that the fingering instability persists and is not suppressed by soil heterogeneity, but rather enhanced by it [33,34]. Work on unsaturated flow in coarse-textured soils has demonstrated the importance of fingered flow at the field scale [10,23,31,35,36,37,38,39], including the role of water repellency as an enhancing mechanism [19,40,41,42,43,44]. Preferential flow due to fingering may significantly influence the transport of contaminants to surface and ground waters [45].
Experiments [33,34,46] and simulations [47] of unsaturated flow in heterogeneous media, with alternating or randomly varied combinations of coarse and fine sands, have demonstrated the possibility of calibrating effective parameters and mathematical models of unsaturated flow using the observed flow patterns at the finger scale. This is due to the contrasting response of wetting fronts when traversing interfaces between coarsely and finely textured materials. This effect is particularly important in the presence of fingering instabilities [33,34]
In this paper, we use numerical simulations to study the interplay between fingering instabilities and soil heterogeneity during water infiltration. We consider a soil with heterogeneous intrinsic permeability. Permeabilities are random, with point Gaussian statistics, and vary smoothly in space due to spatial correlation. To the best of our knowledge, no previous studies have simulated unstable wetting fronts in the presence of moderate or large permeability contrasts. The key research question is whether the presence of moderate or strong heterogeneity overwhelms the hydrodynamic instability, in which case the ability of simulation models to capture fingering may become of marginal interest. On the other hand, if fingering persists or is enhanced by soil heterogeneity, the detailed modeling and upscaling of fingering patterns during water infiltration could be essential to understand infiltration dynamics and groundwater recharge at the field and catchment scale. We frame our work in the context of upscaling approaches to derive effective properties of unsaturated flow in heterogeneous media [46,47] and in the effort to estimate groundwater recharge and soil moisture dynamics in the context of new irrigation procedures [48,49] and changing climate and rainfall patterns [50,51,52].
We simulate a simple scenario of constant-rate infiltration into two-dimensional, initially dry, heterogeneous soil. Heterogeneity is characterized by random, spatially-correlated fields of intrinsic permeability. We consider isotropic, as well as anisotropic permeability fields with different correlation lengths (the typical distances in x and y between high- and low-permeability zones in a random, spatially correlated field). We also consider a wide range of infiltration rates, aiming at the characterization of an effective relative permeability function that can be used in bucket-type models at the field and catchment scales. Note that all the considered infiltration rates are in the range below the saturated hydraulic conductivity (non-ponded infiltration). We characterize the infiltration patterns in heterogeneous soils and relate wetting efficiency (the wetted area and effective relative permeability) with the spatial structure (correlation) of the soil permeability field.
The paper is organized as follows. In Section 2, we present the mathematical model, discuss its implementation using the finite element method, and describe the generation of random, spatially-correlated permeability fields. We also present the basic setup of the numerical simulations. In Section 3, we present and discuss the simulation results, where we study the impact of correlation length on the patterns of unstable infiltration for isotropic and anisotropic permeability fields; the patterns of infiltration into nearly-layered media; and the impact of the infiltration rate on infiltration into heterogeneous dry soil. Finally, we provide some concluding remarks in Section 4.
2. Materials and Methods
2.1. Mathematical Model of Unsaturated Flow in Porous Media
We assume a rigid porous medium and write the mass conservation of water in terms of its saturation, (the fraction of pore space occupied by water):
where is the medium porosity, is the water density, and is the mass flux. We assume that the air density is negligible compared to that of water and that the flow conditions are such that air remains at constant atmospheric pressure. We assume that water is incompressible at these flow conditions. The mass flux is driven by a flow potential, :
where is the water mobility:
where k is the intrinsic permeability of the soil, is the dynamic viscosity of water, and is the water relative permeability, which accounts for the effect of partial saturation [2,53,54]. We define the saturated hydraulic conductivity as:
where g is the gravitational acceleration.
The flow potential, , comprises gravitational and capillary phenomena. It is a second-gradient extension of the Richards model of unsaturated flow [2,55] that allows for unstable wetting fronts [25,26,30,56]:
In the above expression, the water suction head, , is written using Leverett scaling [57]:
where is the characteristic capillary rise, is the Leverett J-function [57]—a dimensionless capillary pressure function—and is the expansion coefficient for the second-gradient theory [30]:
We take the characteristic length of the gradient energy term, , as proportional to the capillary height, . With these definitions, the conservation of mass reads:
In the above equation, the saturated conductivity, , and the characteristic lengths, and , are functions of space for heterogeneous media; the constitutive relationships, , , and , are also nonlinear functions of saturation (see Table 1).
Permeability fields are spatially heterogeneous, so it is important to consider the dependencies of these variables on intrinsic permeability. Based on Equation (4), we obtain , while Leverett scaling predicts:
where is the air-water surface tension and the static contact angle. Hence, the capillary height scales like . Permeability has three separate effects on the mathematical model behavior: it controls the saturated hydraulic conductivity (i.e., the time scales) and therefore the capillary height (i.e., the length scales through the strength of the capillary pressure term). It also controls the strength of the fourth-order term in Equation (5), since . We assume for simplicity that the nonlinear functional forms of relative permeability, , and the Leverett J-function, J, do not change in space, even if intrinsic permeability does.
In this study, we assume that water completely wets the soil ( throughout the domain). Note that partial wetting (non-zero contact angles) [44] and water repellency [31,38,41,42,43] have been shown to play an important role in fingering instabilities and the laboratory and field scales. Water repellency in particular, due to biological activity, cycles of soil wetting and drying, and fire, is a retardation mechanism that may increase runoff and evaporation, thus reducing infiltration rates. From the perspective of soil water infiltration, hydrophobicity is a powerful feedback enhancing wetting front instabilities [40]. We assume that all effects associated with partial wetting are encapsulated into the constitutive relationships (relative permeability and water retention curve) and in the capillary height through Leverett scaling.
2.2. Finite Element Implementation
To apply a standard Finite Element (FEM) discretization using elements, we write the model Equation (8) as a system of two second-order equations:
The above mixed formulation can be compactly written in vector form as:
where the dependent variables, , and fluxes, , are given by:
respectively. The coupled Equations (10) and (11) are discretized in space using a standard Galerkin formulation with linear elements and advanced in time using an adaptive implicit scheme (BDF2) [58]. For constant flow rate infiltration, we impose a downward water infiltration flux at the top boundary, :
where is the flux ratio (dimensionless) and takes a value between zero and one.
These equations were implemented in COMSOL Multiphysics [58] using its general-purpose PDE solver.
2.3. Capillary Pressure and Relative Permeability Functions
The capillary pressure function is typically a decreasing function of saturation [55]. Based on standard constitutive relation modeling [59,60], we parametrize the Leverett J-function, , as [26]:
where is a parameter in the Brooks and Corey model [59] and and are curve-fitting parameters controlling the shape of the function near . The gradient-energy coefficient, , is determined by the integral of the J-function, , which is given by:
The above relationship leads to convex capillary energies and non-negative functional forms for , satisfying . The functional form in Equation (15), with , prevents the water saturation from taking unphysical values above one. The relative permeability, , is a convex function of saturation [55]. Typical functional forms include those of Brooks and Corey [59] and van Genuchten [60]. We adopt a simple power-law form:
with . The effective or reduced water saturation, , is defined in terms of the irreducible water saturation, .
2.4. Problem Setup
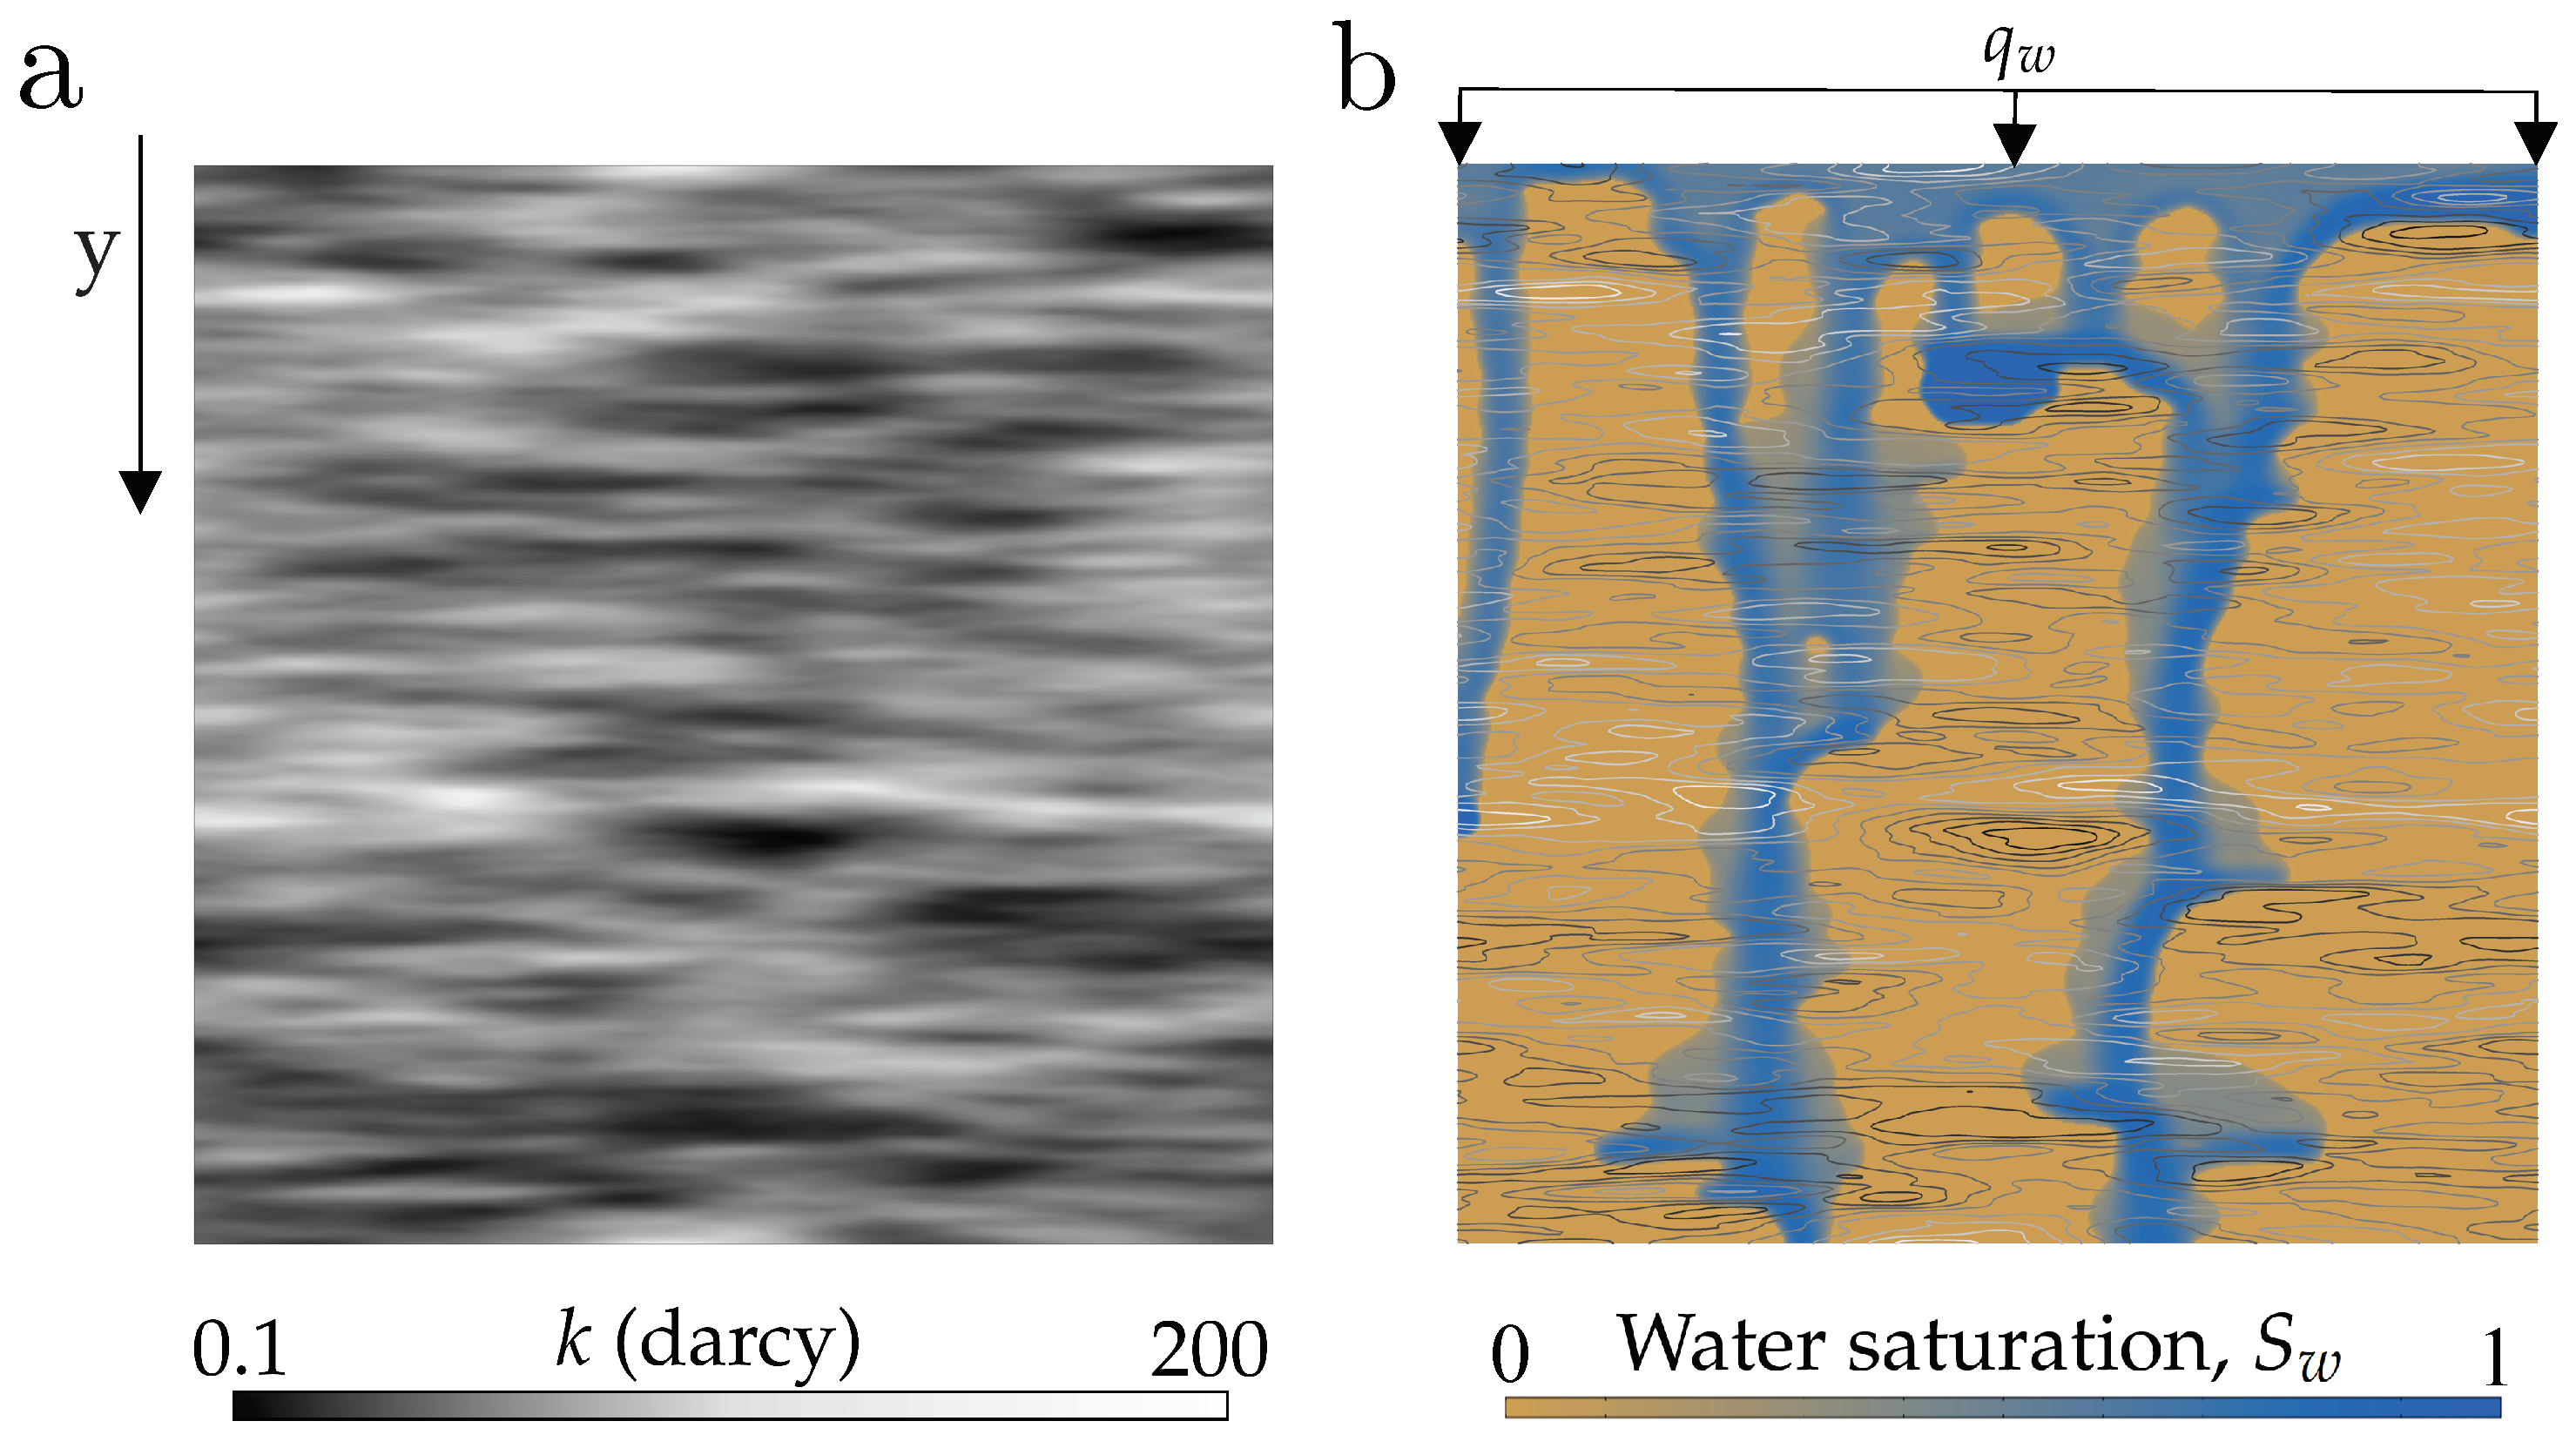
We simulate constant-rate infiltration into heterogeneous soils (Figure 1). The domain is a square of size 1 m × 1 m, which is discretized using a 500 × 500 Cartesian grid. The soil porosity is assumed to be constant and homogeneous, , as are the fluid density and viscosity, kg/m and Pa·s, respectively. We generate multi-Gaussian permeability fields, with intrinsic permeabilities in the range between m and 2 × m and correlation lengths and from cm to cm (Figure 1a). As the main field variable, we compute the water saturation, , and study the patterns of water infiltration depending on the infiltrating water flux and spatial structure (correlation) of the permeability field (Figure 1b). The constitutive parameters are: , , , , and . In the definition of the capillary height, we take N/m and set =. The permeability field is a function of space , where we specify the maximum and minimum permeabilities and and the correlation lengths and . Further details on the generation of random correlated fields are given in Section 2.5 below, and a summary of the model parameters and constitutive definitions is given in Table 1. As initial condition, we assume that the soil is essentially dry, . At the top boundary, we impose a flux ratio, , such that the inflow volumetric flux is given by . Note that this implies a local infiltration flux along the boundary that is not uniform along the top boundary, but that rather depends on the local permeability. We explore flux ratios ranging from 0.004 to 0.2. Lateral boundaries are no-flow boundaries, and we assume purely vertical flow at the bottom boundary, (free drainage). We simulate infiltration up to a final time s and do not consider losses due to evaporation.
2.5. Random Heterogeneity Fields
The intrinsic permeability field is a random, spatially-correlated function of space, . To simplify the parametrization of these random fields, we specify the correlation lengths, and , and the maximum and minimum permeabilities, and . We first generate random correlated fields, , with zero mean and unit standard deviation, using the classical algorithm by Gelhar and Axness [61], which is based on a modified exponential autocovariance for the spectrum. Note that we consider permeabilities that are normally, rather than log-normally, distributed, which may be more appropriate for sandy soils. The function yields the basic spatial structure of the permeability field. The actual permeabilities are obtained by rescaling according to the target maximum and minimum values, as:
Permeability fields obtained with this procedure are shown in Figure 2 and Figure 3, along with their sample probability density functions. We explore the role of soil heterogeneity and structure on infiltration patterns by generating isotropic fields with increasing correlation length (Figure 2), as well as anisotropic fields with different ratios between horizontal and vertical correlation lengths (Figure 3). Unless stated otherwise, the default minimum and maximum permeabilities are hereafter = m and = 2 × m, respectively, with a mean value × m, which corresponds to a mean saturated hydraulic conductivity × m/s cm/min.
3. Results
3.1. Impact of Correlation Length on the Patterns of Unstable Infiltration: Isotropic Permeability Fields
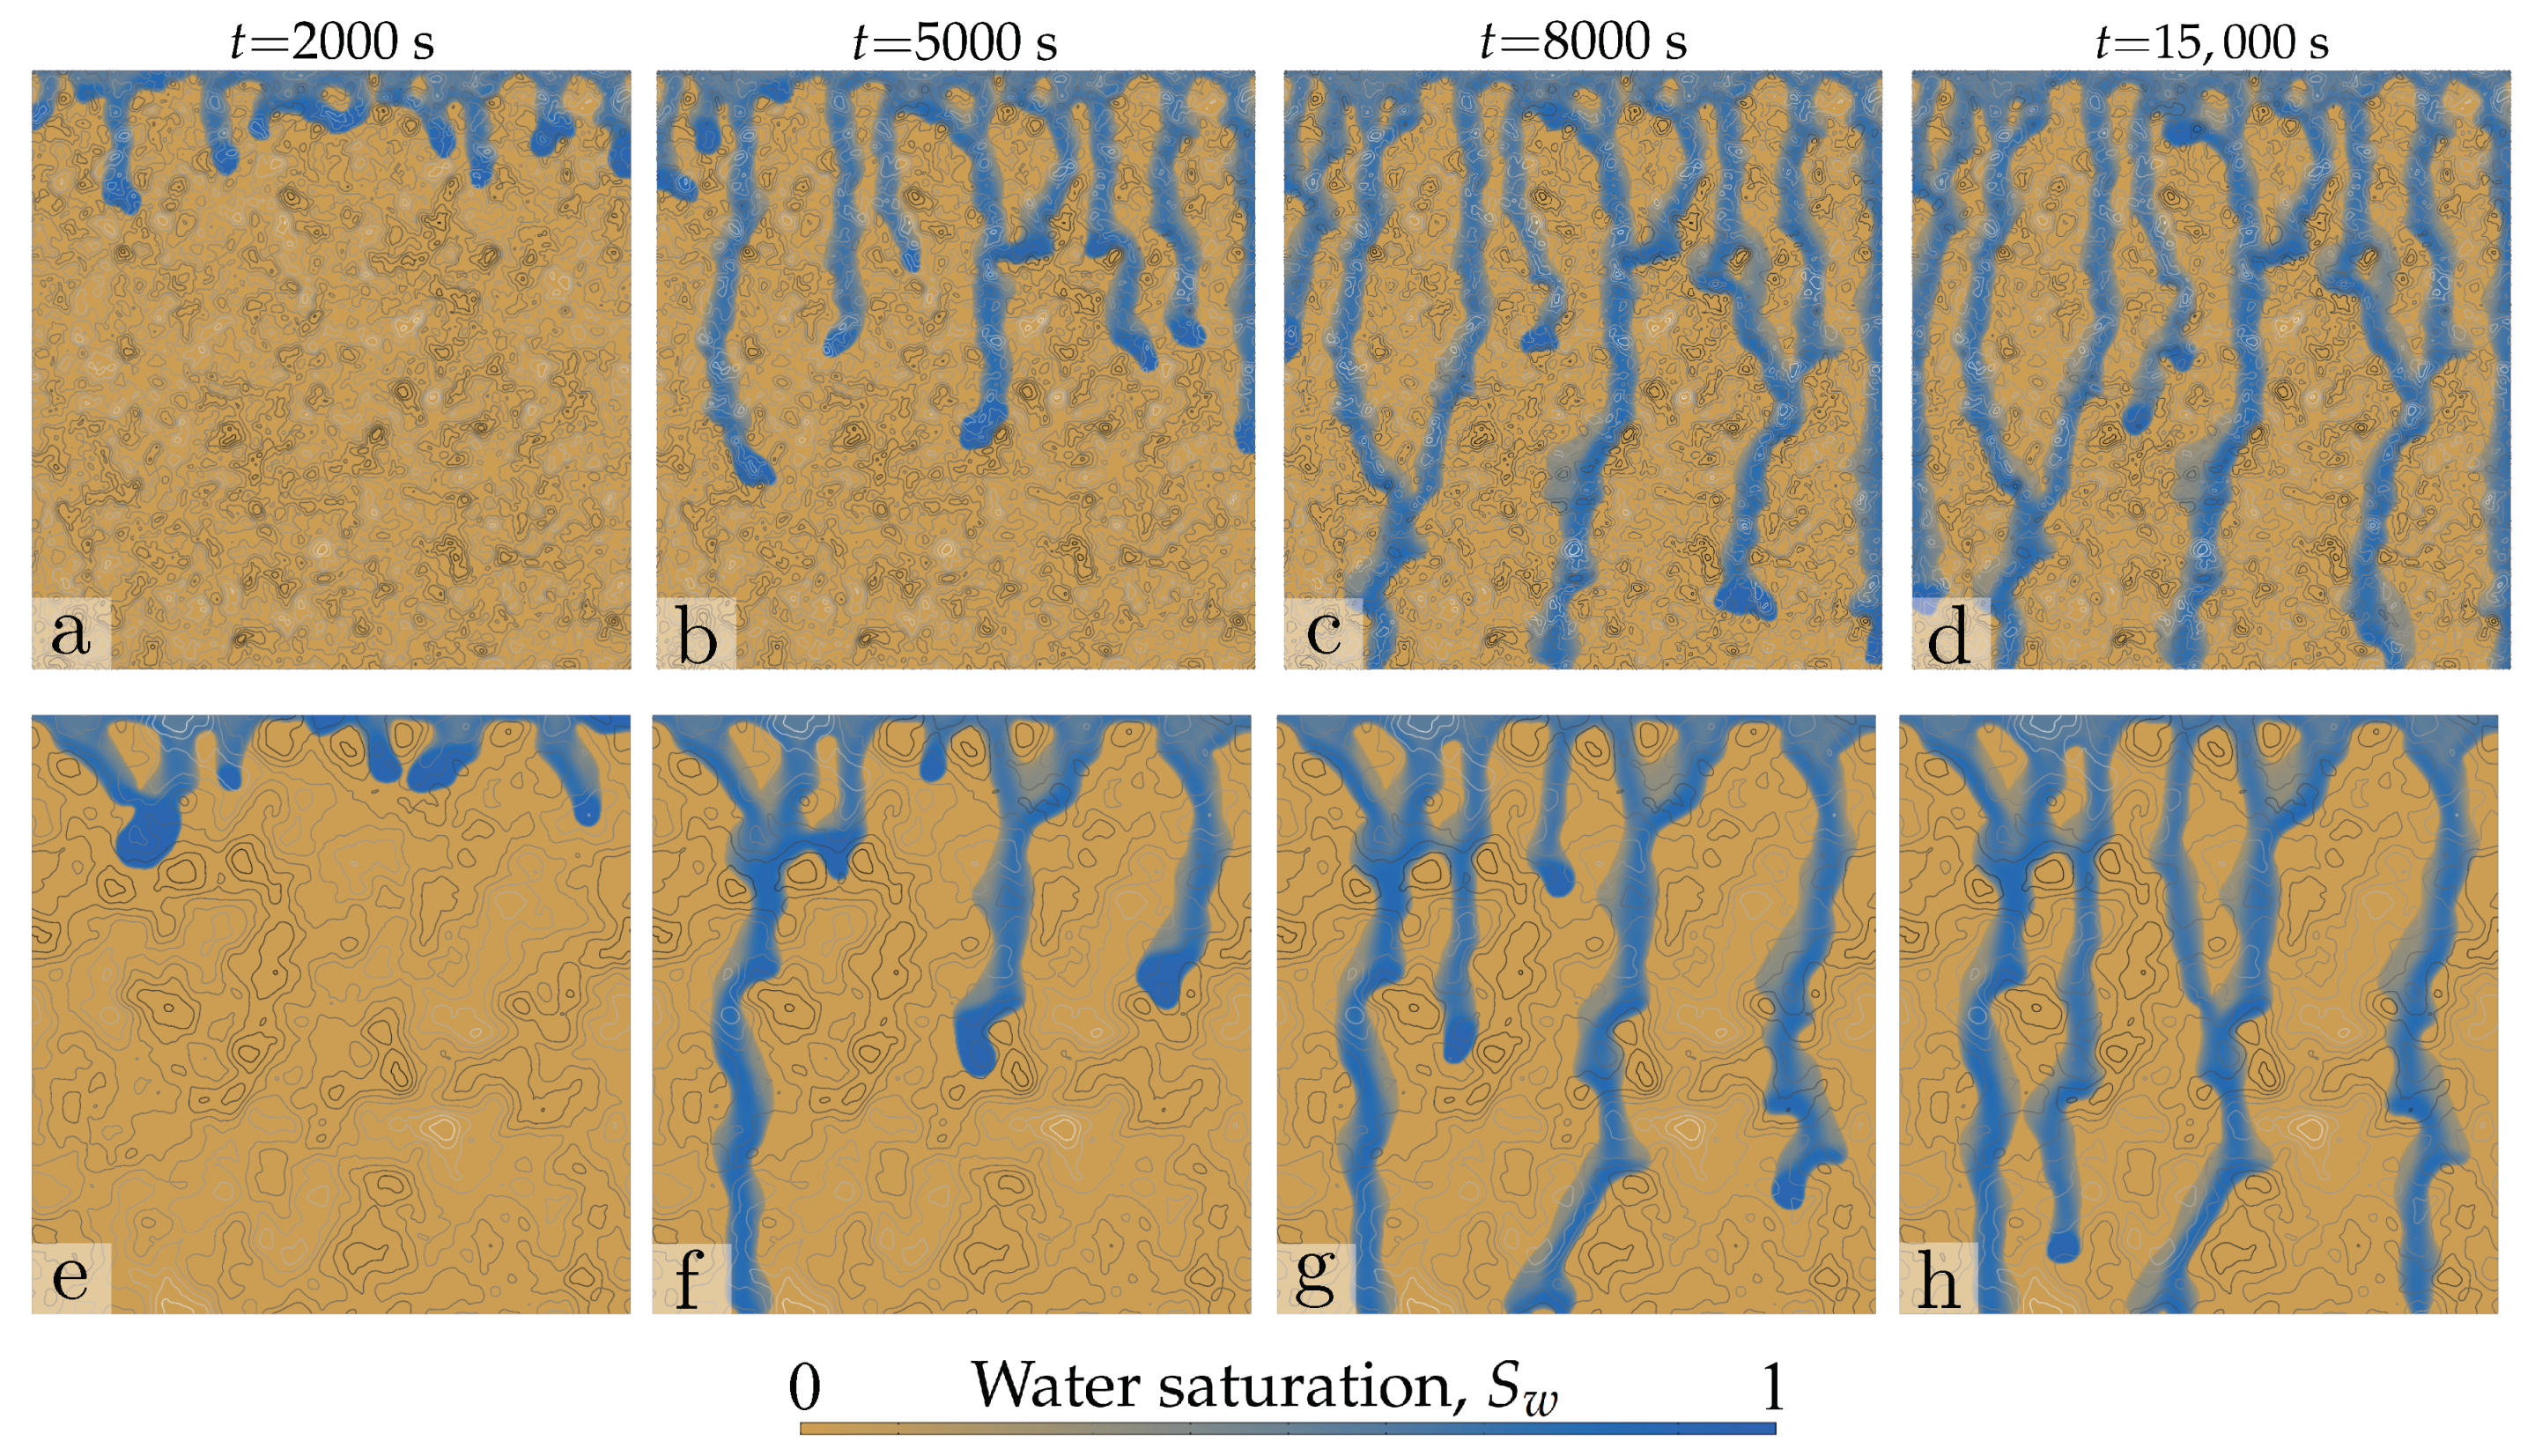
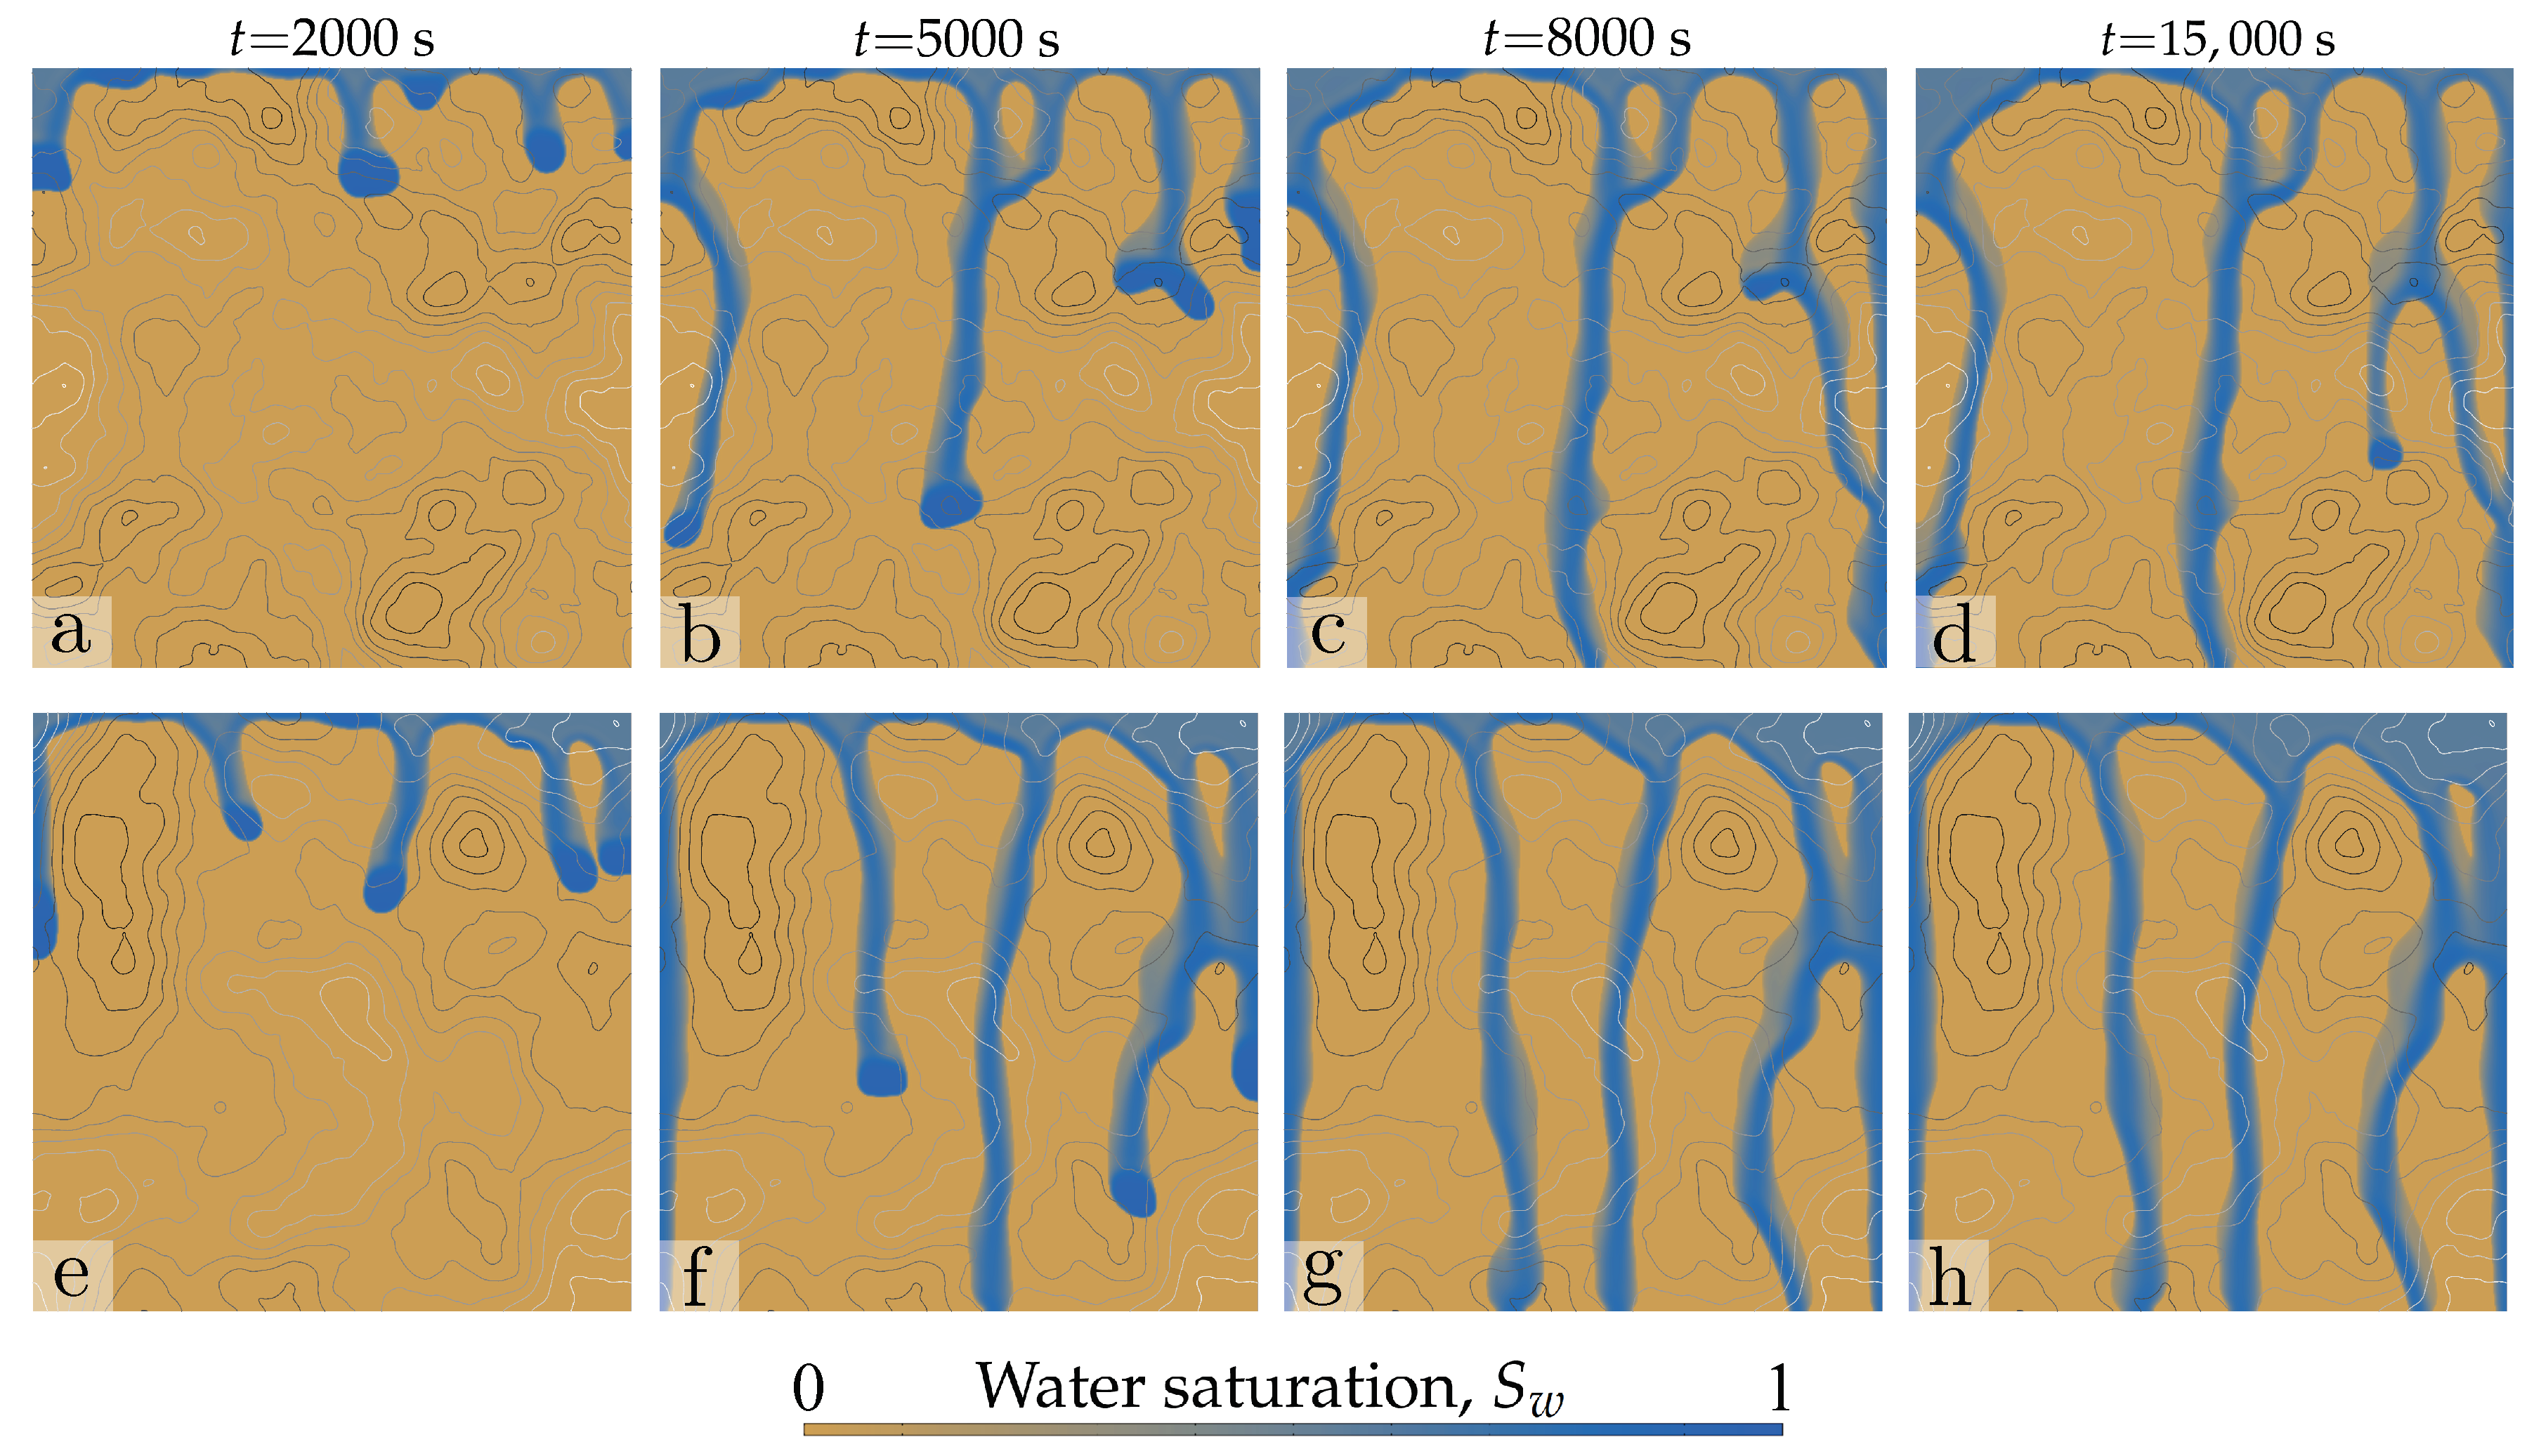
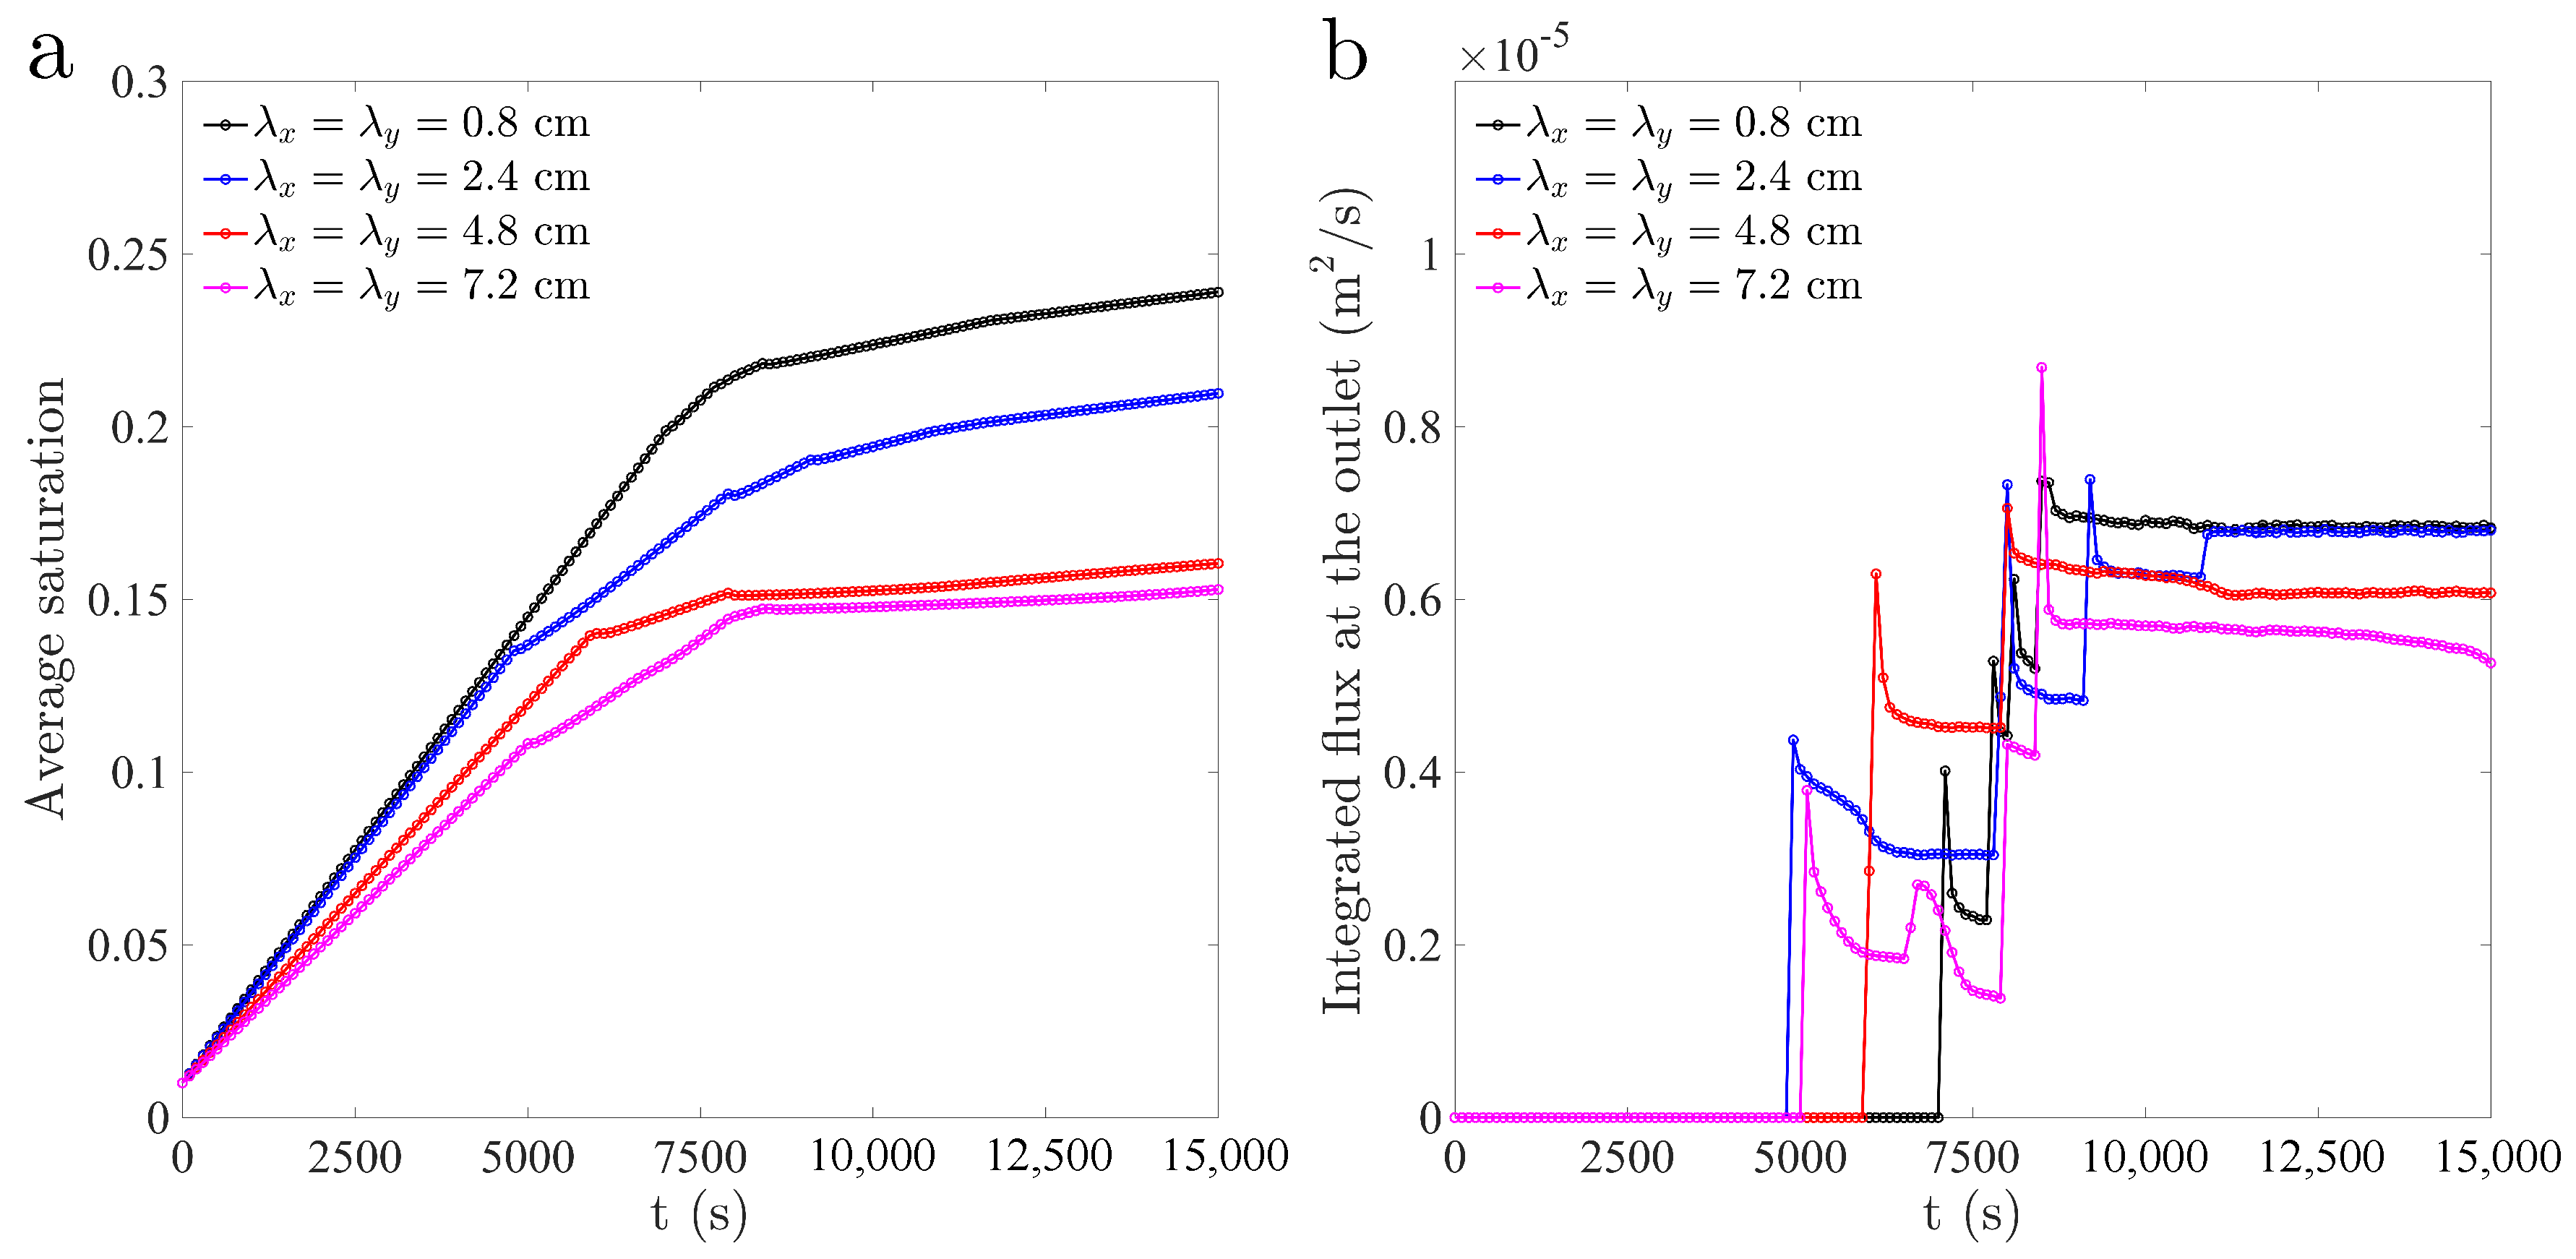
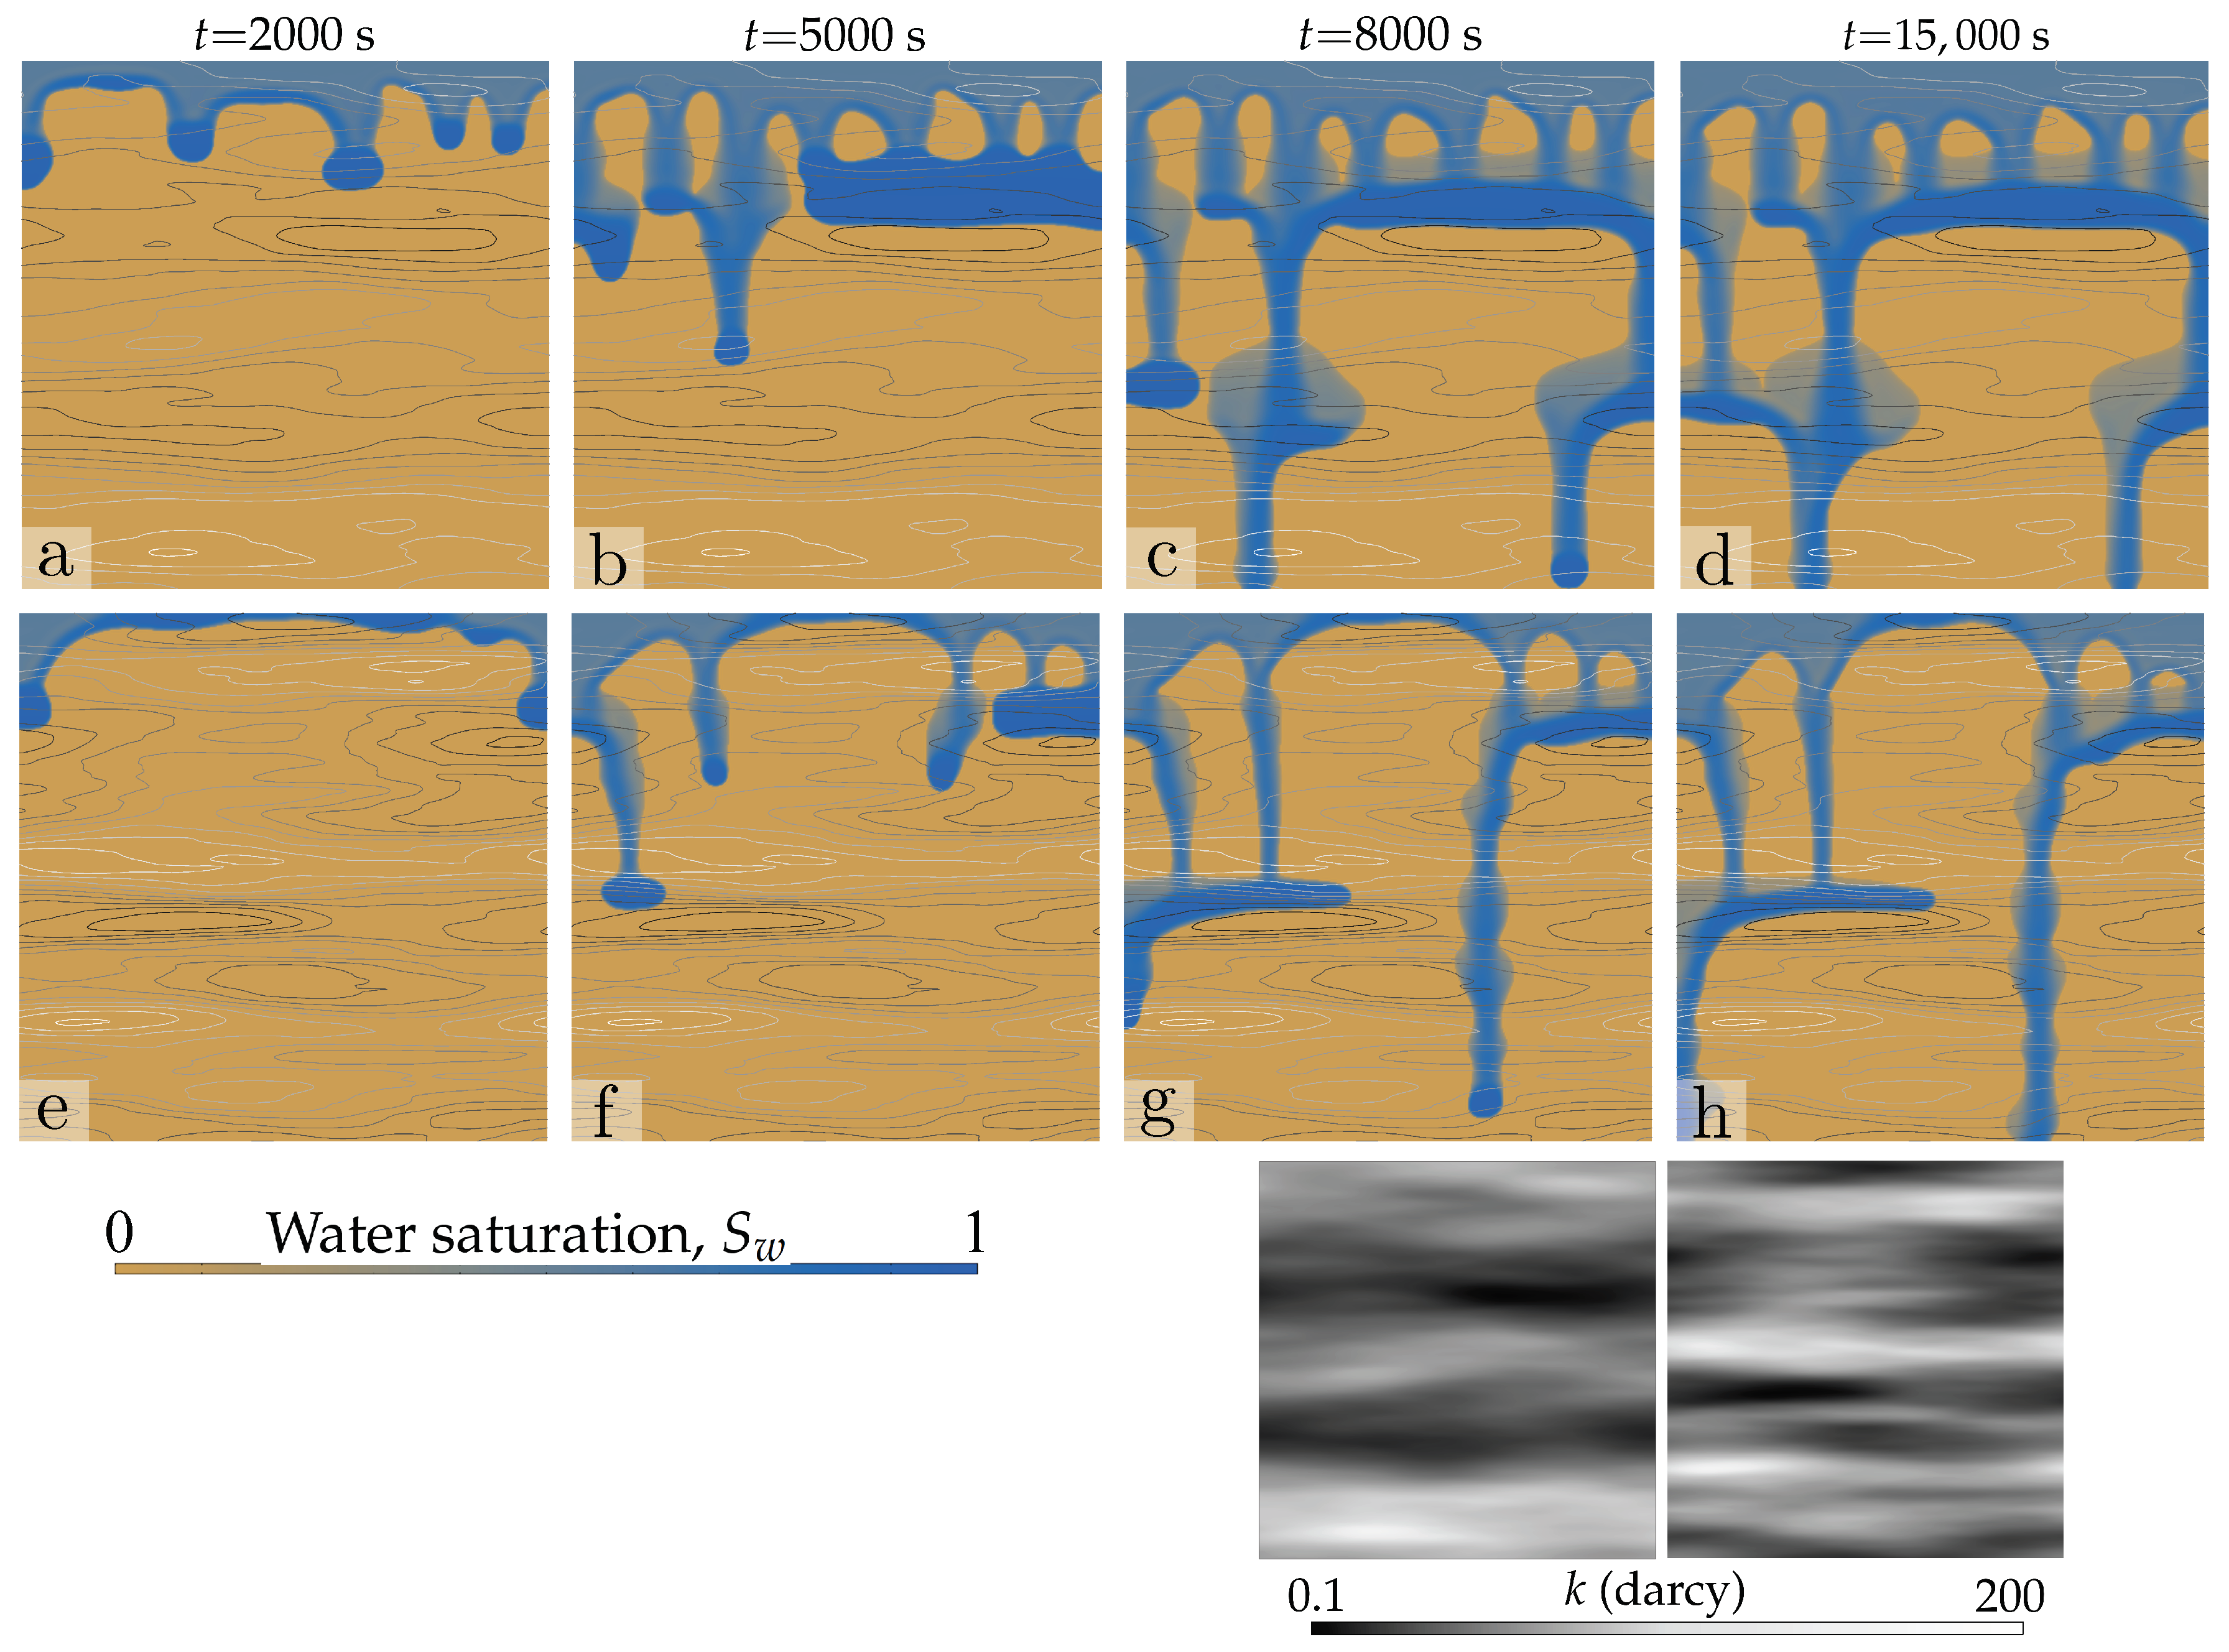
We begin by considering soils with isotropic permeability fields. We aim at exploring the interaction between the natural finger length scale (its width) and the correlation length of the random permeability field, . We set a flux ratio , with m and × m, and simulate continuous non-ponding infiltration at constant flow rate, with the parameters and definitions of Table 1. In Figure 4 and Figure 5, we show snapshots of the evolution of water saturations, at times, 2000, 5000, 8000 and 15,000 s, for four pairs of spatial correlation lengths, . In particular, we consider: cm (Figure 4a–d); cm (Figure 4e–h); cm (Figure 5a–d); and cm (Figure 5e–h). From the evolution of these maps of water saturation, it is already apparent that larger correlation lengths lead to less efficient wetting during infiltration, in the sense of smaller areal coverage of the flow paths and larger distance between fingers. This is because fingers bypass the low-permeability zones, focusing flow along a small number of flow paths for larger correlation lengths. Note that whether flow occurs through the high- or low-permeability zones depends on the balance between the contrast in conductivity and that of capillary heights across textural interfaces [33,46]. The flow focusing effect of unstable infiltration is summarized in Figure 6, which shows the evolution of average water saturation over the entire domain and integrated water flux at the free drainage (bottom) section. Note that the flux is different for each simulation. This is due to the impact of the correlation length on the actual mean saturated hydraulic conductivity at the top boundary, which leads to slightly different infiltrating fluxes. While the theoretical mean is the same for all realizations, and while the flux ratio is the same in all cases, , there are slight variations due to the particular realization of permeabilities.
3.2. Impact of Correlation 0 on the Patterns of Unstable Infiltration: Anisotropic Permeability Fields
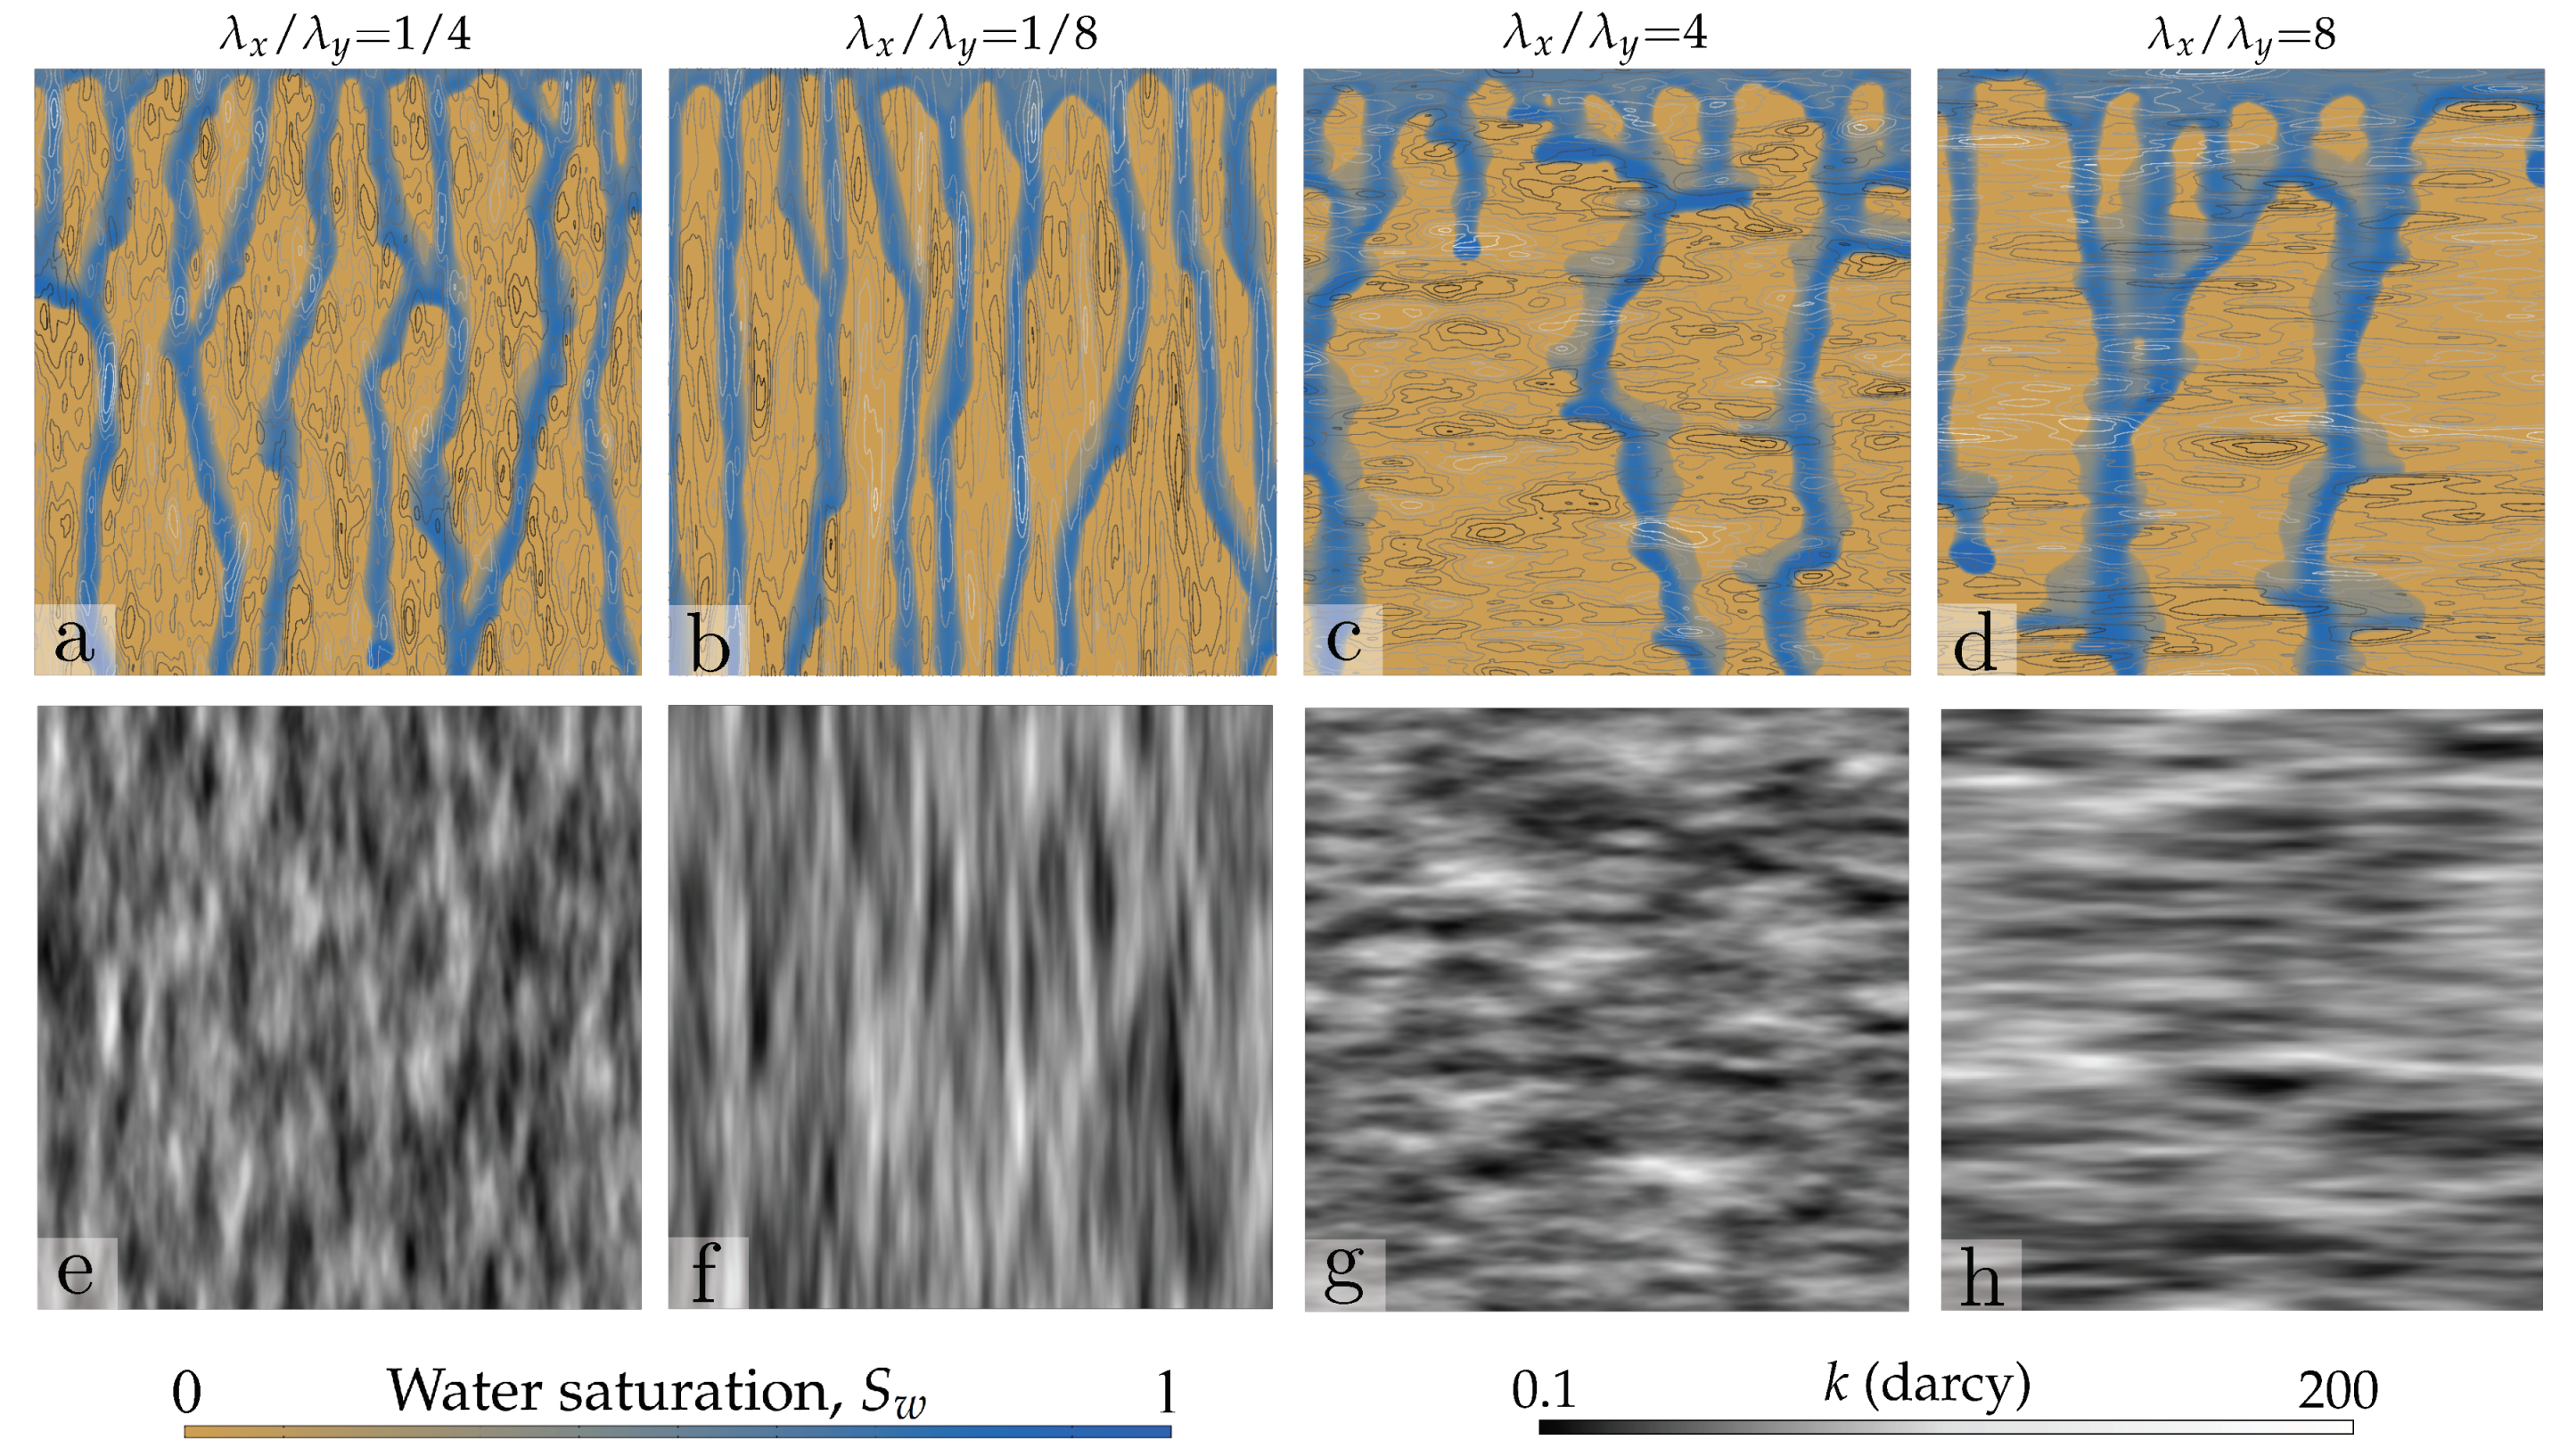
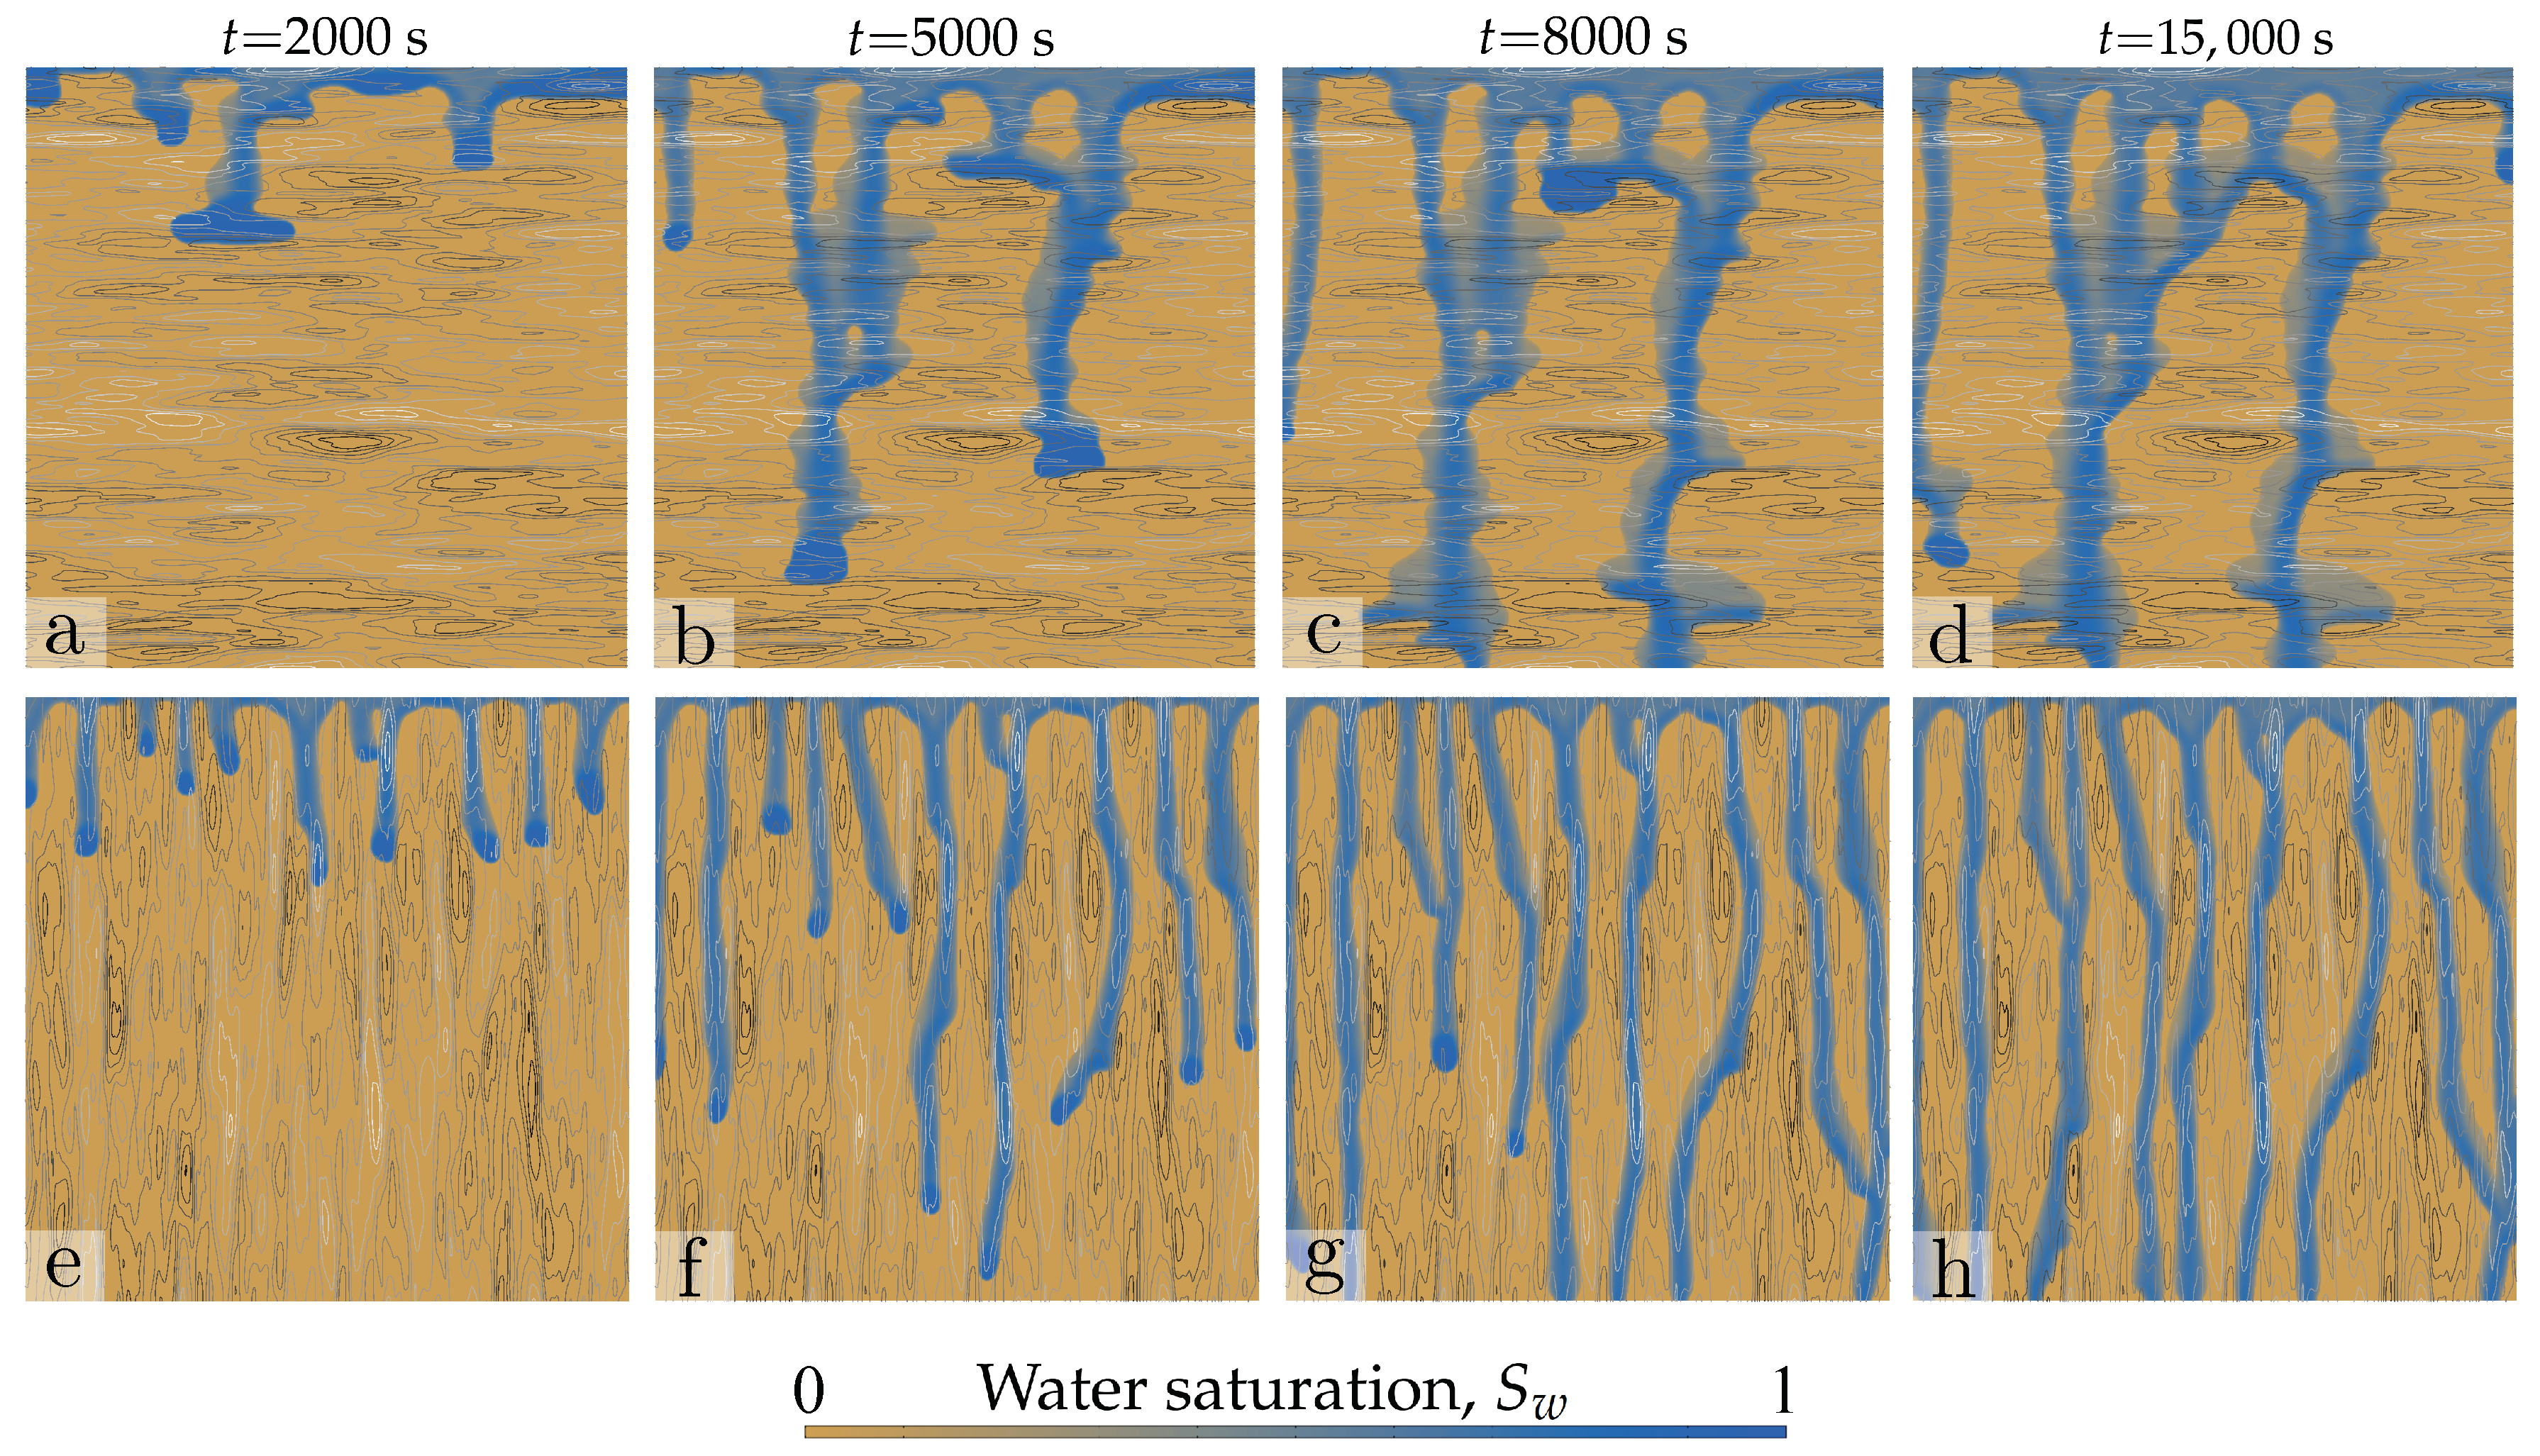
We next consider soils with anisotropic permeability field. We expand the analysis of the previous section, to explore the role of soil structure, understood as layering or vertical channeling due to the arrangement of large/small permeability zones. We set a flux ratio , with m and × m, and simulate constant-rate infiltration with the parameters and definitions of Table 1. The intrinsic permeability fields correspond to those of Figure 3. The patterns of infiltration are markedly different depending on the orientation of permeability layers (Figure 7), with horizontal layering leading to finger meandering and less efficient coverage in terms of wet area. Note that, in spite of the layered soil structure, the overall flow remains dominated by the preferential flow paths due to fingering instability, suggesting that finger flows would also be generated in the corresponding homogeneous soils. The overall progress of infiltration is illustrated in Figure 8 for two permeability fields with ratios, (Figure 8a–d) and (Figure 8e–h). For horizontal layering and depending on the finger impingement conditions, the fingers either bypass low-permeability zones or flow through them, in accordance with experimental observations of infiltration in heterogeneous media [33]. It is interesting that the average saturation in the domain is essentially unaltered by the orientation of permeability layers, as demonstrated by the evolution of domain-averaged water saturation and drainage flux (Figure 9).
3.3. Infiltration into Soils with Large Contrast between Spatial Correlation Lengths
An important practical question in unsaturated flow in the vadose zone and infiltration is whether the effect of fingering instabilities is suppressed by soil structure—layering in particular. To address this question, we consider permeability fields with large anisotropy ( cm and cm) and two different permeability contrasts (Figure 10). While the low-permeability layers lead to significant finger meandering and to flow paths that deviate depending on the finger impingement conditions, the inherent finger dynamics and length scales continue to control the overall flow patterns. As expected, very low permeability zones force the fingers to bypass them (Figure 10e–h). A smaller contrast between high and low permeability zones allows for flow through the lower permeability areas, inducing finger bulging rather than meandering (Figure 10a–d).
3.4. Impact of Infiltration Rate on the Patterns of Infiltration into Heterogeneous Dry Soil
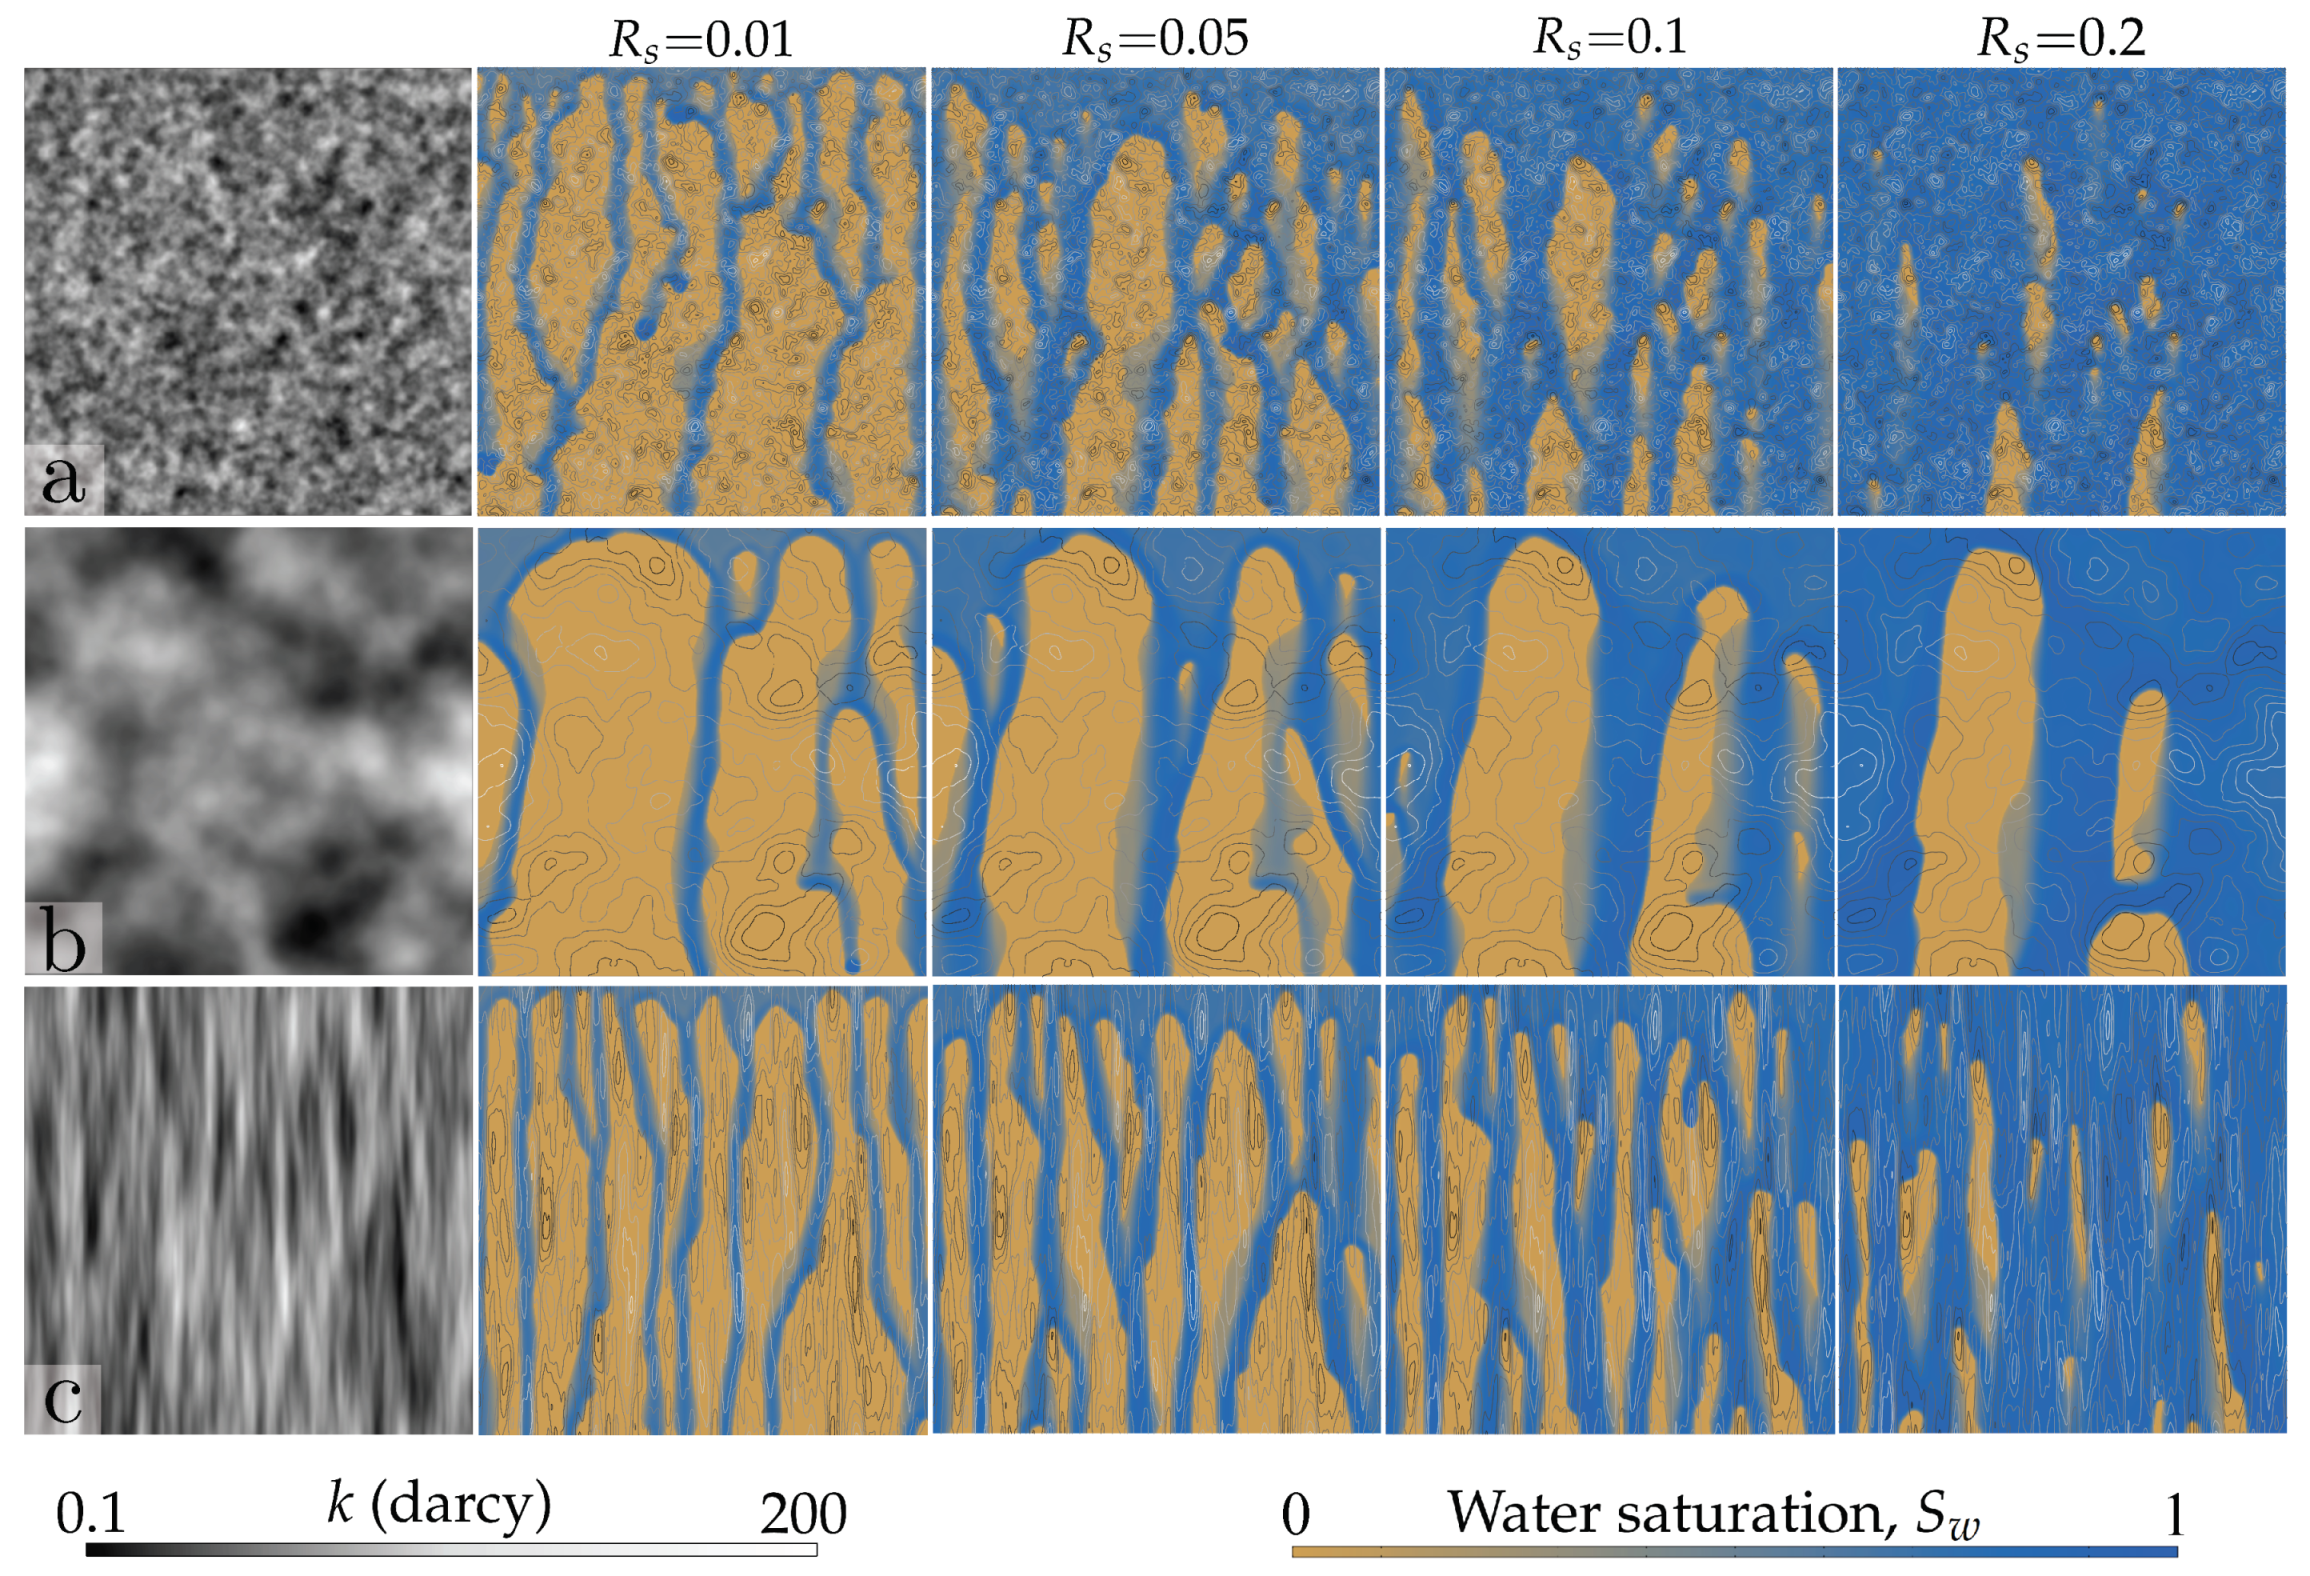
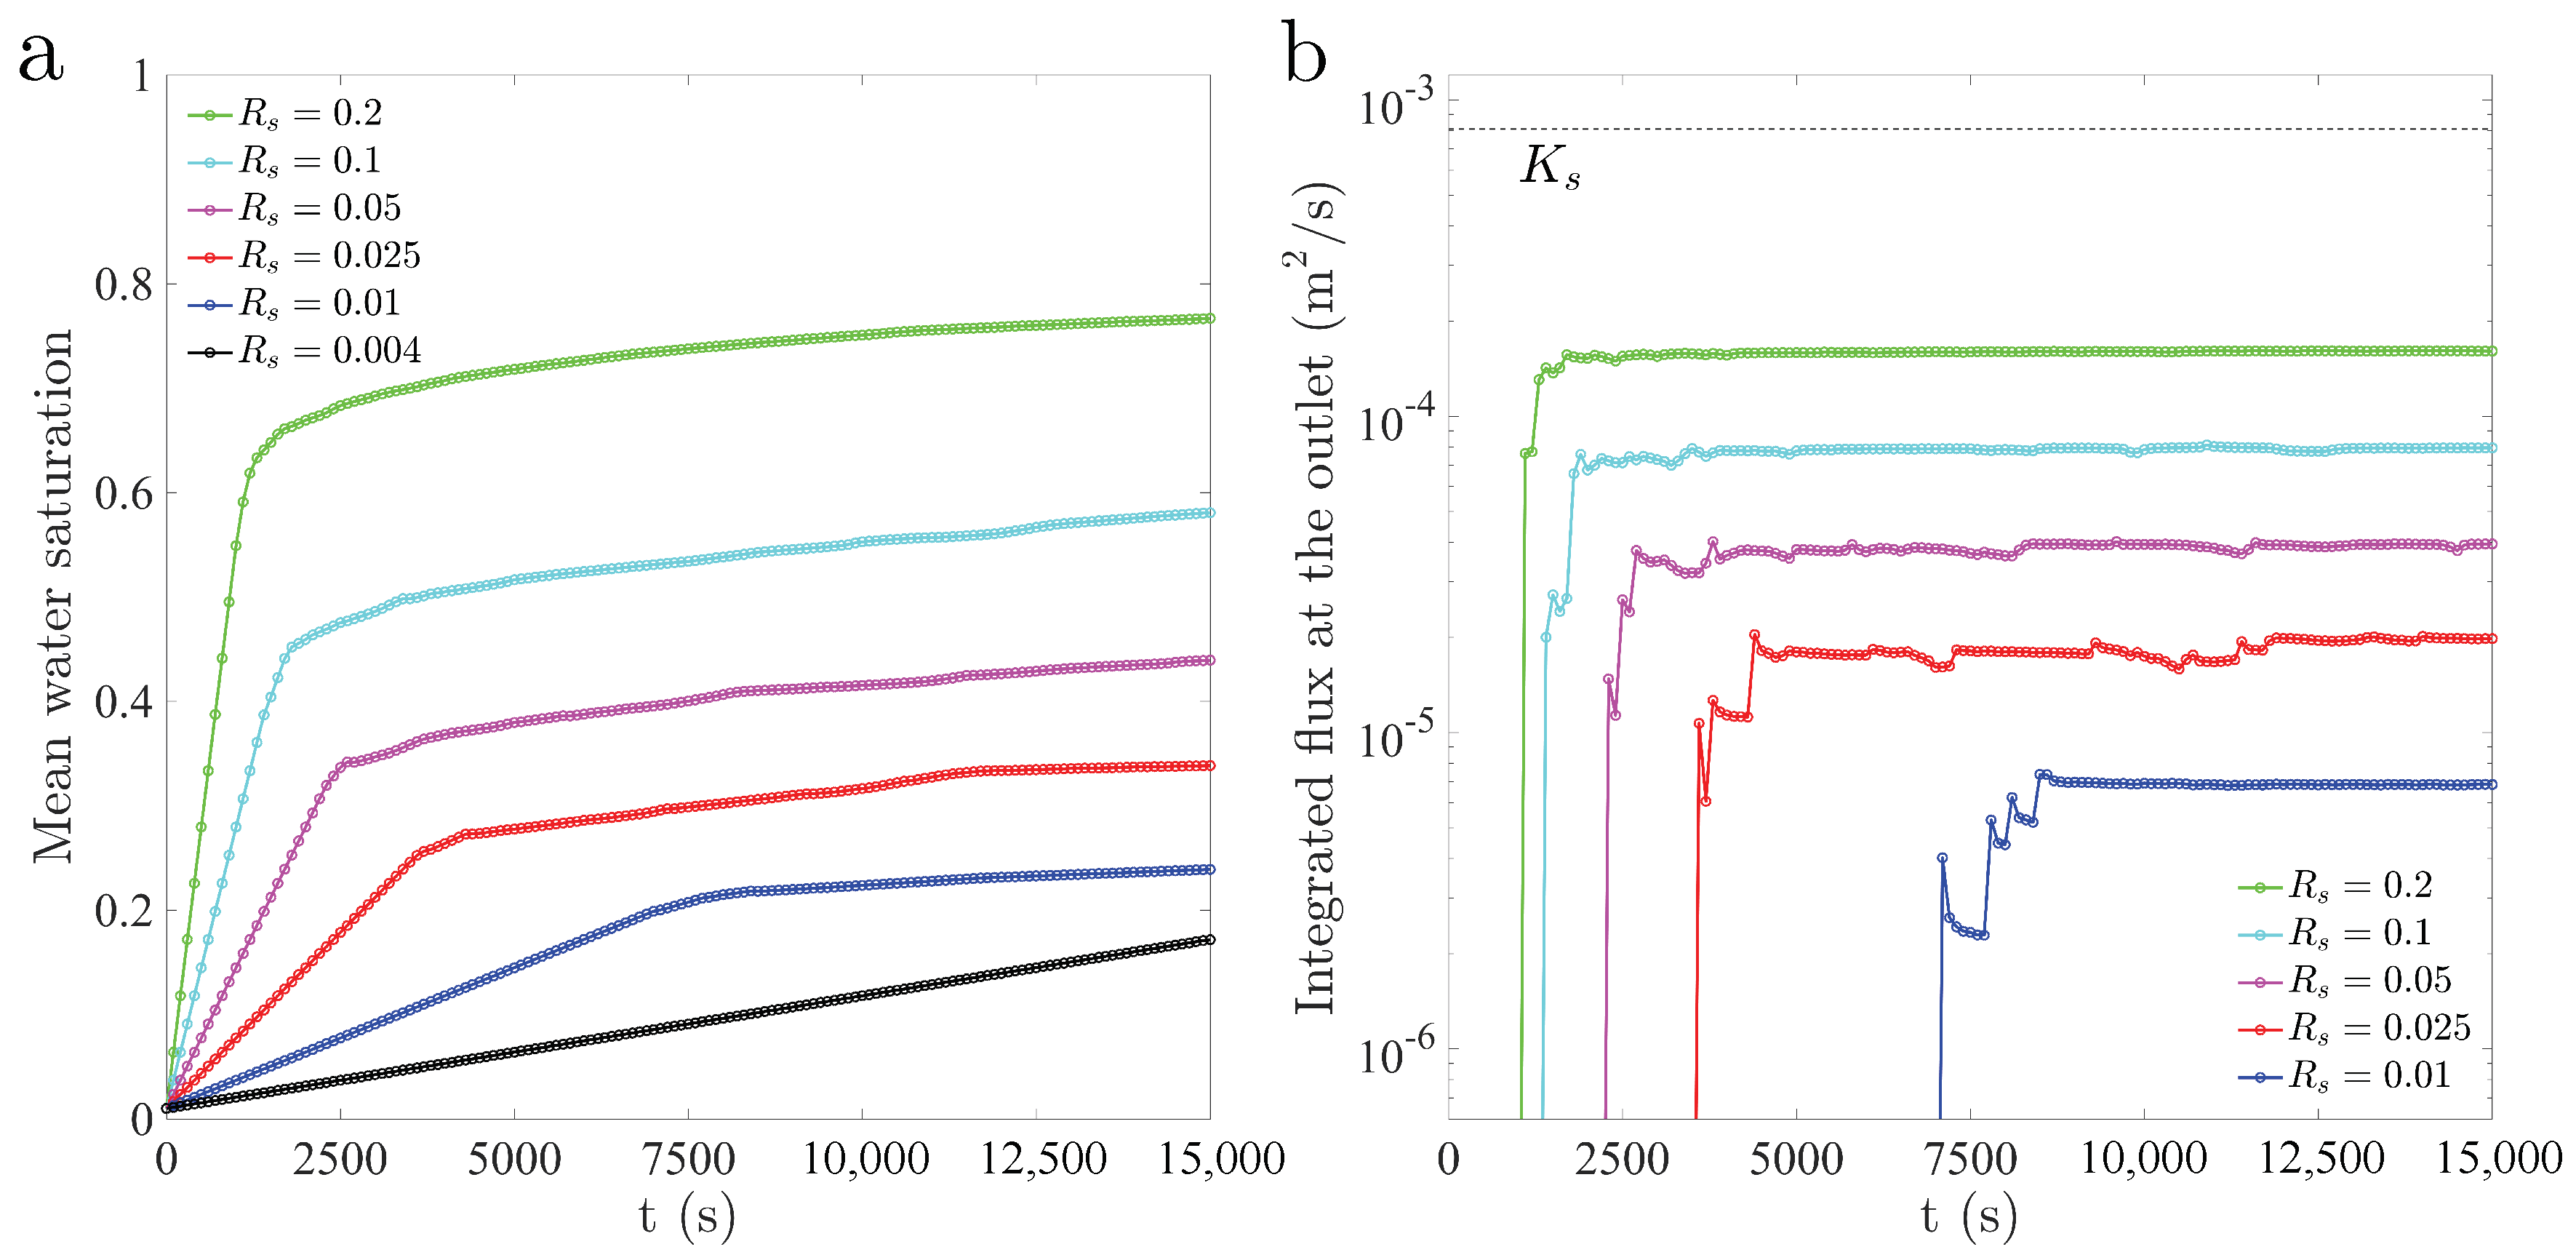
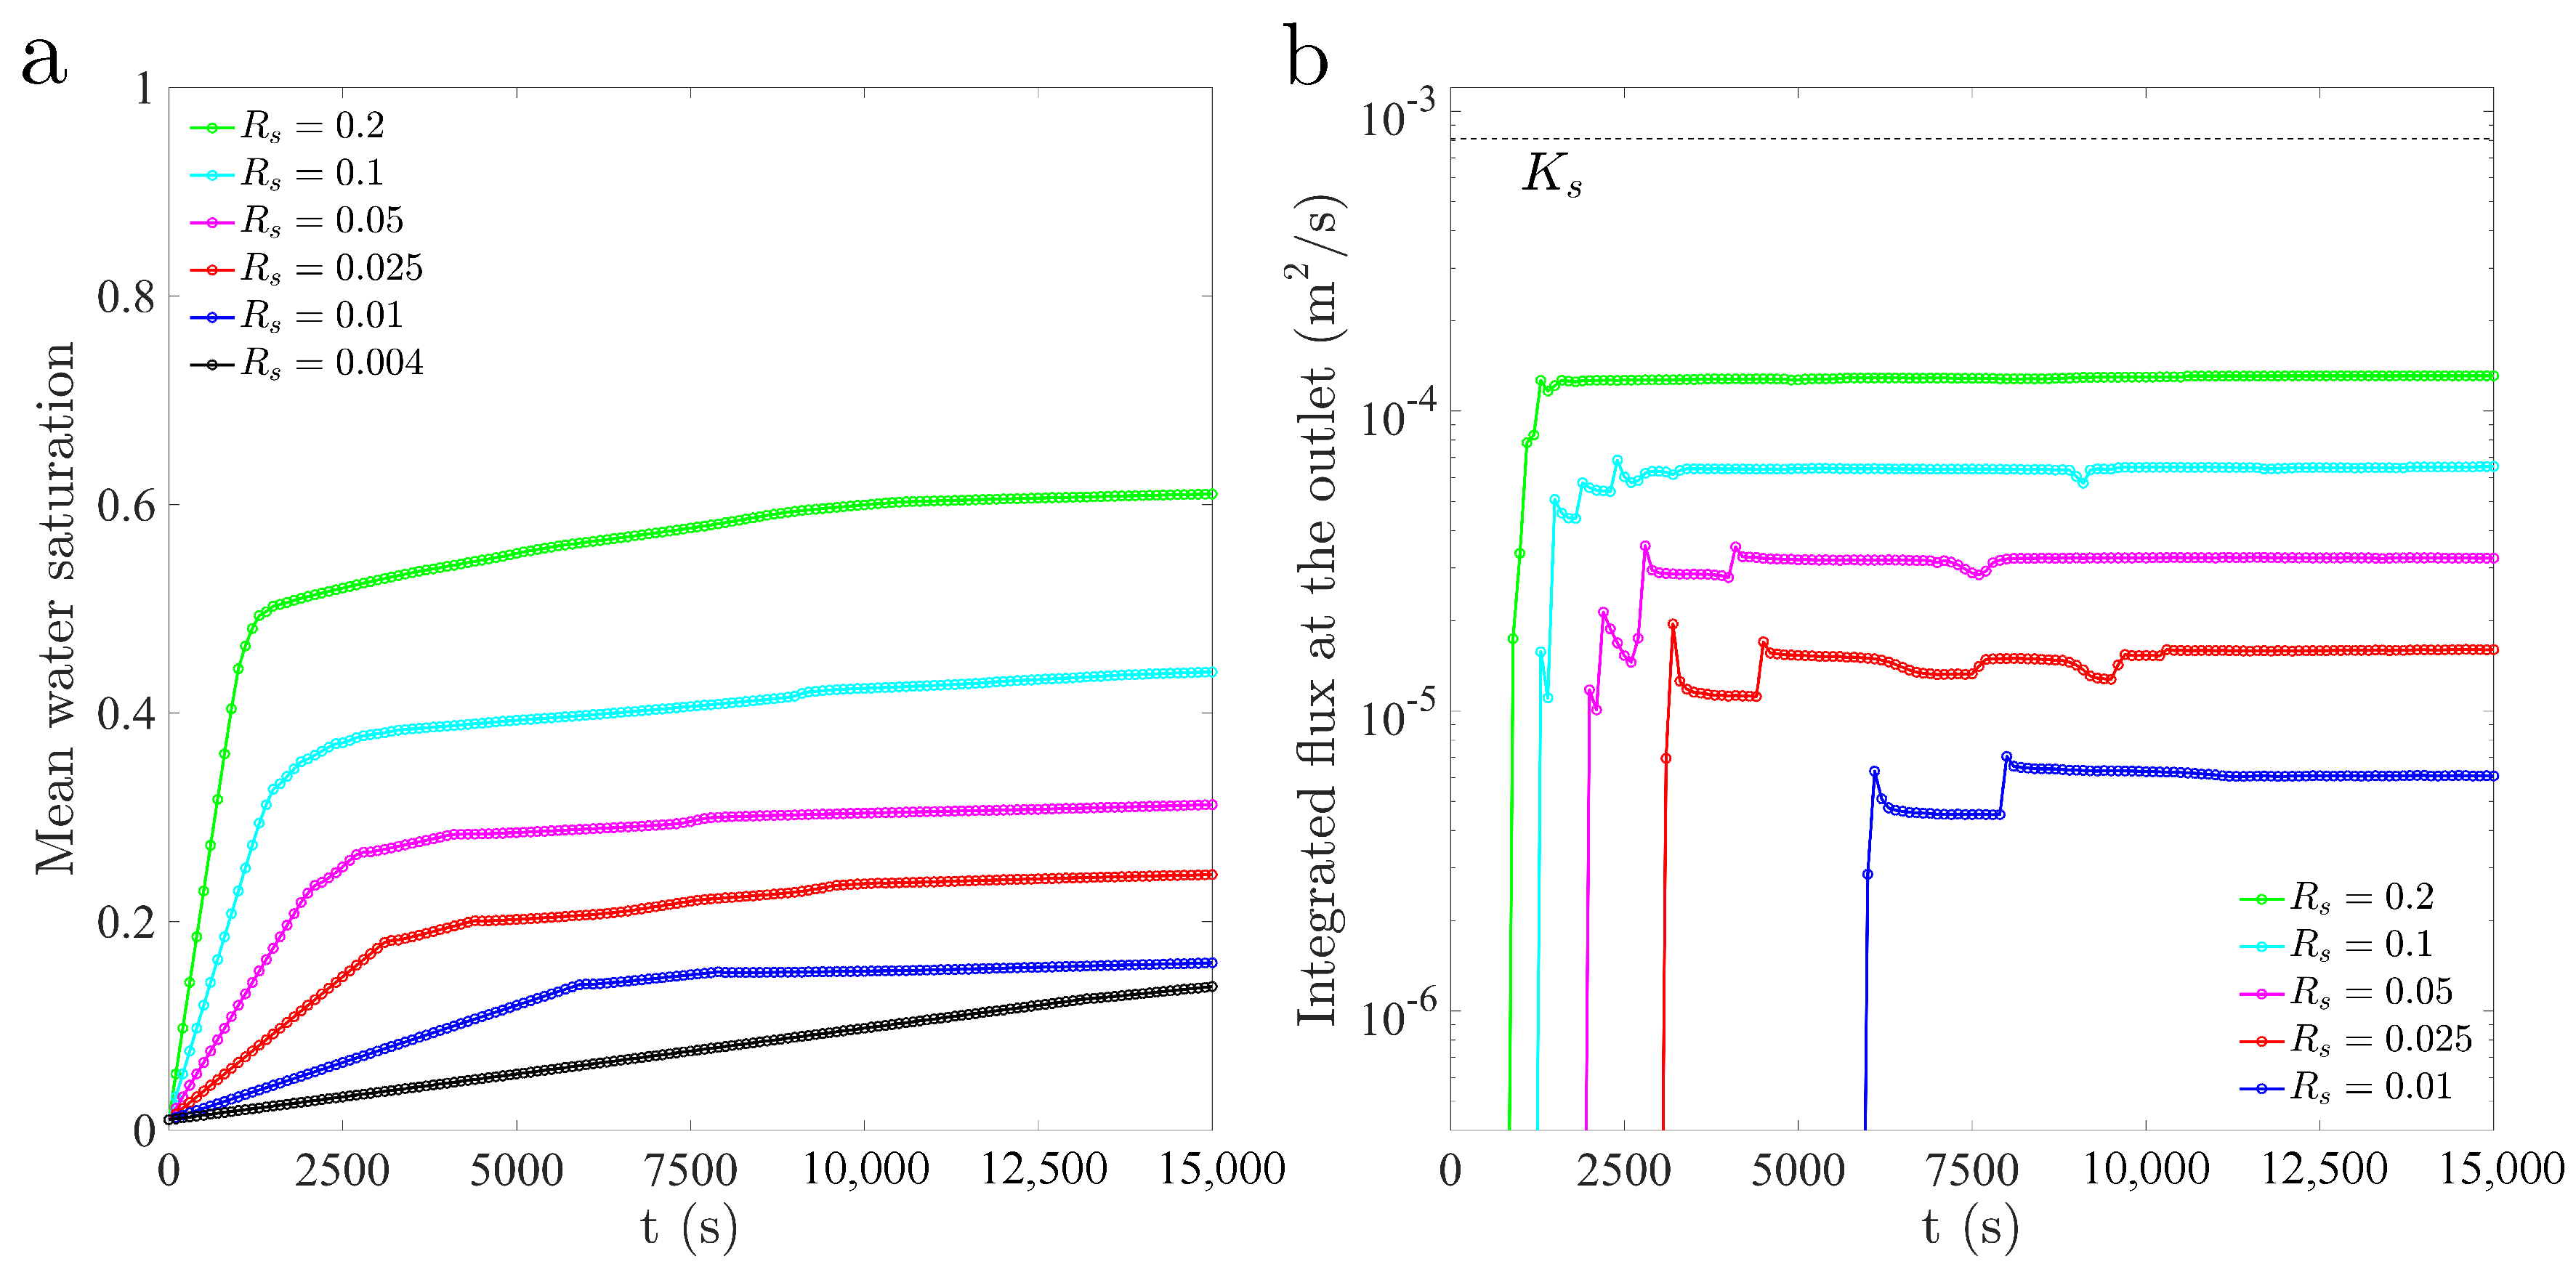
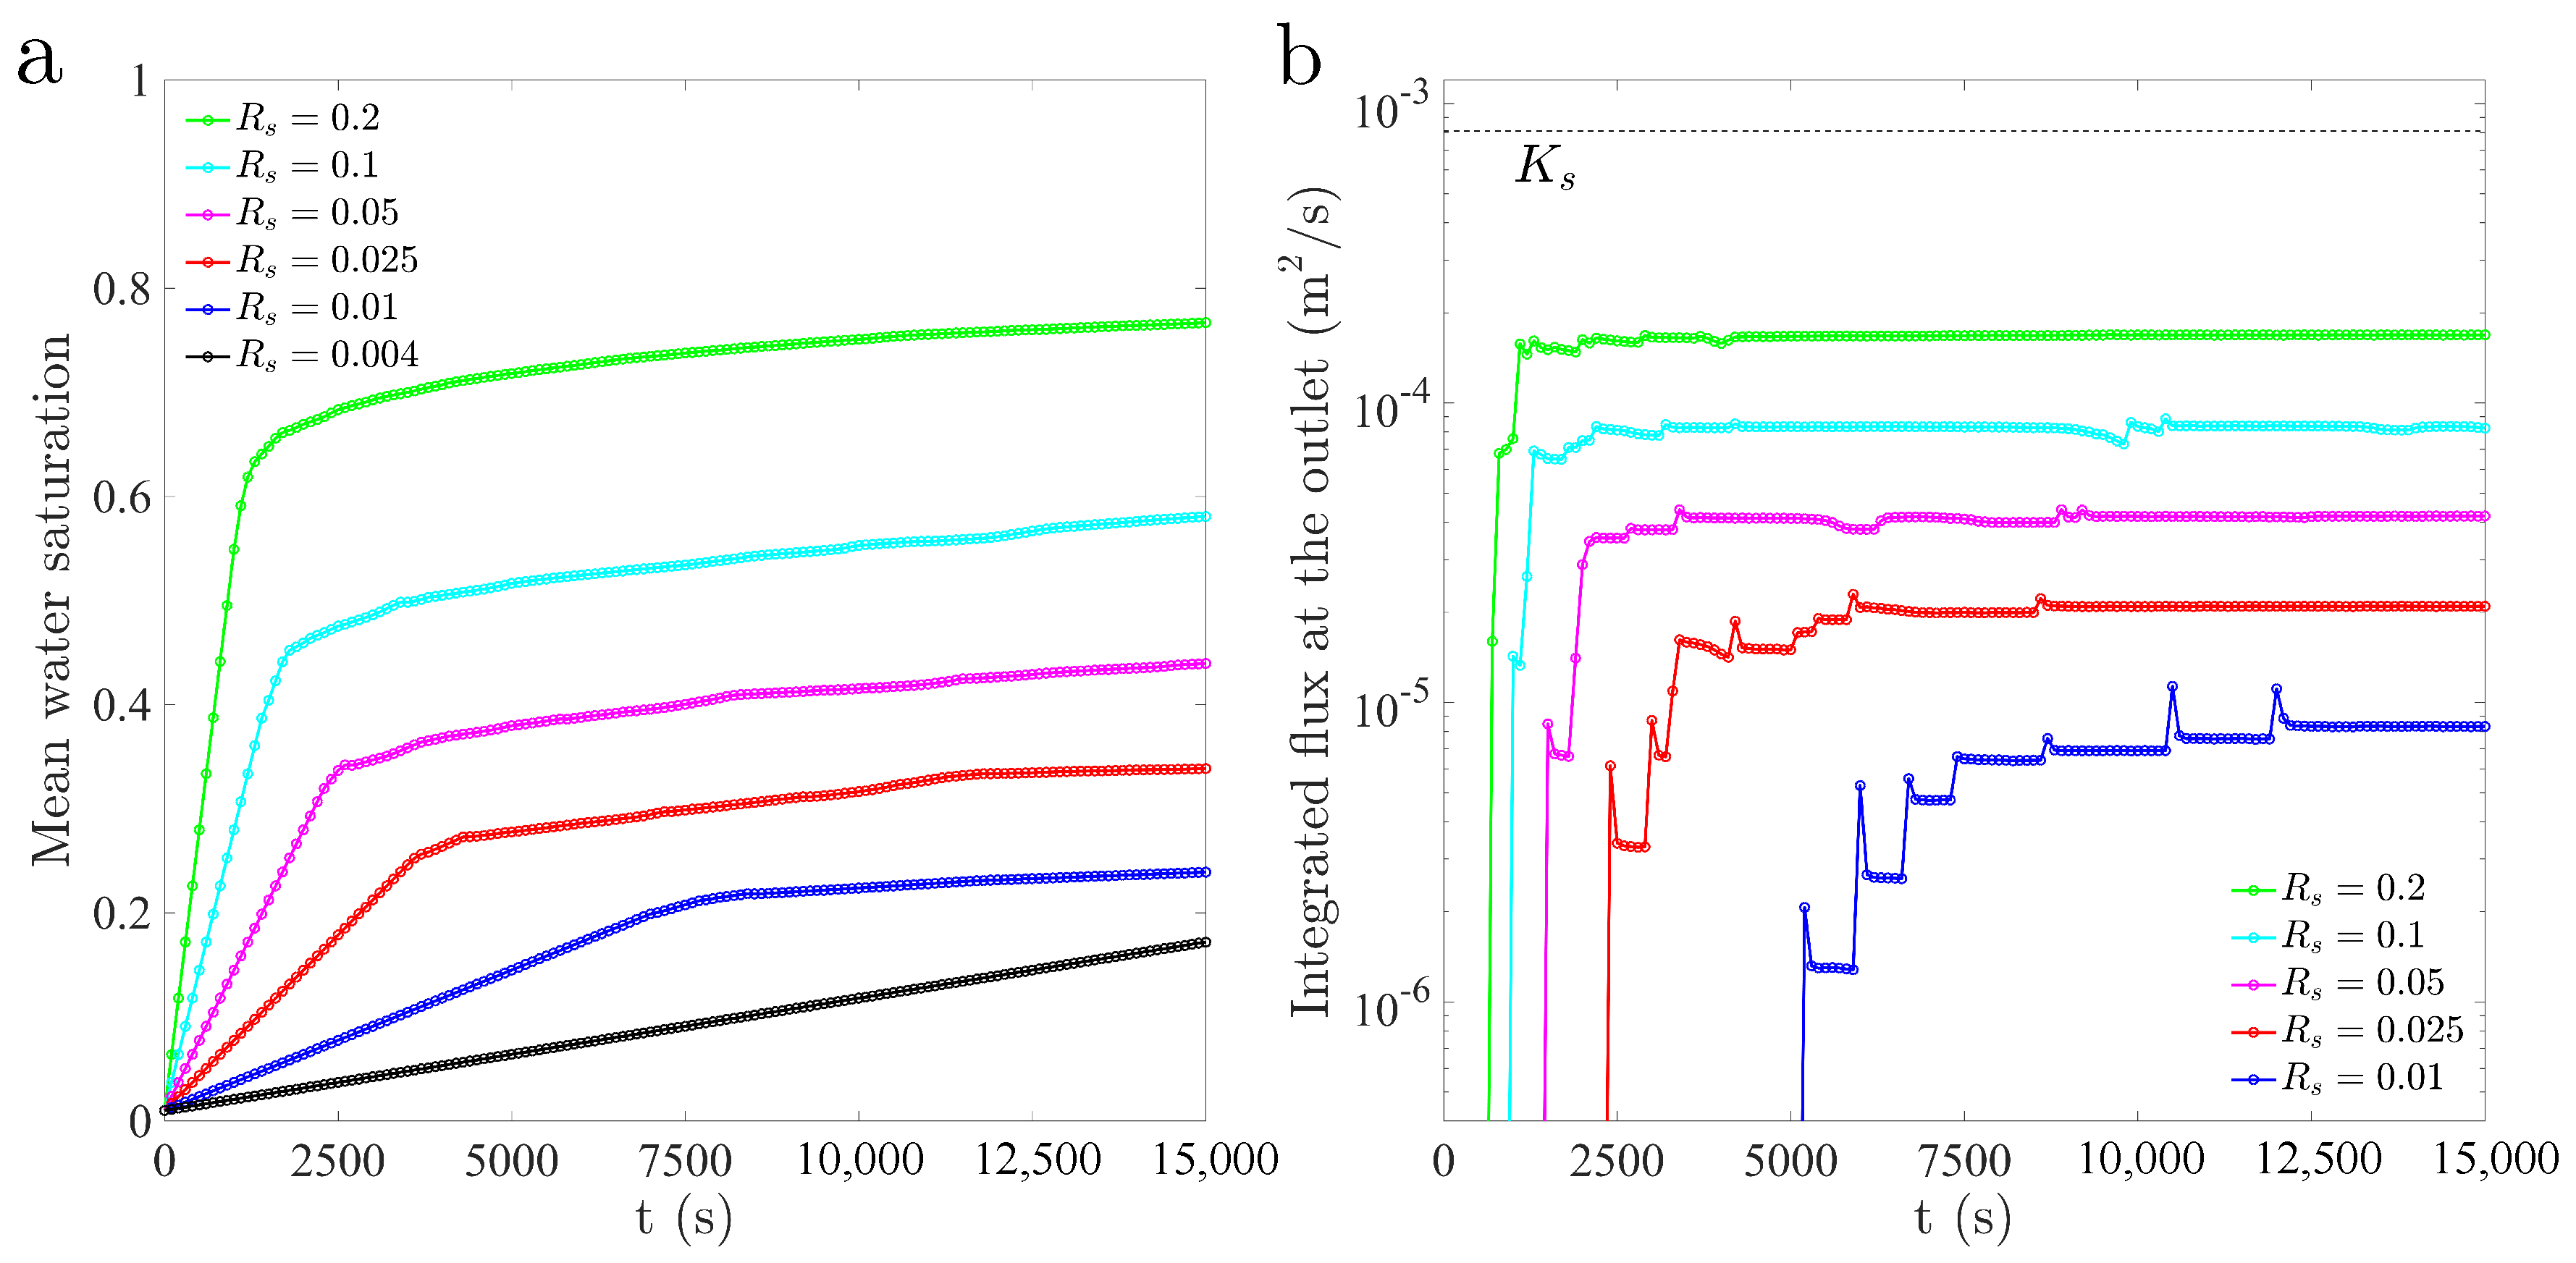
We finally explore the impact of infiltration rate on the patterns of preferential flow in infiltration (Figure 11) and on the wetting efficiency (wet area and average water saturation for a given infiltration flux) (Figure 12, Figure 13 and Figure 14). We simulate infiltration into isotropic ( cm, cm) and anisotropic ( cm and cm) permeability fields, with flux ratios ranging from to . The overall trend with increasing flux ratio is that of a more efficient wetting (increasing wet area), with wider fingers that cover larger portions of the domain (Figure 11). To quantify the wetting efficiency and speed of the infiltration front, we plot the evolution of average saturation over the domain for the different correlation lengths and the evolution of the volumetric flux at the outlet (bottom boundary) for the three permeability fields (Figure 12, Figure 13 and Figure 14). Larger flux ratios lead to shorter arrival times at the bottom of the domain and to a more uniform finger velocity, demonstrated by the smoothness and flatness of the evolution of outlet flux. The wet area increases with the flux ratio, which is consistent with the experimental observations of wider fingers and a more stable wetting front at high infiltrating fluxes. The time needed to achieve a nearly steady-state flow pattern, with a wet area that remains unchanged, is smaller for larger infiltrating fluxes.
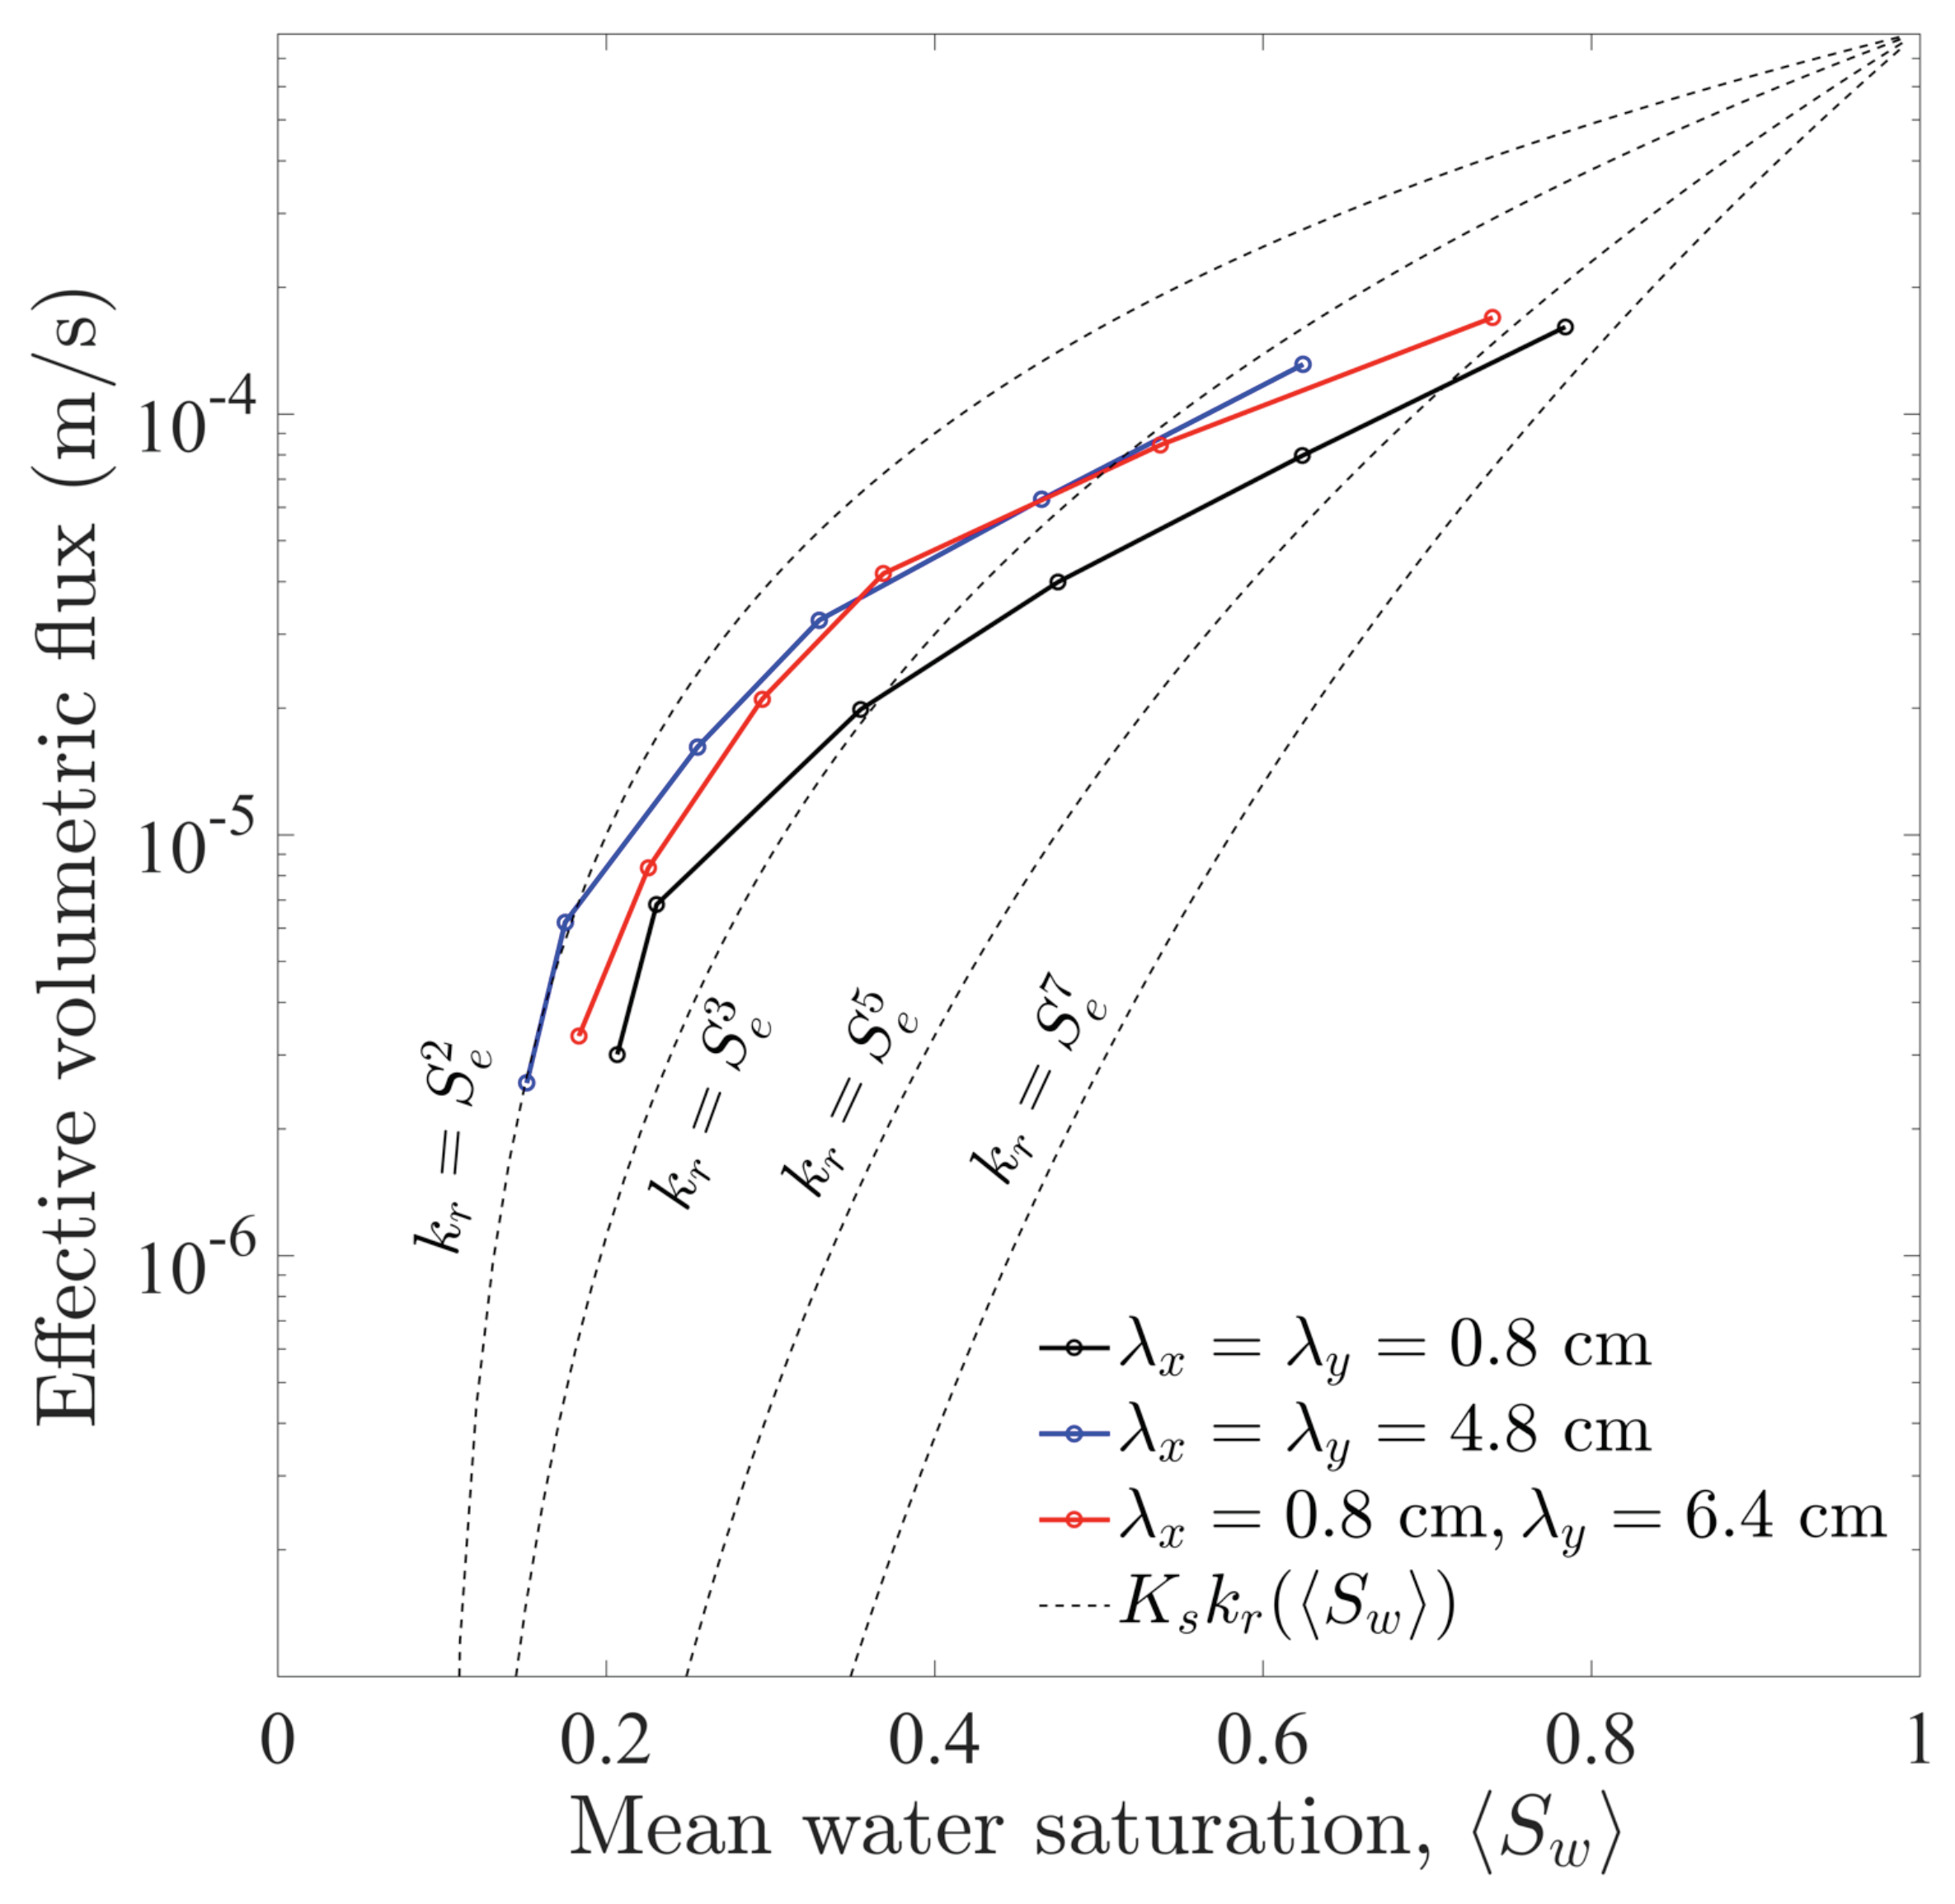
To summarize our results on the impact of the spatial structure (correlation) of the soil intrinsic permeability, fingering, and infiltration rate, we plot the volumetric flux as a function of mean water saturation, for three different pairs of correlation lengths (Figure 15). This plot represents the effective relative conductivity function that one should use in basin-scale hydrological models, where infiltration is modeled using simplified bucket-type models. It is interesting that fingering changes the effective relative conductivity compared with a compact infiltration front, where the effective field-scale relative conductivity function would coincide with the Richards-scale unsaturated conductivity.
4. Discussion and Conclusions
This paper presented, for the first time, a numerical investigation of the interplay between fingering instabilities and soil heterogeneity in water infiltration into dry soil. We performed detailed simulations of constant-rate infiltration into soils with isotropic and anisotropic intrinsic permeability fields. Permeability fields were random and spatially correlated, with Gaussian statistics.
We explored several pairs of spatial correlation lengths, with the goal of exploring contrasting soil structures: from isotropic, unstructured soils to nearly layered media with low-permeability lenses. Our mathematical model accounted for the impact of permeability heterogeneity on capillary pressure, through Leverett scaling. We explored soil properties favoring unstable infiltration (gravity fingering) and studied the interplay between intrinsic finger size (controlled by wetting front dynamics) and the correlation lengths of the permeability field. We illustrated the main changes in the infiltration pattern qualitatively, through representative simulations and visualizations of the evolution of water saturation fields during infiltration and quantified the impact of permeability structure on effective finger coverage (mean saturation) and effective conductivity.
From our results, we may draw the following conclusions:
- Soil heterogeneity did not suppress fingering instabilities, but it may actually enhance their effects of preferential flow and channeling during water infiltration. In particular, soil heterogeneity enhanced fingering at low infiltration rates for all explored spatial structures of intrinsic permeability. At large infiltration rates, the wet area tended to cover the entire soil, so that the finger width was comparable with the system size.
- Fingering patterns strongly depended on soil structure, in particular the correlation length and anisotropy of the permeability field. While the finger size and flow dynamics were only slightly controlled by the correlation length in isotropic fields, layering led to significant finger meandering and bulging, changing arrival times and wetting efficiencies.
- Fingering and soil heterogeneity needed to be considered when upscaling the constitutive relationship of multiphase porous media from the finger to field and basin scales. While relative permeabilities remained unchanged upon upscaling for stable displacements, the inefficient wetting due to fingering led to relative permeabilities at the field scale that were significantly different from those at the Darcy scale. These effective relative permeability functions also depended, although less strongly, on heterogeneity and soil structure.
- Novel experimental observations of unsaturated flow and fingering in heterogeneous soils, such as those in [33,34,46], will help guide the refinement of mathematical models such as the one used in the present study, in particular regarding the calibration of the strength of the second-gradient extension of Richards’ equation used to reproduce fingering instabilities.
Author Contributions
Investigation L.C.-F., M.J.S.-N., X.F. and R.J. All authors have read and agreed to the published version of the manuscript.
Funding
Funding for this research was provided by the Spanish Ministry of Economy and Competitiveness under Grant CTM2014-54312-P (to L.C.-F.), by the Abdul Latif Jameel World Water and Food Security Lab (J-WAFS) at MIT (to R.J.), by the MIT International Science and Technology Initiatives (MISTI), through a Seed Fund grant (to R.J. and L.C.-F.), and by the Miller Fellowship for Basic Research in Science (to X.F.).
Conflicts of Interest
The authors declare no conflict of interest. The funders had no role in the design of the study; in the collection, analyses, or interpretation of data; in the writing of the manuscript; nor in the decision to publish the results.
References
- Rodriguez-Iturbe, I. Ecohydrology: A hydrologic perspective of climate-soil-vegetation dynamics. Water Resour. Res. 2000, 36, 3–9. [Google Scholar] [CrossRef] [Green Version]
- Richards, L.A. Capillary conduction of liquids through porous mediums. Physics 1931, 1, 318–333. [Google Scholar] [CrossRef]
- Horton, R.E. The role of infiltration in the hydrologic cycle. Trans. Am. Geophys. Union 1933, 14, 446–460. [Google Scholar] [CrossRef]
- Philip, J.R. The theory of infiltration 1. The infiltration equation and its solution. Soil Sci. 1957, 83, 345–357. [Google Scholar] [CrossRef]
- Philip, J.R. Theory of infiltration. In Advances in Hydroscience; Chow, V.T., Ed.; Academic Press: New York, NY, USA, 1969; pp. 215–296. [Google Scholar]
- DiCarlo, D.A. Stability of gravity-driven multiphase flow in porous media: 40 years of advancements. Water Resour. Res. 2013, 49, 4531–4544. [Google Scholar] [CrossRef]
- Xiong, Y. Flow of water in porous media with saturation overshoot: A review. J. Hydrol. 2014, 510, 353–362. [Google Scholar] [CrossRef]
- Hill, D.E.; Parlange, J.Y. Wetting front instability in layered soils. Soil Sci. Soc. Am. J. 1972, 36, 697–702. [Google Scholar] [CrossRef]
- Glass, R.J.; Parlange, J.Y.; Steenhuis, T.S. Wetting front instability, 2. Experimental determination of relationships between system parameters and two-dimensional unstable flow field behaviour in initially dry porous media. Water Resour. Res. 1989, 25, 1195–1207. [Google Scholar] [CrossRef]
- Ritsema, C.J.; Dekker, L.W.; Nieber, J.L.; Steenhuis, T.S. Modeling and field evidence of finger formation and finger recurrence in a water repellent sandy soil. Water Resour. Res. 1998, 34, 555–567. [Google Scholar] [CrossRef] [Green Version]
- Méheust, Y.; Løvoll, G.; Måløy, K.J.; Schmittbuhl, J. Interface scaling in a two-dimensional porous medium under combined viscous, gravity, and capillary effects. Phys. Rev. E 2002, 66, 051603. [Google Scholar] [CrossRef] [Green Version]
- Leroux, N.R.; Pomeroy, J.W. Modelling capillary hysteresis effects on preferential flow through melting and cold layered snowpacks. Adv. Water Resour. 2017, 107, 250–264. [Google Scholar] [CrossRef]
- Aubrecht, R.; Lánczos, T.; Schlögl, J.; Audy, M. Small-scale modelling of cementation by descending silica-bearing fluids: Explanation of the origin of arenitic caves in South American tepuis. Geomorphology 2017, 298, 107–117. [Google Scholar] [CrossRef]
- Diment, G.A.; Watson, K.K. Stability analysis of water movement in unsaturated porous materials 3. Experimental studies. Water Resour. Res. 1985, 21, 979–984. [Google Scholar] [CrossRef]
- Glass, R.J.; Cann, S.; King, J.; Baily, N.; Parlange, J.Y.; Steenhuis, T.S. Wetting front instability in unsaturated porous media: A three-dimensional study in initially dry sand. Transp. Porous Media 1990, 5, 247–268. [Google Scholar] [CrossRef]
- Selker, J.S.; Leclerq, P.; Parlange, J.Y.; Steenhuis, T. Fingered flow in two dimensions, 1. Measurement of matric potential. Water Resour. Res. 1992, 28, 2513–2521. [Google Scholar] [CrossRef] [Green Version]
- Selker, J.S.; Parlange, J.Y.; Steenhuis, T. Fingered flow in two dimensions, 2. Predicting finger moisture profile. Water Resour. Res. 1992, 28, 2523–2528. [Google Scholar] [CrossRef] [Green Version]
- Lu, T.X.; Biggar, J.W.; Nielsen, D.R. Water movement in glass bead porous media, 2. Experiments of infiltration and finger flow. Water Resour. Res. 1994, 30, 3283–3290. [Google Scholar] [CrossRef]
- Bauters, T.W.J.; DiCarlo, D.A.; Steenhuis, T.S.; Parlange, J.Y. Preferential flow in water-repellent sands. Soil Sci. Soc. Am. J. 1998, 62, 1185–1190. [Google Scholar] [CrossRef]
- Bauters, T.W.J.; DiCarlo, D.A.; Steenhuis, T.S.; Parlange, J.Y. Soil water content dependent wetting front characteristics in sands. J. Hydrol. 2000, 231, 244–254. [Google Scholar] [CrossRef]
- Yao, T.; Hendrickx, J.M.H. Stability analysis of the unsaturated water flow equation 2. Experimental verification. Water Resour. Res. 2001, 37, 1875–1881. [Google Scholar] [CrossRef]
- Flekkøy, E.G.; Schmittbuhl, J.; Løvholt, F.; Oxaal, U.; Måløy, K.J.; Aagaard, P. Flow paths in wetting unsaturated flow: Experiments and simulations. Phys. Rev. E 2002, 65, 036312. [Google Scholar] [CrossRef] [PubMed] [Green Version]
- Wang, Z.; Jury, W.A.; Tuli, A.; Kim, D.J. Unstable flow during redistribution: Controlling factors and practical implications. Vadose Zone J. 2004, 3, 549–559. [Google Scholar] [CrossRef]
- Wei, Y.; Cejas, C.M.; Barrois, R.; Dreyfus, R.; Durian, D.J. Morphology of rain water channeling in systematically varied model sandy soils. Phys. Rev. Appl. 2014, 2, 044004. [Google Scholar] [CrossRef] [Green Version]
- Cueto-Felgueroso, L.; Juanes, R. Nonlocal interface dynamics and pattern formation in gravity-driven unsaturated flow through porous media. Phys. Rev. Lett. 2008, 101, 244504. [Google Scholar] [CrossRef] [PubMed] [Green Version]
- Cueto-Felgueroso, L.; Juanes, R. A phase-field model of unsaturated flow. Water Resour. Res. 2009, 45, W10409. [Google Scholar] [CrossRef]
- Gomez, H.; Cueto-Felgueroso, L.; Juanes, R. Three-dimensional simulation of unstable gravity-driven infiltration of water into a porous medium. J. Comput. Phys. 2013, 238, 217–239. [Google Scholar] [CrossRef] [Green Version]
- Rätz, A.; Schweizer, B. Hysteresis models and gravity fingering in porous media. Z. Angew. Math. Mech. 2014, 94, 645–654. [Google Scholar] [CrossRef] [Green Version]
- Brindt, N.; Wallach, R. The moving-boundary approach for modeling gravity-driven stable and unstable flow in soils. Water Resour. Res. 2017, 53, 344–360. [Google Scholar] [CrossRef]
- Beljadid, A.; Cueto-Felgueroso, L.; Juanes, R. A continuum model of unstable infiltration in porous media endowed with an entropy function. Adv. Water Resour. 2019. under review. [Google Scholar]
- Ritsema, C.J.; Dekker, L.W. Soil moisture and dry bulk density patterns in bare dune sands. J. Hydrol. 1994, 154, 107–131. [Google Scholar] [CrossRef]
- Hendrickx, J.M.H.; Flury, M. Uniform and preferential flow mechanisms in the vadose zone. In Conceptual Models of Flow and Transport in the Fractured Vadose Zone; The National Academies Press: Washington, DC, USA, 2001; pp. 149–187. [Google Scholar]
- Cremer, C.J.M.; Schuetz, C.; Neuweiler, I.; Lehmann, P.; Lehmann, E.H. Unstable Infiltration Experiments in Dry Porous Media. Vadose Zone J. 2019, 16, 13. [Google Scholar] [CrossRef]
- Sililo, O.T.N.; Tellam, J.H. Fingering in unsaturated zone flow: A qualitative review with laboratory experiments in heterogeneous systems. Ground Water 2000, 38, 864–871. [Google Scholar] [CrossRef]
- Glass, R.J.; Steenhuis, T.S.; Parlange, J.Y. Wetting front instability as a rapid and far-reaching hydrologic process in the vadose zone. J. Contam. Hydrol. 1988, 3, 207–226. [Google Scholar] [CrossRef]
- Ommen, H.C.V.; Dijksma, R.; Hendrickx, J.M.H.; Dekker, L.W.; Hulshof, J.; Heuve, M.V.D. Experimental assessment of preferential flow paths in a field soil. J. Hydrol. 1989, 105, 253–262. [Google Scholar] [CrossRef]
- Liu, Y.; Steenhuis, T.S.; Parlange, J.Y. Formation and persistence of fingered flow fields in coarse grained soils under different moisture contents. J. Hydrol. 1994, 159, 187–195. [Google Scholar] [CrossRef]
- Ritsema, C.J.; Dekker, L.W. How water moves in a water repellent sandy soil 2. Dynamics of fingered flow. Water Resour. Res. 1994, 9, 2519–2531. [Google Scholar] [CrossRef]
- Ritsema, C.J.; Steenhuis, T.S.; Parlange, J.Y.; Dekker, L.W. Predicted and observed finger diameters in field soils. Geoderma 1996, 70, 185–196. [Google Scholar] [CrossRef]
- Ritsema, C.J.; Dekker, L.W. Wetting patterns and moisture variability in water repellent Dutch soils. J. Hydrol. 2000, 231, 148–164. [Google Scholar]
- Ritsema, C.J.; Dekker, L.W. Preferential flow in water repellent sandy soils: Principles and modeling implications. J. Hydrol. 2000, 231, 308–319. [Google Scholar] [CrossRef] [Green Version]
- Wang, Z.; Wu, Q.J.; Wu, L.; Ritsema, C.J.; Dekker, L.W.; Feyen, J. Effects of soil water repellency on infiltration rate and flow instability. J. Hydrol. 2000, 231, 265–276. [Google Scholar] [CrossRef]
- Wallach, R.; Jortzick, C. Unstable finger-like flow in water-repellent soils during wetting and redistribution—The case of a point water source. J. Hydrol. 2008, 351, 26–41. [Google Scholar] [CrossRef]
- Wallach, R.; Margolis, M.; Graber, E.R. The role of contact angle on unstable flow formation during infiltration and drainage in wettable porous media. Water Resour. Res. 2013, 49, 6508–6521. [Google Scholar] [CrossRef]
- Glass, R.J.; Oosting, G.H.; Steenhuis, T.S. Preferential solute transport in layered homogeneous sands as a consequence of wetting front instability. J. Hydrol. 1989, 110, 87–105. [Google Scholar] [CrossRef]
- Wildenschild, D.; Jensen, K.H. Laboratory investigations of effective flow behavior in unsaturated heterogeneous sands. Water Resour. Res. 1999, 35, 17–27. [Google Scholar] [CrossRef]
- Wildenschild, D.; Jensen, K.H. Numerical modeling of observed effective flow behavior in unsaturated heterogeneous sands. Water Resour. Res. 1999, 35, 29–42. [Google Scholar] [CrossRef]
- Jiménez-Martínez, J.; Skaggs, T.; van Genuchten, M.; Candela, L. A root zone modelling approach to estimating groundwater recharge from irrigated areas. J. Hydrol. 2009, 367, 138–149. [Google Scholar] [CrossRef]
- Jiménez-Martínez, J.; Candela, L.; Molinero, J.; Tamoh, K. Groundwater recharge in irrigated semi-arid areas: Quantitative hydrological modelling and sensitivity analysis. Hydrogeol. J. 2010, 18, 1811–1824. [Google Scholar] [CrossRef]
- Crosbie, R.S.; Scanlon, B.R.; Mpelasoka, F.S.; Reedy, R.C.; Gates, J.B.; Zhang, L. Potential climate change effects on groundwater recharge in the High Plains Aquifer, USA. Water Resour. Res. 2013, 49, 3936–3951. [Google Scholar] [CrossRef] [Green Version]
- Berg, A.; Sheffield, J. Climate Change and Drought: The Soil Moisture Perspective. Curr. Clim. Chang. Rep. 2018, 4, 180–191. [Google Scholar] [CrossRef]
- Samaniego, L.; Thober, S.; Kumar, R.; Wanders, N.; Rakovec, O.; Pan, M.; Zink, M.; Sheffield, J.; Wood, E.F.; Marx, A. Anthropogenic warming exacerbates European soil moisture droughts. Nat. Clim. Chang. 2018, 8, 421–426. [Google Scholar] [CrossRef]
- Muskat, M.; Meres, M.W. The flow of heterogeneous fluids through porous media. Physics 1936, 7, 346–363. [Google Scholar] [CrossRef]
- Muskat, M. Physical Principles of Oil Production; McGraw-Hill: New York, NY, USA, 1949. [Google Scholar]
- Bear, J. Dynamics of Fluids in Porous Media; Elsevier: New York, NY, USA, 1972. [Google Scholar]
- Sciarra, G. Phase field modeling of partially saturated deformable porous media. J. Mech. Phys. Solids 2016, 94, 230–256. [Google Scholar] [CrossRef] [Green Version]
- Leverett, M.C. Capillary behavior of porous solids. Trans. AIME 1941, 142, 152–169. [Google Scholar] [CrossRef]
- COMSOL. COMSOL Multiphysics Structural Mechanics Module User’s Guide v5.2a; COMSOL: Stockholm, Sweden, 2016. [Google Scholar]
- Brooks, R.H.; Corey, A.T. Properties of porous media affecting fluid flow. J. Irrig. Drain. Div. Proc. Am. Soc. Civ. Eng. 1966, IR2, 61–88. [Google Scholar]
- Van Genuchten, M.T. A closed-form equation for predicting the hydraulic conductivity of unsaturated soils. Soil Sci. Soc. Am. J. 1980, 44, 892–898. [Google Scholar] [CrossRef] [Green Version]
- Gelhar, L.W.; Axness, C.L. Three-Dimensional Stochastic Analysis of Macrodispersion in Aquifers. Water Resour. Res. 1983, 19, 161–180. [Google Scholar] [CrossRef]
Figure 1.
Problem setup. We simulate constant-rate infiltration into heterogeneous soil. (a) Sample realization of a random, spatially-correlated permeability field. (b) Snapshot of the water saturation field from a simulation with the permeability field shown in Panel (a).
Figure 1.
Problem setup. We simulate constant-rate infiltration into heterogeneous soil. (a) Sample realization of a random, spatially-correlated permeability field. (b) Snapshot of the water saturation field from a simulation with the permeability field shown in Panel (a).

Figure 2.
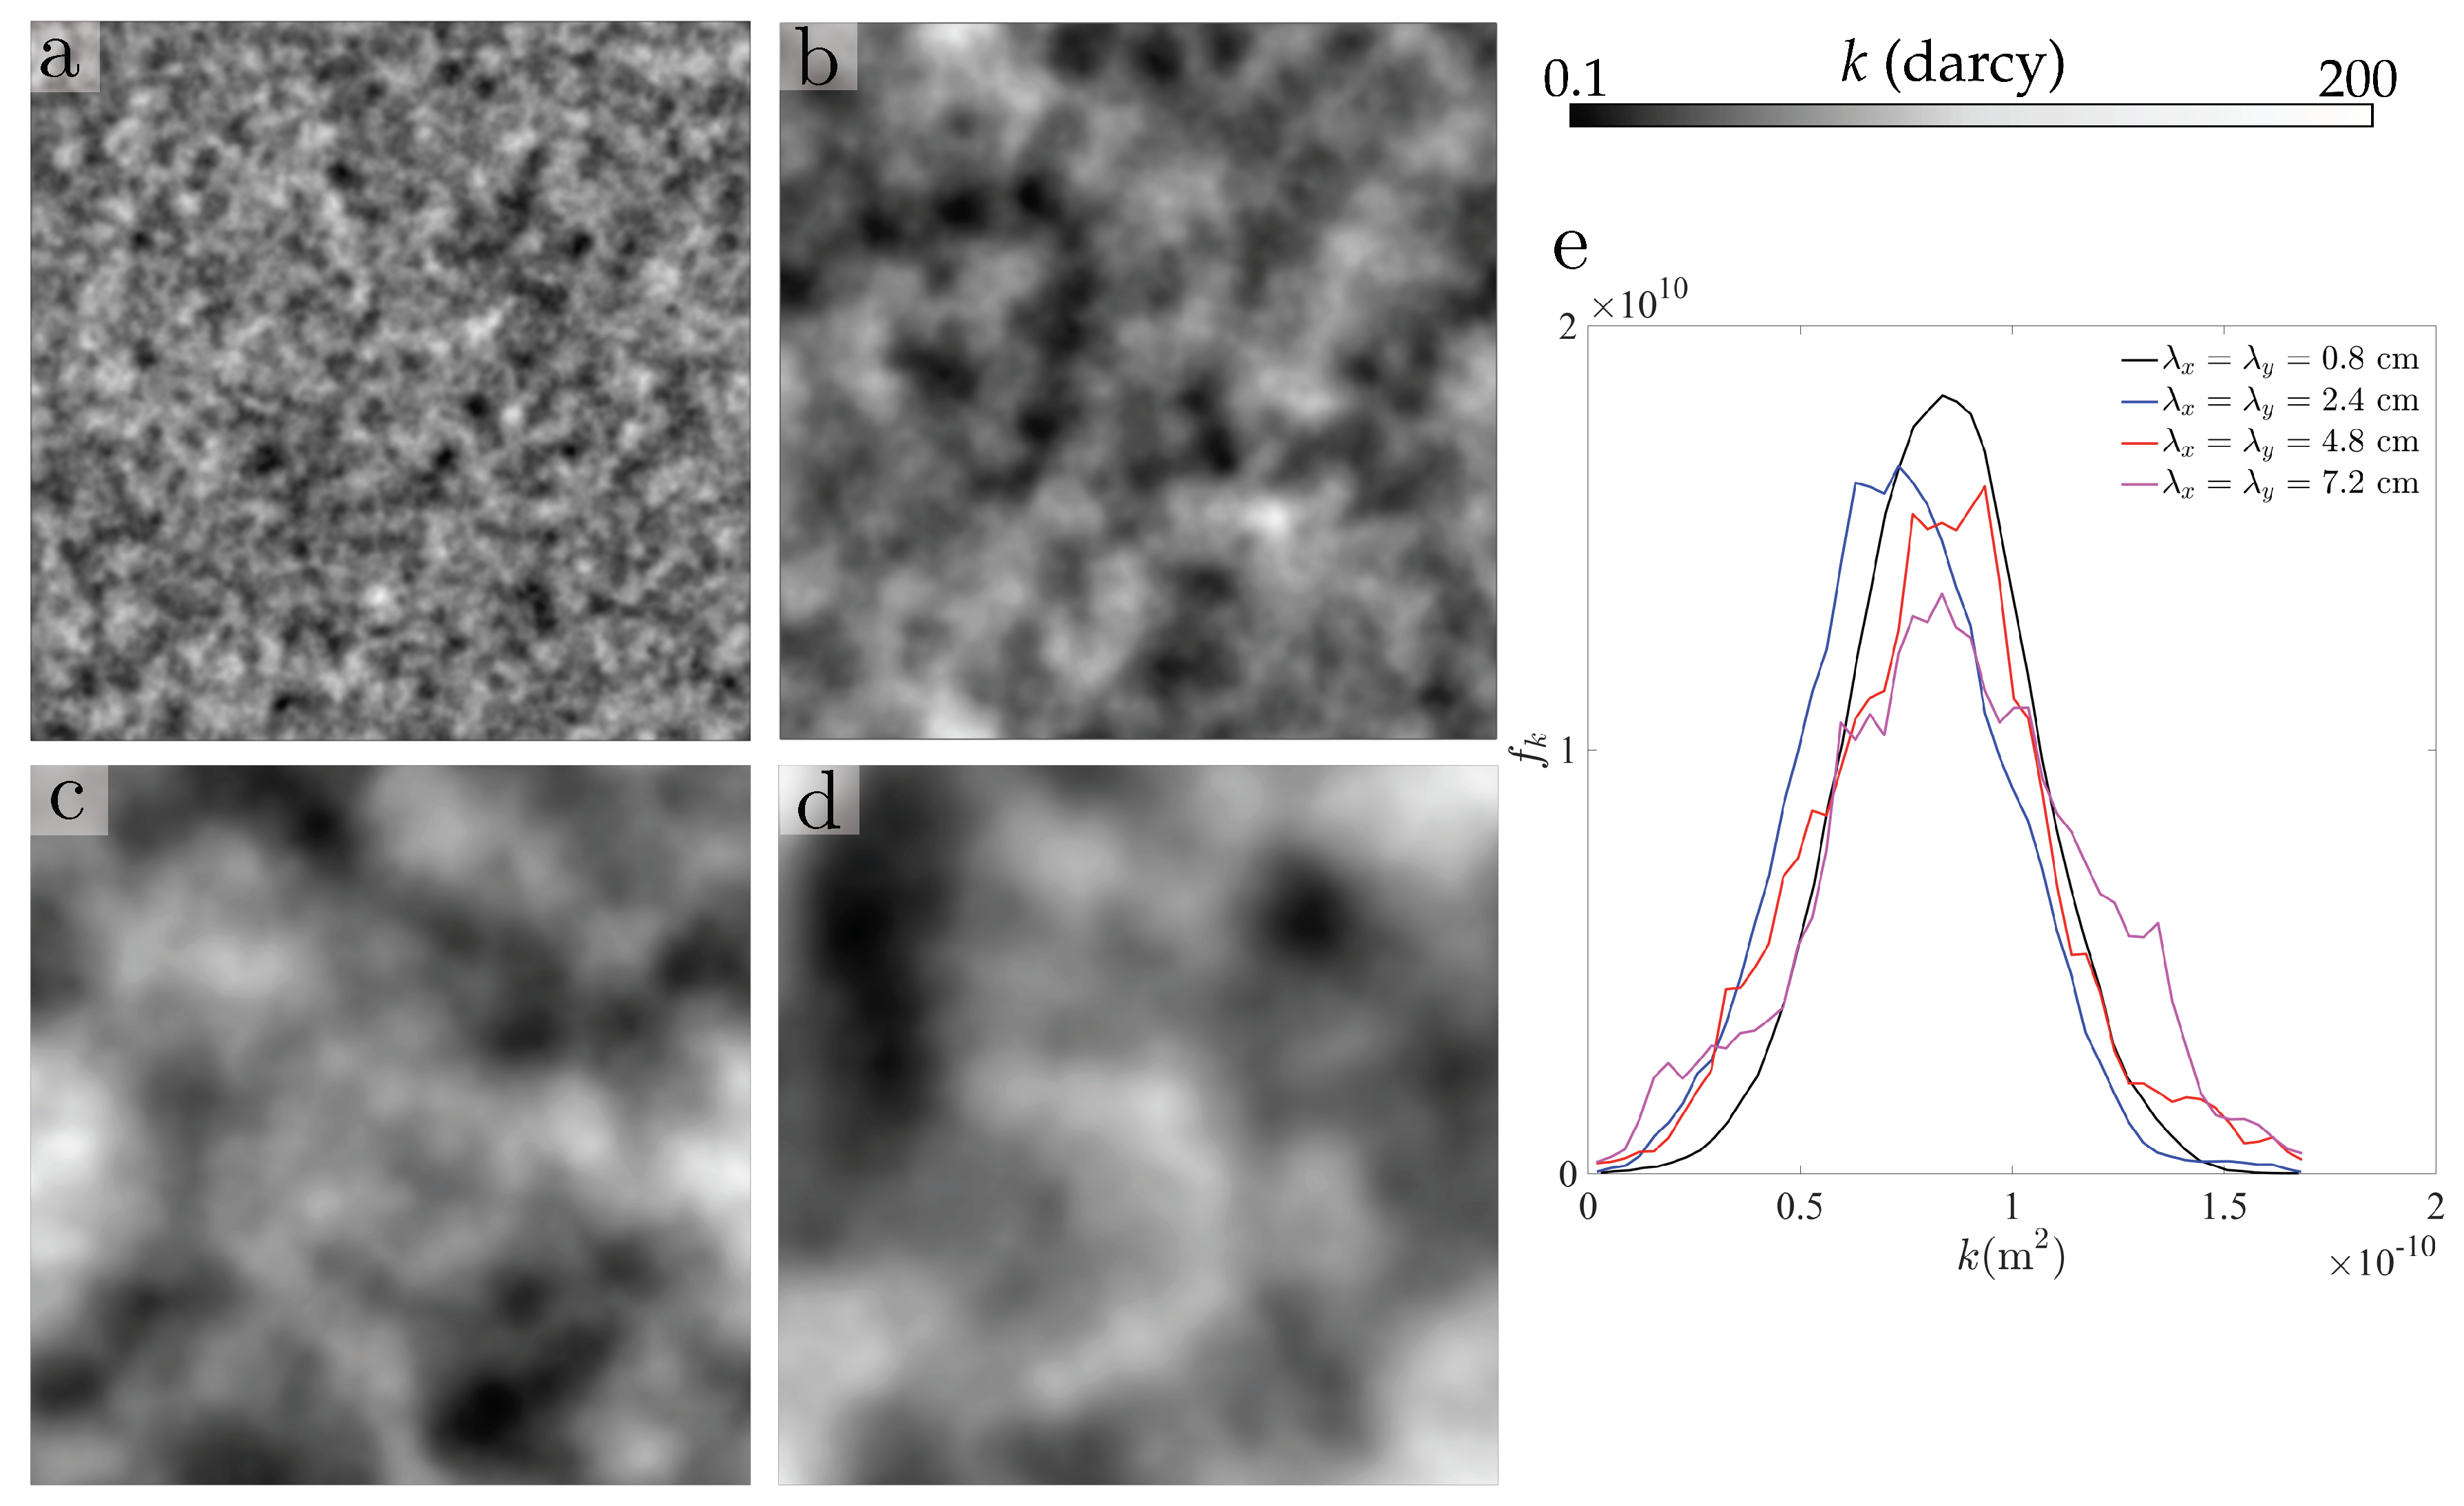
Statistics of the random permeability fields. (a–d) Maps of isotropic intrinsic permeability fields, which are random and characterized by the minimum and maximum permeability, m and 2 × m, receptively, and correlation lengths, and . Sample permeability fields with (a) == cm, (b) == cm, (c) == cm, and (d) == cm. (e) Sample probability density functions of permeability for the fields shown in Panels (a–d).
Figure 2.
Statistics of the random permeability fields. (a–d) Maps of isotropic intrinsic permeability fields, which are random and characterized by the minimum and maximum permeability, m and 2 × m, receptively, and correlation lengths, and . Sample permeability fields with (a) == cm, (b) == cm, (c) == cm, and (d) == cm. (e) Sample probability density functions of permeability for the fields shown in Panels (a–d).

Figure 3.
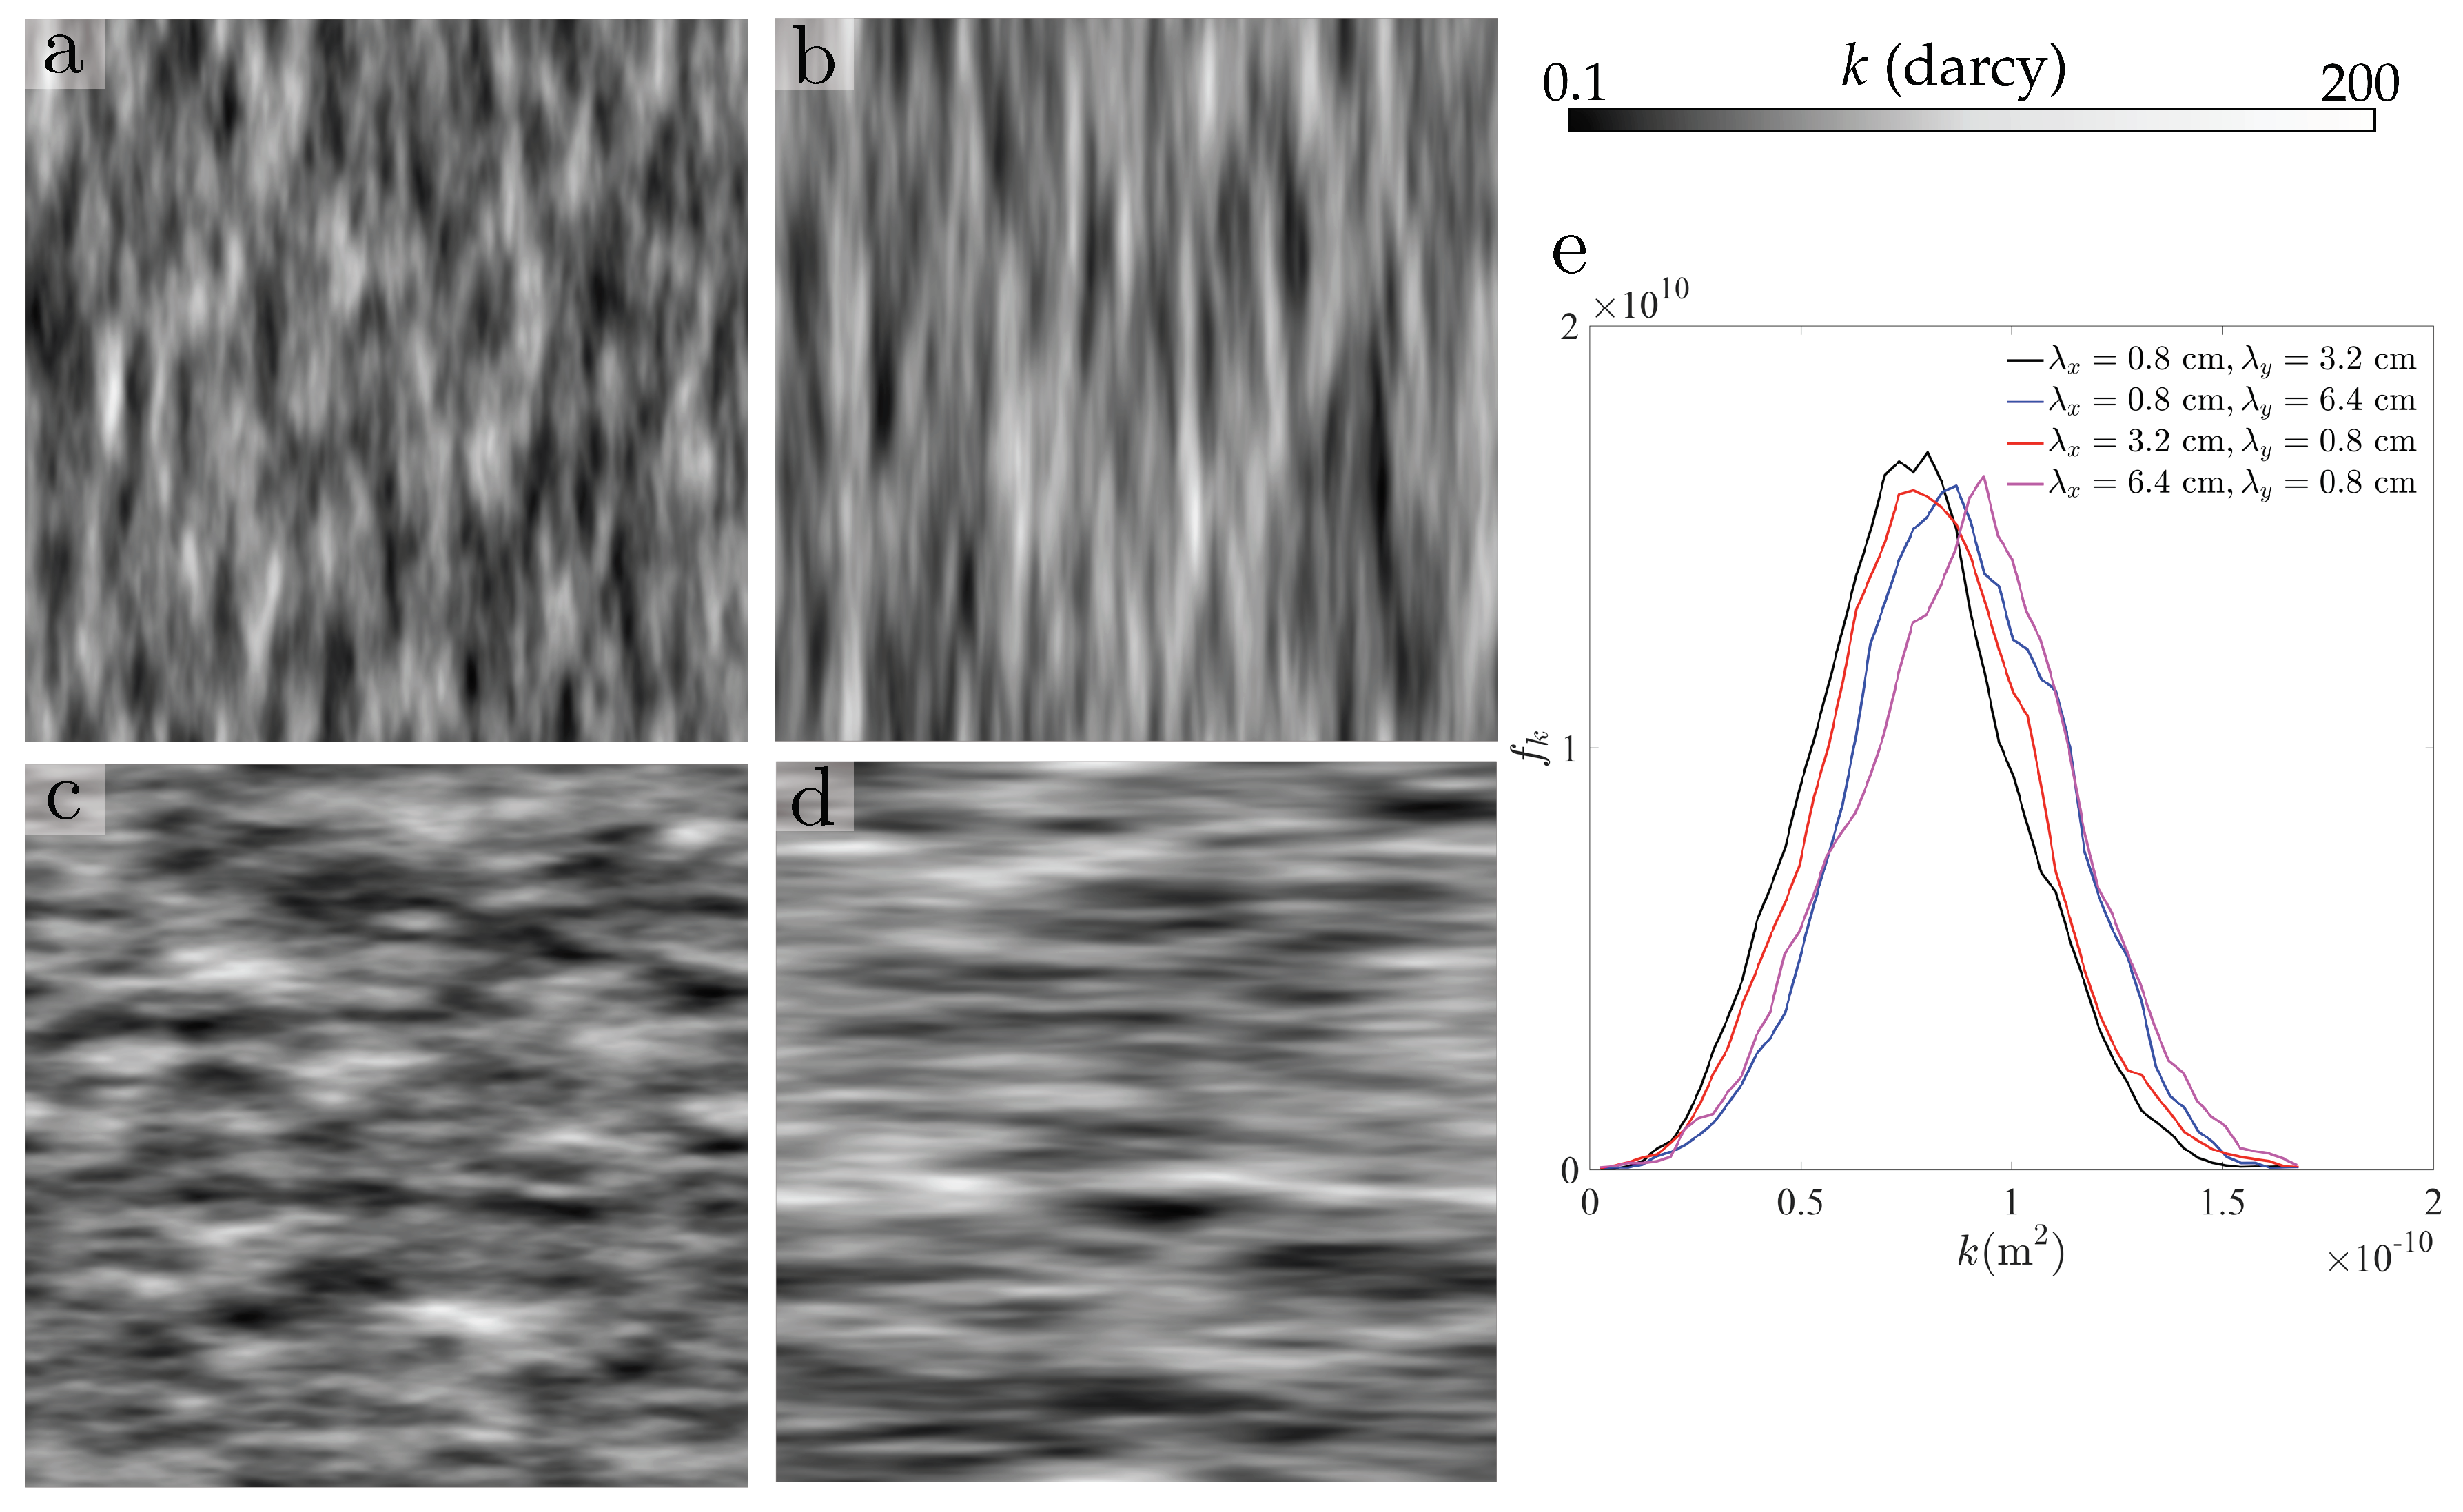
Statistics of the random permeability fields. (a–d) Anisotropic intrinsic permeability fields, which are random and characterized by the minimum and maximum permeability, m and 2 × m, receptively, and correlation lengths, and . Sample permeability fields with (a) = cm and = cm, (b) = cm and = cm, (c) = cm and = cm, and (d) = cm and = cm. (e) Sample probability density functions of permeability for the fields of Panels (a–d).
Figure 3.
Statistics of the random permeability fields. (a–d) Anisotropic intrinsic permeability fields, which are random and characterized by the minimum and maximum permeability, m and 2 × m, receptively, and correlation lengths, and . Sample permeability fields with (a) = cm and = cm, (b) = cm and = cm, (c) = cm and = cm, and (d) = cm and = cm. (e) Sample probability density functions of permeability for the fields of Panels (a–d).

Figure 4.
Impact of correlation length on unstable infiltration: isotropic permeability fields. Snapshots of the saturation field, at times , and 15,000 s, for a flux ratio, =. The correlation lengths in permeability are == cm (a–d) and == cm (e–h). Lines in grey scale are isocontours of permeability, corresponding to the field in Panels (a,b) in Figure 2.

Figure 5.
Impact of correlation length on unstable infiltration: isotropic permeability fields. Snapshots of the saturation field, at times and 15,000 s, for a flux ratio, =. The correlation lengths in permeability are == cm (a–d) and == cm (e–h). Lines in grey scale are isocontours of permeability, corresponding to the fields in panels (c,d) in Figure 2.

Figure 6.
(a) Evolution of the domain-averaged saturation for various correlation lengths. (b) Evolution of the volumetric flux at the outlet (bottom boundary).
Figure 6.
(a) Evolution of the domain-averaged saturation for various correlation lengths. (b) Evolution of the volumetric flux at the outlet (bottom boundary).

Figure 7.
(a–d) Maps of water saturation at time t= 15,000 s, for four different pairs of correlation lengths: (a) = cm and = cm, (b) = cm and = cm, (c) = cm and = cm, and (d) = cm and = cm. (e–h) Permeability fields for the simulations in Panels (a–d).
Figure 7.
(a–d) Maps of water saturation at time t= 15,000 s, for four different pairs of correlation lengths: (a) = cm and = cm, (b) = cm and = cm, (c) = cm and = cm, and (d) = cm and = cm. (e–h) Permeability fields for the simulations in Panels (a–d).

Figure 8.
Patterns of unstable infiltration: anisotropic permeability fields. (a–d) Maps of water saturation at times t=, and 15,000 s, for two different pairs of correlation lengths: (a–d) = cm and = cm and (e–h) = cm and = cm. Contours in grey scale represent isocontours of permeability, corresponding to the permeability field in Panels (f,h) in Figure 7.

Figure 9.
(a) Evolution of domain-averaged water saturation for the various anisotropic permeability fields. (b) Evolution of the volumetric flux at the outlet (bottom boundary).
Figure 9.
(a) Evolution of domain-averaged water saturation for the various anisotropic permeability fields. (b) Evolution of the volumetric flux at the outlet (bottom boundary).

Figure 10.
Patterns of infiltration into nearly-layered media. (a–d) Maps of water saturation at times and 15,000 s, for correlation lengths = cm and = cm and minimum and maximum permeability m and 2 × m, respectively. (e–h) Maps of water saturation at times and 15,000 s, for correlation lengths = cm and = 4 cm and minimum and maximum permeability m and 2 × m, respectively.

Figure 11.
Impact of infiltration rate on infiltration into heterogeneous dry soil. We show maps of water saturation at t= 15,000 s. Along the rows, saturation fields for flux ratios , and and permeability fields with correlation lengths (a) == cm, (b) == cm, and (c) = cm and = cm.
Figure 11.
Impact of infiltration rate on infiltration into heterogeneous dry soil. We show maps of water saturation at t= 15,000 s. Along the rows, saturation fields for flux ratios , and and permeability fields with correlation lengths (a) == cm, (b) == cm, and (c) = cm and = cm.

Figure 12.
(a) Evolution of the domain-averaged water saturation for the several flux ratios and correlation lengths == cm. (b) Evolution of the volumetric flux at the outlet (bottom boundary).
Figure 12.
(a) Evolution of the domain-averaged water saturation for the several flux ratios and correlation lengths == cm. (b) Evolution of the volumetric flux at the outlet (bottom boundary).

Figure 13.
(a) Evolution of the domain-averaged water saturation for the several flux ratios and correlation lengths == cm. (b) Evolution of the volumetric flux at the outlet (bottom boundary).
Figure 13.
(a) Evolution of the domain-averaged water saturation for the several flux ratios and correlation lengths == cm. (b) Evolution of the volumetric flux at the outlet (bottom boundary).

Figure 14.
(a) Evolution of the domain-averaged water saturation for the several flux ratios and correlation lengths = cm and = cm. (b) Evolution of the volumetric flux at the outlet (bottom boundary).
Figure 14.
(a) Evolution of the domain-averaged water saturation for the several flux ratios and correlation lengths = cm and = cm. (b) Evolution of the volumetric flux at the outlet (bottom boundary).

Figure 15.
Impact of unstable infiltration and heterogeneity on the effective conductivity of dry soils. We plot the volumetric flux as a function of mean water saturation, for three different pairs of correlation lengths. These results correspond to the simulations with different flux ratios of Figure 11, Figure 12, Figure 13 and Figure 14. The dashed lines show popular choices of relative conductivity curves assuming compact infiltration fronts (power-law functions).


Table 1.
Summary of model parameters and constitutive definitions.
| Name | Value | Unit | Description |
|---|---|---|---|
| 0.3 | – | Soil porosity | |
| 1000 | kg/m | Water density | |
| 0.001 | Pa·s | Water viscosity | |
| 0.016 | N/m | Air-water surface tension | |
| g | 9.81 | m/s | Acceleration of gravity |
| m | Minimum permeability | ||
| 2 × | m | Maximum permeability | |
| [0.8,25.6] | cm | Horizontal correlation length | |
| [0.8,6.4] | cm | Vertical correlation length | |
| m | Capillary height | ||
| m/s | Saturated hydraulic conductivity | ||
| – | Effective water saturation | ||
| 0.1 | – | Irreducible water saturation | |
| – | Flux ratio (top boundary) | ||
| – | Relative permeability function | ||
| J | – | Leverett J-function | |
| m | Gradient energy multiplier | ||
| m | Characteristic gradient energy length | ||
| a | 7 | – | Exponent of relative permeability function |
| 10 | – | Parameter of the Leverett J-function | |
| 40 | – | Parameter of the Leverett J-function | |
| 1 | – | Parameter of the Leverett J-function |
© 2020 by the authors. Licensee MDPI, Basel, Switzerland. This article is an open access article distributed under the terms and conditions of the Creative Commons Attribution (CC BY) license (http://creativecommons.org/licenses/by/4.0/).
Share and Cite
MDPI and ACS Style
Cueto-Felgueroso, L.; Suarez-Navarro, M.J.; Fu, X.; Juanes, R. Numerical Simulation of Unstable Preferential Flow during Water Infiltration into Heterogeneous Dry Soil. Water 2020, 12, 909. https://doi.org/10.3390/w12030909
AMA Style
Cueto-Felgueroso L, Suarez-Navarro MJ, Fu X, Juanes R. Numerical Simulation of Unstable Preferential Flow during Water Infiltration into Heterogeneous Dry Soil. Water. 2020; 12(3):909. https://doi.org/10.3390/w12030909
Chicago/Turabian StyleCueto-Felgueroso, Luis, María José Suarez-Navarro, Xiaojing Fu, and Ruben Juanes. 2020. "Numerical Simulation of Unstable Preferential Flow during Water Infiltration into Heterogeneous Dry Soil" Water 12, no. 3: 909. https://doi.org/10.3390/w12030909
Note that from the first issue of 2016, this journal uses article numbers instead of page numbers. See further details here.