Real Values of Local Resistance Coefficients during Water Flow through Welded Polypropylene T-Junctions


1
Institute of Environmental Engineering, Warsaw University of Life Sciences—SGGW, Nowoursynowska 159, 02-776 Warsaw, Poland
2
Institute of Civil Engineering, Warsaw University of Life Sciences—SGGW, Nowoursynowska 159, 02-776 Warsaw, Poland
*
Author to whom correspondence should be addressed.
Water 2020, 12(3), 895; https://doi.org/10.3390/w12030895
Submission received: 13 February 2020
/
Revised: 18 March 2020
/
Accepted: 19 March 2020
/
Published: 22 March 2020
(This article belongs to the Section Hydraulics and Hydrodynamics)
Abstract
:The paper presents results of investigation of the local resistance coefficient ζ in welded polypropylene T-junctions with the internal diameter 13.2 mm. The investigations were performed on an independently constructed test rig. The scope of investigations encompassed the T-junctions, which were (1) properly warmed up and properly pressed, (2) poorly warmed up and poorly pressed, or (3) excessively warmed up and excessively pressed. The local resistance coefficients ζ determined by measurements according to the standard PN-EN 1267:2012(Designation of the Polish Standard) were compared to those determined with use of the nomograms recommended for designing water supply systems and installations. Real values of the coefficients ζ, obtained in measurements were significantly higher than those read from the nomograms. The local resistance coefficients ζ in welded polypropylene T-junctions depend on water flow velocity and the manufacturing precision of a T-junction joint.
1. Introduction
Fittings, including bends, elbows, T-junctions, diffusers, confusors, and cutting valves, are essential elements of any hydraulic system. The liquid flow through fittings connecting pipelines is more complicated than that through straight sections [1]. The pressure losses associated with the fittings are caused by disturbances in liquid flow which occur during changes in its direction or sudden or gradual changes in the cross-section or shape of the pipeline. The prediction of the pressure losses in fittings is much more uncertain than in the case of straight pipes [2], and the flow mechanisms of liquid inside such fittings is not clearly defined.
Pipeline fittings are the most important part of the system and installation of a water supply, heat distribution, or industrial network, as they allow flexibility in the route of the pipeline. Investigations of water flow through fittings have tremendous significance in understanding and improving their flow capacity and minimizing hydraulic losses. It is well known that viscous incompressible liquids [3] and compressible gases [4] moving through fittings are characterized by flow splitting [5,6,7], occurrence of secondary flows [1,8,9,10], and Dean vortexes, and, in general, by high instability [8,9,11,12].
T-junction fittings have particularly wide application not only in the systems and installations of water supply and heat distribution networks, but also in industrial installations, where they can be used for mixing two or more fluids. In convergent or divergent T-junctions, turbulent flows occur and effectively mix various fluids flowing through the T-junction [13]. T-junction systems are applied in industry to mix air and fuel in gas turbines or combustion engines [11,14], to mix hot and cold water in the pipelines in nuclear power plants [8], or to mix various chemical compounds for which the mixing quality is an important factor affecting the chemical reaction rate. Multiphase (air–water) flow structures through a T-junction have also been investigated [15,16], and the blood flow through T-junctions with variously sloped arms has been modeled [9,17,18,19].
The fittings applied in the systems and installations of water supply and heat distribution networks should be tight at joints, not corrode, be resistant against mechanical and chemical action of liquids, and present the lowest possible hydraulic resistance (hydraulic losses). Nowadays, fittings made of various materials are accessible (steel, cast iron, copper, brass, poly(vinyl chloride)—PVC, polybutylene—PB, polyethylene—PE, polypropylene—PP), and they are joined with pipelines with use of various technologies. There are few items in the scientific and technical literature concerning problems connected to the determination of values of the local resistance coefficient ζ for the fittings during Newtonian liquid flow [2,20,21,22,23,24,25,26].
At present, researchers deal mainly with the mathematical modeling of flow structures in various liquids in elbows with various ratios of curvature radius to diameter (R/D), as well as in T-junctions, diffusers, and confusors [4,22,24]. To make models of flow structures in Newtonian and non-Newtonian liquids, CFD (computational fluid dynamics) software is used, i.e., the so-called computational mechanics of fluids [1,12,15,16,22,27,28]. The mathematical modeling of such flow structures is very hard because the multiphase flows depend on numerous factors and variables [2,5,6,29,30].
Csizmadia and Hős [22] presented results of investigations of local resistance coefficients in diffusers with angles 7.5°–40°, and in elbows with a curvature radius to diameter ratio R/D = 1–10. The investigations were performed with the use of water and two non-Newtonian liquids. The values of local resistance coefficients, determined experimentally in the diffusers and elbows, were compared to the results of calculations done with CFD software. It was stated that the values of local resistance coefficients calculated in the CFD were lower than those obtained in the experiment. On this basis, the researchers suggested that the lower values of local resistance coefficients calculated in the software probably resulted from the assumption that the internal surfaces of the walls of the diffusers and elbows were hydraulically smooth, which was, in fact, not the case.
Liu and Duan [31] presented results of investigations of local resistance coefficients and hydraulic losses in elbows bent with a 90° angle as well as in conical diffusers and edge reducers. The scope of the investigations encompassed elbows with the diameters D = 25 mm, 40 mm, and 50 mm and the curvature radius to diameter ratios R/D = 1.5, 2.0, 4.0, and 6.0; conical diffusers with the inlet diameter D1 = 50 mm and outlet diameter D2 = 25 mm and cone convergence angles θ = 3°, 5°, 10°, 20°, and 90°; and two edge reducers with the inlet and outlet diameters D1/D2 = 50 mm/25 mm and D1/D2 = 68 mm/25 mm. The investigations were performed with use of a non-Newton liquid which was a coal–water mix with a mass concentration 57%–62%. The authors proved that during the flow of the coal–water mix with a given mass concentration through the tested fittings, the parameters of these fittings, i.e., R/D, θ, and β, had an insignificant impact on the values of the local resistance coefficient. As the Reynolds number increased to 1000 and the mass concentration of the coal–water mix increased, the values of the local resistance coefficient of the tested fittings decreased, whereas for higher values of the Reynolds number (Re > 1000), they presented various behaviors (trends) due to particular rheological properties of the coal–water mix, wherein shear stresses increased in line with the rise in the Reynolds number.
Costa et al. [32] compared results of investigations of the local resistance coefficient in T-junctions with a 90° angle during water flow. The authors conducted tests for two types of T-junction. The first type had a joint with sharp edges, and the second one with rounded edges. The researchers proved that the T-junction joint with rounded edges, when compared to the T-junction joint with sharp edges, reduced the value of the local resistance coefficient by 10%–20% and increased the turbulence in the water flow.
Li et al. [24] presented the results of investigations into the reduction of hydraulic resistance in joined elbows and T-junctions by application of wedge elements at the internal surface of the wall beyond the bend and T-junction outlet, with the aim to change the flow structure in the liquid stream and suppress the Dean vortexes that occur there, and to increase the hydraulic resistance. The authors investigated the effect of reduction of the hydraulic resistance in the joined elbows and T-junctions with use of experimental and numerical methods, by determining values of the local resistance coefficient ζ of the joined fittings. The results showed that wedge elements applied with an appropriate height indeed reduced the hydraulic resistance. The researchers proved that the height of the wedge element used to reduce the hydraulic resistance in joined elbows and T-junctions should not exceed 1/4 of the internal diameter of the pipeline.
In aiming to calculate installations of water supply and heat distribution networks, it is necessary to know a numerical value of the local resistance coefficient ζ, which can be determined with reference to the available literature [2,21,22,23,24,25,26,31,33,34,35,36]. Depending on which literature sources are used during selection of the local resistance coefficient value of fittings in calculations of hydraulic losses in installations of water supply and heat distribution networks, various results can be obtained. The increase of hydraulic resistance in a given fitting is affected by the internal surface roughness of its wall, bending angle, diameter, and type of joining with the pipeline. Accordingly, the installations of water supply and heat distribution networks where high hydraulic losses occur are characterized by higher investment and exploitation costs, as they require pumps with higher delivery head which, in turn, must be equipped with more powerful engines.
Currently, there is no information in the scientific and technical literature explaining how to calculate the values of the local resistance coefficient ζ in welded polypropylene T-junctions for design purposes. The present paper includes a comparative analysis of the results of investigations into the values of the local resistance coefficient ζ in welded polypropylene T-junctions, which were obtained experimentally on the test rig and calculated according to the directives [26]. It also proposes equations and a nomogram for calculation of this coefficient for design purposes. The objects of the investigations were the welded polypropylene T-junctions with an internal diameter of 13.2 mm, which were (1) properly warmed up and properly pressed, (2) poorly warmed up and poorly pressed, or (3) excessively warmed up and excessively pressed.
2. Materials and Methods
2.1. Description of Test Rig
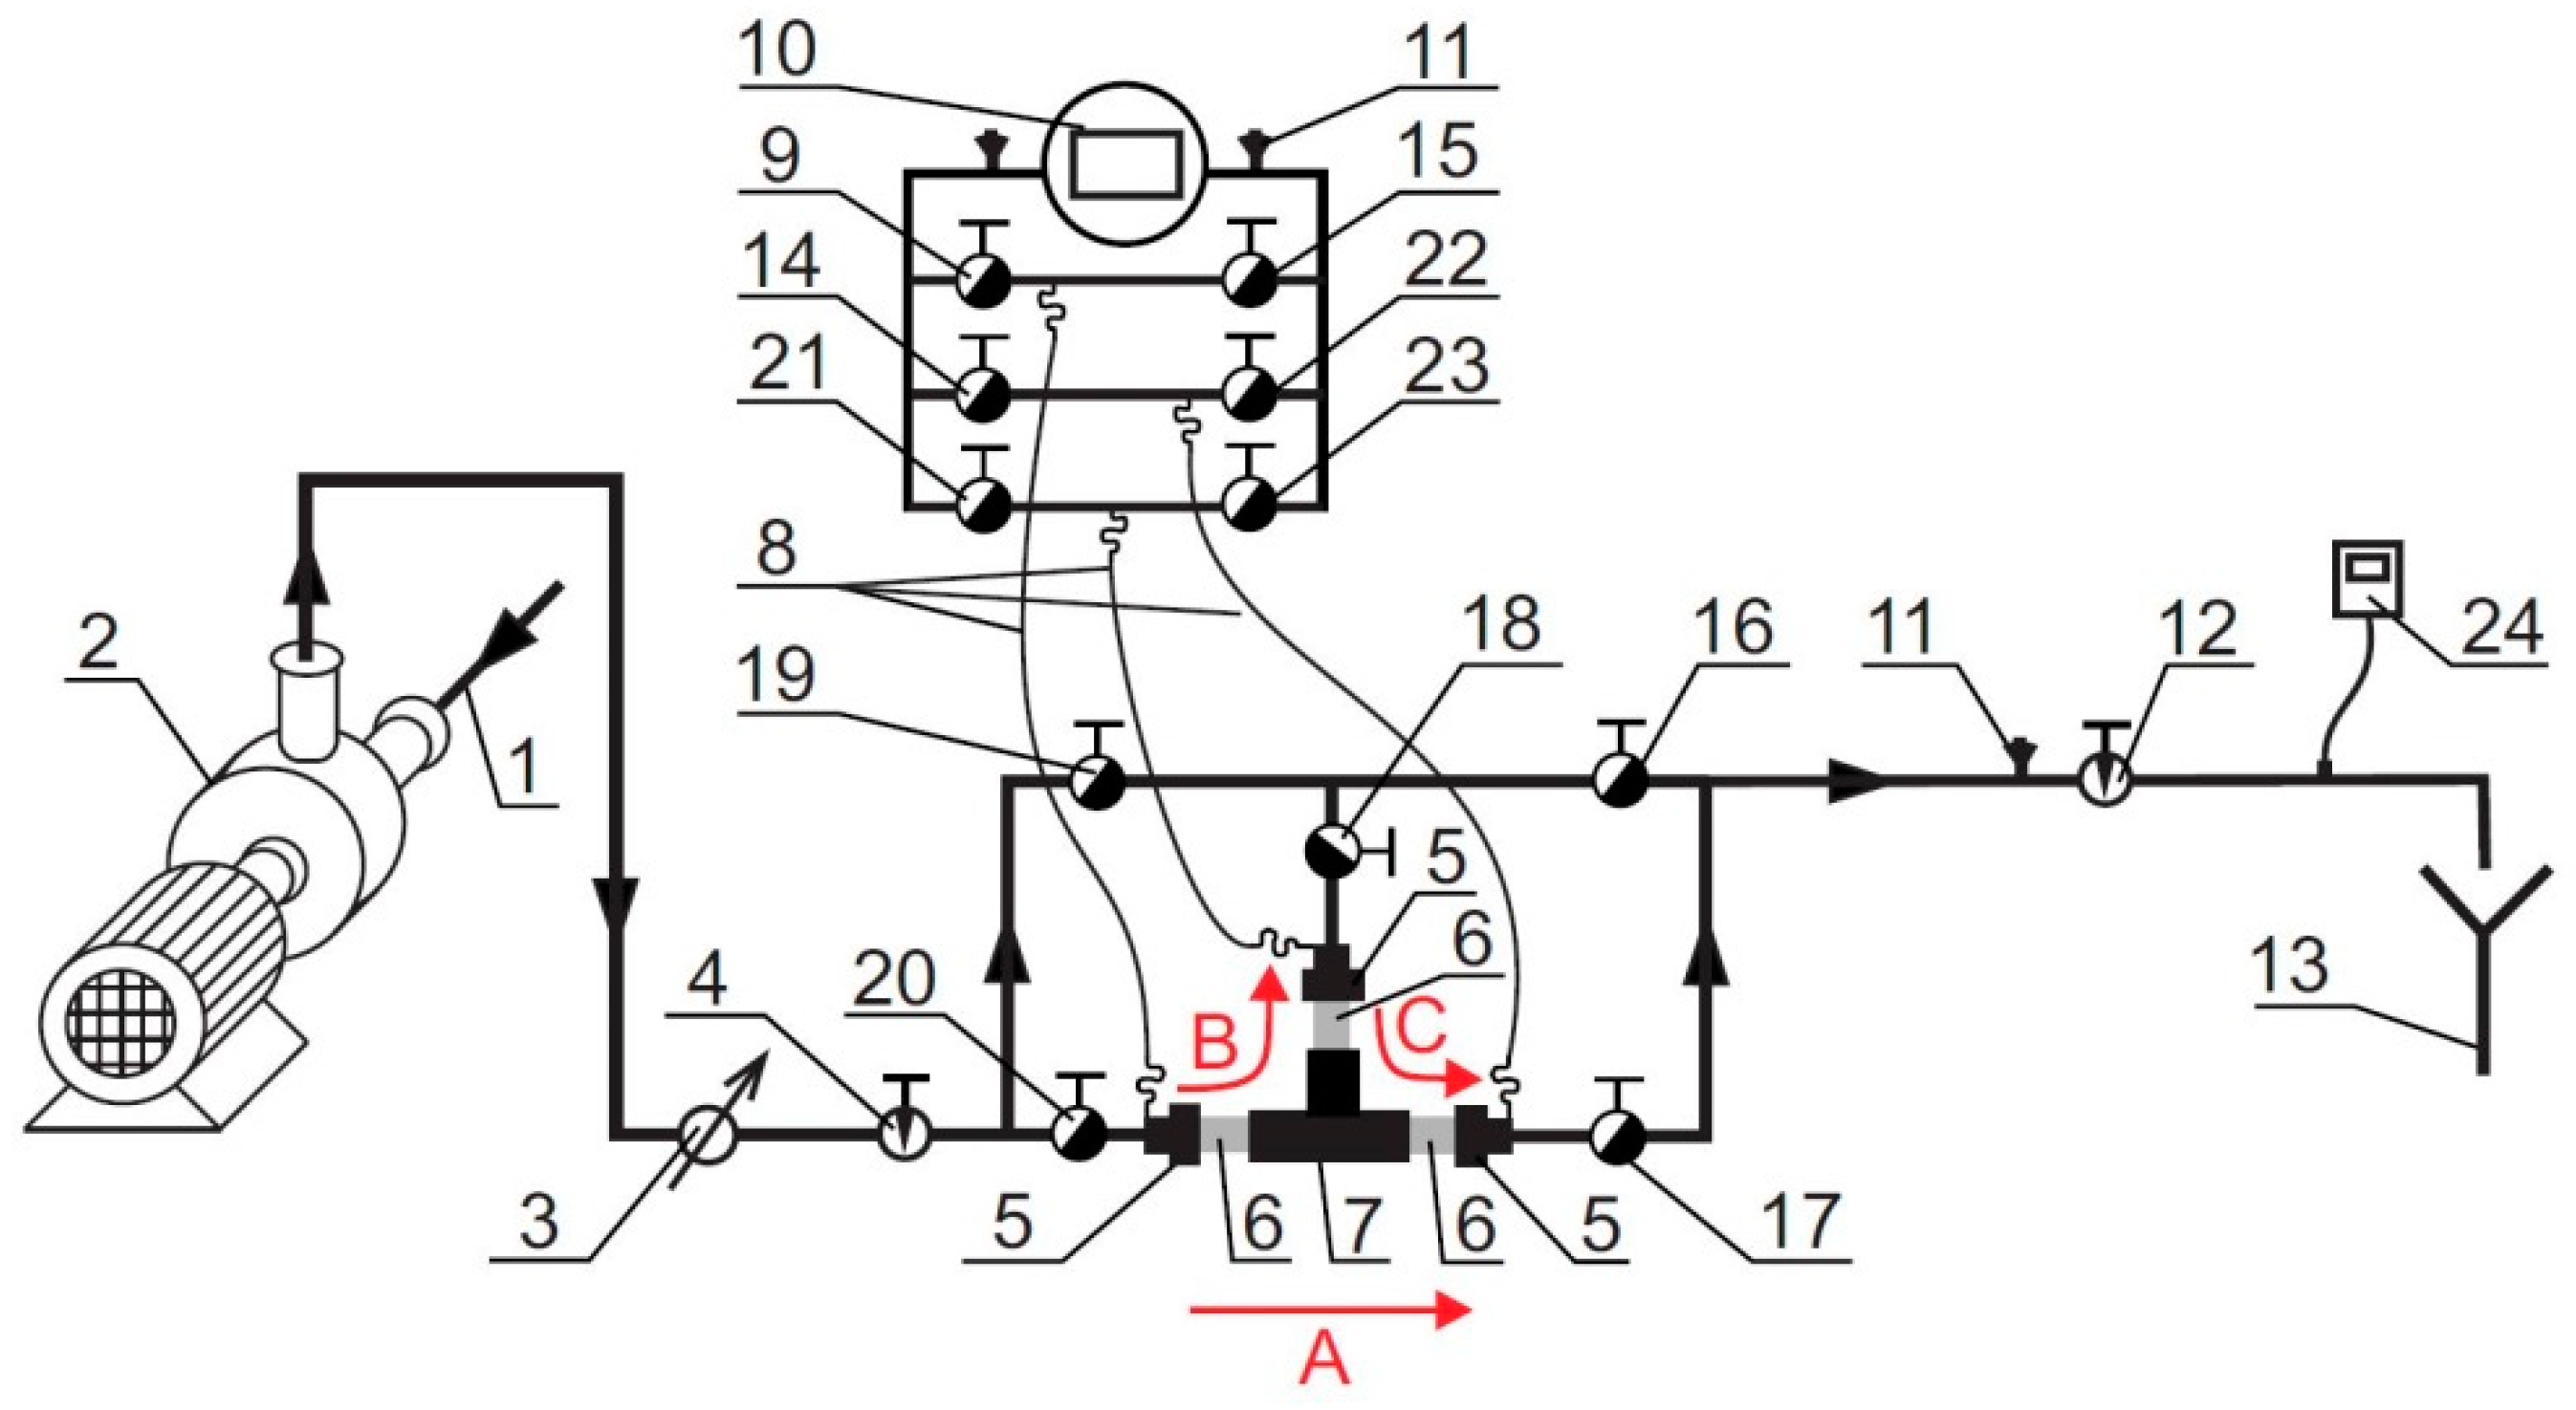
To investigate the hydraulic resistance of welded polypropylene T-junctions and to determine real values of the local resistance coefficient ζ, a laboratory test rig was built; its scheme is presented in Figure 1. A pipeline (1) delivered water to a pump (2), which forced its flow through the rig. Beyond the pump, a PROMAG 33FT40 electromagnetic water flow meter (3) of Endress+Hauser (Switzerland) was mounted to measure flowing water quantity as well as a needle valve (4) cutting the water inflow off while the T-junctions were being changed. The measurement range of the electromagnetic water flow meter was 0.0–106 dm3⋅min−1. At the inlet and outlet of the T-junction (7) were mounted impulse hoses (8) connected to ball valves (9). The hydraulic resistance of the individual T-junctions was measured using a DELTABAR 230 piezoelectric pressure difference meter (10) of Endress+Hauser with a measurement range of 0.0–500 mbar. The T-junctions were mounted at the test rig in the vertical position with use of a screwed joint (5) and a short polypropylene pipe section (6). At the highest points of the measurement system, vents (11) were mounted. Values of water flow rate were controlled by a needle valve (12), beyond which an electronic resistance thermometer (24) was mounted to measure water temperature. The rig operated in an open system and the water flowing out was carried into the sewerage system (13).
The measurement errors of the applied electromagnetic flow meter and piezoelectric difference pressure meter were lower than 1%, and the output current signal fell into the range of 4 to 20 mA. The measurement accuracy of the applied electronic resistance thermometer was ±1 °C and its measurement resolution was −0.1 °C.
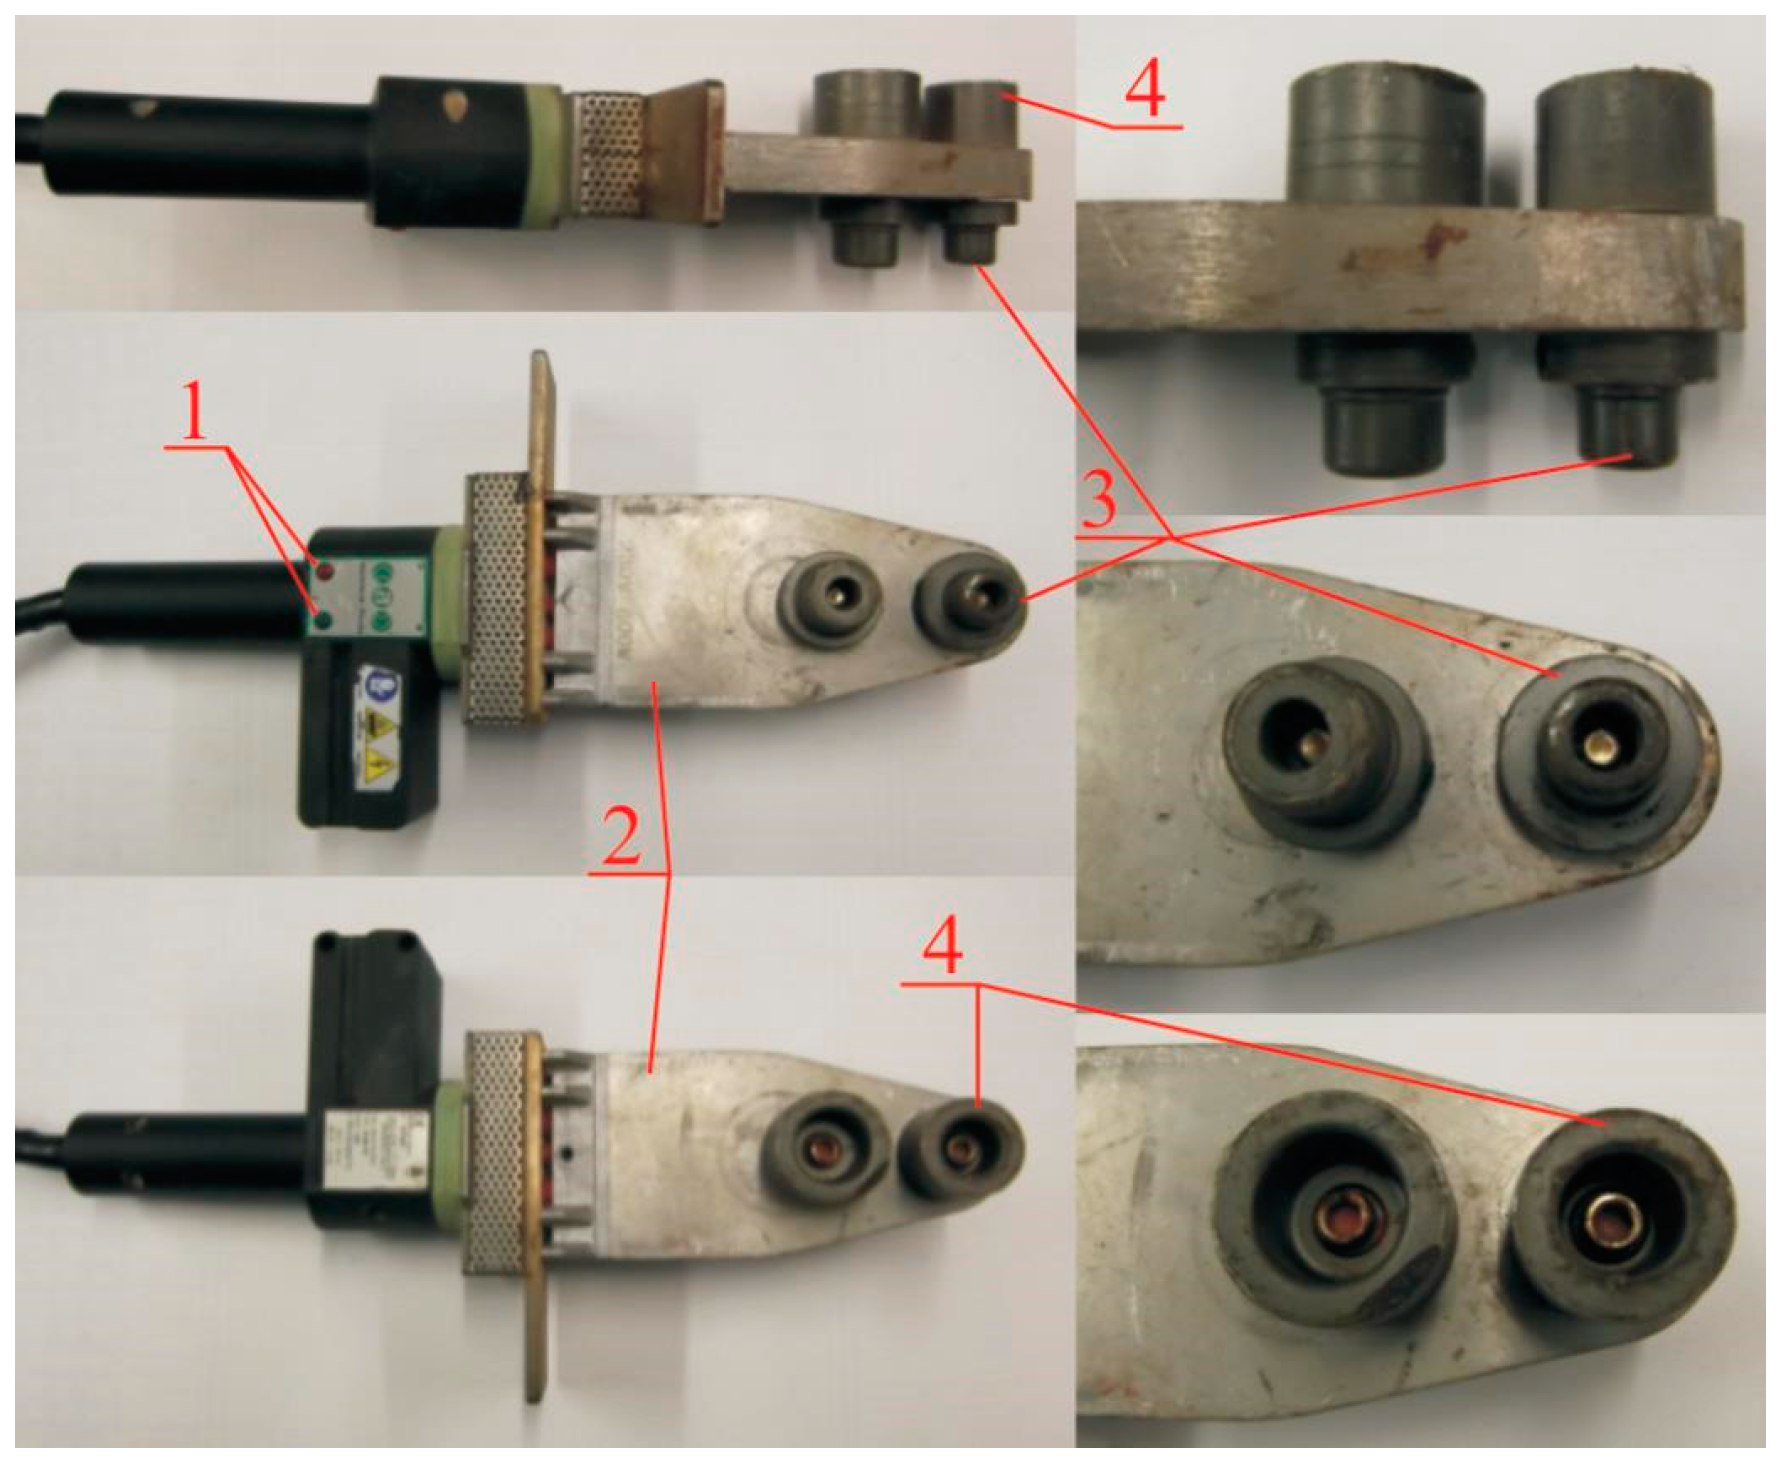
The polypropylene T-junctions were welded with an Aquatherm polyfusion electric welder (Figure 2).
2.2. Methodology of Investigations
Measurements of the hydraulic resistance of the individual T-junctions were performed in the following way (Figure 1). As the given T-junction (7) had been mounted in a horizontal position, before the start of each measurement series, it was checked whether all valves on the test rig were closed. The measurements of the hydraulic resistance were performed separately (Figure 1) for (A) through-run water flow, (B) divergent water flow, and (C) convergent water flow. As each measurement series started, Valves 4 and 12 were opened, moreover forthrough-run water flow (A) valves 20 and 17, for divergent water flow (B) valves 20, 18, and 16, and for convergent water flow (C) valves 19, 18, 17 were also opened. Pump 2 was then turned on and the valves were opened on a distributor of the piezoelectric pressure difference meter (10), connected by the impulse hoses with the beginning and end of the tested T-junction; these valves were for Series A (through-run water flow), 9 and 22; for Series B (divergent water flow), 9 and 23; and for Series C (convergent water flow), 21 and 22. The impulse hoses (8) and the piezoelectric pressure difference meter (10), as well as the whole measurement set, were then vented with use of the vents (11). As the air bubbles were removed from the measurement set, the first assumed value of the water flow rate q was set on the electromagnetic water flow meter (3) with use of the needle valve (12). When the water flow conditions were stable, the pressure difference Δp from the piezoelectric meter (10) and the water temperature T from the electronic resistance thermometer (24) was read. Next, with use of the needle valve (12), the next value of the water flow rate q was set and, when the water flow conditions were stable, subsequent readings of Δp and T were made. As each measurement series was finished, the pump (2) was turned off.
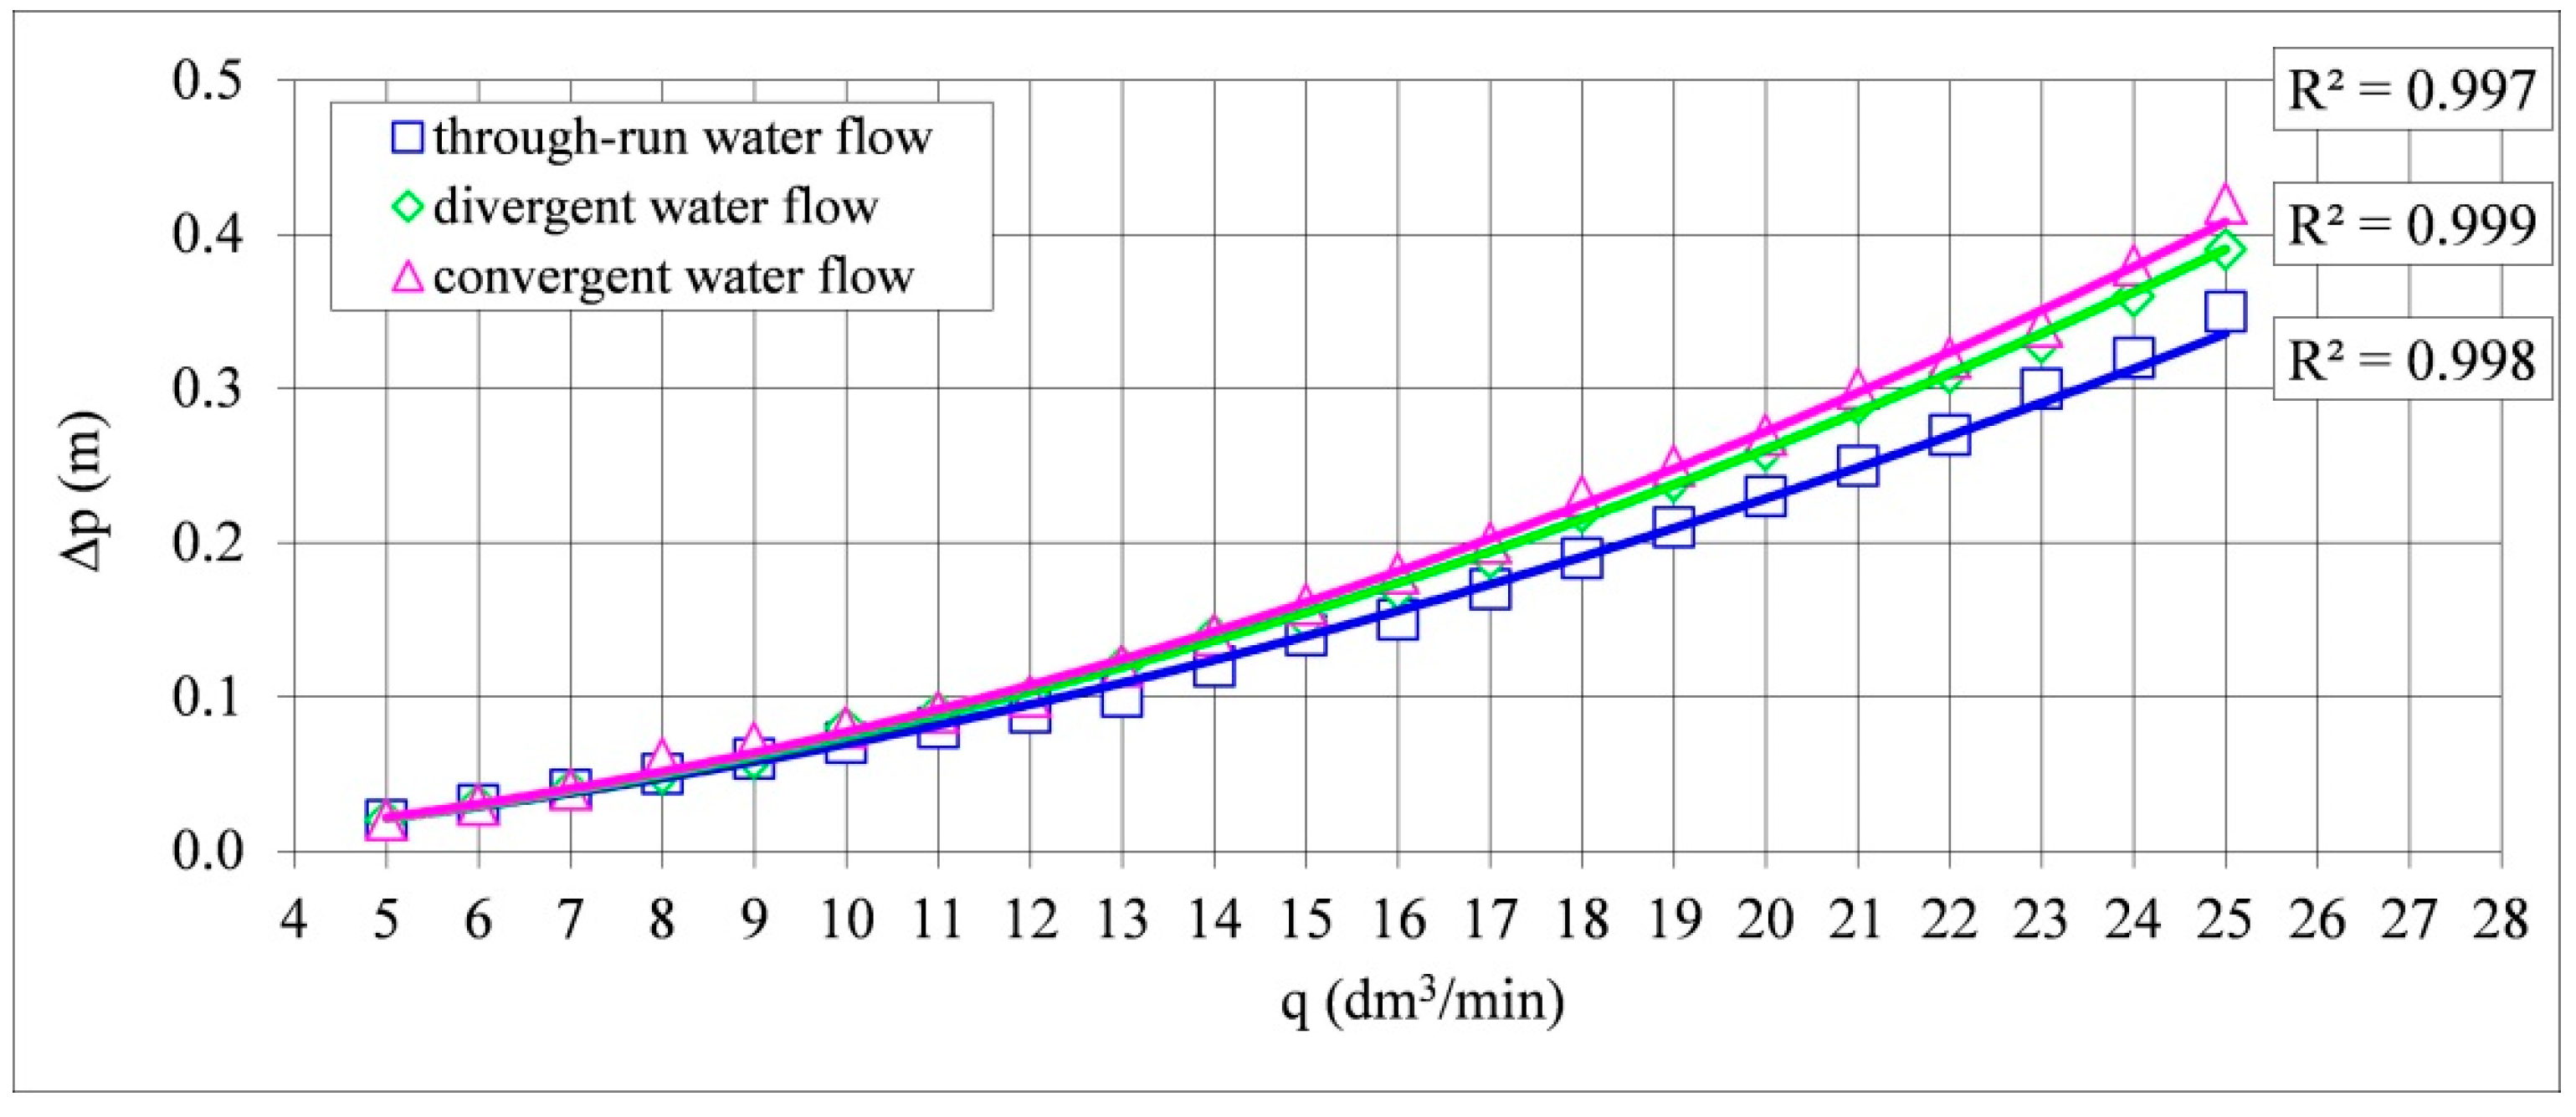
During the measurement of the hydraulic resistance of the T-junctions, hydraulic resistance occurred in short polypropylene pipe sections and in the screwed joints joining the tested T-junctions with the impulse endings (Figure 1). Due to this fact, additional hydraulic resistance measurements were made for the unit consisting of the screwed joints and the pipe section mounted between them, constituting the sum of the pipe sections used for the investigation of a given T-junction. The obtained values of the hydraulic resistance of the pipes and screwed joints were subtracted from the measured hydraulic resistance of the T-junctions, yielding the real hydraulic resistance occurring in the tested T-junctions.
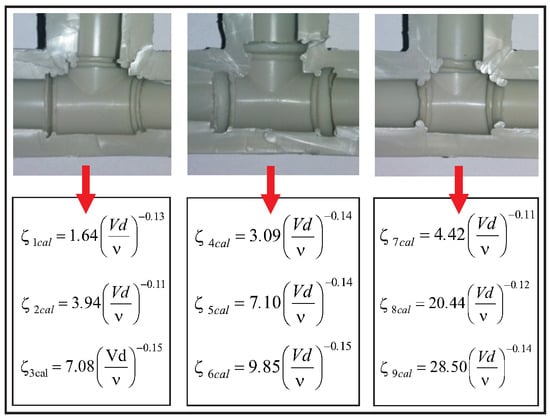
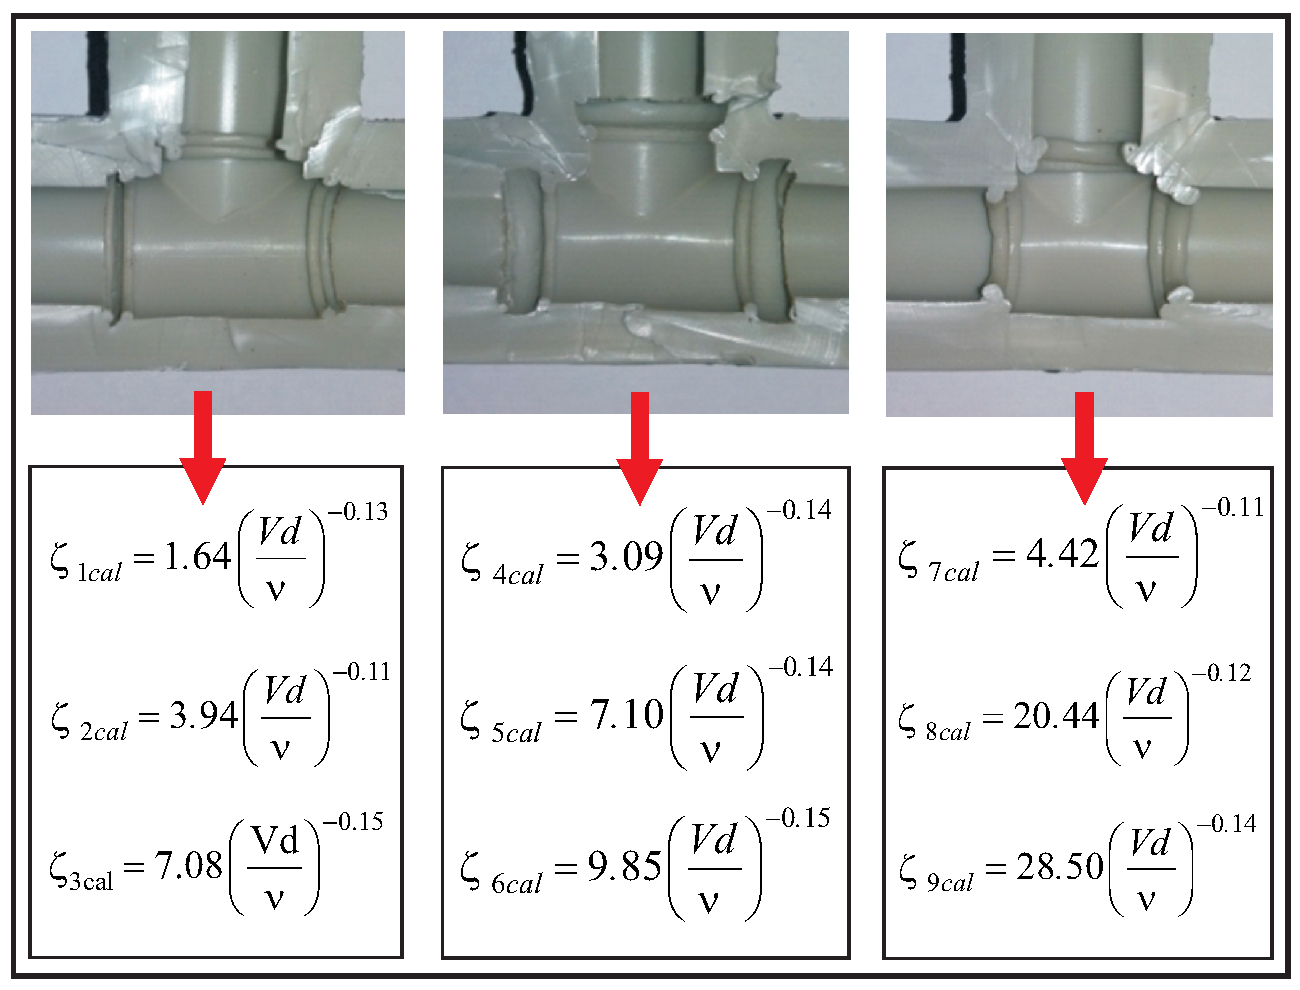
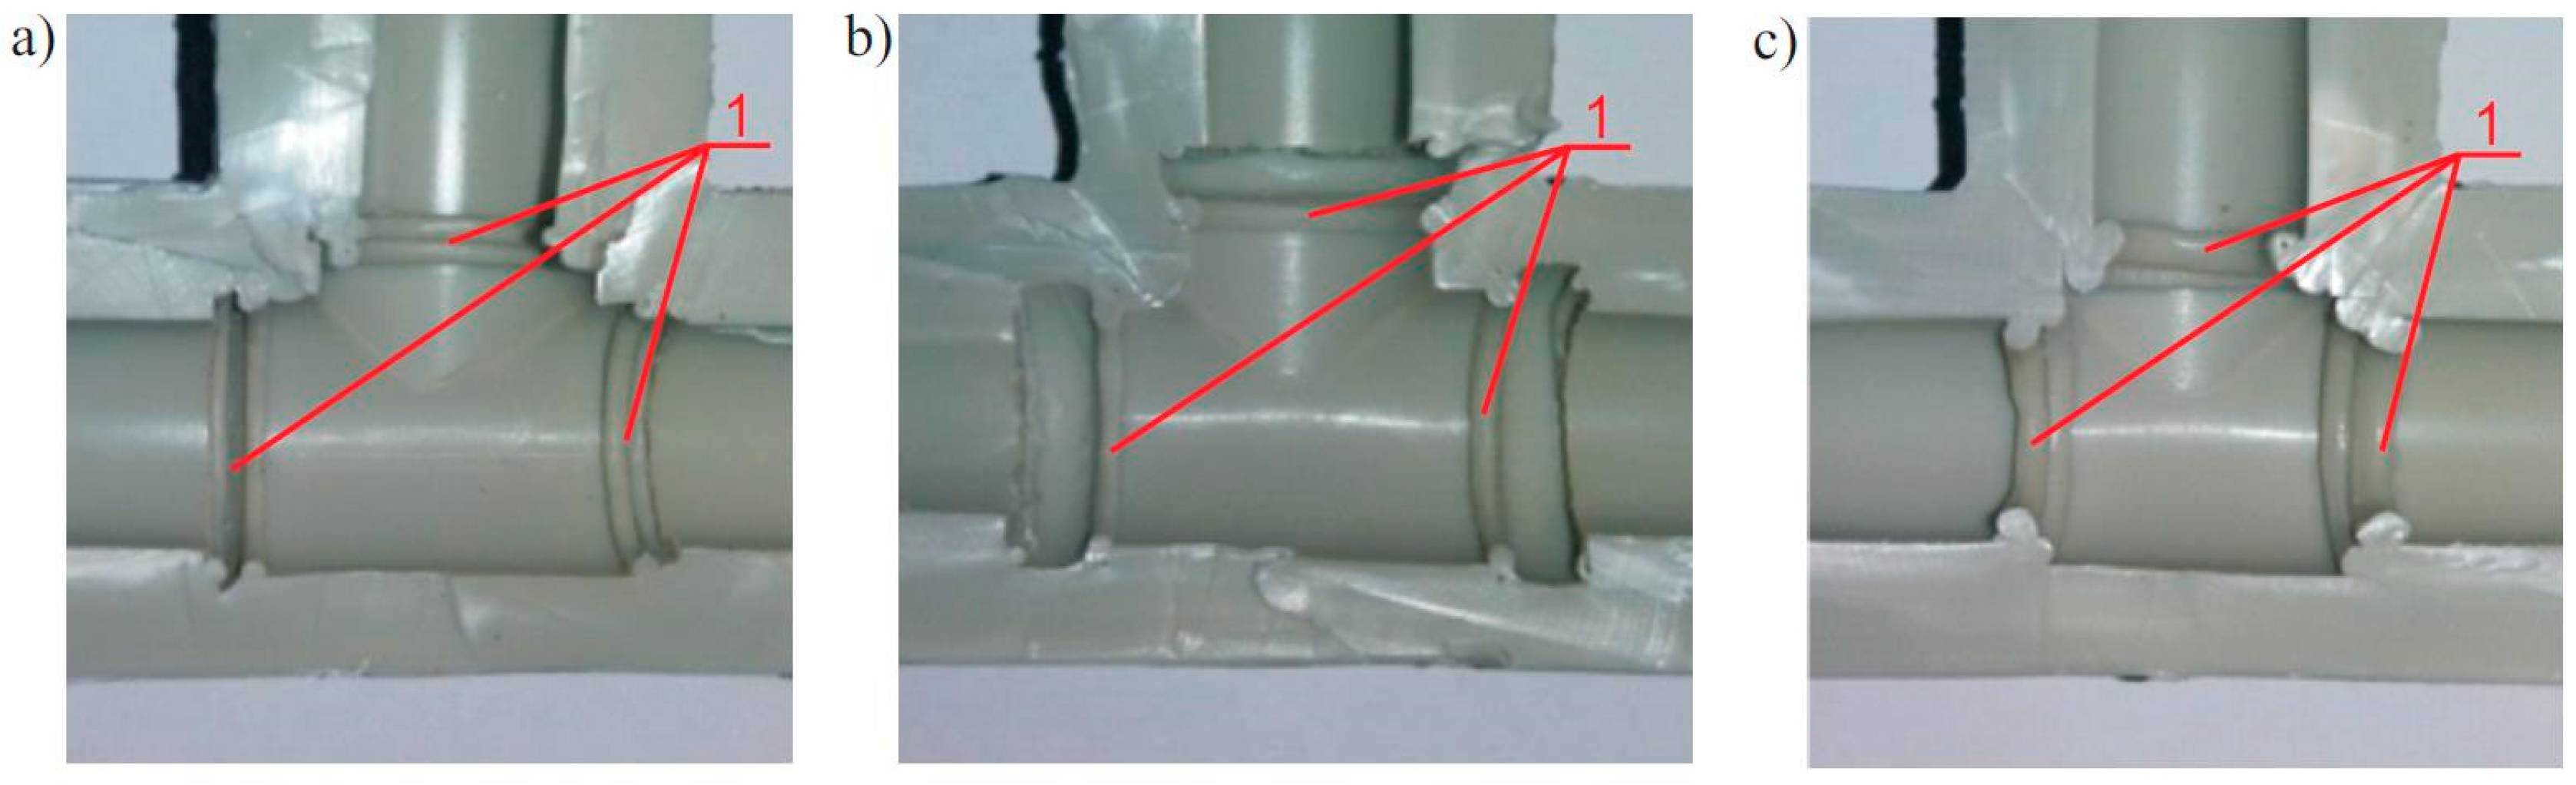
The measurements of hydraulic resistance were made for the assumed values of the water flow rate q, changing every 1 dm3⋅min−1 within the range 5–25 dm3⋅min−1. The water temperature T during the measurements was equal to 12 °C. The tests were conducted using 30 randomly welded polypropylene T-junctions with the internal diameter 13.2 mm, divided into three groups according to the welding quality. There were 10 T-joints in each group (Figure 3). The first group contained properly warmed up and properly pressed T-junctions (Figure 3a), the second one contained poorly warmed up and poorly pressed T-junctions (Figure 3b), and the third one contained excessively warmed up and excessively pressed T-junctions (Figure 3c).
During the measurements on the electromagnetic flow meter, small pulsations of water flow q were observed, which were evoked by the pump operation and also affected the values of the pressure difference Δp being registered by the piezoelectric pressure difference meter (10). To eliminate random measurement errors, three measurement series were made for each T-junction and the results were averaged. In this way, 10 averaged measurement series were obtained for each T-junction group.
The values of the local hydraulic resistance ζ of the welded polypropylene T-junctions were determined from the experimental tests via the following formulas [37].
where ζ is the local resistance coefficient, q is the water flow rate in m3⋅s−1, g is the gravitational acceleration in m⋅s2, Δp is the pressure difference in Pa, V is the water flow velocity in m⋅s−1, ρ is the water mass density in kg⋅m−3, d is the internal diameter of the T-junction in mm.
3. Results and Discussion
Analysis of the individual T-junctions (Figure 3) showed that their warming up and pressing to the pipe affected the local hydraulic resistance occurring during water flow. In case of the properly warmed up and properly pressed T-junction (Figure 3a), as a result of pressing the T-junction to the pipe, two adjoining small fashes developed inside of it at both ends. In case of the poorly warmed up and poorly pressed T-junction (Figure 3b), two small fashes developed as well; however, they did not adjoin but were far apart. In case of the excessively warmed up and excessively pressed T-junction (Figure 3c), big fashes developed, which created a distinct orifice in the cross-section of the T-junction at both ends.
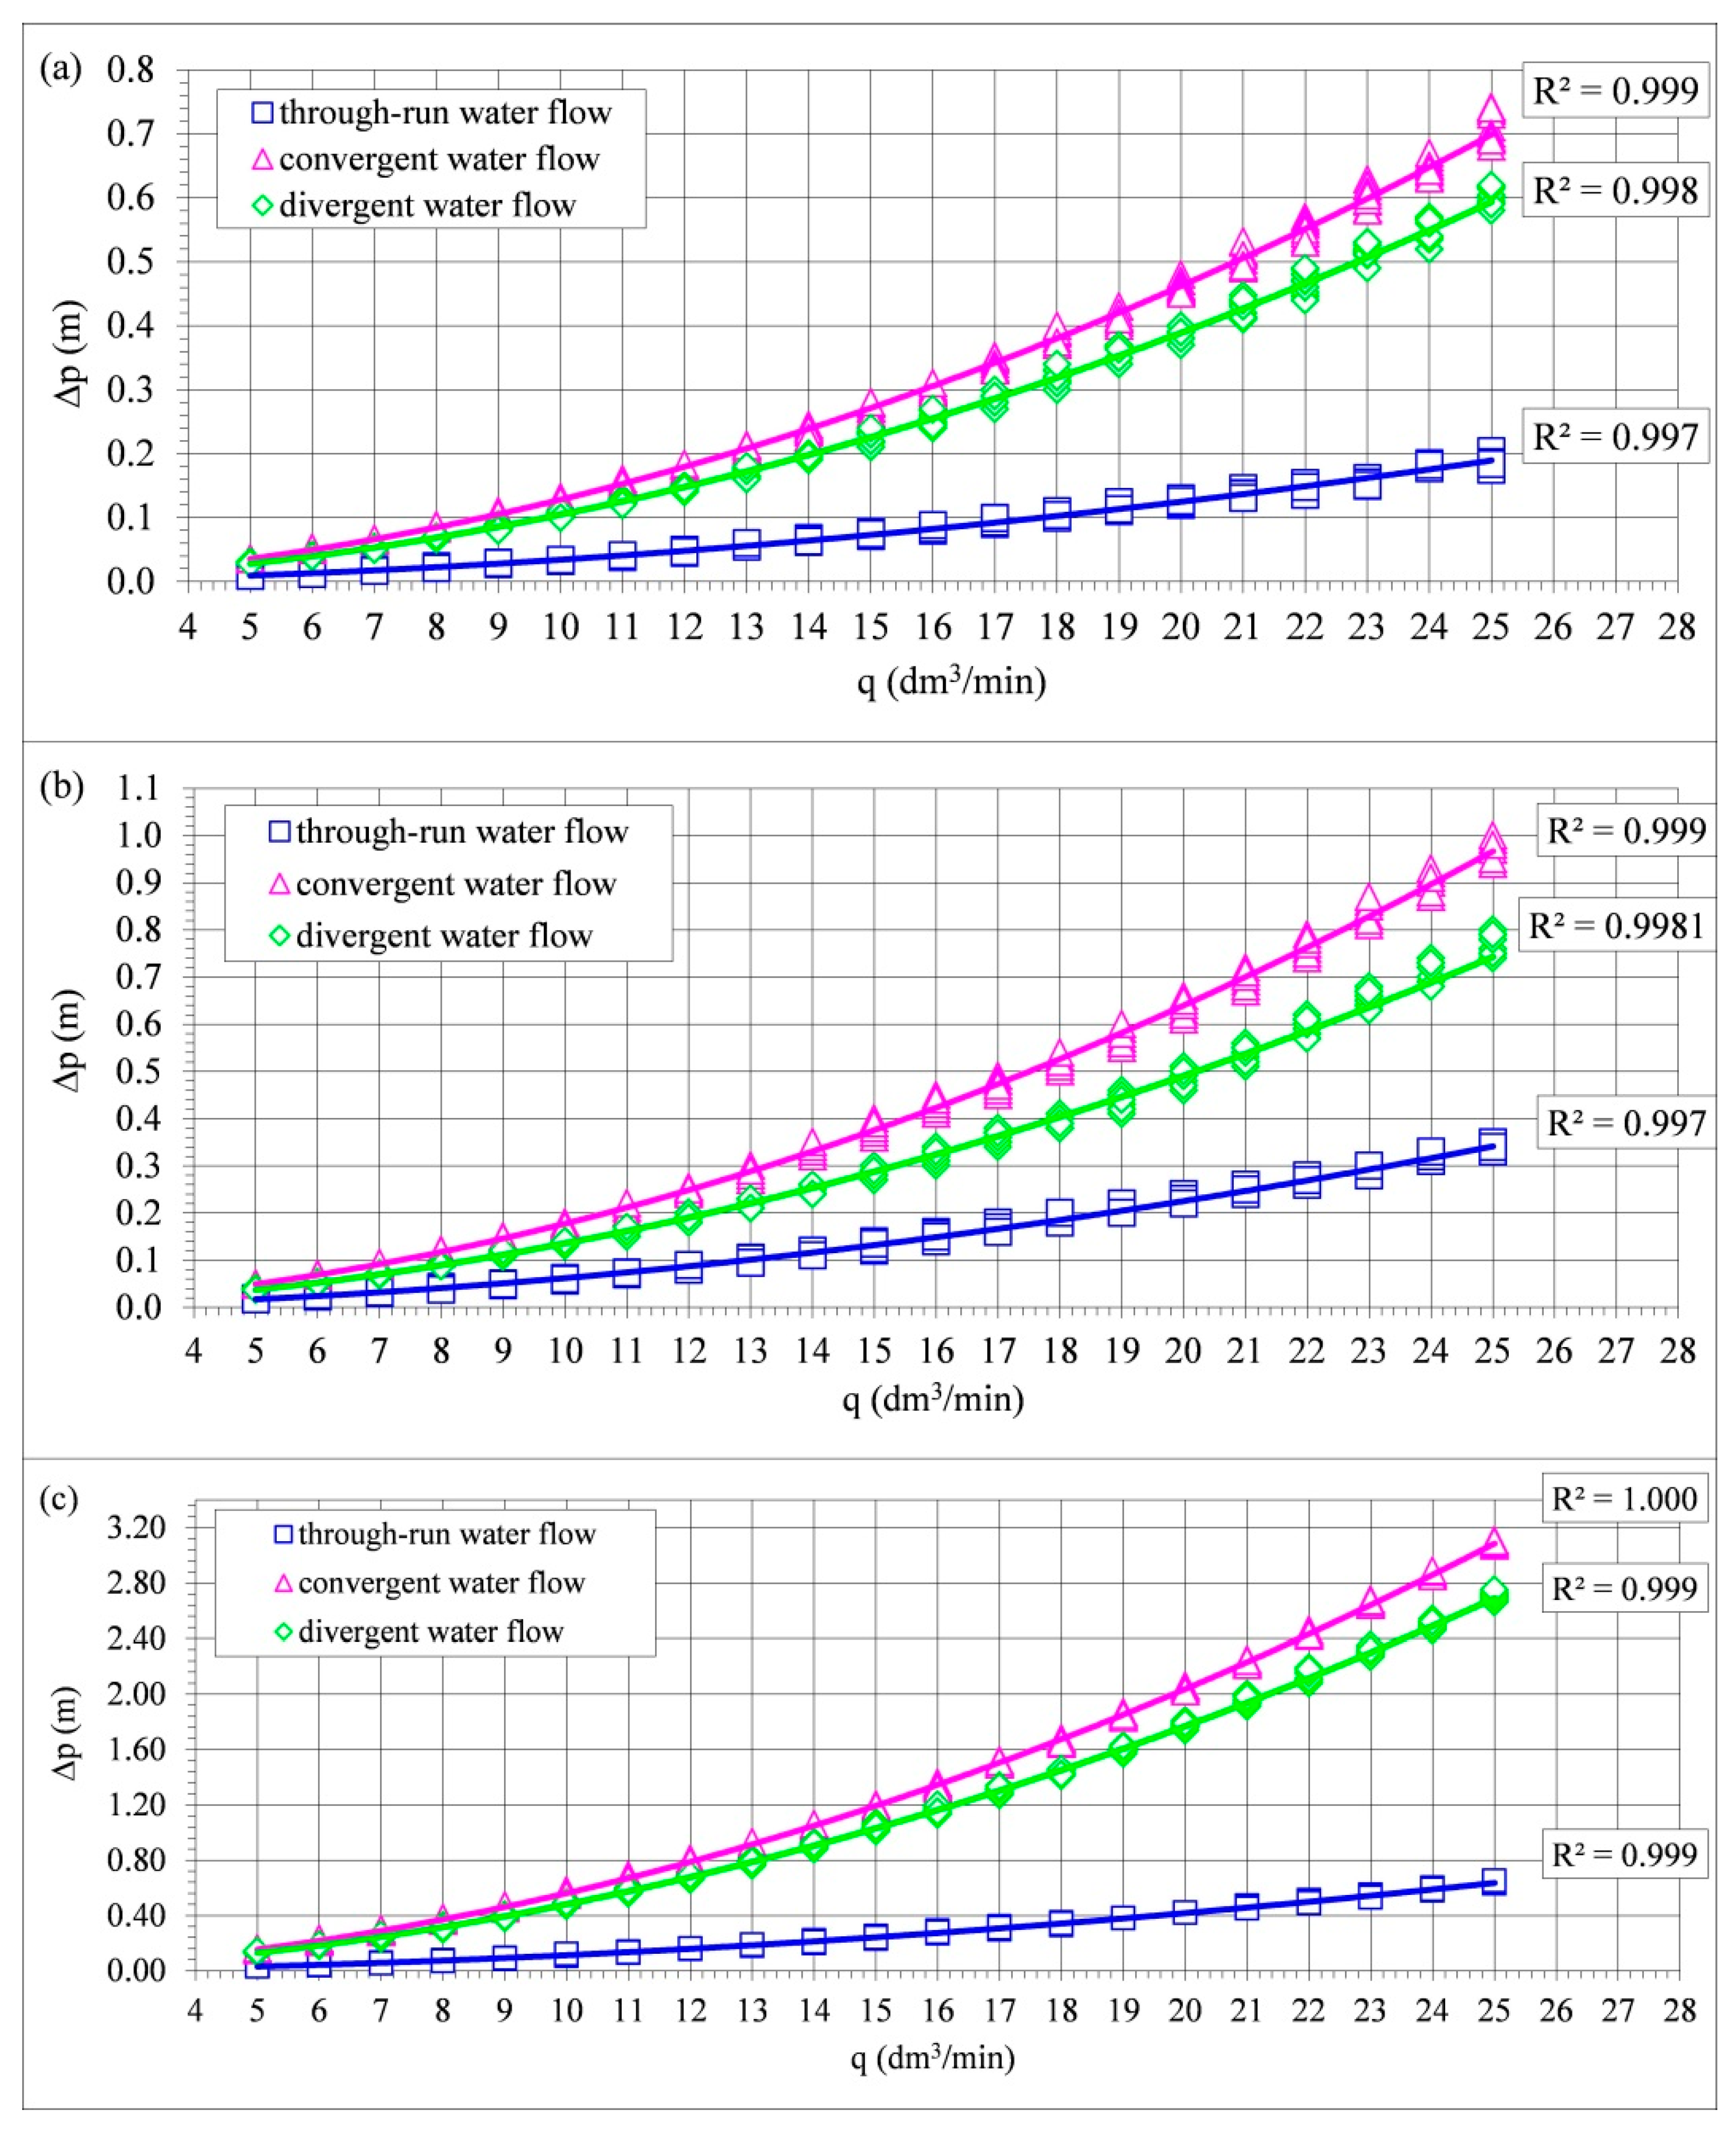
Figure 4 presents the results of measurements of the real pressure difference Δp, i.e., the hydraulic resistance of the T-junction after subtraction of the hydraulic resistances occurring in the screwed joints and the pipe section mounted between them, constituting the sum of the pipe sections used for the investigation of a given T-junction (Figure 5). During the measurements, the hydraulic resistance in the T-junctions increased along with the increase of the value of the water flow rate (Figure 4), which was a trend corresponding to the literature data [21,23,34,35,36]. The lowest hydraulic resistance during the water flow occurred in case of the properly warmed up and properly pressed T-junctions (Figure 3a), and the highest occurred in the case of the excessively warmed up and excessively pressed ones (Figure 3c). The trend (regression) of the measured values of Δp was of an exponential type and the values of the determination coefficient R2 from sample were over 0.98, indicating that the hydraulic resistance of the welded T-junctions depended at least 98% on the water flow rate and manufacturing precision of the T-junction joint, and only 2% on other factors like water temperature or gravitational acceleration.
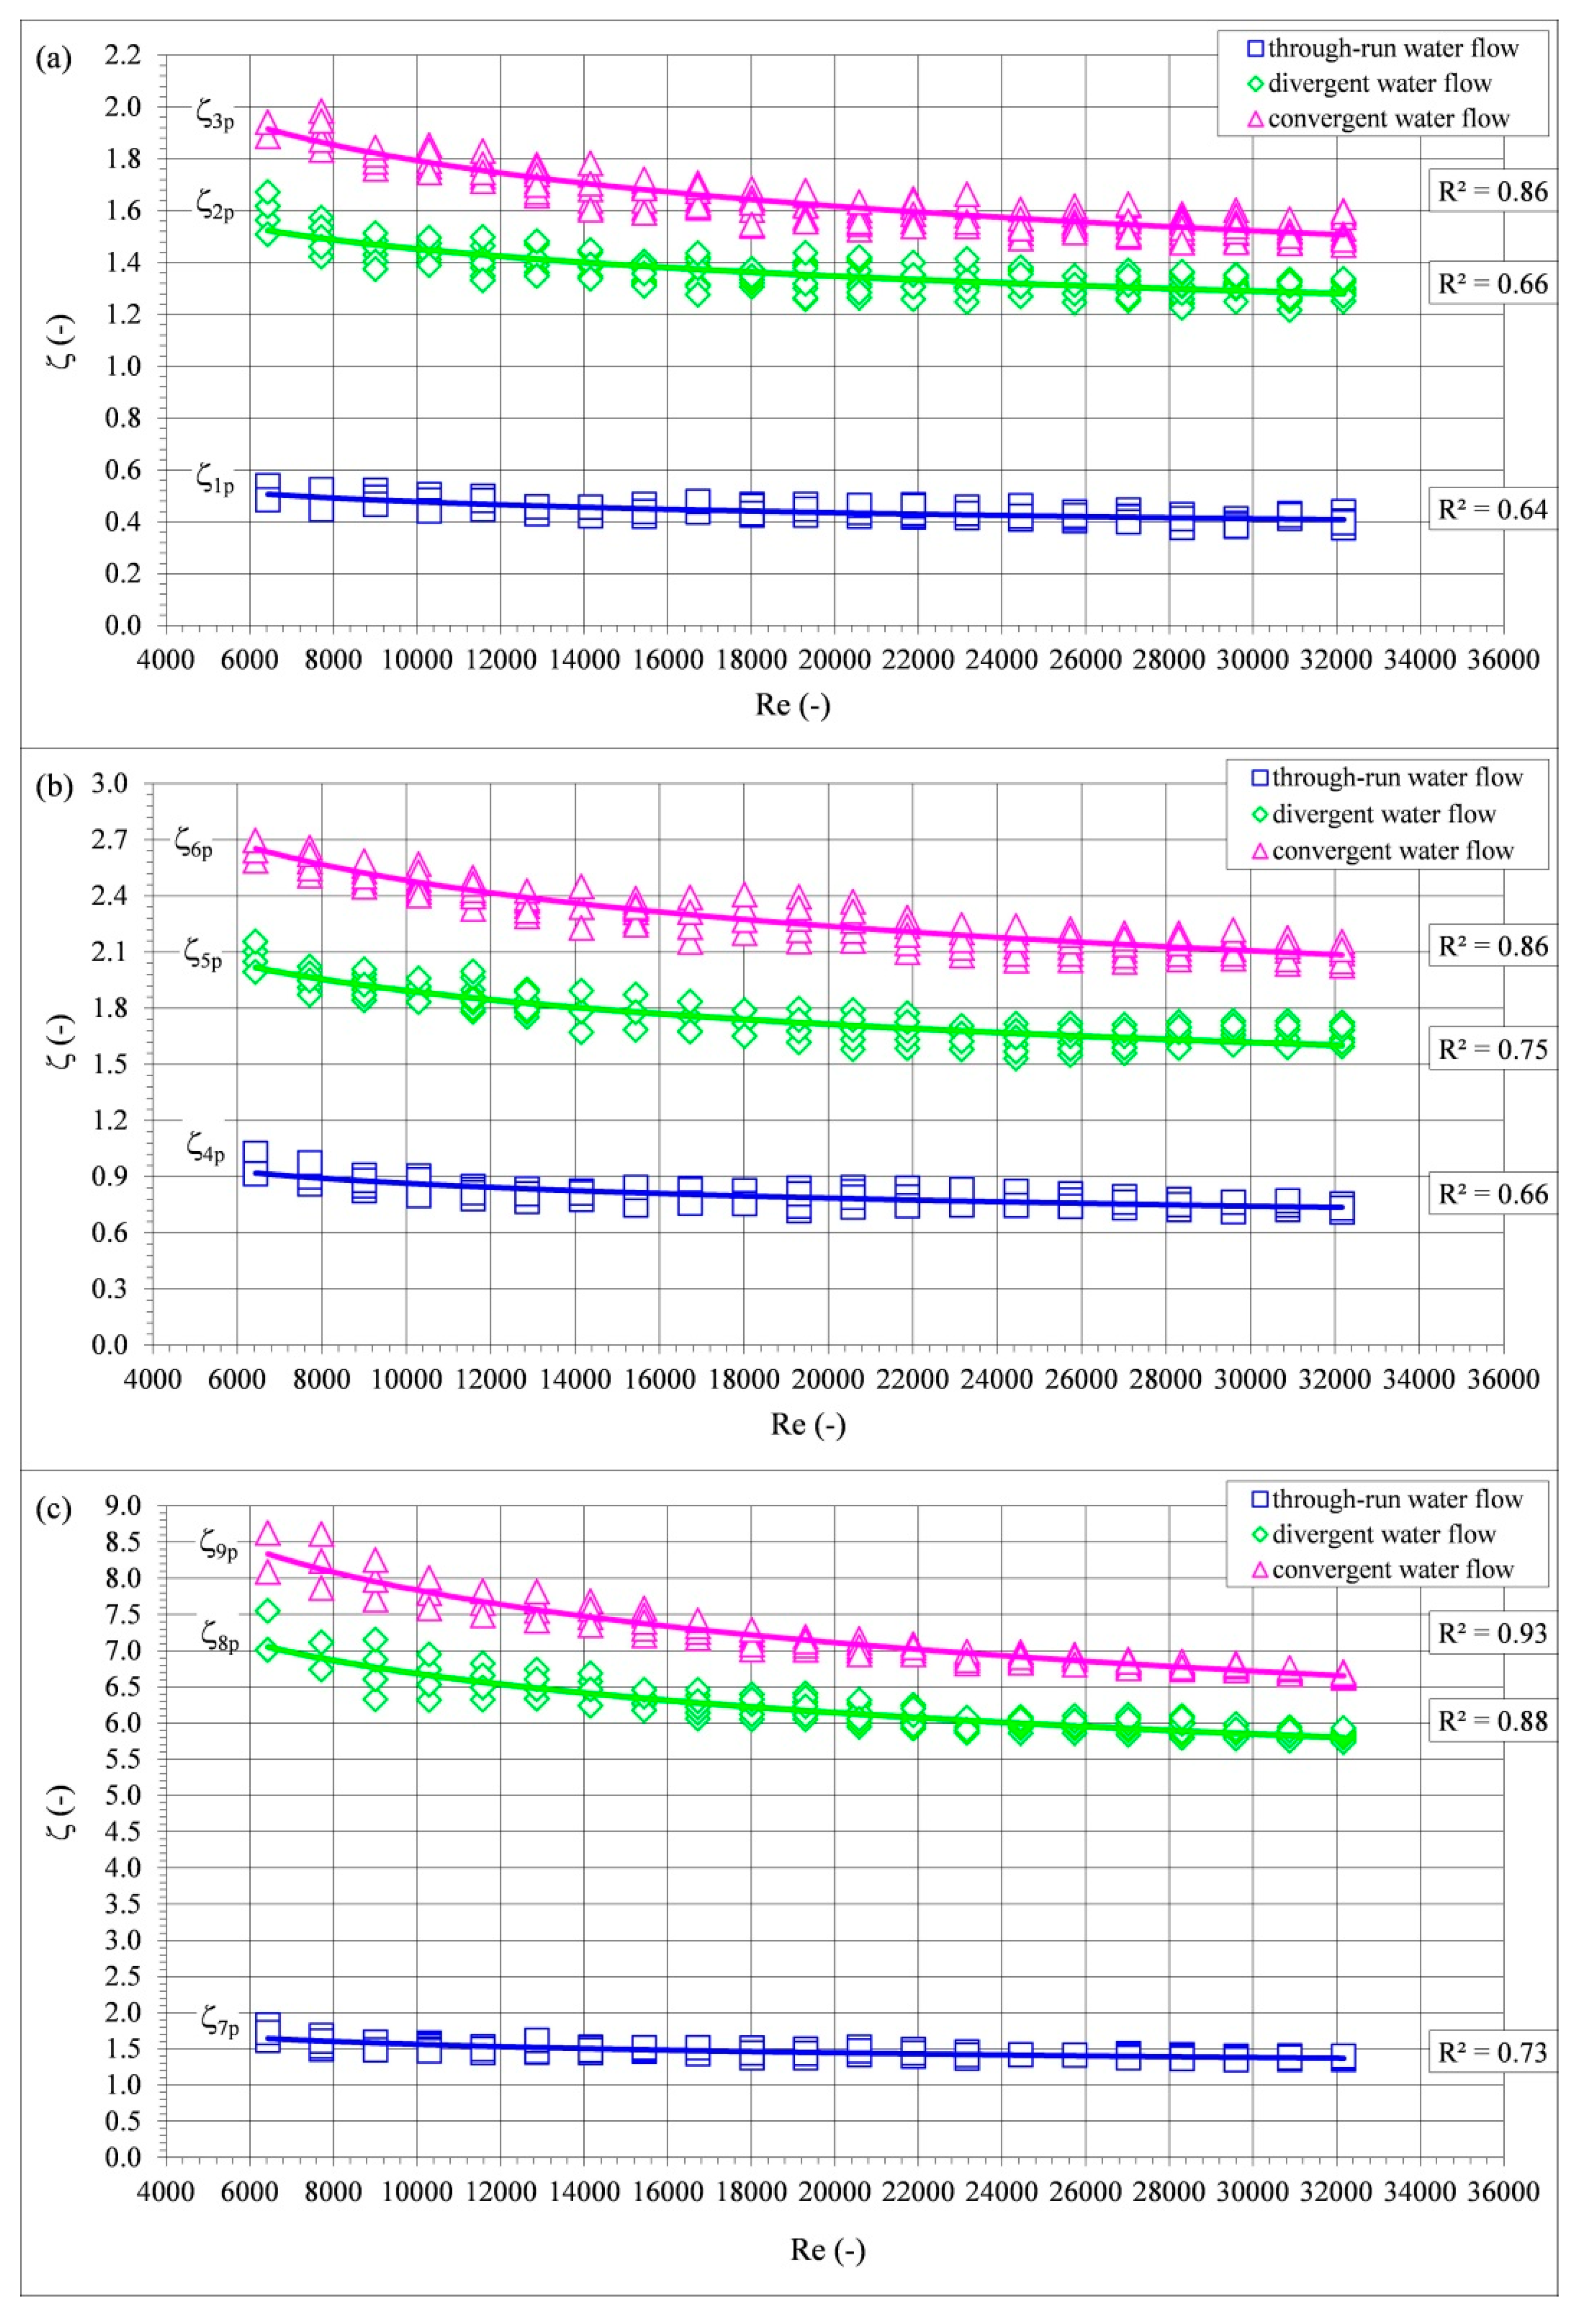
Using Equations (1) and (2) for assumed values of the water flow rate q and measured values of the real pressure difference Δp in the individual T-junctions (Figure 4), local resistance coefficients ζ1p, ζ2p, ζ3p, ζ4p, ζ5p, ζ6p, ζ7p, ζ8p, and ζ9p were determined and are presented in Figure 6 as a function of the Reynolds number. The Reynolds number depends on the water flow velocity, internal diameter of a T-junction, and the water kinematic viscosity coefficient; hence, it described the hydraulic flow conditions of water in the tested T-junctions very well. Both the local resistance coefficient and the Reynolds number are dimensionless quantities; thus, researchers who determine local resistance coefficients ζ in fittings analyze them as a function of the Reynolds number [2,4,11,12,21,22,23,24,25,26,31,32,33,34,35,36]. The values of the local resistance coefficients decreased along with the increase of the Reynolds number (Figure 6), which was the trend expected according to the literature data [17,32]. The lowest values of the local resistance coefficients occurred for the properly warmed up and properly pressed T-junctions, and the highest for the excessively warmed up and excessively pressed ones. The trend (regression) of the measured values of ζ was of an exponential type, and the values of the determination coefficient R2 from sample were over 0.64, indicating that the local resistance coefficient depended at least 64% on the Reynolds number Re, i.e., on the water flow velocity V, the T-junction diameter d, the water kinematic viscosity coefficient ν, and manufacturing precision of the T-junction joint, and depended 36% on the pressure difference Δp occurring in the T-junction during the water flow.
Table 1 presents basic statistics of the value of the local resistance coefficient determined from the measurements. The mean value of the local resistance coefficient from the measurements made for the properly warmed up and properly pressed T-junctions with through-run water flow was equal to ζ1p = 0.44, the divergent water flow ζ2p = 1.37, and the convergent water flow ζ3p = 1.65. The mean value of the local resistance coefficient from the measurements made for the too poorly warmed up and too poorly pressed T-junctions with the through-run water flow was equal to ζ4p = 0.80, the divergent water flow ζ5p = 1.75, and the convergent water flow ζ6p = 2.29. The mean value of the local resistance coefficient from the measurements made for the excessively warmed up and excessively pressed T-junctions with the through-run water flow was equal to ζ7p = 1.47, the divergent water flow ζ8p = 6.26, and the convergent water flow ζ9p = 7.26. Table 2 presents the values determined from the nomograms proposed by Rennels and Hudson [26] used to calculate values of the local resistance coefficient in T-junctions for engineering purposes, i.e., for designing systems and installations of water supply.
Comparison of the mean values of the local resistance coefficient determined from the measurements (Table 1) with the values read from the nomograms recommended for design of systems and installations of water supply (Table 2) allowed us to state that the real values of the local resistance coefficients in the polypropylene T-junctions were significantly higher than those read from the nomograms [26].
The functional dependence between the values of the local resistance coefficient determined from the measurements and the Reynolds number Re for the tested T-junctions was best described by an exponential mathematical model in form of the following equations.
where ζ1w: local resistance coefficient for the properly warmed up and properly pressed T-junctions with the through-run water flow; ζ2w: local resistance coefficient for the properly warmed up and properly pressed T-junctions with the divergent water flow; ζ3w: local resistance coefficient for the properly warmed up and properly pressed T-junctions with the convergent water flow; ζ4w: local resistance coefficient for the poorly warmed up and poorly pressed T-junctions with the through-run water flow; ζ5w: local resistance coefficient for the poorly warmed up and poorly pressed T-junctions with the divergent water flow; ζ6w: local resistance coefficient for the poorly warmed up and poorly pressed T-junctions with the convergent water flow; ζ7w: local resistance coefficient for the excessively warmed up and excessively pressed T-junctions with the through-run water flow; ζ8w: local resistance coefficient for the excessively warmed up and excessively pressed T-junctions with the divergent water flow; ζ9w: local resistance coefficient for the excessively warmed up and excessively pressed T-junctions with the convergent water flow; Re: Reynolds number.
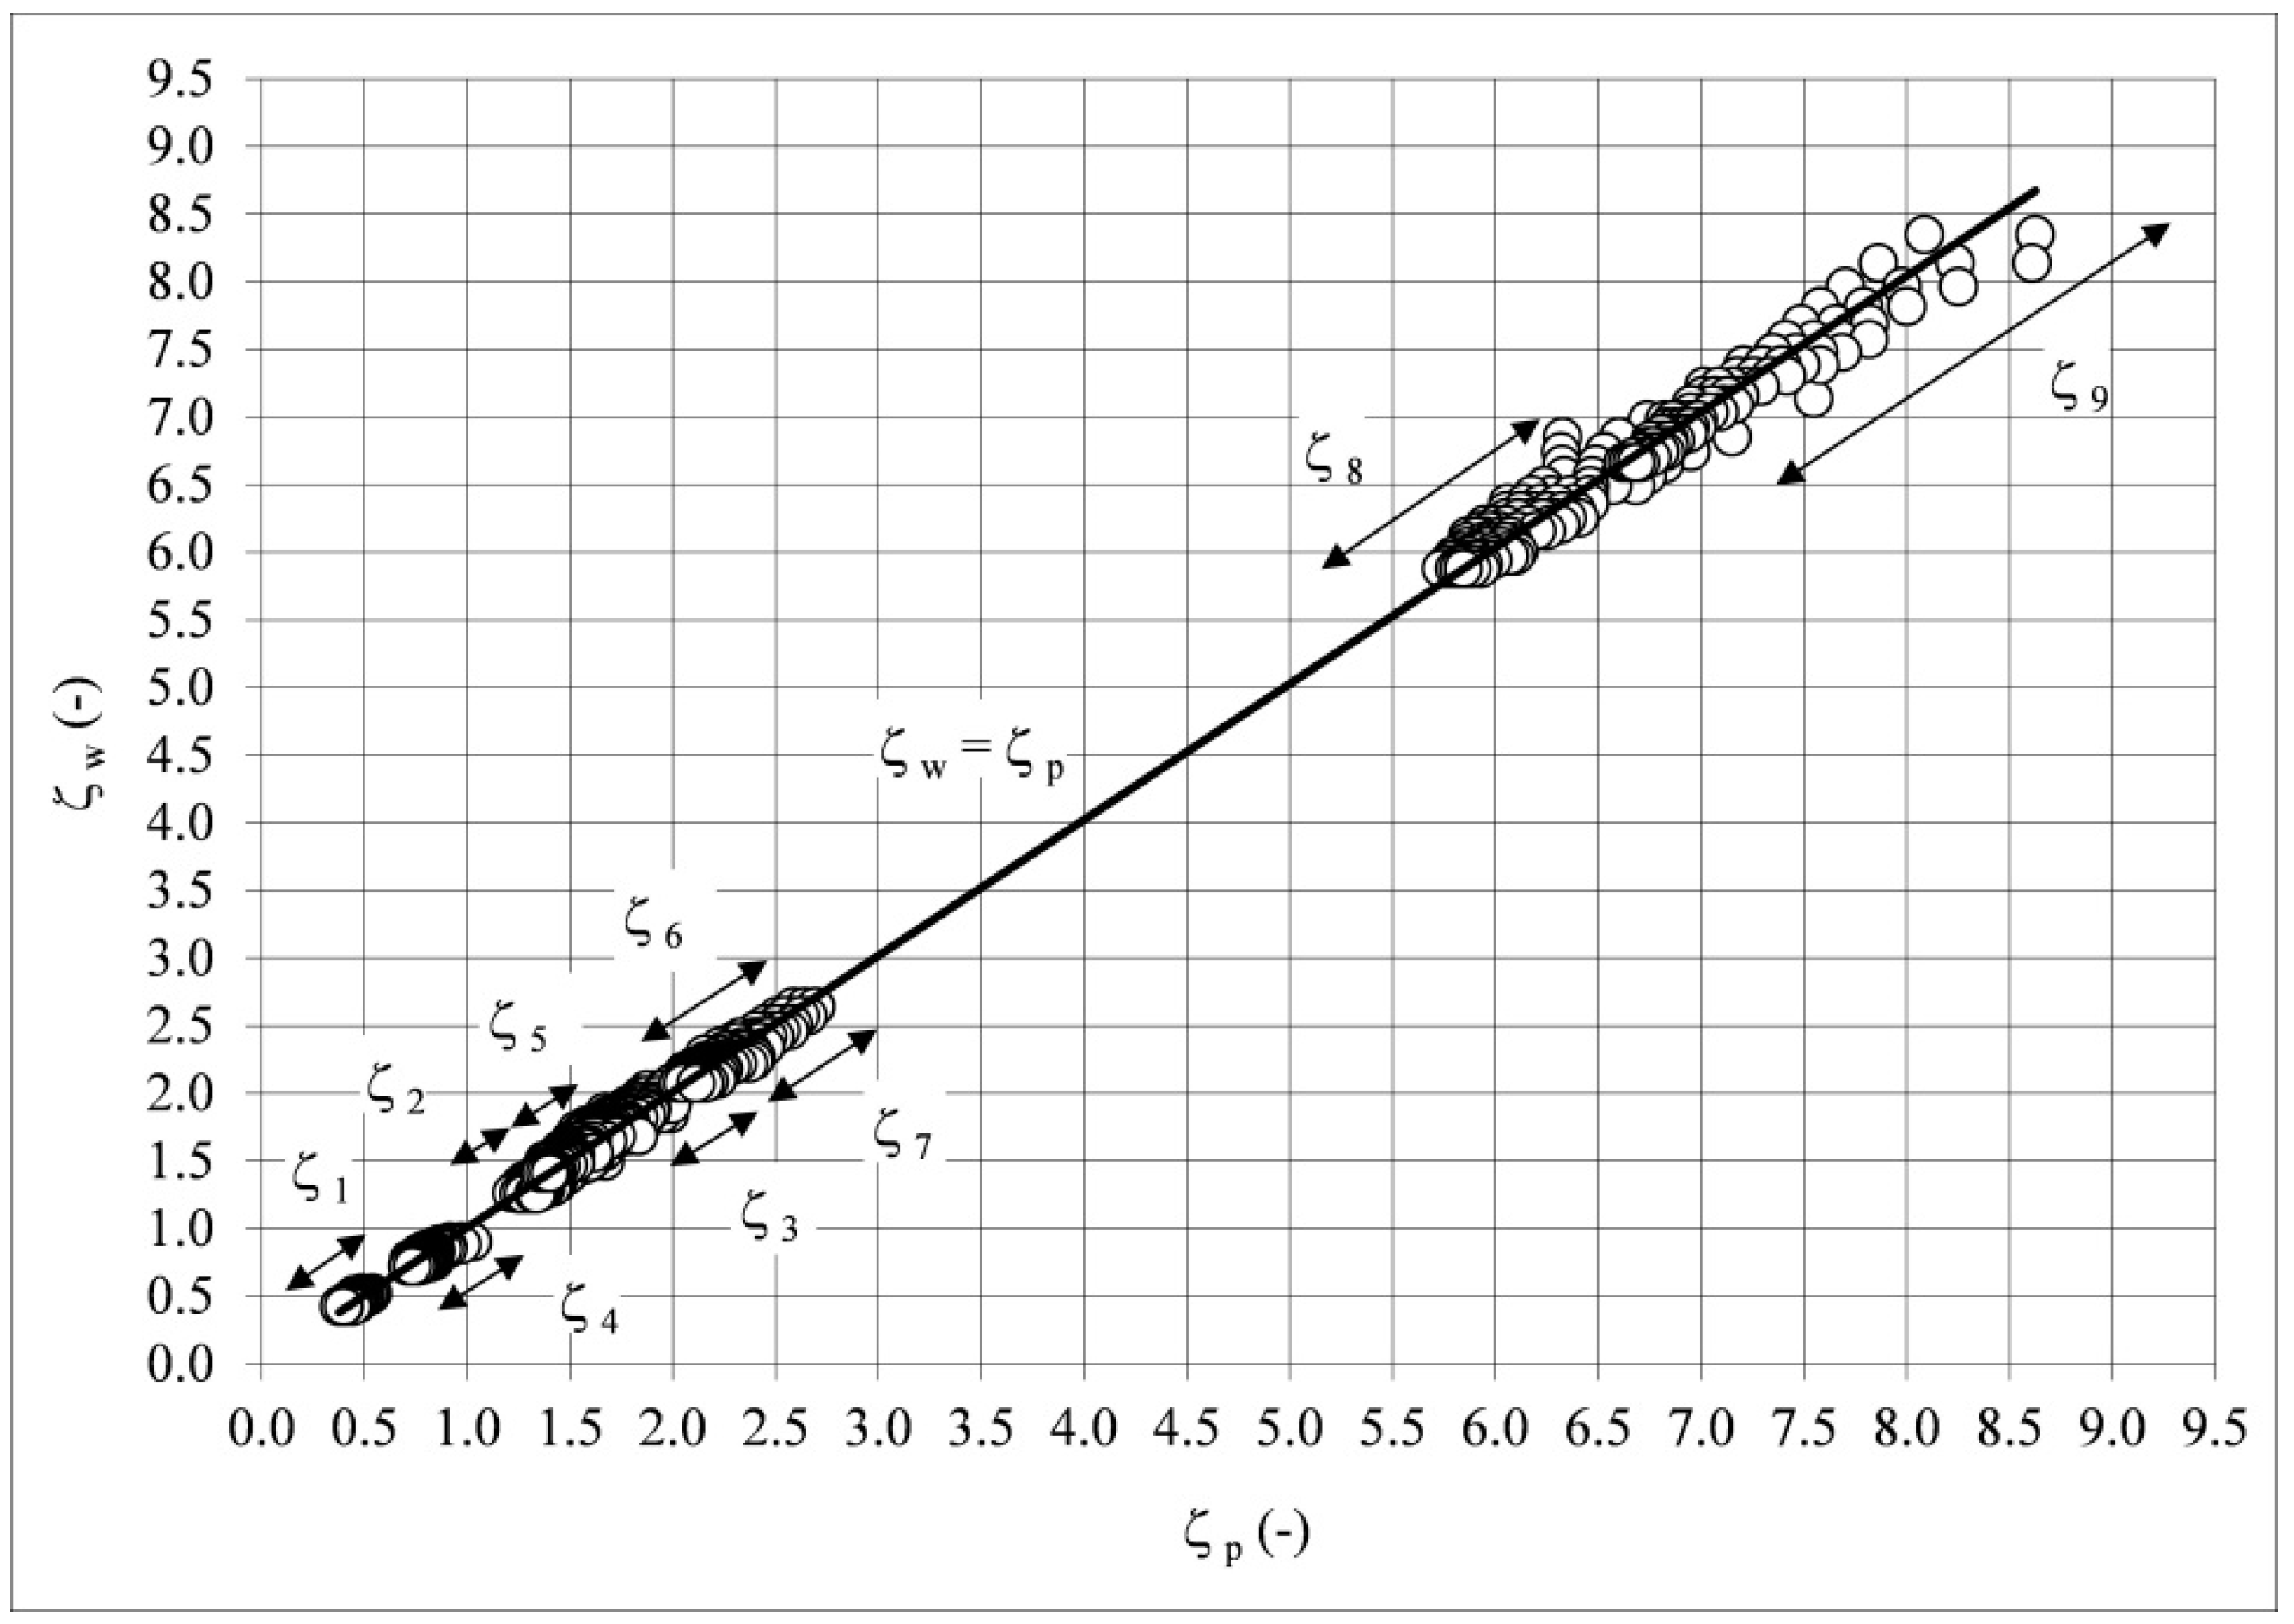
An evaluation of the adjustment of the exponential mathematical model for calculations of the local resistance coefficient ζ in polypropylene T-junctions was performed with use of a graph (Figure 7), where the ordinates were the results of calculations from Equations (3)–(11), i.e., predicted values ζw, whereas the abscissae were the values obtained from the measurements ζp (Figure 6). The obtained points were approximated by a linear function crossing the origin of coordinates; thus, the correctness of choice of the mathematical model was verified by the slope coefficient of the linear function. The analysis of the dependence presented in Figure 7 allowed us to state that the exponential mathematical model described reality well, as the slope coefficient of the linear function was equal to 1.
In calculations of standpipes and pipe sections connecting the standpipe and tapping points, the minimum and maximum velocities of water flow were applied [38]. If the Reynolds number is written in the form [26]
then Equations (3)–(11) assume the following forms
where V is the water flow velocity in m⋅s−1, ν is the kinematic viscosity coefficient of water in m2⋅s−1, and d is the internal diameter of the T-junction in m.
A statistical analysis was performed to check whether differences between the mean values of the local resistance coefficients obtained in measurements ζ1p, ζ2p, ζ3p, ζ4p, ζ5p, ζ6p, ζ7p, ζ8p, ζ9p (Figure 6) and calculated from Equations (13)–(21), ζ1cal, ζ2cal, ζ3cal, ζ4cal, ζ5cal, ζ6cal, ζ7cal, ζ8cal, and ζ9cal, were indeed significant. First, the normality of distribution was checked using the Shapiro–Wilk test, and then the homogeneity of variance was tested using the Levene test. Calculations of normality of distribution and homogeneity of variance were done with STATISTICA software and the obtained results are presented in Table 3. In both tests for individual groups, the values of calculated probability pcal were greater than the assumed significance level α = 0.05 (Table 3), meaning that the conditions of normal distribution and homogeneity of variance in the examined groups were satisfied. Student’s t-test was then used for two populations; a zero hypothesis (H0: n1 = n2) stated that the mean values were statistically equal, and an alternative hypothesis (H1: n1 ≠ n2) stated that the mean values were statistically different. Calculations of the Student t-statistic value |tcal| were performed using the computer software STATISTICA (StatSoft Polska Sp. zo.o, Poland); the obtained results are gathered in Table 4.
For the alternative hypothesis, it was determined that a critical region |tcal| ≥ tα = 0.05 and, for v = n1 + n2 – 2 = 40 degrees of freedom and α = 0.05, i.e., a selected 5% risk of error (significance level), the critical value tα = 0.05 = 2.021 was read from the tables. Analysis of Table 4 allowed us to state that |tcal| ≤ tα=0.05, i.e., the zero hypothesis could not be rejected; thus, the differences between the mean values of the results of the local resistance coefficients obtained from measurements, ζ1p, ζ2p, ζ3p, ζ4p, ζ5p, ζ6p, ζ7p, ζ8p, and ζ9p (Figure 6) and calculated from Equations (13)–(21), ζ1cal, ζ2cal, ζ3cal, ζ4cal, ζ5cal, ζ6cal, ζ7cal, ζ8cal, and ζ9cal, were statistically insignificant, i.e., equal to each other. This is also confirmed by the fact that the calculated probability value, pcal, was greater than 0.05 (assumed significance level).
Thus, Equations (13)–(21) can be used in the design of water supply installations made of polypropylene to determine real values of the local resistance coefficient ζ, with dependence on an assumed manufacturing precision of joints of the T-junctions with an internal diameter of 13.2 mm. Using these equations for design purposes according to the requirements of the standard PN-EN 806-3:2006 [38], a nomogram was worked out to determine values of local resistance coefficients ζ depending on water flow velocity in polypropylene T-junctions with an internal diameter of 13.2 mm (Figure 8).
Currently, designers of water supply networks apply simplified methods of estimation of the local resistance coefficient ζ in fittings; thus, the pressure losses in these water supply networks are calculated inaccurately. Until now, it has not been known how to determine the local resistance coefficient ζ of a welded polypropylene T-junction with a given internal diameter. Now, a designer of polypropylene water supply networks, using the nomogram (Figure 8) and assuming a water flow velocity, can exactly determine the real value of the local resistance coefficient ζ in a welded polypropylene T-junction with the internal diameter of 13.2 mm, depending on water flow direction, and then exactly calculate the real value of the pressure losses that will occur in the designed water supply system.
Analysis of the results of the investigations allowed us to state that the local resistance coefficient ζ in a welded polypropylene T-junction significantly depends on the manufacturing precision of the T-junction joints. Many manufacturers and distributors of fittings do not submit the values of the local resistance coefficient ζ in technical catalogues; thus, it is not clear whether they correspond to reality, because the values of ζ for polypropylene fittings with the same diameter but from different manufacturers are not the same. The values of ζ for the fittings, calculated according to the recommended guidelines [33], were significantly lower than the measured values [21,23,25,34,36]. This was also confirmed by the present investigations, performed with use of the welded polypropylene T-junctions with an internal diameter of 13.2 mm. Accordingly, it must be stated that the values of the local resistance coefficient ζ for fittings should be determined by measurement. Analyzing the problem of local resistance coefficients ζ, one must also consider the hydraulic resistance resulting the joining of this fitting with a straight section of the pipeline. In fact, the straight sections between the fittings are a source of hydraulic resistances as well. In the technical and scientific literature, there is often no information on whether a determined local resistance coefficient ζ concerns the fitting itself or also includes the resistances occurring in the straight pipeline section between the fittings. According to the standard methodology of determination of local resistances [37], the hydraulic resistance occurring in straight sections between fittings should also be considered. Due to this fact, the hydraulic resistance occurring in these sections of the pipeline should be measured, not calculated, because the accuracy of these calculations depends on the assumed or calculated value of the linear resistance coefficient λ as well as the assumed value of absolute roughness k.
4. Conclusions
The local resistance coefficient ζ of welded polypropylene T-junctions does not have a constant value, and depends on the water flow velocity and manufacturing precision of a given T-junction. An increase of the water flow velocity in a welded polypropylene T-junctions results in a fall in the value of the local resistance coefficient ζ. Equations (13)–(21) and the nomogram shown in Figure 8 can be used to design of water supply installations made of polypropylene and to determine real values of the resistance coefficient ζ relative to the assumed manufacturing precision of a T-junction with an internal diameter 13.2 mm.
The comparison of the mean values of the local resistance coefficient ζ determined from the measurements of properly warmed up and properly pressed T-junctions with the respective values for poorly warmed up and poorly pressed T-junctions (ζ4p, ζ5p, ζ6p) and excessively warmed up and excessively pressed T-junctions (ζ7p, ζ8p, ζ9p) allowed us to state that for the through-run water flow, the value of ζ4p increased by 45%, ζ7p by 70.1%, in the divergent water flow ζ5p increased by 21.7% and ζ8p by 78.1%, and in the convergent water flow, ζ6p increased by 27.9% and ζ9p by 77.3%.
As the real value of the local resistance coefficient ζ in a welded polypropylene T-junction significantly depends on the welding time and pressing force applied to the elements being welded, it is necessary for fitting manufacturers to precisely determine the welding time and pressing force, as well as to equip welding sets with dynamometers measuring the pressing force during joining of the fittings being welded.
The comparison of the mean values of the local resistance coefficient ζ determined from the measurements with the values read from the nomograms recommended for designing water supply networks [26] allowed us to state that for the properly warmed up and properly pressed T-junctions, in the through-run water flow, the value of ζ1p increased by 88.6%, in the divergent water flow ζ2p increased by 4.4%, and in the convergent water flow ζ3p increased by 32.1%; for poorly warmed up and poorly pressed T-junctions, in the through-run water flow, the value of ζ4p increased by 93.8%, in the divergent water flow, ζ5p increased by 25.1%, and in the convergent water flow, ζ6p increased by 51.1%; for the excessively warmed up and excessively pressed T-junctions, in the through-run water flow, the value of ζ7p increased by 96.6%, in the divergent water flow, ζ8p increased by 79.1%, and in the convergent water flow, ζ9p increased by 84.6%.
In case of the welded polypropylene T-junctions, the methods of calculating the value of the local resistance coefficient outlined in Reference [26] significantly underestimate the results as compared to the values obtained in measurements. The big difference between the values of the coefficient ζ obtained by measurement and the values determined according to the guidelines indicates that recommended methods of calculating the value of the local resistance coefficient for fittings should be specified.
The values of the local resistance coefficient ζ of welded polypropylene T-junctions published in the literature and catalogues significantly differ from the real values obtained by measurement. Due to this fact, it is necessary to perform further investigations of welded polypropylene fittings in a range of diameters, which will allow real values of the coefficient ζ to be determined and enable new guidelines for the determination of values of local resistance coefficients to be established.
Author Contributions
Conceptualization, M.K., M.C. and P.W.; methodology, M.K. and P.W.; validation, M.K. and M.C.; formal analysis, M.K. and M.C.; investigation, M.K.; data curation, M.K. and M.C.; writing—original draft preparation, M.K.; writing—review and editing, M.K, M.C. and P.W.; visualization, M.K, M.C. and P.W.; supervision, M.K. All authors have read and agreed to the published version of the manuscript.
Funding
This research received no external funding.
Conflicts of Interest
The authors declare no conflict of interest.
References
- Ono, A.; Kimura, N.; Kamide, H.; Tobita, A. Influence of elbow curvature on flow structure at elbow outlet under high Reynolds number condition. Nucl. Eng. Des. 2011, 41, 4409–4419. [Google Scholar] [CrossRef]
- Wichowski, P.; Siwiec, T.; Kalenik, M. Effect of the concentration of sand in a mixture of water and sand flowing through PP and PVC elbows on the minor head loss coefficient. Water 2019, 11, 828. [Google Scholar] [CrossRef] [Green Version]
- Štigler, J.; Klas, R.; Kotek, M.; Kopecký, V. The fluid flow in the T-junction. The comparison of the numerical modeling and PIV measurement. Procedia Eng. 2012, 39, 19–27. [Google Scholar] [CrossRef] [Green Version]
- Röhrig, R.; Jakirlić, S.; Tropea, C. Comparative computational study of turbulent flow in a 90° pipe elbow. Int. J. Heat Fluid Flow 2015, 55, 120–131. [Google Scholar] [CrossRef]
- Hellstrőm, L.H.; Sinha, A.; Smits, A.J. Visualizing the very-large-scale motions in turbulent pipe flow. Phys. Fluids 2011, 23, 011703. [Google Scholar] [CrossRef] [Green Version]
- Takamura, H.; Ebara, S.; Hashizume, H.; Aizawa, K.; Yamano, H. Flow visualization and frequency characteristics of velocity fluctuations of complex turbulent flow in a short elbow piping under high Reynolds number condition. J. Fluids Eng. 2012, 134, 101201–101209. [Google Scholar] [CrossRef]
- Kim, J.; Yadav, M.; Kim, S. Characteristics of secondary flow induced by 90-degree elbow in turbulent pipe flow. Eng. Appl. Comput. Fluid 2014, 8, 229–239. [Google Scholar] [CrossRef]
- Selvam, P.K.; Kulenovic, R.; Laurien, E. Experimental and numerical analyses on the effect of increasing inflow temperatures on the flow mixing behavior in a T-junction. Int. J. Heat Fluid Flow 2016, 61, 323–342. [Google Scholar] [CrossRef]
- Koka, F.; Myoseb, R.; Hoffmannb, K.A. Numerical assessment of pulsatile flow through diverging tees with a sharp and round-edge junction. Int. J. Heat Fluid Flow 2019, 76, 1–13. [Google Scholar] [CrossRef]
- Brücker, C. Study of the three-dimensional flow in a T-junction using a dual-scanning method for three-dimensional scanning-particle-image velocimetry (3-D SPIV). Exp. Therm. Fluid Sci. 1997, 14, 35–44. [Google Scholar] [CrossRef]
- Sakowitz, A.; Mihaescu, M.; Fuchs, L. Turbulent flow mechanisms in mixing T-junctions by Large Eddy Simulations. Int. J. Heat Fluid Flow 2014, 45, 135–146. [Google Scholar] [CrossRef]
- Dutta, P.; Saha, S.K.; Nandi, N.; Pal, N. Numerical study on flow separation in 90° pipe bend under high Reynolds number by k-ε modeling. Eng. Sci. Technol. Int. J. 2016, 19, 904–910. [Google Scholar] [CrossRef] [Green Version]
- Kuczaj, A.K.; Komen, E.M.J.; Loginov, M.S. Large-Eddy Simulation study of turbulent mixing in a T-junction. Nucl. Eng. Des. 2010, 240, 2116–2122. [Google Scholar] [CrossRef] [Green Version]
- Chalet, D.; Chesse, P. Fluid dynamic modeling of junctions in internal combustion engine inlet and exhaust systems. J. Therm. Sci. 2010, 19, 410–418. [Google Scholar] [CrossRef]
- Athulya, A.S.; Miji Cherian, R. CFD modelling of multiphase flow through T junction. Proced. Technol. 2016, 24, 325–331. [Google Scholar] [CrossRef] [Green Version]
- Lin, D.; Diwakar, P.; Mehrotra, V.; Rosendall, B.; Berkoe, J. Modeling multi-phase flow using CFD with related applications. WIT Trans. Eng. Sci. 2005, 50, 251–261. [Google Scholar]
- Mynard, J.P.; Valen-Sendstad, K. A unified method for estimating pressure losses at vascular junctions. Int. J. Numer. Methods Biomed. Eng. 2010, 31, 1–24. [Google Scholar] [CrossRef]
- Grus, T.; Lindner, J.; Vik, K.; Tošovský, J.; Matěcha, J.; Netřebská, H.; Tůma, J.; Adamec, J. Particle image velocimetry measurement in the model of vascular anastomosis. Prague Med. Rep. 2007, 108, 75–86. [Google Scholar]
- Grus, T.; Grusová, G.; Lambert, L.; Banerjee, R.; Matěcha, J.; Mlček, M. The influence of the anastomosis angle on the hemodynamics in the distal anastomosis in the infrainguinal bypass: An in vitro study. Physiol. Res. 2016, 65, 591–595. [Google Scholar] [CrossRef]
- Bassett, M.D.; Winterbone, D.E.; Pearson, R.J. Calculation of steady flow pressure loss coefficients for pipe junctions. Proc. Inst. Mech. Eng. 2001, 215, 861–881. [Google Scholar] [CrossRef]
- Kalenik, M. Real values of local resistance coefficient during flow of water through welded polypropylene elbows. Ochr. Sr. 2019, 41, 23–30. (In Polish) [Google Scholar]
- Csizmadia, P.; Hős, C. CFD-based estimation and experiments on the loss coefficient for Bingham and power-law fluids through diffusers and elbows. Comput. Fluids 2014, 99, 116–123. [Google Scholar] [CrossRef]
- Gietka, N.K. Experimental analysis of coefficients of local resistance on elbows in multilayer pipe systems. Acta Sci. Pol. Form. Circum. 2015, 14, 47–56. (In Polish) [Google Scholar] [CrossRef]
- Li, A.; Chen, X.; Chen, L.; Gao, R. Study on local drag reduction effects of wedge-shaped components in elbow and T-junction close-coupled pipes. Build. Simul. 2014, 7, 175–184. [Google Scholar] [CrossRef]
- Cisowska, I. Studies of hydraulic resistance in polypropylene pipe fittings. Struct. Environ. 2009, 1, 53–58. [Google Scholar]
- Rennels, D.C.; Hudson, H.M. Pipe Flow. A Practical and Comprehensive Guide; John Wiley Sons, Inc.: Hoboken, NJ, USA, 2012. [Google Scholar]
- Chowdhury, R.R.; Alam, M.M.; Sadrul Islam, A.K.M. Numerical modeling of turbulent flow through bend pipes. Mech. Eng. Res. J. 2016, 10, 14–19. [Google Scholar]
- Dutta, P.; Nandi, N. Effect of Reynolds number and curvature ratio on single phase turbulent flow in pipe bends. Mech. Mech. Eng. 2015, 19, 5–16. [Google Scholar]
- Kalenik, M.; Chalecki, M. Experimental study of air lift pump delivery rate. Rocz. Ochr. Sr. 2018, 20, 221–240. [Google Scholar]
- Kalenik, M. Empirical formulas for calculation of negative pressure difference in vacuum pipelines. Water 2015, 7, 5284–5304. [Google Scholar] [CrossRef] [Green Version]
- Liu, M.; Duan, Y.F. Resistance properties of coal-water slurry flowing through local piping fittings. Exp. Therm. Fluid Sci. 2009, 33, 828–837. [Google Scholar] [CrossRef]
- Costa, N.P.; Maia, R.; Proença, M.F.; Pinho, F.T. Edge effects on the flow characteristics in a 90 deg Tee junction. J. Fluids Eng. 2006, 128, 1204–1217. [Google Scholar] [CrossRef]
- PN-76/M-34034. Pipelines. Calculations of Pressure Losses; Polish Standard; PKN: Warsaw, Poland, 1987. (In Polish) [Google Scholar]
- Strzelecka, K.; Jeżowiecka-Kabsch, K. Real values of resistance coefficients in water flow through leading pipe sudden expansion. Ochr. Sr. 2008, 30, 29–33. (In Polish) [Google Scholar]
- Li, Y.; Wang, C.; Ha, M. Experimental determination of local resistance coefficient of sudden expansion tube. Energy Power Eng. 2015, 7, 154–159. [Google Scholar] [CrossRef] [Green Version]
- Pliżga, O.; Kowalska, B.; Musz-Pomorska, A. Laboratory and numerical studies of water flow through selected fittings installed at copper pipelines. Rocz. Ochr. Sr. 2016, 18, 873–884. [Google Scholar]
- PN-EN 1267:2012. Industrial Valves. Test of Flow Resistance Using Water as Test Fluid; Polish Standard; PKN: Warsaw, Poland, 2012. [Google Scholar]
- PN-EN 806-3:2006. Specifications for Installations Inside Buildings Conveying Water for Human Consumption—Part 3: Pipe Sizing-Simplified Method; Polish Standard; PKN: Warsaw, Poland, 2006. [Google Scholar]
Figure 1.
Scheme of the test rig for investigations of hydraulic resistance of polypropylene T-junctions: 1–water supplying pipe; 2–pump; 3–electromagnetic water flow meter; 4–needle valve; 5: screwed joints; 6–polypropylene pipe sections; 7–T-junction; 8: impulse hoses; 9, 14, 15, 16, 17, 18, 19, 20, 21, 22, 23–ball cut-off valves; 10: piezoelectric pressure difference meter; 11–vents; 12–needle valve for water flow control; 13–floor sewerage inlet; 24–electronic resistance thermometer; A–through-run water flow; B–divergent water flow; C–convergent water flow.

Figure 2.
Polyfusion welder: 1–temperature signal lamps; 2–heating plate; 3–heating mandrel; 4–heating sleeve.
Figure 2.
Polyfusion welder: 1–temperature signal lamps; 2–heating plate; 3–heating mandrel; 4–heating sleeve.

Figure 3.
Three types of polypropylene T-junction with visible fashes resulting from the pressing of the welded elements to each other: (a) properly warmed up and properly pressed T-junction, (b) poorly warmed up and poorly pressed T-junction, (c) excessively warmed up and excessively pressed T-junction; 1: fash resulting from the pressing of the welded elements to each other.

Figure 4.
Dependence between the real pressure difference Δp in polypropylene T-junctions with an internal diameter of 13.2 mm and the water flow rate q: (a) properly warmed up and properly pressed T-junction, (b) poorly warmed up and poorly pressed T-junction, (c) excessively warmed up and excessively pressed T-junction.

Figure 5.
Dependence between the mean pressure difference Δp in the screwed joints and polypropylene pipe sections and the water flow rate q.
Figure 5.
Dependence between the mean pressure difference Δp in the screwed joints and polypropylene pipe sections and the water flow rate q.

Figure 6.
Dependence between the local resistance coefficient ζ in polypropylene T-junctions with an internal diameter of 13.2 mm and Reynolds number Re: (a) properly warmed up and properly pressed T-junction, (b) poorly warmed up and poorly pressed T-junction, (c) excessively warmed up and excessively pressed T-junction.

Figure 7.
Verification of the correctness of the exponential mathematical model for calculations of the local resistance coefficient ζ.
Figure 7.
Verification of the correctness of the exponential mathematical model for calculations of the local resistance coefficient ζ.

Figure 8.
Nomogram for determining values of the local resistance coefficient ζ in welded polypropylene T-junctions with an internal diameter of 13.2 mm, depending on water flow velocity V: (a) properly warmed up and properly pressed T-junction, (b) poorly warmed up and poorly pressed T-junction, (c) excessively warmed up and excessively pressed T-junction.


Table 1.
Basic statistics of the local resistance coefficients ζ determined from the measurements of the polypropylene T-junctions.
Table 1.
Basic statistics of the local resistance coefficients ζ determined from the measurements of the polypropylene T-junctions.
| Local Resistance Coefficient | Statistics | ||||
|---|---|---|---|---|---|
| Minimum | Maximum | Mean | Median | Standard Deviation | |
| ζ1p | 0.38 | 0.54 | 0.44 | 0.44 | 0.06 |
| ζ2p | 1.22 | 1.67 | 1.37 | 1.35 | 0.08 |
| ζ3p | 1.47 | 1.98 | 1.65 | 1.62 | 0.12 |
| ζ4p | 0.71 | 1.02 | 0.80 | 0.79 | 0.05 |
| ζ5p | 1.53 | 2.16 | 1.75 | 1.71 | 0.12 |
| ζ6p | 2.03 | 2.70 | 2.29 | 2.25 | 0.17 |
| ζ7p | 1.35 | 1.83 | 1.47 | 1.45 | 0.09 |
| ζ8p | 5.74 | 7.55 | 6.26 | 6.15 | 0.36 |
| ζ9p | 6.62 | 8.62 | 7.26 | 7.12 | 0.49 |
Table 2.
Values of the local resistance coefficient for the polypropylene T-junctions determined from the nomograms [26].
Table 2.
Values of the local resistance coefficient for the polypropylene T-junctions determined from the nomograms [26].
| Flow Direction | ζn |
|---|---|
| Through-run, ζ10n | 0.05 |
| Divergent, ζ11n | 1.31 |
| Convergent, ζ12n | 1.12 |
Table 3.
Results of calculations of the statistics using the Shapiro–Wilk test and Levene test. Differences of the mean values are significant with the probability p > 0.05.
Table 3.
Results of calculations of the statistics using the Shapiro–Wilk test and Levene test. Differences of the mean values are significant with the probability p > 0.05.
| Local Resistance Coefficient ζ | Probability Value Calculated with the Shapiro–Wilk Test pcal | Probability Value Calculated with the Levene Test pcal |
|---|---|---|
| ζ1p 1 | 0.175 | 0.536 |
| ζ1cal 2 | 0.136 | |
| ζ2p 1 | 0.071 | 0.715 |
| ζ2cal 2 | 0.144 | |
| ζ3p 1 | 0.096 | 0.836 |
| ζ3cal 2 | 0.127 | |
| ζ4p 1 | 0.111 | 0.992 |
| ζ4cal 2 | 0.132 | |
| ζ5p 1 | 0.107 | 0.654 |
| ζ5cal 2 | 0.132 | |
| ζ6p 1 | 0.114 | 0.986 |
| ζ6cal 2 | 0.127 | |
| ζ7p 1 | 0.157 | 0.967 |
| ζ7cal 2 | 0.144 | |
| ζ8p 1 | 0.106 | 0.890 |
| ζ8cal 2 | 0.132 | |
| ζ9p 1 | 0.074 | 0.971 |
| ζ9cal 2 | 0.140 |
1 ζ1p–ζ9p: local resistance coefficients obtained in measurements (Figure 6); 2 ζ1cal–ζ9cal: local resistance coefficients calculated in Equations (13)–(21).
Table 4.
Results of calculations of the statistics using Student’s t-test. Differences of the mean values were significant with the probability p < 0.05.
Table 4.
Results of calculations of the statistics using Student’s t-test. Differences of the mean values were significant with the probability p < 0.05.
| Local Resistance Coefficientζ | Statistics | ||||
|---|---|---|---|---|---|
| Mean | Standard Deviation | Calculated Value of the Student’s t-Test |tcal| | Calculated Probability Value pcal | Calculated Value of the Student’s t-Test Read from Tables for p = 0.05 and v = 40 tα = 0.05 | |
| ζ1p 1 | 0.459 | 0.025 | −1.875 | 0.075 | 2.021 |
| ζ1cal 2 | 0.461 | 0.029 | |||
| ζ2p 1 | 1.352 | 0.080 | 1.820 | 0.084 | |
| ζ2cal 2 | 1.347 | 0.072 | |||
| ζ3p 1 | 1.643 | 0.124 | 1.810 | 0.085 | |
| ζ3cal 2 | 1.639 | 0.119 | |||
| ζ4p 1 | 0.790 | 0.054 | 1.482 | 0.154 | |
| ζ4cal 2 | 0.789 | 0.054 | |||
| ζ5p 1 | 1.801 | 0.119 | –1.978 | 0.062 | |
| ζ5cal 2 | 1.812 | 0.123 | |||
| ζ6p 1 | 2.288 | 0.171 | 1.639 | 0.117 | |
| ζ6cal 2 | 2.280 | 0.166 | |||
| ζ7p 1 | 1.506 | 0.088 | –0.882 | 0.388 | |
| ζ7cal 2 | 1.511 | 0.080 | |||
| ζ8p 1 | 6.320 | 0.359 | −1.943 | 0.066 | |
| ζ8cal 2 | 6.338 | 0.368 | |||
| ζ9p 1 | 7.268 | 0.494 | −0.828 | 0.418 | |
| ζ9cal 2 | 7.273 | 0.494 | |||
1 ζ1p–ζ9p: local resistance coefficients obtained in measurements (Figure 6); 2 ζ1cal–ζ9cal: local resistance coefficients calculated using Equations (13)–(21).
© 2020 by the authors. Licensee MDPI, Basel, Switzerland. This article is an open access article distributed under the terms and conditions of the Creative Commons Attribution (CC BY) license (http://creativecommons.org/licenses/by/4.0/).
Share and Cite
MDPI and ACS Style
Kalenik, M.; Chalecki, M.; Wichowski, P. Real Values of Local Resistance Coefficients during Water Flow through Welded Polypropylene T-Junctions. Water 2020, 12, 895. https://doi.org/10.3390/w12030895
AMA Style
Kalenik M, Chalecki M, Wichowski P. Real Values of Local Resistance Coefficients during Water Flow through Welded Polypropylene T-Junctions. Water. 2020; 12(3):895. https://doi.org/10.3390/w12030895
Chicago/Turabian StyleKalenik, Marek, Marek Chalecki, and Piotr Wichowski. 2020. "Real Values of Local Resistance Coefficients during Water Flow through Welded Polypropylene T-Junctions" Water 12, no. 3: 895. https://doi.org/10.3390/w12030895
Note that from the first issue of 2016, this journal uses article numbers instead of page numbers. See further details here.