Study on Aeration Optimization and Sewage Treatment Efficiency of a Novel Micro-Pressure Swirl Reactor (MPSR)
by
Shengshu Ai
1,2, 
Shuangshi Dong
1,*,
Zebing Nie
2,3,
Suiyi Zhu
2,3,
Qingkai Ren
2,3 and
Dejun Bian
2,3,* 1
Key Laboratory of Groundwater Resources and Environment (Ministry of education), Jilin University, Changchun 130021, China
2
Key Laboratory of Urban Sewage Treatment of Jilin Province, Changchun Institute of Technology, Changchun 130012, China
3
Science and Technology Innovation Center for Municipal Wastewater Treatment and Water Quality Protection, Northeast Normal University, Changchun 130117, China
*
Authors to whom correspondence should be addressed.
Water 2020, 12(3), 890; https://doi.org/10.3390/w12030890
Submission received: 9 February 2020
/
Revised: 13 March 2020
/
Accepted: 17 March 2020
/
Published: 22 March 2020
(This article belongs to the Special Issue Advances in the Technologies for Water and Wastewater Treatment)
Abstract
:This study developed a new type of micro-pressure swirl reactor (MPSR) for treating rural domestic sewage with variable water volume in northern China. The transformation of a traditional aeration tank to MPSR was mainly divided into three steps. Firstly, the aeration device was installed on one side of the aeration tank. Secondly, most of the top cover plate was sealed. Finally, the liquid level-lifting zone was set to achieve micro-pressure. The study measured the flow velocity and dissolved oxygen (DO) distribution in the main reaction zone of MPSR, studied the effects of MPSR sewage treatment in continuous operation mode and sequential batch operation mode, and analyzed the main microbial species. The experimental results showed that a stable circular circle flow and a spatial DO gradient in MPSR were formed when the aeration rate of MPSR was 0.2 m3/h. Through the MPSR sewage treatment experiment in two operation modes, it could meet the current requirements of rural environmental pollution controlled in China. Analysis of the types of microorganisms showed that microorganisms with different functions gathered in different zones of the MPSR due to the different dissolved oxygen environment and water flow environment, which further improved the ability of MPSR to simultaneously remove nitrogen and phosphorus.
1. Introduction
Due to the disadvantages of development in recent decades [1,2,3], environmental pollution in most rural areas of China has become very serious, and the Chinese government is working hard to solve the problem [4,5,6]. Among them, rural domestic sewage is one of the important pollution sources. So far, biological treatment technology is still the main means for treating rural domestic sewage, and its core component is the biochemical reaction tank [7,8]. Through the research of nitrogen and phosphorus removal theory and reference to urban sewage treatment plants, researchers have formed a series of treatment processes, such as AO (anoxic aerobic process), A2O (anaerobic anoxic aerobic process), SBR (sequence batch reactor), CAST (cyclic activated sludge technology), etc. [9,10]. These sewage treatment processes can be divided into two categories. One is the continuous flow process represented by A2O, and the other is the sequential batch process represented by SBR [9]. In China, especially in the northeast and northwest rural areas, due to the small rural population and the cold weather, it is not easy to form a continuous flow of domestic sewage in winter. Moreover, when snow and ice melt in spring, rainfall increases in summer and people’s production and living activities increase in the two seasons, the sewage is suitable for continuous flow treatment. Since the SBR process can be retrofitted to the CAST process, the alternate operation of the SBR process and CAST seems to be the best choice to solve the problem. However, the SBR process has the inherent disadvantage that it is difficult to remove nitrogen and phosphorus simultaneously [11,12,13]. At the same time, the complicated operation on management of the CAST process makes it not suitable for rural areas lacking professionals. In order to solve the above problems, we have improved the traditional biological aeration tank, and formed a novel sewage treatment process of micro-pressure swirl reactor (MPSR) [14,15].
MPSR combines the ordinary activated sludge method and sludge mixed liquid mass transfer theory. Through the improvement of the activated sludge method aeration tank structure, the sludge mixed liquid in the reactor is circulated, forming a unique aeration method and biochemical reaction surroundings. Reasonable control of aeration can promote three different oxygen environments (anaerobic, anoxic, and aerobic) in a single tank. These features make MPSR more able to perform simultaneous nitrogen and phosphorus removal. In addition, because MPSR has a single-tank structure, it is easy to switch between the continuous flow process and batch flow process. In this study, several aspects were focused on, namely the flow field inside the reactor, the distribution of dissolved oxygen, the sewage treatment efficiency, and the evolution of the microbial community in the reactor, to better understand the removal mechanisms of the novel reactor.
2. Materials and Methods
2.1. Description of the Micro-Pressure Swirl Reactor (MPSR)
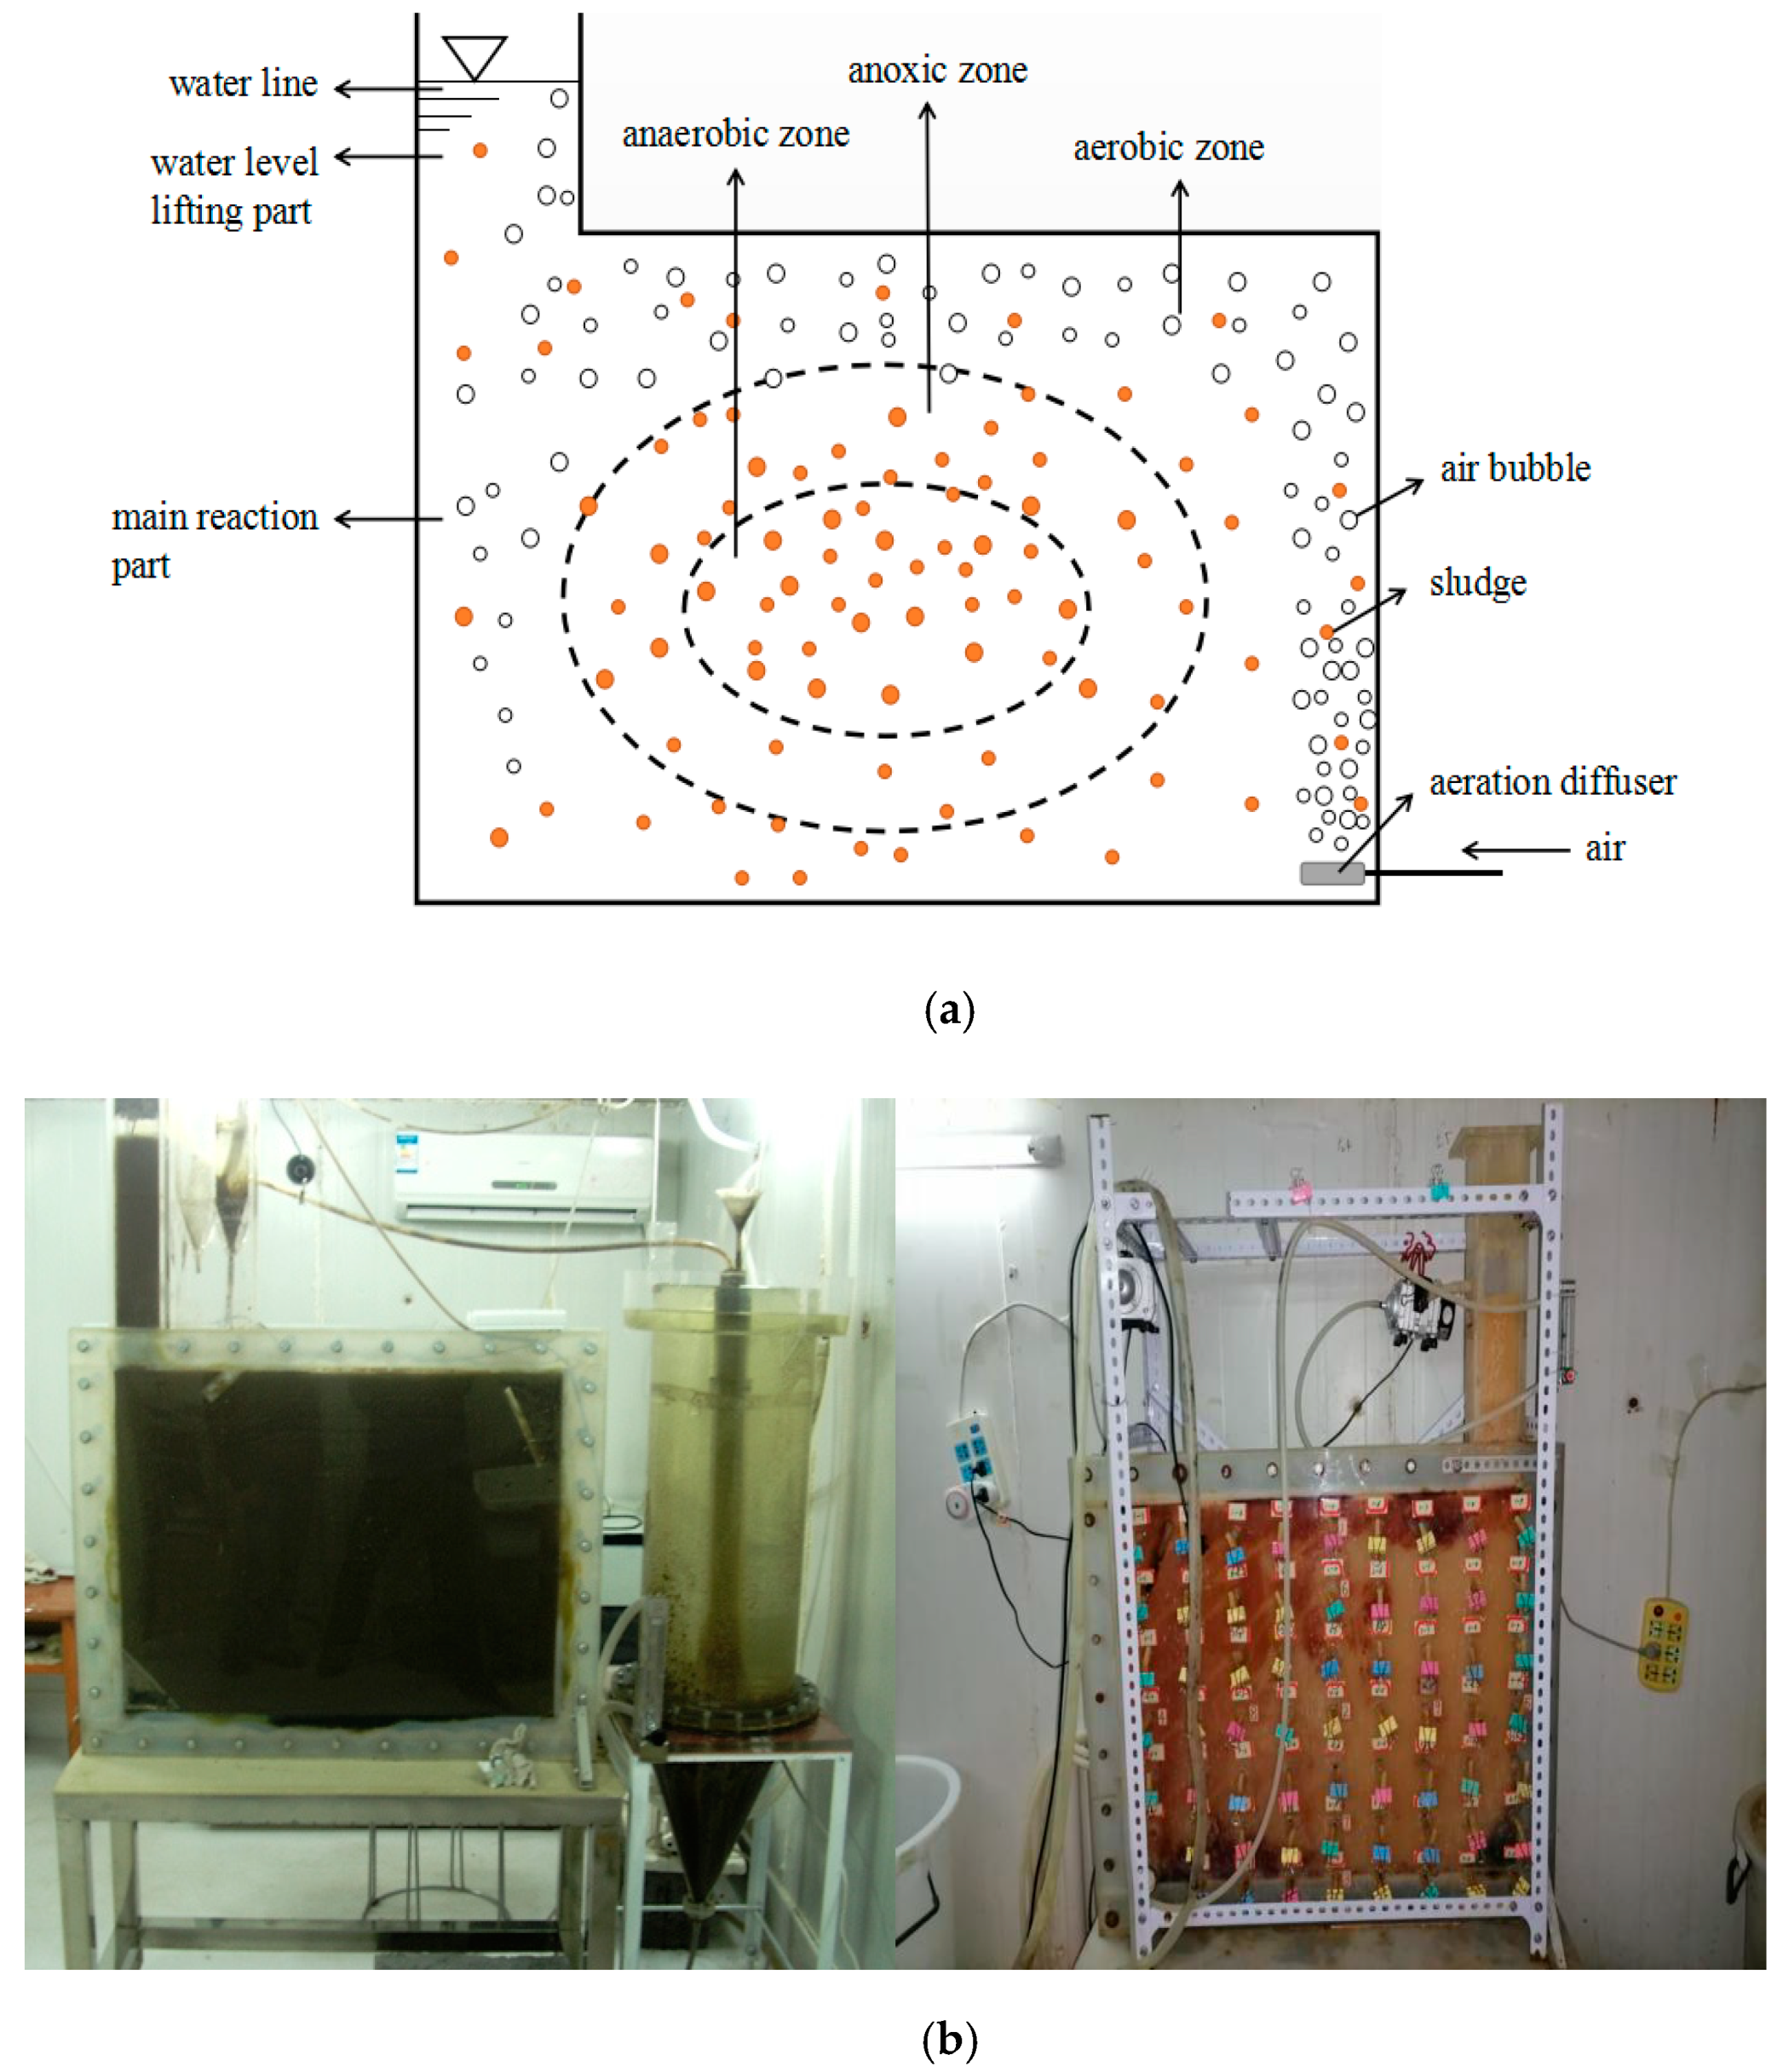
The structure of MPSR and the ideal internal dissolved oxygen partition are shown in Figure 1a. The reactor consists of two parts, the main reaction part and the water level-lifting part. By setting the aeration diffuser along one side of the bottom, the bubbles could be used to drive the liquid flow, so that the mixed liquid in the reactor was powered and circulated. Micro-pressure was generated in the main reaction zone through the water level-lifting part, and the semi-sealed structure on the top of the reactor could prolong the contact time between air bubbles and sewage, thereby, the oxygen transfer efficiency was improved, further improving the aeration efficiency. Since sewage and air bubbles were mainly in contact with the aeration side and the top of the reactor, under appropriate aeration, not only sewage and activated sludge could be mixed and recycled, but dissolved oxygen (DO) concentration could be gradually reduced from the outside to the center of the reactor, forming a different dissolved oxygen zone (aerobic, anoxic and anaerobic).
The running photos of the test model are shown in Figure 1b. The same model was used in two different operating modes, namely continuous operation mode and sequential batch mode. The reactor and sedimentation tank models were made of plexiglass. The effective volume of the reactor model was 54 L. The main reaction part was 800 mm long, 100 mm wide, and 600 mm high. The water level-lifting part was 100 mm long, 80 mm wide, and 800 mm high. The air diffusion device was installed on the bottom of the side opposite to the water level-lifting part of the reactor. The clarification unit of the reactor was a vertical sedimentation tank with an operational volume of 54 L.
2.2. Flow Velocity Distribution Test
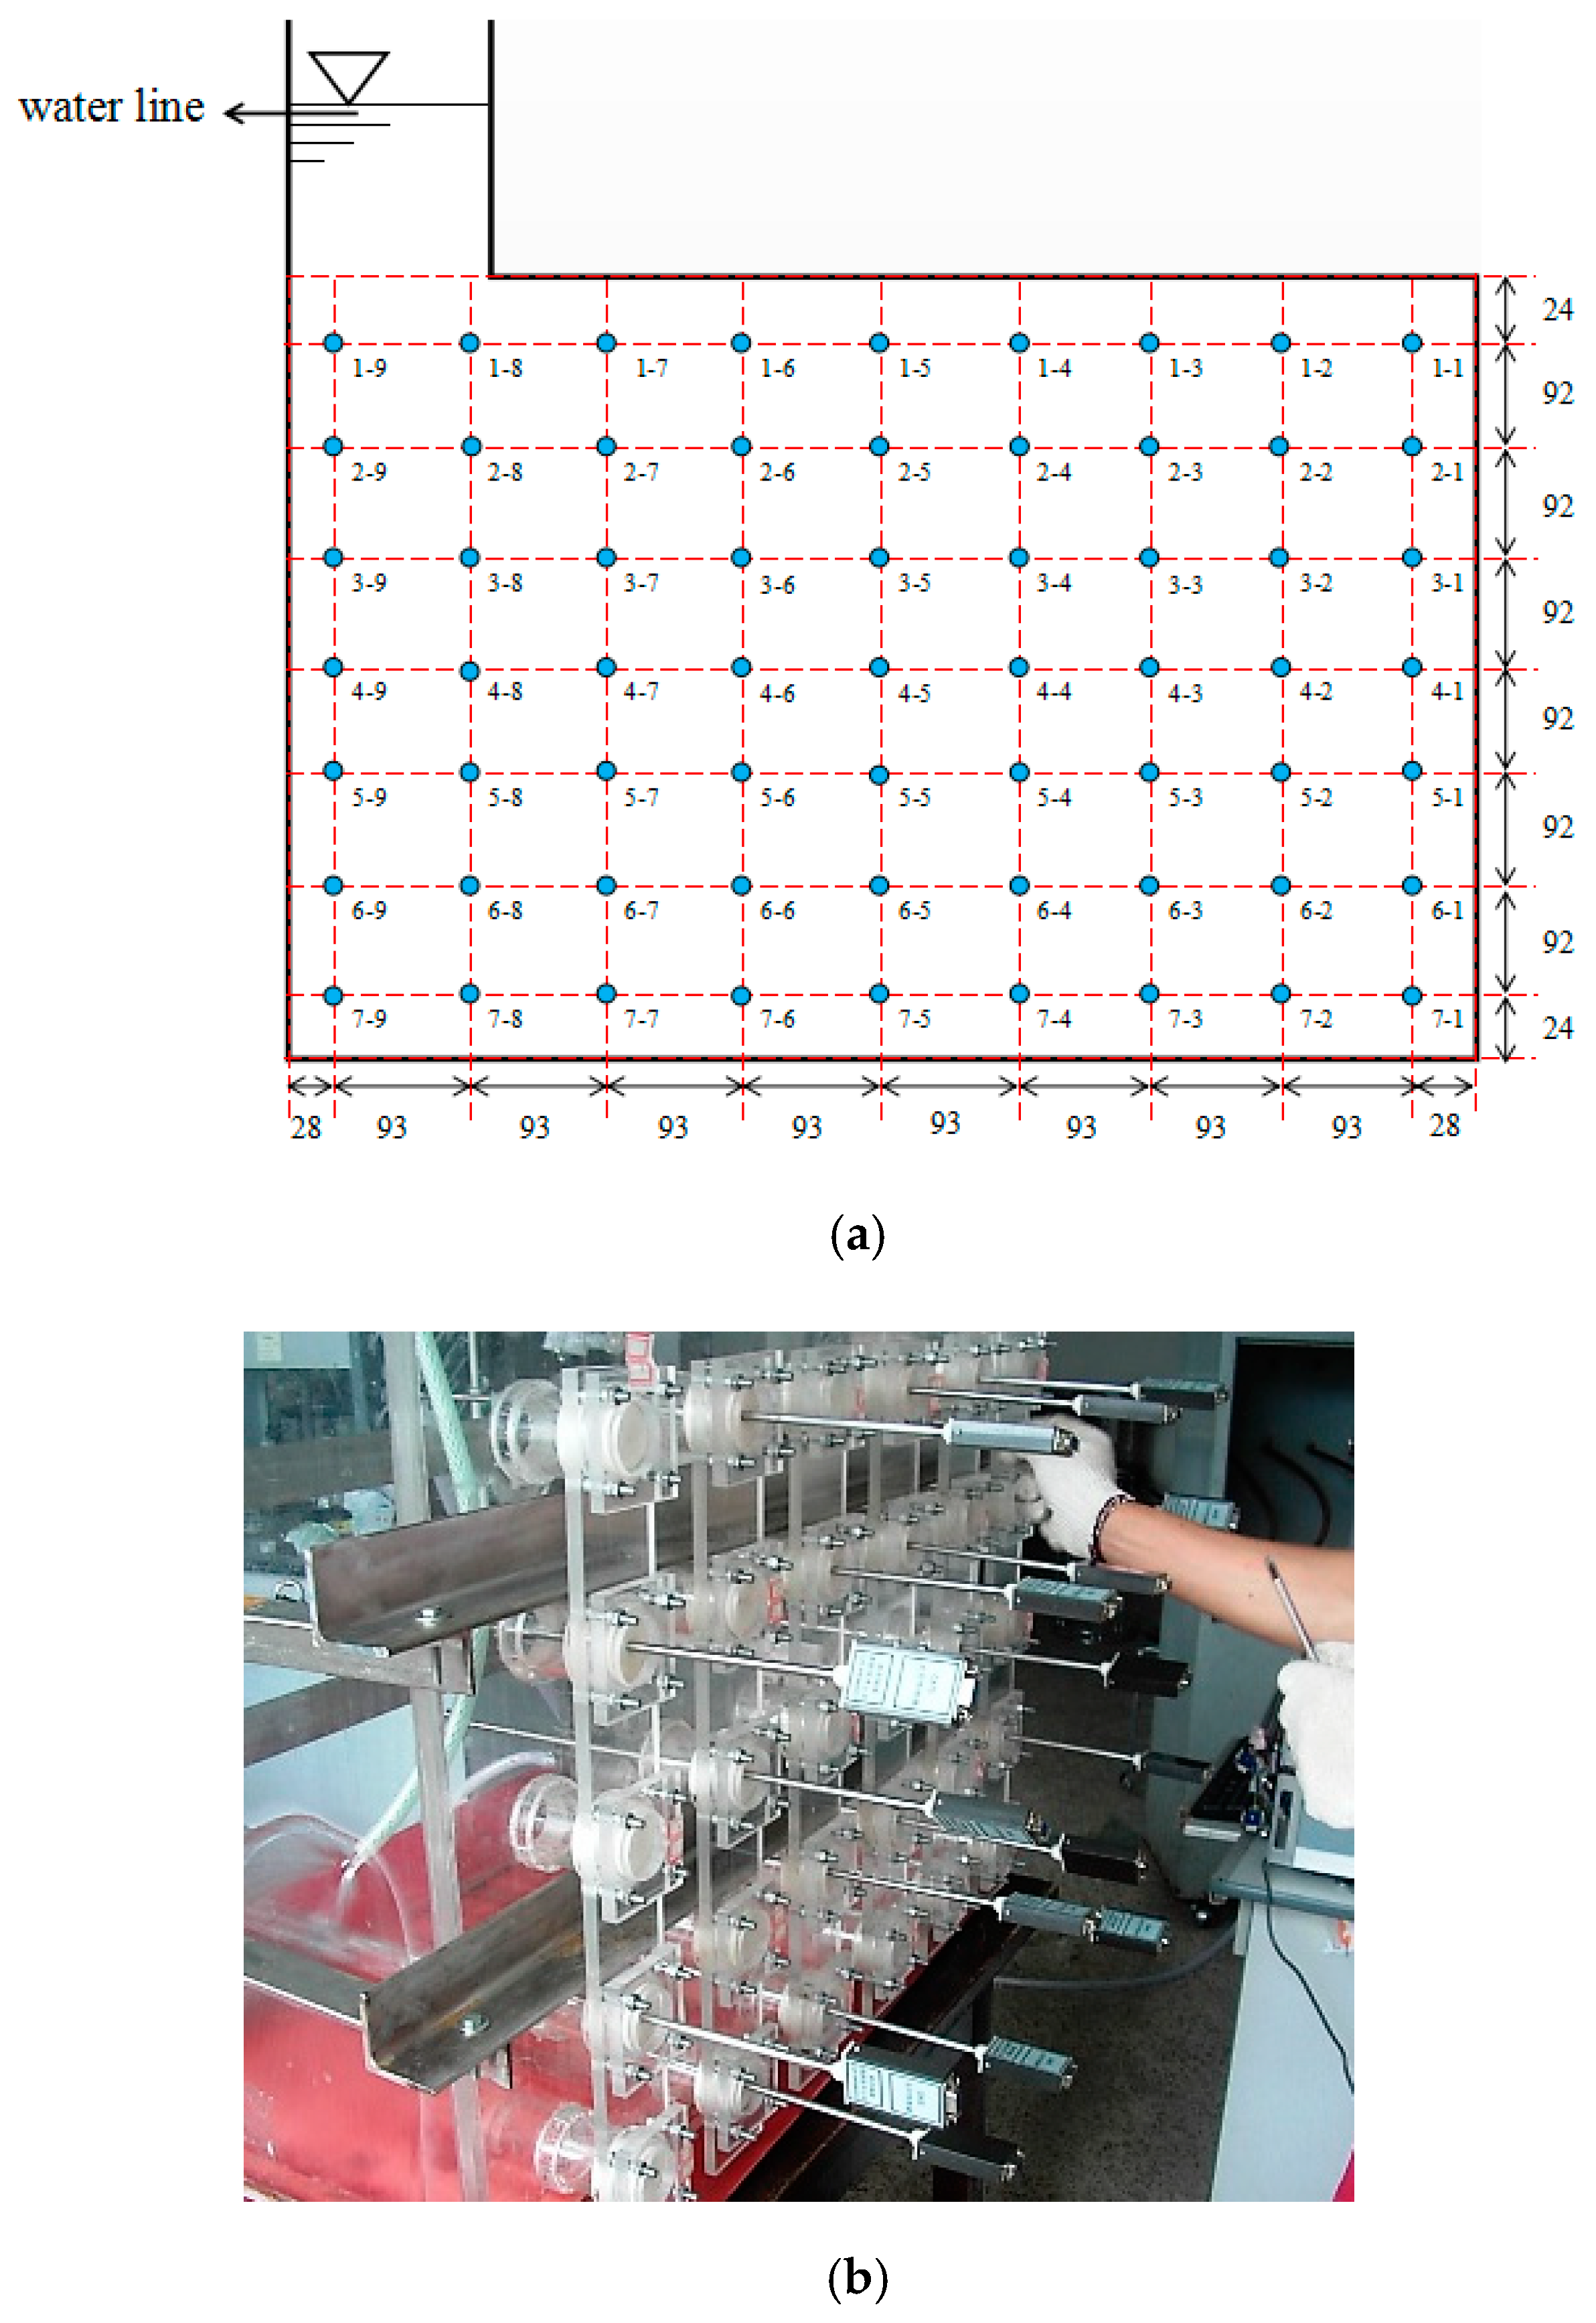
The flow distribution in MPSR was monitored by a flow meter. The water temperature was 20 ± 1 °C and the reactor was filled with tap water, the influence of different aeration amounts on the velocity distribution of the main reaction part of MPSR was studied. The test had shown that the flow velocity distribution of the reactor in the width direction was uniform under the influence of uniformed aeration of the air diffusion device. The cross-section of the reactor at a width of 5 mm was used as a coordinate plane. The right-angle vertex of the MPSR aeration equipment installation area was the origin of the coordinates in the length direction (X axis) and height direction (Y axis). The data collection points for the velocity distribution are shown in Figure 2a. 63 flow velocity collection points were set in the test. The multi-machine non-constant flow function of the multi-functional intelligent flow meter (LGY-III, Nanjing Institute of Water Resources Research, China) was selected to measure the internal water flow rate in real time. The device installation is shown in Figure 2b. The parameters of the instrument were set as follows: the flow rate scale was 1, the acquisition time was 5 s, the acquisition interval was 2 s, and the acquisition times were 20 times. Multi-channel and multi-address flow velocity measurement was selected. The following steps were used in the test:
- The reactor was filled with water to the measurement set level, and the water temperature was controlled at 20 ± 1 °C. The test was performed in a constant temperature-controlled room, and the water temperature was adjusted to 20 ± 1 °C by controlling the room temperature.
- Using an air compressor (ACO-12, Sun sun, China), the aeration volume was adjusted by adjusting the air flow meter (LZB-DK600-4F, Cheng feng, China), the rise water level after adjusting to set value was recorded, and velocity data was collected. Because the rise of the liquid level would cause the display value of the flow meter to decrease, the test stipulated that the set aeration amount was based on the actual display value of the flow meter after inflation.
- When the next aeration amount was detected, the aeration was stopped for 10 min. After the water level was stationary, the reactor was filled with water to the measurement set level, the flow meter was adjusted to the next aeration, and step (2) was performed after stabilization.
- The average velocity of each point was taken and the contour map of the internal velocity distribution of MPSR was drawn by using a commercial three-dimensional (3D) visualization software package (Surfer 8.0, Golden Sofware, USA).
2.3. Dissolved Oxygen Distribution Test
Providing sufficient dissolved oxygen is one of the important purposes of aeration in biochemical tanks. The experiment studied the distribution of dissolved oxygen in MPSR when the model was in continuous flow mode. The test sewage was a mixed sewage of the first sedimentation tank of the sewage treatment station in the suburb of Changchun and artificially added beer. The activated sludge in the biochemical pond of the suburban treatment station was taken as the inoculated sludge, which was added to the MPSR after being filtered through a screen. The initial activated sludge concentration was around 4000 mg/L. It was found that the activated sludge settled at the bottom of the MPSR when the aeration was less than 0.10 m3/h, so the initial aeration of the reactor was controlled at 0.10 m3/h. Both the inlet water and sludge return were controlled by a peristaltic pump (BT300-2J, Longer Pump, China). The inlet water flow was 108 L/day, the return flow was also 108 L/day, the sludge return ratio was 100%, and the hydraulic retention time (HRT) was 12 h. Sludge concentration was measured and regular sludge discharged, the activated sludge concentration was controlled to be about 4000 mg/L. After the removal rate of CODCr reached 80%, and continued to run stably for one week, experimental research on the distribution of dissolved oxygen in MPSR under different aeration was carried out. The distribution of dissolved oxygen detection points is shown in Figure 2a. Dissolved oxygen was detected by four DO meters (Oxi3310-SET1, WTW Company, Germany). Due to limited equipment, interlaced and reciprocated sampling was used to reduce the detection interference. The test time for each point was 1 h, the data recording interval was 10 min, and a total of 6 sets of data was gathered. Three tests were performed for each aeration amount, and the average value of a total of 18 sets of data at each point was taken as the DO value of the point at this aeration amount. The 3D visualization software (Surfer 8.0) was used to draw the contour map of the DO distribution of the MPSR main reaction zone at each aeration amount.
2.4. Research on MPSR Sewage Treatment in Two Operation Modes
In order to meet the requirements of a rural sewage treatment station in northern China, this study investigated the effects of MPSR in continuous operation mode and sequential batch operation mode. Firstly, the operating parameters of the continuous flow operation mode were basically consistent with the DO distribution test. The difference was that the sludge residence time (SRT) was controlled to 27 ± 3 days by regular discharge of biomass, and the concentration of mixed liquid suspended solids (MLSS) was maintained at 4000~4500 mg/L. Secondly, the operating parameters of the sequential batch mode were as follows: the single operating cycle of the reactor was 720 min, including 30 min of water inlet, 600 min of aeration, 70 min of sedimentation, and 20 min of drainage. The drainage ratio was 50%, and the residence time of sludge was also controlled to 27 ± 3 days. The test was performed at room temperature. Due to the temperature difference between day and night, the inlet water temperature ranged from 15.7 to 23 °C. The quality of the inlet water is shown in Table 1. At the same time, the aeration volume of the two modes was controlled to 0.2 m3/h according to the previous experimental. The summary of the control parameters of the two modes is shown in Table 2.
2.5. Microbial Community Analysis
Microbial samples at points 1-5, 4-3, 4-5, 4-7, and 7-5 were collected during the steady period of MPSR operation in continuous flow mode. The samples were washed with PBS (Phosphate buffer saline) buffer, then DNA was extracted using a DNA Isolation Kit (MO BIO Power So) (Amann 1995). GC-clamp-F357 primer (Base pairs, guanine and cytosine in DNA) (5′–CGCCCGCCGCGCCCCGCGCCCGGCCCGCCGCCCCCGCCCCCCTACGGGAGGCAGCAG-3′) and R517 primer (5′-ATTACCGCGGCTG CTGG-3′) were used to amplify the bacterial 16SrRNA (16S ribosomal RNA) gene. The PCR (Polymerase chain reaction) products were separated by using DGGE (Denatured gradient gel electrophoresis) with a D-Code universal mutation detection system (Bio-Rad Laboratories, Hercules, CA, USA) according to the instruction manual. The dominant bands in the DGGE gel were excised and used as direct templates for PCR, agarose gel was recovered and purified after electrophoresis, and DNA fragments were sequenced.
2.6. Other Analysis Methods
Temperature, DO, and pH were monitored by WTW Multi 340imeter with DO and pH probes (WTW Company, Germany). COD (Chemical oxygen demand) was measured with a COD quick-analysis apparatus (Lian-hua Tech. Co., Ltd., 5B-1, China). TN, NH4+-N, TP (TN: Total nitrogen; NH4+-N: Ammonia nitrogen; TP: Total phosphorus), and MLSS were analyzed according to standard methods [16].
3. Results and Discussion
3.1. Research on Velocity Distribution in MPSR
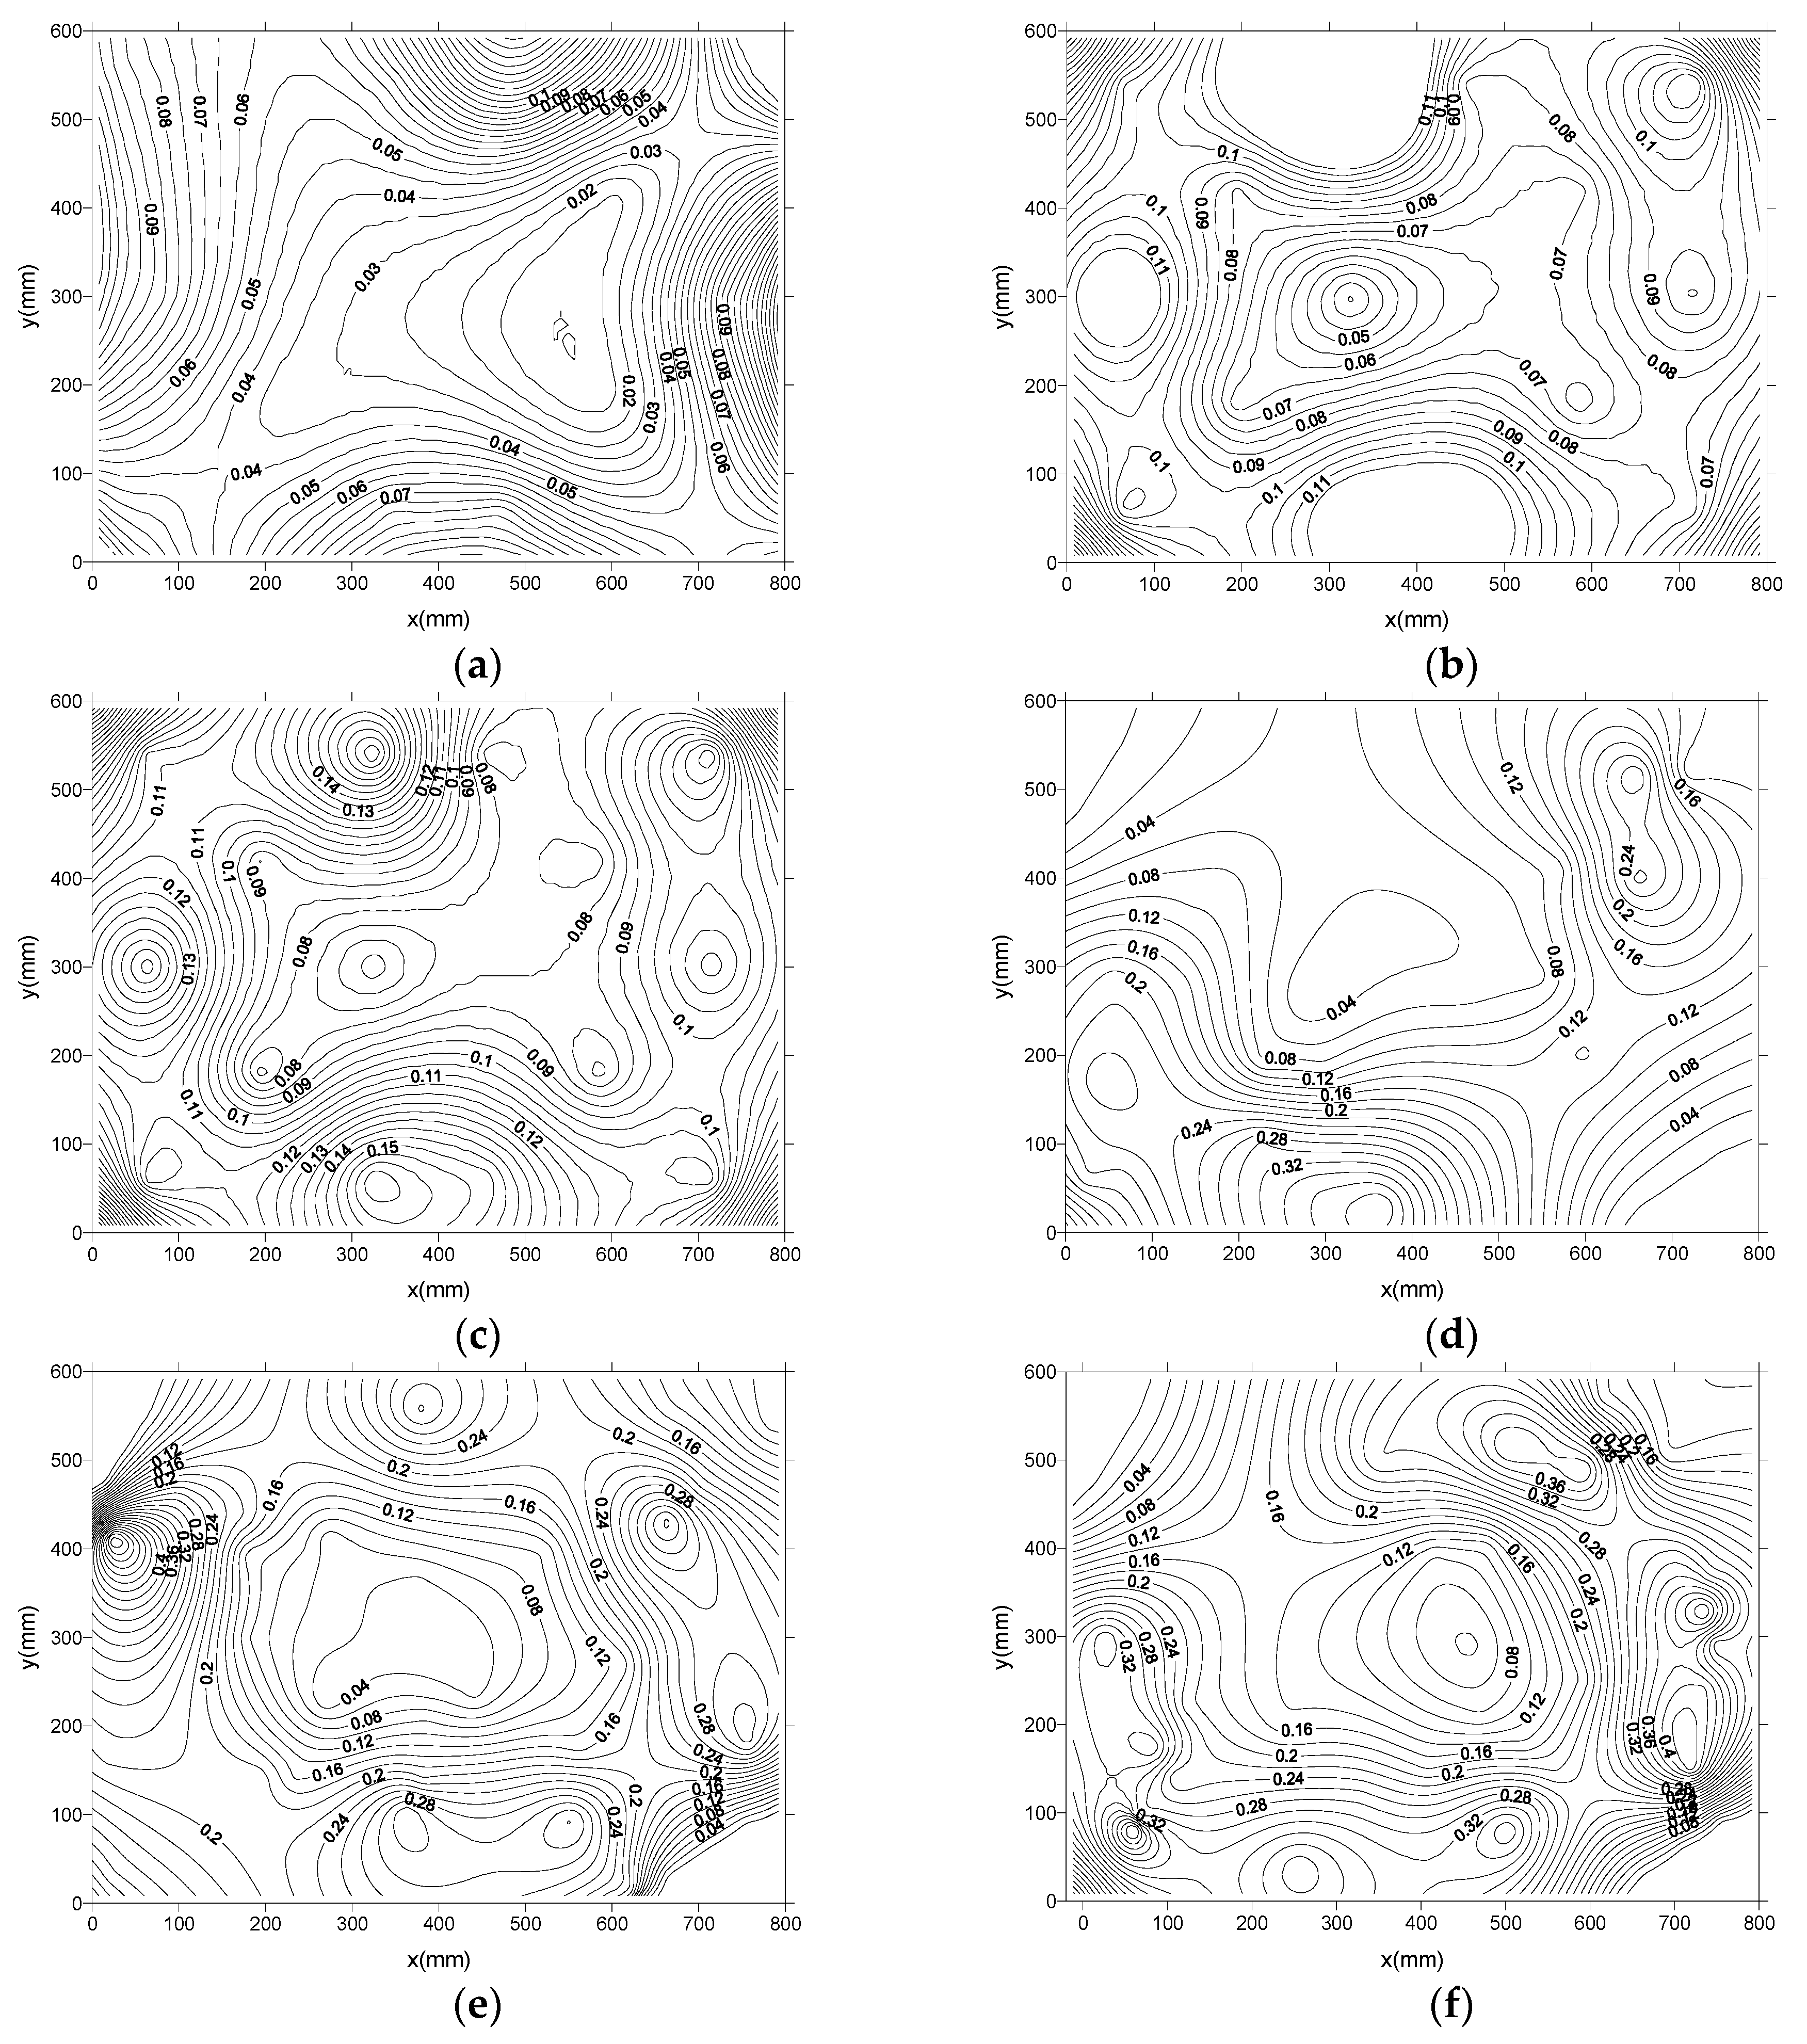
This test detected the flow velocity distribution of the MPSR main reaction zone when the aeration amounts were 0.04, 0.06, 0.10, 0.15, 0.20, and 0.30 m3/h, and the results are shown in Figure 3. It could be seen that as the amount of aeration increased, the average velocity of the water flow also increased. Under the six different aeration amounts, a low-speed circulation area was formed in the central area of the reactor. The formation of this zone provided a prerequisite for the formation of different dissolved oxygen zones in the actual operation. The sizes of the central circulation zones formed by different aeration amounts were different. The larger the aeration amount, the smaller the zone was. The flow velocity around the main reaction zone was high, and the flow velocity gradually decreased toward the center, and a relatively stable circulating flow was formed in the main reaction center zone. Due to the viscous force of the side plate to the water flow and the impact and reflection of the water flow, the four corners of the main reaction zone formed unstable vortex zones. In the aeration zone and the bubble rising zone, the bubbles were dense, and strong kinetic energy and momentum exchange were generated with the contact water flow. The turbulence was obvious, and the flow velocity was the largest. At the junction of the main reaction part and the water level-lifting part, the bubbles moved upwards due to buoyancy and the water they wrap around continued to move forward due to inertia. Here, the gas–liquid separation was intense, and the liquid flowed back strongly, forming a strong turbulence zone. In addition, only when the bubbles in the upper area directly opposite the aeration diffuser head accumulated to a certain amount, did it begin to flow horizontally with water, so that the water flow in the main reaction zone showed a pulse motion state.
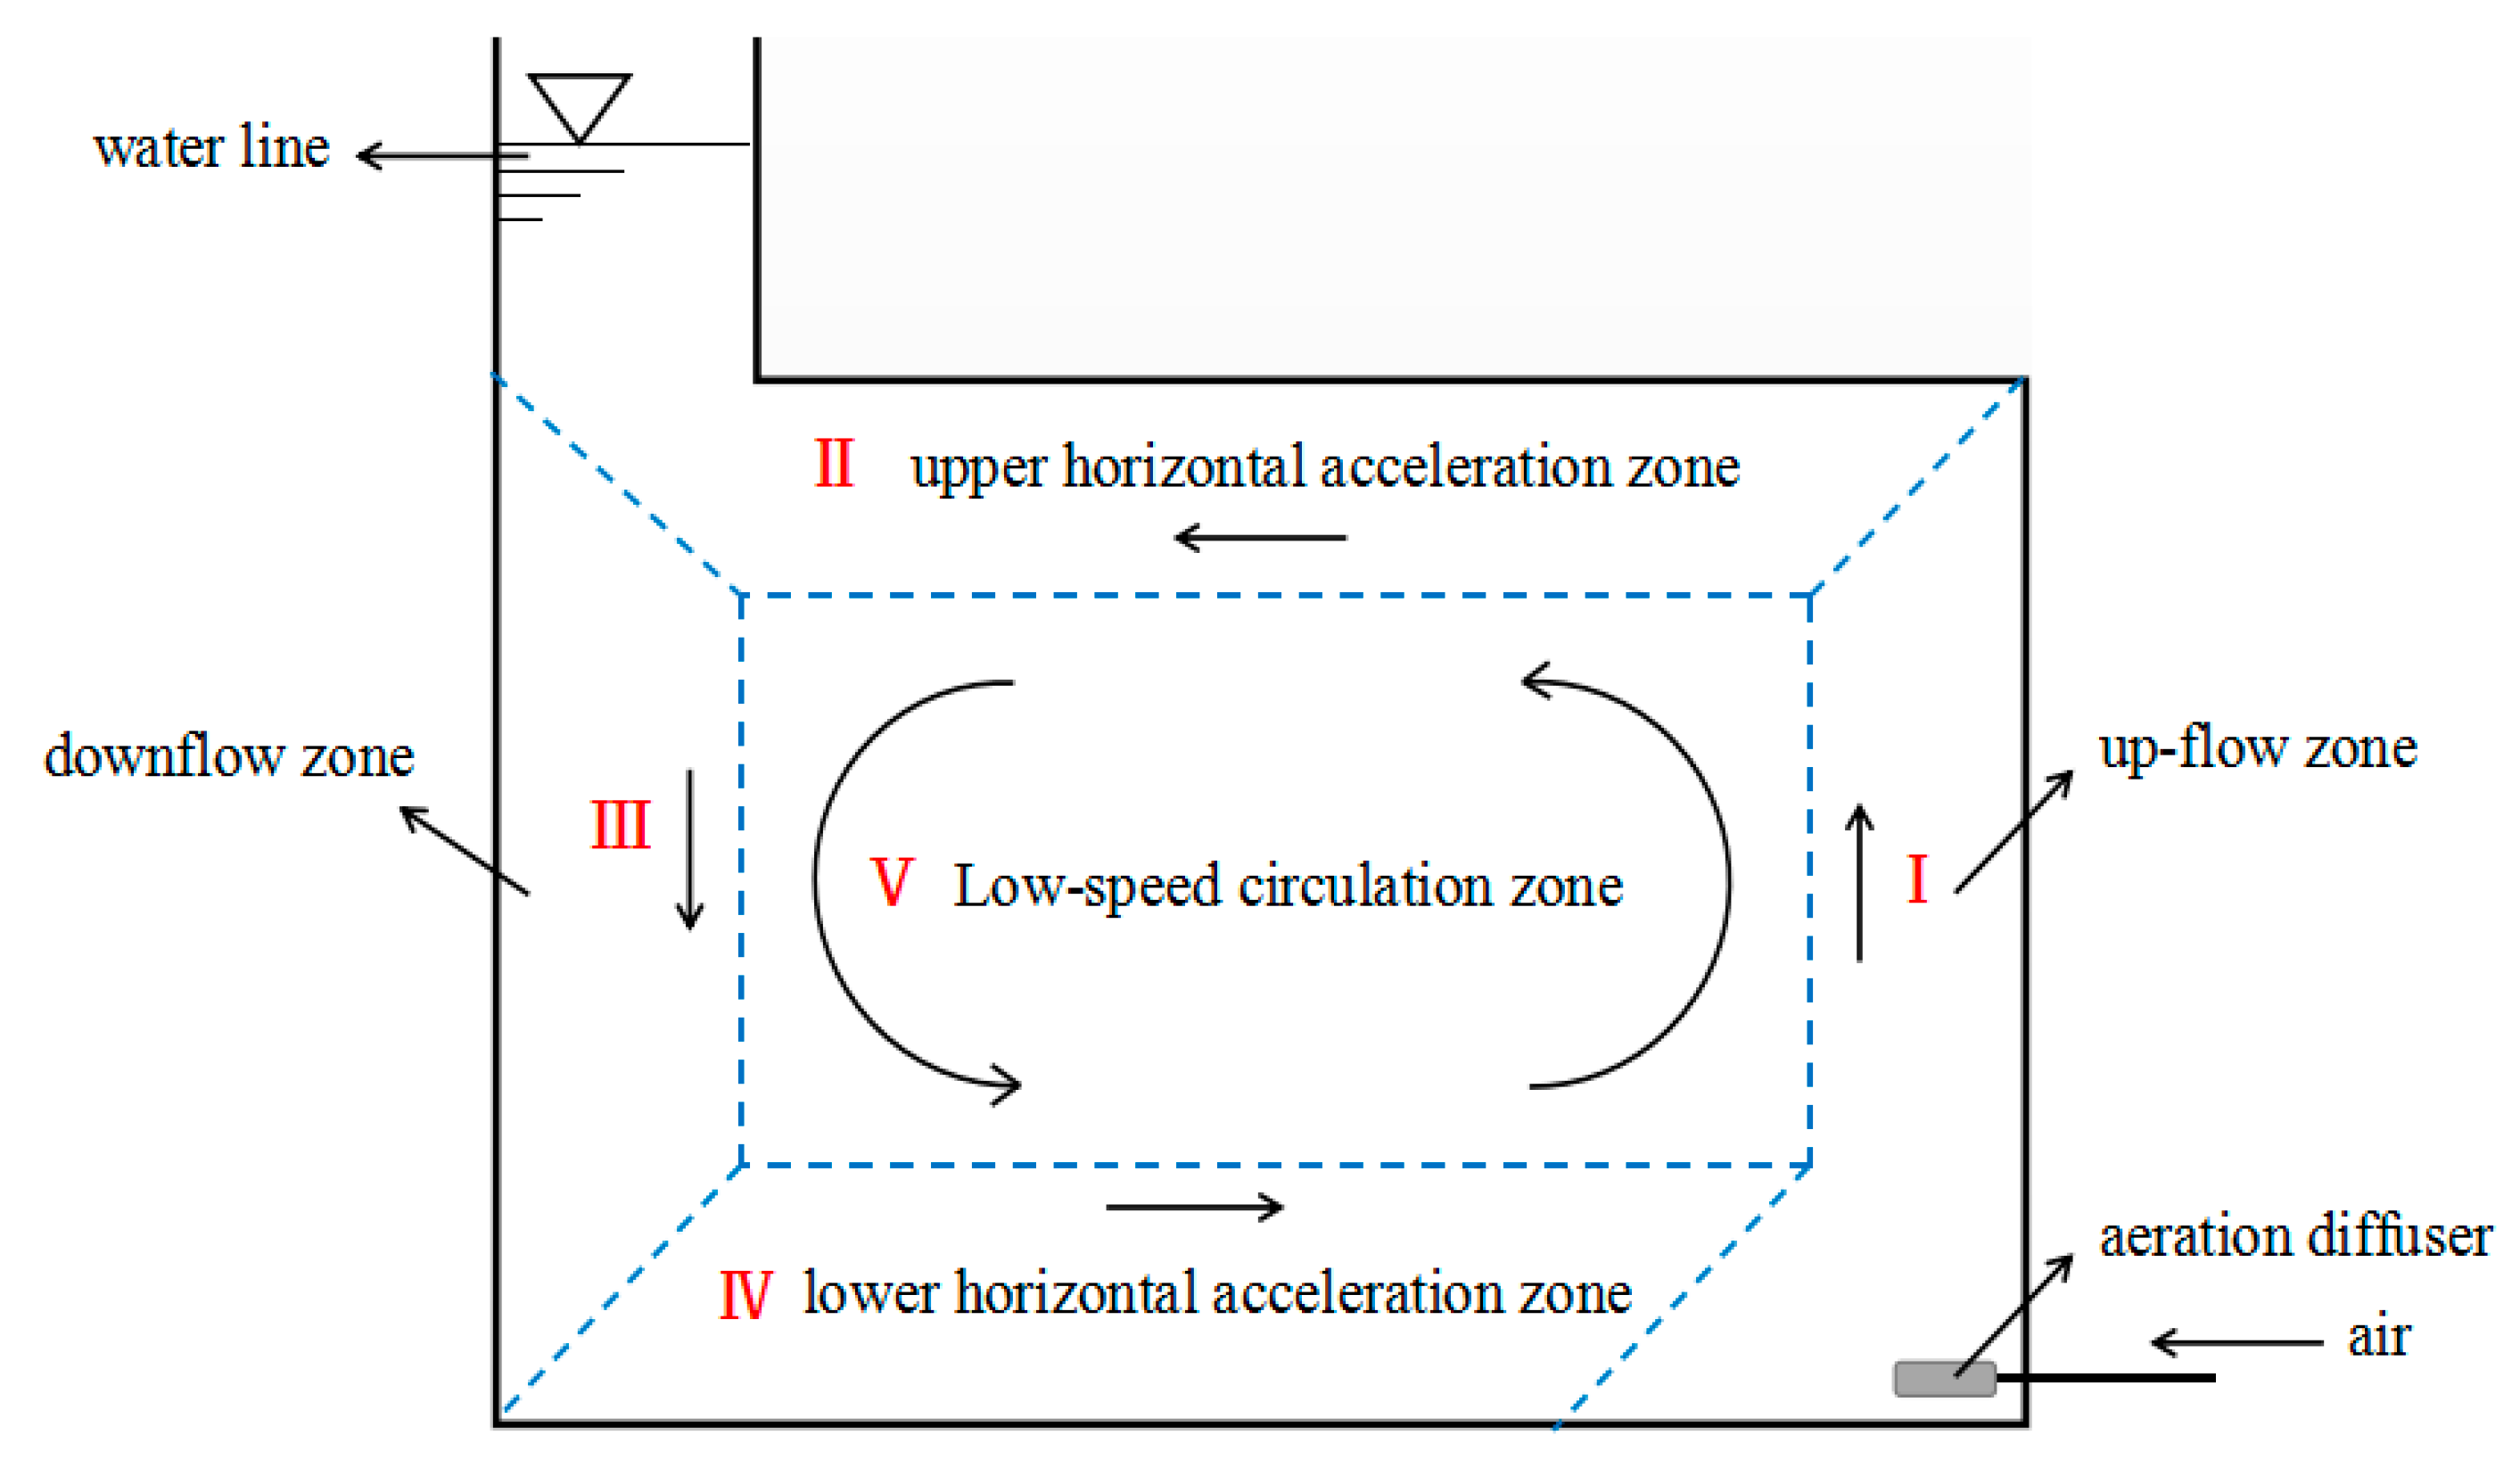
Through the study of the flow velocity distribution under different aeration rates, the results showed that the MPSR main reaction zone could be divided into five zones according to the different directions and modes of water flow. The regional distribution diagram is shown in Figure 4. They were: up-flow zone (I), upper horizontal acceleration zone (II), down-flow zone (III), lower horizontal acceleration zone (IV), and central low-speed circulation zone (V). The up-flow zone was located directly above the aeration diffusion device. Under the action of aeration, the bubbles accelerated upward due to buoyancy, and the water current also accelerated upward under the influence of the bubbles. This zone was the main source of power for the water circulation in the reactor, and it was also the zone with the fastest water flow velocity. The top horizontal accelerated flow zone was located near the top cover of the reactor. When water and air bubbles accelerating in the up-flow zone met the top cover, the flow rate dropped rapidly. Some bubbles started to move horizontally with the inertia of the water flow, but some bubbles would gather near the cover. As the volume of the bubbles increased, the water flow began to accelerate horizontally under the continuous squeeze of the bubbles. The down-flow zone was located on the opposite side of the up-flow zone, and the flow direction was also opposite. This zone would wrap some of the bubbles in the upper horizontal acceleration zone, but due to buoyancy, the number of bubbles that were wrapped was small and the volumes of it were small too. The down-flow zone was also in an accelerated motion state, and its power was mainly derived from the gravity acceleration of the water. The lower horizontal acceleration zone was located in the near wall area at the bottom of the reactor. There were almost no air bubbles in this area. The water flow was accelerated horizontally under the suction effect of the aeration area. Due to the limited scope of aeration, when the amount of aeration was small and the water flow energy on the side near the down-flow zone was insufficient, activated sludge precipitation in this area was prone to occur in actual operation. The central low-speed circulation zone was located in the central area of the main reaction zone. There were no air bubbles in this zone. Due to the viscosity of the water, the kinetic energy of the water flow in the four surrounding zones was transferred to the central area, thereby ensuring the continuity and stability of the cycle. Although there were different acceleration forces in the four surrounding zones, it was difficult to continuously accelerate the water flow due to the blockage of the reactor side wall. At the same time, turbulence existed in the surrounding zones due to aeration disturbance, gas-liquid separation, and side wall reflection of the water flow. The existence of these turbulences promoted the material exchange between the surrounding zones and the central circulation zone, which had a certain promotion effect on the actual sewage treatment of MPSR.
The flow velocity distribution test not only revealed the flow velocity distribution of the main reaction zone under each aeration amount, but also obtained the flow pattern distribution of the main reaction zone under each aeration amount. From the experimental results, it could be found that the flow velocity increased in the I, II, III, and IV flow zones distributed around the main reaction zone, and the corresponding acceleration power in each zone helped to maintain and stabilize the circulating flow. Turbulence at the four apex corners of the main reaction zone accelerated the mass exchange. These provided the basic conditions for MPSR to ensure that sewage and microorganisms were in a mixed state and promoted pollutant removal.
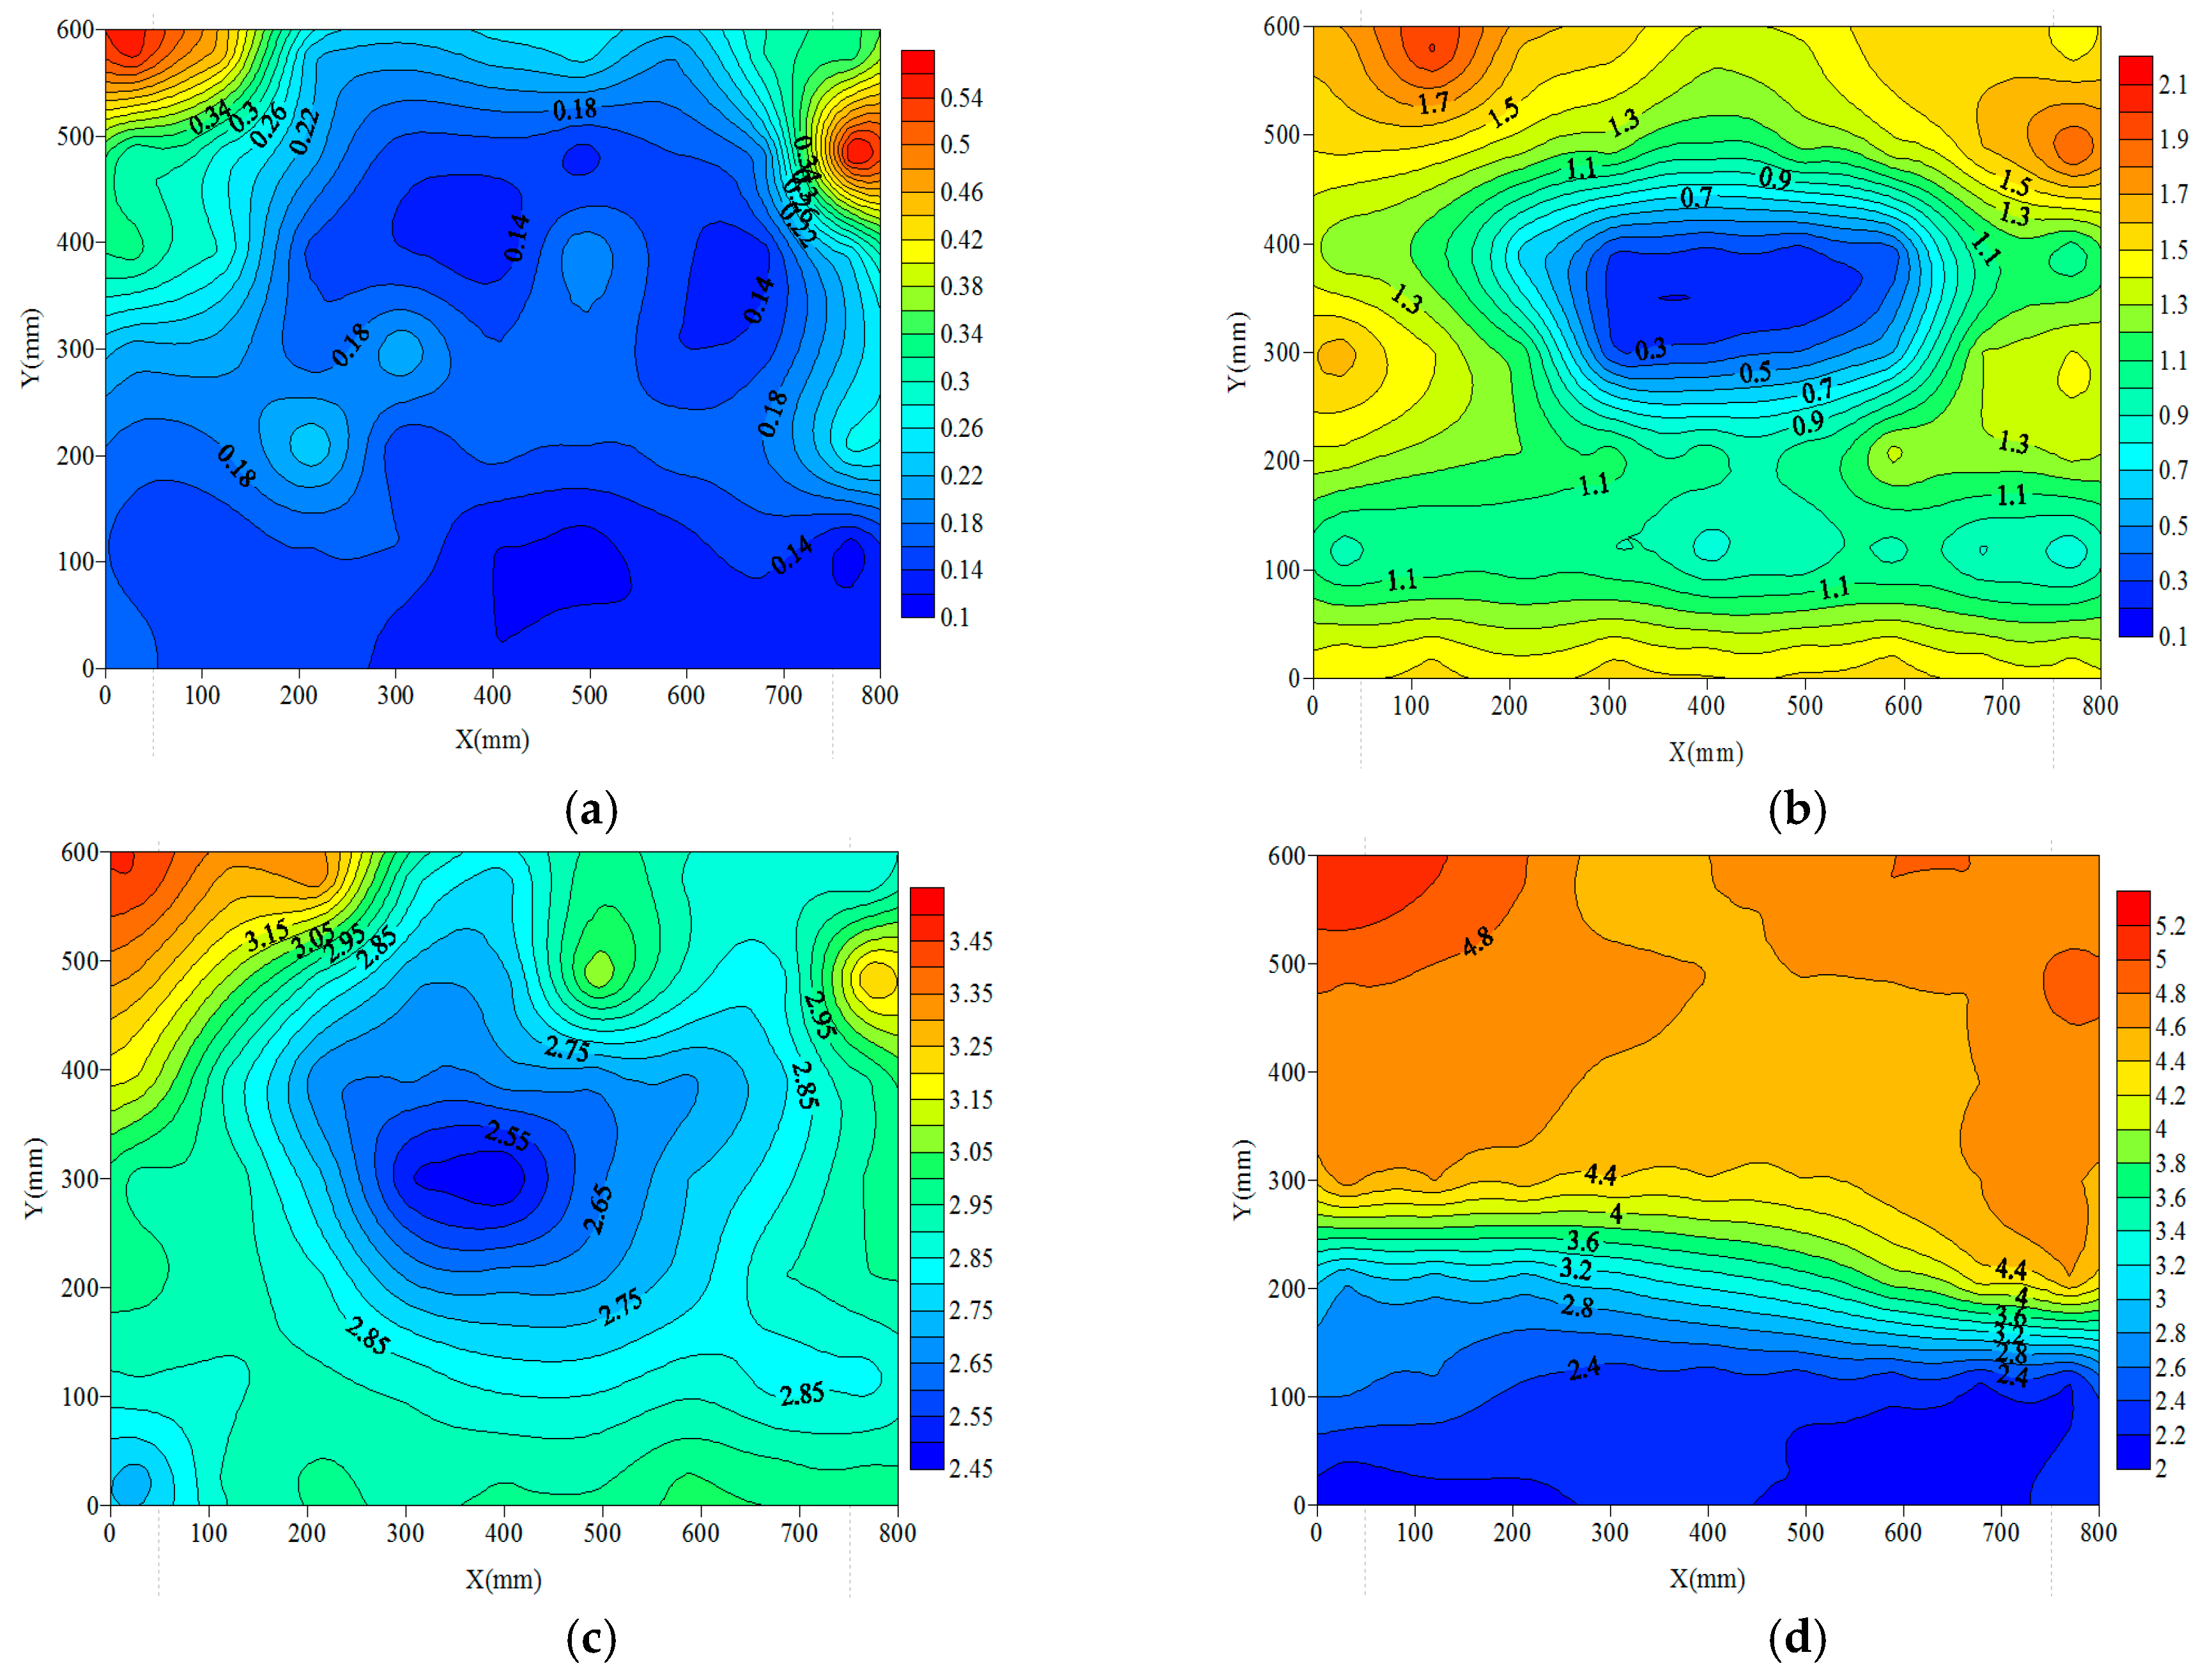
For MPSR, aeration has two important functions. One is to ensure the circulating flow of the mixed liquid in the reactor. The other is to provide sufficient dissolved oxygen for biochemical reactions. In order to determine the optimal aeration volume of the reactor under the experimental conditions, the internal dissolved oxygen distribution of the MPSR was studied in a continuous operation mode. Under the test conditions, when the aeration amount was less than 0.1 m3/h, activated sludge sedimentation existed in the horizontal acceleration zone. Therefore, the test was performed when the aeration amounts were 0.1, 0.2, 0.3, and 0.4 m3/h, and the test results are shown in Figure 5. It can be seen that the dissolved oxygen distribution and flow velocity distribution in the main reaction zone were very different. Although the dissolved oxygen also showed a law of lower center and higher edge, this law was not obvious when the aeration amount was relatively low and high. Meanwhile, different aeration levels have a greater impact on the dissolved oxygen distribution in the main reaction zone.
It could be seen from Figure 5a that when the aeration amount was 0.1 m3/h, the dissolved oxygen supply was obviously insufficient. The average dissolved oxygen in the entire main reaction zone was below 0.5 mg/L, and there was no obvious aerobic zone. It was not conducive to the removal of organic matter and the occurrence of nitrification. At sampling point 2-1 on the aeration side, the dissolved oxygen value was the largest at 0.58 mg/L. At the sampling point 3-5 near the center of the reactor, the dissolved oxygen was the smallest, which was 0.11 mg/L. Although the edge dissolved oxygen was higher and the center dissolved oxygen was lower, the difference was only 0.47 mg/L. No distinctly different dissolved oxygen partitions were formed. It could be seen from Figure 5c that when the aeration volume was 0.3 m3/h, the dissolved oxygen supply was obviously excessive. Although the difference between the maximum dissolved oxygen and the minimum dissolved oxygen was 0.81 mg/L during this aeration, which was higher than that when the aeration was 0.1 m3/h, the gradient of the dissolved oxygen was still not obvious. The average dissolved oxygen in the entire main reaction zone was 2.85 mg/L, and there was no anaerobic zone and anoxic zone. This would severely interfere with the denitrification process. When the aeration amount was 0.4 m3/h, it could be found that the dissolved oxygen distribution in the main reaction zone no longer followed the previous rule. From Figure 5d, in the upper half of the main reaction zone, because the water flow directly contacted the air bubbles, the dissolved oxygen was higher. Due to the greater aeration intensity, the turbulence in the reactor was more intense. The strong material exchange broke the distribution of high oxygen, middle oxygen, and low oxygen in the reactor, and made the dissolved oxygen distribution of the reactor closer to a completely mixed state.
When the aeration amount was 0.2 m3/h, the characteristics of the DO contour map were similar to those of the velocity profile. As shown in Figure 5b, the lowest value of dissolved oxygen was 0.24 mg/L at sampling point 3-4, which was close to the center of the reactor. The highest value of dissolved oxygen was 2.02 mg/L at the sampling point 1-8, and the position was on the edge of the reactor. The difference reached 1.8 mg/L. The DO gradient distribution in the main reaction zone was clearly discernible, and the DO concentration decreased from the outer layer to the inner layer. The dissolved oxygen concentration in the outer layer was 1.2 to 1.6 mg/L, the dissolved oxygen concentration in the middle layer was 0.6 to 1.0 mg/L, and the dissolved oxygen concentration in the center layer was 0 to 0.4 mg/L. The aerobic zone, anoxic zone, and anaerobic zone coexisted in the same biochemical aeration tank. In addition, influent was introduced into the central area of the reactor, which could not only provide an electron donor for the denitrifier, but also facilitate the growth of nitrifying bacteria in the outer layer. It was beneficial to the simultaneous removal of nitrogen and phosphorus from the reactor. From the continuous flow MPSR dissolved oxygen distribution, it could be found that the optimal aeration amount was 0.2 m3/h under the experimental conditions.
It was an important breakthrough to realize the coexistence of anaerobic, anoxic, and aerobic in a single biological aeration tank. Although the presence of simultaneous nitrification and denitrification confirmed the existence of an anaerobic microenvironment in the SBR aeration tank, the actual anaerobic zone was more important for practical operation. As shown in Figure 3e and Figure 5b, the sewage could enter from the MPSR center at points 4-5, which were located in the central circulation area and the anaerobic area. Due to the low flow velocity of the central circulation and the anaerobic environment, the organic matters in the influent could be fully used for anaerobic phosphorus release and denitrification. With the circulation of the mixed solution, the influent gradually diffused into the anoxic zone. The anoxic zone was in direct contact with the aerobic zone, and nitrate nitrogen produced by nitrification in the aerobic zone was easily exchanged to the anoxic zone, where the denitrification mainly occurred. Finally, the influent diffused into the aerobic zone. Due to the consumption of organic matters, aerobic phosphorus absorption and nitrification occurred mainly in the aerobic zone. Therefore, MPSR could achieve simultaneous nitrogen and phosphorus removal.
3.2. The Results of MPSR Sewage Treatment
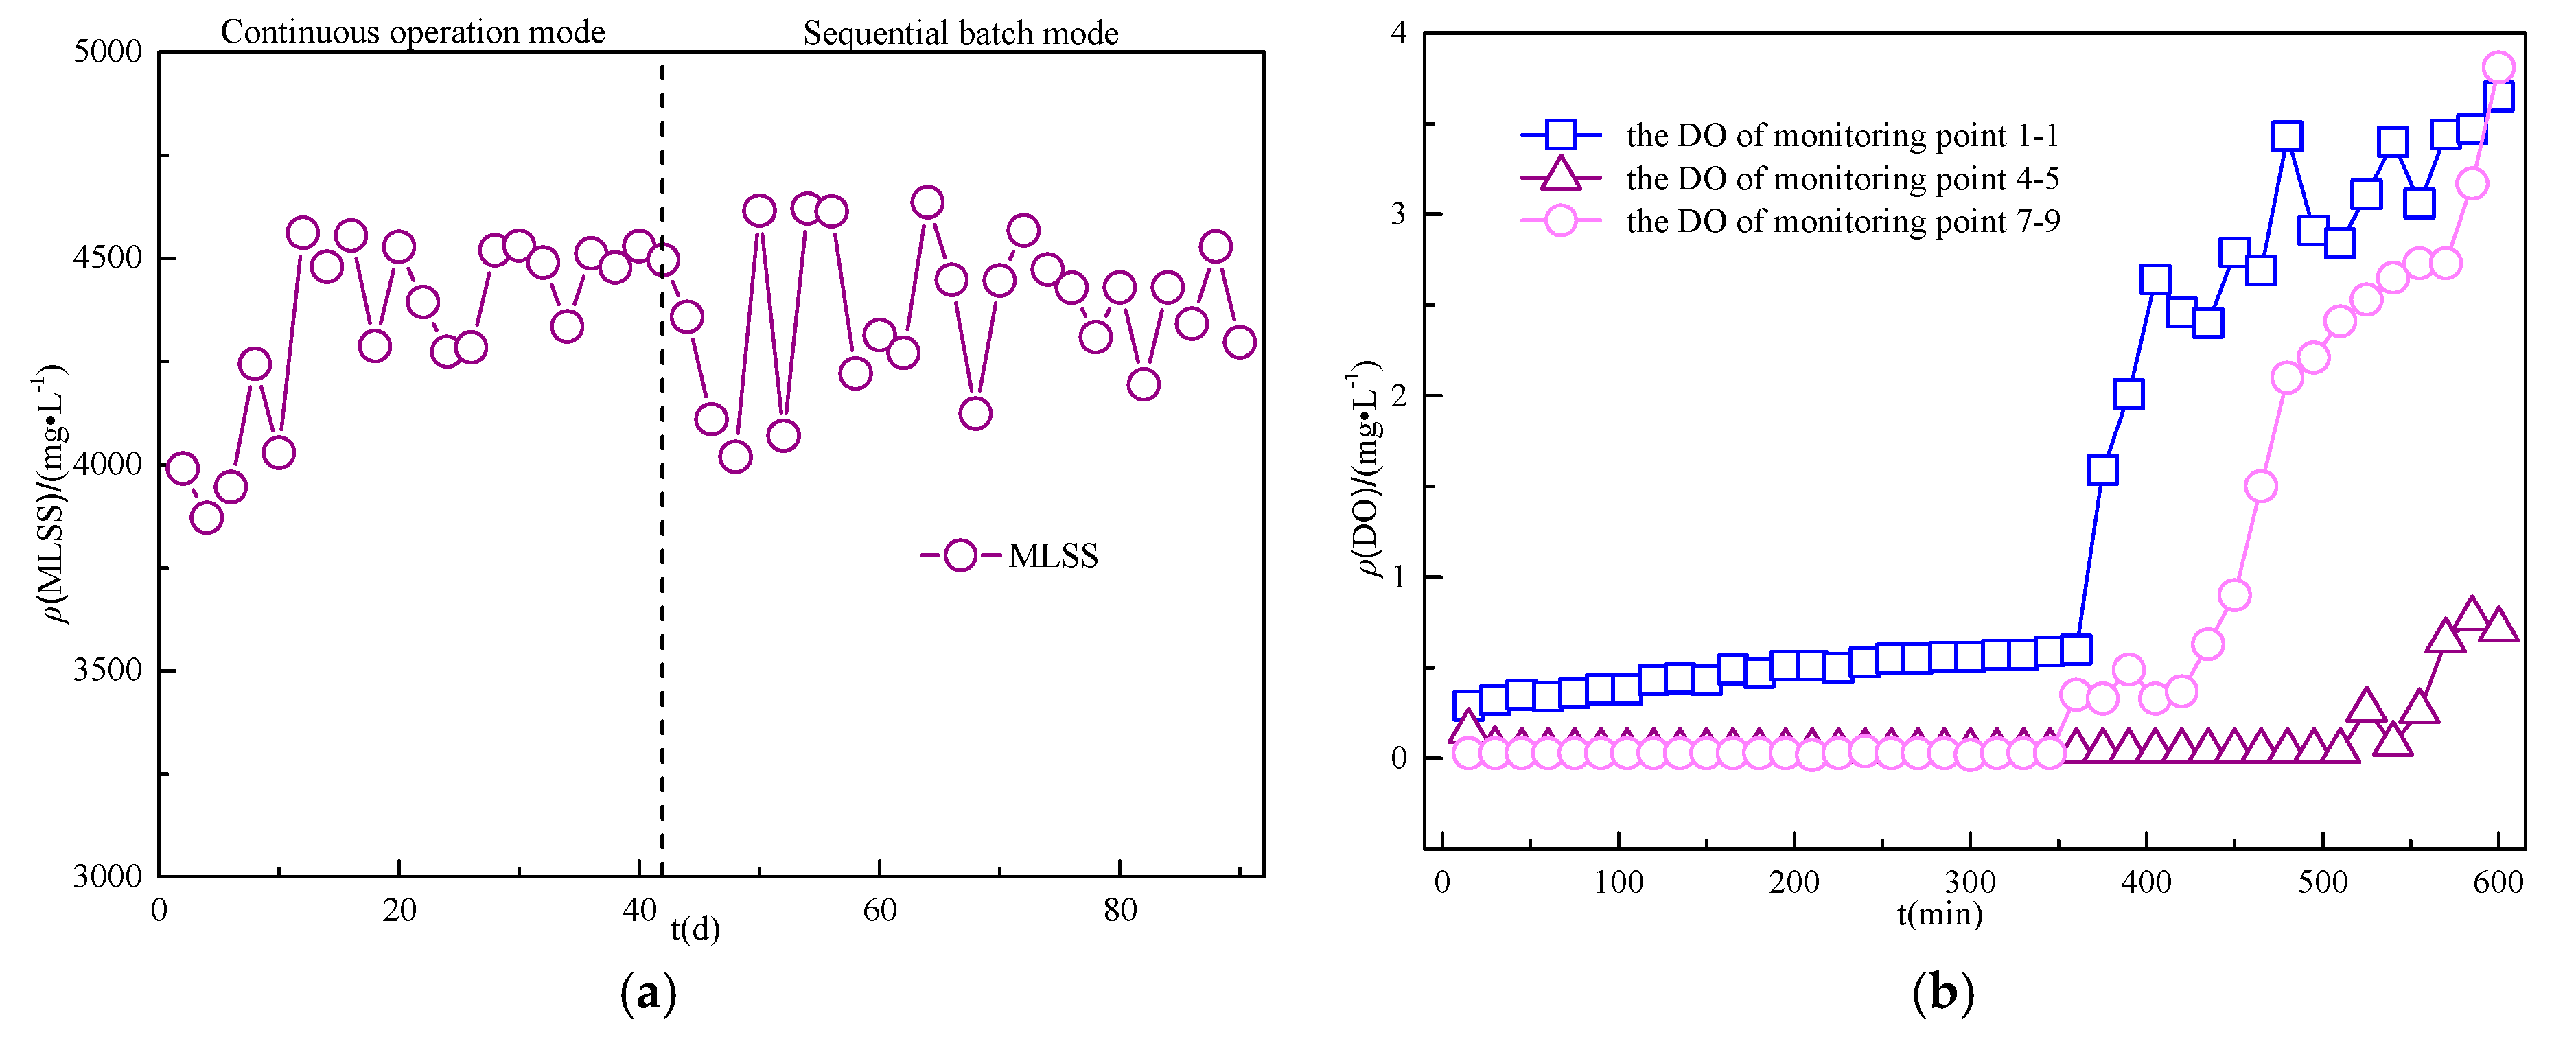
During the operation of MPSR in continuous operation mode and sequential batch mode, the change of the mixed liquor suspended solids (MLSS) concentration with the running time is shown in Figure 6a. MLSS was tested every two days, in which continuous operation mode ran for 42 days and sequential batch mode ran for 48 days. The change of MLSS concentration had an important impact on the distribution of dissolved oxygen and the removal of pollutants in MPSR. Therefore, maintaining stable MLSS concentration was a prerequisite for MPSR to run well. From Figure 6a, the MLSS changed little during operation, and its concentration was basically maintained between 4000~4500 mg/L.
Figure 6b showed the change law of DO at the three sampling points of the main reaction zone 1-1, 4-5, and 7-9 during a single aeration period when MPSR was in sequential batch mode. During the operation of the reactor in the batch mode, the aeration time of a single cycle was 600 min (10 h). Unlike the dissolved oxygen distribution in the continuous operation mode (Figure 5a), in the sequential batch mode, all zones of the MPSR were in a low-oxygen environment during an aeration time of 0~360 min. With the increase of the reaction time, DO in each zone of MPSR increased. Although the DO distribution in the MPSR at the initial stage of aeration was similar to that of ordinary SBR aeration tanks, the MPSR was characterized by different DO rise times in various zones in the later stage of the aeration. From Figure 6b, during the aeration from 0 to 360 min, the DO had been slowly rising at the sample point 1-1, and the average DO at this stage was 0.5 mg/L. After 360 min, DO began to rise sharply. At the end of the aeration period, the DO at point 1-1 was stable at about 3.5 mg/L. From Figure 2a, the sampling point 1-1 was located directly above the aeration diffusion device. This zone was also the place where the bubbles were easy to gather. Therefore, the DO at point 1-1 was higher than that at point 4-5 and 7-9. Its sharp increase in DO was also the earliest. During the 0~360 min aeration, the DO at sampling points 4-5 and 7-9 were basically unchanged and maintained at a low level. During this period, the average value of DO at both points was below 0.1 mg/L. After 360 min of aeration, there was a difference in DO change between the two points. After aeration for 360 min at sampling points 7-9, the DO showed a slight increase. At this time, the DO was maintained at about 0.35 mg/L. The reason for the analysis was that the DO in the up-flow zone and the upper horizontal acceleration zone started to rise, and with the circulation of the water flow, the DO at points 7-9 increased. Points 4-5 were located in the area of the main reaction center. Due to the smaller impact, its DO continued to remain below 0.1 mg/L. As the biochemical reaction continued, after 450 min of aeration, the DO at point 7-9 began to rise sharply, until the end of the aeration period, the DO increased to a maximum of 3.81 mg/L. At point 4-5, DO began to increase gradually after 550 min of aeration. Until the end of the aeration period, the highest DO value was 0.77 mg/L. This change rule of DO in MPSR had prolonged the existence time of the anoxic/anaerobic zone in the reactor to the greatest extent. Compared with an ordinary SBR aeration tank, MPSR will continue to perform denitrification in the later stage of aeration to further improve TN removal efficiency, thereby avoiding the contradiction between the order of denitrification and nitrification to a certain extent.
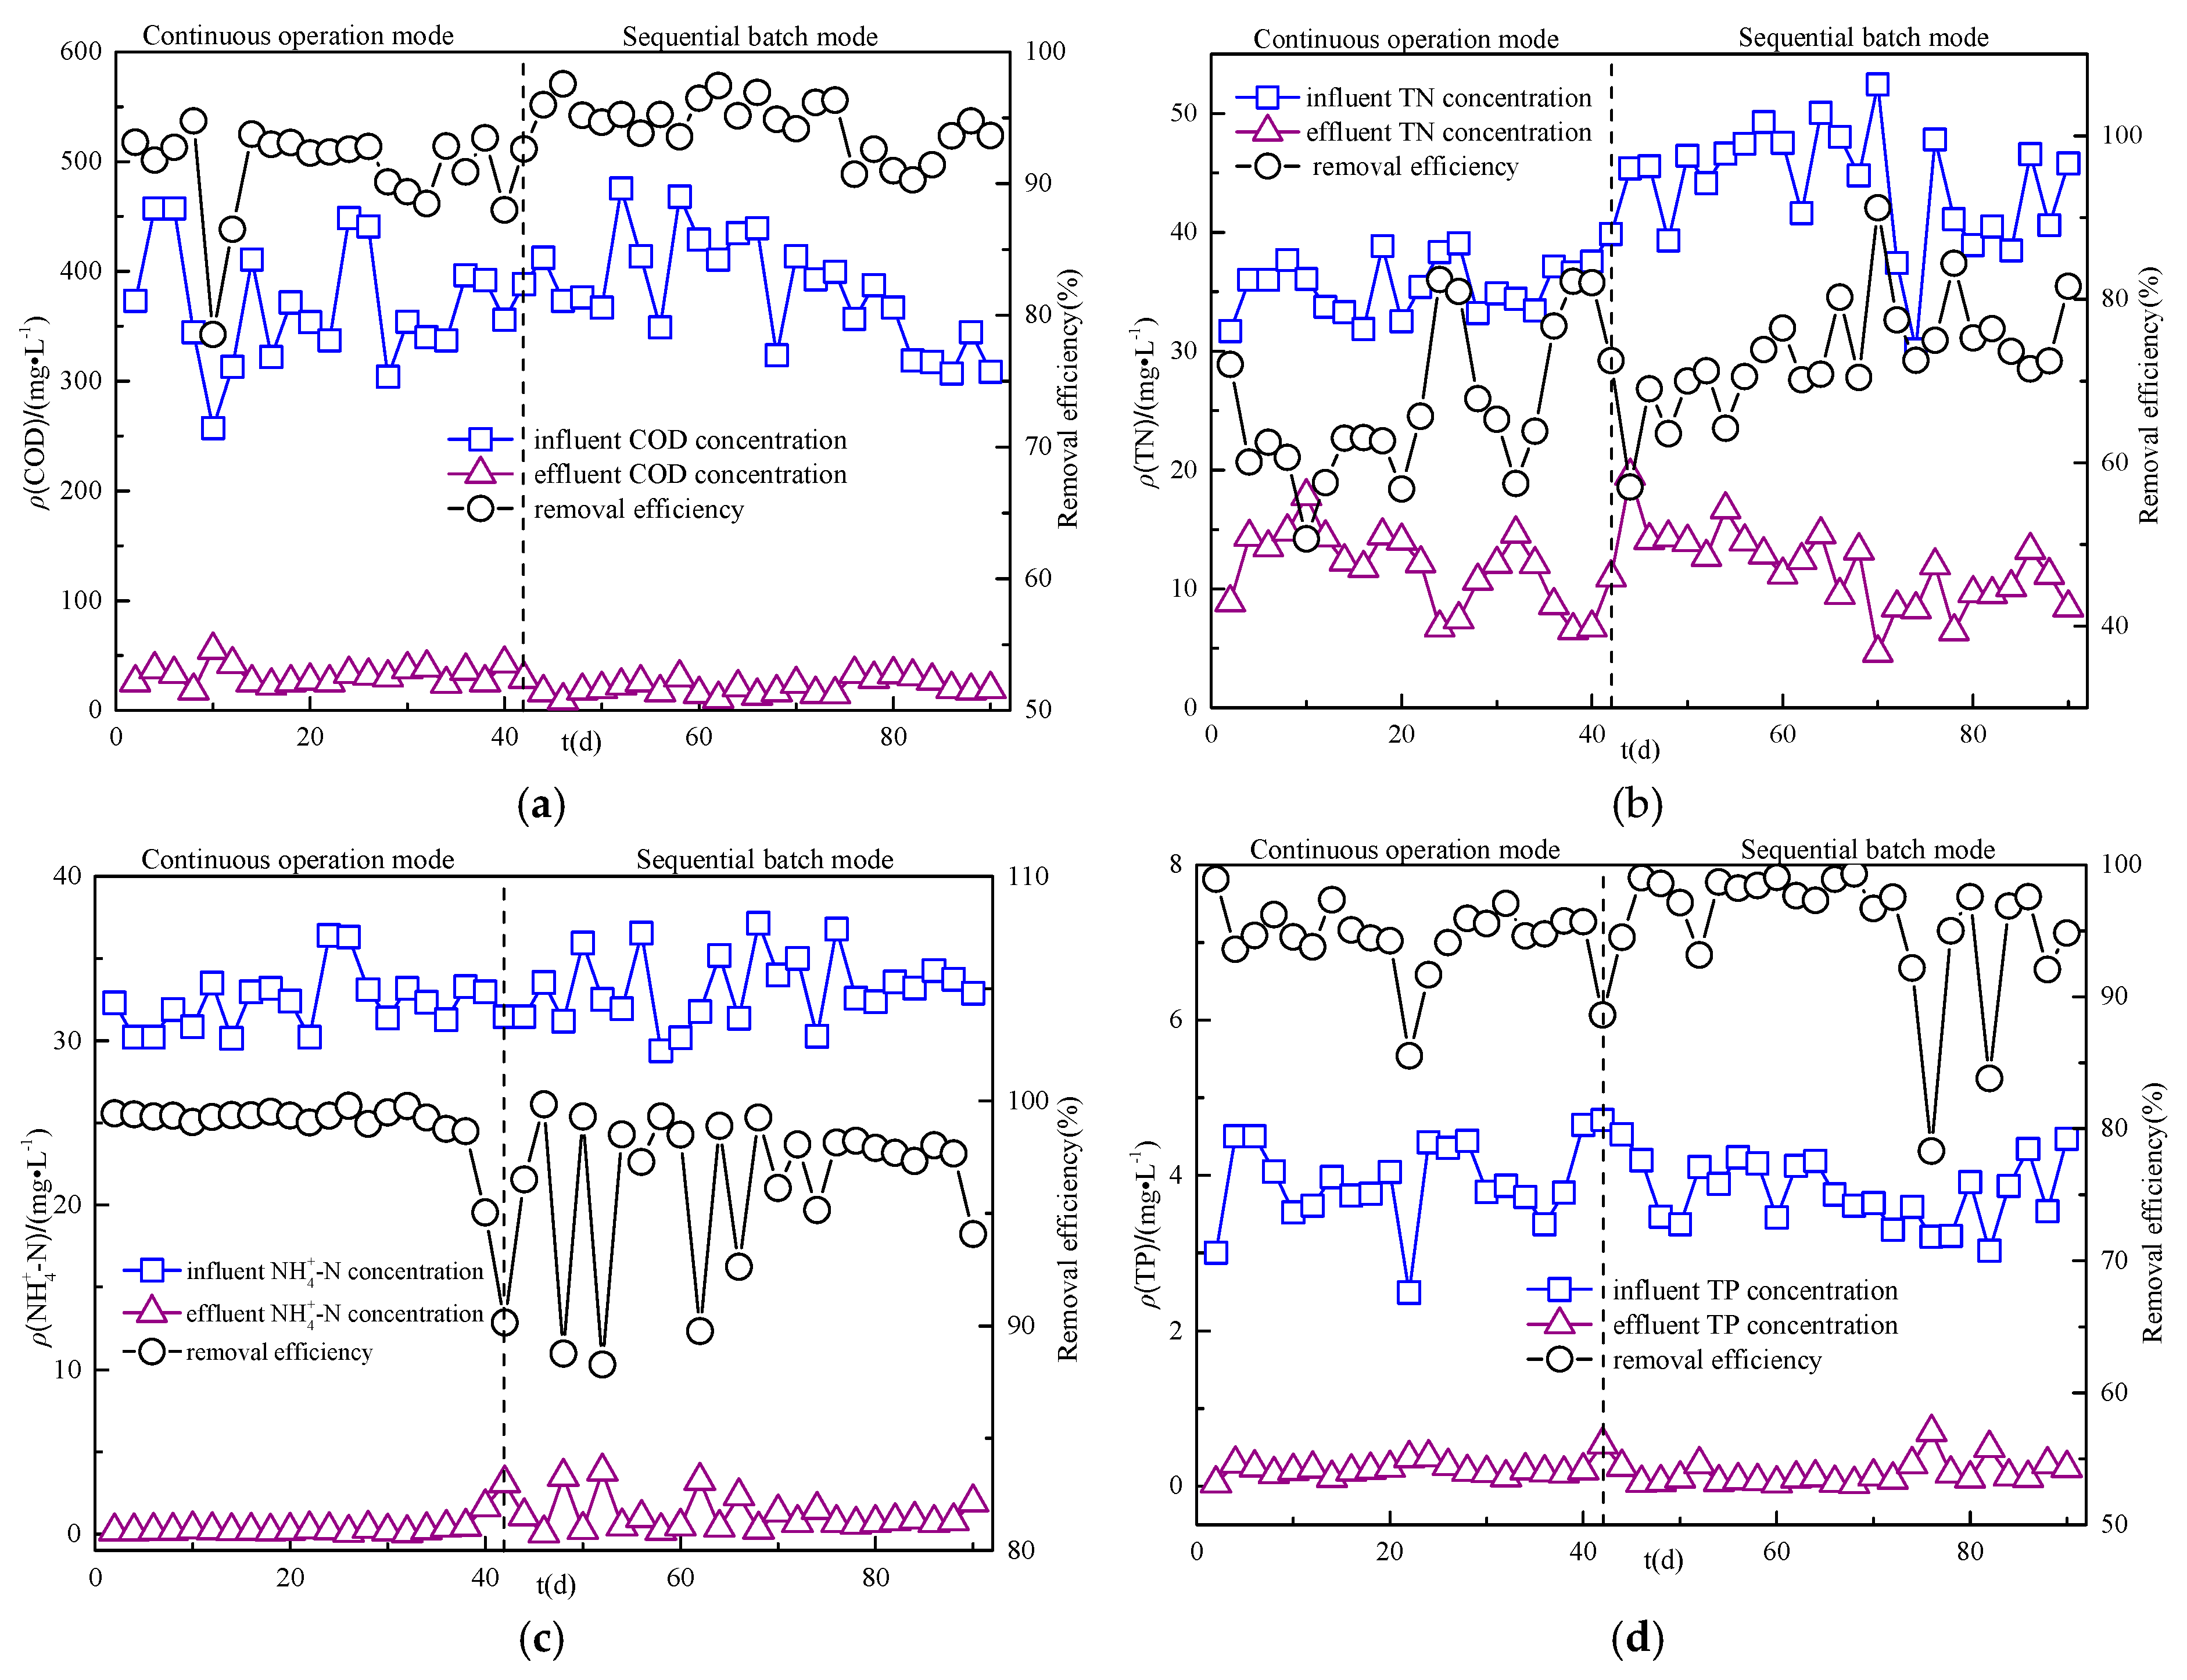
Figure 7 shows the removal effect of COD, TN, NH4+-N, and TP in MPSR under two operating modes. In continuous operation mode and sequential batch operation mode, the average removal rates of the four pollutants were 91.12%, 70.95%, 98.65%, 92.77%, and 94.46%, 74.23%, 96.47%, 95.54%. The average effluent concentrations of the four pollutants were 31.90, 10.7, 0.30, 0.31 mg/L, and 21.09, 9.68, 1.23, 0.18 mg/L. The effluent concentration of the four pollutants had reached the grade A standard of Chinese urban sewage discharge standards, which fully met the current requirements of Chinese rural pollution control [17].
3.3. Microbial Community Analysis
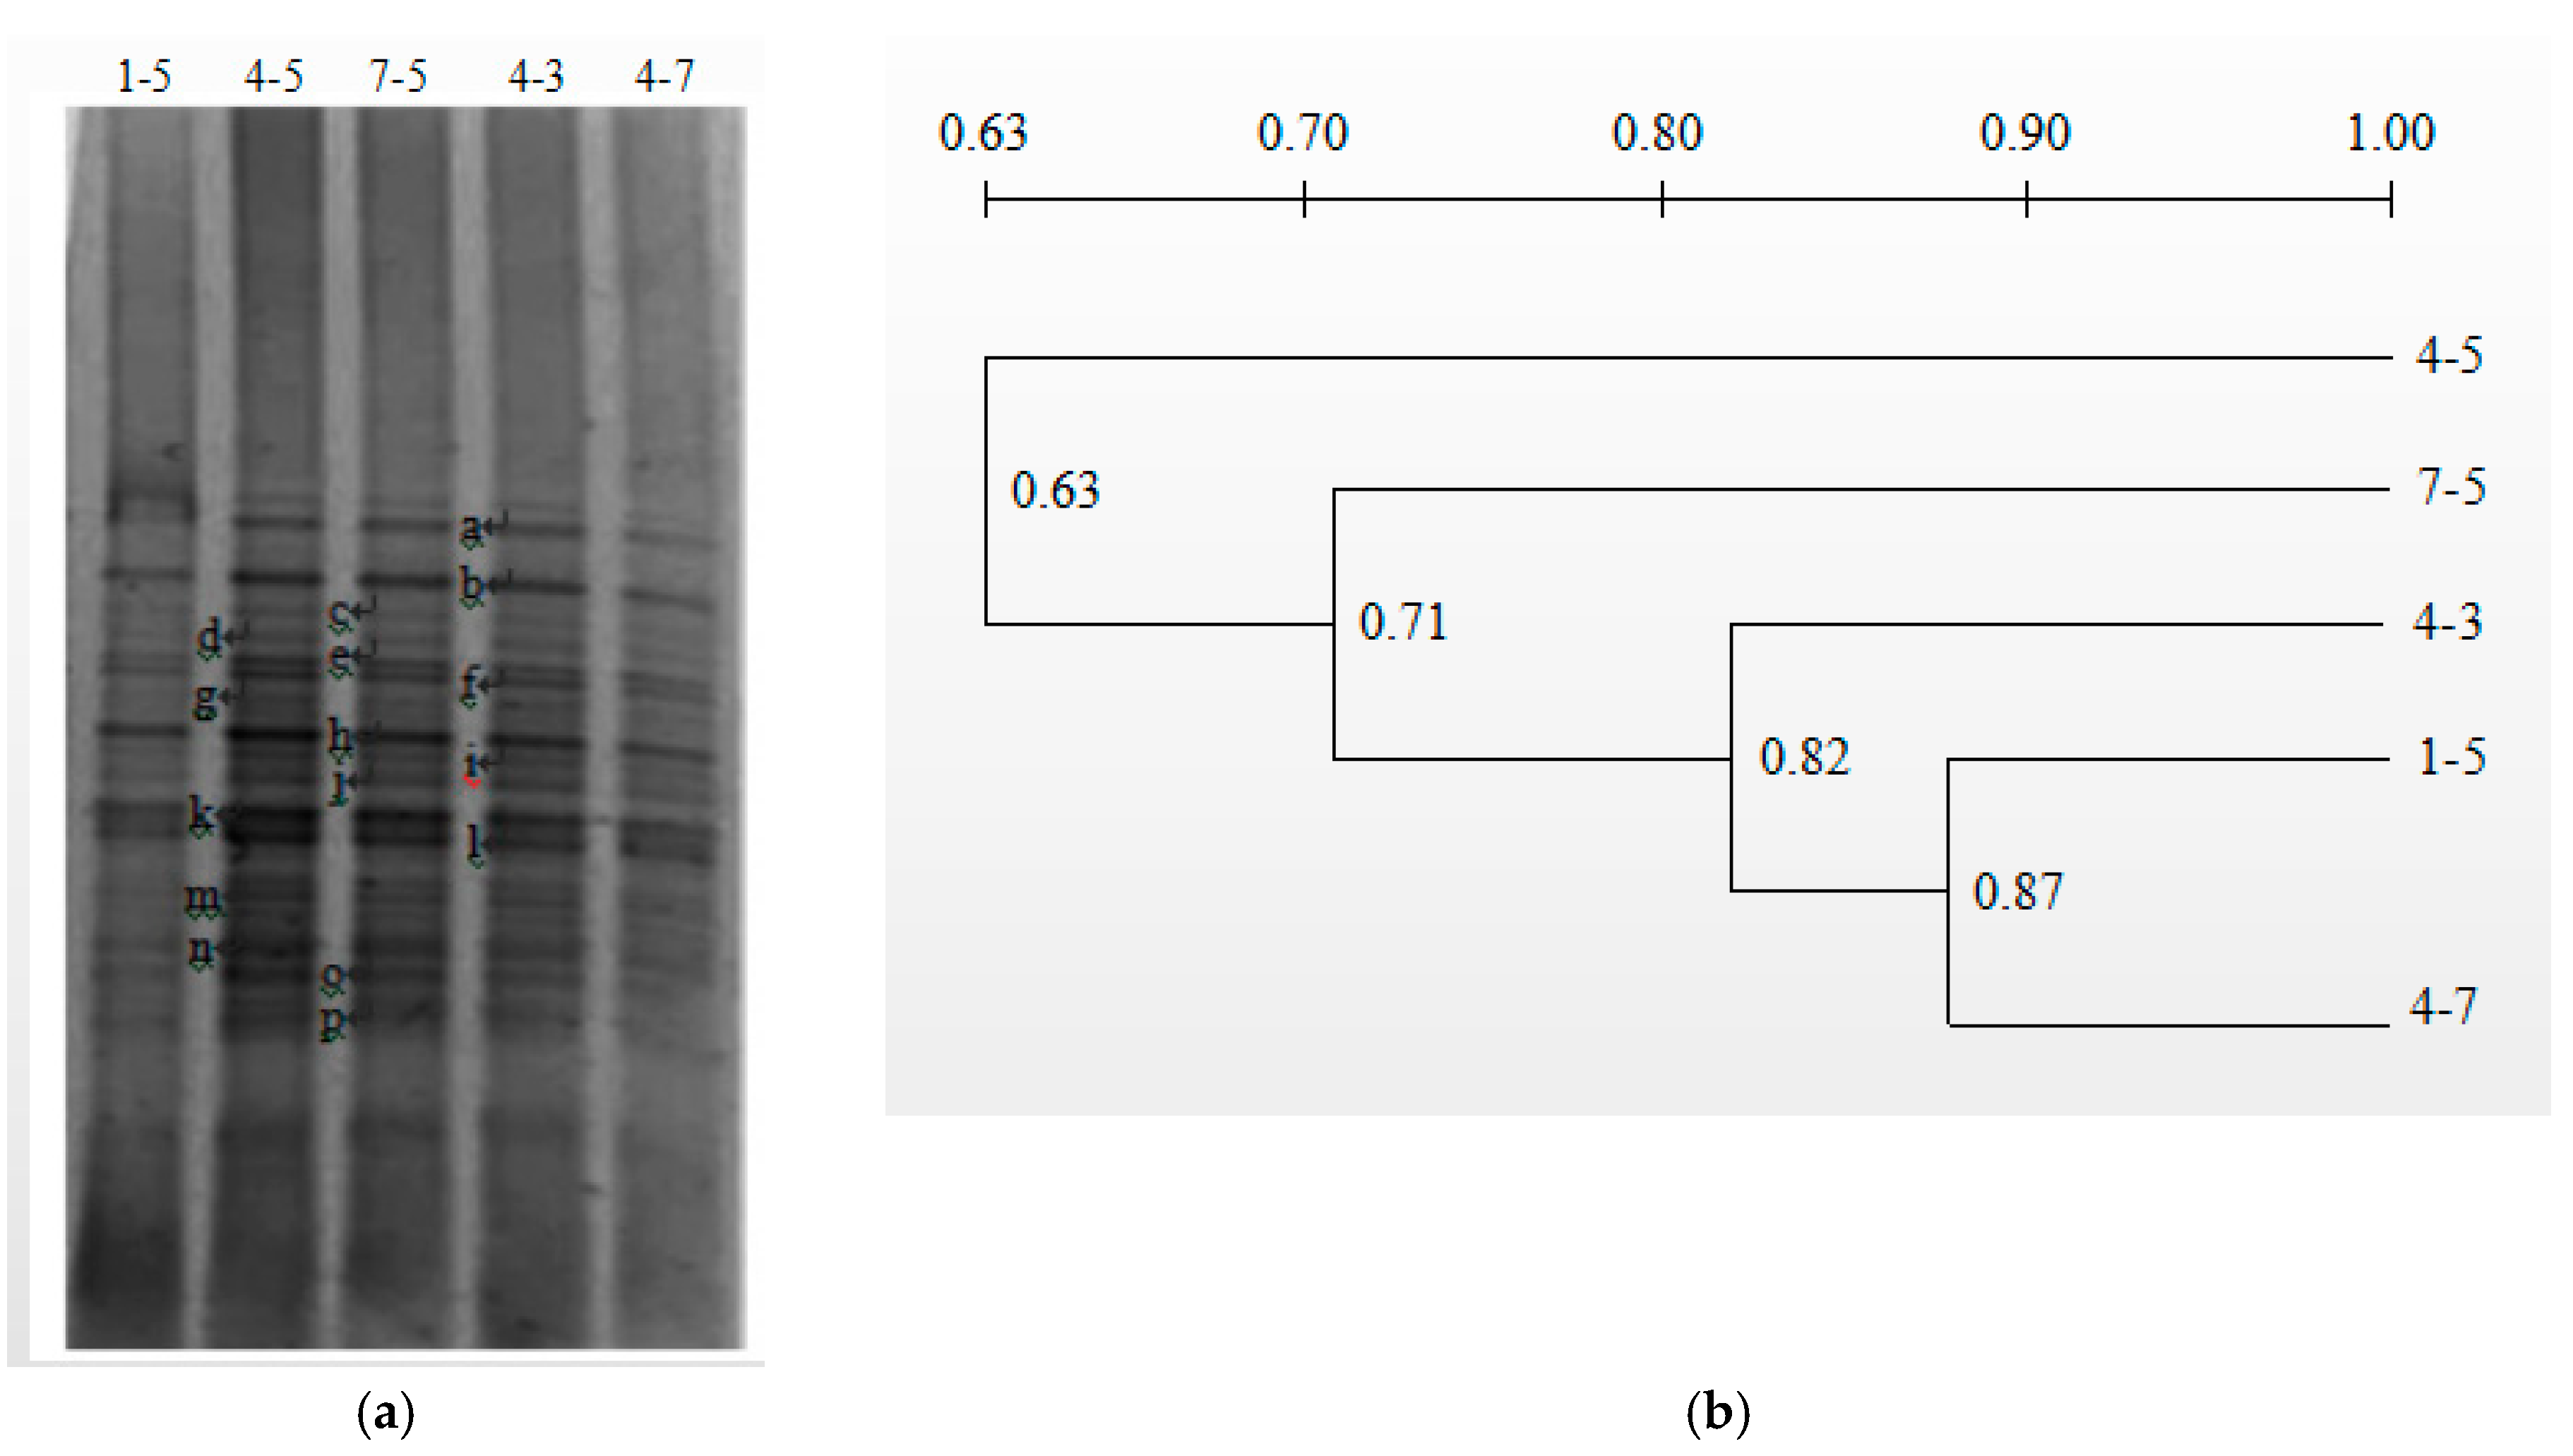
When MPSR was in continuous flow operation mode, activated sludge samples were collected from five sampling points, 1-5, 4-5, 7-5, 4-3, and 4-7, and their microbial community structure was detected. The test results are shown in Figure 8. From Figure 8a, there were obvious differences in the richness and diversity of microorganisms in the activated sludge mixture at different points in the reactor. In each sample lane, there was a stable number of major species, and new major species propagated under different dissolved oxygen environments. For example, the bacteria represented by bands a, b, e, f, h, k, and l were always present at five different sampling points, and the strength was basically unchanged. It was shown that this type of bacteria was very suitable for the internal environment of the reactor and had an important effect on the removal of pollutants, belonging to the dominant species. The strains represented by bands i, j, and n had also always existed, but the brightness of the bands of this type of bacteria varied greatly at different points, indicating that this type of bacteria will only play a role in some specific zones. The bacteria represented by bands c, d, and m were not found at 1-5, and the bands were also weak in the other four samples, indicating that this type of flora was poorly adaptable to the internal environment of the reactor, and the high dissolved oxygen environment at points 1-5 might affect its survival. The bacteria represented by bands o and p were not found in the lanes 1-5 and 4-7, but they were evident in the lanes of samples 4-5, 7-5, and 4-3, indicating that this kind of bacteria was not suitable for zones with high water flow velocity. The species represented by band g only appeared in samples 4-5, indicating that this group of bacteria may only exist in a hypoxic environment.
The UPGMA (Unweighted pair group method using arithmetic average) algorithm was used to perform cluster analysis of the similarity degree of the bacterial communities on the five sample lane maps. The results are shown in Figure 8b. Samples 1-5 and 4-7 had the highest similarity, while sample 4-5 had the lowest similarity to other samples. From the figure, the similarity between the sample flora was closely related to the external environment where the sample sampling point was located. Because the sewage in the reactor was in a cyclic push flow movement, the closer the sampling layer to the stratosphere, the higher the similarity of bacteria between the samples. At the sampling point 4-5 in the center of the reactor, because the water entered the reactor from there, and it is also the lowest DO of the reactor, the community distribution was more complicated, and the difference with other samples was also large. The above analysis showed that during the operation of the reactor, the structure of the microbial population had undergone complex succession changes and there were large differences in space.
DNA bands from the DGGE profiles were cloned and sequenced, and the sequences were compared with the data in the Gene Bank for homology analysis. As shown in Table 3, most bacteria in the reactor were Uncultured bacterium. Among the 16 DNA bands, 8 bands had the highest similarity with Proteobacteria, 3 bands had the highest similarity with Bacteroidetes, 3 bands had the highest similarity with Firmicutes, and 1 band had the highest similarity with Acidobacteria. Numerically, Acidobacteriumsp, Nitrosomonassp, Eubacterium, Proteobacterium, Acinetobacter, and Flavobacteriales bacterium were dominant and played an important role in the organic carbon and nitrogen removal process in the reactor.
4. Conclusions
By setting an aeration device on one side of the aeration tank, sealing most of the top cover, and raising the water outlet level, the traditional aeration tank was modified to develop a new type of micro-pressure swirl reactor. The study mainly draws the following conclusions. First, the flow velocity distribution test showed that MPSR could form a stable circulation zone in the center of the reactor, which can meet the function of mixing and agitating in the aeration tank. Secondly, the dissolved oxygen distribution test results showed that when the aeration volume was 0.2 m3/h, the aerobic zone, the anoxic zone, and the anaerobic zone coexisted in the MPSR aeration tank, which met the MPSR design expectation. Finally, MPSR tests in continuous operation and sequential batch operation showed that the MPSR process fully met the current requirements of rural pollution control in China. In addition, microbial community analysis showed that during the MPSR operation in continuous flow mode, the structure of the microbial population experienced complex succession changes, with large spatial differences. Because the dissolved oxygen environment and the water flow environment are different, microorganisms with different functions gather in different areas of the MPSR, which was of great significance for the simultaneous removal of nitrogen and phosphorus from the reactor.
Author Contributions
Data curation, S.A., Z.N., and Q.R.; Formal analysis, S.A., S.D., and S.Z.; Funding acquisition, D.B.; Investigation, S.D. and D.B.; Project administration, Q.R.; Resources, S.A.; Software, S.Z.; Supervision, S.D.; Writing—original draft, S.A. and Z.N.; Writing—review and editing, Z.N. and D.B. All authors have read and agreed to the published version of the manuscript.
Funding
This research was funded by National Natural Science Foundation of China (51878067), and the Jilin Province Science and Technology Development Program (20170101082JC; 20180201020SF).
Conflicts of Interest
The authors declare no conflict of interest.
References
- Liu, X.; Pan, Y.; Zhang, W.; Ying, L.; Huang, W. Achieve Sustainable development of rivers with water resource management—Economic model of river chief system in China. Sci. Total Environ. 2020, 708, 134657. [Google Scholar] [CrossRef] [PubMed]
- Shi, T.; Yang, S.; Zhang, W.; Zhou, Q. Coupling coordination degree measurement and spatiotemporal heterogeneity between economic development and ecological environment -Empirical evidence from tropical and subtropical regions of China. J. Clean. Prod. 2020, 244, 118739. [Google Scholar] [CrossRef]
- Chen, N.; Xu, L. Relationship between air quality and economic development in the provincial capital cities of China. Environ. Sci. Pollut. Res. 2016, 24, 2928–2935. [Google Scholar] [CrossRef] [PubMed]
- Ministry of Environ Protection of the PRC. National “13th Five Year Plan” for Environmental Protection; China Environmental Science Process: Beijing, China, 2017.
- Hosgood, H.D.; Mongodin, E.F.; Wan, Y.; Hua, X.; Rothman, N.; Hu, W.; Vermeulen, R.; Seow, W.J.; Rohan, T.; Xu, J.; et al. The Respiratory Tract Microbiome and Its Relationship to Lung Cancer and Environmental Exposures Found in Rural China. Environ. Mol. Mutagen. 2019, 60, 617–623. [Google Scholar] [CrossRef] [PubMed] [Green Version]
- Yin, G.; Jiang, X.; Sun, J.; Qiu, M. Discussing the regional-scale arable land use intensity and environmental risk triggered by the micro-scale rural households’ differentiation based on step-by-step evaluation—A case study of Shandong Province, China. Environ. Sci. Pollut. Res. 2020, 27, 8271–8284. [Google Scholar] [CrossRef] [PubMed]
- Vanesa, B.; Javier, E.; Felipe, G.; Iñigo, G.; Pilar, B.; Ana, U. Better understanding of the activated sludge process combining fluorescence-based methods and flow cytometry: A case study. J. Environ. Sci. 2020, 90, 51–58. [Google Scholar]
- Liu, X.; Li, A.; Ma, L.; Jing, Z.; Yang, J.; Tang, Y.; Hu, B. A comparison on phosphorus release and struvite recovery from waste activated sludge by different treatment methods. Int. Biodeterior. Biodegrad. 2020, 148, 104878. [Google Scholar] [CrossRef]
- Park, Y.; Woo, H.; Kim, D. A study on the organic, nitrogen and phosphorus removal in (AO)2 SBR and A2O SBR. Hangug Hwangyeong Bogeon Haghoeji 2006, 31, 340–348. [Google Scholar]
- Wu, L.; Wang, J.; Liu, X. Enhanced nitrogen removal under low-temperature and high-load conditions by optimization of the operating modes and control parameters in the CAST system for municipal wastewater. Desalin. Water Treat. 2013, 53, 1683–1698. [Google Scholar] [CrossRef]
- Lu, Y.-Z.; Wang, H.; Kotsopoulos, T.; Zeng, R.J. Advanced phosphorus recovery using a novel SBR system with granular sludge in simultaneous nitrification, denitrification and phosphorus removal process. Appl. Microbiol. Biotechnol. 2016, 100, 4367–4374. [Google Scholar] [CrossRef] [PubMed]
- Gieseke, A.; Amann, P.; Schramm, A. Simutaneous P and N removal in a sequencing batch biofilm reactor: Insights from reactor-and microscale investigations. Water Res. 2002, 36, 501–509. [Google Scholar] [CrossRef]
- Yang, S.; Yang, F.; Fu, Z.; Wang, T.; Lei, R. Simultaneous nitrogen and phosphorus removal by a novel sequencing batch moving bed membrane bioreactor for wastewater treatment. J. Hazard. Mater. 2010, 175, 551–557. [Google Scholar] [CrossRef] [PubMed]
- Bian, D.; Zhou, D.; Huo, M.; Ren, Q.; Tian, X.; Wan, L.; Zhu, S.; Ai, S. Improving oxygen dissolution and distribution in a bioreactor with enhanced simultaneous COD and nitrogen removal by simply introducing micro-pressure and swirl. Appl. Microbiol. Biotechnol. 2015, 99, 8741–8749. [Google Scholar] [CrossRef] [PubMed]
- Ren, Q.K.; Yu, Y.; Zhu, S.Y.; Bian, D.J.; Huo, M.X.; Zhou, D.D.; Huo, H.L. Characterization of a novel micro-pressure swirl reactor for removal of chemical oxygen demand and total nitrogen from domestic wastewater at low temperature. Biodegradation 2017, 28, 145–157. [Google Scholar] [CrossRef] [PubMed]
- APHA. Standard Methods for the Examination of Water and Wastewater, 22nd ed.; American Public Health Association, American Water Works Association, and Water Environment Federation: Washington, DC, USA, 2007. [Google Scholar]
- GuoBiao Standards. Discharge Standard of Pollutants for Municipal Wastewater Treatment Plant; China Environmental Science Press: Beijing, China, 2002. [Google Scholar]
Figure 1.
(a) Schematic diagram of the micro-pressure swirl reactor (MPSR) under ideal conditions, (b) the photo of MPSR actual operation.
Figure 1.
(a) Schematic diagram of the micro-pressure swirl reactor (MPSR) under ideal conditions, (b) the photo of MPSR actual operation.

Figure 2.
(a) Monitoring point layout of the reactor for flow velocity and dissolved oxygen (DO) test, (b) the photo of velocity meter on-site installation.
Figure 2.
(a) Monitoring point layout of the reactor for flow velocity and dissolved oxygen (DO) test, (b) the photo of velocity meter on-site installation.

Figure 3.
Contour map of water flow velocity distribution in the main reaction zone at each aeration amounts. (a) 0.04 m3/h (Unit: m/s), (b) 0.06 m3/h (Unit: m/s), (c) 0.10 m3/h (Unit: m/s), (d) 0.15 m3/h (Unit: m/s), (e) 0.20 m3/h (Unit: m/s), (f) 0.3 m3/h (Unit: m/s).
Figure 3.
Contour map of water flow velocity distribution in the main reaction zone at each aeration amounts. (a) 0.04 m3/h (Unit: m/s), (b) 0.06 m3/h (Unit: m/s), (c) 0.10 m3/h (Unit: m/s), (d) 0.15 m3/h (Unit: m/s), (e) 0.20 m3/h (Unit: m/s), (f) 0.3 m3/h (Unit: m/s).

Figure 4.
Schematic diagram of MPSR flow partition.

Figure 5.
Contour map of the dissolved oxygen distribution in the main reaction zone at each aeration amount. (a) 0.10 m3/h (Unit: mg/L), (b) 0.20 m3/h (Unit: mg/L), (c) 0.30 m3/h (Unit: mg/L), (d) 0.40 m3/h (Unit: mg/L).
Figure 5.
Contour map of the dissolved oxygen distribution in the main reaction zone at each aeration amount. (a) 0.10 m3/h (Unit: mg/L), (b) 0.20 m3/h (Unit: mg/L), (c) 0.30 m3/h (Unit: mg/L), (d) 0.40 m3/h (Unit: mg/L).

Figure 6.
MLSS change during MPSR operation and DO change during sequential batch operation. (a) is the change of MLSS during the operation of MPSR, (b) is the time variation of the sampling point DO within the typical batch MPSR cycle time.
Figure 6.
MLSS change during MPSR operation and DO change during sequential batch operation. (a) is the change of MLSS during the operation of MPSR, (b) is the time variation of the sampling point DO within the typical batch MPSR cycle time.

Figure 7.
Pollutants removal effect of MPSR in two operating modes. (a) COD, (b) TN, (c) NH4+-N, (d) TP.
Figure 7.
Pollutants removal effect of MPSR in two operating modes. (a) COD, (b) TN, (c) NH4+-N, (d) TP.

Figure 8.
Study of the Microbial flora characteristics: (a) DGGE profile of total bacteria in activated sludge samples and (b) UPGMA cluster analysis of DGGE.
Figure 8.
Study of the Microbial flora characteristics: (a) DGGE profile of total bacteria in activated sludge samples and (b) UPGMA cluster analysis of DGGE.


Table 1.
Characteristics of synthetic wastewater.
| COD | TN | NH4+-N | TP | |
|---|---|---|---|---|
| Range (mg·L−1) | 257.3~475.6 | 30.15~52.45 | 29.37~37.14 | 2.49~4.71 |
| Average (mg·L−1) | 376.52 | 40.08 | 32.81 | 3.85 |
Table 2.
Operating parameters of various working conditions.
| Operation Mode | Operation Parameters |
|---|---|
| Continuous operation mode | The water inflow was 108 L/day, the sludge return ratio was 100%, the HRT (Hydraulic retention time) was 12 h, the sludge residence time was 27 ± 3 days, and the aeration volume was controlled at 0.2 m3/h. |
| Sequential batch mode | The single operating cycle of the reactor was 720 min, including 30 min of water inlet, 600 min of aeration, 70 min of sedimentation, and 20 min of drainage. The drainage ratio was 50%, and the residence time of sludge was also controlled to 27 ± 3 days, and the aeration volume was controlled at 0.2m3/h. |
Table 3.
16SrDNA fragment sequencing analysis results.
| Band | Length/bp | Highest Similarity Bacteria (No.) | Similarity/(%) |
|---|---|---|---|
| Band a | 169 | Uncultured Acidobacterium sp. (JQ065958) | 100 |
| Band b | 174 | Uncultured bacterium (CU925702) | 100 |
| Band c | 189 | Uncultured Bacteroidetes bacterium (EU246822) | 92 |
| Band d | 195 | Desulfobulbaceae bacterium (PR2_D12HE600890) | 97 |
| Band e | 194 | Uncultured Nitrosomonas sp. (GQ227644) | 99 |
| Band f | 189 | Uncultured Flavobacteriales bacterium (GU929377) | 98 |
| Band g | 189 | Uncultured Sphingobacteriales bacterium (AY694477) | 97 |
| Band h | 169 | Eubacterium ventriosum (L34421) | 100 |
| Band i | 194 | Erysipelotrichi bacterium (JF345332) | 100 |
| Band j | 169 | Uncultured alpha proteobacterium (FN679232) | 98 |
| Band k | 169 | Uncultured proteobacterium (EU300547) | 98 |
| Band l | 195 | Acinetobacter sp. SH825131.2 (AJ633636) | 98 |
| Band m | 169 | Arcobacter sp. GCDN6_III (JQ072063) | 100 |
| Band n | 195 | Acinetobacter sp. AHJ6 (JQ837283) | 100 |
| Band o | 195 | Uncultured Clostridia bacterium (FJ535170) | 100 |
| Band p | 169 | Uncultured proteobacterium (GQ355005) | 96 |
© 2020 by the authors. Licensee MDPI, Basel, Switzerland. This article is an open access article distributed under the terms and conditions of the Creative Commons Attribution (CC BY) license (http://creativecommons.org/licenses/by/4.0/).
Share and Cite
MDPI and ACS Style
Ai, S.; Dong, S.; Nie, Z.; Zhu, S.; Ren, Q.; Bian, D. Study on Aeration Optimization and Sewage Treatment Efficiency of a Novel Micro-Pressure Swirl Reactor (MPSR). Water 2020, 12, 890. https://doi.org/10.3390/w12030890
AMA Style
Ai S, Dong S, Nie Z, Zhu S, Ren Q, Bian D. Study on Aeration Optimization and Sewage Treatment Efficiency of a Novel Micro-Pressure Swirl Reactor (MPSR). Water. 2020; 12(3):890. https://doi.org/10.3390/w12030890
Chicago/Turabian StyleAi, Shengshu, Shuangshi Dong, Zebing Nie, Suiyi Zhu, Qingkai Ren, and Dejun Bian. 2020. "Study on Aeration Optimization and Sewage Treatment Efficiency of a Novel Micro-Pressure Swirl Reactor (MPSR)" Water 12, no. 3: 890. https://doi.org/10.3390/w12030890
Note that from the first issue of 2016, this journal uses article numbers instead of page numbers. See further details here.