Article

What Triggers the Annual Cycle of Cyanobacterium Oscillatoria sp. in an Extreme Environmental Sulfide-Rich Spa?

by
Andreas Reul
1,*,
Elena Martín-Clemente
2,
Ignacio J. Melero-Jiménez
2,
Elena Bañares-España
2,
Antonio Flores-Moya
2 and
María J. García-Sánchez
2
1
Departamento de Ecología y Geología, Universidad de Málaga, 29010 Málaga, Spain
2
Departamento de Botánica y Fisiología Vegetal, Universidad de Málaga, 29010 Málaga, Spain
*
Author to whom correspondence should be addressed.
Water 2020, 12(3), 883; https://doi.org/10.3390/w12030883
Submission received: 4 February 2020 / Revised: 12 March 2020 / Accepted: 13 March 2020 / Published: 21 March 2020
(This article belongs to the Special Issue Advances in Mountain and Mediterranean Wetlands Conservation)

Abstract

:
A seasonal cycle of sulfide, nitrate, phosphate, ammonium, chlorophyll a (Chl a) and Oscillatoria sp. abundance (<100 μm), as well as the relative contribution of taxonomic phytoplanktonic groups (cyanobacteria, green algae, cryptomonads, diatoms and dinoflagellates) to total Chl a were measured by fluorometric measurements at La Hedionda sulfide-rich spa (southern Spain). Fluorometry determined that cyanobacteria Chl a concentration correlated positively with the abundance of Oscillatoria sp. Aggregates at 45–100 μm equivalent spherical diameter (ESD) and was used as an indicator of Oscillatoria sp. Abundance, including for aggregates <45 and >100μm (ESD). In addition, air temperature, radiation and precipitation were downloaded from meteorological databases. In agreement with the meteorological annual cycle observed in air temperature, radiation and precipitation, sulfide concentration at La Hedionda Spa shows an annual cycle with concentrations around 40 μM in winter and up to 200 μM in the dry summer period. Phytoplankton composition was dominated by cyanobacteria (mainly Oscillatoria sp.), but other groups were also represented (green algae, cryptomonads, diatoms and dinoflagellates), although they remained constant throughout the year (median Chl a < 0.2 μg L−1). Cyanobacteria, in contrast, showed an annual cycle with a significantly higher median in summer (Chl a = 1.6 μg L−1) than in winter (Chl a = 0.4 μg L−1). No linear relationship between nutrients and cyanobacteria concentration was observed, but an optimum curve of cyanobacteria concentration to sulfide concentration was fitted through a general additive model (GAM). The four-fold increase of cyanobacteria concentration under exposition of an elevated sulfide concentration can be due to higher growth rates at elevated sulfide concentrations reported for an Oscillatoria sp. strain isolated during the same annual cycle at La Hedionda and we suggest that the selective agent, sulfide, positively triggers Oscillatoria sp. proliferation in summer. According to our findings, the Oscillatoria sp. population of La Hedionda not only is sulfide-resistant, but requires sulfide in its optimal niche.

1. Introduction

La Hedionda is a sulfide-rich (200 μM) thermal (20 °C) spring outflow in southern Spain [1,2] (Figure 1). While the sulfide-rich water of La Hedionda has been appreciated in thermal baths since almost 61 before Christ [3,4], sulfide is also a biocide because it blocks photosystem II (PSII) and respiratory electron transport [5,6,7,8,9]. However, cyanobacteria strains inhabiting sulfureous habitats can usually overcome the toxic effect of sulfide, maintaining oxygenic photosynthesis through the sulfide-resistance of PSII [6,10,11,12] and/or enabling PSII-independent anoxygenic photosynthesis with sulfide as an electron donor to PSI [11,13,14,15,16]. For this reason, we initially addressed the study of the adaptation processes of cyanobacteria to La Hedionda water [2] and, in this study, we hypothesized that the levels of sulfide in this habitat could be the main trigger of cyanobacteria populations. However, despite the fact that sulfide-rich spas are natural laboratories for studying eco-evolutionary processes involved in the adaptation of photosynthetic organisms to sulfide [2,4,17,18], little information exists about the seasonal variability of the sulfide concentration and low diversity populations of photosynthetic organisms inhabiting these extreme ecosystems [4]. It must be highlighted that the usual phytoplankton succession has been widely studied in epicontinental waters where annual cycles depend on physical control, nutrients and grazing [19]. Curiously, few studies of extreme environments cover an annual cycle, and little is known about seasonality and the main factors that trigger cyanobacterial populations in extreme environments. This is surprising, as the ancient origin of cyanobacteria [20] has determined the present-day distribution in more extreme environments, and precisely this diversity of adaptations including tolerance to high temperatures, salinity, UV radiation and desiccation may be important for future global change scenarios [21]. In order to figure out the seasonal pattern of phytoplankton succession and the main driving factors, we here show the first annual cycle of abiotic conditions with associated phytoplankton concentration and composition in the sulfide-rich environment of La Hedionda spa.

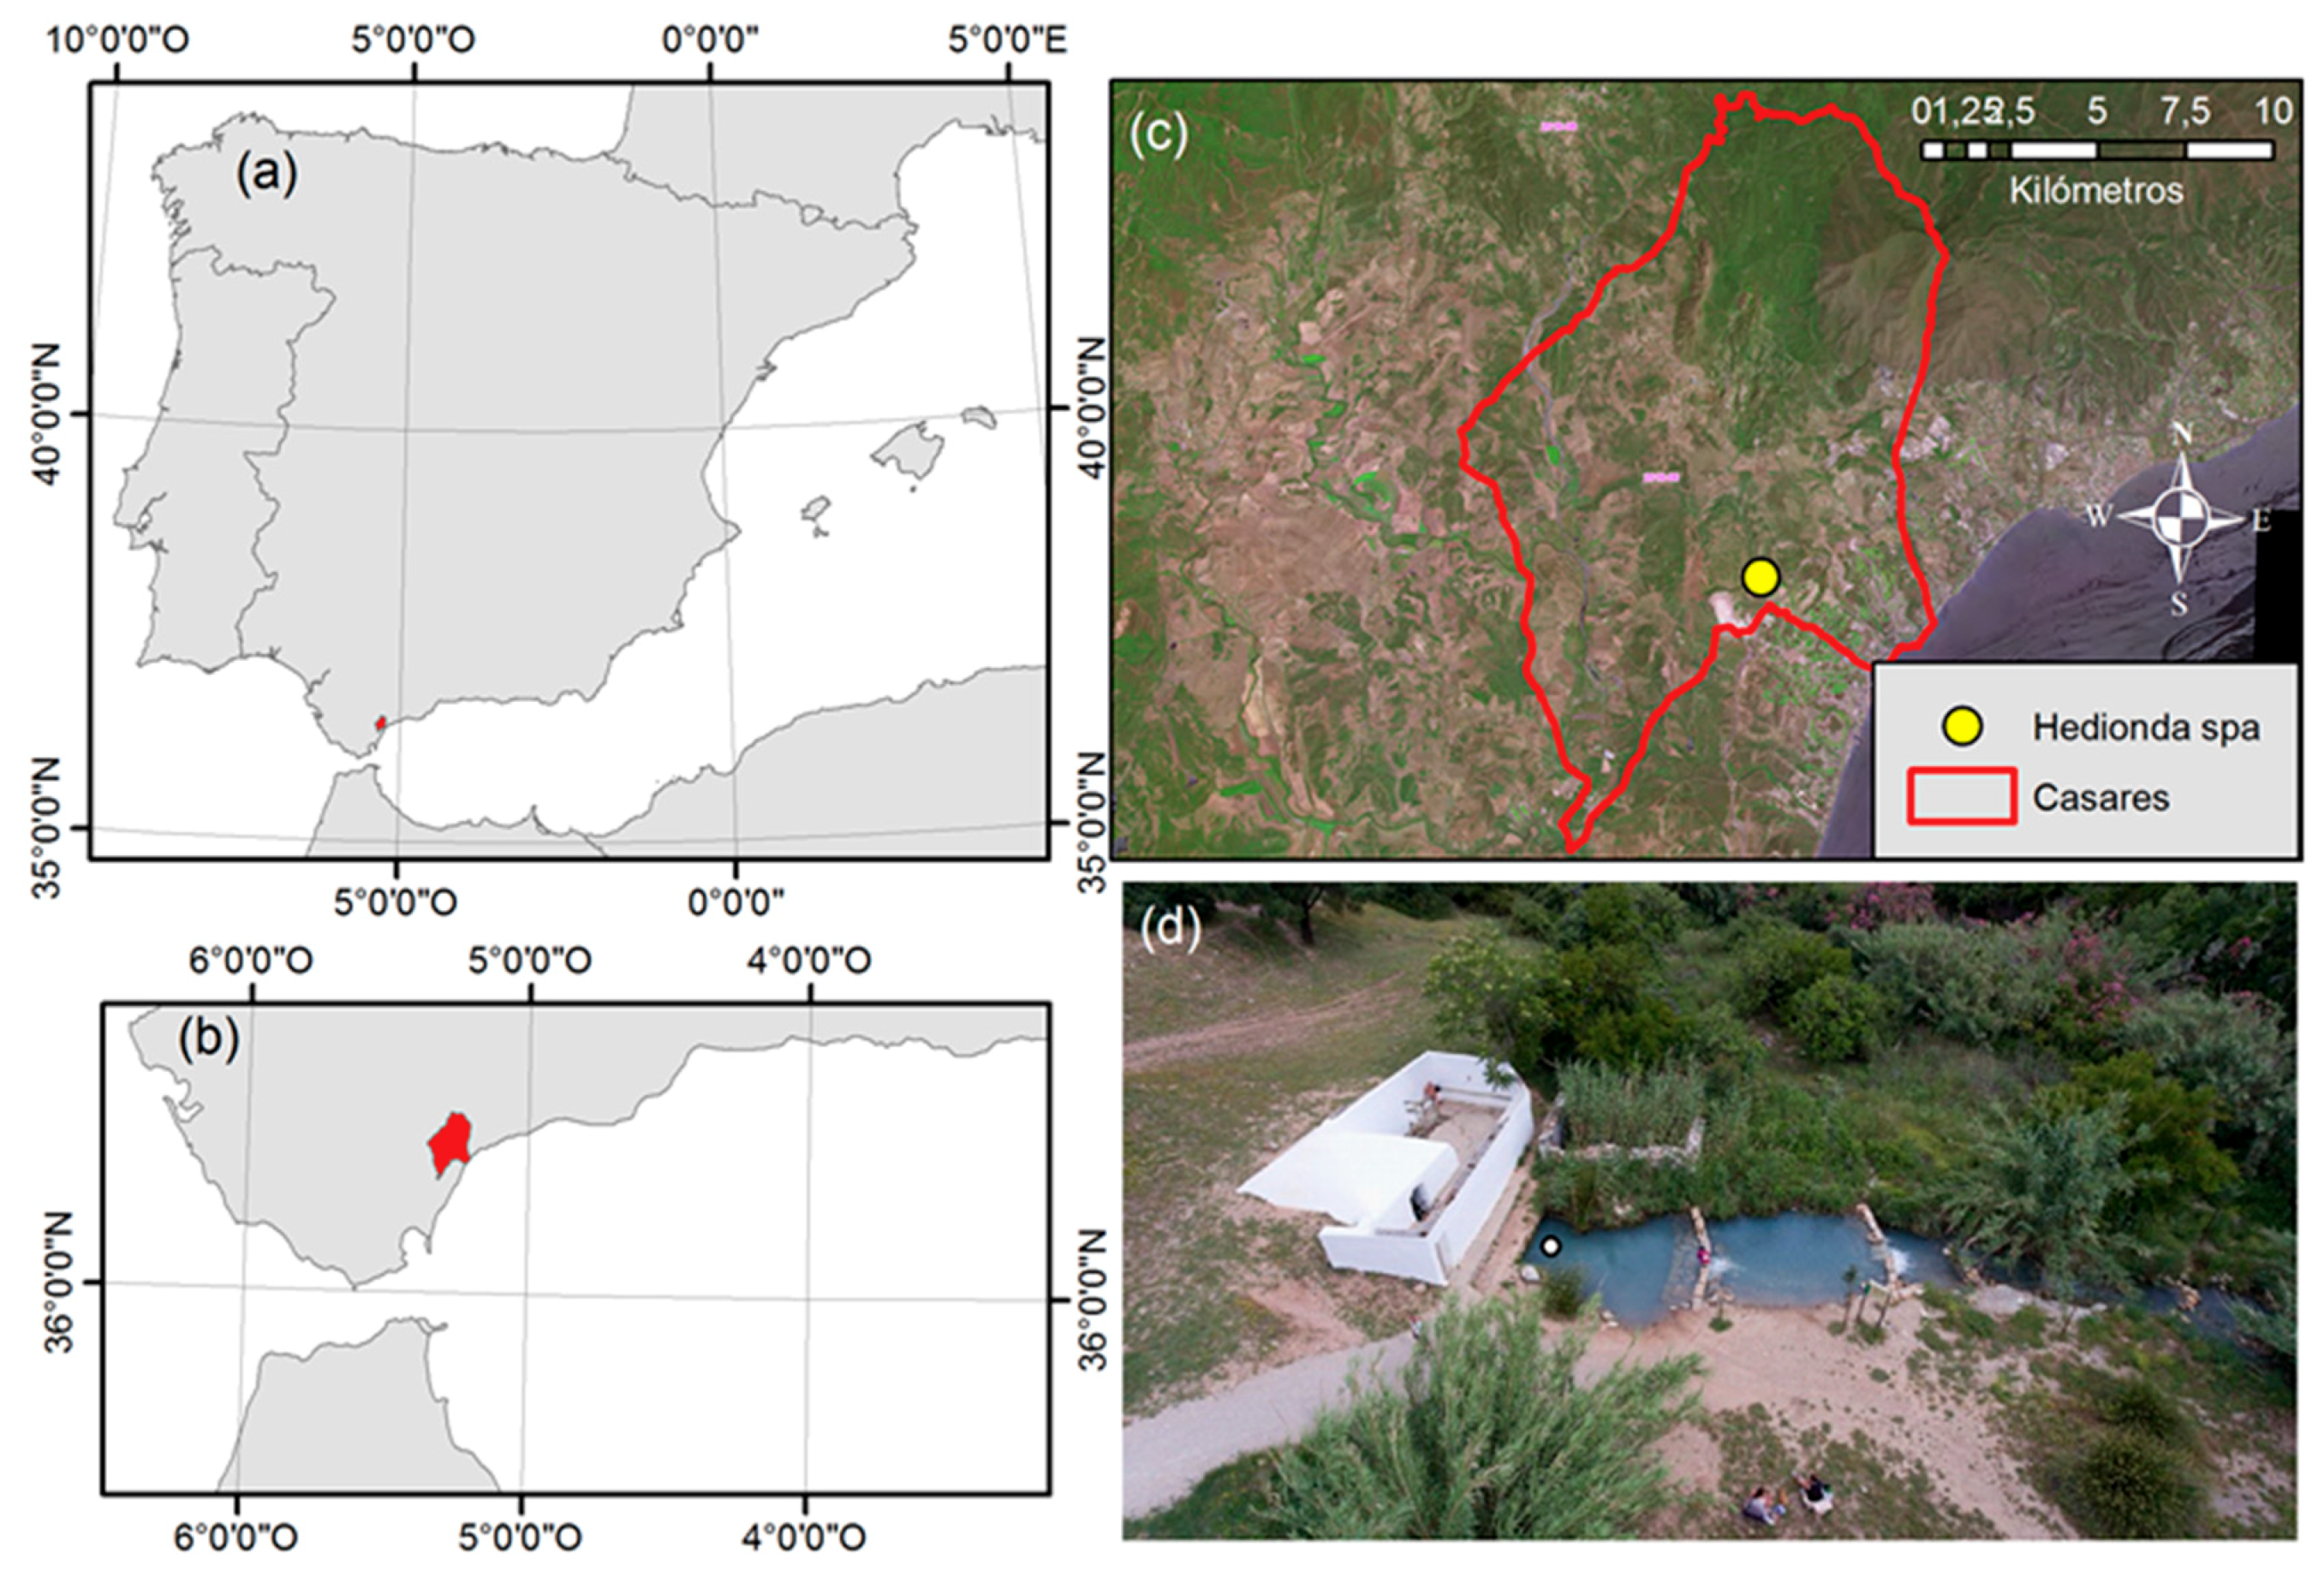
2. Materials and Methods

The sulfide-rich, thermal (20 °C) spring flows into a 5 m × 5 m × 1 m roofed pond and is then released into subsequent basins. A ten-year flow measurement reveals a minimum and maximum flow of 40–60 L s−1 and 110–135 L s−1 related to precipitation patterns [1]. In order to cover an annual cycle, monthly sampling was carried out between March 2016 and June 2017 at the inflow in the first basin (white dot, Figure 1c). When available, additional weekly samplings were included to increase sampling frequency as much as possible. At each sampling date, pH and total sulfide concentrations were measured in situ with a pH meter (Hanna HI 9125) and a multiparameter portable colorimeter (DR900, Hatch Co., Loveland, CO, USA), respectively. Sulfide determinations were performed in triplicates, with a Coefficient of Variation (CV) < 3% at all sampling times [22,23]. Mean annual pH value (7.23 ± 0.06) was reported previously [2], and shown to keep a constant value throughout the year.
Regarding nutrient determination, 500 mL water samples were taken in polyethylene bottles rinsed previously with 10% HCl, kept in the dark and cold until the sample was frozen at −20 °C. Phosphate and nitrate concentrations were analyzed through ion chromatography analysis (930 Compact IC Flex, Methrom) using a Metrosep C3 250/4.0 column for the determination of cations and a Metrosep A Supp 7-250/4.0 column for the determination of anions. Ammonium concentration was analyzed using the colorimetric Berthelot method [24].
Likewise, for phytoplankton analysis, 5 L samples were taken between 09:00 and 11:00 UTC, in polyethylene bottles and maintained in the dark and cold during the 1 h transport to the laboratory. Immediately after arriving at the laboratory of the University of Malaga, total chlorophyll a (Chl a) concentration and taxonomic groups of phytoplankton were estimated with a submersible fluorometer with a five-point excitation spectra (Biological-Biophysical-Engineering (BBE) -Moldaenke FluoroProbe [25]). The submersible fluorometer discriminated among four phytoplanktonic groups (i.e. diatoms and dinoflagellates together, cyanobacteria, green algae and cryptophytes) based on the relative fluorescence intensity of Chl a at 680 nm, following sequential light excitation by 5 light-emitting diodes (LEDs) emitting at 450 nm, 525 nm, 570 nm, 590 nm and 610 nm [25,26]. For abundance and size estimation of Oscillatoria sp., identified according to Kómarek and Anagnostidis [27] by using an optical microscope, 2 L water samples were passed through a 45 μm mesh and recuperated in 20 mL. Then, the samples were analyzed with a Flow Imaging Microscopy (FlowCAM, Benchtop VS4C/488/DSP; Fluid Imaging, Scarborough, Maine, USA) using a 100 μm flow cell and 100-fold magnification (10× objective). The analysis was carried out in autoimage mode in order to take individual pictures of each particle in the vision field. Moreover, phytoplankton abundance and size estimations in the original data were manually reprocessed in order to distinguish between detritus and phytoplanktonic cells (aggregates) [28].
Cyanobacteria concentration significantly correlated with Oscillatoria sp (45–100 μm equivalent spherical diameter (ESD)) abundance (r = 0.665; n = 19; p < 0.01) and biovolume (r = 0.456; n = 19; p < 0.05). Therefore, data from cyanobacteria concentration was used in this work as a proxy for Oscillatoria sp. abundance and biovolume, as it also includes aggregates <45 μm and >100 μm ESD of this filamentous species.
Meteorological data were acquired from the meteorological sampling station in Estepona, located 10.5 km from the spa [29].
Statistical Analysis.
Environmental–biological relationships were analyzed through correlation and regression (SigmaStatt) if linear relationships were observed. A general additive model (GAM) was calculated for fitting non-linear relationships using the ‘mgcv 1.8–17’ package (R version 3.4.1). The best model was chosen according to the Akaike Information Criterion (AIC), where a lower AIC indicates a higher goodness-of-fit and an inferior tendency to over-fit.

3. Results

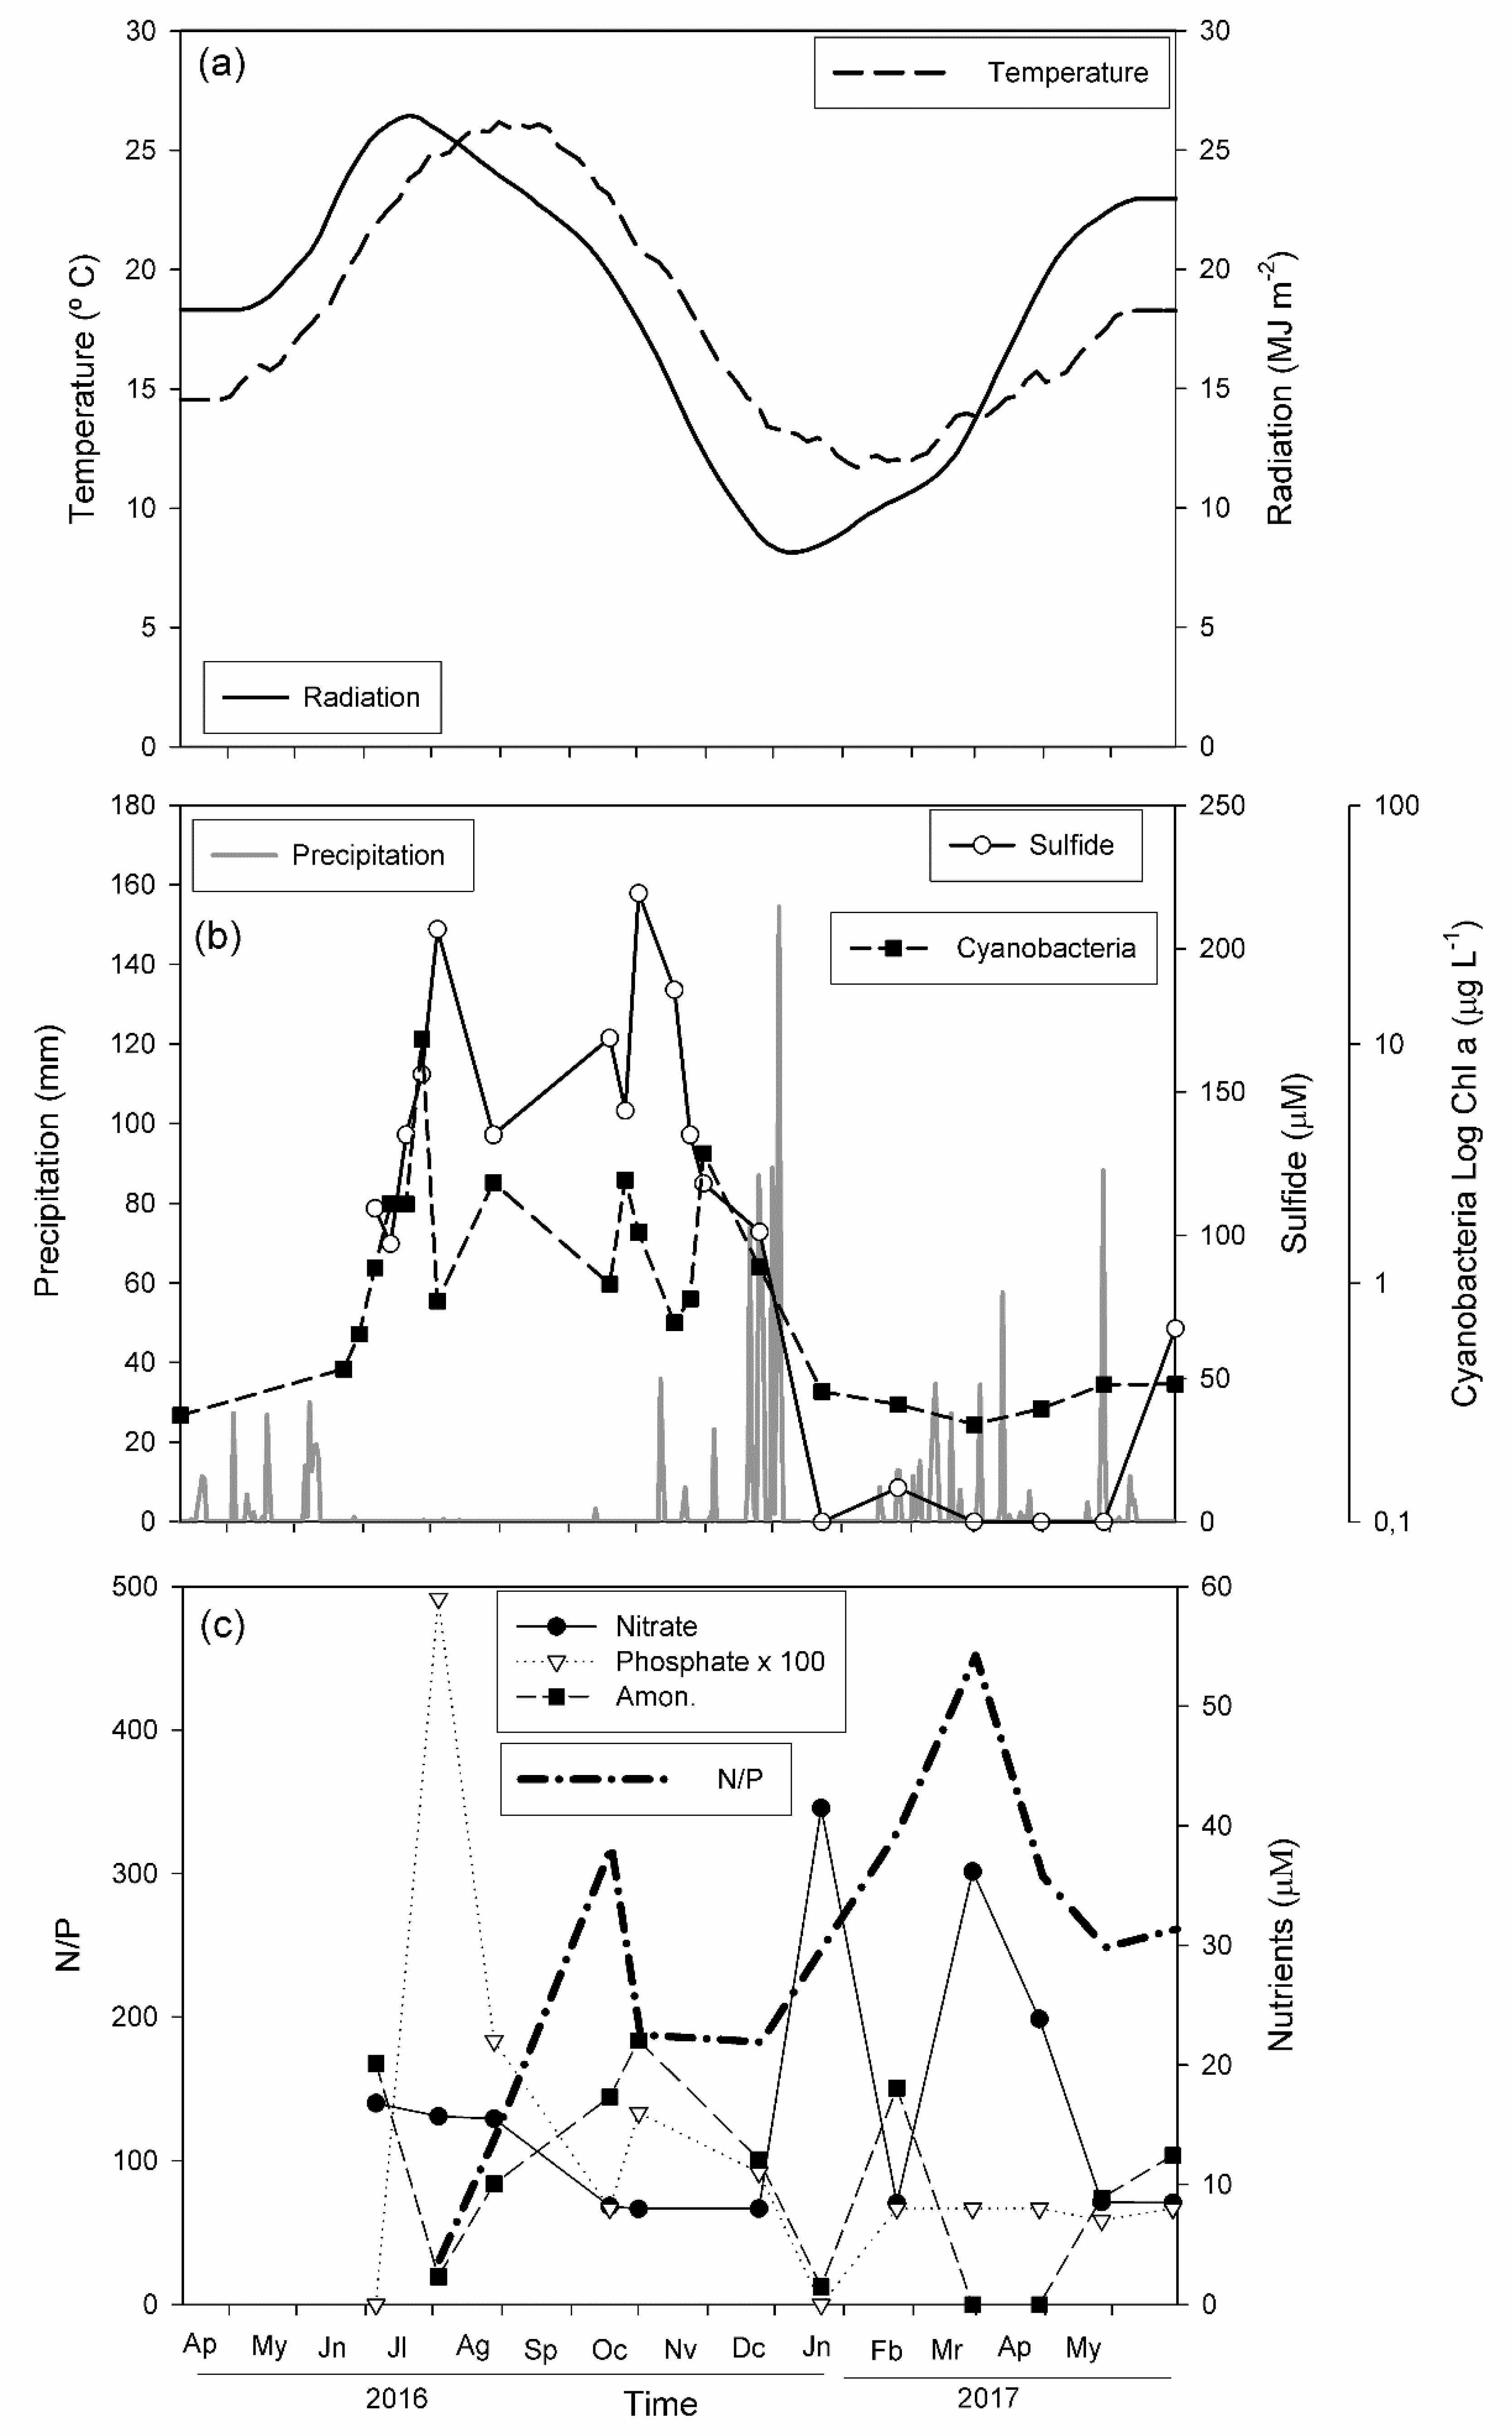
3.1. Abiotic Factors

La Hedionda spa is located in an area characterized by a Mediterranean climate with dry summers and mild, wet winters [30,31]. The mean air temperature and radiation (Figure 2a) shows an annual cycle where radiation anticipates temperature. The minimum and maximum overall mean solar radiation was recorded at the solstices of December (5 MJ m−2) and June (25 MJ m−2), respectively. Thus, the minimum and maximum temperatures were found 1–2 months later (approximately 10 °C and 25 °C in midwinter and midsummer, respectively). It must be highlighted that temperatures above 20 °C were observed from June to November. During the summer months (June–September), precipitation was absent, then some small precipitation was observed in autumn (October–November) before considerable precipitation occurred in winter (December) (Figure 2b). Sulfide concentrations >100 μM were observed during the warm (>20 °C) and dry season, which dropped down after the strong precipitation in December (Figure 2a,b). Low sulfide concentrations (<12 μM) maintained from January to May, and increased again in the last sampling to 67 μM, approaching 109 μM and 97 μM in May and June of the previous year (Figure 2b). Thus, the annual cycle shows two phases: one with high sulfide concentration (>100 μM) between June and December, and another with low sulfide concentration between January and June. Cyanobacteria concentration followed the seasonal sulfide pattern (Figure 2b). Nitrate and ammonium ranged from 8–42 μM and 0–20 μM, respectively; the phosphate level was 1–2 orders of magnitude lower than the level recorded for inorganic nitrogen, which ranged from 9–0.6 μM. Excluding the two dates with undetectable phosphate concentrations (June and December 2016), the lowest phosphate concentration was 0.07 μM. The N/P ((NO3 + NH4+)/PO4−3) ratio was always >16, suggesting a relative limitation of phytoplankton growth of phosphate with respect to nitrate.

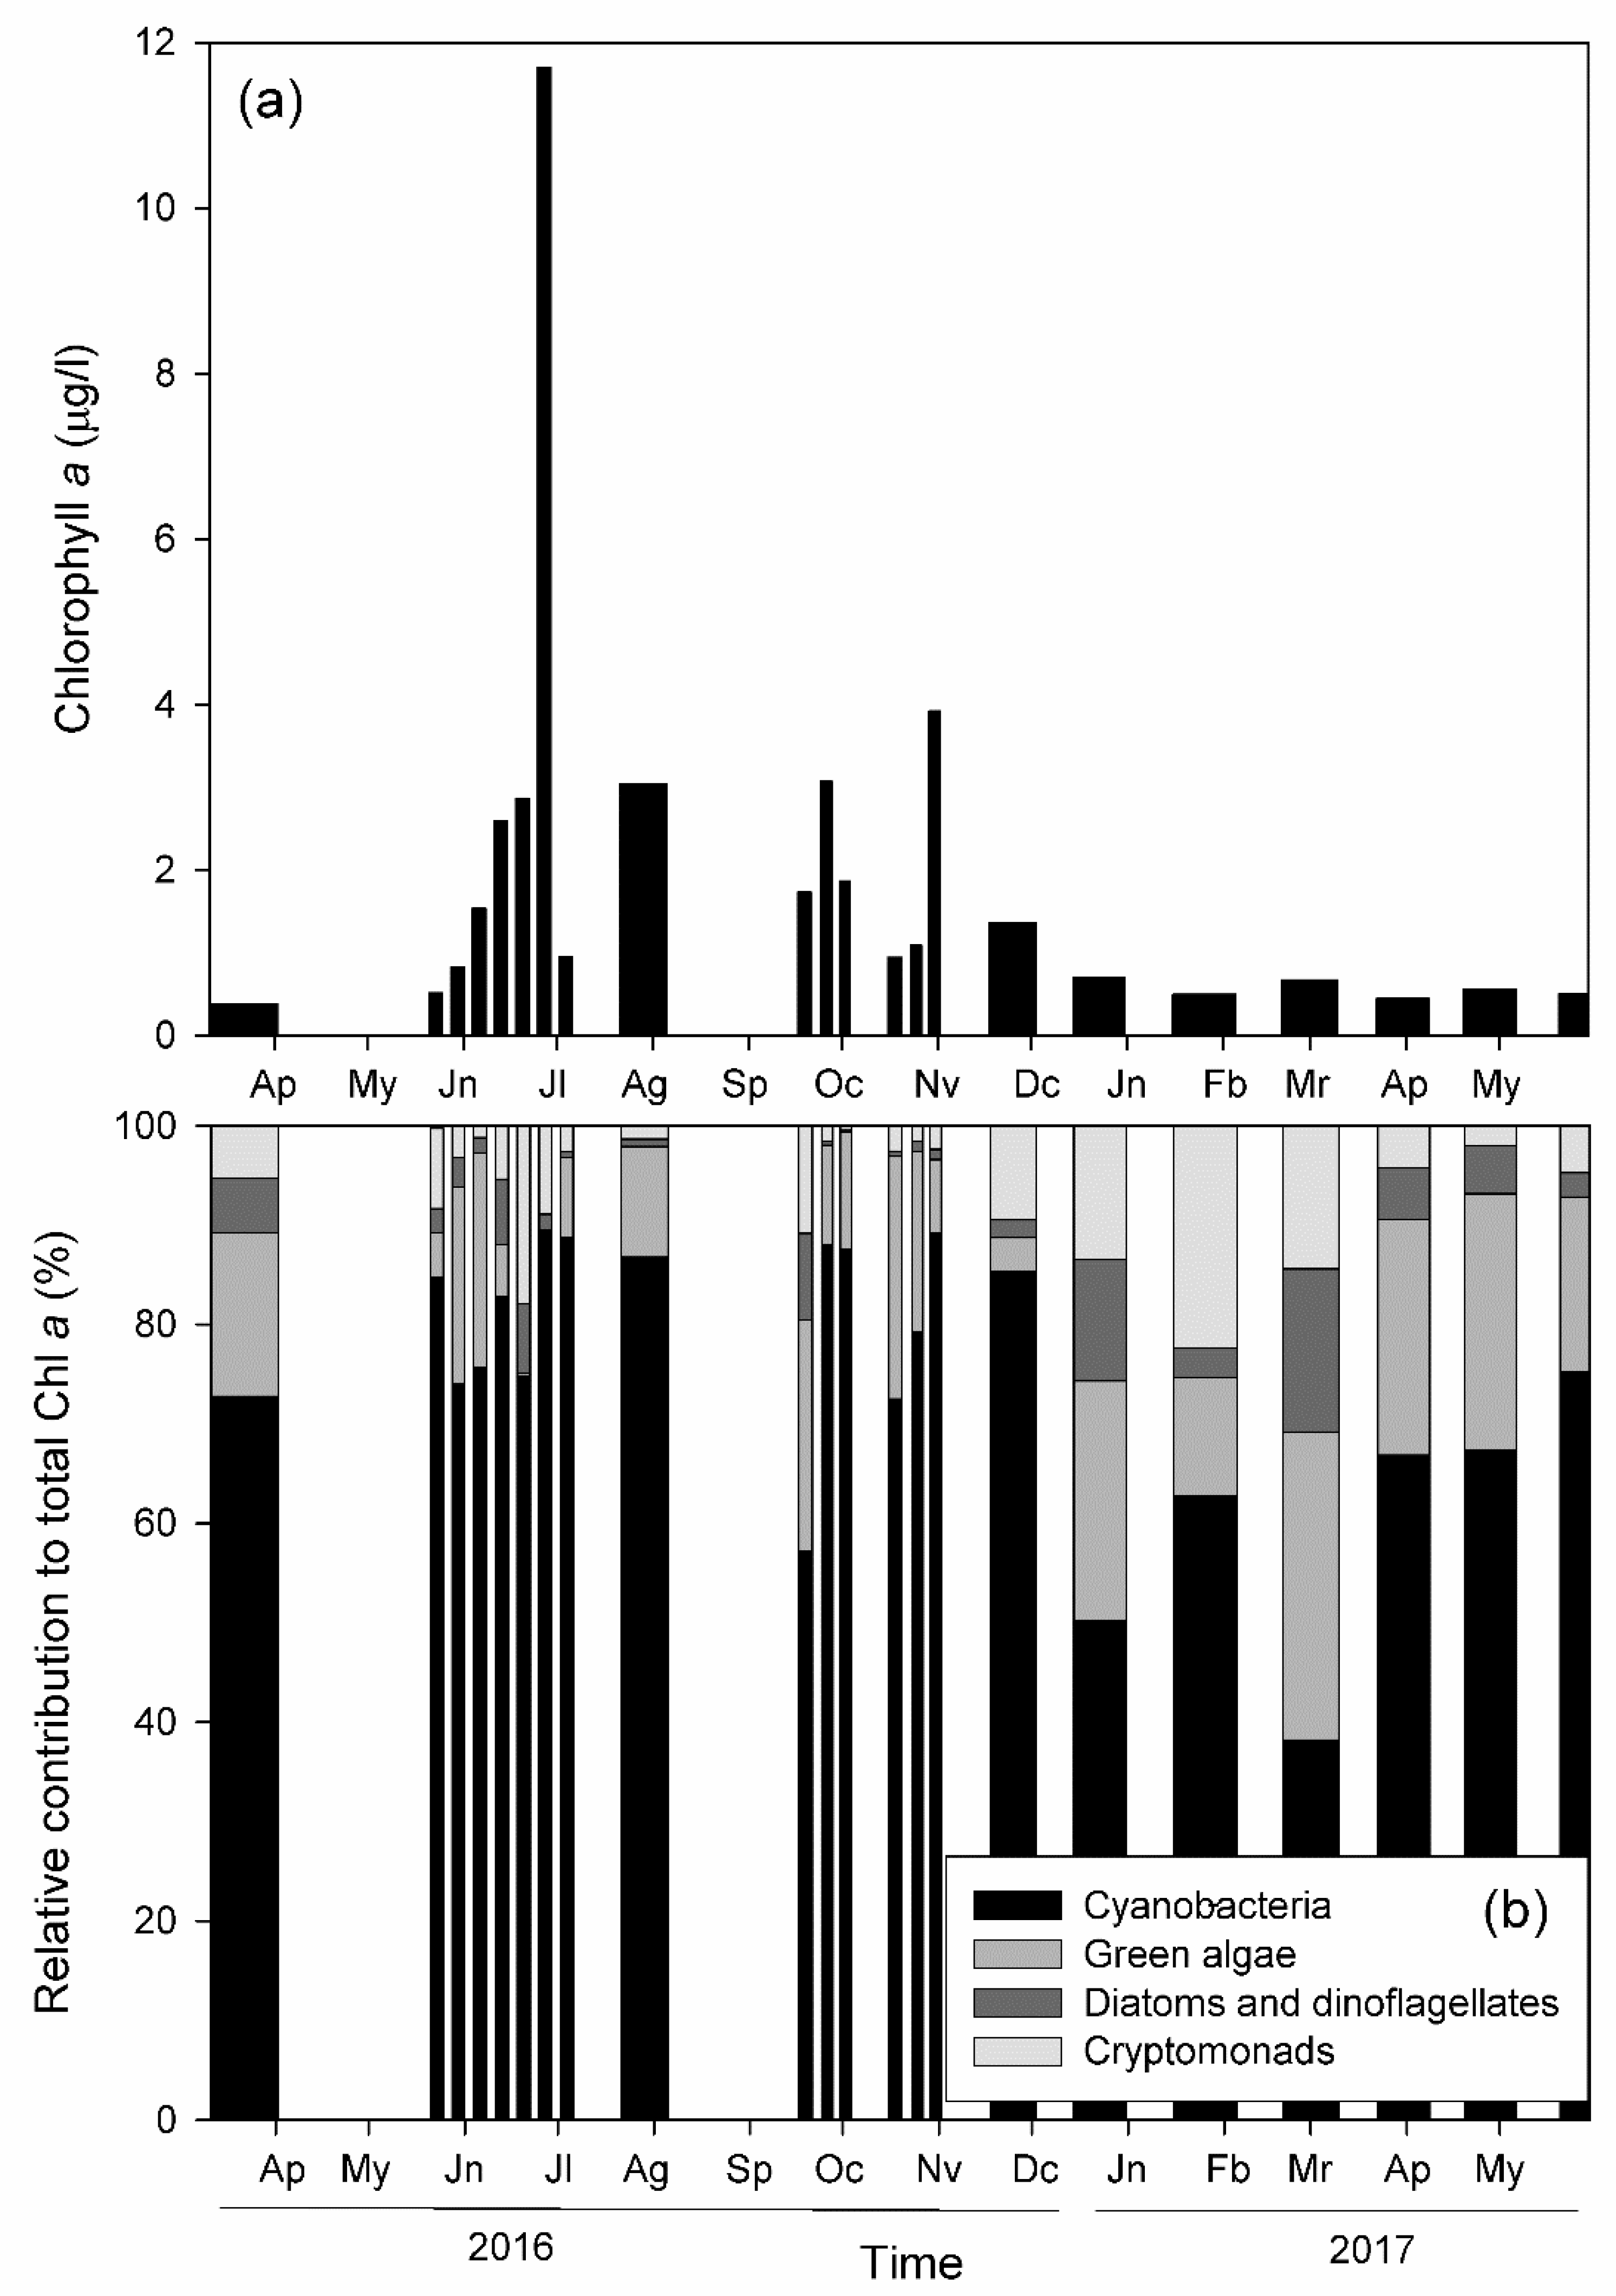
3.2. Phytoplankton Abundance and Diversity

The highest Chl a concentration (11 μg L−1) was observed in late June 2016 (Figure 3a). Chl a concentration was significantly higher (median = 1.8 μg L−1) during the dry season, with a higher (>100 μM) sulfide concentration than in the period of low (<100 μM) sulfide concentration (median = 0.5 μg L−1) (p < 0.004, Mann–Whitney Rank Sum Test). Cyanobacteria (Oscillatoria sp.) dominated Chl a concentration throughout the year (Figure 3b). The phytoplanktonic group concentration, the relative contribution of cyanobacteria (Oscillatoria sp.) to total Chl a concentration, and the sulfide concentration in summer and in winter are compared in Table 1. Only Oscillatoria sp. showed significant differences between summer and winter, with higher concentrations in summer, coinciding with significantly higher sulfide concentrations.
Thus, changes in total Chl a concentration and the relative contribution of the four groups depend only on the temporal variability of cyanobacteria (Oscillatoria sp.), while the other groups remain similar throughout the year (Figure 3).

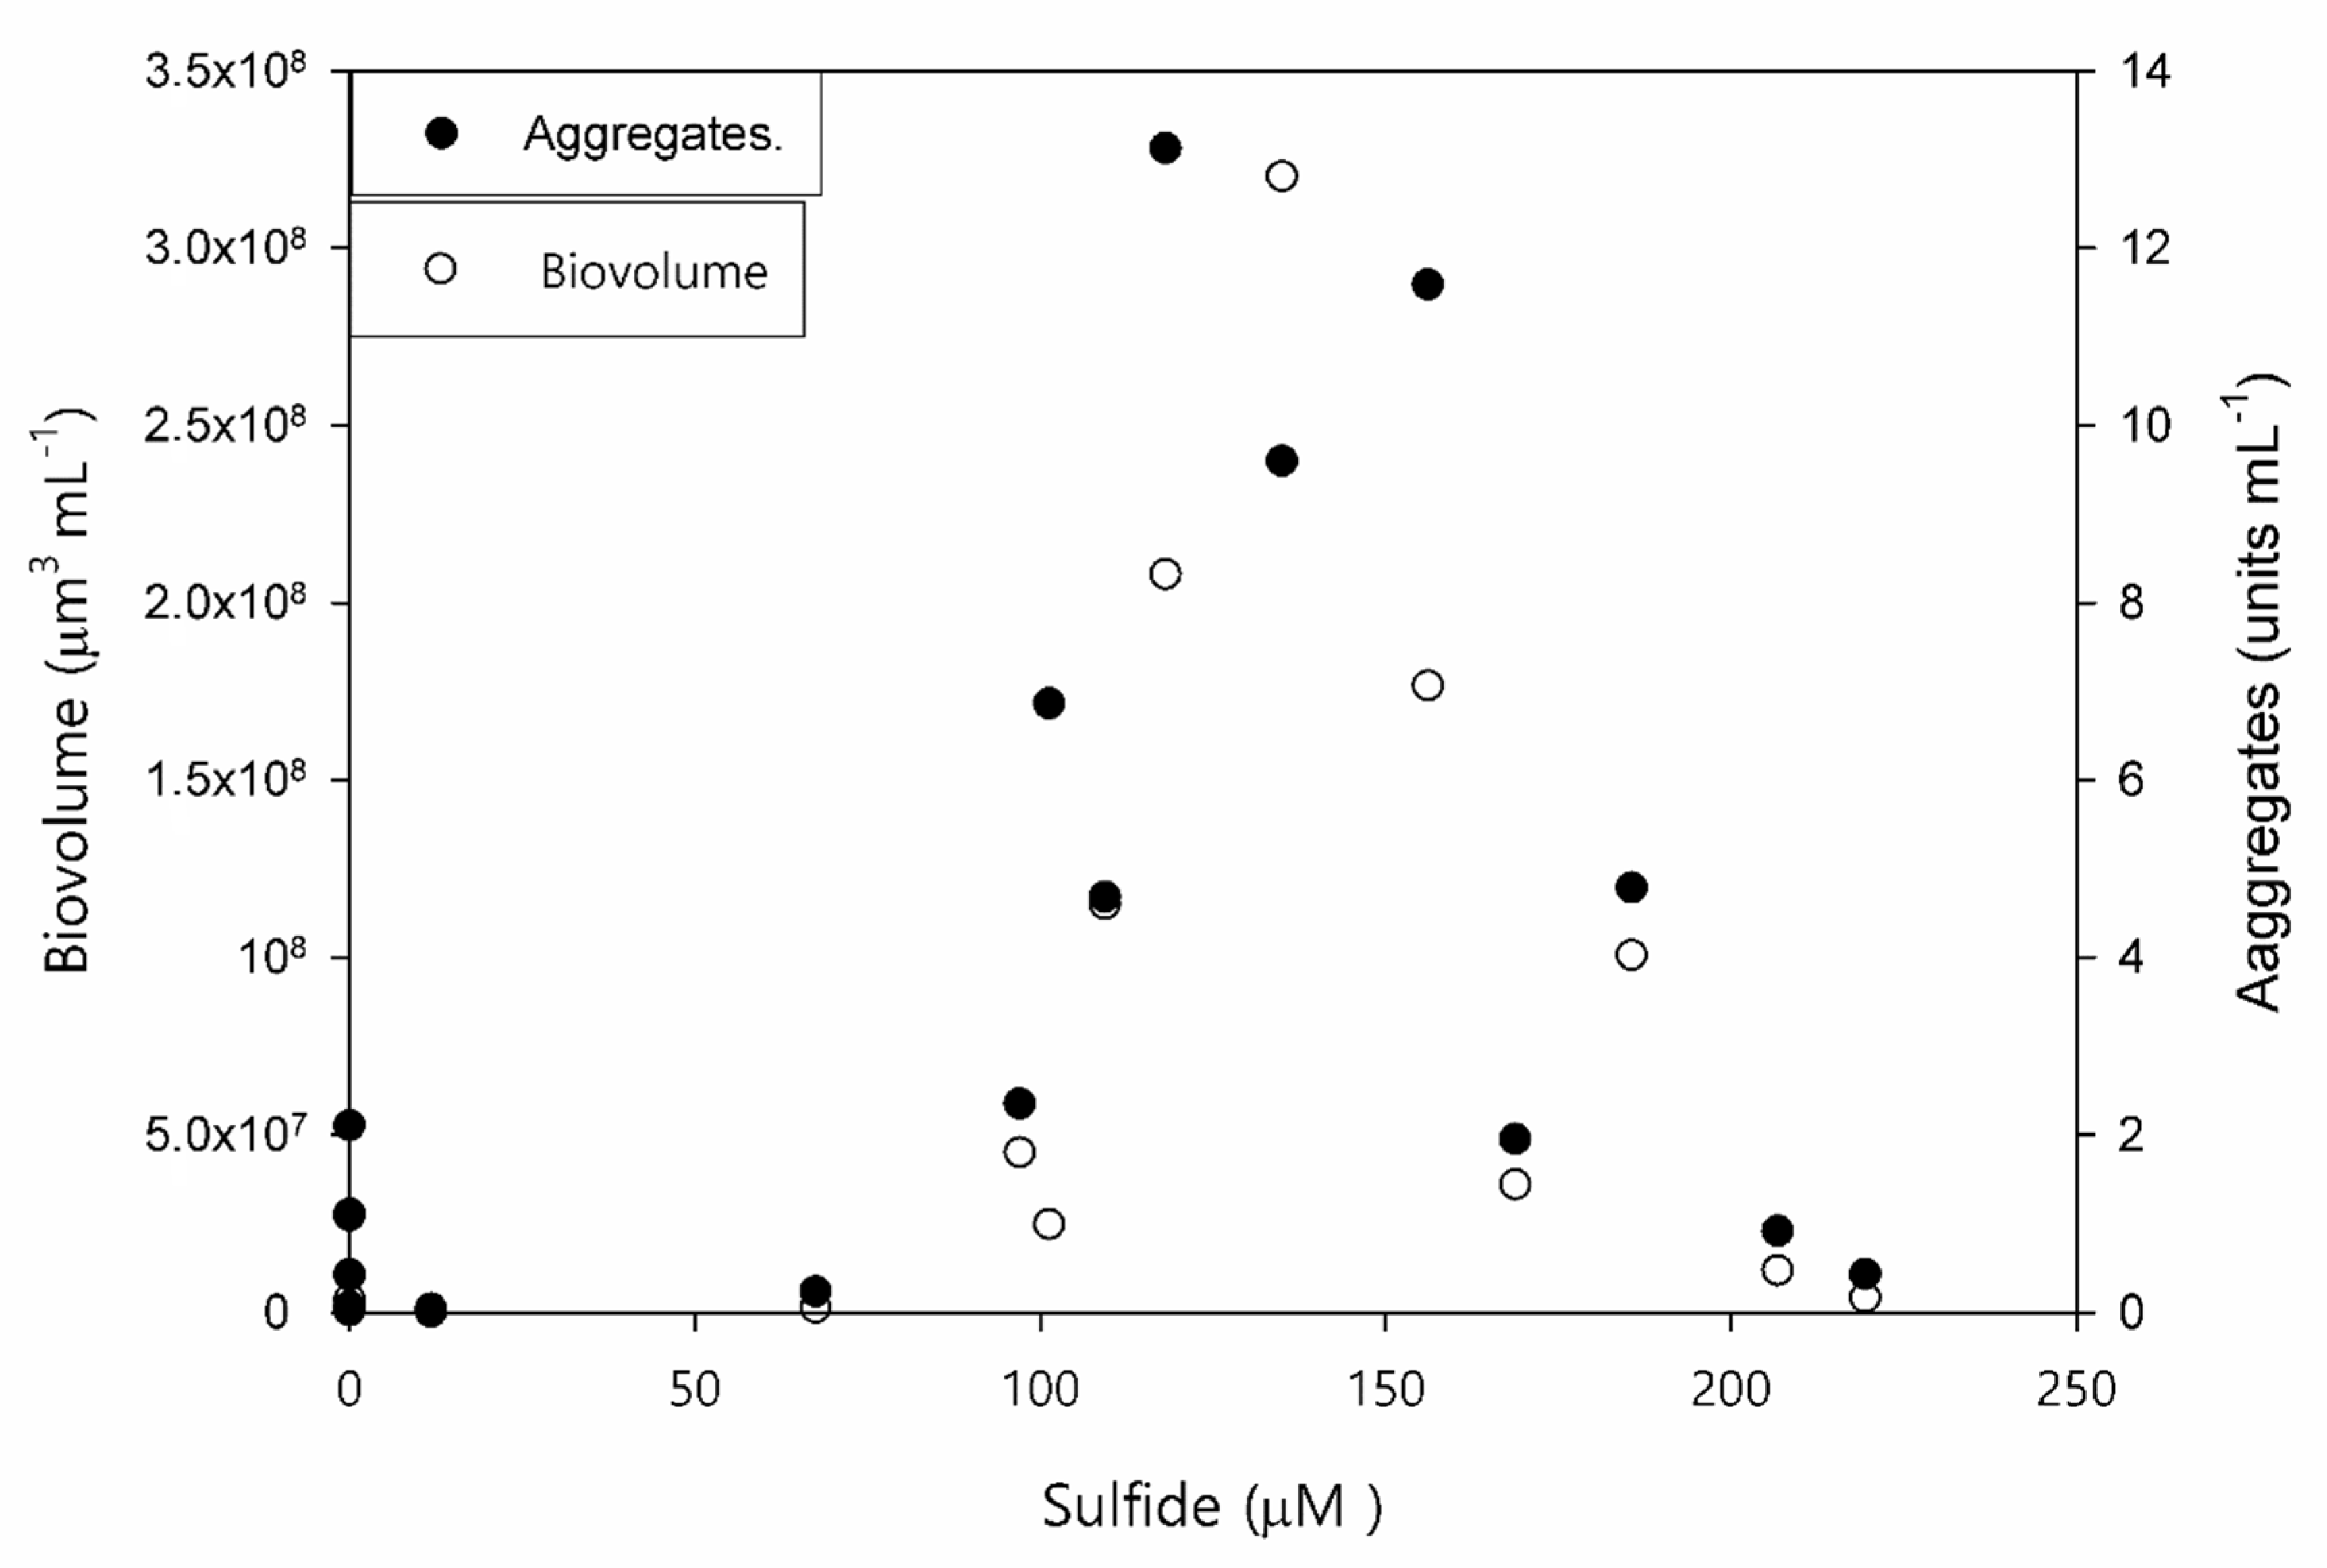
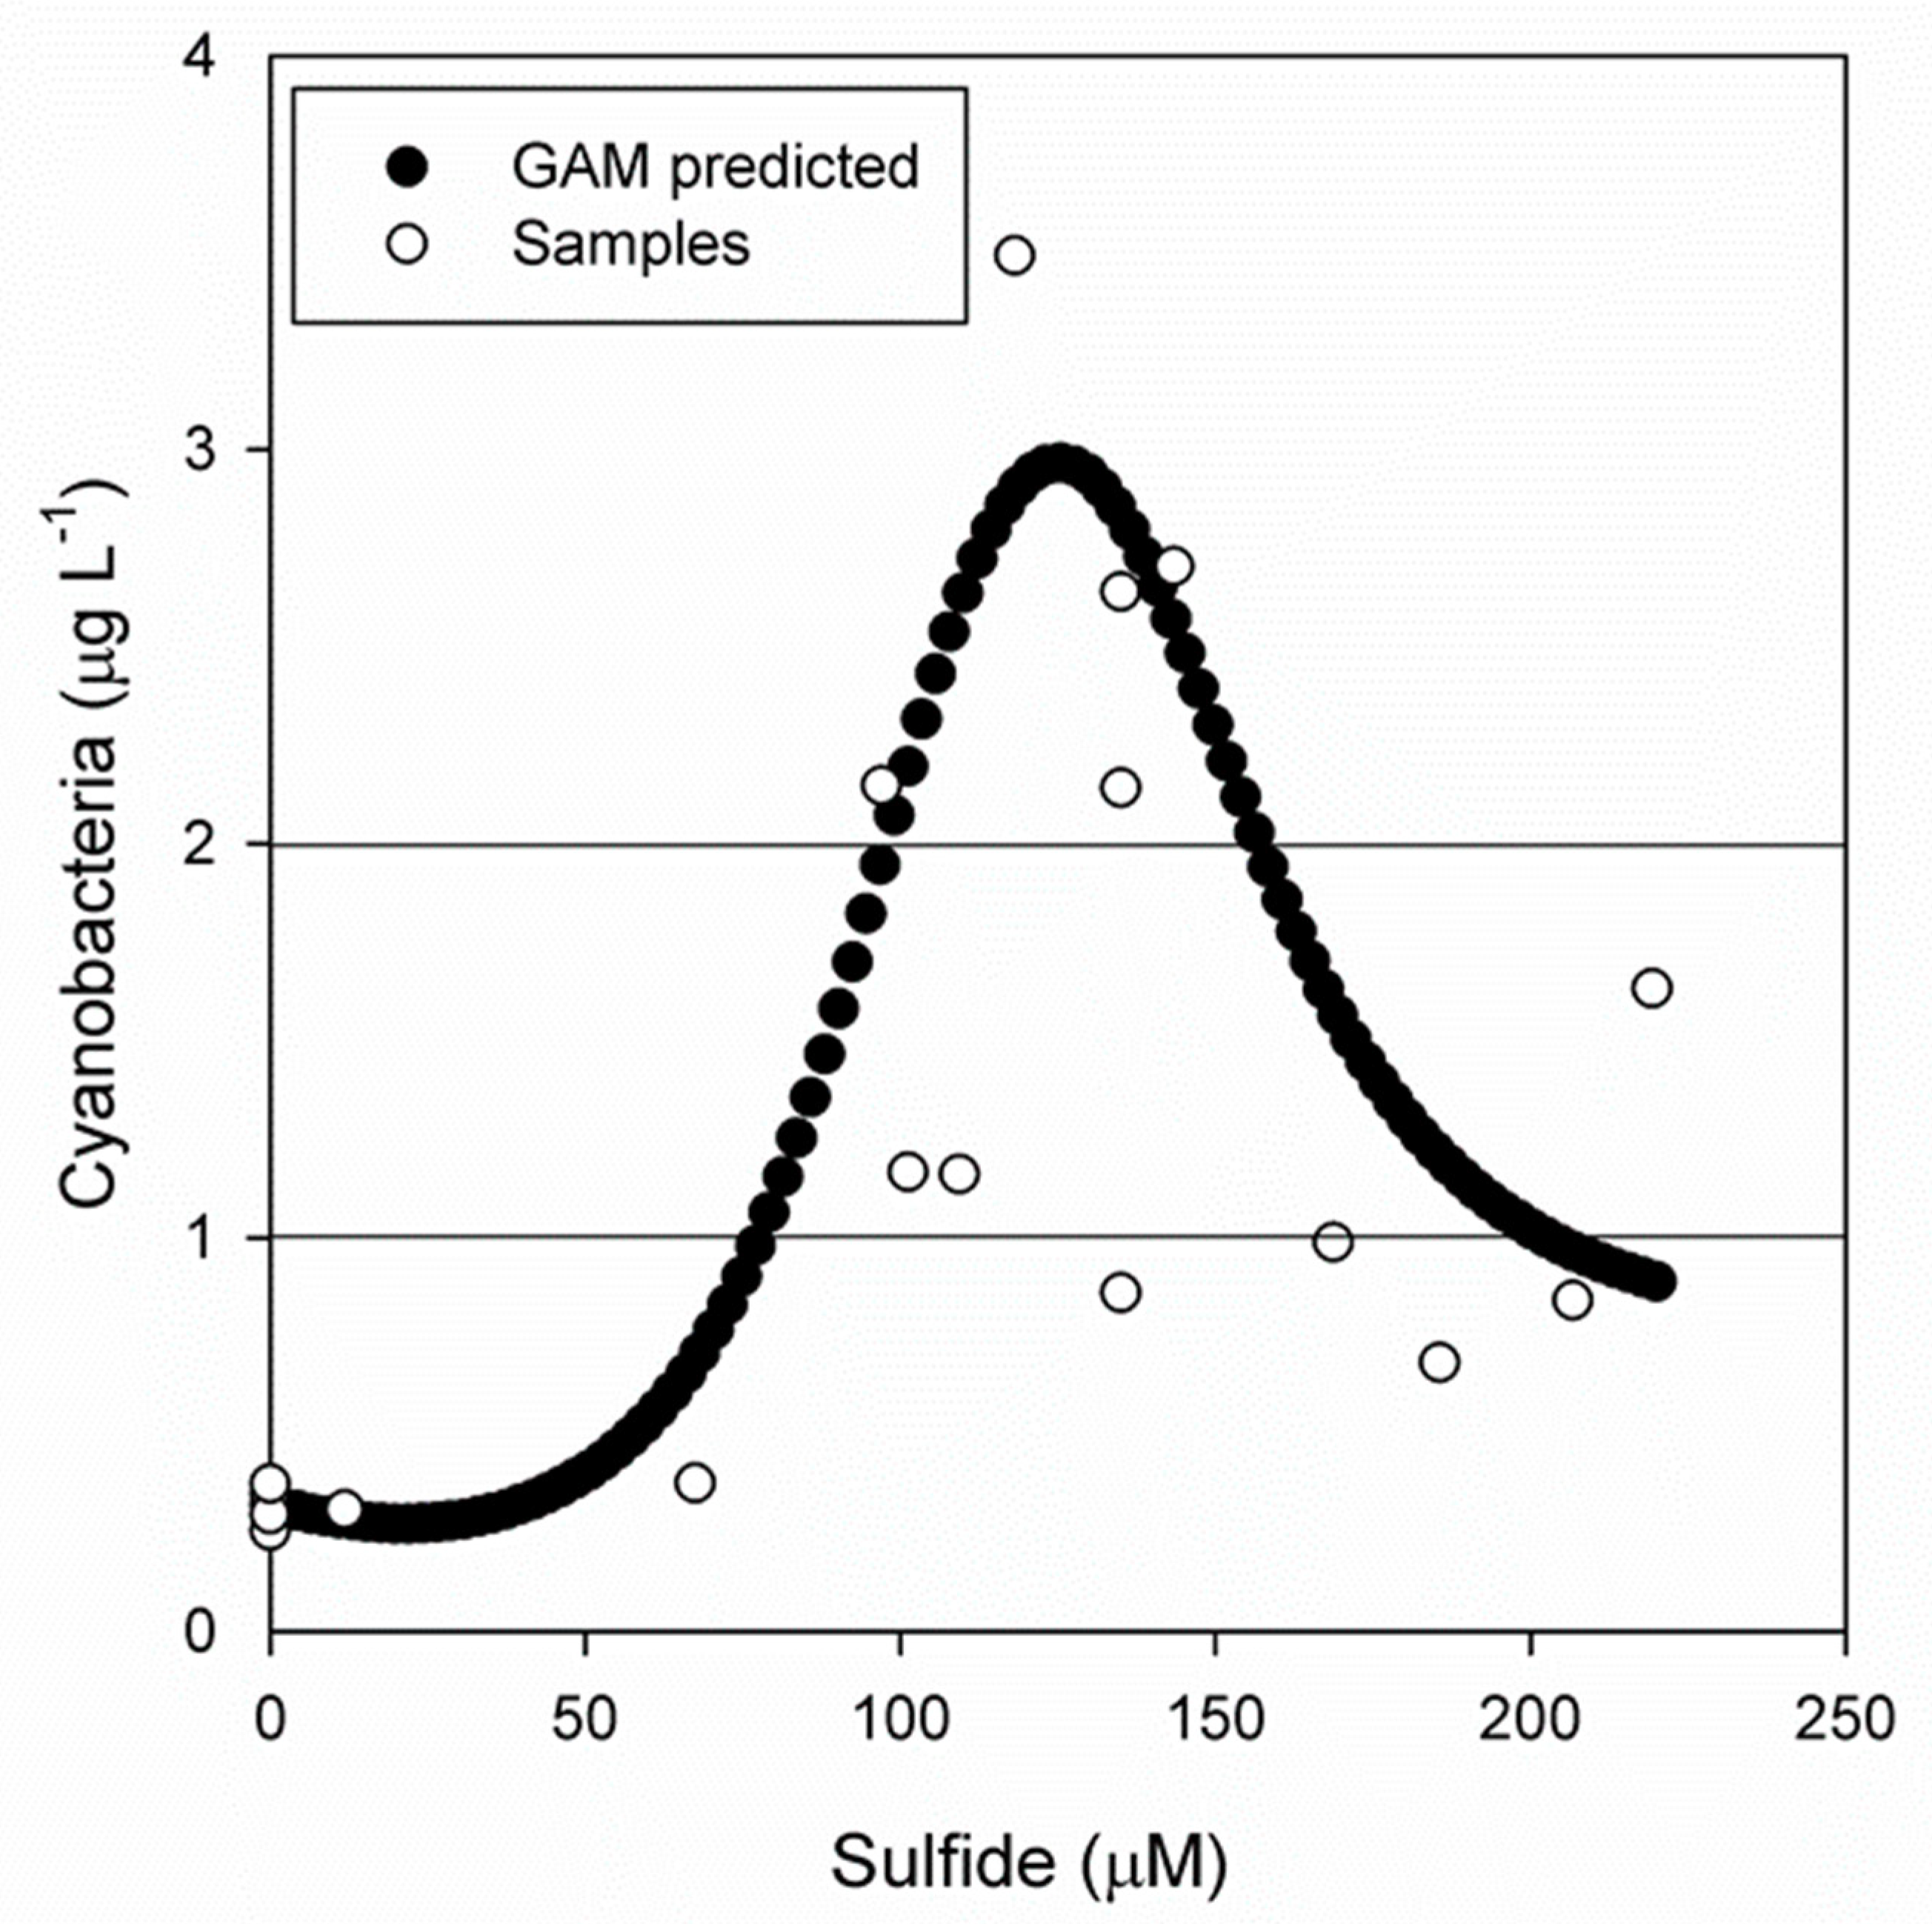
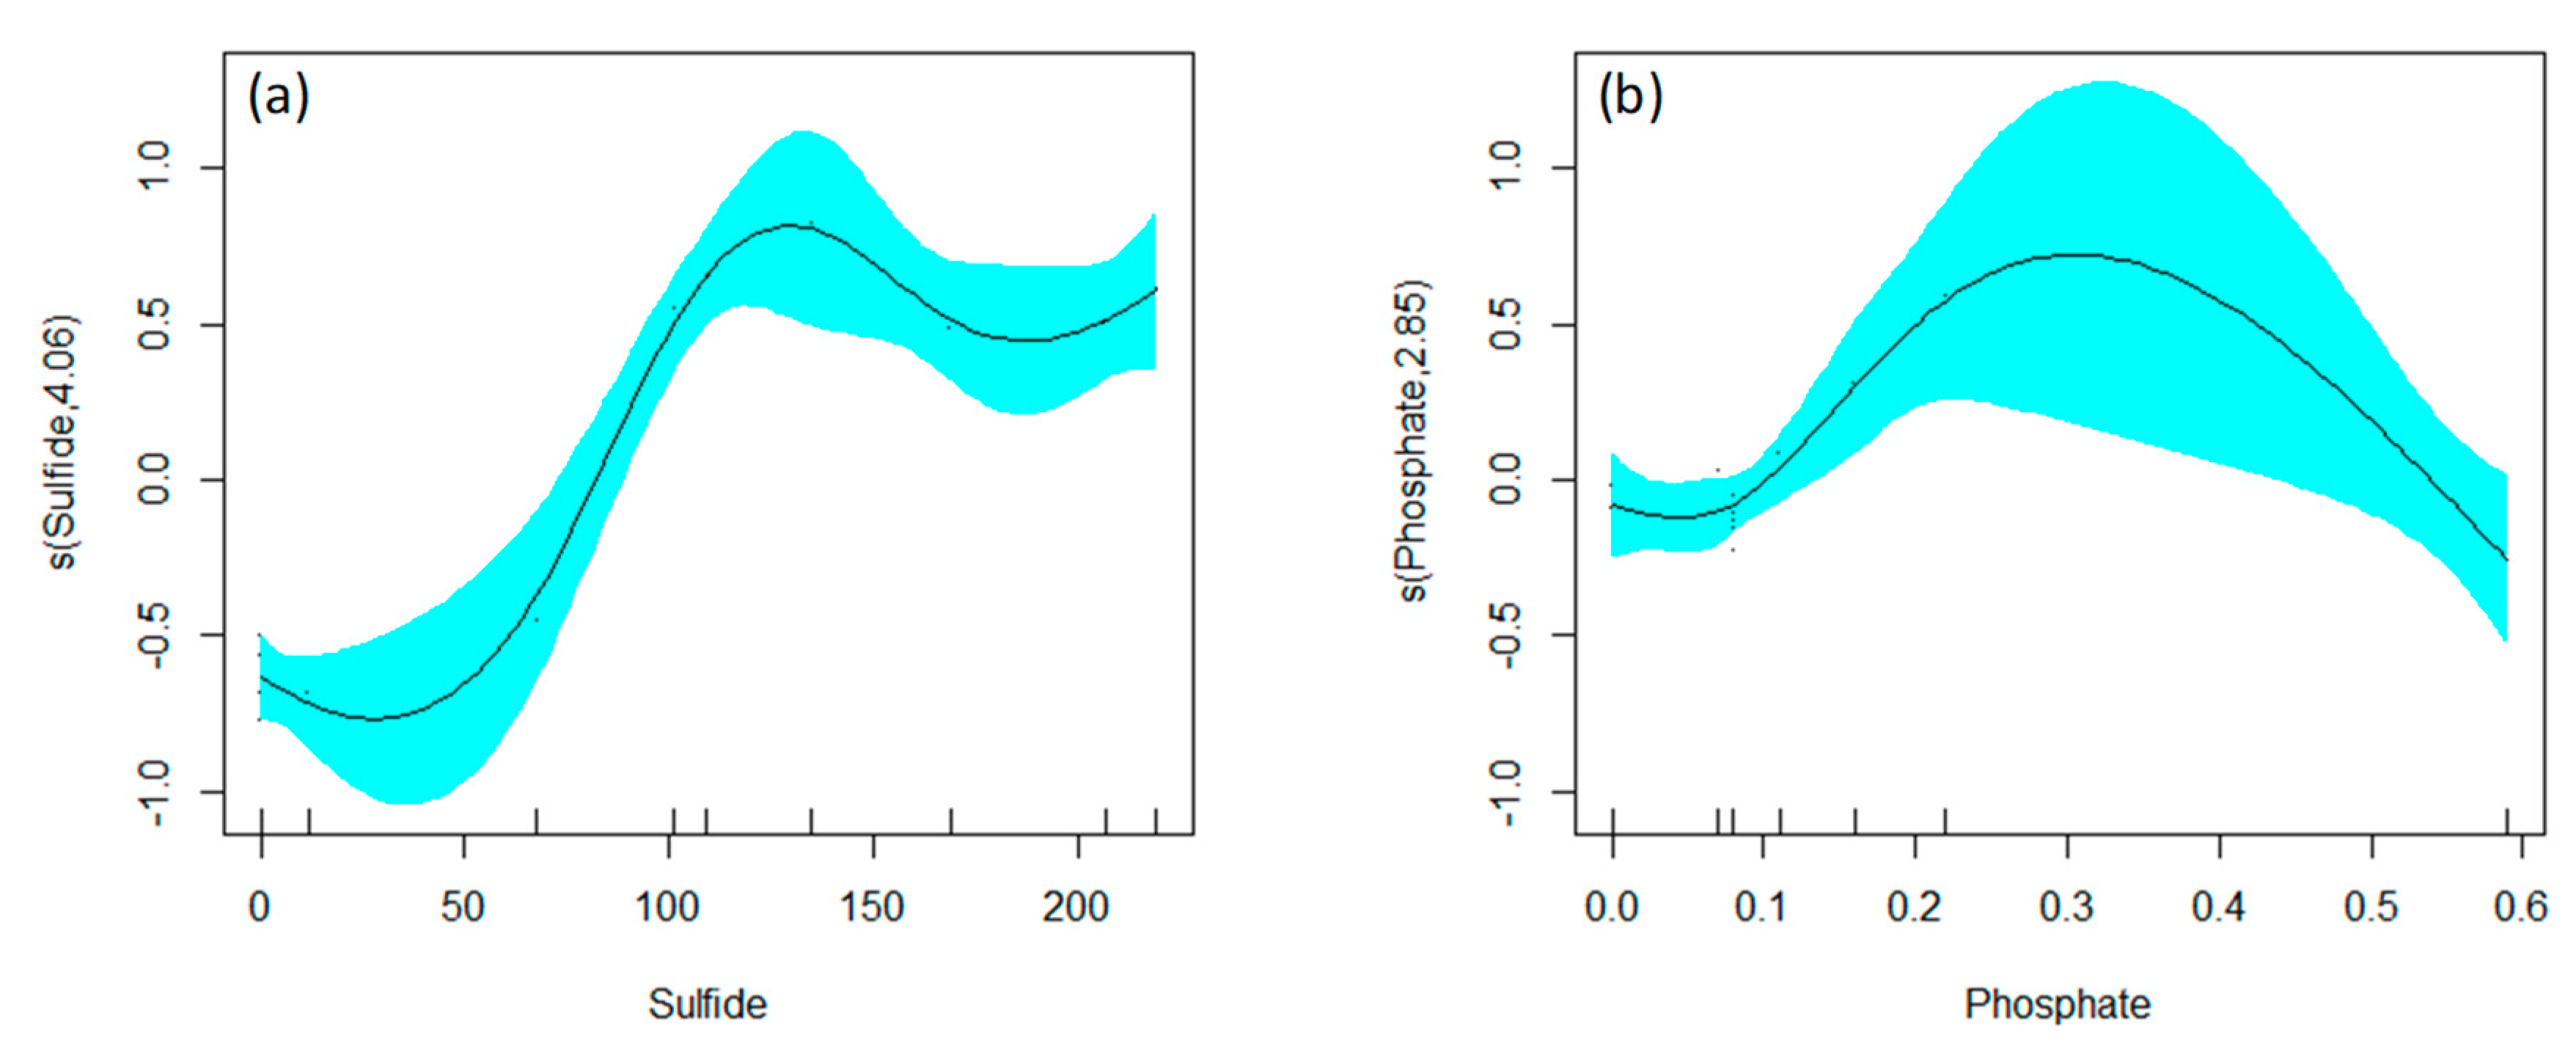
3.3. What Triggers Cyanobacteria (Oscillatoria sp.) Concentration?

By plotting Oscillatoria sp. abundance and biovolume of cells/aggregates <100 μm against sulfide concentration, low abundance/biovolume values were observed at lower and higher sulfide concentrations, and the highest abundance/biovolume values were observed between 100 and 200 μM (Figure 4). As the N/P ratio is higher than 16, in the case of nutrient limitation of algal growth, phosphorus would be the limiting macronutrient. However, sulfide is a selective agent that negatively affects oxygenic photosynthesis and phytoplankton growth. Therefore, both variables could trigger Oscillatoria sp. growth.
Presenting the cyanobacteria concentration as proxy for the whole size range of Oscillatoria sp. against sulfide concentration, and indicating the phosphate concentration with a color scale, the optimal sulfide concentration for Oscillatoria sp. growth is detected in the range of 100–200 μM (Figure 5). High phosphate concentrations beyond a sulfide concentration of 200 μM did not lead to elevated Oscillatoria sp. concentration. As the relation between cyanobacteria and sulfide and phosphate concentration was not linear, a general additive model (GAM) analysis was carried out in order to predict Oscillatoria sp. concentration at La Hedionda spa.

GAM Analysis

The GAM analysis [32] was fitted using the ‘mgcv 1.8–17’ package in R version 3.4.1. Three GAMs were analyzed by considering sulfide, phosphate or both compounds as explanatory variables. The percentage of explained variation was 97.3%, 58.8% and 99.3%, respectively, with AIC values of −10.4, 19.4 and −18.7. Consequently, the GAM which considers both sulfide and phosphate was chosen (Appendix A).
Sulfide was the most important predictor, and explains almost 97.3% of the variability. The predicted curve of the model shows Chl a concentration corresponding to cyanobacteria (Oscillatoria sp.) ≥2 μg L−1 at sulfide concentrations ranging between 100–160 μM, and Chl a concentrations >1 μg L−1 at sulfide concentrations between 70–200 μM (Figure 6).

4. Discussion

Sulfide, Chl a and cyanobacteria (Oscillatoria sp.) concentrations follow a clear annual cycle at La Hedionda spa, with a hot, dry and sulfide-rich summer period (June–November), and a colder, sulfide-poor winter period (December–May). Low sulfide concentration is related to dilution by recharging of the aquifer through precipitation in winter and spring. It is worth mentioning that the highest Chl a and cyanobacteria (Oscillatoria sp.) concentrations were found during the sulfide-rich period. The remaining variables do not provide relevant information explaining the annual cycle. The concentration of the remaining phytoplanktonic groups was low and constant during the year. Low Chl a concentration during the period of low sulfide concentration could be related to higher cell loss of phytoplankton by water runoff. However, algal loss by runoff would affect all planktonic groups in a similar way, but the other taxa remain at similar concentrations during the whole year and no significant differences have been observed between summer and winter. Therefore, factors other than runoff could trigger the cyanobacteria (Oscillatoria sp.) concentration cycle. From an ecophysiological point of view, an Oscillatoria sp. strain isolated from La Hedionda spa in the framework of the same research project showed maximum growth rates when exposed to 100–350 μM daily sulfide additions in the growth medium [2]. Field data and the adjusted GAM model show an optimum curve with the highest cyanobacteria concentration (2.97 μg L−1) at a sulfide concentration of 125 μM. This is close to the mean sulfide concentration (147 ± 36 μM) of La Hedionda water in summer, showing that the degree of Oscillatoria sp. sulfide tolerance is correlated with the environmental sulfide level, as observed previously in other cyanobacteria inhabiting sulfidic habitats [6]. In fact, the prevalence of sulfide in the source water is one of the most noticeable features at La Hedionda. It seems logical that this component is related to the cyanobacterial richness and abundance, taking into account that a common trait of these kinds of springs is that sulfide is the factor that modulates the cyanobacteria composition of the phytoplankton [10].
The fact that a strain of the Oscillatoria genus shows a higher abundance under sulfide conditions due to the resistance of PSII is already described in the literature [6,10,11]. This compound blocks the electron flow from the donor side of PSII, inhibiting oxygenic photosynthesis [6,33], an effect observed in many cyanobacteria groups regardless of the strain’s evolutionary history or its degree of sulfide tolerance [6]. Thus, Oscillatoria sp. found in La Hedionda seem to exhibit sulfide-resistant oxygenic photosynthesis, which is not common in cyanobacteria since the majority of groups are sensitive to H2S concentrations in the range 10–50 µM [11]. Indeed, even some cyanobacteria living in low sulfide springs are sulfide-sensitive [11], so this strain found in La Hedionda that showed sulfide-resistance is a remarkable fact.
However, Oscillatoria sp. found in La Hedionda not only seem to exhibit sulfide-resistant photosynthesis, but sulfide seems to improve its fitness as its relative abundance in its natural medium is enhanced by sulfide (Figure 6), along with its growing rate [2] and the maximum quantum yield of PSII (data not shown) is higher in the presence than in the absence of sulfide. This result is similar to that found in a strain of Oscillatoria sp. isolated from Wilbur Hot Springs (California, USA), that showed sulfide-resistant oxygenic photosynthesis, which increased more than two-fold in presence of approximately 100 μM H2S [11]. Moreover, an Oscillatoria terebriformis strain from a sulfide spring in Hunter’s Hot Springs (Oregon, USA) was also described as a sulfide-resistant strain, but was incapable of performing anoxygenic photosynthesis [10].
These strains [10,11] could not perform anoxygenic photosynthesis using sulfide as an electron donor to PSI, which has also been seen in the preliminary results with the strain presented in this work (data not shown). Consequently, sulfide-resistant oxygenic photosynthesis instead of sulfide-dependent anoxygenic photosynthesis seems to be a common strategy followed by Oscillatoria sp. to survive under sulfide conditions in springs with moderate sulfide levels and oxygenated waters on the mat layer. It is remarkable that in the present study, not the classical factors (physical factors, nutrients, grazing [19]) but precisely the selective variable of the extreme environment positively affects adapted organisms. Although thermal spas are less variable than other epicontinental aquatic ecosystems, we suggest future studies covering several annual cycles to confirm our findings.

5. Conclusions

  • Total sulfide concentration in La Hedionda Spa shows an annual cycle, with concentrations around 40 μM in winter and up to 200 μM in summer.
  • Regardless of cyanobacteria, other phytoplankton groups show consistently similar and low concentrations throughout the year.
  • The fact that cyanobacteria (Oscillatoria sp.) reaches the highest concentration at high sulfide concentrations suggests the presence of a high sulfide-adapted Oscillatoria sp. population.
  • In contrast to generally accepted succession models in epicontinental waters, neither nutrient nor light, but the selective agent (sulfide) positively triggers Oscillatoria sp. proliferation in summer.
  • While Oscillatoria sp. are distributed worldwide, the present strain might be the result of an almost 2000 year adaptation with the annual sulfide cycle of La Hedionda Spa.

Author Contributions

Conceptualization, A.R.; A.F.-M.; M.J.G.-S.; methodology, E.M.-C., I.J.M.-J.; E.B.-E.; software, A.R.; validation, resources, A.F.-M., M.J.G.-S.; writing—original draft preparation, A.R.; writing—review and editing, A.F.-M., E.M.-C., M.J.G.-S.; I.J.M.-J.; E.B.-E.; funding acquisition, A.F.-M.; M.J.G.-S. All authors have read and agreed to the published version of the manuscript.

Funding

This research was funded by the national projects CGL2014-53862-P, CGL2017-87314-P (Ministerio de Economía y Competitividad, Spain). EM-C was funded by a BES-2015-0728984 grant (Ministerio de Economía y Competitividad, Spain). The acquisition of the FlowCAM by the University of Málaga was co-financed by the 2008–2011 FEDER program for Scientific-Technique Infrastructure (UNMA08-1E005).

Conflicts of Interest

The authors declare no conflict of interest.

Appendix A

Detailed information of the GAM analysis.
Table A1. Formulae, coefficient and significant level of the GAM analysis. The used smoothing method was Restricted Maximum Likelihood (REML), k refers to knots and indicates the maximum number of turning points, edf refers to estimated degrees of freedom and indicates the turning points found in the smoothing process, Ref.df refers to reference degrees of freedom, F is the F value, the Pr(>|t|) is the t value for the t test. Significance codes: 0 ‘***’ 0.001 ‘**’ 0.01 ‘*’ 0.05 ‘.’ 0.1 ‘ ’ 1.
Family: Tweedie (p = 1.116)
Link function: log
Formula:
Cyanobacteria ~ s(Sulfide, k = 6) + s(Phosphate, k = 6)
Parametric coefficients:
Estimate Standard Error t value Pr(>|t|)
(Intercept) −0.42269 0.03862 −10.94 0.00035 ***
Approximate significance of smooth terms:
edf Ref.df F  p-value
s(Sulfide)  4.056 4.305 38.795 0.000548 ***
s(Phosphate) 2.851 3.023 5.898 0.060124.
R2 (adjusted) = 0.993 Deviance explained = 99.3%
−REML = 2.5089 Scale est. = 0.010243 n = 12
Figure A1. Functional forms of the smoothed (s) covariates (a) sulfide and (b) phosphate in μM of the generalized additive model.
Water 12 00883 g0a1

References

  1. Jiménez-Sánchez, J.; De la Hera Portillo, A.; Rubio Campos, J.C.; Hueso-Quesada, L.M. Informe de caracterización hidrogeológica y propuesta de protección de manantiales y lugares de interés hidrogeológico (Málaga). In Plan de Conservación, Recuperación y Puesta en Valor de Manantiales y Lugares de Interés Hidrogeológico de Andalucía (Estrategia de Conservación de los Ecosistemas Acuáticos Relacionados con las Masas de Agua Subterránea)—MA-4 Baños de la Hedionda; Estirado Oliet, M., Rubio Campos, J.C., Espina Argüello, J., García Padilla, M., Fernández-Palacios Carmona, J.M., Cañizares García, M.I., Eds.; 2011; Available online: http://info.igme.es/SidPDF/167000/081/167081_0000001.pdf (accessed on 1 December 2019).
  2. Martín-Clemente, E.; Melero-Jiménez, I.J.; Bañares-España, E.; Flores-Moya, A.; García-Sánchez, M.J. Adaptation dynamics and evolutionary rescue under sulfide selection in cyanobacteria: a comparative study between Microcystis aeruginosa and Oscillatoria sp. (cyanobacteria). J. Phycol. 2019, 55, 1348–1360. [Google Scholar] [CrossRef] [PubMed]
  3. IGME-JA. Evaluación del Estado Actual de las Aguas Minerales en la Comunidad Autónoma de Andalucía (Convenio Marco de asistencia técnica entre el Instituto Tecnológico y Geominero de España y la Consejería de Economía y Hacienda de la Junta de Andalucía) 1991. Available online: http://info.igme.es/SidPDF%5C034000%5C671%5CMemoria%5C34671_0001.pdf (accessed on 1 December 2019).
  4. Flores-Moya, A.; Costas, E.; Bañares-España, E.; García-Villada, L.; Altamirano, M.; López-Rodas, V. Adaptation of Spirogyra insignis (Chlorophyta) to an extreme natural habitat environment (sulphureous waters) through preselective mutations. New Phytolog. 2005, 166, 655–661. [Google Scholar] [CrossRef] [PubMed]
  5. Oren, A.; Padan, E.; Malkin, S. Sulfide inhibition of Photosystem II in cyanobacteria (blue-green algae) and tobacco chloroplasts. BBA Bioenerg. 1979, 546, 270–279. [Google Scholar] [CrossRef]
  6. Miller, S.R.; Bebout, B.M. Variation in sulfide tolerance of photosystem II in phylogenetically diverse cyanobacteria from sulfidic habitats. Appl. Environ. Microb. 2004, 70, 736–744. [Google Scholar] [CrossRef] [Green Version]
  7. Bagarinao, T. Sulphide as an environmental factor and toxicant: tolerance and adaptations in aquatic organisms. Aquat. Toxicol. 1992, 24, 21–62. [Google Scholar] [CrossRef]
  8. Stal, L.J. Physiological ecology of cyanobacteria in microbial mats and other communities. New Phytol. 1995, 131, 1–32. [Google Scholar] [CrossRef] [Green Version]
  9. Stal, L.J. Cyanobacterial mats and stromatolites. In Ecology of Cyanobacteria II: Their Diversity in Space and Time; Whitton, B.A., Ed.; Springer: Dordrecht, The Netherlands, 2012; pp. 65–125. [Google Scholar]
  10. Castenholz, R.W. The effect of sulfide on the blue-green algae of hot springs II. Yellowstone National Park. Microb. Ecol. 1977, 3, 79–105. [Google Scholar] [CrossRef]
  11. Cohen, Y.; Jørgensen, B.B.; Revsbech, N.P.; Poplawski, R. Adaptation to hydrogen sulfide of oxygenic and anoxygenic photosynthesis among cyanobacteria. Appl. Environ. Microbiol. 1986, 51, 398–407. [Google Scholar] [CrossRef] [Green Version]
  12. Dodds, W.K.; Castenholz, R.W. Sulfide and pH effects on variable fluorescence of photosystem II in two strains of the cyanobacterium Oscillatoria amphigranulata. Photosynth. Res. 1990, 24, 265–271. [Google Scholar] [CrossRef]
  13. Cohen, Y.; Jørgensen, B.B.; Paden, E.; Shilo, M. Sulfide dependent anoxygenic photosynthesis in the cyanobacterium Oscillatoria limnetica. Nature 1975, 257, 489–492. [Google Scholar] [CrossRef]
  14. Cohen, Y.; Padan, E.; Shilo, M. Facultative anoxygenic photosynthesis in the cyanobacterium Oscillatoria limnetica. J. Bacteriol. 1975, 123, 855–861. [Google Scholar] [CrossRef] [PubMed] [Green Version]
  15. Leister, D. Experimental evolution in photoautotrophic microorganisms as a means of enhancing chloroplast functions. Essays Biochem. 2017, 62, 77–84. [Google Scholar] [CrossRef]
  16. Walter, J.M.; Coutinho, F.H.; Dutilh, B.E.; Swings, J.; Thompson, F.L.; Thompson, C.C. Ecogenomics and taxonomy of Cyanobacteria phylum. Front. Microbiol. 2017, 8, 2132. [Google Scholar] [CrossRef] [PubMed]
  17. Fernández-Arjona, M.M.; Bañares-España, E.; García-Sánchez, M.J.; Hernández-López, M.; López-Rodas, V.; Costas, E.; Flores-Moya, A. Disentangling mechanisms involved in the adaptation of photosynthetic microorganisms to the extreme sulphureous water from Los Baños de Vilo (S Spain). Microb. Ecol. 2013, 66, 742–751. [Google Scholar] [CrossRef]
  18. Bañares-España, E.; Fernández-Arjona, M.M.; García-Sánchez, M.J.; Hernández-López, M.; Reul, A.; Mariné, M.H.; Flores-Moya, A. Sulphide resistance in the cyanobacterium Microcystis aeruginosa: a comparative study of morphology and photosynthetic performance between the sulphide-resistant mutant and the wild-typestrain. Microb. Ecol. 2016, 71, 860–872. [Google Scholar] [CrossRef]
  19. Sommer, U.; Adrian, R.; De Senerpont Domis, L.; Elser, J.J.; Gaedke, U.; Ibelings, B.; Jeppesen, E.; Lürling, M.; Molinero, J.C.; Mooij, W.M.; et al. Beyond the Plankton Ecology Group (PEG) Model: Mechanisms Driving Plankton Succession. Annu. Rev. Ecol. Evol. Syst. 2012, 43, 429–448. [Google Scholar] [CrossRef]
  20. Demoulin, C.F.; Lara, Y.L.; Cornet, L.; François, C.; Baurain, D.; Wilmotte, A.; Javaux, E.J. Cyanobacteria evolution: Insight from the fossil record. Free Radic. Biol. Med. 2019, 140, 206–223. [Google Scholar] [CrossRef]
  21. Whitton, B.A.; Potts, M. Introduction to the Cyanobacteria. In Ecology of Cyanobacteria II: Their Diversity in Space and Time; Whitton, B.A., Ed.; Springer: Dordrecht, Netherlands, 2012; pp. 1–13. [Google Scholar] [CrossRef]
  22. Pachmayr, F. Vorkommen und Bestimmung von Schwefelverbindungen in Mineralwasser. Ph.D. Thesis, University München, München, Germany, 1960. [Google Scholar]
  23. Cline, J.D. Spectrophotometric determination of hydrogen sulfide in natural waters 1. Limnol. Oceanogr. 1969, 14, 454–458. [Google Scholar] [CrossRef]
  24. Slawyk, G.; MacIsaac, J.J. Comparison of two automated ammonium methods in a region of coastal upwelling. Deep Sea Res. 1972, 19, 521–524. [Google Scholar] [CrossRef]
  25. Beutler, M.; Wiltshire, K.H.; Meyer, B.; Moldaenke, C.; Lüring, M.; Meyerhöfer, U.-P.; Hansen, H.D. A fluorometric method for the differentiation of algal populations in vivo and in situ. Photosynth. Res. 2002, 72, 39–53. [Google Scholar] [CrossRef]
  26. Leboulanger, C.; Bouvy, M.; Carré, C.; Cecchi, P.; Amalric, L.; Bouchez, A.; Pagano, M.; Sarazin, G. Comparison of the effects of two herbicides and an insecticide on tropical freshwater plankton in microcosms. Arch. Environ. Contam. Toxicol. 2011, 61, 599–613. [Google Scholar] [CrossRef] [PubMed]
  27. Komárek, J.; Anagnostidis, K. Cyanoprokaryota 2. Teil/Part 2: Oscillatoriales Süßwasserflora von Mitteleuropa. In Freshwater Flora of Central Europe; Publisher Akademischer Verlag: Heidelberg, Germany, 2005; p. 772. [Google Scholar]
  28. Reul, A.; Muñoz, M.; Bautista, B.; Neale, P.J.; Sobrino, C.; Mercado, J.M.; Segovia, M.; Salles, S.; Kulk, G.; León, P.; et al. Effect of CO2, nutrients and light on coastal plankton. III. Trophic cascade, size structure and composition. Aquat. Biol. 2014, 22, 59–76. [Google Scholar] [CrossRef] [Green Version]
  29. Metorological Station of Estepona. Available online: http://www.juntadeandalucia.es/agriculturaypesca/ifapa/ria/servlet/FrontController?action=Static&url=coordenadas.jsp&c_provincia=29&c_estacion=4 (accessed on 15 June 2017).
  30. Köppen, W. Versuch einer Klassifikation der Klimate, vorzugsweise nach ihren Beziehungen zur Pflanzenwelt. Geogr. Zeitschr. 1900, 6, 593–611. [Google Scholar]
  31. Kottek, M.; Grieser, J.; Beck, C.; Rudolf, B.; Rube, F. World Map of the Köppen-Geiger climate classification updated. Meteorol. Z. 2006, 15, 259–263. [Google Scholar] [CrossRef]
  32. Hastie, T.J.; Tibshirani, R. Generalized Additive Models. Stat. Sci. 1986, 1, 297–310. [Google Scholar] [CrossRef]
  33. Sivaraja, M.; Hunziker, D.; Dismukes, G.C. The reaction of H2S with the photosynthetic water-oxidizing complex and its lack of reaction with the primary electron acceptor in spinach. Biochim. Biophys. Acta 1988, 936, 228–235. [Google Scholar] [CrossRef]
Figure 1. (a) Iberian Peninsula, (b) Municipality of Casares, (c) Location of Casares and La Hedionda spa, (d) La Hedionda spa with a roofed part on the left and the outflow in the open air on the right with the sampling point (white dot).
Water 12 00883 g001
Figure 2. (a) Ten-day running mean of solar radiation and air temperature. (b) Rainfall at the meteorological sampling station in Estepona; sulfide concentration and cyanobacteria Chl a concentration in La Hedionda water measured at each sampling site. (c) Nitrate, ammonia, phosphate concentrations and N/P ((NO3 + NH4+)/PO4−3) ratio measured in La Hedionda water at each sampling.
Water 12 00883 g002
Figure 3. (a) Annual cycle of total chlorophyll a (Chl a) concentration and (b) relative contribution of the main phytoplanktonic groups (cyanobacteria, green algae, diatoms and dinoflagellates, and cryptomonads), derived from fluoroprobe measurements (wide bars correspond to monthly sampling and narrow bars to weekly sampling).
Water 12 00883 g003
Figure 4. Biovolume (Biov.) and abundance (Abund.) of aggregates of Oscillatoria sp. versus sulfide concentration.
Water 12 00883 g004
Figure 5. Cyanobacteria (Oscillatoria sp.) concentration versus sulfide concentration plot. Phosphate concentration is shown using a color scale with filled symbols. Open circles indicate weekly samples where no nutrient measurements were carried out.
Water 12 00883 g005
Figure 6. Prediction of cyanobacteria concentration as a function of sulfide concentration at La Hedionda spa as derived from the general additive model (GAM).
Water 12 00883 g006
Table 1. Differences among cyanobacteria, diatoms, dinoflagellates and green algae concentration (Chl a µg L−1) during summer and winter (Mann–Whitney Rank Sum Test, median). The relative contribution of Oscillatoria sp. to total Chl a concentration, and the comparison between winter and summer sulfide concentration (t-student, mean ± standard deviation), is shown as well. Numbers in brackets indicate numbers of replicates, * p < 0.005, ** p < 0.001, ns indicates non-significance.
SummerWinterDifferences
Cyanobacteria concentration (Oscillatoria sp., Chl a µg L−1)1.6 (13)0.4 (9)**
Relative contribution of cyanobacteria (Oscillatoria sp.) to total Chl a concentration85% (13)67% (9)*
Sulfide concentration (µM)147 ± 39 (13)13 ± 27 (9)**
Diatoms and dinoflagellates concentration(Chl a µg L−1)0.02 (13)0.02 (9)ns
Green algae concentration(Chl a µg L−1)0.2 (13)0.1 (9)ns
Cryptomonads concentration(Chl a µg L−1)0.05 (13)0.03 (9)ns

