Article

Partition and Fate of Phthalate Acid Esters (PAEs) in a Full-Scale Horizontal Subsurface Flow Constructed Wetland Treating Polluted River Water

1
College of Water Sciences, Beijing Normal University, Beijing 100875, China
2
College of Water Resources and Civil Engineering, China Agricultural University, Beijing 100083, China
3
School of Environment, Tsinghua University, Beijing 100084, China
*
Authors to whom correspondence should be addressed.
Water 2020, 12(3), 865; https://doi.org/10.3390/w12030865
Submission received: 18 February 2020 / Revised: 15 March 2020 / Accepted: 16 March 2020 / Published: 19 March 2020
(This article belongs to the Section Water Quality and Contamination)

Abstract

:
When used as highly produced chemicals and widely used plasticizers, Phthalate acid esters (PAEs) have potential risks to human life and the environment. In this study, to assess the distribution and fate of PAEs, specifically inside a full-scale horizontal subsurface flow constructed wetland, four PAEs including dimethyl phthalate (DMP), diethyl phthalate (DEP), di-n-butyl phthalate (DBP), and bis (2-ethylhexyl) phthalate (DEHP) were investigated. In effluent, PAEs concentration decreased 19.32% (DMP), 19.18% (DEP), 19.40% (DBP), and 48.56% (DEHP), respectively. Within the wetland, PAEs partitioned in water (0.18–1.12 μg/L, 35.38–64.92%), soil (0.44–5.08 μg/g, 1.02–31.33%), plant (0.68–48.6 μg/g, 0.85–36.54%), air and biological transformation (2.72–33.21%). The results indicated that soil and plant adsorption contributed to the majority of PAE removal, digesting DMP (19.32%), DEP (19.18%), DBP (19.40%), and DEHP (48.56%) in constructed wetlands. Moreover, the adsorption was affected by both octanol/water partition coefficient (Kow) and transpiration stream concentration factors (TSCF). This work, for the first time, revealed the partition and fate of PAEs in constructed wetlands to the best of our knowledge.

1. Introduction

Phthalate acid esters (PAEs) and phthalates are synthetic compounds used mainly as plasticizers to improve the flexibility, durability, and transparency of plastics [1]. As additives in numerous products, including coatings, coverings, insecticides, flooring, drainpipes, packaging, cosmetics, adhesives, and paints [2], they may migrate into the environment via various pathways including microbial transformation, microsomal metabolism, and sunlight exposure [3]. With strong chemical bond to the matrices of polymers, PAEs are persistent and found in almost all the environments, such as rivers [4], sediments [5], soils [6], sewage [7], air [8], biota [9], and even in human tissue [10]. Many pieces of evidence show the carcinogenic, teratogenic, and estrogenic effects of PAEs [11]. Their potential risk to human and animal health has attracted increasing attention around the world. Accordingly, in 1977, six PAEs were listed as priority pollutants by the United States Environmental Protection Agency (US EPA) [12], including dimethyl phthalate (DMP), diethyl phthalate (DEP), di-n-butyl phthalate (DBP), bis (2-ethylhexyl) phthalate (DEHP), di-n-octyl phthalate, and butyl benzyl phthalate. DEHP was further classified as one of the 33 hazardous substances to be controlled in surface water by the European Community in 2000 [13].
As receptors of PAEs, many rivers and other aquatic ecosystems worldwide have been polluted by PAEs, leading to the importance of finding appropriate treatments to solve the problem. Many techniques have been developed to remove PAEs from water, including activated carbon adsorption [14], chemical advanced-oxidation processes [15], and conventional wastewater treatment plants [16]. Though these treatments are effective in reducing PAEs levels, they suffered from the relatively low cost-effectiveness and treatment capacities for low-level PAEs contamination in the large volumes of water, such as rivers and lakes. Constructed wetlands, therefore, draw increasing attention as a cost-effective bio-filtration system [17]. As an efficient way to mitigate pollutants and improve the water quality of rivers and lakes, constructed wetlands have been applied to remove conventional organic pollutants with satisfactory performance [18]. With more organic micropollutants found in municipal wastewater and remaining stable through the treatment plant, such as pharmaceutical and personal care products, herbicides, estrogens, and androgens [19], there were increasing interests in applying constructed wetlands as an advanced technique to remove their amounts further [20]. More importantly, the mechanisms of such organic micropollutants were still not clear and there was a lack of studies on the micropollutants partition and fate in constructed wetlands.
The partition and fate of PAEs were determined by many factors across multimedia phases [21]. Though some research [22] has investigated PAE removal in wetlands, their partition and fate are not well discussed in these cases. Some multimedia fate models have been developed for hydrophobic organic matters [23], such as polycyclic aromatic hydrocarbons (PAHs) [24], polybrominated diphenyl ethers (PBDEs) [25], and Benzo[a]pyrene [26]. Some environmental factors are found with critical roles in determining the partition of organic matters across multimedia [27], such as octanol/water partition coefficient (Kow) and transpiration stream concentration factor (TSCF) [28], but only limited research addresses PAEs [29].
In this study, we chose four PAEs (DMP, DEP, DBP, and DEHP) from the US EPA priority list and investigated their total removal efficiency in a full-scale constructed wetland with the horizontal subsurface flow. Their unique partitions and fates in the wetland were further analyzed and discussed within the multimedia system (water, soils, plants, and air). By detecting the concentration and evaluating the enrichment coefficient (the ratio of pollution concentration in plants to soils) [30] in Phragmites australis tissues, the fates of different PAEs behaved differently, and the results helped deepen our understanding on the improvement of constructed wetlands in organic micropollutant removal.

2. Materials and Methods
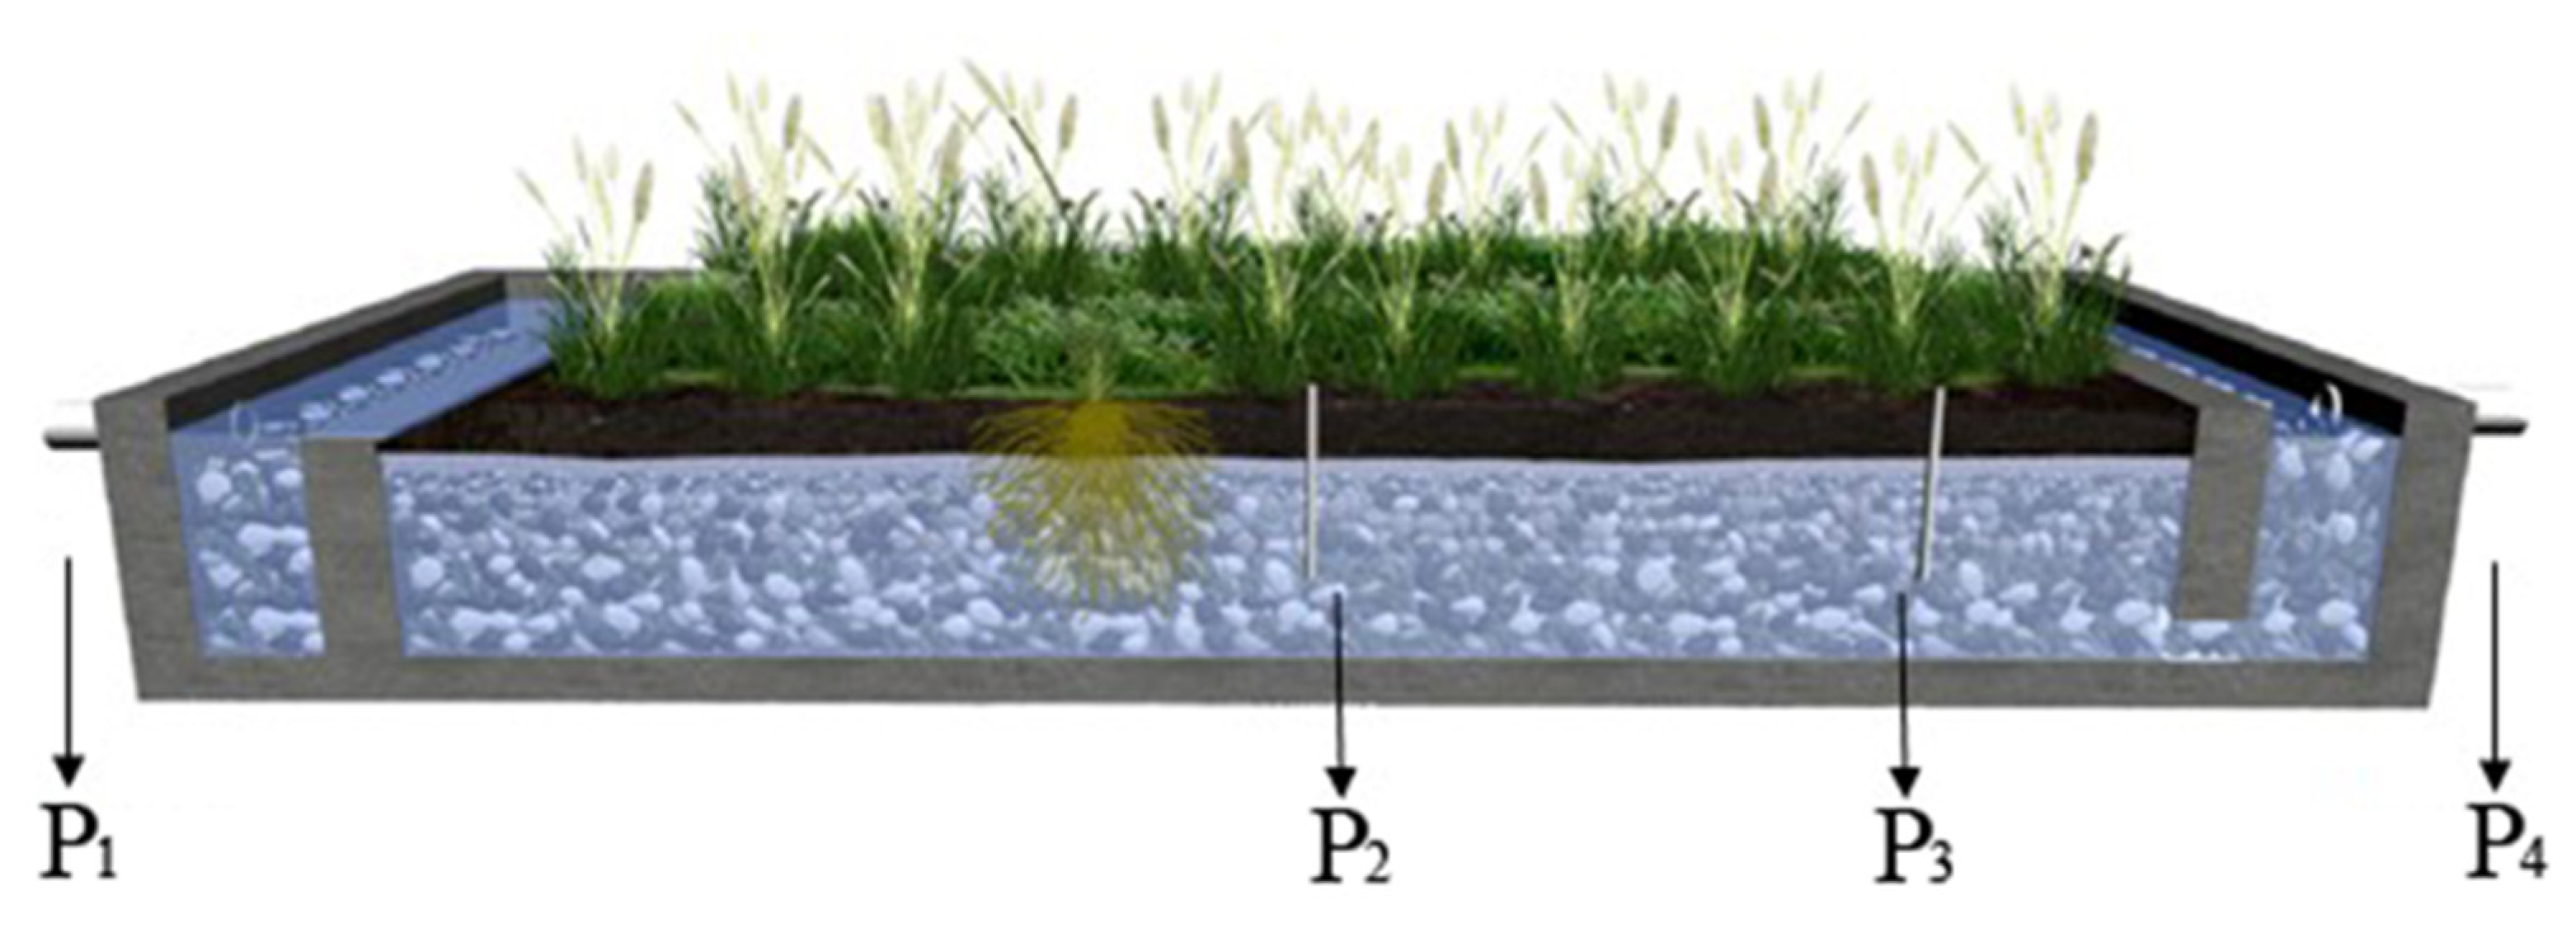
2.1. Field Site

This field study was performed in a full-scale constructed wetland with horizontal subsurface flow located in Tianjin, China (39°08’ N, 117°12’ E). The annual temperature averages 14 °C, and the monthly means range from −2 °C in January to 28 °C in July. This wetland consisted of 55 chambers in parallel, which is 31 m in length in the direction of the flow, 20 m in width, and 0.8 m in depth. The wetland was planted with Phragmites australis, as shown in Figure 1. Constructed and operated since 2007 to treat polluted river water, the daily treatment capacity of the studied constructed wetland was 170 m3 with 24 h hydrological retention time (HRT).

2.2. Sampling

All the water, soil, and plant samples were collected four times from July to September 2014. For influent (P1, Figure 1) and effluent (P4, Figure 1) water sampling, the water samples were collected using a stainless-steel bucket. For water sampling inside the wetland (P2 and P3, Figure 1), the 70-cm-long stainless-steel tubes (6 mm in diameter with several small holes at the bottom) were introduced and fixed into the ground, and the water samples were sucked from the tubes via syringe. Soil sample collection was carried out at the same sites as water samples, using a shovel to take the whole top layer soils (0–20 cm). At each sampling point, 10 Phragmites australis individuals (near the water sampling sites) were collected and divided into leaves, stems, and roots before analysis. Moreover, the sample sites as listed in Figure 1.
All the samples were transferred to the laboratory within six hours. The water samples were stored in 1 L amber glass bottles with polytetrafluoroethylene caps at 4 °C. Soil samples were stored as bulk samples in amber glass jars with glass caps at −20 °C. The plant tissues were wrapped in aluminized paper and kept in sealed plastic bags at 4 °C. All samples were extracted within seven days of collection.

2.3. Sample Pretreatment

Water samples were pretreated according to US EPA methods 3535 and 8061a, with slight modifications, according to Zheng’s research [31]. The 1000 mL water samples were filtered through the 0.45 μm millipore membrane (Millipore, Bedford, MA, USA) and then pre-concentrated by solid-phase extraction (recovery rates reached 93.8%, and pre-concentration 2500 times). Each cartridge (C18, 500 mg, 6 mL; Supelco, Bellefonte, PA, USA) was activated by adding 2 mL methylene chloride, 1 mL acetone, 2 mL methanol, and 2 mL purified water. After sample loading (at 4 mL/min), the cartridge was air-dried for 10 min. Then, 8 mL of methanol was passed through the cartridge at 1 mL/min. The effluent was evaporated to dryness under a gentle nitrogen stream. The residue was then re-dissolved with 400 μL n-hexane [31].
Plant samples were oven-dried at 60 °C for 48 h and then ground using a glass mortar and sieved to pass through a 1 mm stainless-steel sieve. The 1000 g plant sample was added into a 100 mL Erlenmeyer flask with a ground-glass stopper, with additives of 25 mL methanol and 3 g anhydrous sodium sulfate. After stored overnight, the flask was shaken at 60 rpm for 4 h. The extract was filtered through a 0.45 μm membrane (Millipore, USA). The flasks and plant tissues were rinsed three times with 50 mL of methanol. The combined filtrate was then evaporated to dryness using a rotary evaporator. The residue was re-dissolved with 400 μL n-hexane (recovery rates reached 91.4% and pre-concentration 62.5 times) [31].

2.4. PAEs Analysis

PAEs analyses were performed using a 7890-5975 GC-MS (Agilent, USA), operated in the electron-impact and selective-ion-monitoring modes. The column was an HP-5 ms capillary column (30 m × 250 μm i.d.; 0.25 μm film thickness; Agilent, USA). The temperatures of the injector and ion source were maintained at 280 and 250 °C, respectively. The carrier gas was helium (1 mL/min). The GC oven temperature was set at 60 °C for 1 min, increased from 60 °C to 220 °C at 20 °C/min, held constant at 220 °C for 1 min, increased from 220 °C to 280 °C at 5 °C/min, and then held for 2 min. We injected 1.0 μL of the prepared sample into the GC-MS in splitless mode with an interface temperature of 280 °C [31].

2.5. Data Analysis

PAEs removal efficiencies were calculated with the following Equation (1).
RPAEs = (CICE)/CE
where: RPAEs was removal rates of PAEs and CI and CE represented influent and effluent concentration, respectively.
The soil-water partition coefficient (Kd, L/g) was the ratio of PAEs concentrations in soils to those in water, calculating with the following Equation (2).
Kd = Cw/Cs
where Cw represented PAEs concentration in water and Cs represented PAE concentration in soils.
The root-water concentration factor (RWCF, Equation (3)) and root-soil concentration factor (RSCF, Equation (4)) were calculated as the PAEs level in root to that in water and soil, respectively. The translocation factor (TF, Equation (5)) was calculated as the ratio of PAEs level in leaves to that in roots [6].
RWCF = Cr/Cw
RSCF = Cr/Cs
TF = Cl/Cr
where Cr and Cl represented PAEs concentration in roots and leaves of Phragmites australis, respectively. Cw and Cs represented PAEs concentration in water and soils, respectively.
All reported data were the means of three replicates. All the experimental results were expressed on the dry weight of soil and plant tissues. Data that followed a normal distribution was subjected to analysis with one-way ANOVA and least significant differences for comparison of treatment means (p < 0.05). All data were processed using the SPSS software (SPSS Inc., Chicago, IL, USA, version 14.0).

3. Results and Discussion

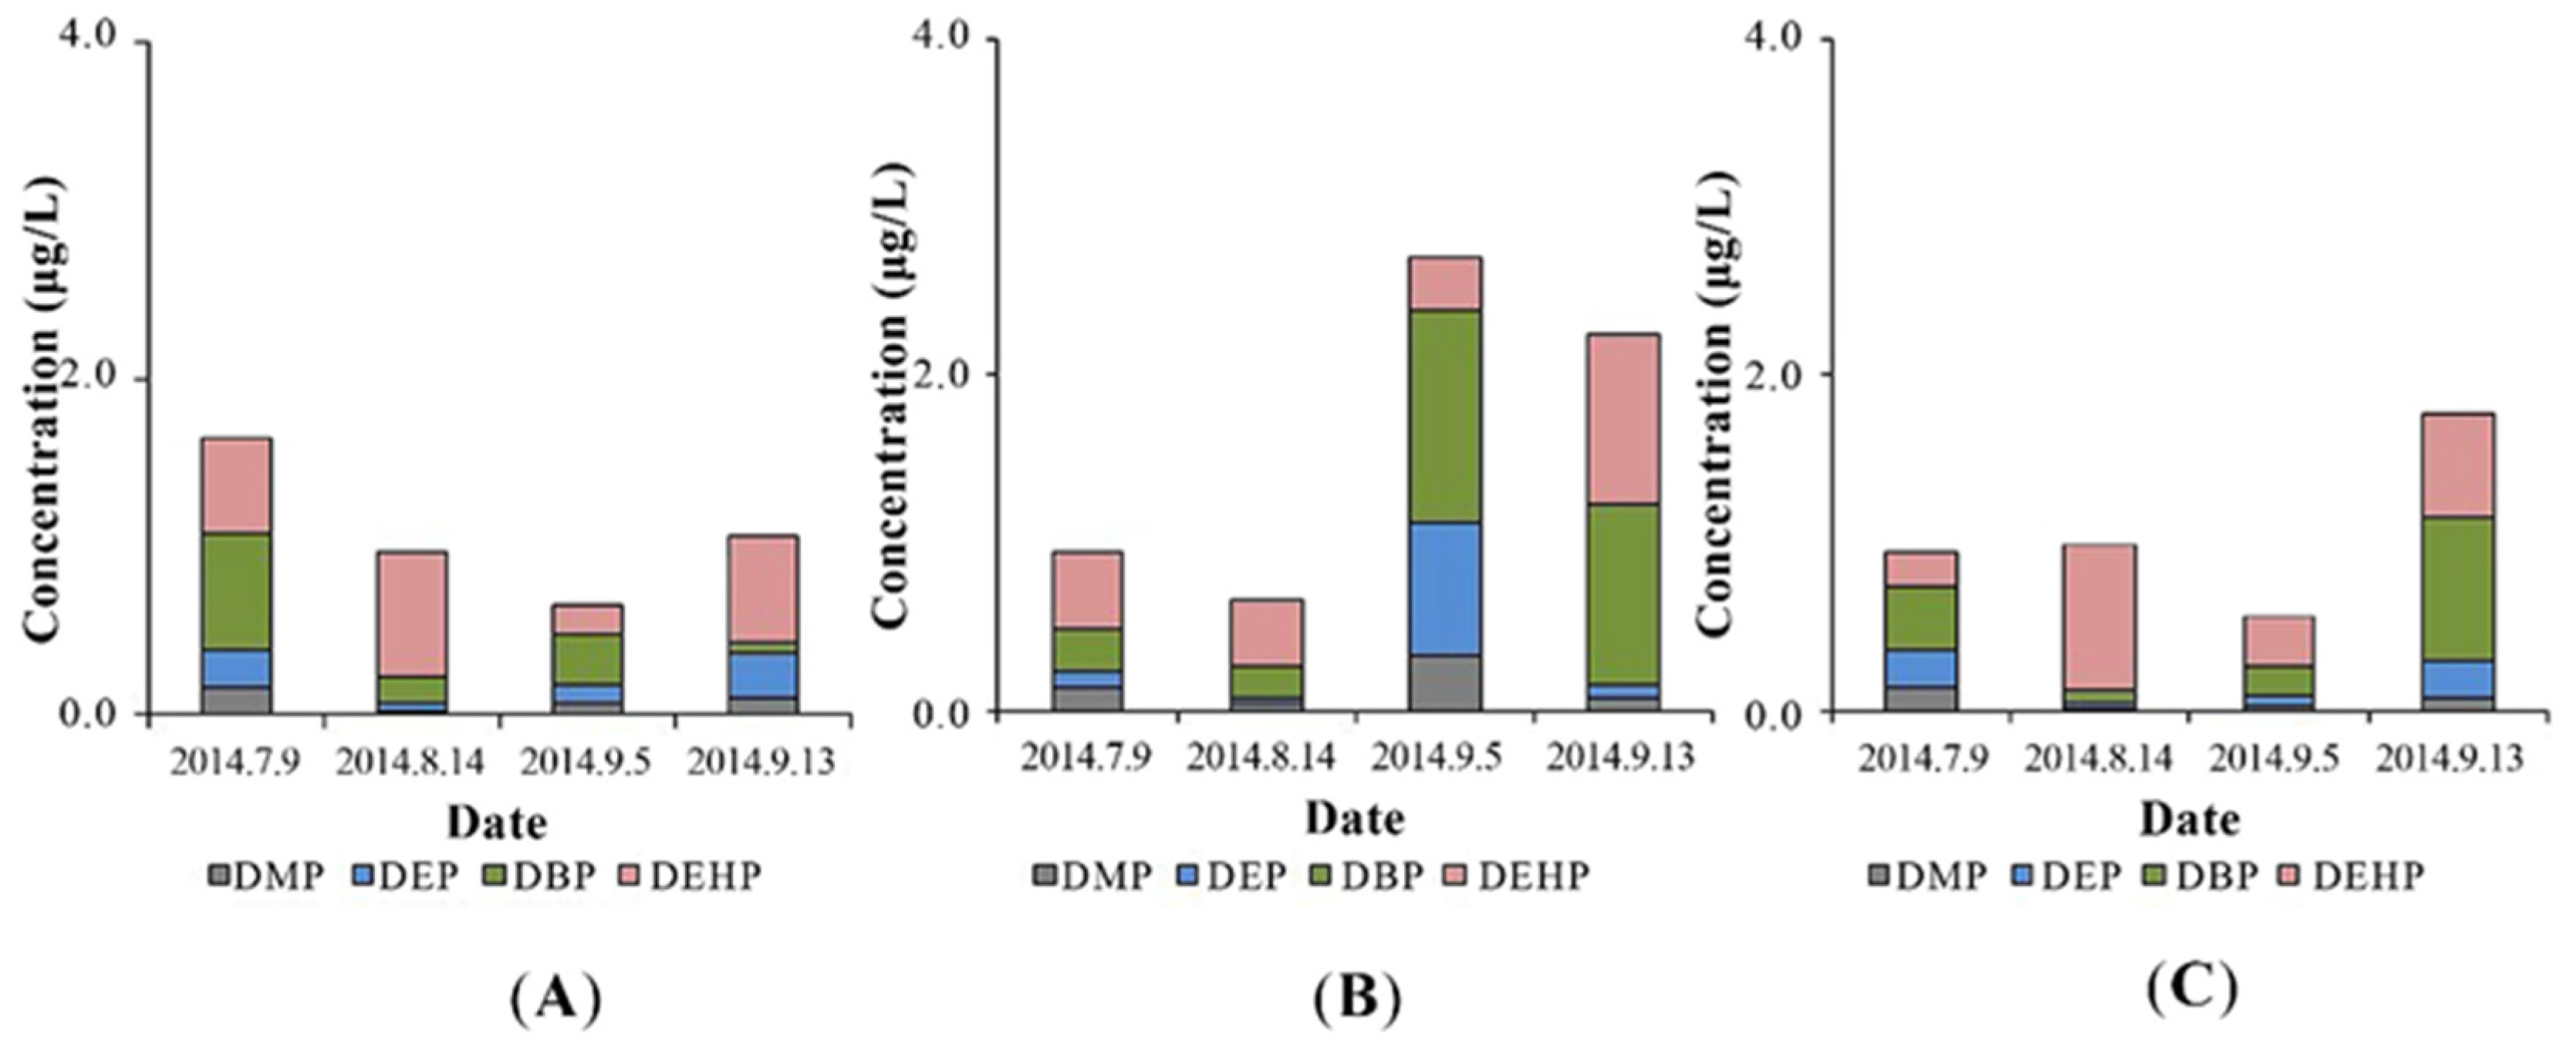
3.1. PAEs Removal in Constructed Wetland

Figure 2A illustrated the change of PAEs concentrations in the influent. DBP was the most abundant PAEs and its concentration ranged from 0.08 μg/L to 0.70 μg/L, followed by DEHP (0.16 μg/L to 0.74 μg/L), DEP (0.03 μg/L to 0.26 μg/L), and DMP (0.03 μg/L to 0.16 μg/L). Compared to the effluents of most wastewater treatment plants, the PAEs levels in the present study were relatively low. In Finland, the concentration of DEHP in wastewater effluent was 98 μg/L to 122 μg/L, but less than 5 μg/L for other PAEs [32]. The DEHP in Marne Aval region was also the dominant PAEs in the pretreated water, and the concentrations of the four targeted PAEs were 22.46 μg/L (DEHP), 7.71 μg/L (DEP), 1.10 μg/L (DBP), and 0.82 μg/L (DMP) [13]. In the UK, the concentration of DEP (25 μg/L) was higher than those of DEHP (23.6 μg/L), DBP (2.54 μg/L) and DMP (0.26 μg/L) in the raw sewage [33].
The PAE moisture level inside the constructed wetland was surprisingly higher than those in the influent, as illustrated in Figure 2B. This may be due to the desorption of PAEs in soil and then combining with colloids.
In the effluent, different PAEs removal efficiencies were observed in the constructed wetland (Figure 2A,C). During the sampling period, the DMP, DEP, DBP, and DEHP were averagely removed 19.32%, 19.18%, 19.40%, and 48.56%, respectively. Comparing to the removal efficiency of wastewater treatment plants around the world, the constructed wetland in this study had a relatively lower PAEs removal efficiency. In French, the reduction of PAEs achieved 90%, 90%, 86%, and 78% for DMP, DEP, DBP and DEHP, table, respectively [13]. In Finland, the DEHP removal efficiency averaged 94% [32] and in Australia, the elimination rates of DEP and DBP were 98% and 94%, respectively [34]. There may be two reasons for this disparity in removal rates. Firstly, it is due to the difference processes in the two treatment systems. In wastewater treatment plants in France, Finland, and Australia, PAEs were functioned by pretreatment, suspended sediment, biological treatment, nitrification, and final effluent [13,32,34]. In our study, the constructed wetland showed a certain ability to remove PAEs but was less effective than the traditional wastewater treatment plants, in which the operating conditions were precisely controlled to achieve the highest removal efficiency. Secondly, PAEs concentration in the influents varied. The original concentration of DMP, DEP, DBP, and DEHP in French treatment plants were 0.82 ± 1.13 ug/L, 7.71 ± 5.21 ug/L, 1.10 ± 0.37 ug/L, 22.46 ± 13.22 ug/L, respectively [13]. In Finland, the influent concentration of DEHP was 98–122 ug/L [32] and of DEP and DBP was 1.08 ug/L and 0.20 ug/L in Australia [34]. The unsatisfied removal rates in this study were possibly attributed to their low levels in the influent and poor uptake by plants [22].
Comparing to other constructed wetlands, the PAEs removal efficiencies in the present study were also lower. Nearly 100% DBP elimination ratio was found in Liang’s work, from 14.85 mg/L to 0.7 μg/L, after treated by two constructed wetlands systems with vertical and reverse-vertical flows [35]. Similarly, higher DBP removal was also found in Zhao’s study [36], where the average DBP concentration declined from 9.84 mg/L in influent to 5.82 μg/L in effluent by an integrated vertical-flow constructed wetland. However, in these systems, the influent concentrations of PAEs were much higher than the normal PAEs contamination level in the natural aqueous system around the world. In Weihe River in China, the PAEs concentrations were found at low level (DEP, not detected (ND)-4.023 μg/L; DBP, ND-3.168 μg/L; DEHP, 0.079–8.341 μg/L) [37], as well as the concentrations in other rivers in China (DBP, DEP, and DEHP were 9–61 μg/L, ND-4 μg/L, and ND-32 μg/L, respectively) [38]. In some Korean rivers, DMP concentration was around 1.59 μg/L [4], and in French Seine Rivers, DBP (0.047–0.14 μg/L), DEP (ND-0.48 μg/L), and DEHP (0.107–0.636 μg/L) were found [39].
In this research, we got an order of removal by DMP < DEP < DBP < DEHP, which is in reverse order in Tang’s research, where the removal of PAEs in domestic sewage through horizontal subsurface flow constructed wetlands achieved 68–74% for DMP, 44–51% for DEP, 43–55% for DBP, and 21–34% for DEHP [22]. Previous research has shown that biodegradation contributed a larger part of removal efficiencies for DMP and DEP (75–99%) than for DEHP (only 1–44%) [33]. Moreover, studies suggest that the removal efficiency of PAEs in constructed wetlands is related to the length of the alkyl-side chains. In other words, PAEs with short ester hydrocarbon chains are more readily biodegraded and mineralized than those with long ester chains, some of which are considered recalcitrant [40,41]. The lower removals of DMP and DEP in this study may be due to the lower nutrients for microbiology in the influent (COD of 30–50 mg/L, NH+4-N of 2–3 mg/L, and TP of 3–5 mg/L) and resulted in a lower strength of biodegradation on DMP and DEP.

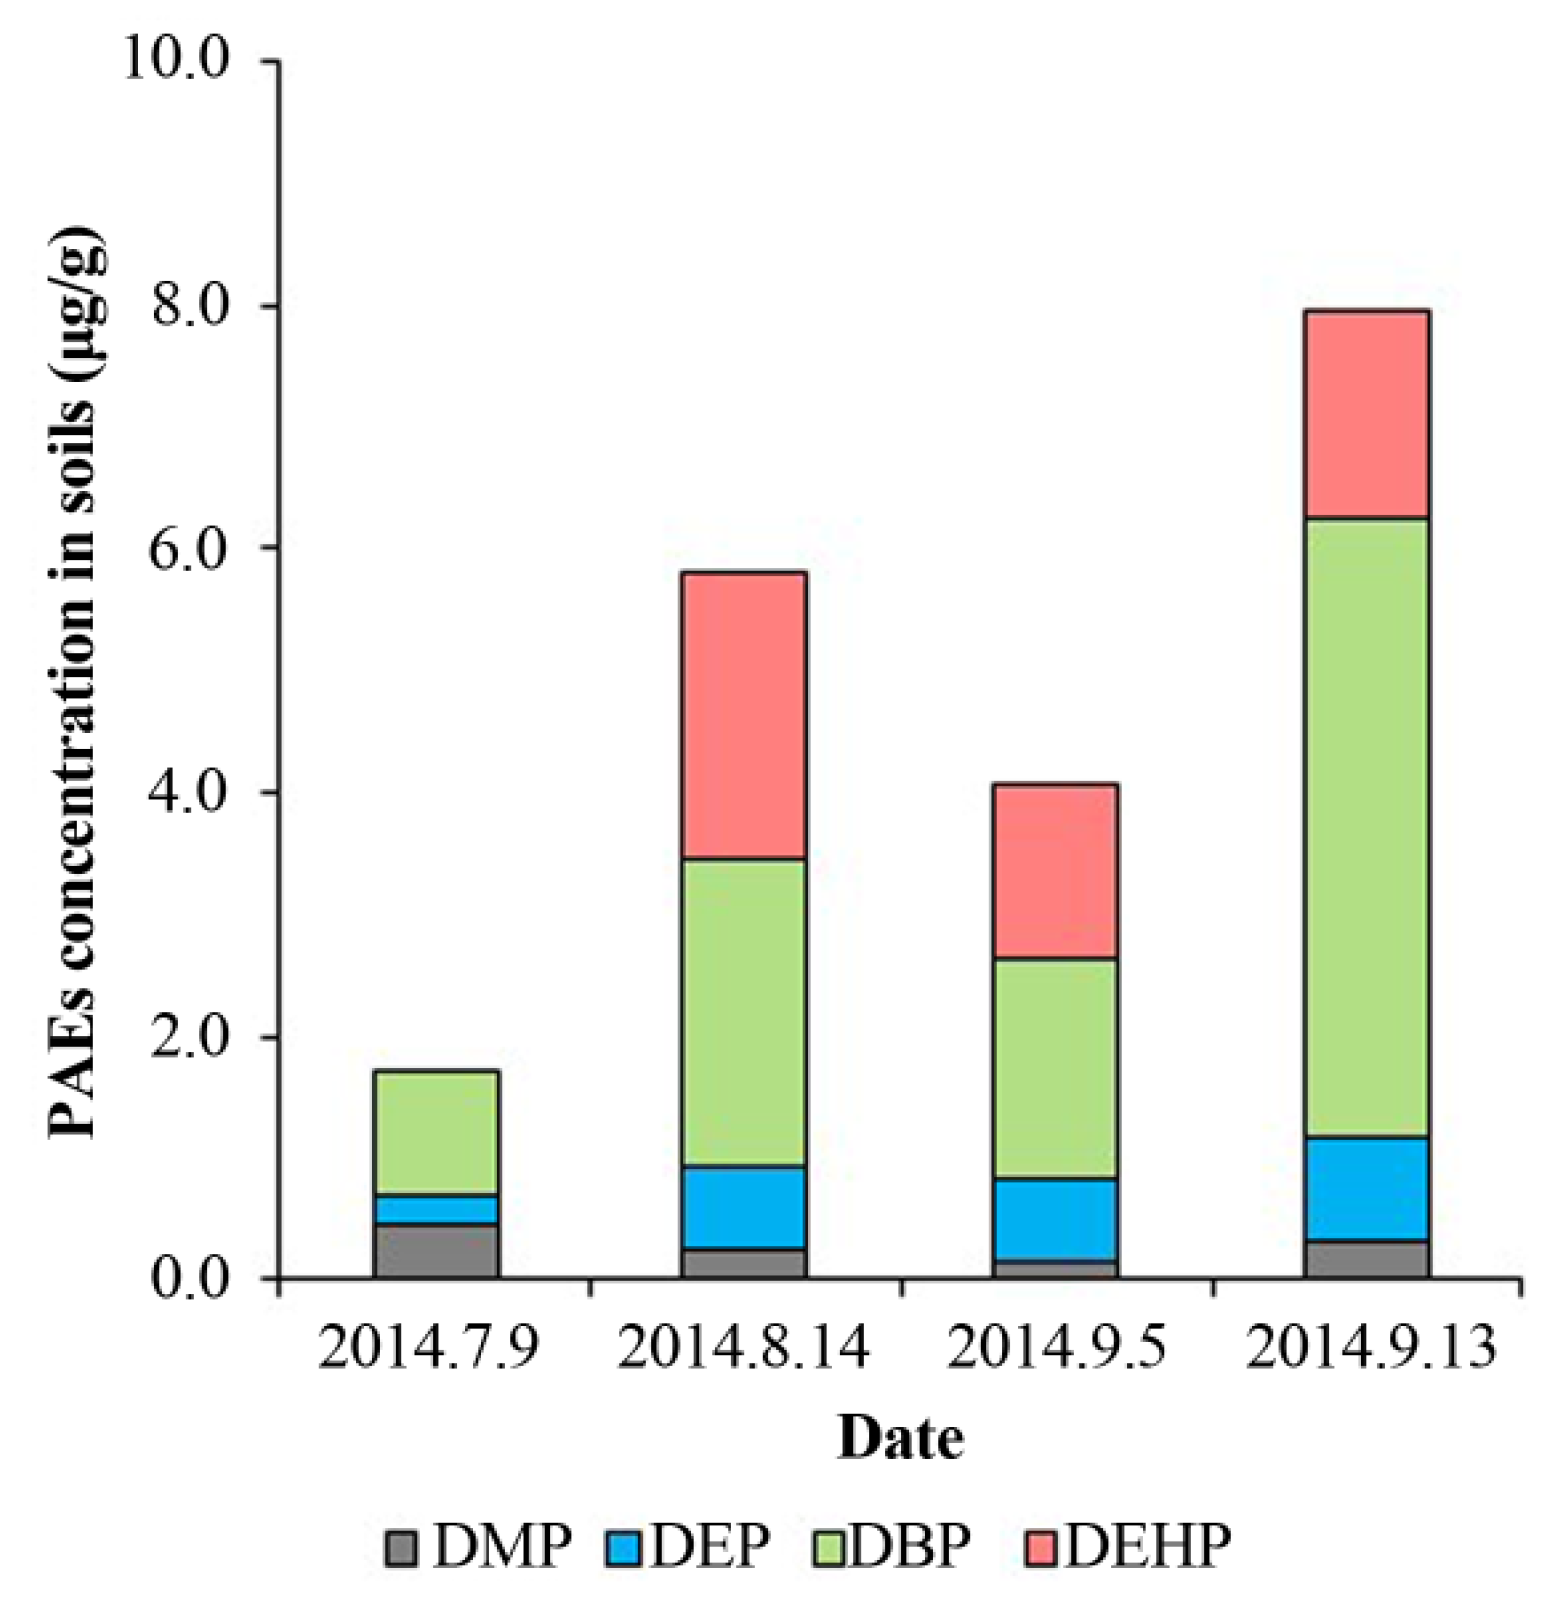
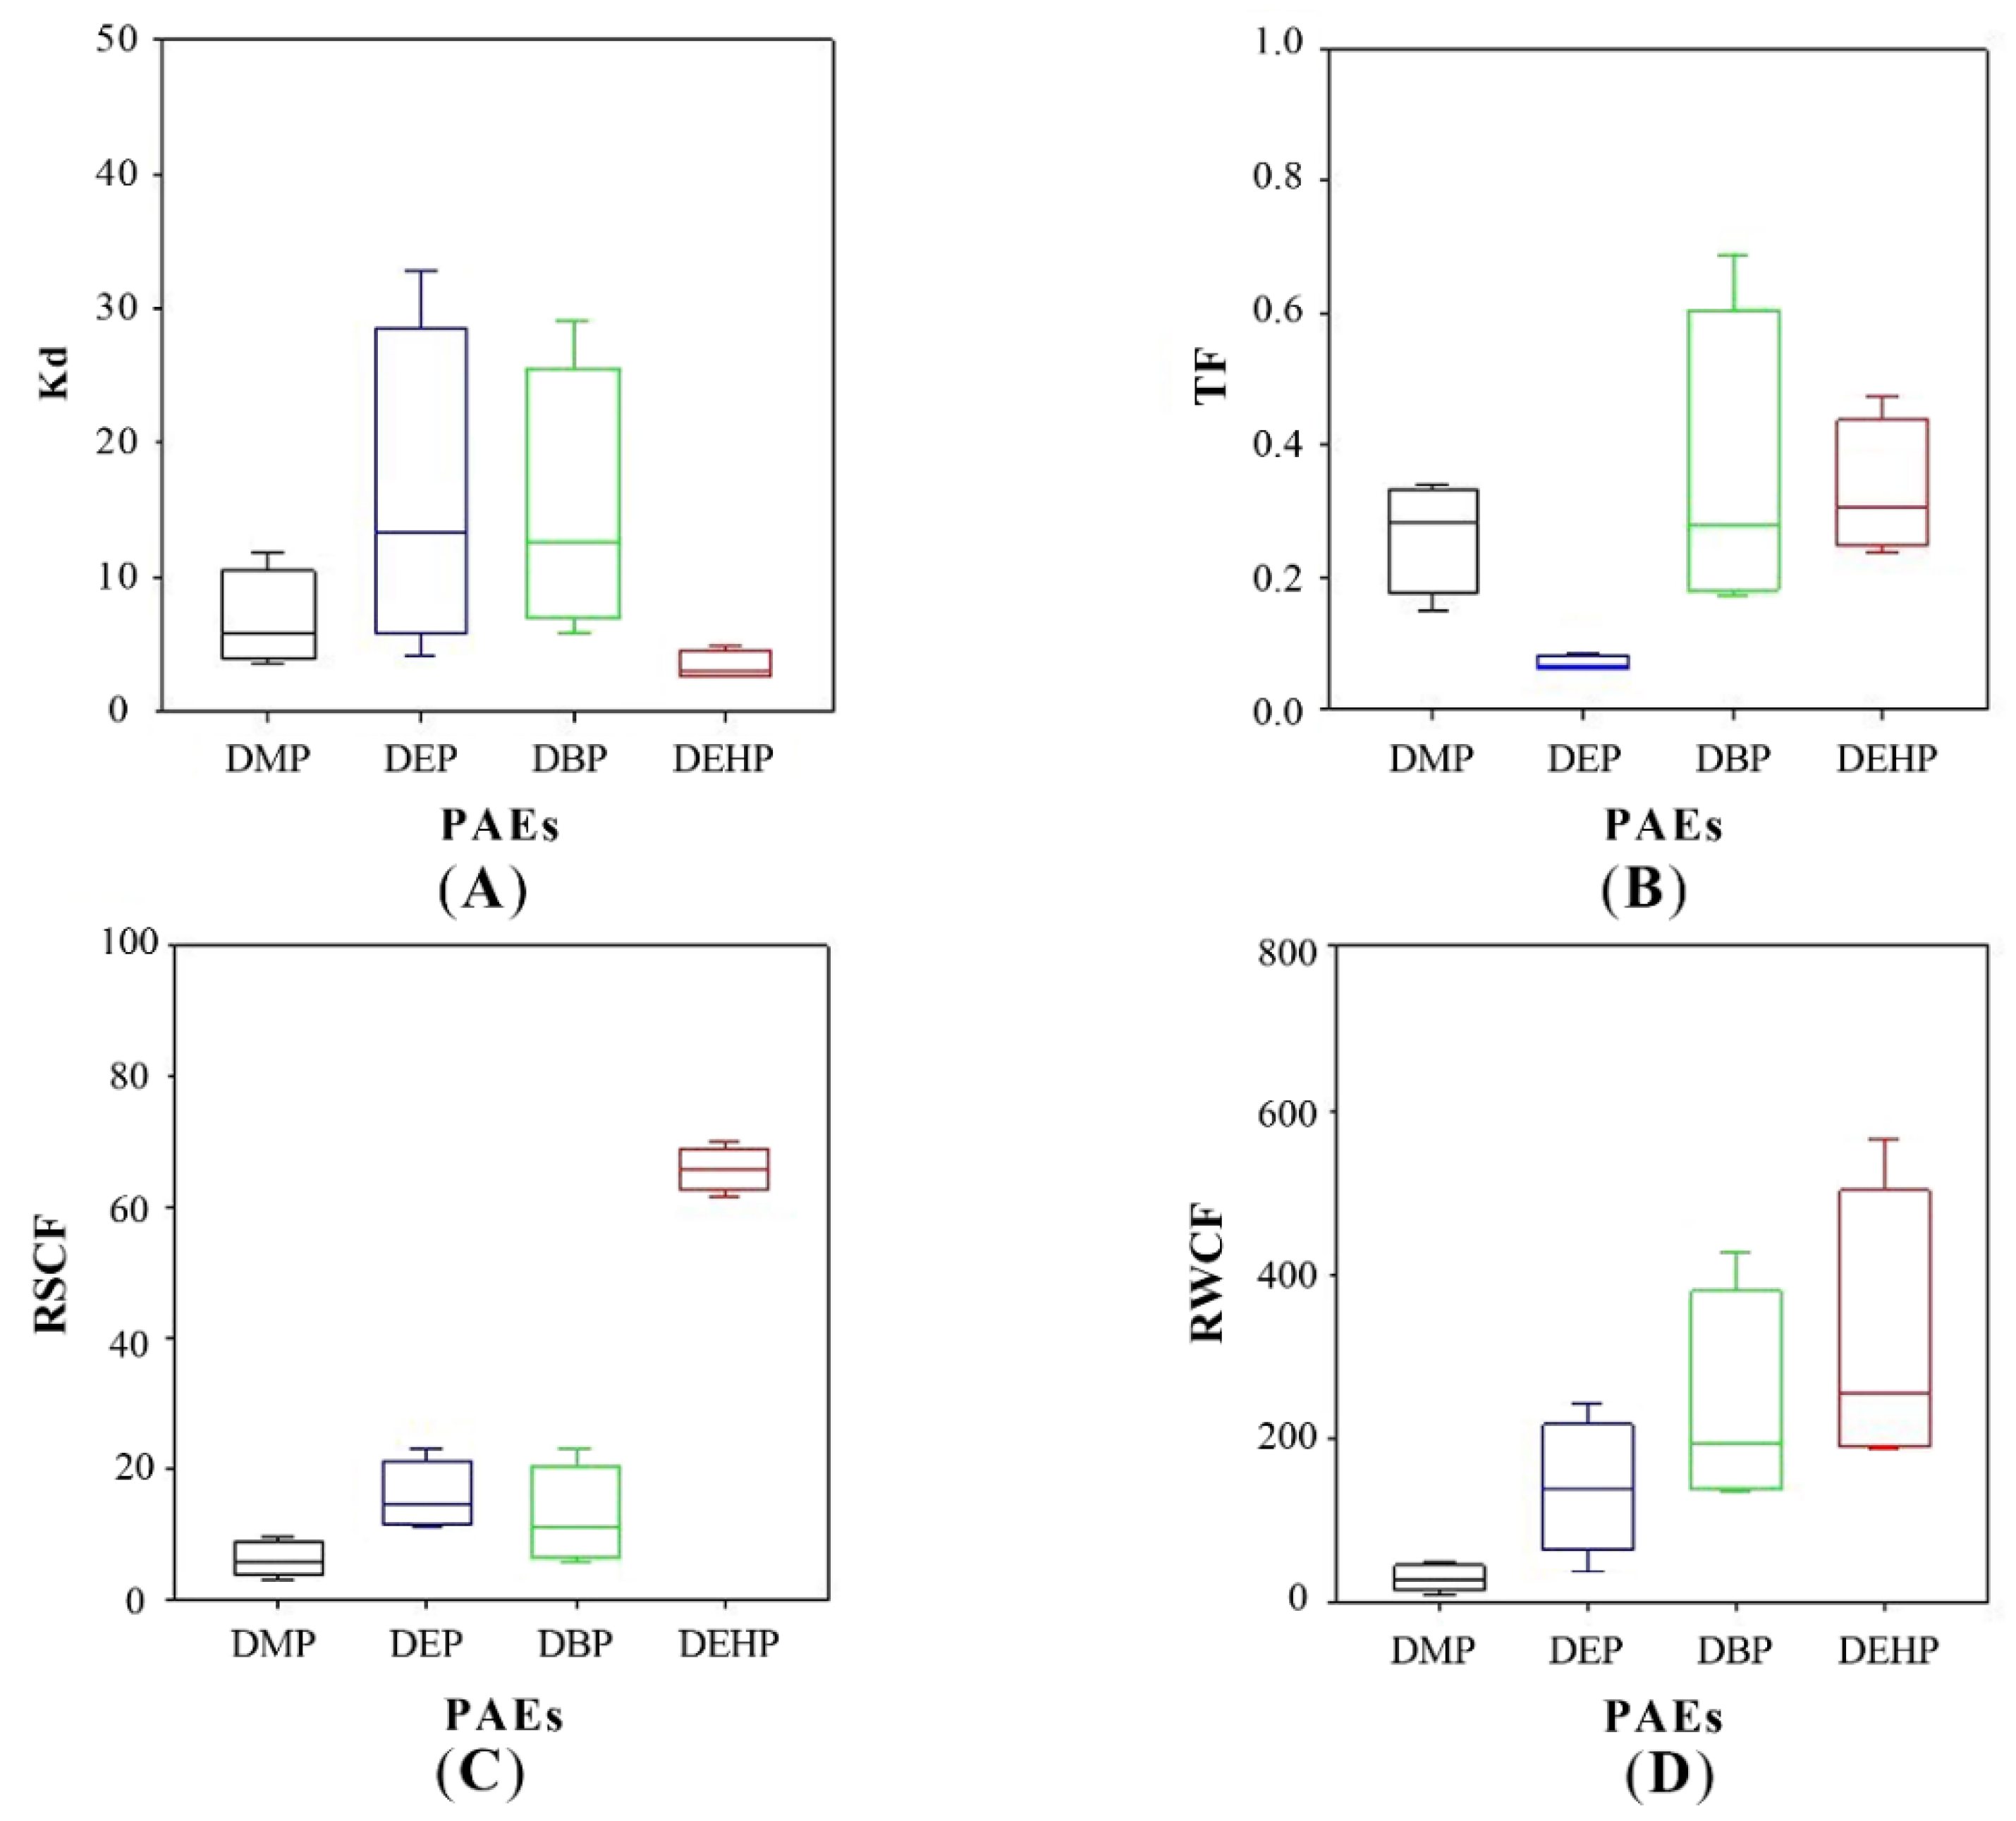
3.2. PAEs Absorption in Soils

Among the four targeted PAEs (Figure 3), soils had the highest contents of DBP, which ranged from 0.36 μg/g to 5.09 μg/g (mean concentration 2.16 ± 1.83 μg/g), followed by DEHP (mean concentration 1.82 ± 0.47 μg/g). Soil DMP and DEP remained at relatively low levels throughout the study period, with averages of 0.29 ± 0.12 and 0.53 ± 0.31 μg/g, respectively. During the two-month operation, a significant accumulation of DEHP, DBP, and DEP was found in soils (p < 0.001) without DMP (p > 0.05). Compared to other studies, the levels and profiles of PAEs in soils were similar in the present study. In Japan, the concentrations of DEHP in the sediments of Jinzu River and Oyabe River were 0.02 μg/g to 0.30 μg/g and 0.02 μg/g to 1.80 μg/g, respectively [42]. The similar PAEs concentrations were also found in some sediments in China, including of Kaohsiung Harbor (DEHP, 0.40 μg/g to 34.80 μg/g; DBP, ND to 1.31 μg/g; DMP and DEP, ND) [43], the Pearl River Delta (DEHP, 0.03 μg/g to 170.0 μg/g; DBP, 0.310 μg/g to 2.8 μg/g; DEP, 0.009 μg/g to 0.12 μg/g; DMP, 0.003 μg/g to 0.20 μg/g) [44], and urban lakes in Guangzhou (DEHP, 0.21 μg/g to 14.16 μg/g; DBP, 0.082 μg/g to 1.26 μg/g; DEP, 0.028 μg/g to 1.05 μg/g; DMP, 0.001 μg/g to 0.43 μg/g) [45].
In most of the cases, DBP and DEHP were observed as the major PAEs in soils, attributing to their high octanol/water partition coefficient (Kow), which represented the migration of hydrophobic organic matters (PAEs in this study) between soils and water [46]. The values of log Kow are 1.60, 2.42, 4.50, and 7.60 for DMP, DEP, DBP, and DEHP, respectively [47]. Here, the soil-water partition coefficients (Kd) were calculated and illustrated in Figure 4A. The partition of DMP, DEP, and DBP between soils and water fitted well with the trends of log Kow, and their increasing partition in soils was attributed to the increasing Kow. This is agreed with the previous research as it has reported that with log Kow increases, there is a greater tendency for organic substances to adsorb on soil [41]. Nevertheless, the Kd of DEHP was much lower than expected (>4) [41]. This lower Kd of DEHP may differ due to the high absorption of plants for DEHP. We can know that the DEHP concentrations of treatments with plant growth were significantly lower than those without plants [48].

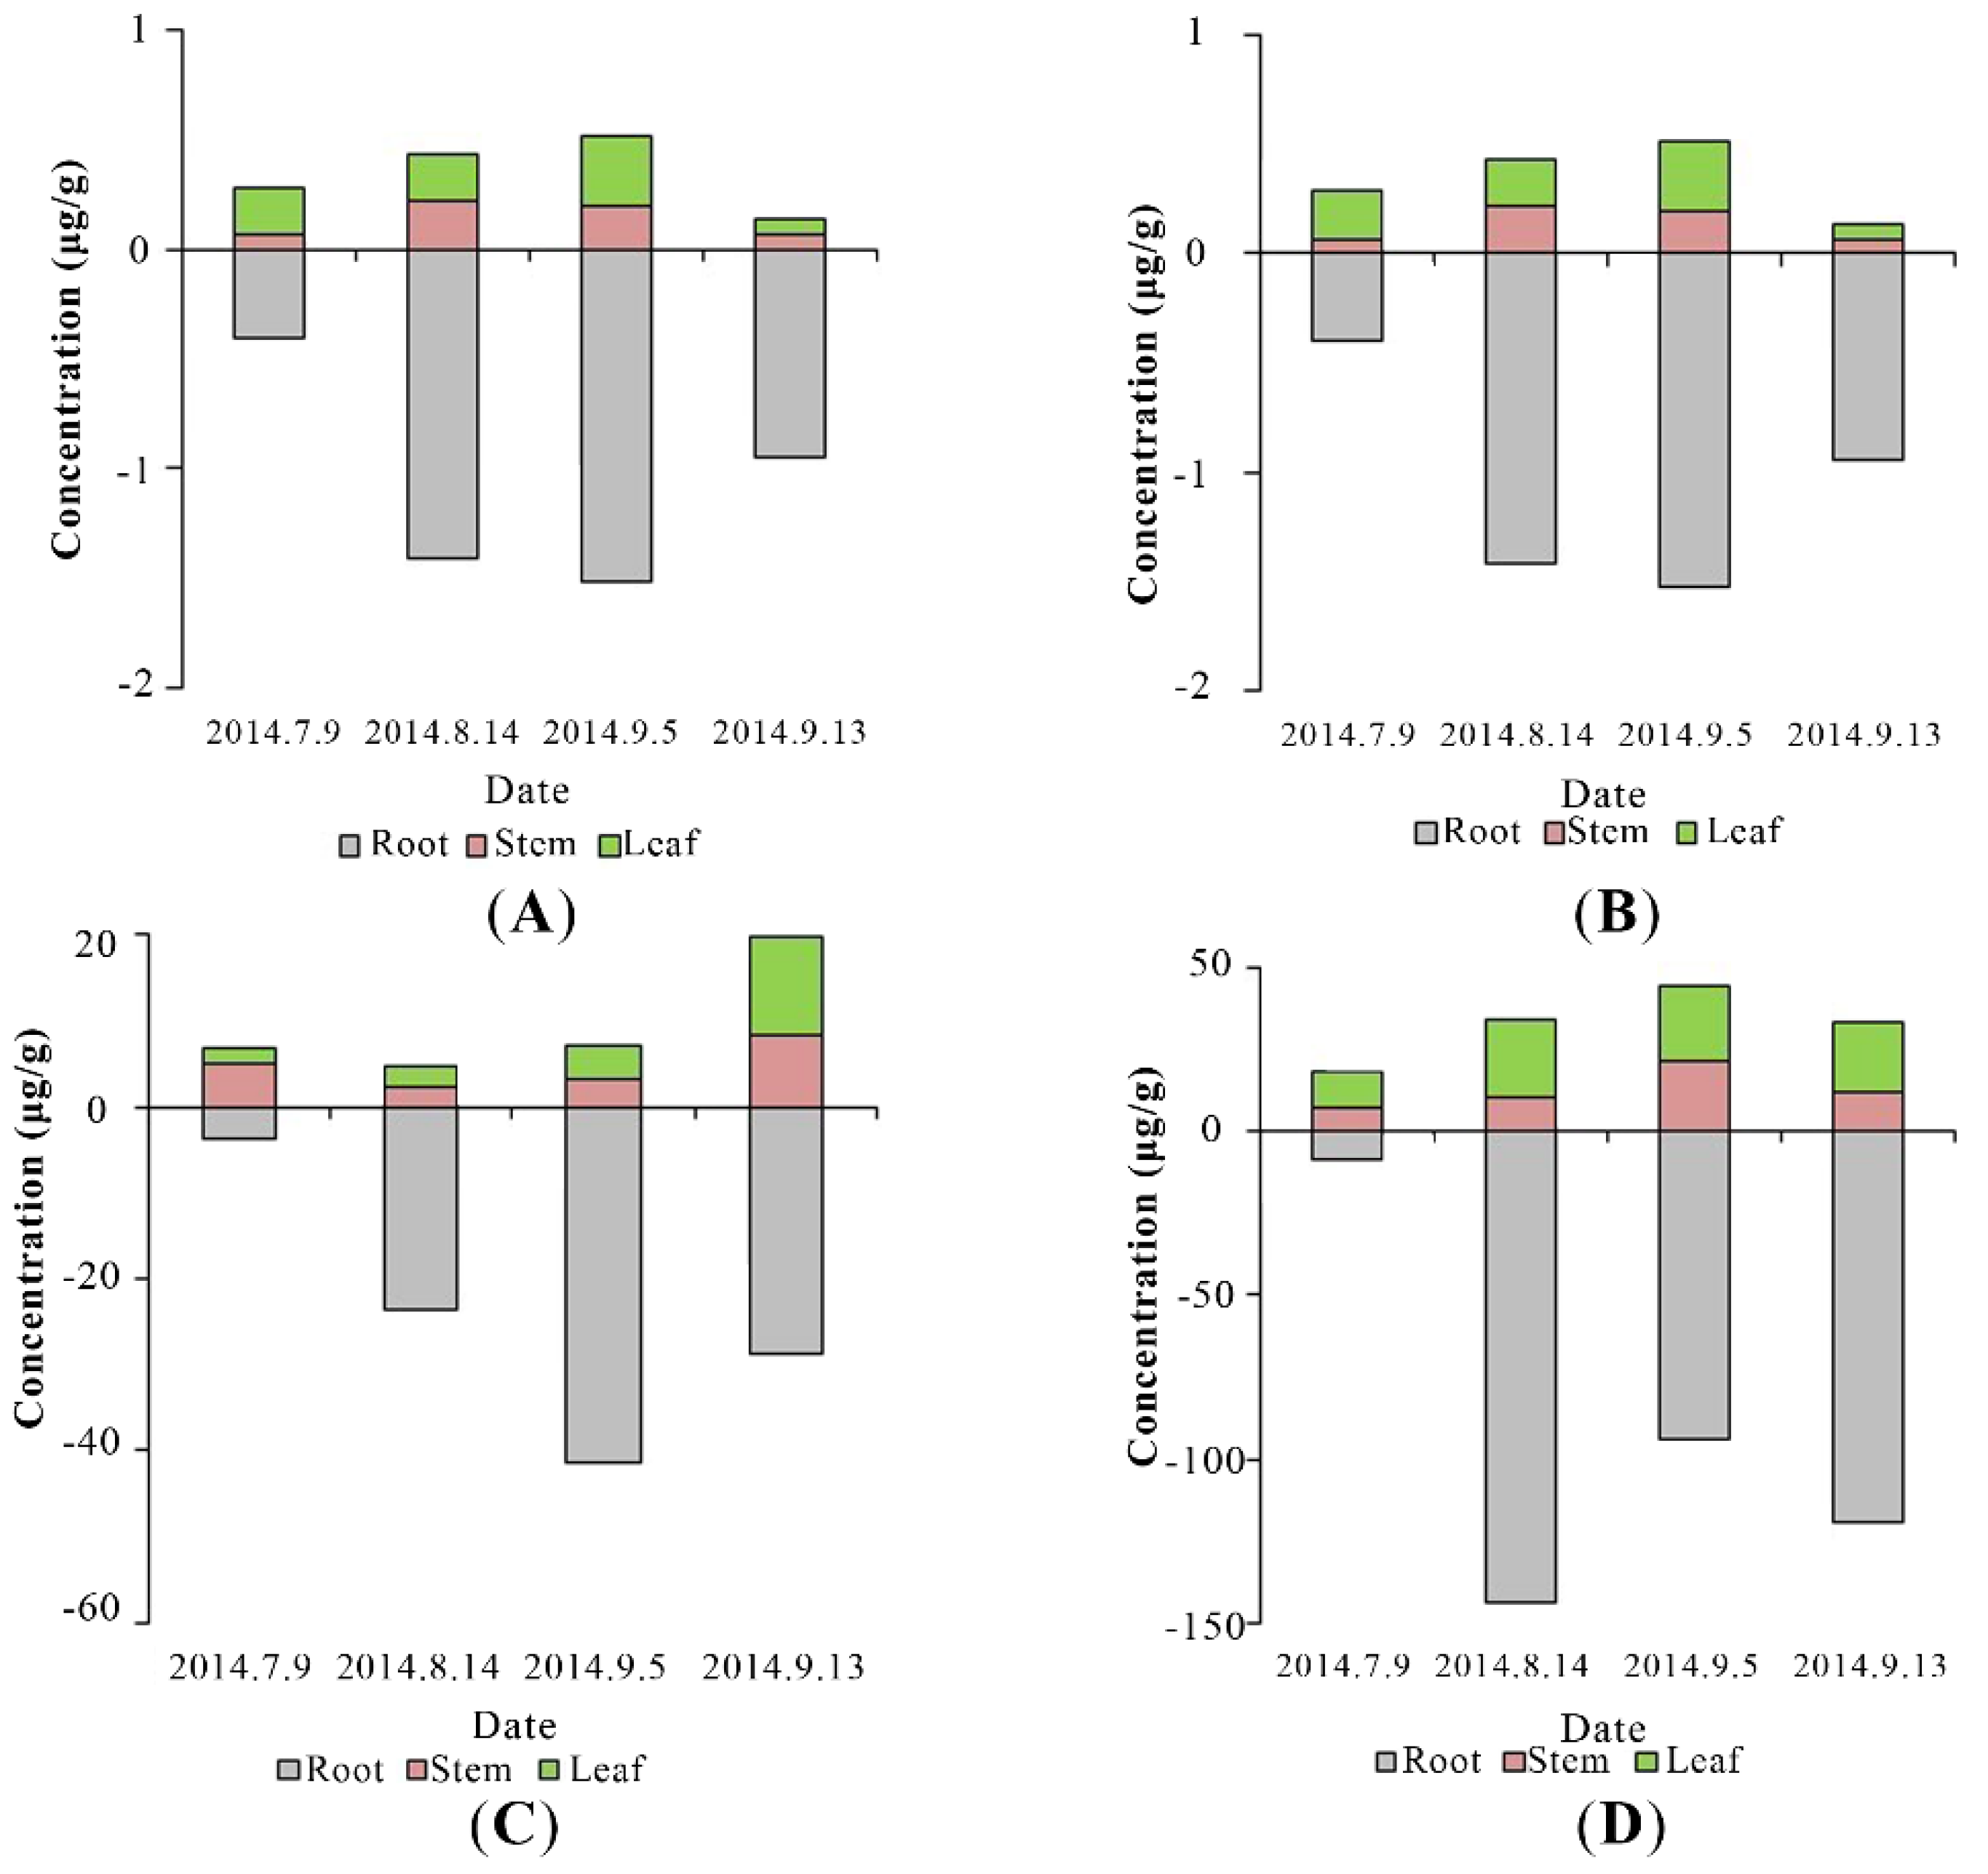
3.3. PAEs Uptake by Plants

Of all the PAEs, DEHP had the highest concentrations in plant tissues (26.67–177.68 mg/kg), followed by DBP (10.41–48.66 mg/kg), DEP (2.25–16.97 mg/kg), and DMP (0.69–2.04 mg/kg). Moreover, it contributed to PAEs removal in wetlands. Several previous studies have reported similar plant uptake of PAEs. Yin examined the uptake of DBP and DEHP by Capsicum and found the increasing DBP concentration in plant tissues with soil DBP, whereas the uptake of DEHP was not observed [49]. In contrast, Li’s work proved the uptake of DEHP by eleven plant species, including Zeamays, alfalfa, ryegrass, teosinte, etc., and the average removal rates ranged from 66.8% to 87.5% [48]. Potamogeton crispus L. can uptake and accumulate DBP and DEHP, enhancing the removal of DBP and DEHP from water by 6.3% and 22.4%, compared with no plants, respectively [50]. Comparing to previous work on DEHP uptake by Zea mays spp. and Medicago sativa [48], in which the DEHP was 0.87 μg/g to 2.46 μg/g in shoots and 0.53 μg/g to 1.86 μg/g in roots, P. australis showed much stronger capacities in accumulating DEHP. These results indicated that uptake of PAEs by plants was somewhat species-specific. The differences in the plant uptake of PAEs between plant species may be attributed to differences in plant lipid contents [6].
PAEs concentrations were much higher in roots than those in stems and leaves throughout the experiment (Figure 5). This was because phthalates are hydrophobic compounds, and their sorption to plant roots is likely influenced by the lipid content [6], and roots with the higher lipid content than most other plant tissues may preferentially accumulate hydrophobic compounds [51]. Translocation factor (TF), defined as the tested PAEs concentration ratio of the shoots to the roots, was a value reflecting PAEs transport to aerial tissues from the roots, is used in this research. The values of TFs of DMP, DBP, and DEHP were similar as 0.264 ± 0.059, 0.355 ± 0.166, and 0.330 ± 0.073, respectively, much higher than that of DEP (0.070 ± 0.008) (Figure 4B). The values of TF are reported to vary among different plant species. TFs are 0.13–0.34 for DBP and 0.73–0.88 for DEHP in edible plants, such as lettuce and carrot [6]. The TF of DEHP is 0.627–2.31 (Zea mays spp.) and 0.835 (Medicago sativa) [48]. From the theory of transpiration stream concentration factor (TSCF), high hydrophobic organic compounds (higher log Kow) are easier to be uptaken by plants, but they also tend to be strongly adsorbed to soil organic matters, consequently resulting in low concentrations in the soil solution [52]. Thus, the bell shape of TF against log Kow has been widely discussed and accepted, and the model suggests moderate hydrophobic chemicals (0.5 < log Kow < 3) have the highest TFs. DMP and DEP are therefore expected to have the highest TF values in this study, but our results illustrated an entirely different trend that the TF value of DEP was the lowest, as illustrated in Figure 4B. This may be caused by joint action of adsorption on soils and dissolution in water. The enhanced dissipation of DEHP in the presence of vegetation might be derived from plant-promoted biodegradation and sorption stronger to the soil. Furthermore, the small number of samples may also be the cause of this result.
The contribution of plant uptake to the total enhanced dissipation of the tested four PAEs in the present research was less than 0.20%, which may be underestimated as only the unaltered PAEs were analyzed without consideration of those transformed PAEs during plant uptake. The studies on pesticides have highlighted the capacity of plant metabolism after uptake [53]. The pathways of plant uptake for lipophilic xenobiotics are phase I activation reactions and phase II conjugation reactions/synthesis [54]. During the phase I plant metabolism, which usually involves hydrolysis or oxidation, xenobiotics may undergo hydroxylation or hydrolysis [54], where reactions such as hydrolysis lead to the formation of the corresponding MPEs (monoalkyl phthalate esters) from PAEs [6]. The conjugation reactions of phase II had added functional groups like hydroxyl or carboxyl and the monoesters were further transformed [6,54]. Therefore, further research on PAE transformation and metabolism is needed for an accurate understanding of the plant’s work on PAEs.

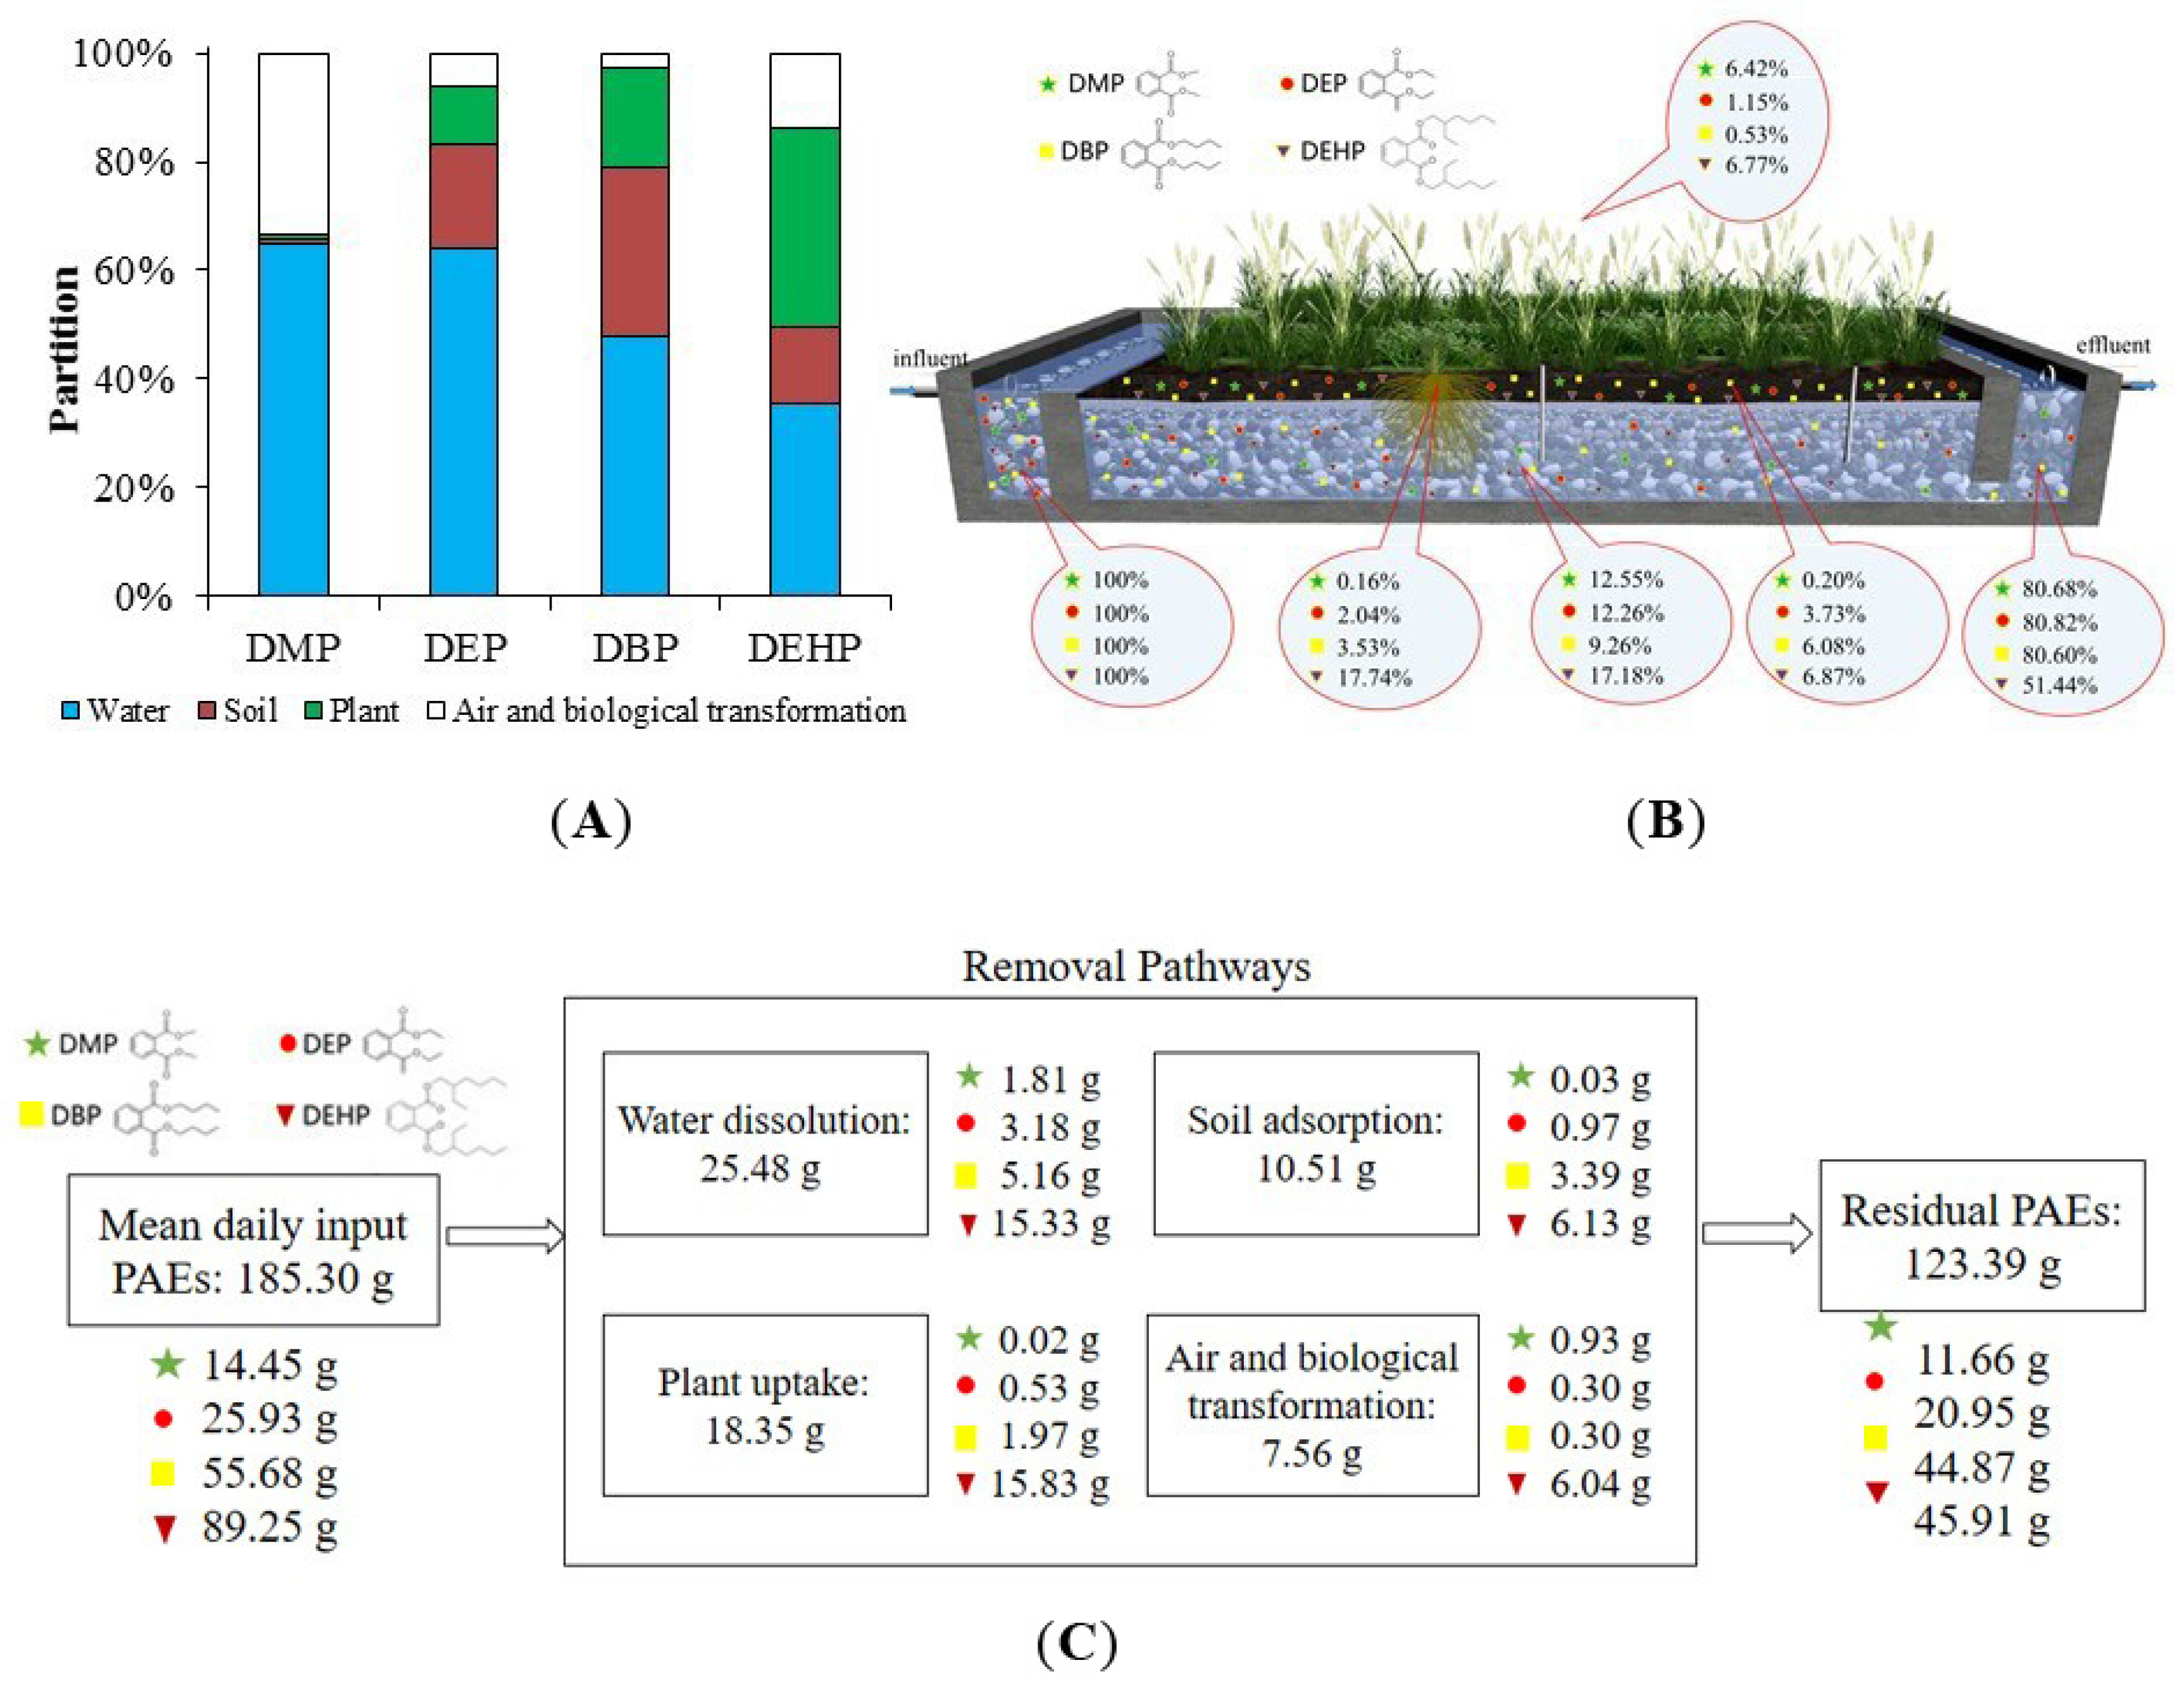
3.4. PAEs Distribution and Fate

The distribution and fate of the four targeting PAEs across multimedia in the constructed wetland are shown in Figure 6. In our research, constructed wetland digested DMP (19.32%), DEP (19.18%), DBP (19.40%), and DEHP (48.56%). The PAEs in water (blue bar) accounted for the majority of PAEs, declining with the increasing Kow for the adsorption by soil and plant. The DEHP with the highest Kow has the best adsorption effect. The adsorption by soil and plant can rise up to 50.68%. Elsewhere, the adsorption ratio for DBP, DEP, and DMP, respectively, was 49.55%, 30.11%, and 1.87%. Therefore, the horizontal subsurface flow constructed wetland in this study can efficiently remove most PAEs, with the removal efficiency 20–50%. The mass balance of PAEs (as shown in Figure 6C) was calculated by the influent concentration and daily treatment capacity of the constructed wetland in this work. Removal mechanisms of PAEs and the specific amount of each removal pathway are also shown.
However, the adsorptive behaviors of soil and plant were not identical. The fraction of soil adsorption (brown bar) was positively correlated with Kd values of PAEs. DEP and DBP have the highest Kd, and their proportion in soils was 19.44% and 31.33%, respectively. The corresponding removal pathway in mass balance calculation is soil adsorption in Figure 6C. The highest plant partition was found for DEHP (36.54%), followed by DBP (18.22%), DEP (10.66%), and DMP (0.85%). The corresponding removal pathway is plant uptake in mass balance calculation. The partition of PAEs in the plant (green bar) had a positive relationship with the RSCF and RWCF. As for the rest of PAEs, they might be evaporated as or degraded by biochemical processes in the wetland. And highest air and biological transformation were found for DMP (33.21%), followed by DEHP (13.94%), DEP (5.97%), and DBP (2.72%).
Typically, the translocation of high hydrophobic contaminants from soil to the shoot tissues is small [55]. As several literature reviews have shown, the plant uptake of DEHP with lower water solubility (about 0.40 mgL−1) and higher log Kow (7.0–7.8 range) was small [22]. The difference between the relationship between a plant’s uptaking capacity and log Kow obtained in this study and those previously reported is not clear but could be caused by a variety of factors including plant growth conditions, plant species, plant age, duration, transpiration, and losses due to metabolism and volatilization. Restrainedly, we believe that rather low concentrations of nutrients presented as COD, ammonia, and total phosphorus in the tested influent reduced the microbial mass than the biodegradation of PAEs. Moreover, the low level of PAEs in the influent decreased the driving force for bioreaction, including micro-biodegradation and plant uptake. That is, PAEs may take different paths in lightly polluted water and heavily polluted water. Compared with the previous study [22], it seems that adsorption contributes the most removal for lightly polluted water and bioreaction for that of heavily polluted water. This agrees with the research of Tang considering the PAEs with short ester hydrocarbon chains being more readily biodegraded and mineralized than those with long ester chains [22]. Tang reported a strong correlation between removal efficiencies and key nutrients (DO and COD) for microbiological mass for PAEs with short ester hydrocarbon chains (DMP and DEP), while a relatively weak correlation of that for PAEs with long ester hydrocarbon chains (DBP and DEHP) [22]. Details on microhabitat are needed for further insight.

4. Conclusions

In this study, a full-scale horizontal subsurface flow constructed wetland was investigated for its satisfactory performance in reducing PAEs, as well as the partition and fate of PAEs throughout the system. Results show that (1) the removal efficiency varied among DMP, DEP, DBP, and DEHP, attributing to their different Kow and partition across the multimedia; (2) Kow increased from DMP to DEP and DBP, contributing to the increasing adsorption in soils and uptake by P. australis; (3) DEHP had the highest Kow among the four PAEs with the lowest soil adsorption and the highest plant uptake, indicating an intense adsorption competition between plant and soils.
Our research revealed that Kow is a crucial factor affecting PAEs partition in constructed wetlands. Further study will be required to identify ways to enhance the PAEs removal efficiency. For example, soils with a different textural class or mineral composition and a mixture of plant species may improve the removal efficiency. Moreover, it will be necessary to quantify the removal of PAEs by chemical reactions in the soil or water and by microbes, since both are potentially essential processes.

Author Contributions

L.Z.: Conceptualization, Methodology. T.L., E.X., M.L., A.D., and B.-T.Z.: Formal analysis. T.L. and M.L.: Writing-Original draft preparation. L.Z. and T.L.: Writing Reviewing and Editing. L.Z. and E.X.: Funding acquisition. X.L. and D.Z.: data analysis and discussion. All authors have read and agreed to the published version of the manuscript.

Acknowledgments

This research was supported by the Natural Science Foundation of Beijing (Z170004), National Natural Science Foundation of China (No. 51509003) and the Beijing Municipal Science and Technology Commission (D161100000216001). We appreciate the help of Bruce Anderson, Shubiao Wu and Goffery Hart for their valuable editing language.

Conflicts of Interest

The authors declare no conflict of interest.

References

  1. Gao, D.; Li, Z.; Wen, Z.; Ren, N. Occurrence and fate of phthalate esters in full-scale domestic wastewater treatment plants and their impact on receiving waters along the Songhua River in China. Chemosphere 2014, 95, 24–32. [Google Scholar] [CrossRef]
  2. Koniecki, D.; Wang, R.; Moody, R.P.; Zhu, J. Phthalates in cosmetic and personal care products: Concentrations and possible dermal exposure. Environ. Res. 2011, 111, 329–336. [Google Scholar] [CrossRef] [PubMed]
  3. Okamoto, Y.; Ueda, K.; Kojima, N. Potential risks of phthalate esters: Acquisition of endocrine-disrupting activity during environmental and metabolic processing. J. Health Sci. 2011, 57, 497–503. [Google Scholar] [CrossRef] [Green Version]
  4. Cho, E.; Khim, J.; Chung, S.; Seo, D.; Son, Y. Occurrence of micropollutants in four major rivers in Korea. Sci. Total Environ. 2014, 491–492, 138–147. [Google Scholar] [CrossRef] [PubMed]
  5. Liu, H.; Cui, K.; Zeng, F.; Chen, L.; Cheng, Y.; Li, H.; Li, S.; Zhou, X.; Zhu, F.; Ouyang, G.; et al. Occurrence and distribution of phthalate esters in riverine sediments from the Pearl River Delta region, South China. Mar. Pollut. Bull. 2014, 83, 358–365. [Google Scholar] [CrossRef] [PubMed]
  6. Sun, J.; Wu, X.; Gan, J. Uptake and metabolism of phthalate esters by edible plants. Environ. Sci. Technol. 2015, 49, 8471–8478. [Google Scholar] [CrossRef] [PubMed]
  7. Bergé, A.; Gasperi, J.; Rocher, V.; Gras, L.; Coursimault, A.; Moilleron, R. Phthalates and alkylphenols in industrial and domestic effluents: Case of Paris conurbation (France). Sci. Total Environ. 2014, 488–489, 26–35. [Google Scholar] [CrossRef] [PubMed] [Green Version]
  8. Kang, Y.; Man, Y.; Cheung, K.; Wong, M. Risk assessment of human exposure to bioaccessible phthalate esters via indoor dust around the Pearl River Delta. Environ. Sci. Technol. 2012, 46, 8422–8430. [Google Scholar] [CrossRef]
  9. Joel, D.B. Ultra-trace determination of phthalate ester metabolites in seawater, sediments, and biota from an urbanized marine inlet by LC/ESI-MS/MS. Environ. Sci. Technol. 2009, 16, 6262–6268. [Google Scholar]
  10. Hanno, C.E. Leaching of the plasticizer di(2-ethylhexyl)phthalate (DEHP) from plastic containers and the question of human exposure. Appl. Microbiol. Biot. 2014, 24, 9967–9981. [Google Scholar]
  11. He, W.; Qin, N.; Kong, X.; Liu, W.; He, Q.; Ouyang, H.; Yang, C.; Jiang, Y.; Wang, Q.; Yang, B.; et al. Spatio-temporal distributions and the ecological and health risks of phthalate esters (PAEs) in the surface water of a large, shallow Chinese lake. Sci. Total Environ. 2013, 461–462, 672–680. [Google Scholar] [CrossRef] [PubMed]
  12. Ventrice, P.; Ventrice, D.; Russo, E.; Sarro, G. Phthalates: European regulation, chemistry, pharmacokinetic and related toxicity. Environ. Toxicol. Phar. 2013, 36, 88–96. [Google Scholar] [CrossRef] [PubMed]
  13. Dargnat, C.; Teil, M.-J.; Chevreuil, M.; Blanchard, M. Phthalate removal throughout wastewater treatment plant: Case study of Marne Aval station (France). Sci. Total Environ. 2009, 407, 1235–1244. [Google Scholar] [CrossRef]
  14. Adhoum, N.; Monser, L. Removal of phthalate on modified activated carbon: Application to the treatment of industrial wastewater. Sep. Purif. Technol. 2004, 38, 233–239. [Google Scholar] [CrossRef]
  15. Gültekin, I.; Ince, N.H. Synthetic endocrine disruptors in the environment and water remediation by advanced oxidation processes. J. Environ. Manage. 2007, 85, 816–832. [Google Scholar] [CrossRef] [PubMed]
  16. Zolfaghari, M.; Drogui, P.; Seyhi, B.; Brar, K.; Buelna, G.; Dubé, R. Occurrence, fate and effects of di (2-ethylhexyl) phthalate in wastewater treatment plants: A review. Environ. Pollut. 2014, 194, 281–293. [Google Scholar] [CrossRef] [PubMed]
  17. Kivaisi, A.K. The potential for constructed wetlands for wastewater treatment and reuse in developing countries: A review. Ecol. Eng. 2001, 16, 545–560. [Google Scholar] [CrossRef]
  18. Ye, J.; Xu, Z.X.; Li, H.Z. Dynamic rule of organic matter removal in vertical-flow constructed wetland. Environ. Sci. 2008, 29, 2166–2171. [Google Scholar]
  19. Gruchlik, Y.; Linge, K.; Joll, C. Removal of organic micropollutants in waste stabilisation ponds: A review. J. Environ. Manage. 2018, 206, 202–214. [Google Scholar] [CrossRef]
  20. Zhu, S.; Chen, H. The fate and risk of selected pharmaceutical and personal care products in wastewater treatment plants and a pilot-scale multistage constructed wetland system. Environ. Sci. Pollut. R. 2014, 21, 1466–1479. [Google Scholar] [CrossRef]
  21. Stales, C.A.; Peterson, D.R.; Parkerton, T.; Adams, W. The environmental fate of phthalate esters: A literature review. Chemosphere 1997, 35, 667–749. [Google Scholar] [CrossRef]
  22. Tang, X.; Suyu, W.; Yang, Y.; Ran, T.; Dai, Y.-N.; Dan, A.; Li, L. Removal of six phthalic acid esters (PAEs) from domestic sewage by constructed wetlands. Chem. Eng. J. 2015, 275, 198–205. [Google Scholar]
  23. Wania, F.; Mackay, D. A global distribution model for persistent organic chemicals. Sci. Total. Environ. 1995, 160–161, 0–232. [Google Scholar] [CrossRef]
  24. Xu, F.L.; Qin, N.; Zhu, Y.; He, W.; Kong, X.Z.; Barbour, M.; He, Q.S.; Wang, Y.; Ouyang, H.; Tao, S. Multimedia fate modeling of polycyclic aromatic hydrocarbons (PAHs) in Lake Small Baiyangdian, Northern China. Ecol. Model. 2013, 252, 246–257. [Google Scholar] [CrossRef]
  25. Wania, F.; Dugani, S. Assessing the long-range transport potential of polybrominated diphenyl ethers: A comparison of four multimedia models. Environ. Toxicol. Chem. 2003, 22, 1252–1261. [Google Scholar] [CrossRef]
  26. Zhu, Y.; Tao, S.; Price, O.; Shen, H.; Jones, K.; Sweetman, A. Environmental distributions of benzo[a]pyrene in China: Current and future emission reduction scenarios explored using a spatially explicit multimedia fate model. Environ. Sci. Technol. 2015, 49, 13868–13877. [Google Scholar] [CrossRef] [PubMed] [Green Version]
  27. Zhu, Y.; Price, O.; Tao, S.; Jones, K.; Sweetman, A. A new multimedia contaminant fate model for China: How important are environmental parameters in influencing chemical persistence and long-range transport potential? Environ. Int. 2014, 6, 18–27. [Google Scholar] [CrossRef] [Green Version]
  28. Hsu, F.C.; Marxmiller, R.L.; Yang, A.Y. Study of root uptake and xylem translocation of cinmethylin and related compounds in detopped soybean roots using a pressure chamber technique. Plant. Physiol. 1990, 93, 1573–1578. [Google Scholar] [CrossRef] [Green Version]
  29. Tian, F.; Liu, Y.; Liu, C.; Gu, H.; Liu, H. Pollution Status and multimedia fate simulation of phthalate acid esters (PAEs) in an arid city. Pol. J. Environ. Stud. 2016, 25, 325–331. [Google Scholar]
  30. Simon, S.; Graham, J.C.; Terp, S.D. Uptake of 40K and 137Cs in native plants of the Marshall Islands. J. Environ. Radioactiv. 2002, 59, 223–243. [Google Scholar] [CrossRef]
  31. Zheng, X.; Zhang, B.T.; Teng, Y. Distribution of phthalate acid esters in lakes of Beijing and its relationship with anthropogenic activities. Sci. Total Environ. 2014, 476, 107–113. [Google Scholar] [CrossRef]
  32. Marttinen, S.; Kettunen, R.H.; Sormunen, K.; Rintala, J. Removal of bis (2-ethylhexyl) phthalate at a sewage treatment plant. Water. Res. 2003, 37, 1385–1393. [Google Scholar] [CrossRef]
  33. Oliver, R.; May, E.; Williams, J. The occurrence and removal of phthalates in a trickle filter STW. Water Res. 2005, 39, 4436–4444. [Google Scholar] [CrossRef] [PubMed]
  34. Tan, B.L.; Hawker, D.W.; Mueller, J.F.; Leusch, F.D.; Tremblay, L.A.; Chapman, H.F. Modelling of the fate of selected endocrine disruptors in a municipal wastewater treatment plant in South East Queensland, Australia. Chemosphere 2007, 69, 644–654. [Google Scholar] [CrossRef] [PubMed]
  35. Liang, W.; Deng, J.-q.; Zhan, F.C.; Wu, Z.B. Effects of constructed wetland system on the removal of dibutyl phthalate (DBP). Microbiol. Res. 2009, 164, 206–211. [Google Scholar] [CrossRef]
  36. Yu Zhao, W.; Bin Wu, Z.; Hong Zhou, Q.; Ping Cheng, S.; Ping Fu, G.; He, F. Removal of dibutyl phthalate by a staged, vertical-flow constructed wetland. Wetlands 2004, 24, 202. [Google Scholar] [CrossRef]
  37. Guo, X.; Wang, L.; Wang, X.; Liu, H. Occurrence and environmental risk assessment of PAEs in Weihe River near Xi’an City, China. Water Sci. Technol. 2013, 67, 948–958. [Google Scholar] [CrossRef]
  38. Wu, X.; Hong, H.; Liu, X.; Guan, W.; Meng, L.; Ye, Y.; Ma, Y. Graphene-dispersive solid-phase extraction of phthalate acid esters from environmental water. Sci. Total Environ. 2013, 444, 224–230. [Google Scholar] [CrossRef]
  39. Teil, M.-J.; Blanchard, M.; Moreau-Guigon, E.; Dargnat, C.; Alliot, F.; Bourges, C.; Desportes, A.; Chevreuil, M. Phthalate fate in the hydrographic network of the river Seine basin (France) under contrasted hydrological conditions. Water Air Soil Poll. 2013, 224, 1592–1606. [Google Scholar] [CrossRef]
  40. Liang, D.-W.; Zhang, T.; Fang, H.; He, J. Phthalates biodegradation in the environment. Appl. Microbiol. Biot. 2008, 80, 183. [Google Scholar] [CrossRef]
  41. Julinová, M.; Slavík, R. Removal of phthalates from aqueous solution by different adsorbents: A short review. J. Environ. Manage. 2012, 94, 13–24. [Google Scholar] [CrossRef] [PubMed]
  42. Yuwatini, E.; Hata, N.; Kuramitz, H.; Taguchi, S. Effect of salting-out on distribution behavior of di (2-ethylhexyl) phthalate and its analogues between water and sediment. SpringerPlus 2013, 2, 422. [Google Scholar] [CrossRef] [PubMed] [Green Version]
  43. Chen, C.-W.; Chen, C.-F.; Dong, C.-D. Distribution of phthalate esters in sediments of Kaohsiung Harbor, Taiwan. Soil Sediment. Contam 2013, 22, 119–131. [Google Scholar] [CrossRef]
  44. Sun, H.; An, T.; Li, G.; Qiao, M.; Wei, D. Distribution, possible sources, and health risk assessment of SVOC pollution in small streams in Pearl River Delta, China. Environ. Sci. Pollut. Res. 2014, 21, 10083–10095. [Google Scholar] [CrossRef]
  45. Zeng, F.; Cui, K.; Xie, Z.; Liu, M.; Li, Y.; Lin, Y.; Zeng, Z.; Li, F. Occurrence of phthalate esters in water and sediment of urban lakes in a subtropical city, Guangzhou, South China. Environ. Int. 2008, 34, 372–380. [Google Scholar] [CrossRef]
  46. Sangster, J. Octanol-water partition coefficients of simple organic compounds. J. Phys. Chem. Ref. Data 1989, 18, 1111–1229. [Google Scholar] [CrossRef]
  47. Jackson Ellington, J. Octanol/water partition coefficients and water solubilities of phthalate esters. J. Chem. Eng. Data 1999, 44, 1414–1418. [Google Scholar] [CrossRef]
  48. Li, Y.-W.; Cai, Q.-Y.; Mo, C.-H.; Zeng, Q.-Y.; Lü, H.; Li, Q.-S.; Xu, G.-S. Plant uptake and enhanced dissipation of di(2-Ethylhexyl) phthalate (DEHP) in spiked soils by different plant species. Int. J. Phytoremediat. 2014, 16, 609–620. [Google Scholar] [CrossRef]
  49. Yin, R.; Lin, X.G.; Wang, S.G.; Zhang, H.Y. Effect of DBP/DEHP in vegetable planted soil on the quality of capsicum fruit. Chemosphere 2003, 50, 801–805. [Google Scholar] [CrossRef]
  50. Chi, J.; Gao, J. Effects of Potamogeton crispus L.–bacteria interactions on the removal of phthalate acid esters from surface water. Chemosphere 2015, 119, 59–64. [Google Scholar] [CrossRef]
  51. Dodgen, L.K.; Li, J.; Parker, D.; Gan, J.J. Uptake and accumulation of four PPCP/EDCs in two leafy vegetables. Environ. Pollut. 2013, 182, 150–156. [Google Scholar] [CrossRef] [PubMed] [Green Version]
  52. Namiki, S.; Otani, T.; Seike, N. Fate and plant uptake of persistent organic pollutants in soil. Soil. Sci. Plant. Nut. 2013, 59, 669–679. [Google Scholar] [CrossRef]
  53. Macherius, A.; Eggen, T.; Lorenz, W.; Moeder, M.; Ondruschka, J.; Reemtsma, T. Metabolization of the bacteriostatic agent triclosan in edible plants and its consequences for plant uptake assessment. Environ. Sci. Technol. 2012, 46, 10797–10804. [Google Scholar] [CrossRef] [PubMed]
  54. Coleman, J.; Blake-Kalff, M.; Davies, E. Detoxification of xenobiotics by plants: Chemical modification and vacuolar compartmentation. Trends Plant. Sci. 1997, 2, 144–151. [Google Scholar] [CrossRef] [Green Version]
  55. Mikeš, O.; Cupr, P.; Trapp, S.; Klanova, J. Uptake of polychlorinated biphenyls and organochlorine pesticides from soil and air into radishes (Raphanus sativus). Environ. Pollut. 2009, 157, 488–496. [Google Scholar] [CrossRef]
Figure 1. Phragmites australis planting and sampling sites in wetland. Four pipes (P1P4) were used for the collection of samples, where P1 is the sampling outlet of the influent, P4 is the sampling outlet of the effluent, P2 and P3 are the sampling sites inside the wetland.
Water 12 00865 g001
Figure 2. Phthalate acid ester (PAE) concentrations in water (A) for influent, constructed wetland with P. australis (B), and effluent (C).
Water 12 00865 g002
Figure 3. The relative distribution of the different PAE in soils at different sampling times.
Water 12 00865 g003
Figure 4. Key parameters of PAEs partitioning in constructed wetland. (A) Soil-water partition coefficient (Kd), (B) translocation factor (TF), (C) root-soil concentration factor (RSCF), and (D) root-water concentration factor (RWCF).
Water 12 00865 g004
Figure 5. The concentrations of DMP (A), DEP (B), DBP (C), and DEHP (D) in the roots, stems, and leaves of P. australis.
Water 12 00865 g005
Figure 6. PAEs distribution and fate. (A) Multimedia distribution and the fate of PAEs in soil, plant, air, and water of the constructed wetland. (B) Fate of PAEs in the system of constructed wetland. (C) Mass balance calculation of PAEs in all pathways.
Water 12 00865 g006

