Recharge–Discharge Relations of Groundwater in Volcanic Terrain of Semi-Humid Tropical Highlands of Ethiopia: The Case of Infranz Springs, in the Upper Blue Nile

 , and
, and 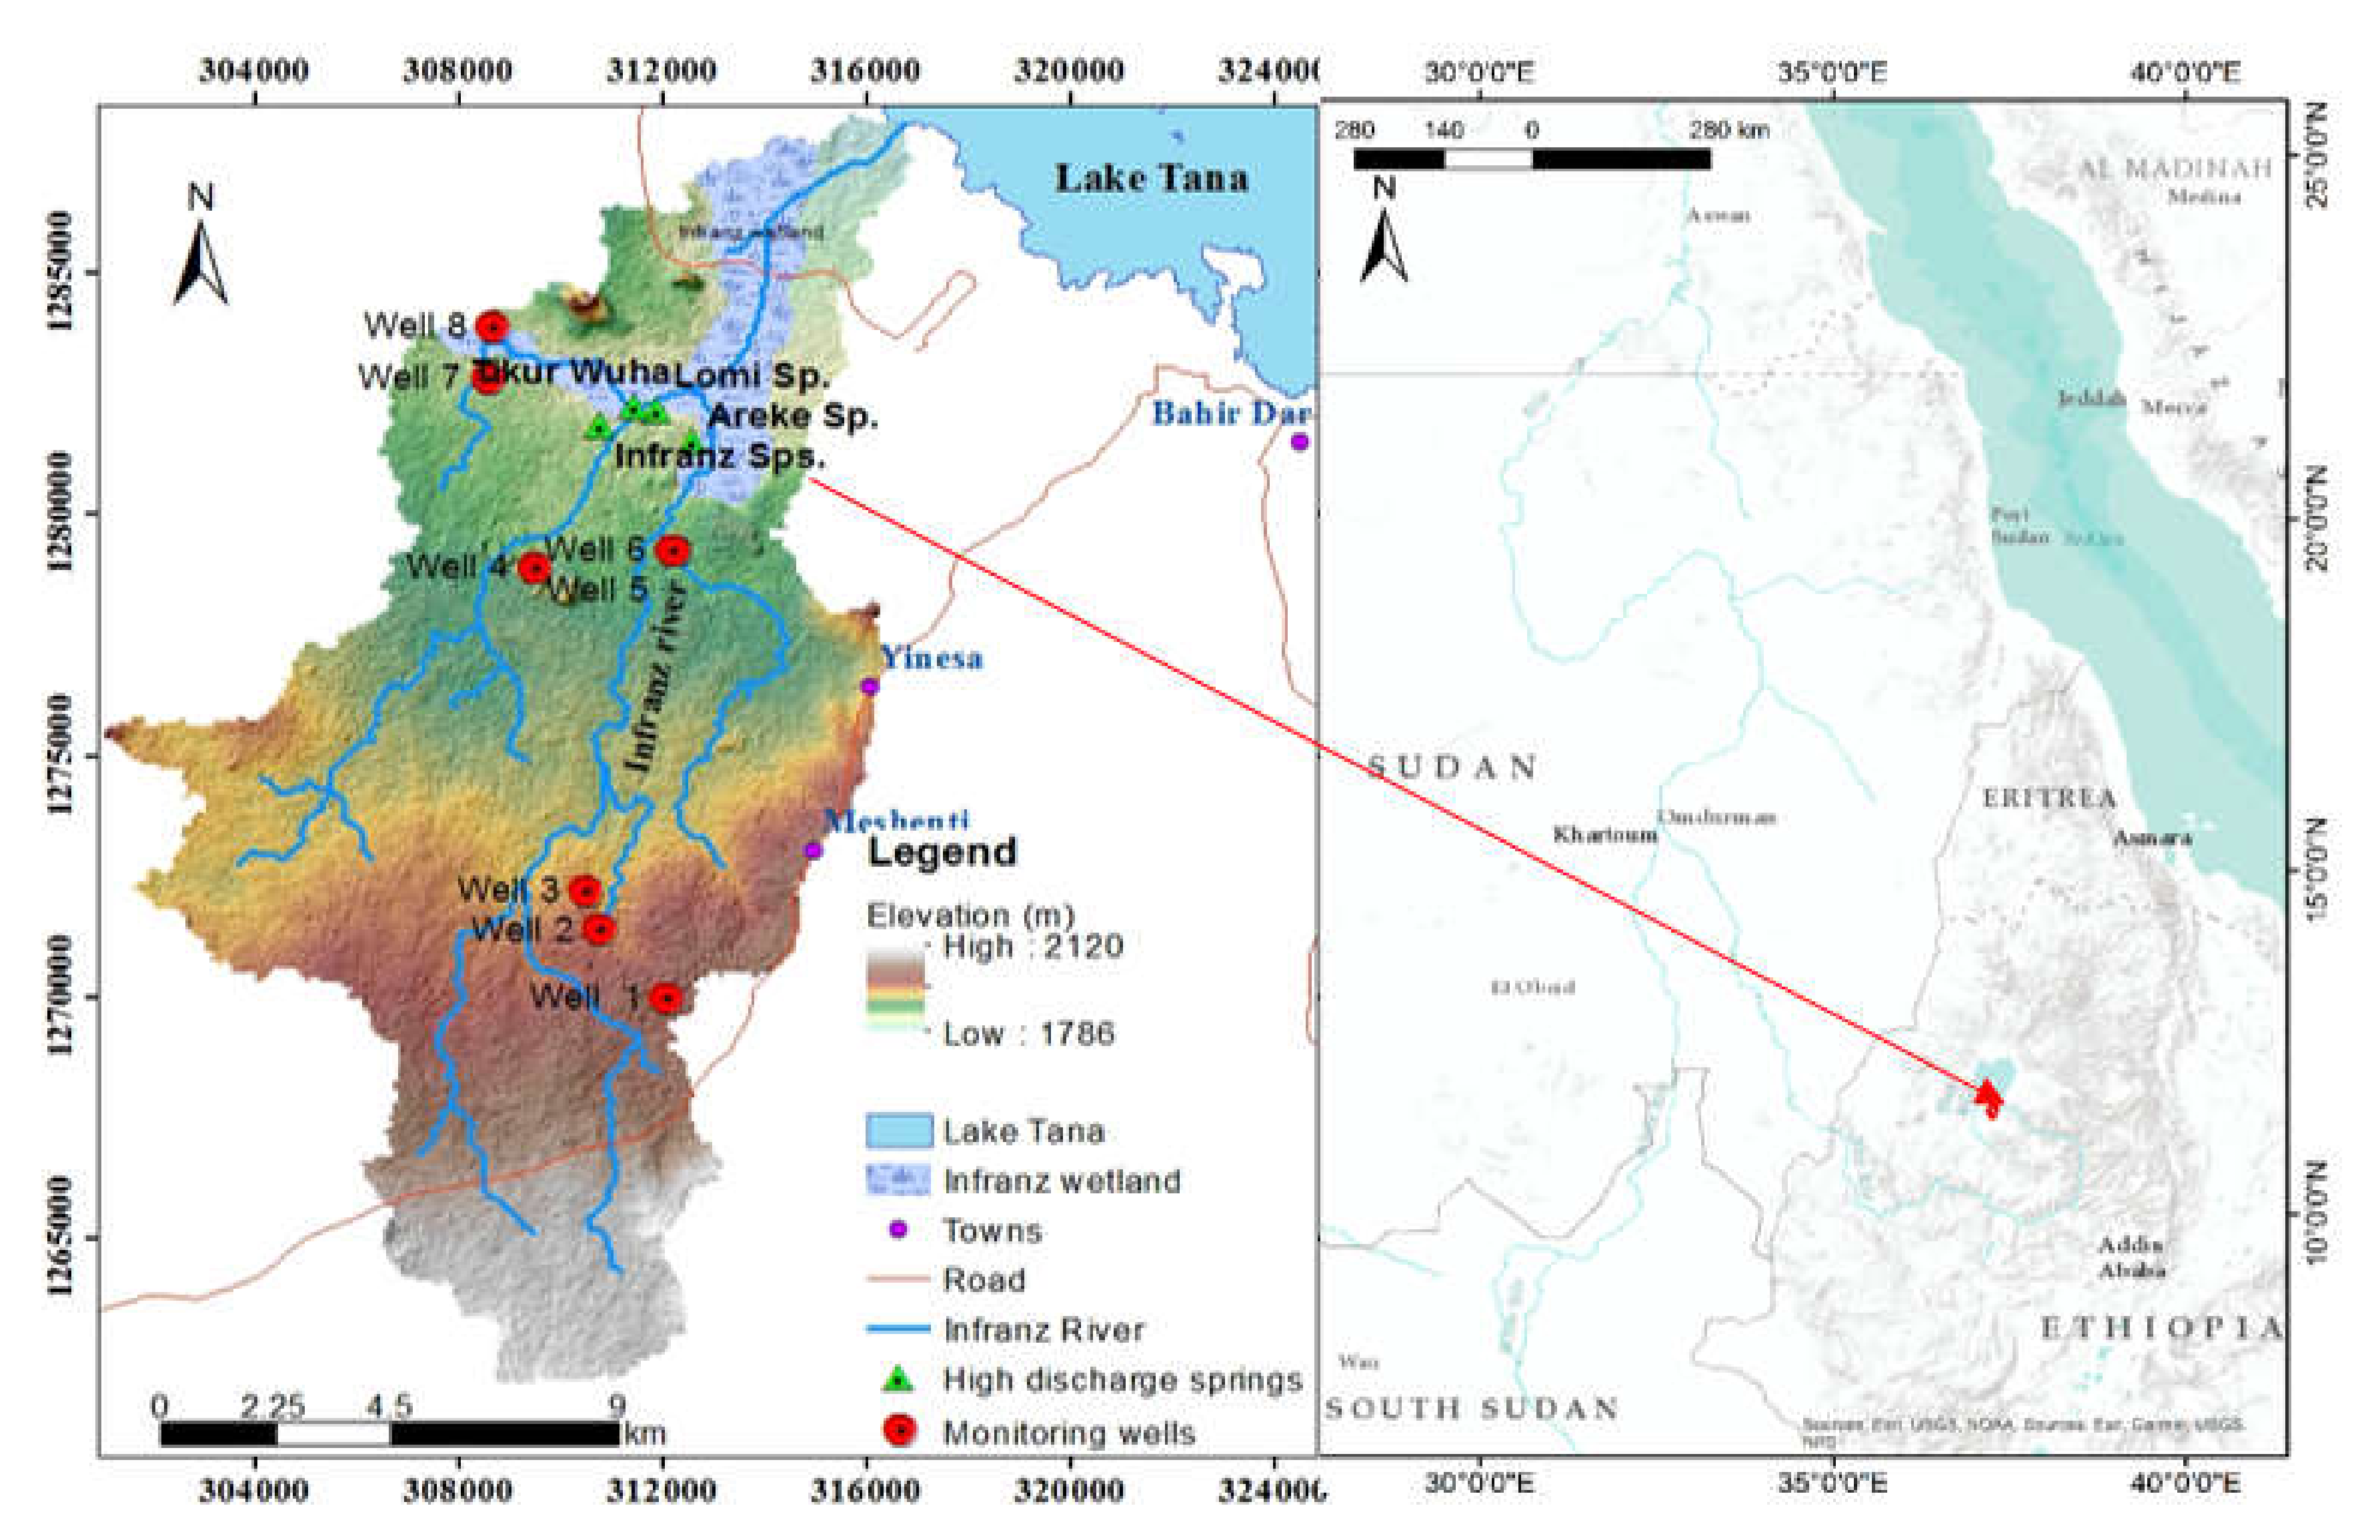
Abstract
:1. Introduction
2. Description of the Study Area
2.1. Location and Climate of the Study Area
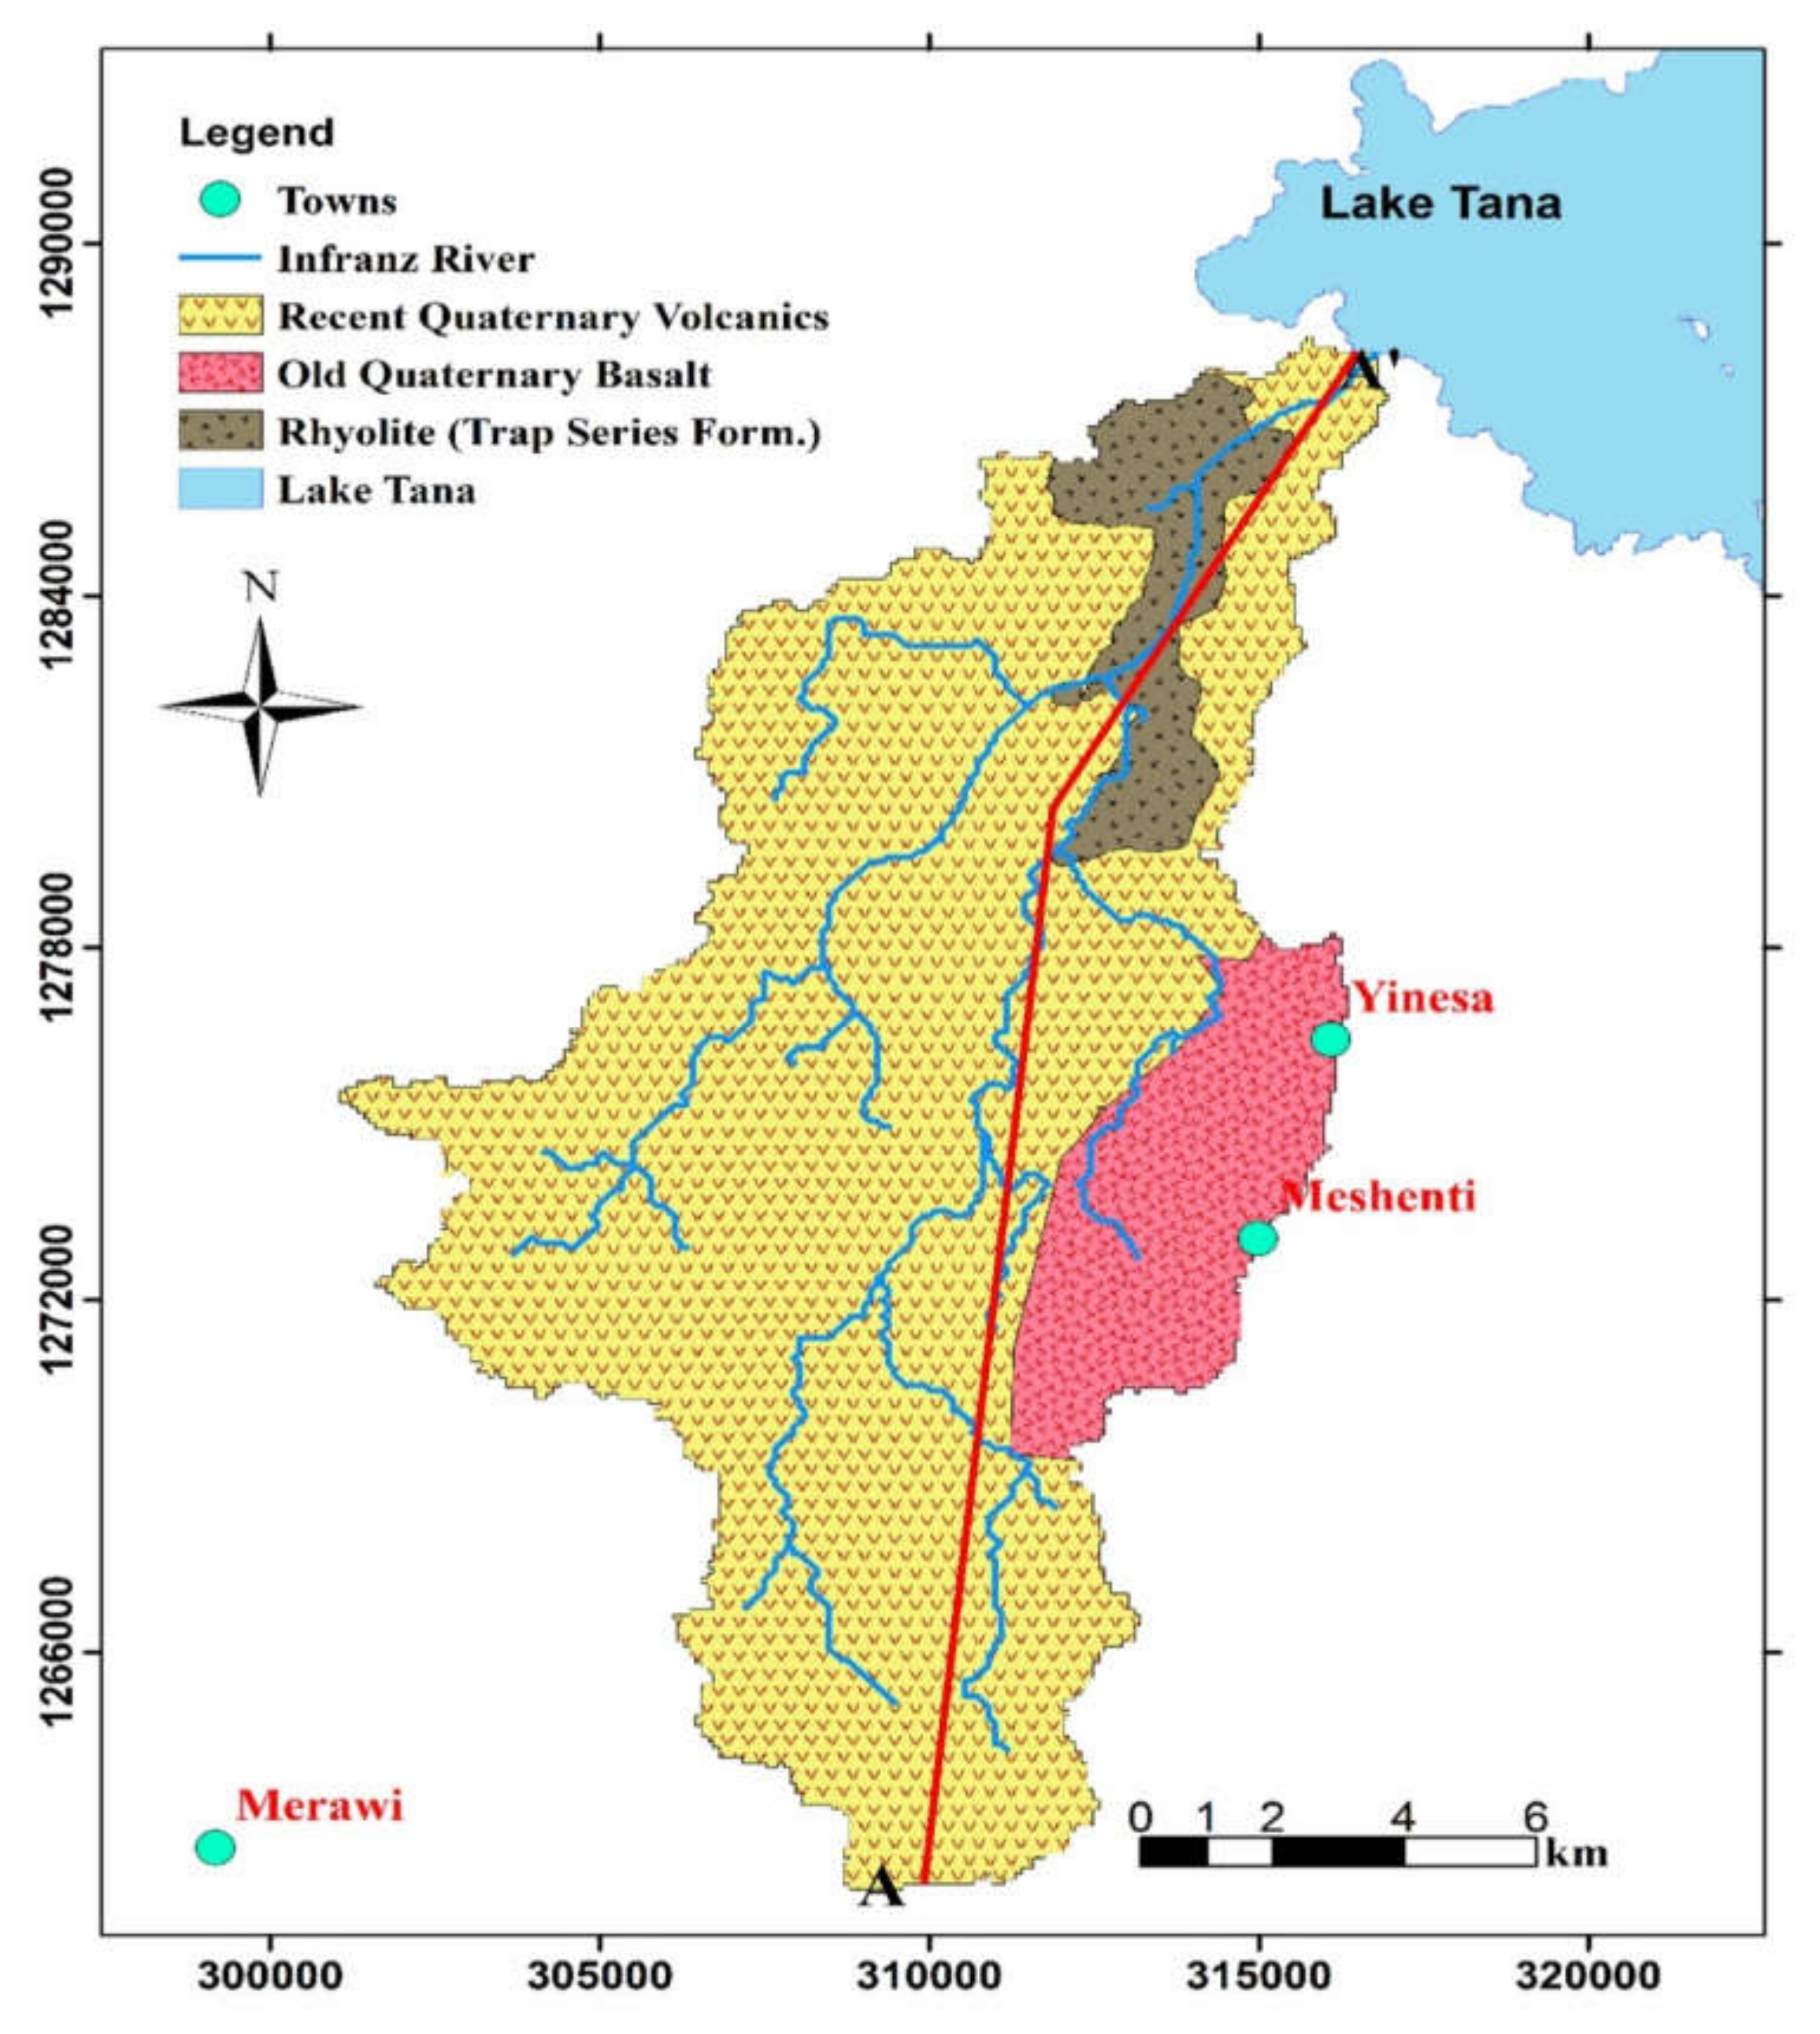
2.2. Geology and Hydrogeology of the Study Area
3. Materials and Methods
3.1. Data Collection
3.2. Groundwater Flow System and Groundwater Level Monitoring
3.3. Groundwater Recharge Estimation
3.3.1. Groundwater Recharge Estimation by Chloride Mass Balance (CMB) Method
3.3.2. Groundwater Recharge Estimation by Soil Moisture Balance (SMB) Method
3.3.3. Groundwater Recharge Estimation by Water Table Fluctuation (WTF) Method
4. Results and Discussion
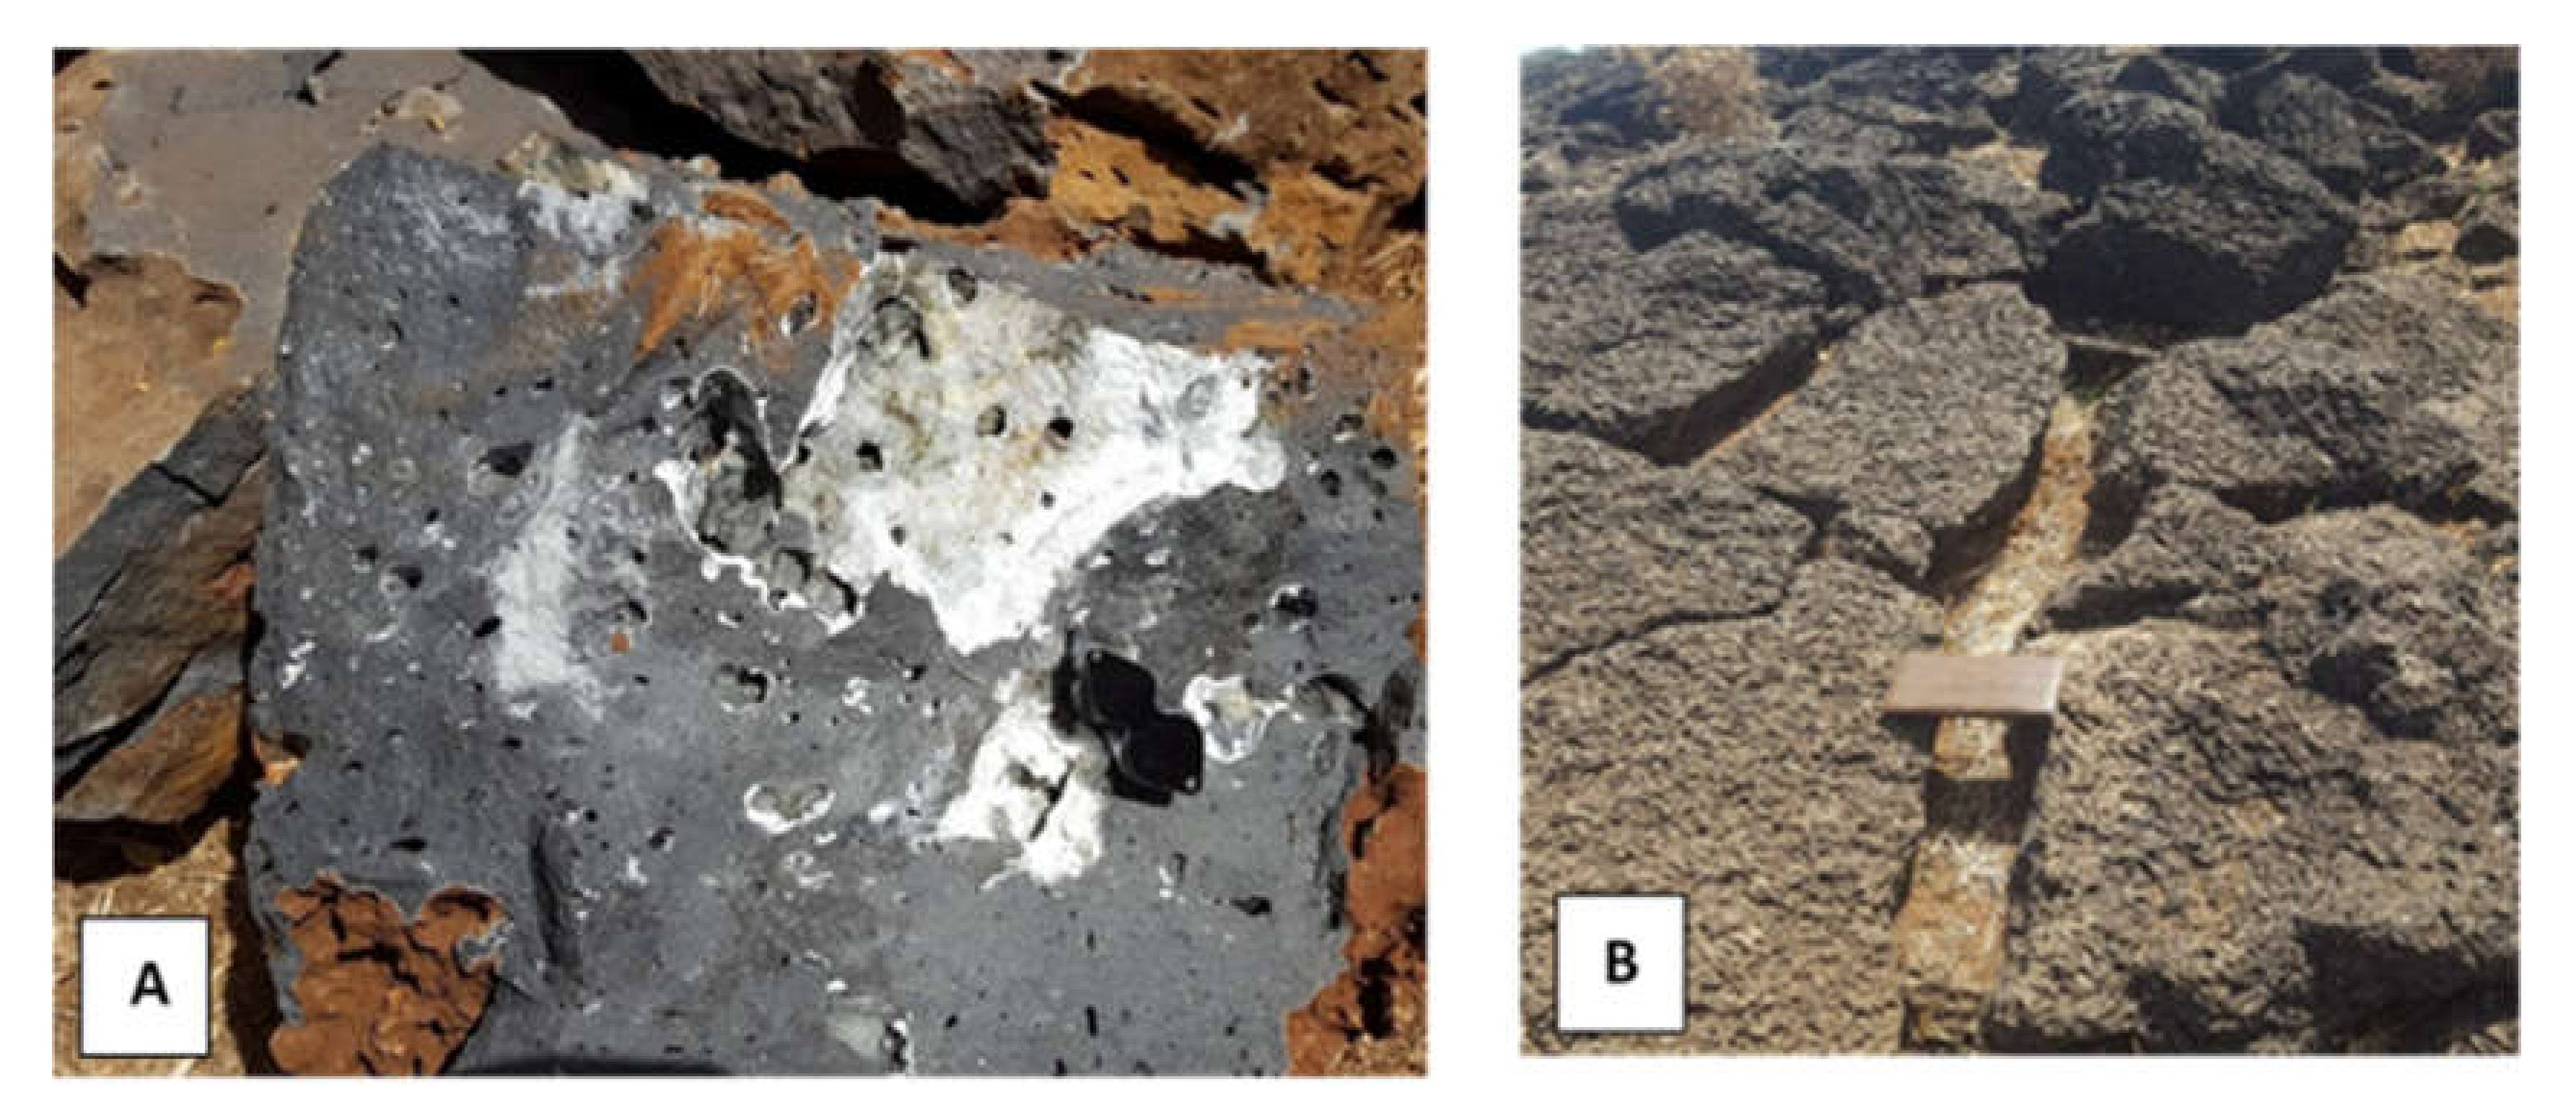
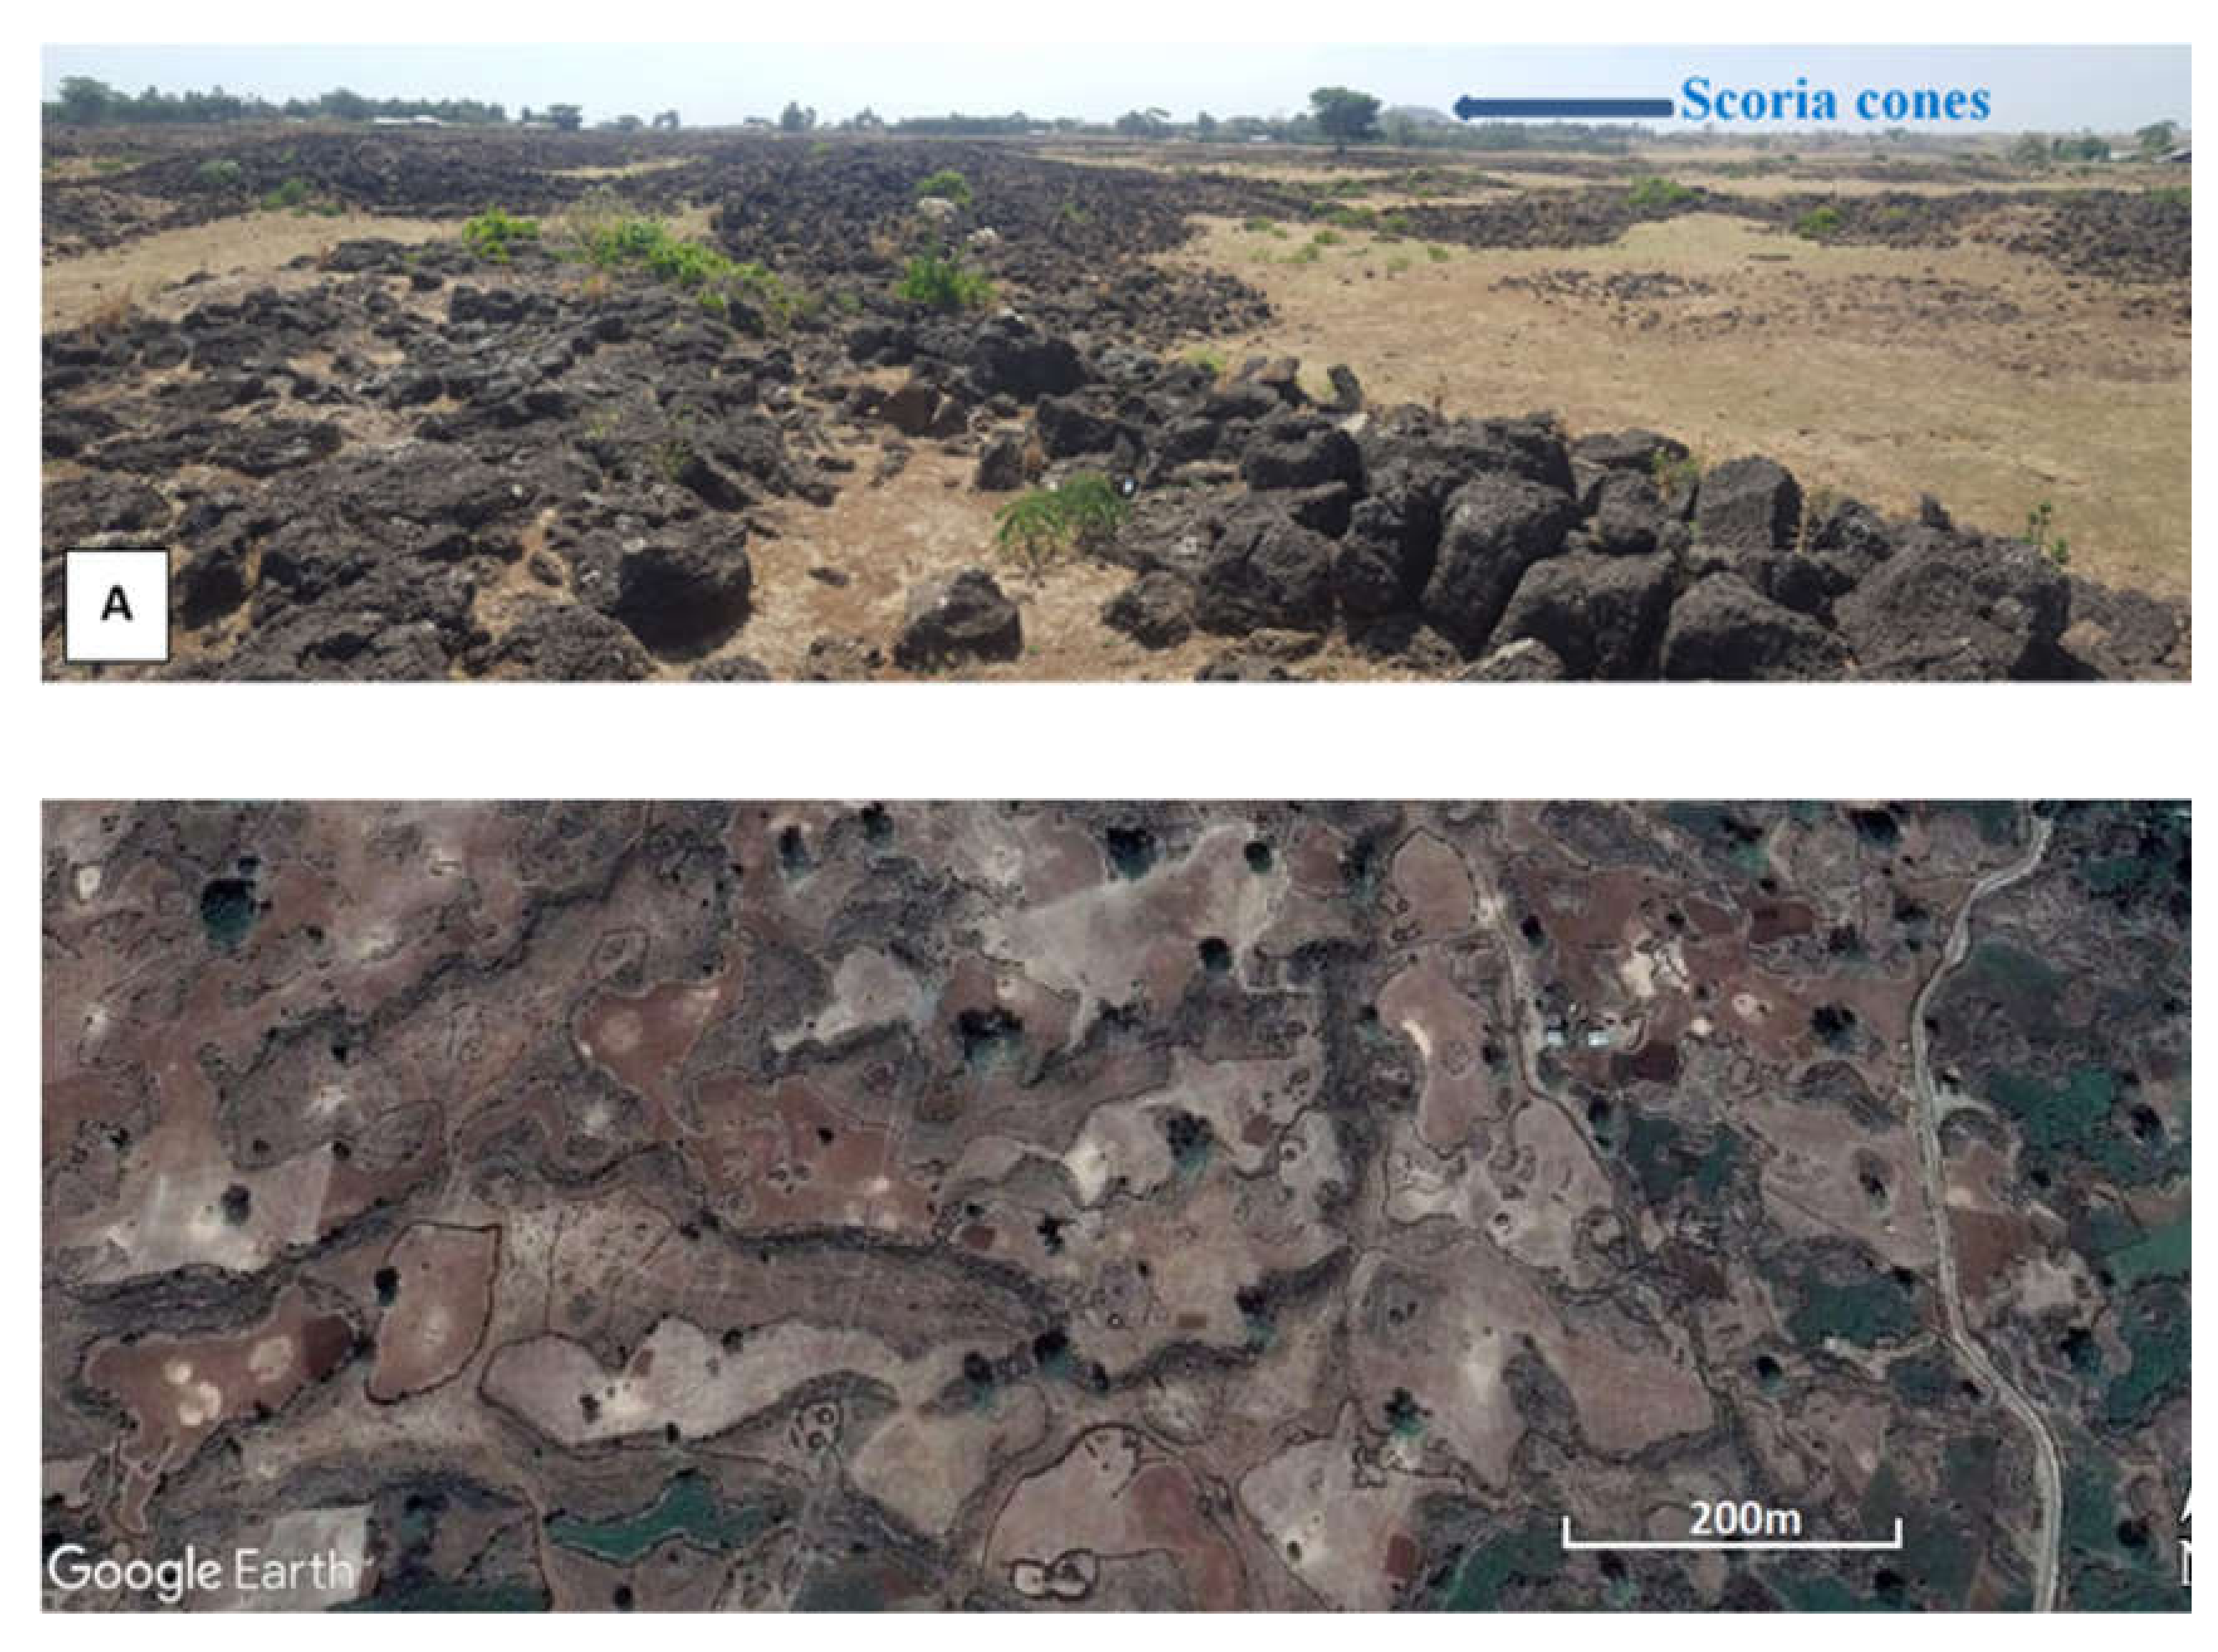
4.1. Geology of the Infranz Catchment
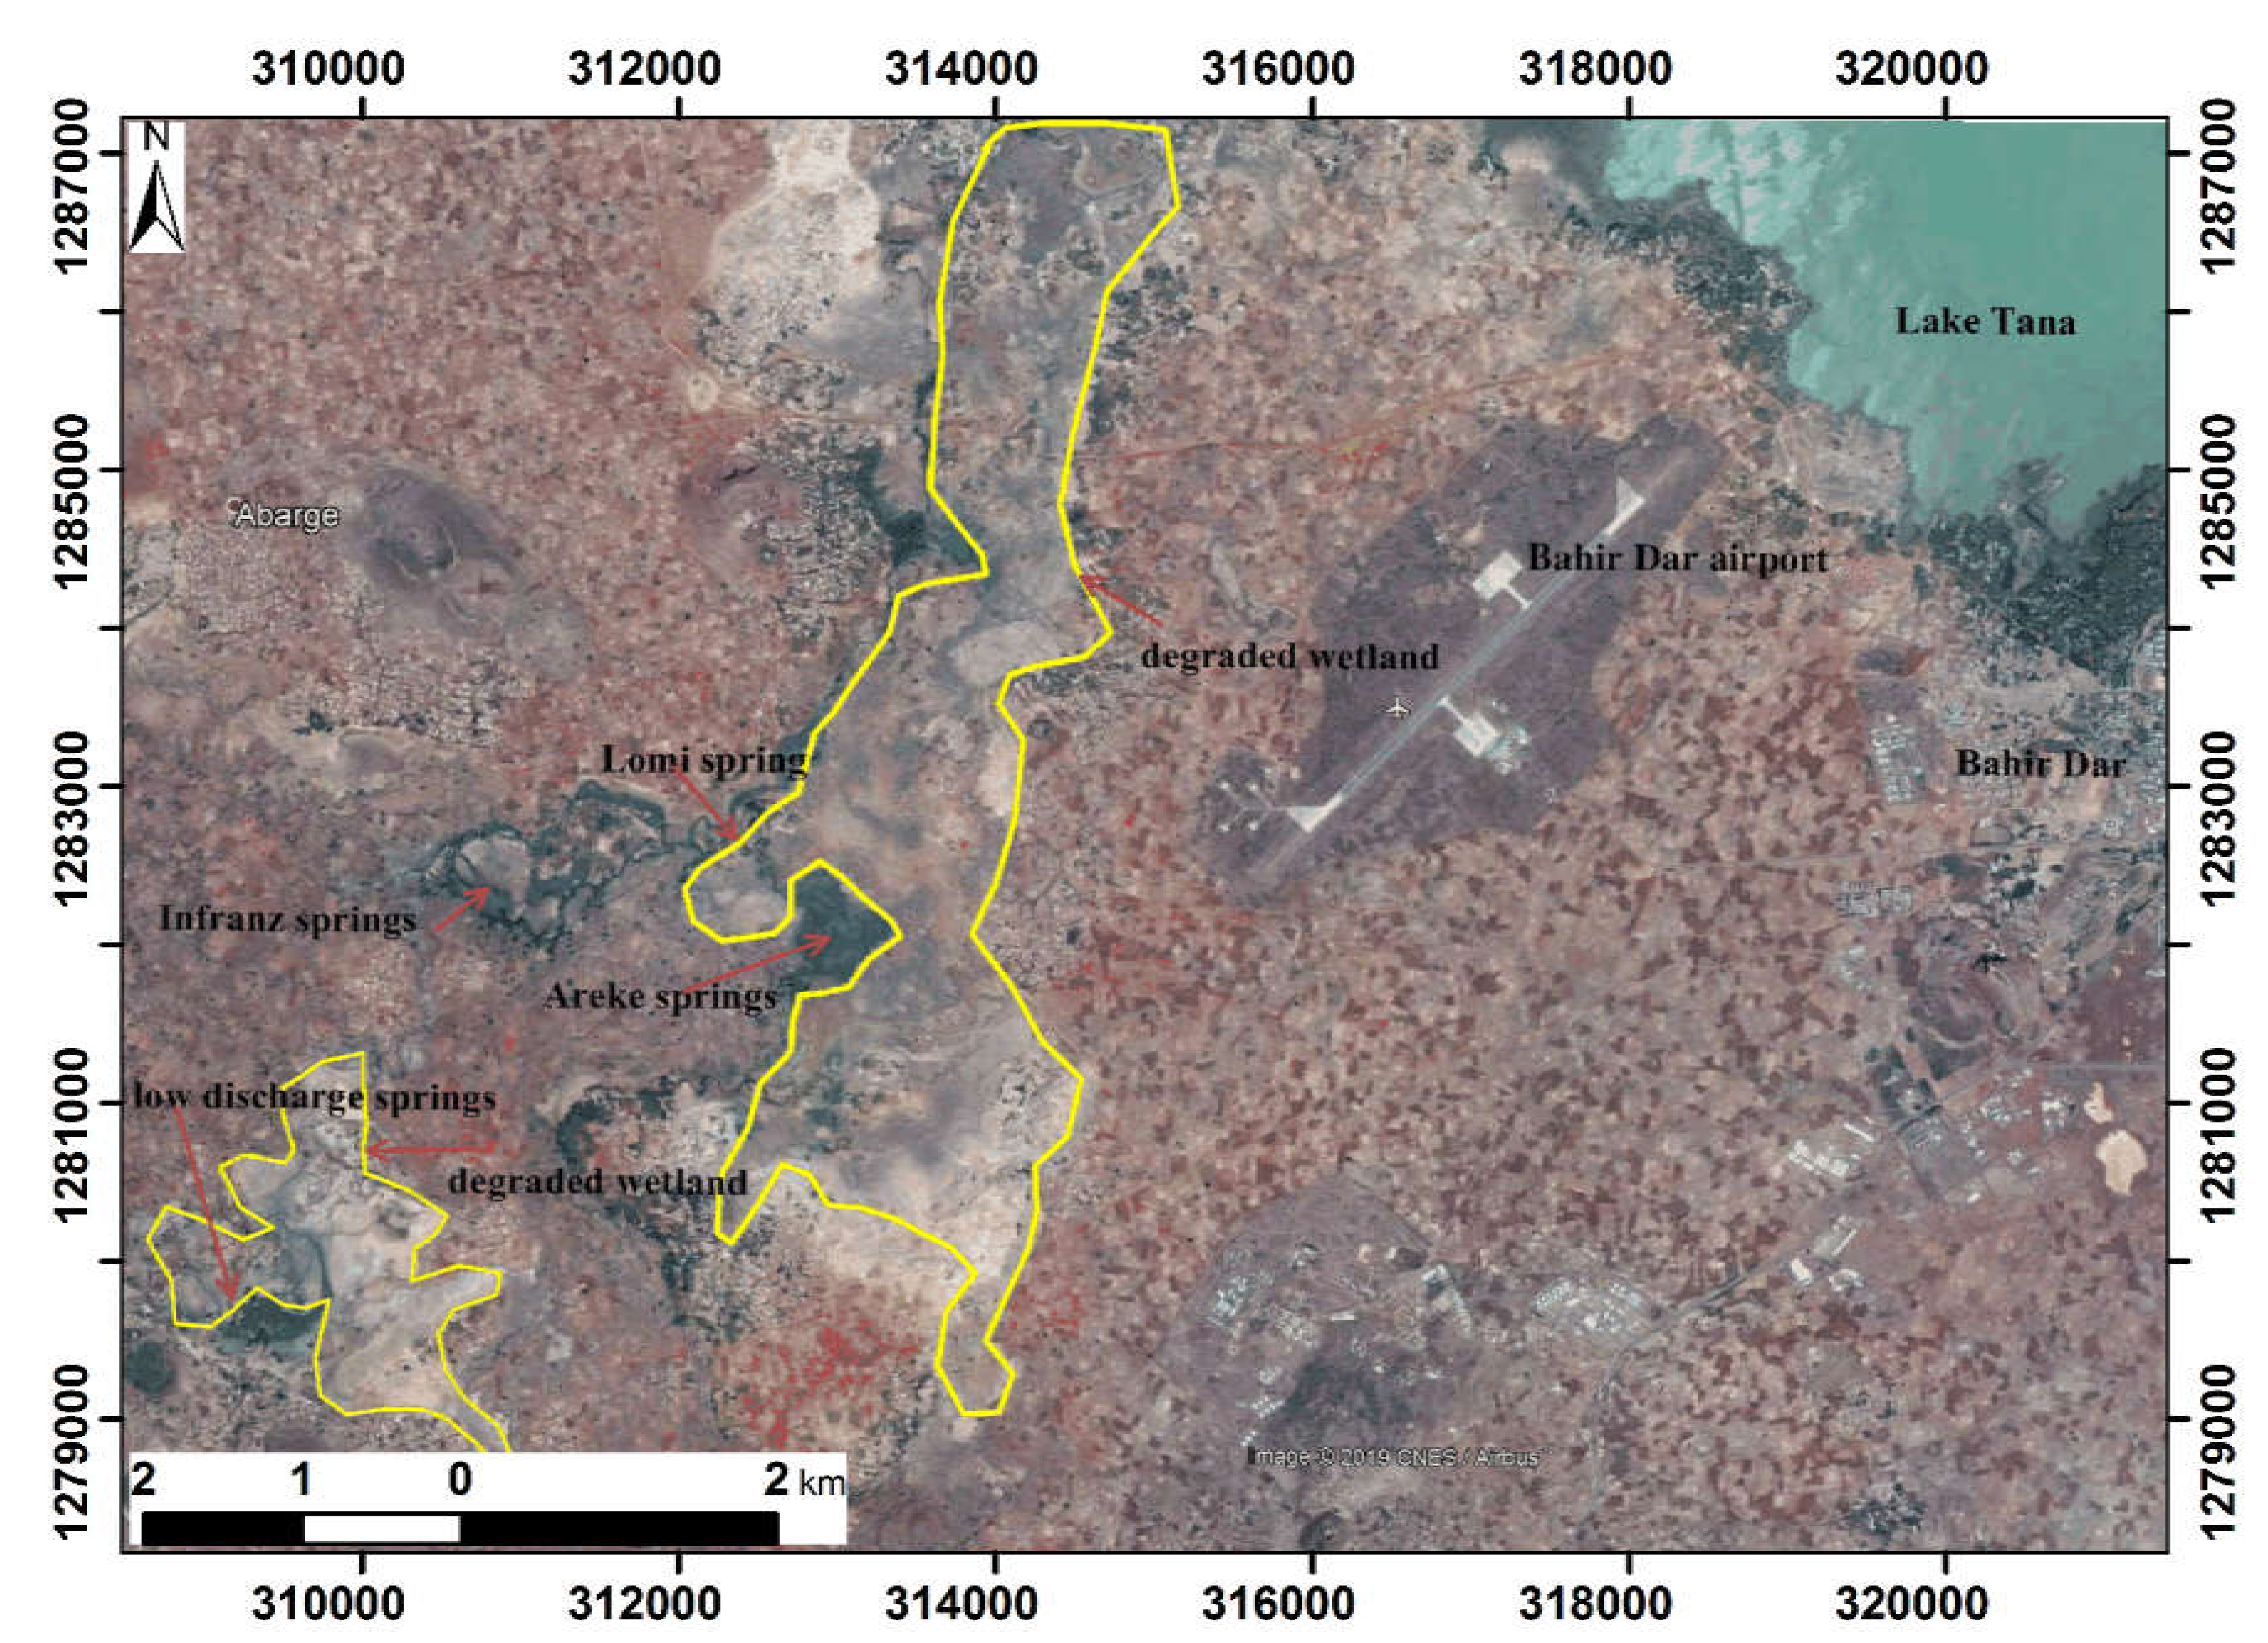
4.2. Springs Occurrence and Relationship with the Wetland System
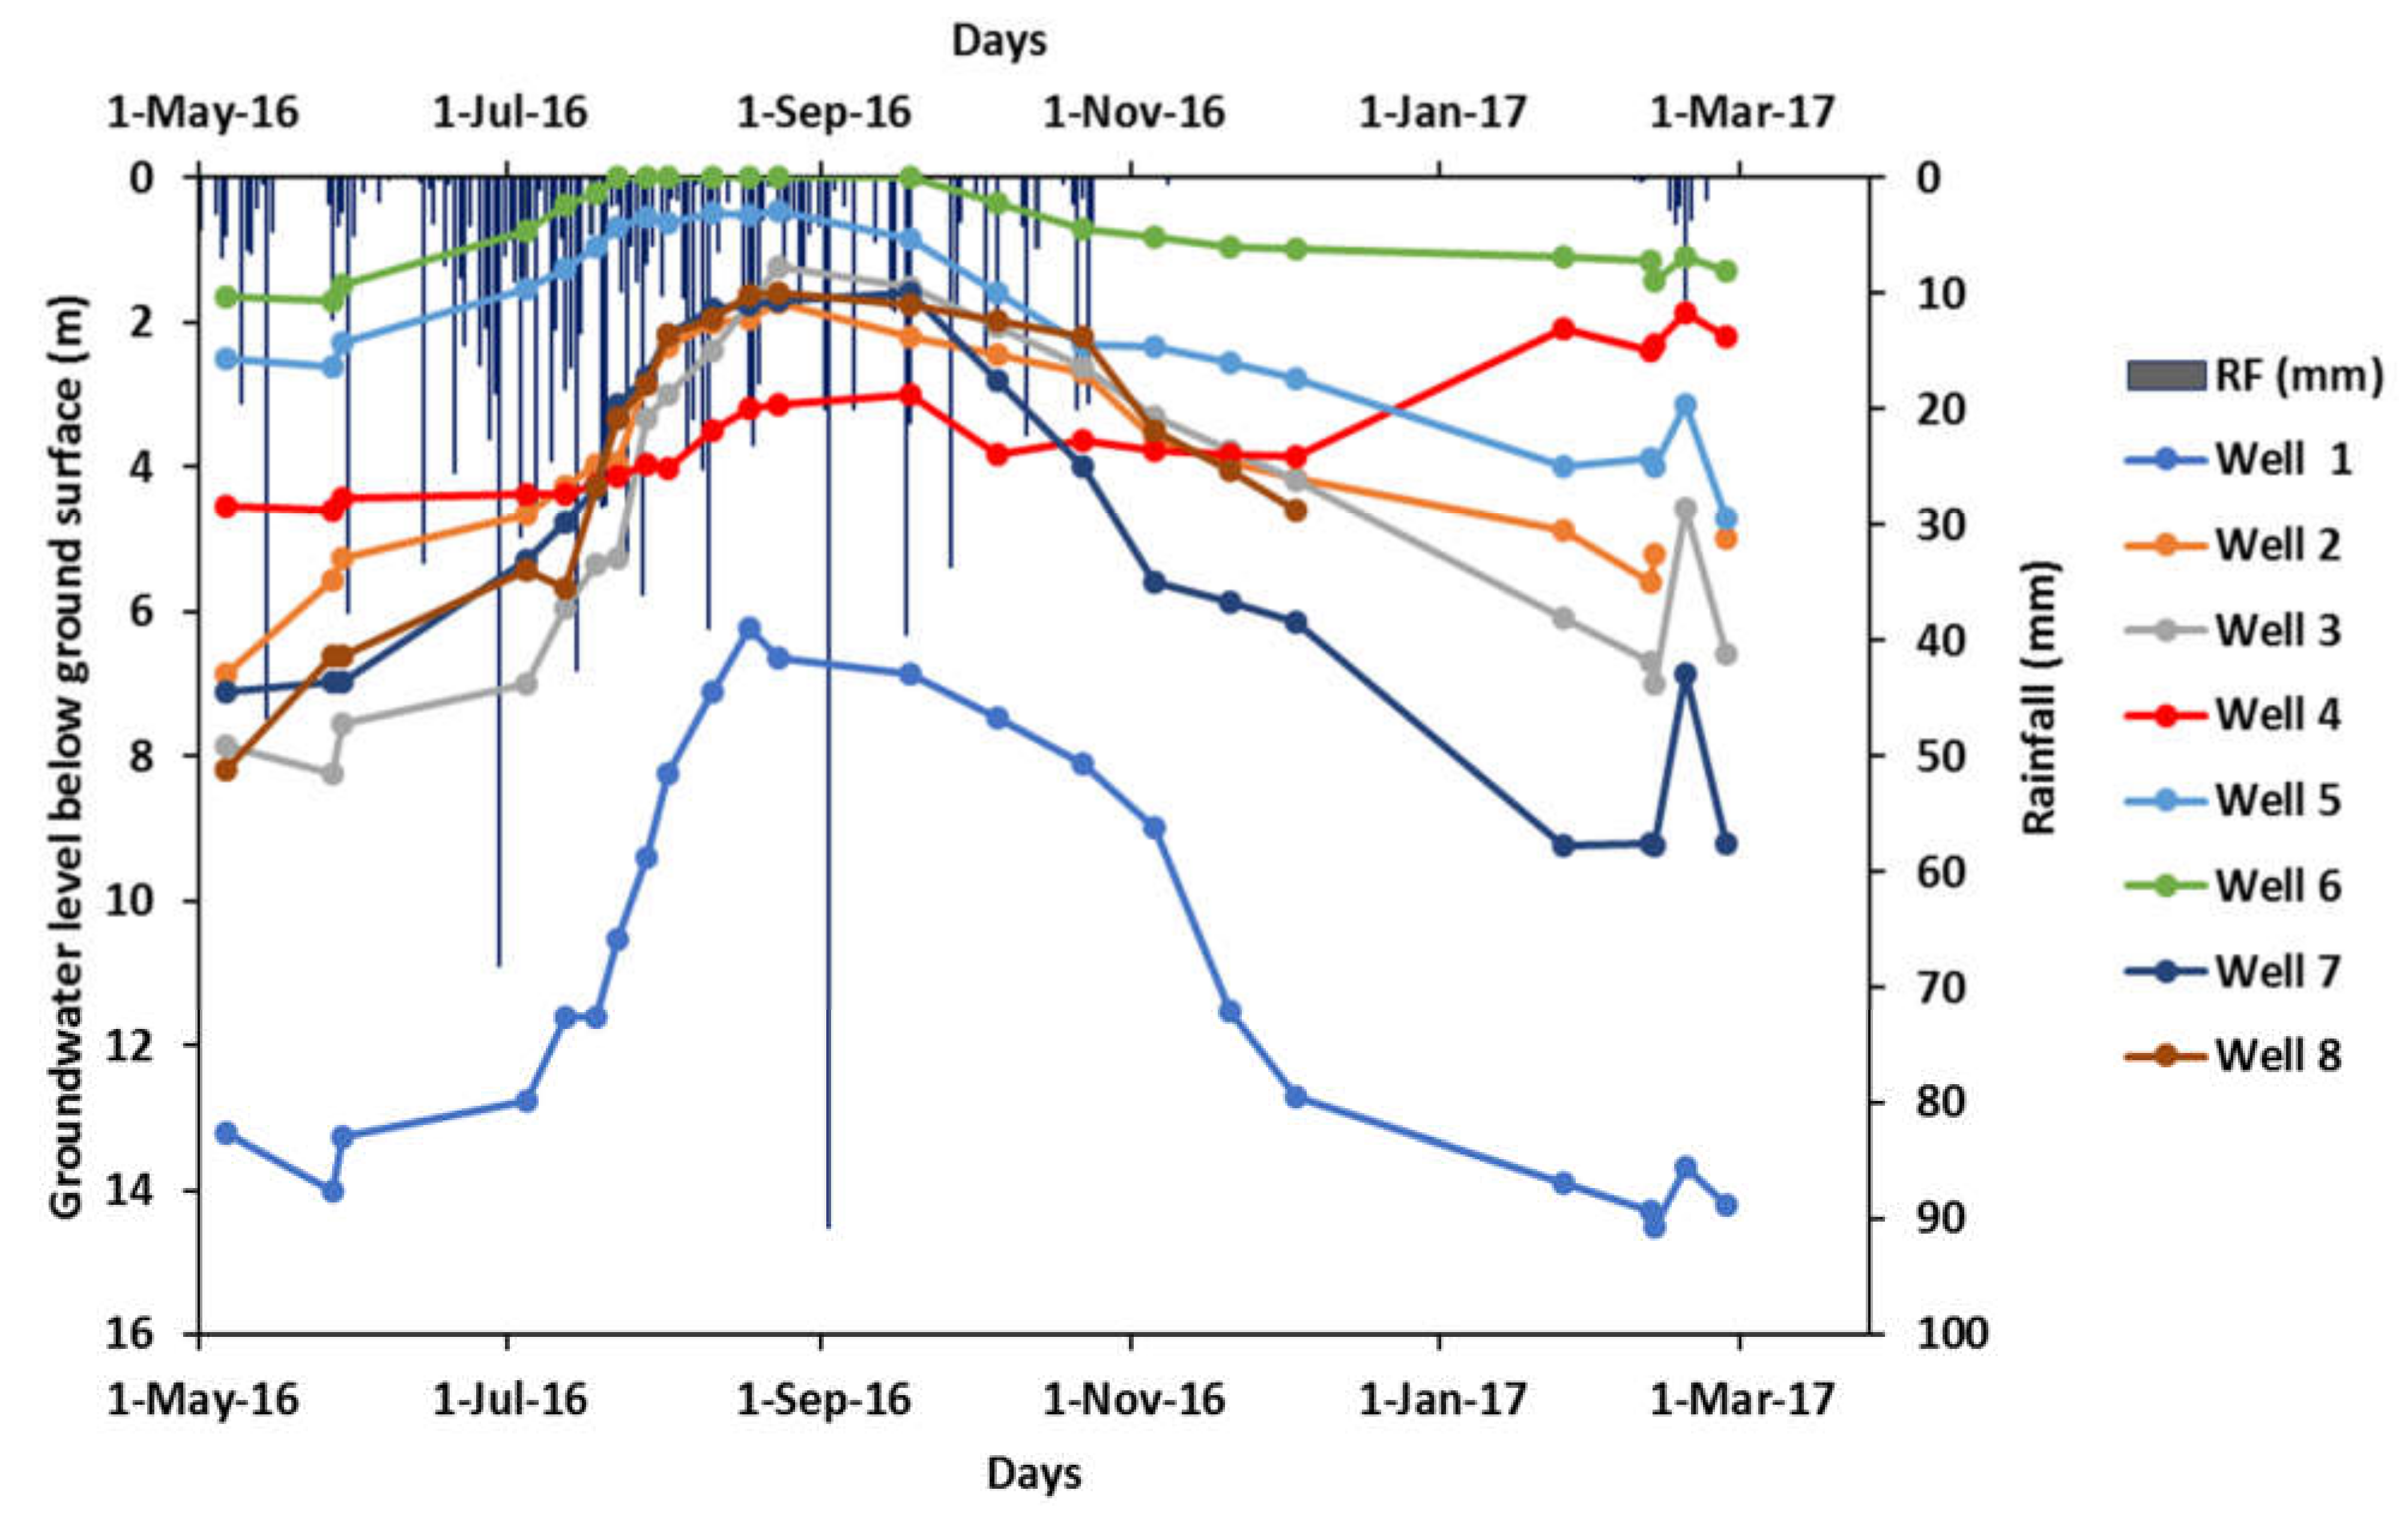
4.3. Groundwater Level Monitoring
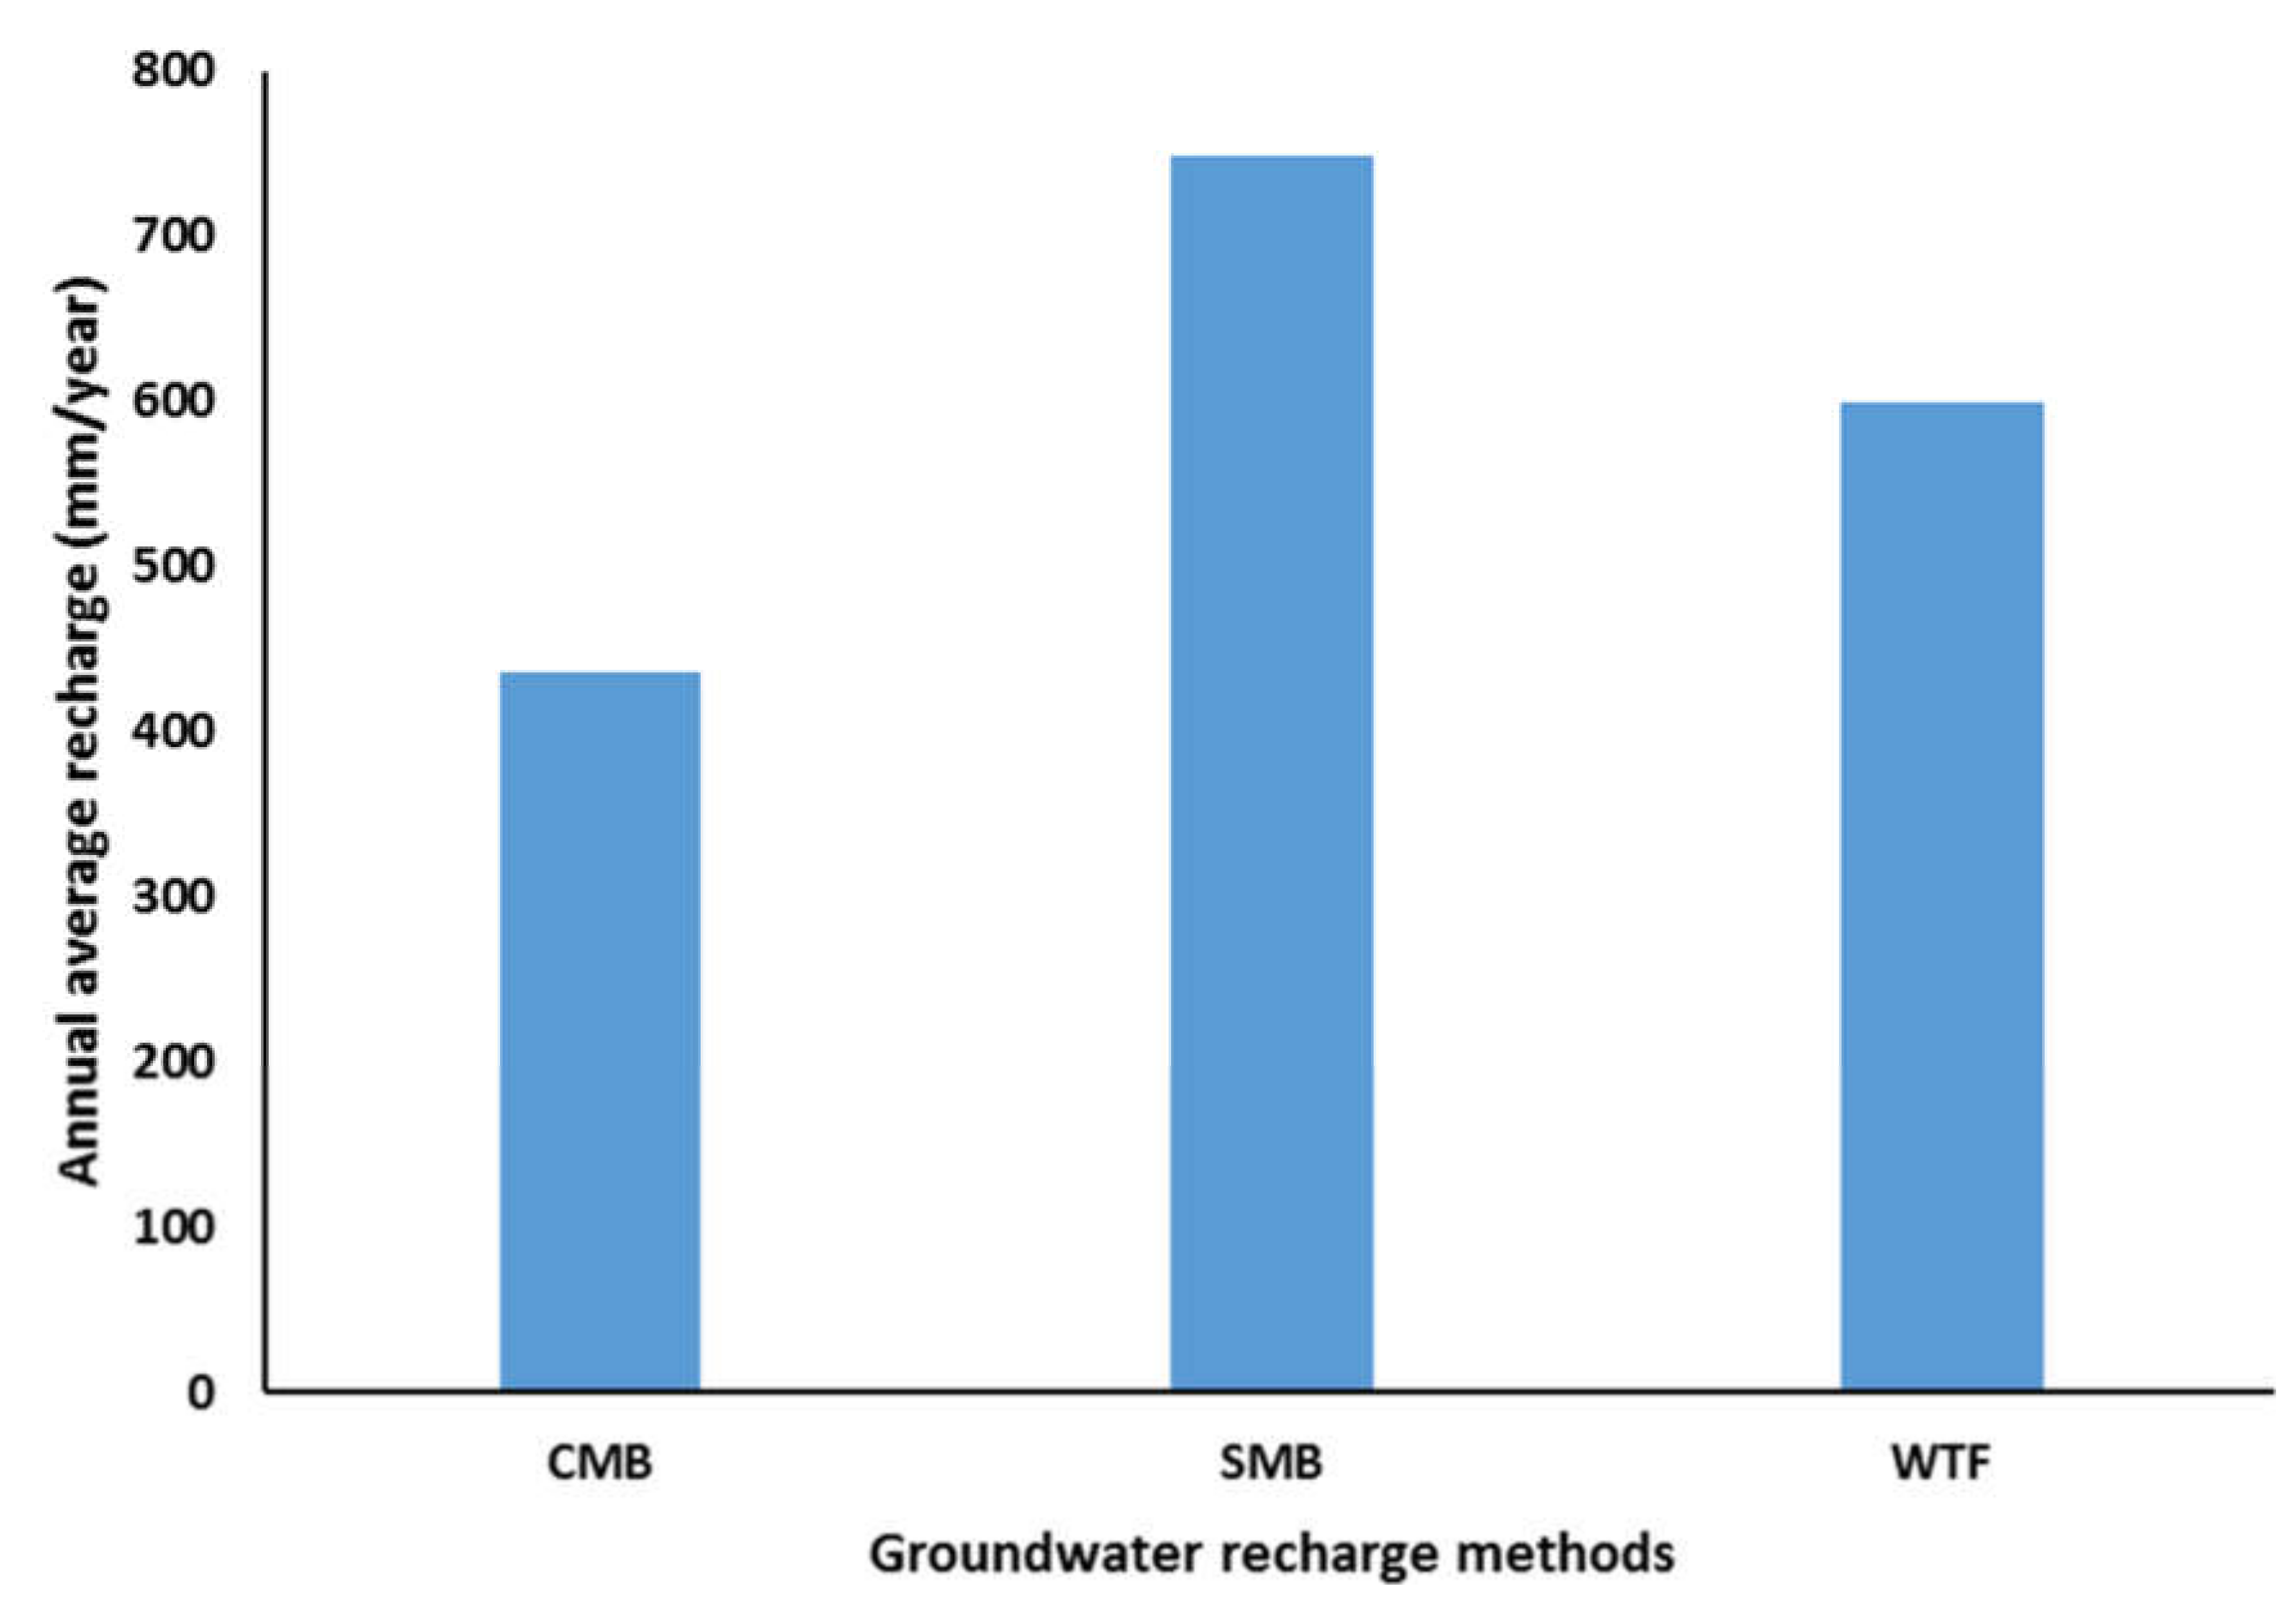
4.4. Groundwater Recharge
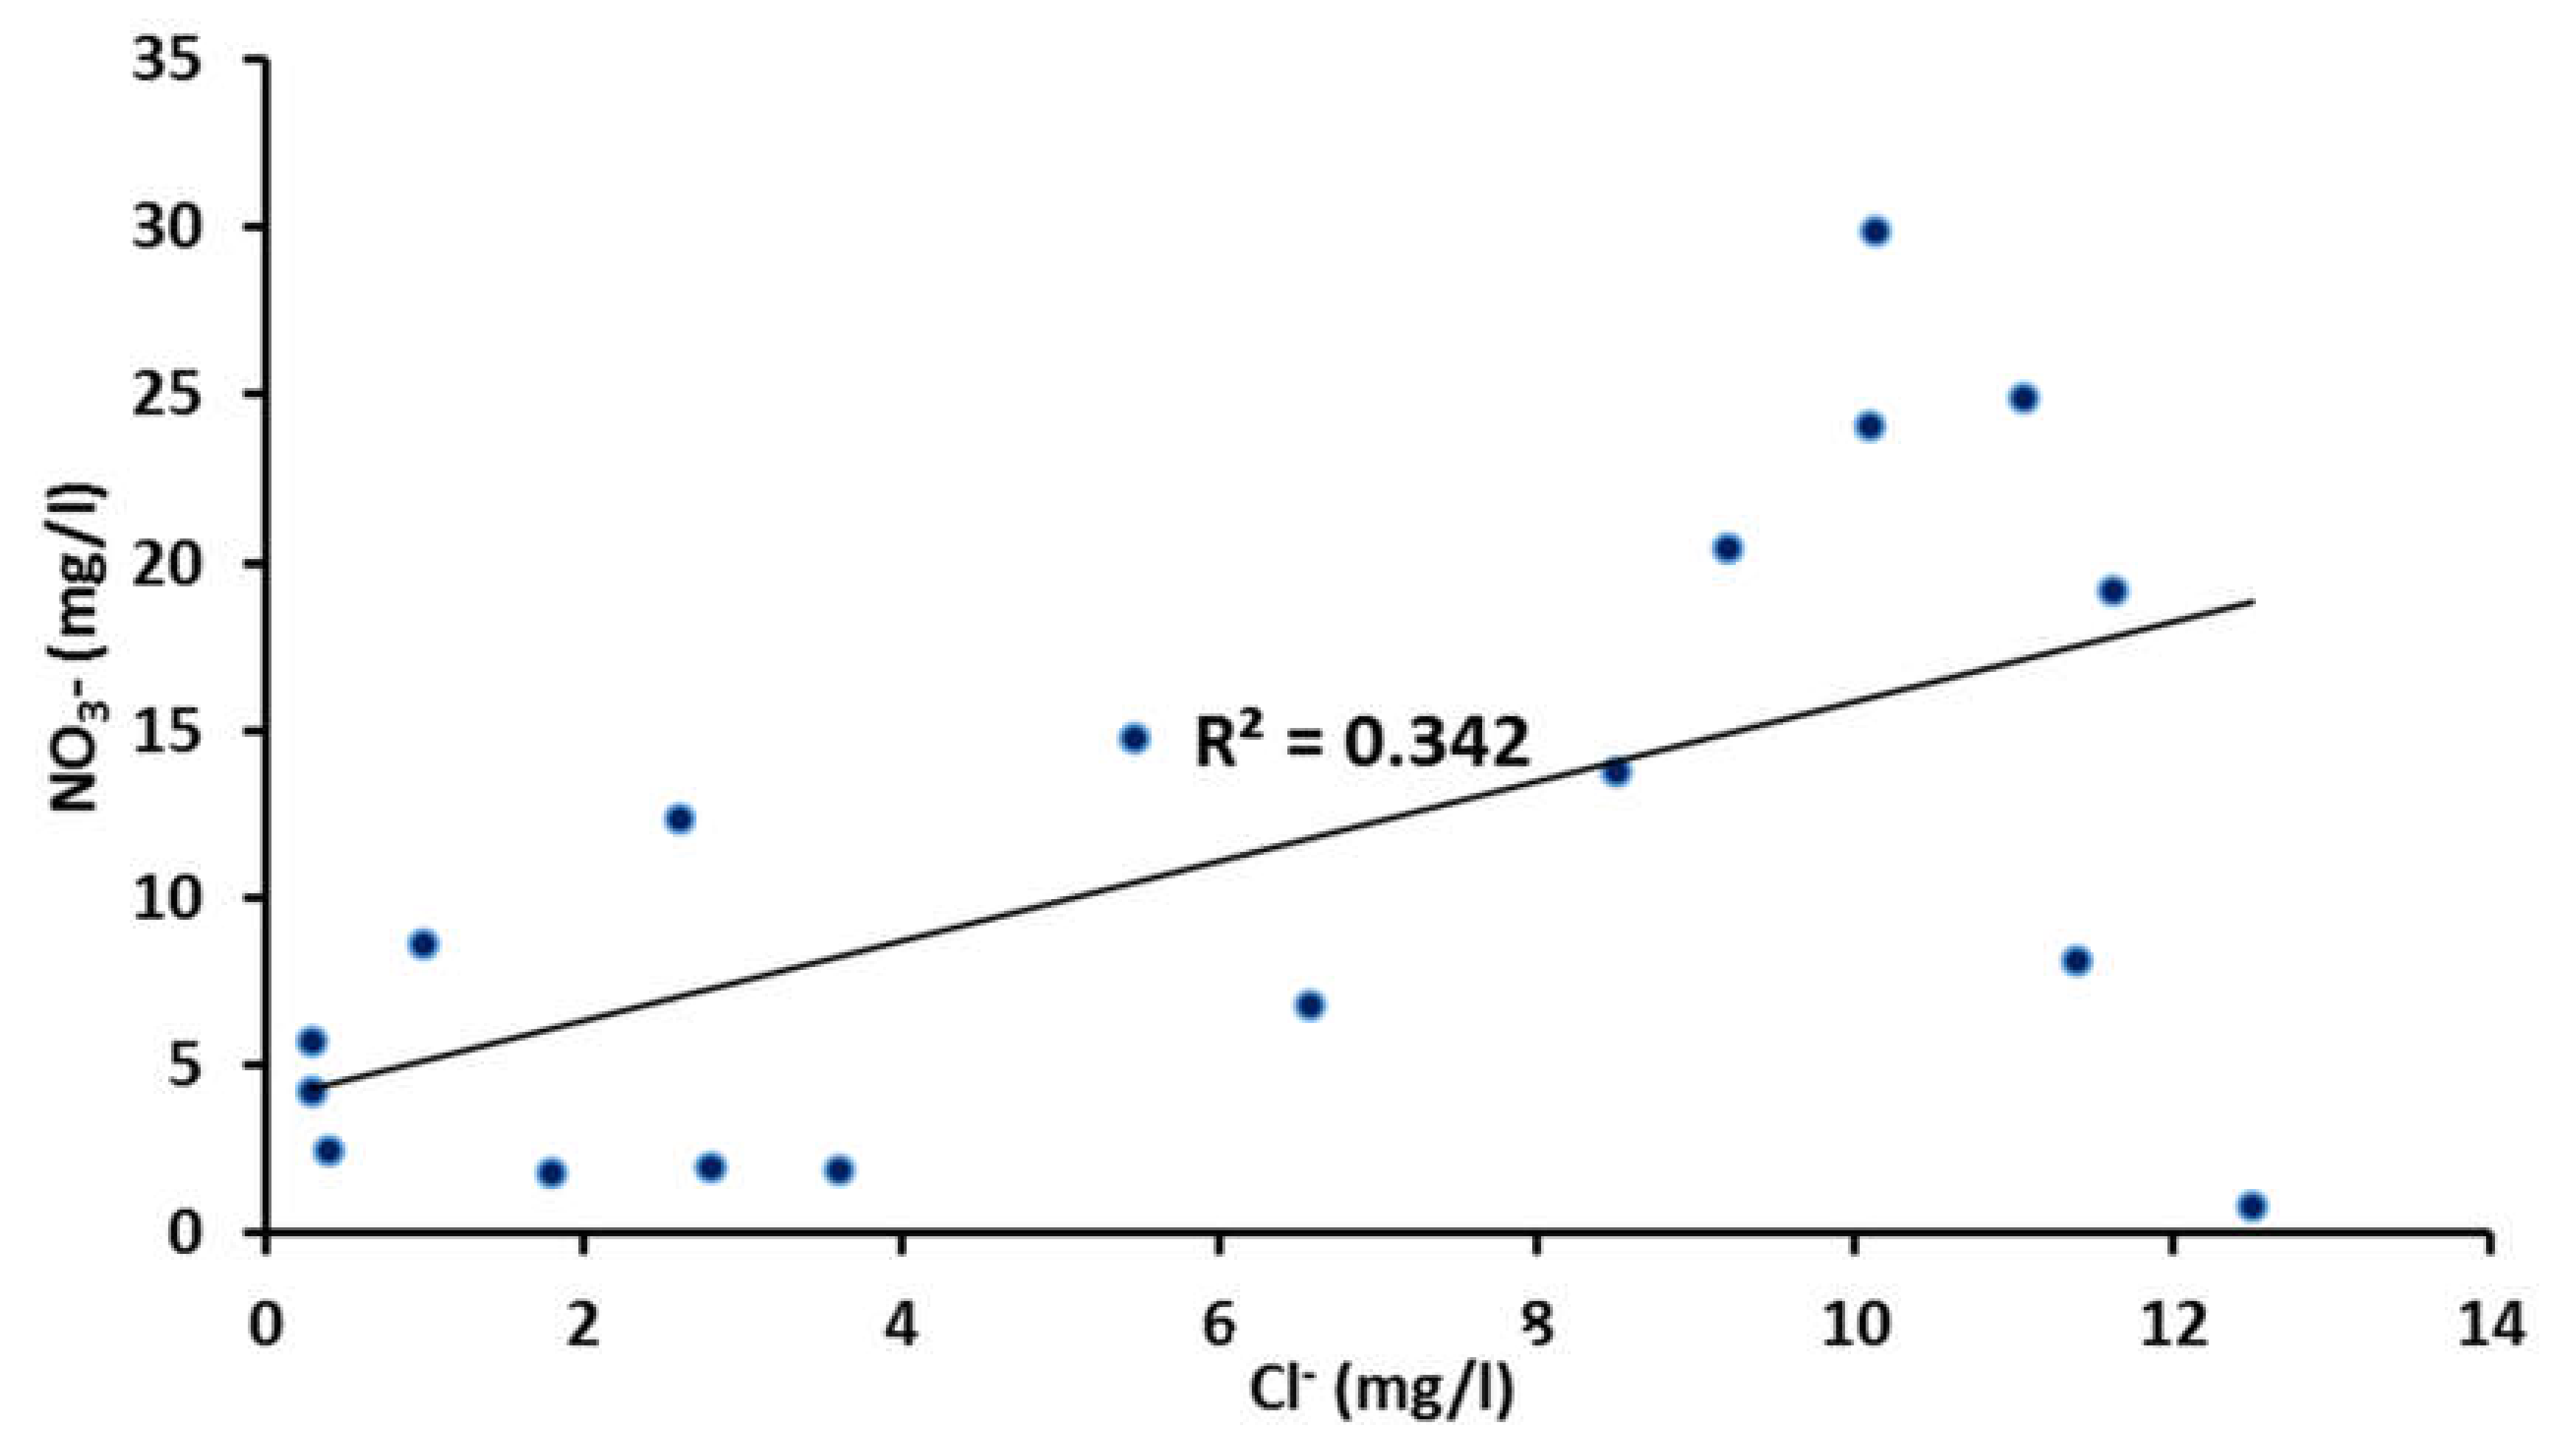
4.4.1. Groundwater Recharge from Chloride Mass Balance (CMB) Method
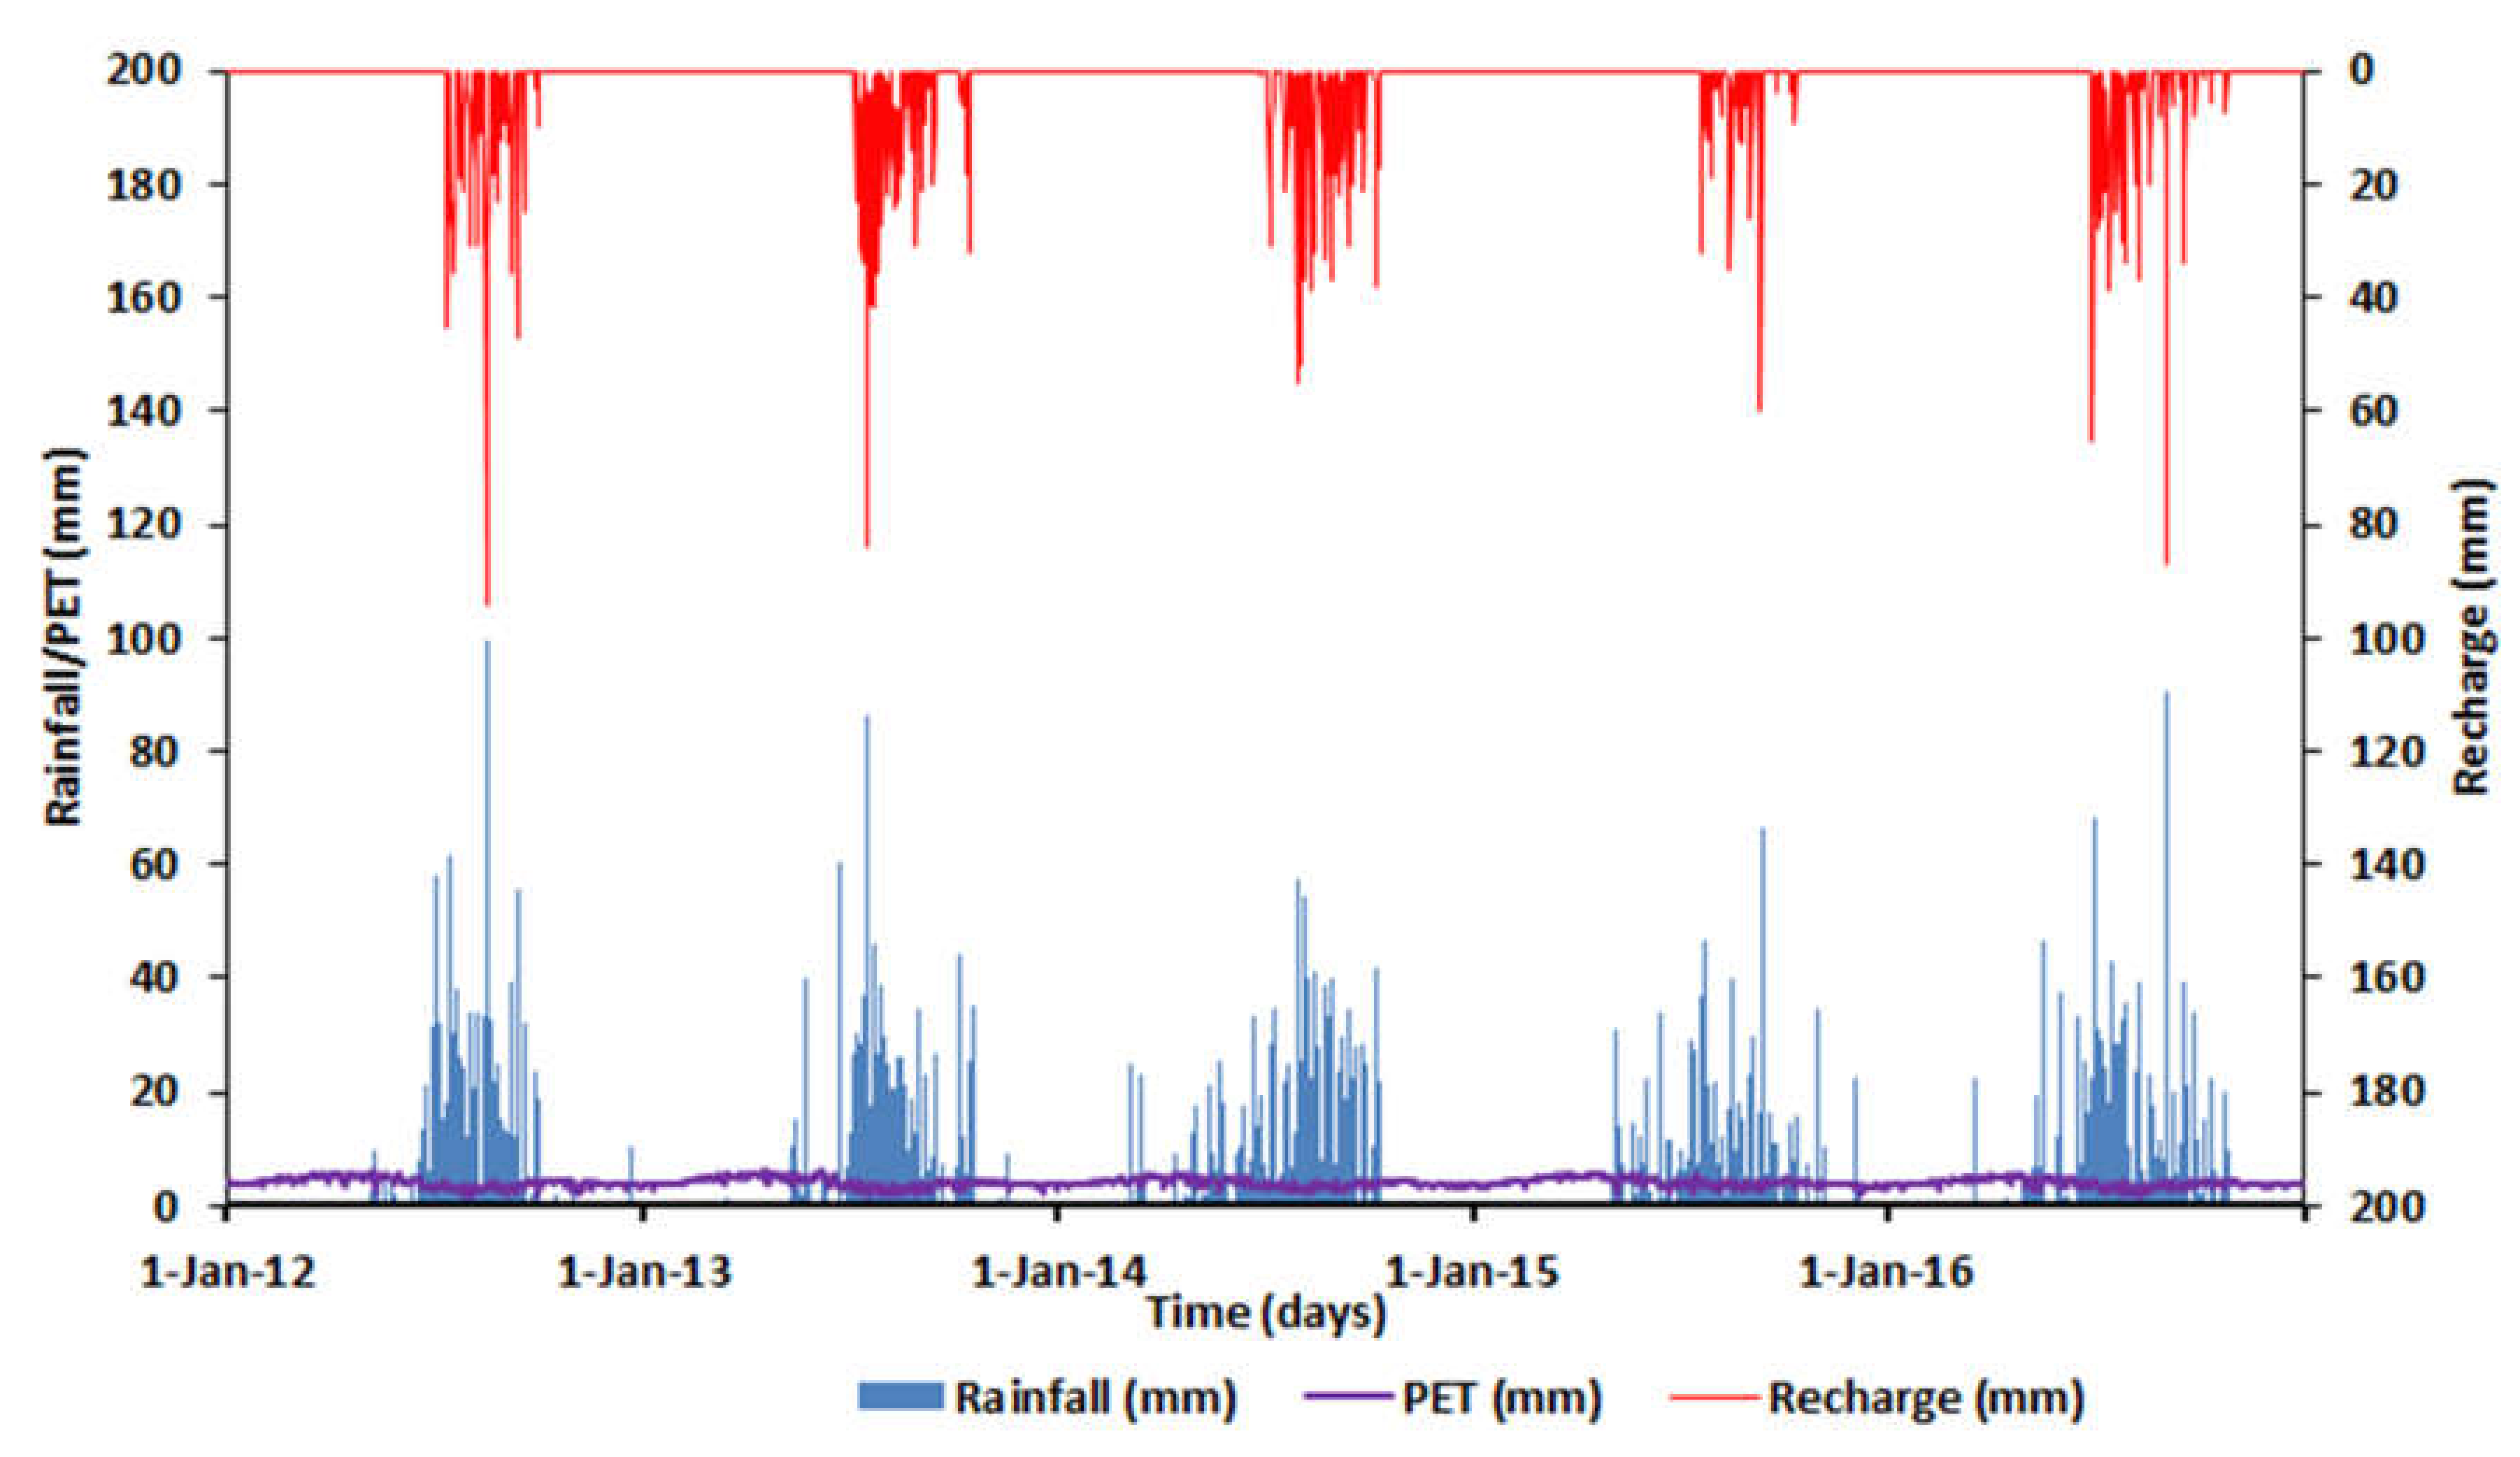
4.4.2. Groundwater Recharge from Soil Moisture Balance (SMB) Method
4.4.3. Groundwater Recharge Estimation by Water Table Fluctuation (WTF) Method
4.5. Conceptual Hydrologic/Hydrogeologic Model and Sources of Recharge to the Springs
5. Conclusions
Author Contributions
Funding
Acknowledgments
Conflicts of Interest
References
- Jakeman, A.J.; Barreteau, O.; Rinaudo, R.J.H.J. Integrated Groundwater Management Concepts. Jakeman, A.J., Barreteau, O., Rinaudo, R.J.H.J., Ross, A., Eds.; Springer Nature: Berlin Heidelberg, Germany, 2016; ISBN 9783319235752. [Google Scholar]
- Melesse, A.M.; Abtew, W.; Setegn, S.G. Nile River Basin: Ecohydrological challenges, climate change and hydropolitics. Springer: Berlin, Germany, 2013; pp. 1–718. [Google Scholar]
- Kebede, S. Groundwater in Ethiopia: Features, numbers and opportunities; Springer-Verlag: Berlin, Germany, 2012; ISBN 9783642303906. [Google Scholar]
- Freeze, R.A.; Cherry, J.A. Groundwater, 1st ed.; Prentice Hall: Englewood Cliffs, NJ, USA, 1979. [Google Scholar]
- De Vries, J.J.; Simmers, I. Groundwater recharge: An overview of processes and challenges. Hydrogeol. J. 2002, 10, 5–17. [Google Scholar] [CrossRef]
- Rushton, K.R.; Ward, C. The estimation of groundwater recharge. J. Hydrol. Eng. 1979, 41, 345–361. [Google Scholar] [CrossRef]
- Todd, D.K.; Mays, L.W. Groundwater Hydrology, 3rd ed.; John Wiley & Sons Inc.: Hoboken, NJ, USA, 2005; ISBN 0-471-45254-8. [Google Scholar]
- Demlie, M. Assessment and estimation of groundwater recharge for a catchment located in highland tropical climate in central Ethiopia using catchment soil – water balance ( SWB ) and chloride mass balance ( CMB ) techniques. Env. Earth Sci 2015, 74, 1137–1150. [Google Scholar] [CrossRef]
- Kulkarni, H.; Deolankar, S.B.; Lalwani, A.; Joseph, B.; Pawar, S. Hydrogeological framework of the Deccan basalt groundwater systems, west-central India. Hydrogeol. J. 2000, 8, 368–378. [Google Scholar] [CrossRef]
- Jefferson, A.; Grant, G.; Rose, T. Influence of volcanic history on groundwater patterns on the west slope of the Oregon High Cascades. Water Resour. Res. 2006, 42, 1–15. [Google Scholar] [CrossRef] [Green Version]
- Nigate, F. Investigating the Hydrogeological System of the Lake Tana Basin in the Northwestern Highlands of Ethiopia (the Upper Blue Nile). Ph.D. Thesis, Ghent University, Ghent, Belgium, 2019. [Google Scholar]
- Peterson, F.L. Water Development on Tropic Volcanic Islands—Type Example: Hawaii. Groundwater 1972, 10, 18–23. [Google Scholar] [CrossRef]
- Tropics Consulting Engineers. Bahir Dar Town Water Supply and Sanitation Project Feasibility Study. Report, Bahir Dar; Tropics Consulting Engineers P.L.C.: Addis Ababa, Ethiopia, 2012. [Google Scholar]
- Abiye, T.A.; Kebede, S. The role of geodiversity on the groundwater resource potential in the upper Blue Nile River Basin, Ethiopia. Environ. Earth Sci. 2011, 64, 1283–1291. [Google Scholar] [CrossRef]
- Nigate, F.; Van Camp, M.; Kebede, S.; Walraevens, K. Hydrologic interconnection between the volcanic aquifer and springs, Lake Tana basin on the Upper Blue Nile. J. African Earth Sci. 2016, 121. [Google Scholar] [CrossRef]
- Awintis, J. Hydrogeological Study of the Infranz Catchment in Lake Tana basin, Ethiopia. Master’s Thesis, Ghent University, Ghent, Belgium, 2017. [Google Scholar]
- Van Landtschoote, A. Hydrogeological investigation and recharge estimation of Gumera river catchment in Lake Tana basin, northern Ethiopia. Master’s Thesis, Ghent University, Ghent, Belgium, 2017. [Google Scholar]
- Dessie, M.G. Hydrogeological investigation and groundwater recharge estimation of the Rib river catchment, Lake Tana Basin, upper Blue Nile, Ethiopia, MSc. Thesis, Ghent University, Ghent, Belgium, 2017. [Google Scholar]
- Nigate, F.; Ayenew, T.; Belete, W.; Walraevens, K. Overview of the Hydrogeology and Groundwater Occurrence in the Lake Tana Basin. In Social and Ecological System Dynamics: Characteristics, Trends, and Integration in the Lake Tana Basin, Ethiopia; Stave, K., Goshu, G., Aynalem, S., Eds.; Springer: Cham, Switzerland, 2017; pp. 77–91. ISBN 9783319457550. [Google Scholar]
- Kebede, S.; Travi, Y.; Alemayehu, T.; Ayenew, T. Groundwater recharge, circulation and geochemical evolution in the source region of the Blue Nile River, Ethiopia. Appl. Geochemistry 2005, 20, 1658–1676. [Google Scholar] [CrossRef]
- Kebede, S.; Admasu, G.; Travi, Y. Isotopes in environmental and health studies estimating ungauged catchment flows from Lake Tana floodplains, Ethiopia: An isotope hydrological approach. Isotopes Environ. Health Stud. 2011, 47, 37–41. [Google Scholar] [CrossRef]
- Hadush, G. Groundwater Contribution and Recharge Estimation in the Upper Blue Nile flows, Ethiopia. Master’s Thesis, ITC, Enschede, The Netherlands, 2008. [Google Scholar]
- Mengistu, S. Numerical Groundwater Flow Modeling of the Lake Tana Basin, Upper Nile, Ethiopia. Ph.D. Thesis, Addis Ababa University, Addis Ababa, Ethiopia, 2010. [Google Scholar]
- Ministry of water resources. Detailed groundwater investigation & monitoring in Tana and Beles basin; Ministry of water resources: Addis Ababa, Ethiopia, 2013. [Google Scholar]
- SMEC. Hydrological study of the Tana-Beles basin: Groundwater investigation; Ministry of water, Irrigation and energy: Addis Ababa, Ethiopia, 2008. [Google Scholar]
- Mamo, S. Integrated Hydrological and Hydrogeological System Analysis of the Lake Tana Basin, Northwestern Ethiopia. Ph.D Thesis, Addis Ababa University, Addis Ababa, Ethiopia, 2015. [Google Scholar]
- Kebede, S.; Travi, Y.; Alemayehu, T.; Marc, V. Water balance of Lake Tana and its sensitivity to fluctuations in rainfall, Blue Nile basin, Ethiopia. J. Hydrol. 2006, 316, 233–247. [Google Scholar] [CrossRef]
- Abbate, E.; Bruni, P.; Ferretti, M.P.; Delmer, C.; Laurenzi, M.A.; Hagos, M.; Bedri, O.; Rook, L.; Sagri, M.; Libsekal, Y. The East Africa Oligocene intertrappean beds: Regional distribution, depositional environments and Afro/Arabian mammal dispersals. J. African Earth Sci. 2014, 99, 463–489. [Google Scholar] [CrossRef]
- Ethiopian Institute of Geological Surveys. Explanation of Geological Map of Ethiopia; Geological Survey of Ethiopia: Addis Ababa, Ethiopia, 1996. [Google Scholar]
- Kieffer, B.; Arndt, N.; Bastien, F.; Bosch, D.; Pecher, A.; Yirgu, G.; Ayalew, D.; Weis, D.; Jerram, D.A.; Keller, F.; et al. Flood and Shield Basalts from Ethiopia: Magmas from the African Superswell. J. Petrol. 2004, 45, 793–834. [Google Scholar] [CrossRef]
- Prave, A.R.; Bates, C.R.; Donaldson, C.H.; Toland, H.; Condon, D.J.; Mark, D.; Raub, T.D. Geology and geochronology of the Tana Basin, Ethiopia: LIP volcanism, Super eruptions and Eocene-Oligocene environmental change. Earth Planet. Sci. Lett. 2016, 443, 1–8. [Google Scholar] [CrossRef] [Green Version]
- Ministry of Water Resources. BCEOM Abay River Basin integrated master plan, main report. Ministry of Water Resources: Addis Ababa, Ethiopia, 1999. [Google Scholar]
- Tóth, J. A Theoretical Analysis of Groundwater Flow in Small A Theoretical Analysis of Groundwater Flow in Small Drainage Basins. J. Geophys. Res. 1963, 68, 4795–4812. [Google Scholar] [CrossRef]
- Lerner, D.N.; Issa, A.S.; Simmers, I. Groundwater Recharge: A guide to Understanding and Estimating Natural Recharge; American Society of Agronomy: Madison, WI, USA, 1990. [Google Scholar]
- Meinzer, O.E. Outline of ground-water hydrology. US Geol. Surv. Water Supply Pap. 1923, 494. [Google Scholar]
- Wood, W.W. Use and misuse of the chloride mass balance method in estimating in groundwater recharge. Ground Water 1999, 37, 2–3. [Google Scholar] [CrossRef]
- Healy, R.W. Estimating Groundwater Recharge; Cambridge University press: Cambridge, CA, USA, 2010; ISBN 978-0-511-79768-2. [Google Scholar]
- Eriksson, E.; Khunakasem, V. Chloride concentrations in groundwater, recharge rate and rate of deposition of chloride in the Israel coastal plain. J. Hydrol. 1969, 7, 178–197. [Google Scholar] [CrossRef]
- Ting, C.; Kereh, T.; Liao, C. Estimation of groundwater recharge using the chloride mass-balance method, Pingtung Plain, Taiwan. Hydrogeol. J. 1998, 6, 282–292. [Google Scholar] [CrossRef]
- Rushton, K.R.; Eilers, V.H.M.; Carter, R.C. Improved soil moisture balance methodology for recharge estimation. J. Hydrol. 2006, 318, 379–399. [Google Scholar] [CrossRef]
- Thornthwaite, C.W.; Mather, J.R. Instructions and Tables for Computing Potential Evapotranspiration and Water Balance. Publ. Climatol. 1957, 10, 183–311. [Google Scholar]
- Crabtree, R.W.; Trudgill, S.T. Hillslope hydrochemistry and stream response on a wooded, permeable bedrock: The role of stemflow. J. Hydrol. 1985, 80, 161–178. [Google Scholar] [CrossRef]
- Steenhuis, T.S.; Van Der Molen, W.H. The TM procedure as a simple engineering method to predict recharge. J. Hydrol. 1986, 84, 221–229. [Google Scholar] [CrossRef]
- Dripps, W.R.; Bradbury, K.R. A simple daily soil-water balance model for estimating the spatial and temporal distribution of groundwater recharge in temperate humid areas. Hydrogeol. J. 2007, 15, 433–444. [Google Scholar] [CrossRef]
- Maréchal, J.C.; Dewandel, B.; Ahmed, S.; Galeazzi, L.; Zaidi, F.K. Combined estimation of specific yield and natural recharge in a semi-arid groundwater basin with irrigated agriculture. J. Hydrol. 2006, 329, 281–293. [Google Scholar] [CrossRef] [Green Version]
- Sophocleous, M.A. Combining the soil water balance and water-level fluctuation methods to estimate natural groundwater recharge: Practical aspects. J. Hydrol. 1991, 124, 229–241. [Google Scholar] [CrossRef]
- Allen, R.G.; Pereira, L.S.; Raes, D.; Smith, M.; Ab, W. Crop Evapotranspiration - Guidelines for Computing Crop Water Requirements; FAO Irrigation and drainage paper 56; FAO: Rome, Italy, 1998; pp. 1–15. [Google Scholar]
- Healy, R.W.; Cook, P.G. Using groundwater levels to estimate recharge. Hydrogeol. J. 2002, 10, 91–109. [Google Scholar] [CrossRef]
- Moon, S.K.; Woo, N.C.; Lee, K.S. Statistical analysis of hydrographs and water-table fluctuation to estimate groundwater recharge. J. Hydrol. 2004, 292, 198–209. [Google Scholar] [CrossRef]
- Crosbie, R.S.; Binning, P.; Kalma, J.D. A time series approach to inferring groundwater recharge using the water table fluctuation method. Water Resour. Res. 2005, 41, 1–9. [Google Scholar] [CrossRef]
- Jepsen, D.H.; Athearn, M.J. A General Geological Map of the Blue Nile River Basin, Ethiopia (1: 1,000,000). Department of Water. Resources: Addis Ababa, Ethiopia, 1961. [Google Scholar]
- Chorowicz, J.; Collet, B.; Bonavia, F.F.; Mohr, P.; Parrot, J.F.; Korme, T. The Tana basin, Ethiopia: Intra-plateau uplift, rifting and subsidence. Tectonophysics 1998, 295, 351–367. [Google Scholar] [CrossRef]
- Sewnet, A. Land use/ cover change at Infranz watershed, Northwestern Ethiopia. J. Landsc. Ecol. 2015, 8, 69–83. [Google Scholar] [CrossRef] [Green Version]
- Edmunds, W.M.; Darling, W.G.; Kinniburgh, D.G.; Kotoub, S.; Mahgoub, S. Sources of recharge at Abu Delaig, Sudan. J. Hydrol. 1992, 131, 1–24. [Google Scholar] [CrossRef]
- Edmunds, W.M.; Gaye, C.B. Estimating the spatial variability of groundwater recharge in the Sahel using chloride. J. Hydrol. 1994, 156, 47–59. [Google Scholar] [CrossRef]
- Ayenew, T.; Demlie, M.; Wohnlich, S. Hydrogeological framework and occurrence of groundwater in the Ethiopian aquifers. J. African Earth Sci. 2008, 52, 97–113. [Google Scholar] [CrossRef]
- Belcher, W.R.; Elliott, P.E.; Geldon, A.L. Hydraulic-Property Estimates for Use With a Transient Ground-Water Flow Model of the Death Valley Regional Ground-Water Flow System, Nevada and California; USGS: Reston, VA, USA, 2001.
- Walker, D.; Parkin, G.; Gowing, J.; Haile, A.T. Development of a Hydrogeological Conceptual Model for Shallow Aquifers in the Data Scarce Upper Blue Nile Basin. Hydrology 2019, 6, 43. [Google Scholar] [CrossRef] [Green Version]
- Hagedorn, B.; El-Kadi, A.I.; Mair, A.; Whittier, R.B.; Ha, K. Estimating recharge in fractured aquifers of a temperate humid to semiarid volcanic island (Jeju, Korea) from water table fluctuations, and Cl, CFC-12 and 3H chemistry. J. Hydrol. 2011, 409, 650–662. [Google Scholar] [CrossRef]
- Hahn, J.; Lee, Y.; Kim, N.; Hahn, C.; Lee, S. The groundwater resources and sustainable yield of Cheju volcanic island, Korea. Environ. Geol. 1997, 33, 43–53. [Google Scholar] [CrossRef]
- Nicolas, W.D.; Shade, P.J.; Hunt, C.D.J. Summary of the Oahu, Hawaii, Regional Aquifer-System Analysis; U.S. Geological Survey: Denver, CO, USA, 1996.


© 2020 by the authors. Licensee MDPI, Basel, Switzerland. This article is an open access article distributed under the terms and conditions of the Creative Commons Attribution (CC BY) license (http://creativecommons.org/licenses/by/4.0/).
Share and Cite
Nigate, F.; Van Camp, M.; Yenehun, A.; Belay, A.S.; Walraevens, K. Recharge–Discharge Relations of Groundwater in Volcanic Terrain of Semi-Humid Tropical Highlands of Ethiopia: The Case of Infranz Springs, in the Upper Blue Nile. Water 2020, 12, 853. https://doi.org/10.3390/w12030853
Nigate F, Van Camp M, Yenehun A, Belay AS, Walraevens K. Recharge–Discharge Relations of Groundwater in Volcanic Terrain of Semi-Humid Tropical Highlands of Ethiopia: The Case of Infranz Springs, in the Upper Blue Nile. Water. 2020; 12(3):853. https://doi.org/10.3390/w12030853
Chicago/Turabian StyleNigate, Fenta, Marc Van Camp, Alemu Yenehun, Ashebir Sewale Belay, and Kristine Walraevens. 2020. "Recharge–Discharge Relations of Groundwater in Volcanic Terrain of Semi-Humid Tropical Highlands of Ethiopia: The Case of Infranz Springs, in the Upper Blue Nile" Water 12, no. 3: 853. https://doi.org/10.3390/w12030853