Article

Hydrochemical Characteristics of Groundwater and Dominant Water–Rock Interactions in the Delingha Area, Qaidam Basin, Northwest China

1
State Key Laboratory of Biogeology and Environmental Geology & MOE Key Laboratory of Groundwater Circulation and Environment Evolution, China University of Geosciences, Beijing 100083, China
2
School of Water Resources & Environment, China University of Geosciences, Beijing 100083, China
3
Institute of Karst Geology, Chinese Academy of Geological Sciences, Guilin 541004, China
4
China Aero Geophysical Survey and Remote Sensing Center for Natural Resources, Beijing 100083, China
*
Authors to whom correspondence should be addressed.
Water 2020, 12(3), 836; https://doi.org/10.3390/w12030836
Submission received: 19 February 2020 / Revised: 13 March 2020 / Accepted: 13 March 2020 / Published: 16 March 2020
(This article belongs to the Section Water Quality and Contamination)

Abstract

:
Groundwater is undoubtedly important for water supplies and eco-environment protection, especially for arid and semi-arid regions. Analyzing the characteristics and evolution of groundwater is significant for the rational management of groundwater resources. This study investigated the hydrogeochemical characteristics and evolutions of groundwater in the Delingha area, northeast of the Qaidam Basin, northwest China, with a total of 123 water samples, including 105 unconfined groundwater samples, 12 confined groundwater samples, and 6 surface water samples. Hydrochemical results showed that the unconfined and confined groundwater presented diversity in ion concentration. Total Dissolved Solids (TDS) of the unconfined groundwater increased from 146.5 to 8954 mg/L along the groundwater flow direction. The groundwater hydrochemical types were HCO3-Ca·Mg and HCO3·SO4-Ca·Mg in the mountain front area, SO4·HCO3-Ca·Mg and SO4·Cl-Ca·Mg types in the alluvial-lacustrine plain, and Cl·SO4-Na and Cl-Na types in the lacustrine plain. The saturation index showed that parts of the groundwater samples were supersaturated with carbonate minerals (calcite and dolomite); however, all the samples were undersaturated with evaporite minerals (halite and gypsum). Groundwater chemical evolution is mainly controlled by evaporite and carbonate mineral dissolutions, aluminosilicates weathering, and cation exchange.

1. Introduction

Water shortage has been a critical issue in many parts of the world, especially in arid and semi-arid areas [1,2,3,4]. Qaidam Basin, which is located in Northwest China, is a typical arid area [5]. Because of the lack of surface-water and precipitation, groundwater has been the main water resource in this area. Sustainable management of groundwater has become a critical issue for this area. Understanding the hydrochemical characteristics of the local groundwater could provide guidance for sustainable groundwater development [6].
The hydrochemistry of groundwater is generally regulated by precipitation, geological structure, rock type, residence time, and geochemical processes along the groundwater flow paths [7,8]. Recent studies for the groundwater of Qaidam area have focused on the recharge source, circulation, hydrochemical characteristics, and hydrochemical evolution of the local groundwater [4,5]. For example, a previous study discussed the hydrochemical characteristics, hydrochemical evolution, and recharge sources of groundwater in Nomhon area and Golmud area of the southern Qaidam Basin. This study concluded that the main recharge source of groundwater was the atmospheric precipitation and that ionic components were mainly derived from water–rock interactions [5]. And an isotopic study of the Glomud River and Nalingguole River illustrated the interaction relationship between surface-water and groundwater in an alluvial-proluvial fan and the groundwater recharge source from meteoric waters and mountain snowmelt [9]. Although those previous studies revealed the groundwater hydrochemistry mechanism in this arid area, there is no systematic research for discussing the pattern of groundwater mineral sources and hydrochemical evolution on a regional scale from the mountain recharge area to the lacustrine plain discharge region in Delingha.
This research mainly presents a hydrochemical investigation of groundwater in Delingha to determine the hydrochemical characteristics, mineral sources, and hydrochemical evolution along the groundwater flow path. The specific aims are as follows: (1) assessing the groundwater hydrochemical characteristics and groundwater quality, (2) revealing the dominating hydrochemical processes and mineral sources of the groundwater. The results of this study will be beneficial for understanding the groundwater hydrochemical evolution on a basin scale and for supporting the elaborate management of groundwater resources.

2. Materials and Methods

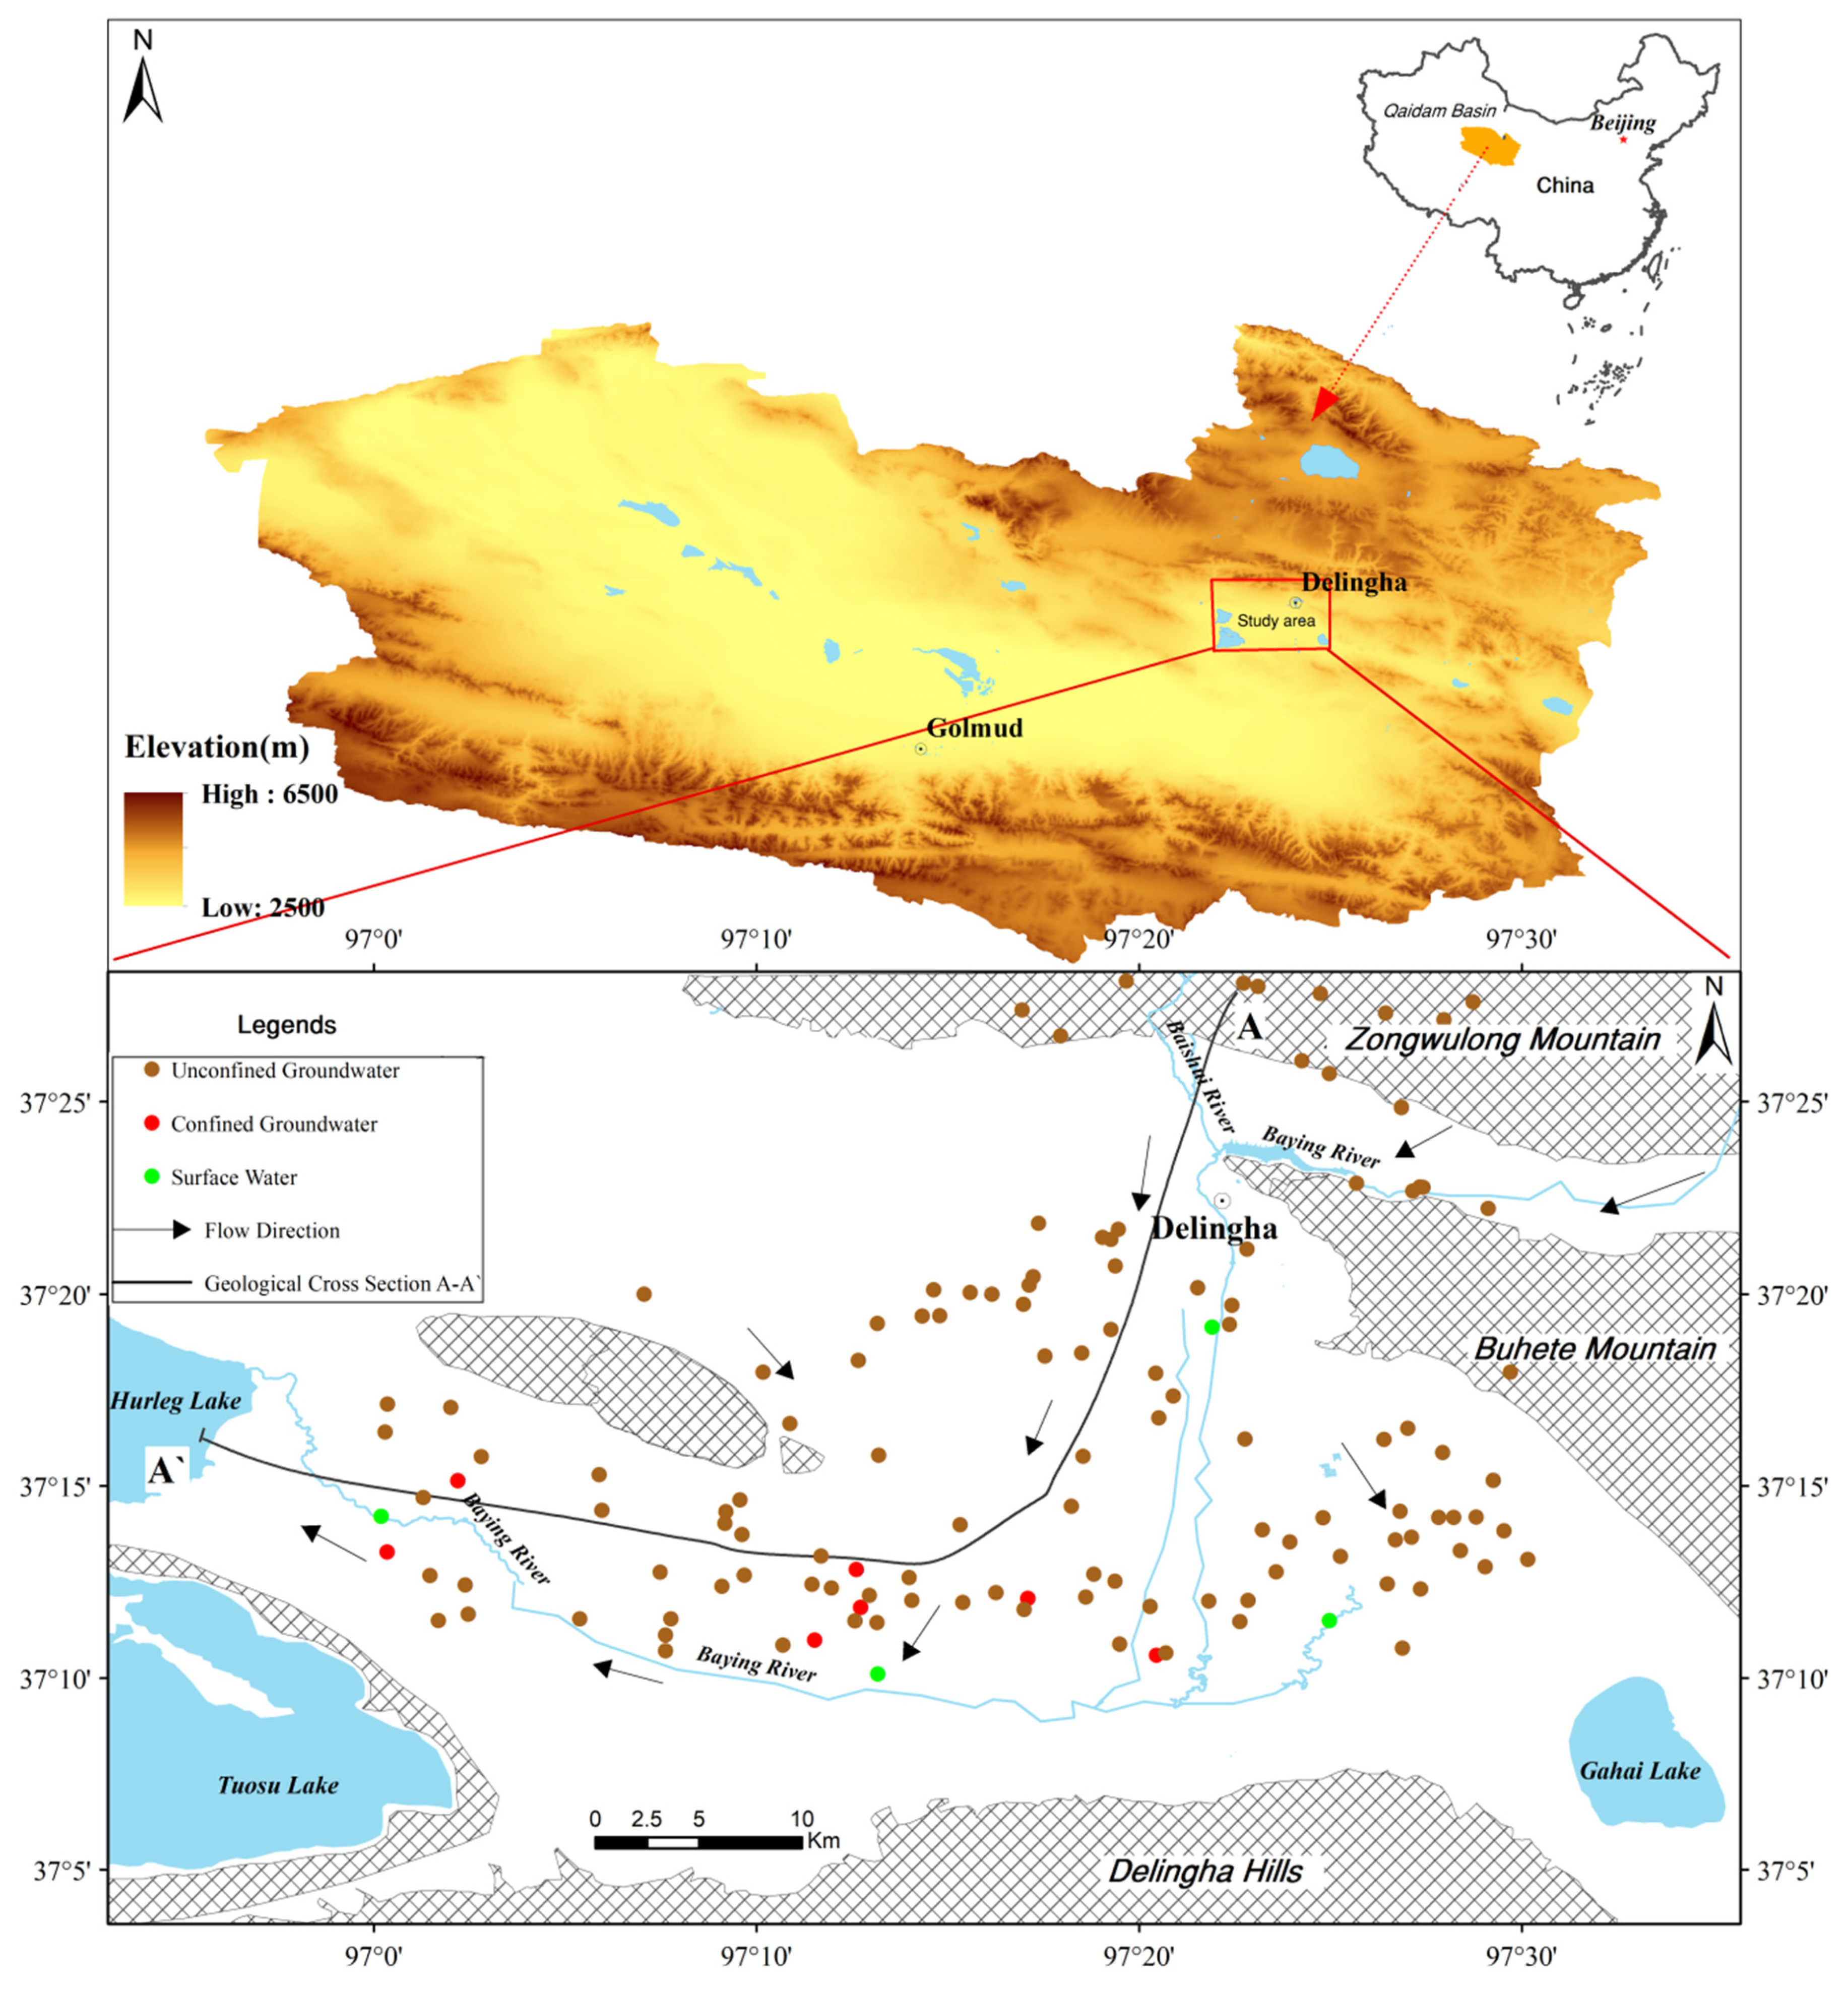
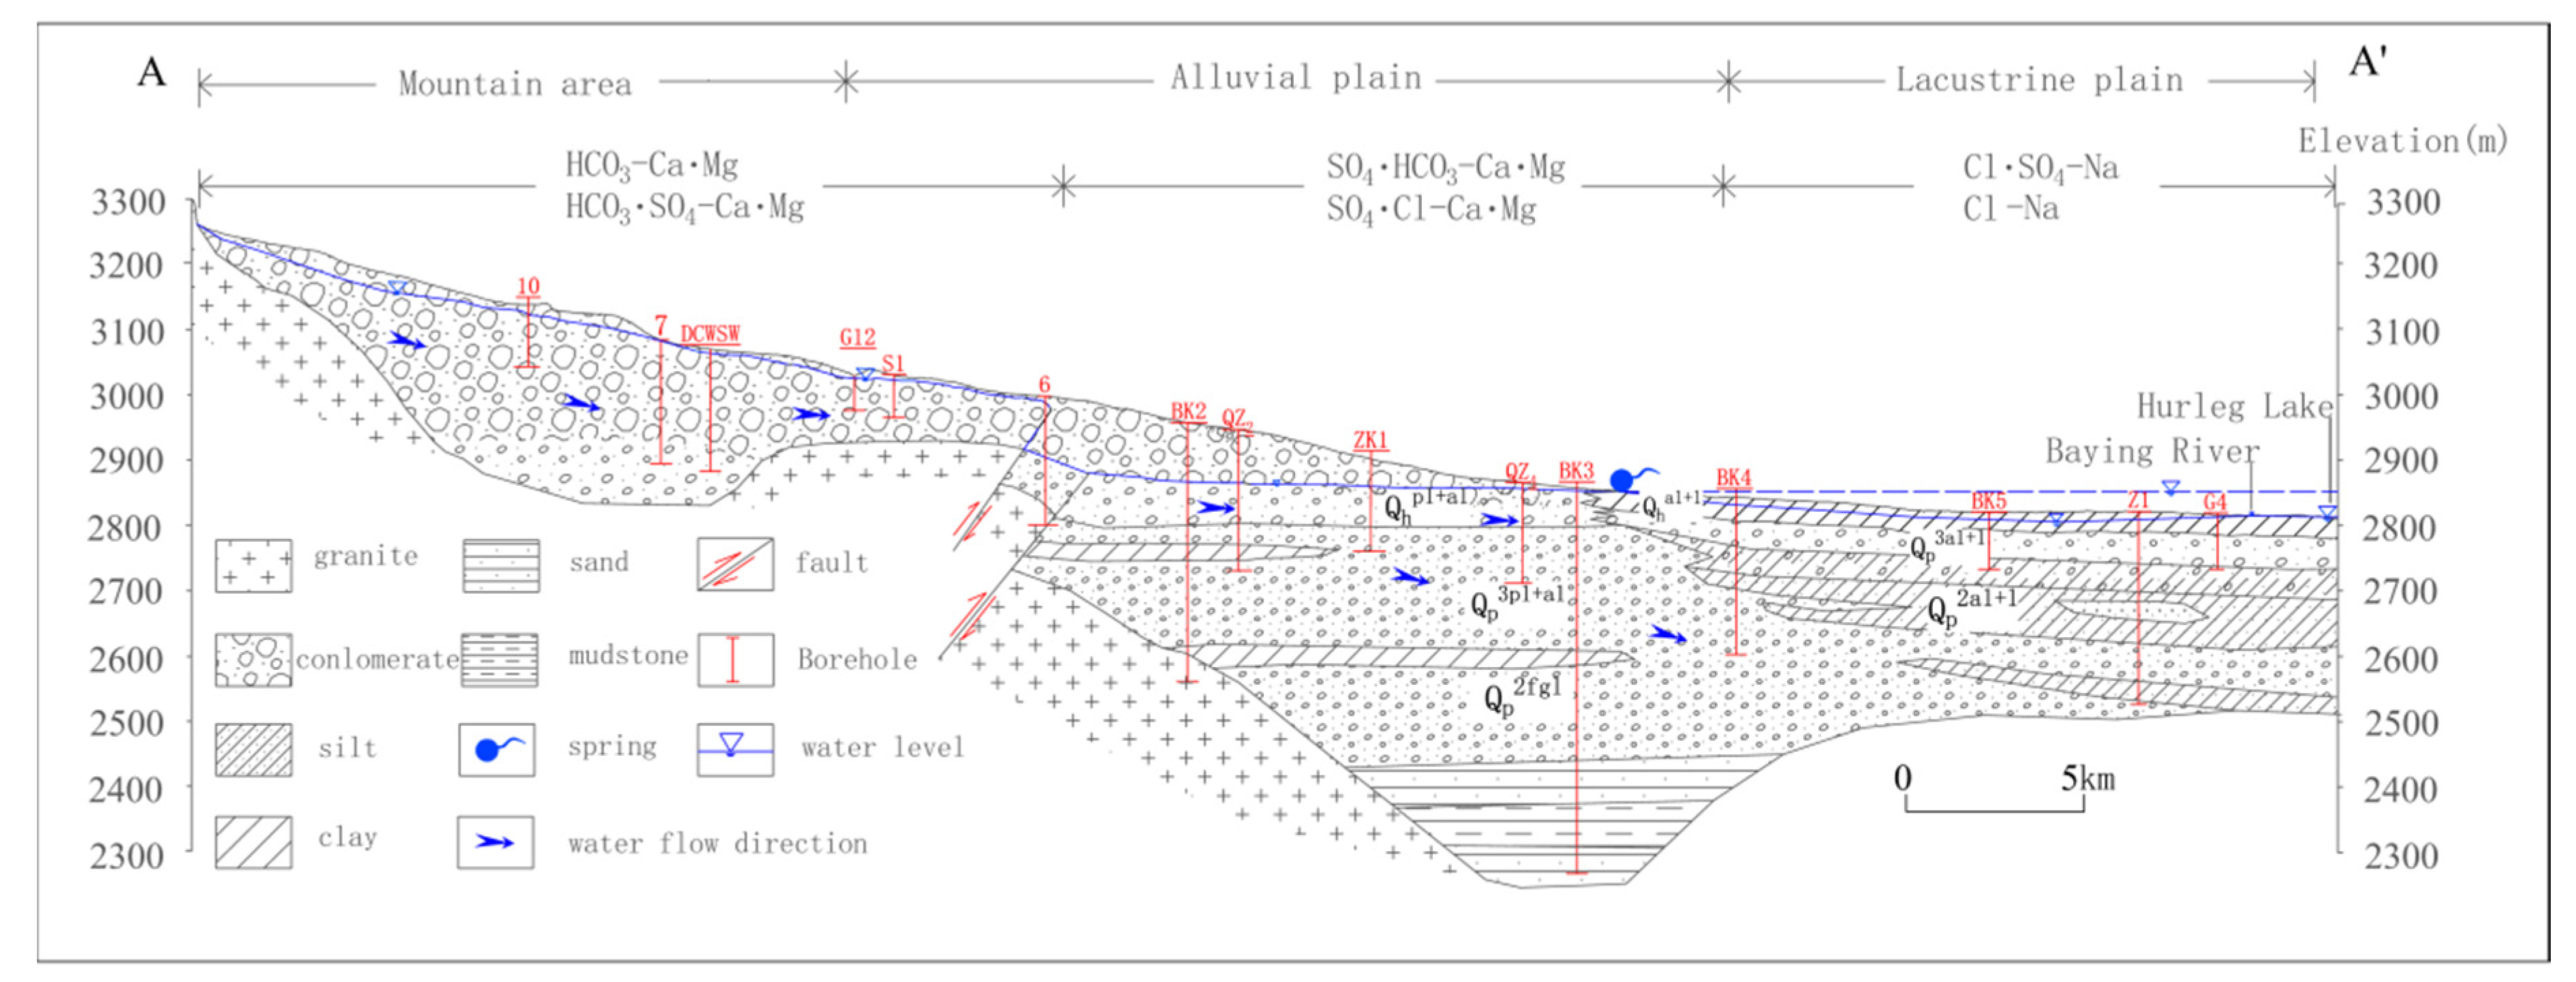
2.1. Regional Hydrogeology

This study area, bounded by the Zongwulong Mountain in the north, Delingha hills in the south, Buhete Mountain in the east, and Delingha uplift in the west, is located in the northeastern of the Qaidam Basin, northwest China (Figure 1). This area extends between longitudes of 96°56′–97°32′ E and latitudes of 37°08′–37°24′ N, encompassing an area of 1200 km2. The highest elevation (5030 m) is in the Zongwulong Mountain, and the lowest (2820 m) is in Toson lake (Figure 1). The relative elevation difference is 2210 m.
The geomorphological units in this area can be mainly divided into four types: middle–high mountain areas, low mountains and hilly areas, Gobi Desert, and alluvial-lacustrine plain. The climate is featured as a typical arid continental climate. The average annual temperature is 3.9 °C, average annual rainfall is 169.3 mm within the rainy season from June to October. And the average annual potential evaporation is 2036 mm, which is more than ten times the average annual rainfall.
The geologic outcrops in this study area include sediments of Sinian, Carboniferous, Permian, and Trias up to Quaternary periods. The outcrops of bedrock are mainly distributed in the mountain area. The alluvial fan and lacustrine plain were comprised of the Quaternary deposits of coarse sand, fine sand and sandy clay, with the thickness ranging from 0 to 500 m (Figure 2). Bedrock fissure groundwater occurring in sandstone and slates of the Triassic and Permian periods is widely distributed in the north and east of this study area. The carbonate fissure karst water occurring in phyllite and limestone of the Carboniferous period is mainly distributed in the south slope of Zongwulong Mountain and mainly receives the replenishment from atmospheric precipitation and snowmelt. Clastic rock fracture groundwater mainly occurs in the hilly area and alluvial-lacustrine plain, in where the lithology is composed of glutenite, sandstone, and mudstone interbeds. Loose sediment groundwater is the main water resource of this region, with a water table depth of 4–60 m.
The main rivers in the Delingha area are the Baying river and Baishui river (Figure 1). The Baying river is the largest river in this area, originating from the Zongwulong Mountain and running through the entire Delingha city. After passing through the Delingha city, it leaks heavily into the aquifer and supplies the groundwater. Then, part of groundwater flows eastward and eventually flows into the Gahai Lake; and most of the groundwater flows westward and finally flows into the Hurleg Lake. Along the flowing path to Hurleg Lake, part of groundwater overflows to the surface in the way of spring (Figure 2).

2.2. Sampling and Analysis Methods

A total of 123 water samples were collected from May to October 2016 in the Delingha region. Those samples (including 6 surface-water, 105 unconfined groundwater and 12 confined groundwater samples) were collected along the general groundwater flow direction, from Zongwulong Mountain to Hurleg Lake (Figure 1). Samples of surface-water were collected from the Baying river, and samples of groundwater were collected from wells, boreholes and springs. The depths of those wells and boreholes of the unconfined aquifer are about 30–150 m. And the depths of boreholes of the confined aquifer, which is in the southern lacustrine plain, range from 100 to 500 m.
All the water samples were stored in portable bottles and then analyzed in the Laboratory of Groundwater Sciences and Engineering of the Institute of Hydrogeology and Environmental Geology, Chinese Academy of Geological Sciences. Major cations (K+, Na+, Ca2+, Mg2+) were measured with ICP-OES, anions (Cl, SO42−) were carried out by spectrophotometry (DX-120IC), and HCO3 and TDS were measured by acid-base titration and gravimetric processes, respectively. According to the charge balance verification of all hydrochemical data, the ionic balance error was within the limit value of ±5%, indicating the accuracy of our data.

3. Results and Discussion

3.1. Hydrochemical Characteristics

Statistics analysis of the hydrochemical parameters of 123 water samples is shown in Table 1, containing the minimum, maximum, and mean values of the major ions and hydrochemical parameters. As shown in Table 1, the concentration of cations in all water samples follows the same order of Na+ > Ca2+ > Mg2+ > K+. However, the order of the concentration of anions in unconfined groundwater (SO42− > Cl > HCO3) is different with that of the confined groundwater and surface water (HCO3 > SO42− > Cl). This implies the different water types that will be discussed in Section 3.2 and can indicate the difference of some geochemical processes (such as evaporation or water–rock interactions) occurring in different water.
TDS, which is a comprehensive hydrochemical parameter, can be used to reflect the groundwater quality [10]. As shown in Table 1, TDS values of the unconfined groundwater range from 52 to 8954 mg/L with a mean value of 1043 mg/L. And it can be concluded that a gradually increasing trend of the TDS value of unconfined groundwater along the flow direction is occurring. This is mainly due to the fact that the unconfined groundwater in the recharge area (northern mountains area) is directly recharged from precipitation and snowmelt, while the groundwater in the discharge area (southeast and southwest area) may be influenced by relatively strong evaporation or water–rock reactions, especially in Gahai Lake and Hurleg Lake. However, the confined groundwater is always fresh water with TDS < 1 g/L. This hydrochemistry difference between unconfined groundwater and confined groundwater indicates the difference of some hydrochemical processes (such as evaporation) occurring in those two aquifers. In addition, the surface-water’s hydrochemistry feature (concentration less than that of unconfined groundwater, but greater than that of the confined groundwater) implies the great recharge and runoff conditions and slight evaporation effects in the downstream area of Baying river. These hydrochemistry distributions in different areas and different aquifers can guide the selection for water resource field.
The pH values vary from 7 to 9 with a mean value of 8, indicating weak alkaline conditions. According to the National Drinking Water Standard of China, the standard pH value of residents’ drinking water is 6.5–8.5. Thus, the analysis result of pH indicates that most water in this area is within the potable range.
The spatial distribution of Na+, Ca2+, Mg2+, K+ cations shows an increasing tendency along the groundwater flow direction (from the mountain area to the alluvial-lacustrine plain). Na+ is the dominant cation in this area, with concentration from 3.5 mg/L to 1887 mg/L in water samples; Ca2+, Mg2+ are the secondary cations in water samples; concentration of K+ is the lowest, with a mean value of 6.9 mg/L.
The concentration of Cl also shows a gradual increase from the mountain area to the alluvial-lacustrine plain. The mean concentration of Cl is 279.1, 67.1, and 113.8 mg/L for unconfined groundwater, confined groundwater, and surface-water, respectively. All the unconfined groundwater samples and parts of confined groundwater samples have Cl values beyond the drinking water limit of 250 mg/L.
The mean concentration value of HCO3 is 267.8, 237.2, and 198.7 mg/L for unconfined groundwater, confined groundwater, and surface-water, respectively. The concentration of HCO3 displays an increasing pattern from the mountain region to the alluvial-lacustrine area. And the HCO3 is the most dominant anion of water in the mountain area. And the average concentration of SO42− is 346.6, 106.8, and 126.2 mg/L from unconfined groundwater, confined groundwater, and surface-water, respectively. SO42− is the dominant anion of water in the alluvial plain.
The results of the main hydrochemical parameter correlation are presented in Table 2. The strong positive correlations between TDS and mainly ions (Na+, Cl, Mg2+, SO42−, Ca2+, K+, and HCO3) suggest the important role played by those mentioned ions in the groundwater hydrochemistry. There are good corrections between Na+ and Cl (0.974), Ca2+ and SO42− (0.915), Ca2+ and Mg2+ (0.858), indicating that the major ions of groundwater may originate from the halite, gypsum, and carbonate dissolution.

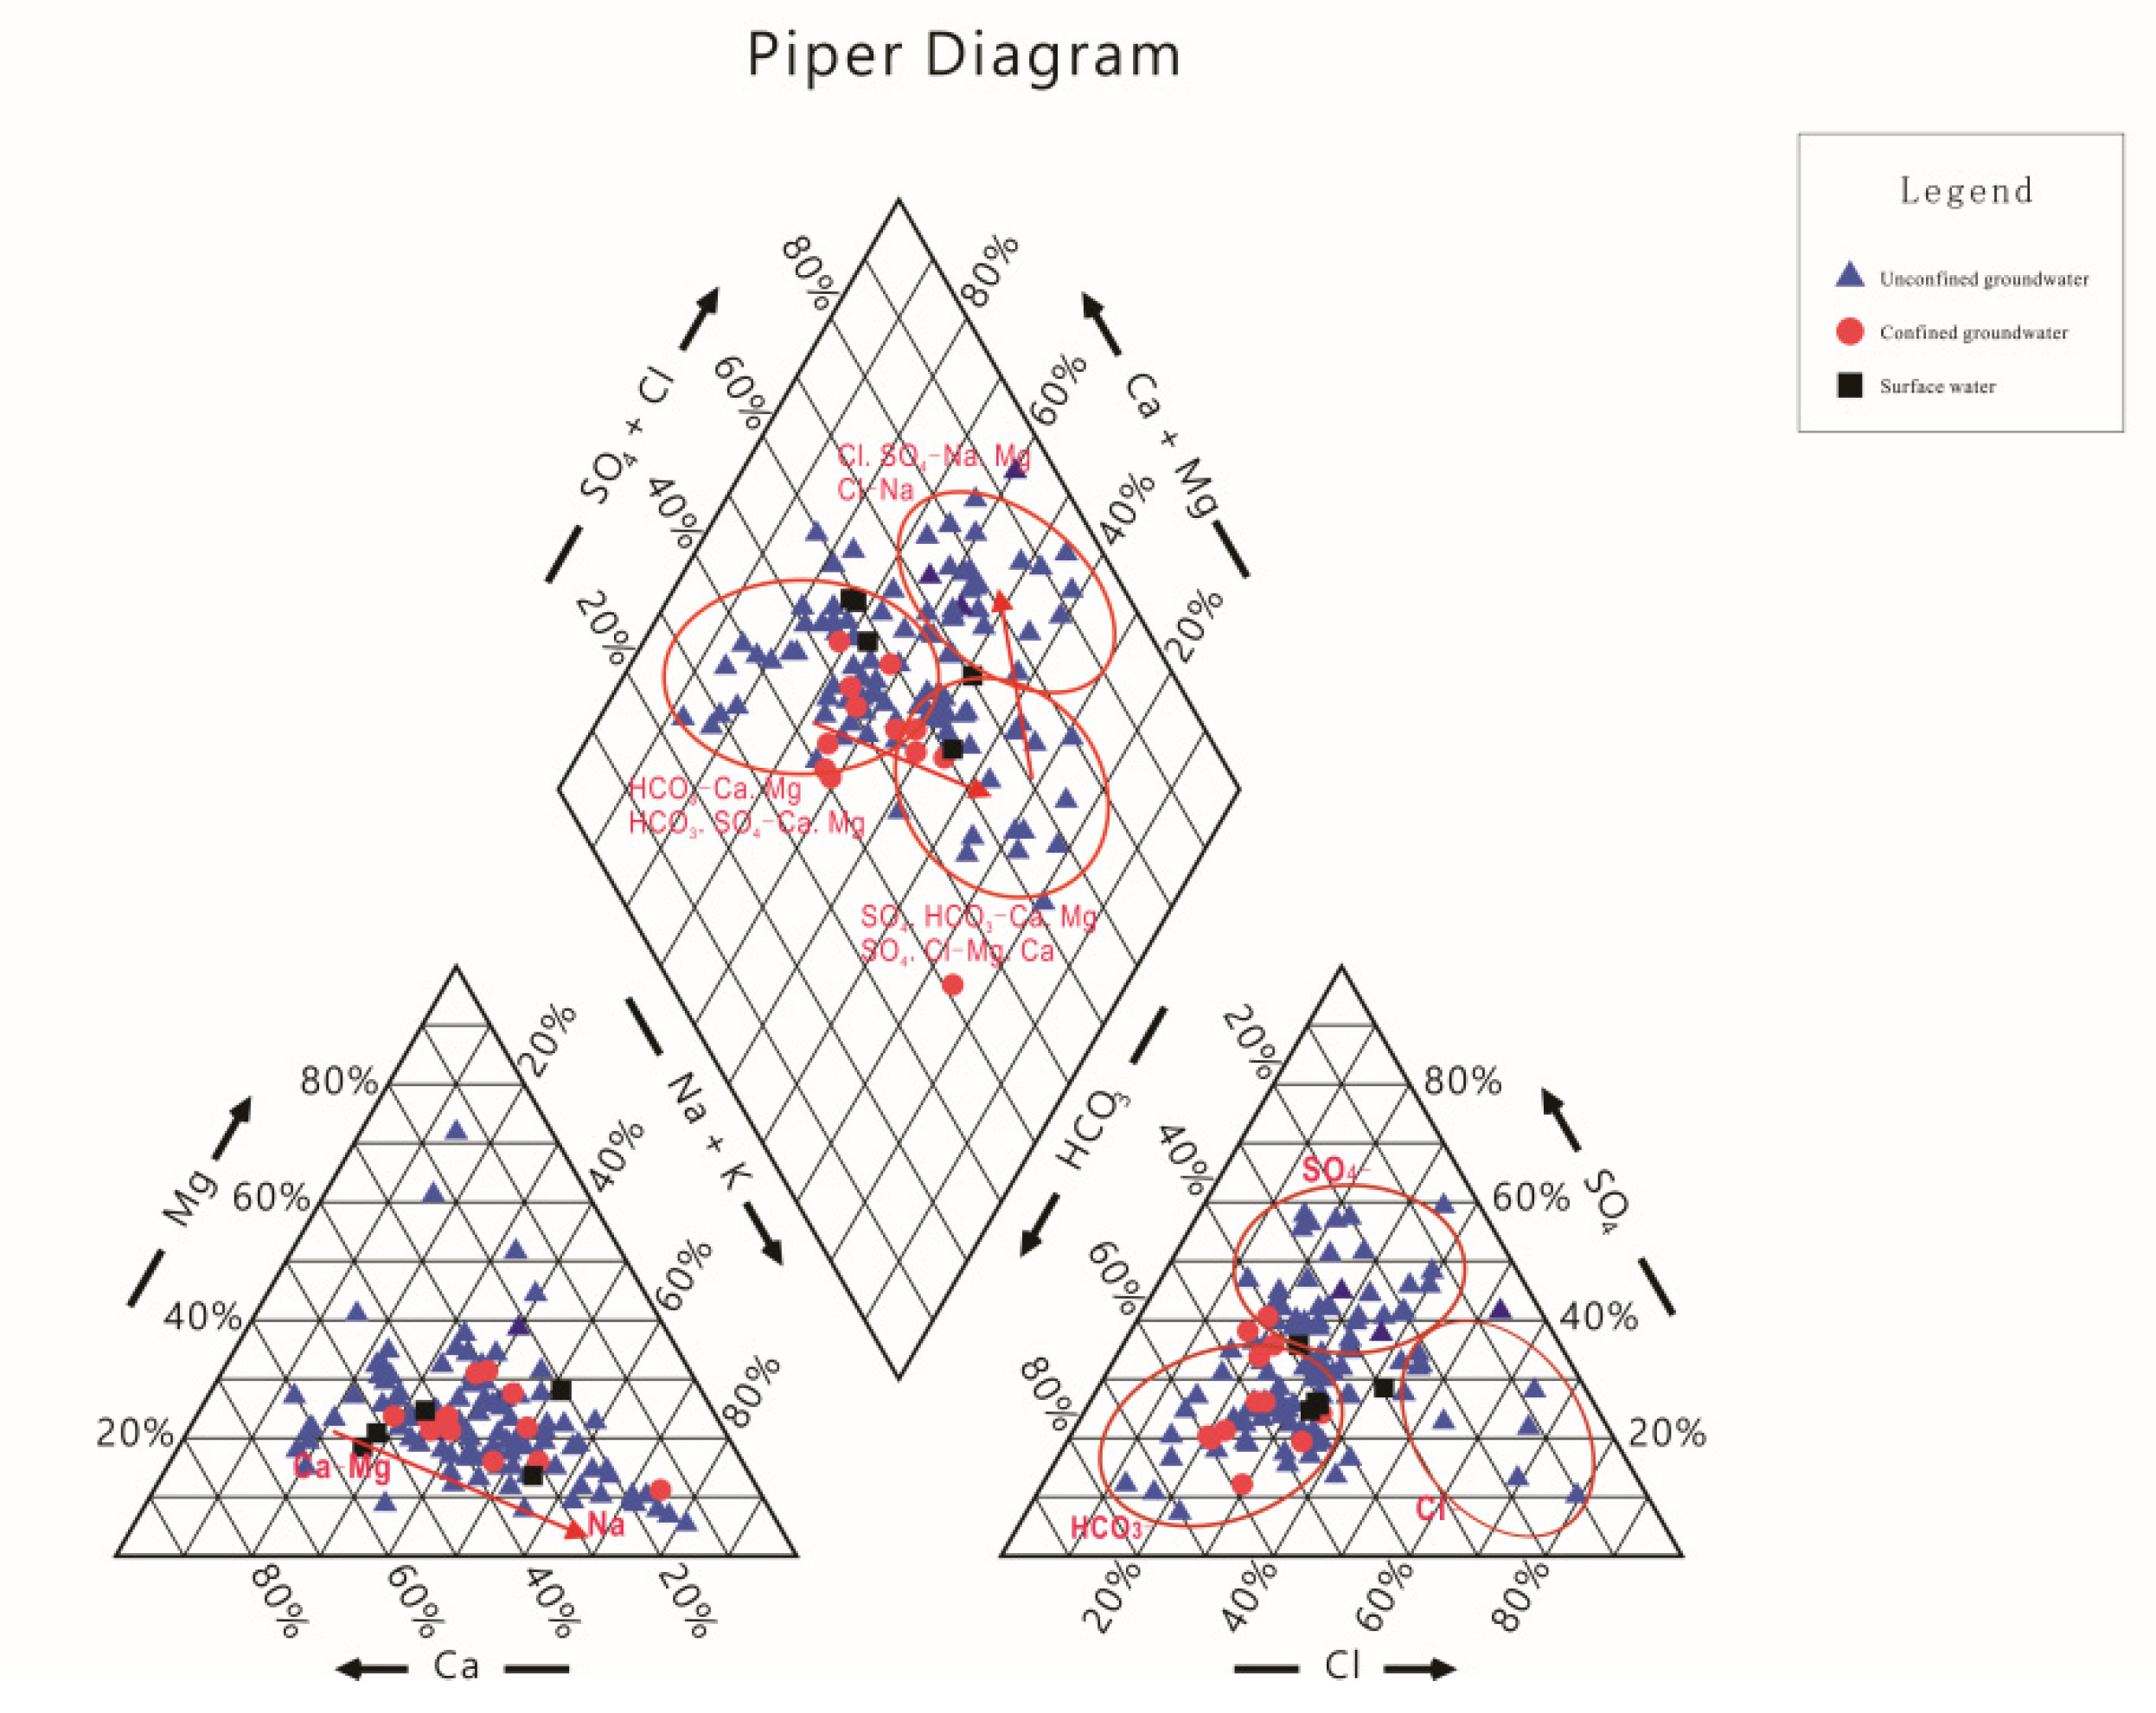
3.2. Groundwater Hydrochemical Types

The piper diagram is an important means to comprehend the hydrochemical characteristics, hydrochemical types and hydrochemical evolution in groundwater [11,12]. Figure 3 shows that the surface water and confined groundwater are characterized by HCO3-Ca·Na and HCO3·SO4-Ca·Na types. However, the type of water chemistry for unconfined groundwater is relatively complex in this study area, including HCO3-Ca·Mg, HCO3·SO4-Ca·Mg, SO4·HCO3-Ca·Mg, SO4·Cl-Ca·Mg, Cl·SO4-Na, and Cl-Na types. The hydrochemical types of the unconfined groundwater in the mountain area (recharge area) were mainly HCO3-Ca·Mg and HCO3·SO4-Ca·Mg types, those in the alluvial-lacustrine plain (runoff area) were mainly SO4·HCO3-Ca·Mg, SO4·Cl-Ca·Mg types, and those in the lacustrine plain (discharge area) were mainly Cl·SO4-Na and Cl-Na types (Figure 2).
According to the analysis of groundwater types in the Delingha area, there is a clear zoning distribution along the flow path (Figure 4). The groundwater recharge area (mountainous area) is mainly featured with HCO3-type, the runoff area (the alluvial-lacustrine plain) is mainly represented by SO4-type, and the groundwater discharge area (near the Gahai Lake and Keluke Lake) is mainly featured with Cl-type.

3.3. Main Hydrochemical Processes

Gibbs diagrams were constructed by the equivalence ratios of Na+/(Na+ + Ca2+) and Cl/(Cl + HCO3) versus TDS. This method has been widely used to identify hydrogeochemical evolution, which involves precipitation, rock weathering, and evaporation–crystallization processes [13]. In the Gibbs diagram, the water samples are located in the lower right, with low TDS values but high values of Na+/(Na+ + Ca2+) or Cl/(Cl + HCO3), indicating that the chemical compositions have been influenced by atmospheric precipitation; samples fall in the center region, suggesting that the rock weathering process is dominant; and samples with high TDS values and high Na+/(Na+ + Ca2+) and Cl/(Cl + HCO3) values fall in the upper right region, indicating the influence of evaporation.
As shown in Figure 5, all the confined groundwater and surface-water samples and most of the unconfined groundwater samples lie in the rock-weathering process dominance area, indicating that the main hydrochemical process of the local water is water–rock interaction. However, a few of unconfined groundwater samples collected from the lacustrine plain with a water table depth of 3–5 m are located in the transition region between evaporation and rock-weathering, suggesting that the water in the lacustrine plain was influenced both by evaporation and water–rock interaction.

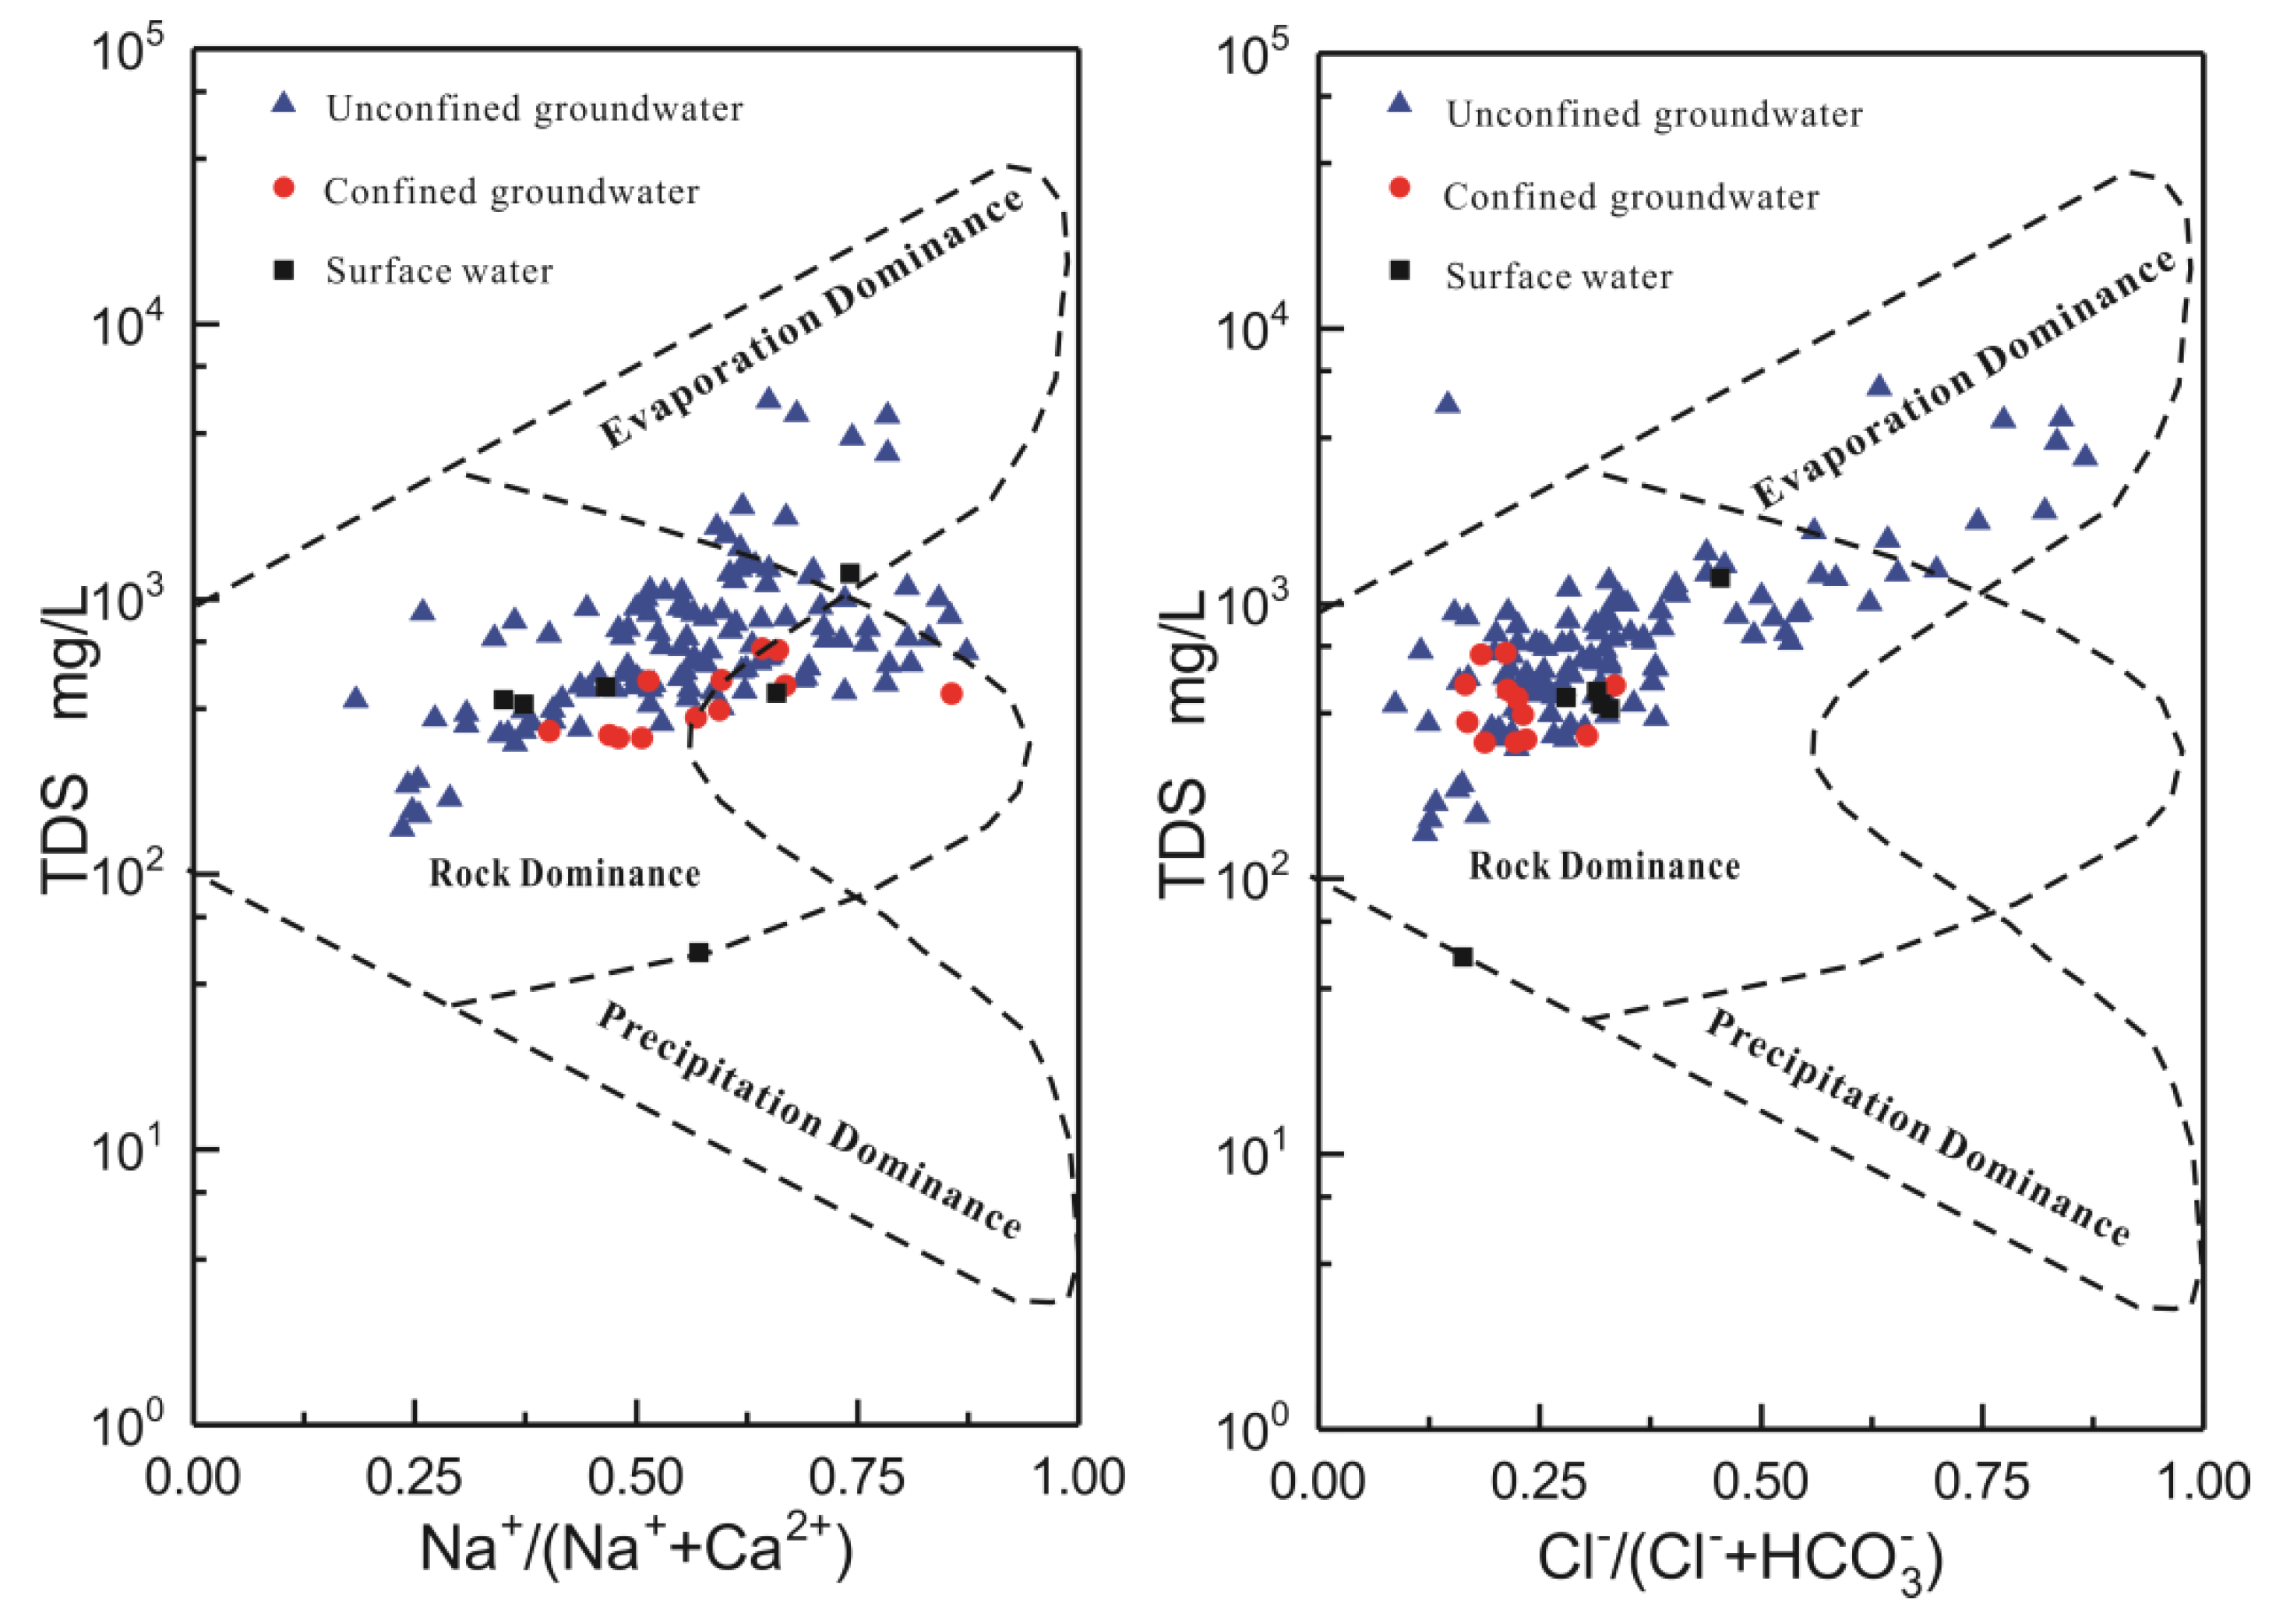
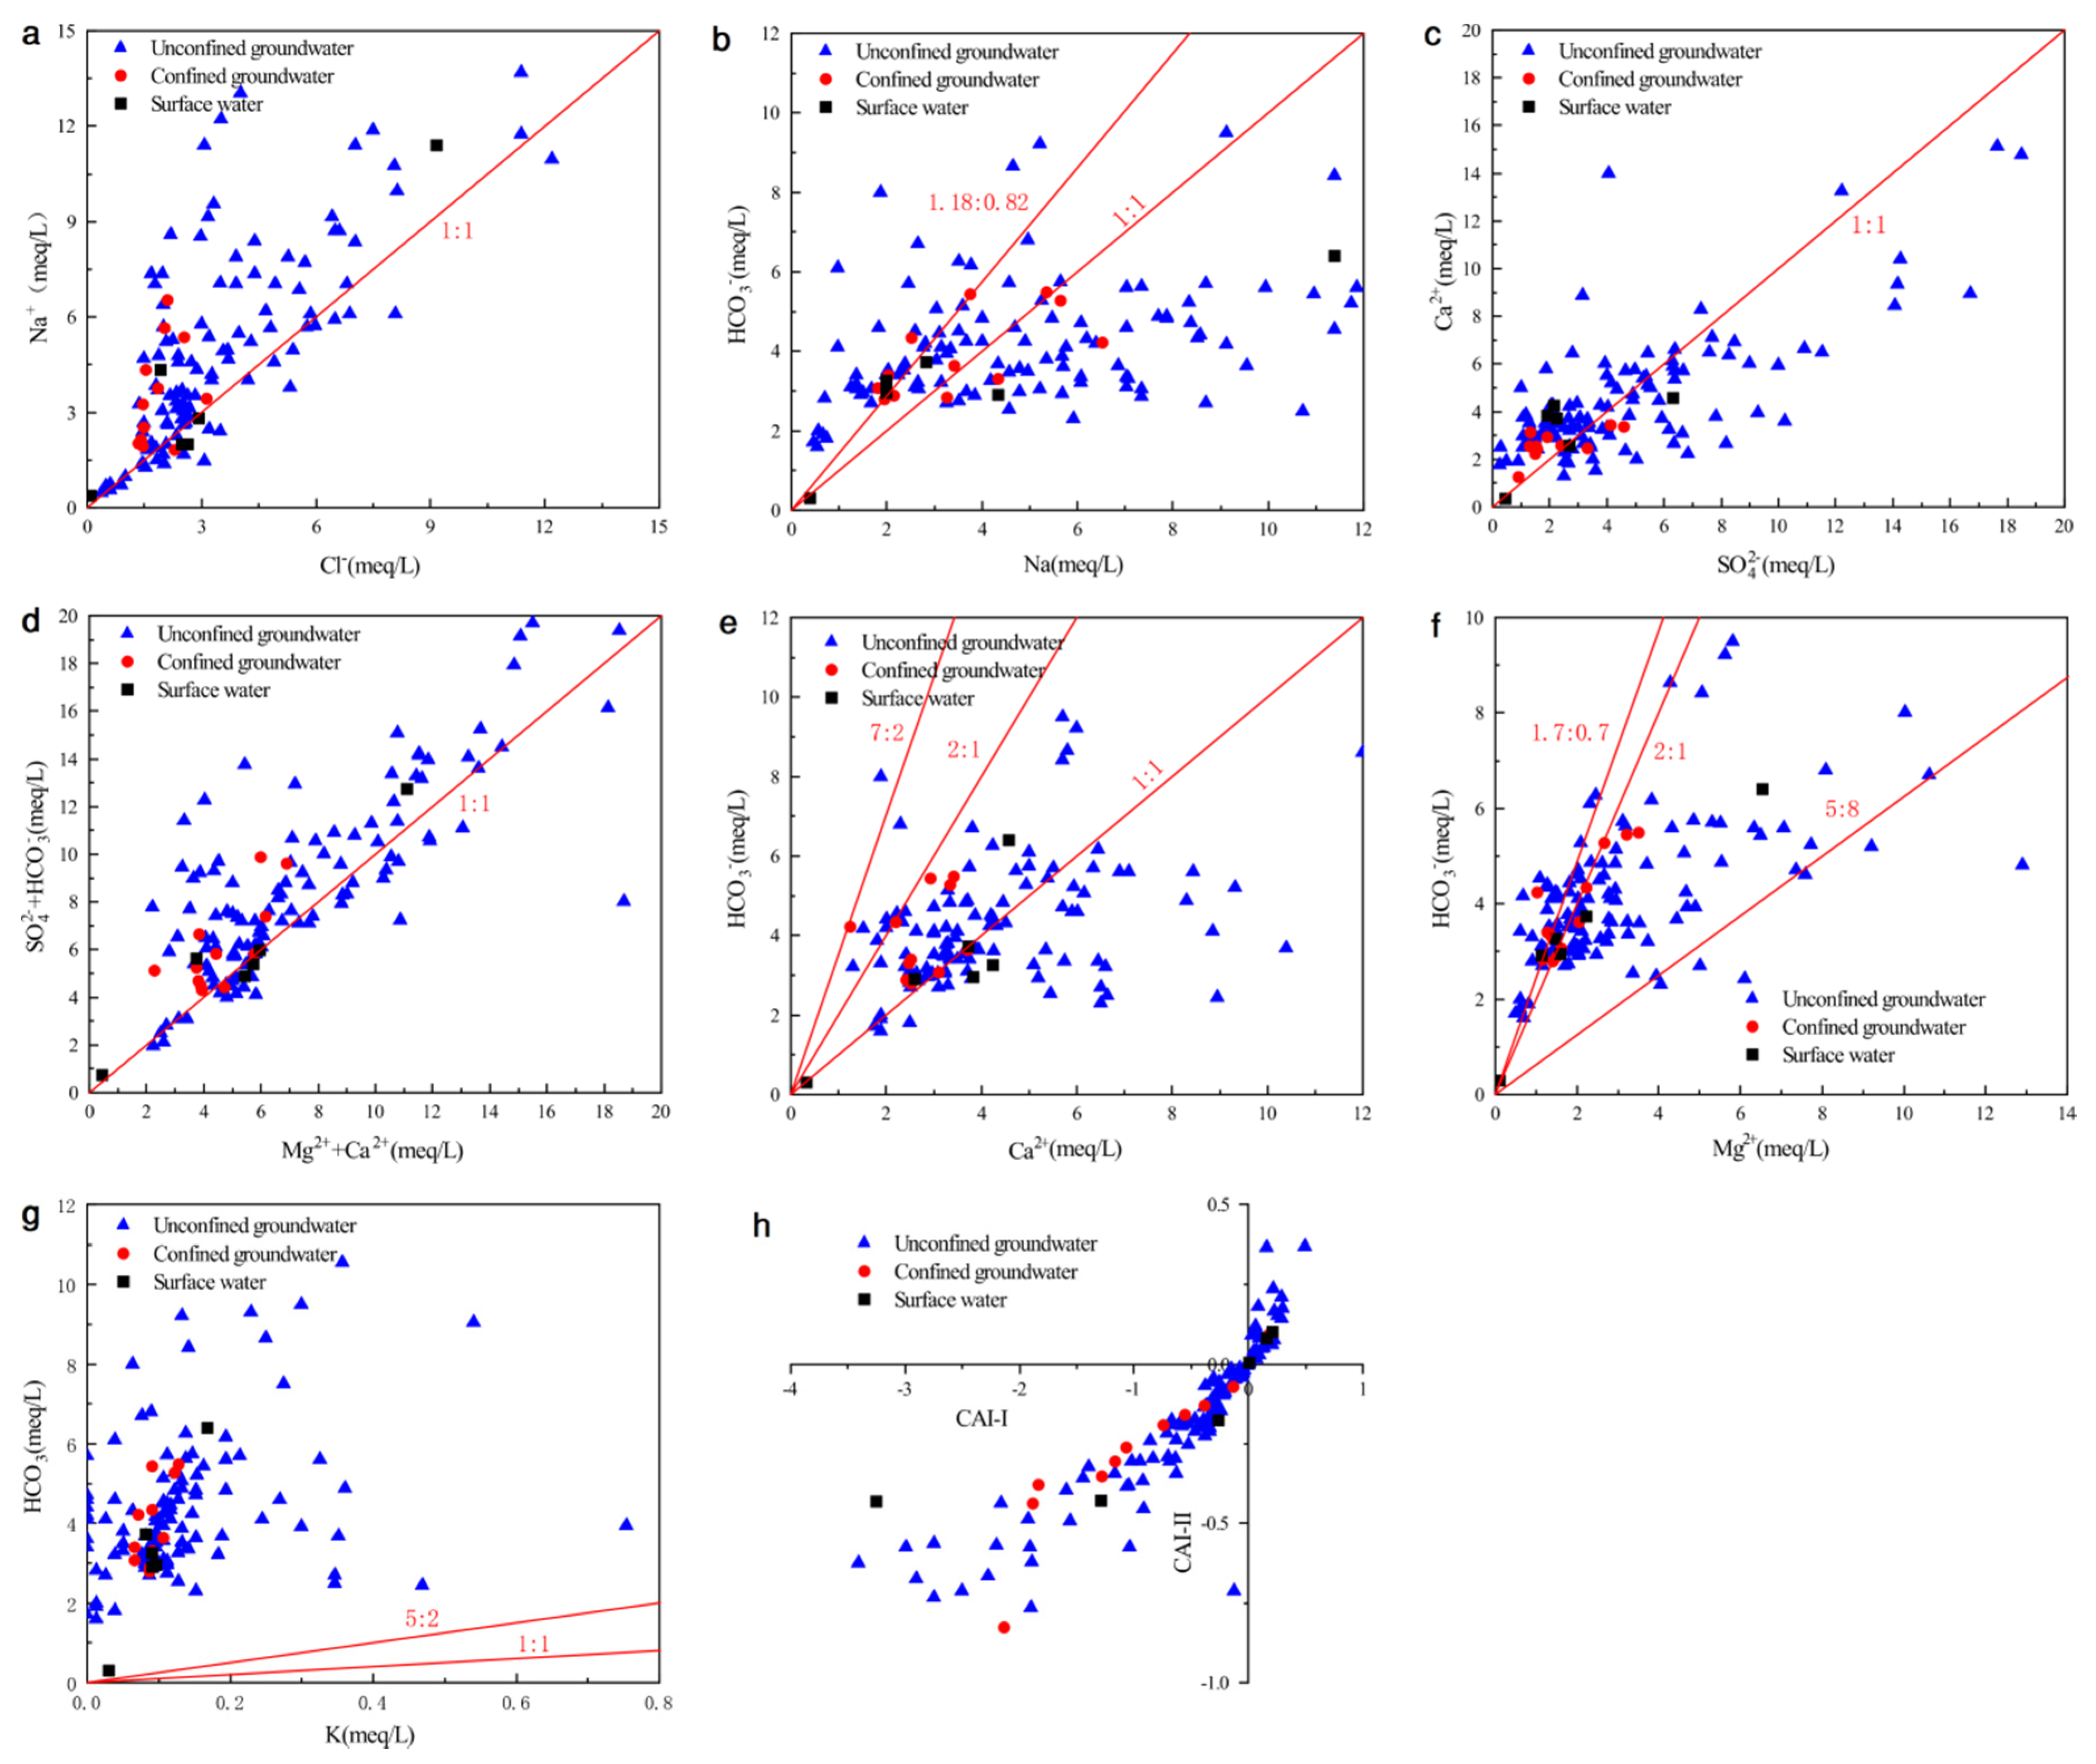
3.4. Major Ion Relations in the Groundwater

The major ion relationship was plotted to explain the hydrochemical evolution processes and the controlling mechanism of the local groundwater. The ion ratio relationship can further assist in comprehending the process of water–rock interactions in this area. Thus, according to the hydrochemistry data, ratio graphs of the major ion relationship were plotted (Figure 6).
If the molar ratio of Na+/Cl is approximate to 1, indicating that halite dissolution mainly contributes to Na+ concentration in groundwater; if this ratio is greater than 1, meaning that there is silicate weathering or a cation exchange; and if this ratio is less than 1, representing an anthropogenic disturbance. As shown, Figure 6a presents the ion relationship between Na+ and Cl. A few of the groundwater samples were along the 1:1 trend line, and the other samples lay above the 1:1 trend line, suggesting that halite dissolution, silicate weathering, and cation exchange are important sources of Na+. In addition, the saturation index (SI) of halite in Section 3.5 can further prove this view of the sources of Na+ and Cl. And few groundwater sample lie under the 1:1 trend line (Figure 6a), indicating that anthropogenic disturbance is weak in this area.
If the HCO3/Na+ ratio of water samples is 1:1 and 0.82:1.18, indicating that weathering of silicate minerals (albite and plagioclase) occurs in the groundwater. The corresponding hydrochemical reactions can be seen in Table 3 (reactions of 3 and 4). As shown in Figure 6b, only a few water samples were plotted between the 1:1 line and line 0.82:1.18. Furthermore, the correlation coefficient between Na+ and HCO3 is low (Table 2). These data suggest that the dissolution of albite and plagioclase is not the main source of Na+ and HCO3 in groundwater. Meanwhile, a ratio of Na+/HCO3 larger than 1 showed the excess of Na+, which is mainly because of the dissolution of halite and cation exchange.
If Ca2+ and SO42− were derived from weathering of gypsum, the molar ratio of Ca2+/SO42 − would be 1:1. Figure 6c showed the relation between Ca2+ and SO42−. It was observed that most of the groundwater samples along the 1:1 trend line and Ca2+ increasing with SO42−, suggesting that weathering of gypsum is a source for Ca2+ and SO42−. Figure 6c also showed that samples of the confined groundwater and a part of unconfined groundwater lay over the 1:1 trend, implying that there may be an inverse cation exchange Equation (2) or weathering of calcite, dolomite and anorthite.
2 Na + + CaX 2 Ca 2 + + 2 NaX
Ca 2 + + 2 NaX 2 Na + + CaX 2
The plot of (Mg2+ + Ca2+) versus (HCO3 + SO42−) can also determine the mineralization processes of groundwater. If the weathering of carbonate and sulfate minerals is the primary reaction in the groundwater, water samples will be along the 1:1 trend line. The samples will tend to lie in the right area when there is cation exchange Equation (1) occurring in the groundwater; water samples will locate at the left area of the diagram when an inverse cation exchange Equation (2) is occurring in the groundwater. As shown in Figure 6d, most of the groundwater samples lie along the 1:1 trend line, implying that the occurrence of dissolutions of carbonates and gypsum minerals. In addition, most of the confined groundwater samples and a part of the unconfined groundwater samples are observed to fall above the trend line of 1:1, indicating the effects of the inverse cation exchange process.
Reactions (5–7, 10, 11) in Table 3 show the main processes that can release Ca2+ and HCO3. Figure 6e is the bivariate plots of Ca2+ and HCO3. According to those reactions, the ratios between Ca2+ and HCO3 from the weathering reactions are 1:1 (calcite), 1:2 (dolomite and anorthite), 1:1.7 (pyroxene), 2:7 (amphibole). Figure 6e suggests that part of the water samples are plotted above the 1:1 line, showing that the HCO3 is greater than Ca2+ and that the weathering of anorthite and dolomite occurs. And some water samples lie along the 1:1 trend line, which suggests that the main source of Ca2+ and HCO3 is weathering of calcite. Furthermore, most water samples are under the 1:1 line, indicating that there is an excess of Ca2+, which results from the dissolution of gypsum. On the whole, the important processes of the groundwater evolution are generally dissolution of gypsum, calcite, dolomite, amphiboles, pyroxene, and anorthites.
The Mg2+ vs. HCO3 relationship diagram has been used to reveal the sources of Mg2+ and HCO3 in groundwater. If the Mg2+ and HCO3 only derive from the dissolution of carbonate and the weathering of amphibole, biotite, and pyroxene, according to the chemical reactions (formulas 6–8,11 in Table 3), the Mg2+/HCO3 milliequivalent ratio will be dolomite (2:1 line), amphibole (7:5 line), biotite (5:8 line), and pyroxene (1.7:0.7 line), respectively. The relation of Mg2+ and HCO3 is shown in Figure 6f, and nearly all samples lie along the 2:1 line and 1.7:0.7 line, indicating a source of dolomite and pyroxene dissolution.
If HCO3 and K+ mainly come from the weathering of K-feldspar and biotite, according to the chemical reactions (formulas 8–9, in Table 3), the HCO3/K+ is 1:1 (K-feldspar) and 5:2 (biotite), respectively. As shown in Figure 6g, all water samples are above the line (1:1) and line (5:2). This suggests that the HCO3 is superfluous and that the weathering of K-feldspar and biotite are rare in the groundwater. The HCO3 was mainly from the weathering of albite, plagioclase, and carbonate minerals.
The chlor-alkaline index (CAI) is an important way to study the occurrence of cation exchange [17,18]. The CAI-1 and CAI-II are estimated through the following equations (units of ions with meq/L):
CAI - 1 = Cl ( Na + + K + ) Cl
CAI - 2 = Cl ( Na + + K + ) CO 3 2 - + SO 4 2 - + HCO 3 - + NO 3
If the chlorine-alkalinity index is less than 0, the normal cation exchange process is dominant for hydrochemistry. On the contrary, if the index is a positive value, a reverse cation exchange process takes place. Figure 6h showed that all confined groundwater and most of the unconfined groundwater of the study area had negative chlorine-alkalinity index values, suggesting that Na+ or K+ in the aquifer have been substituted by Ca2+ or Mg2+ in the groundwater Equation (1). However, some unconfined groundwater samples are with positive index values, indicating a reverse cation exchange process Equation (2).

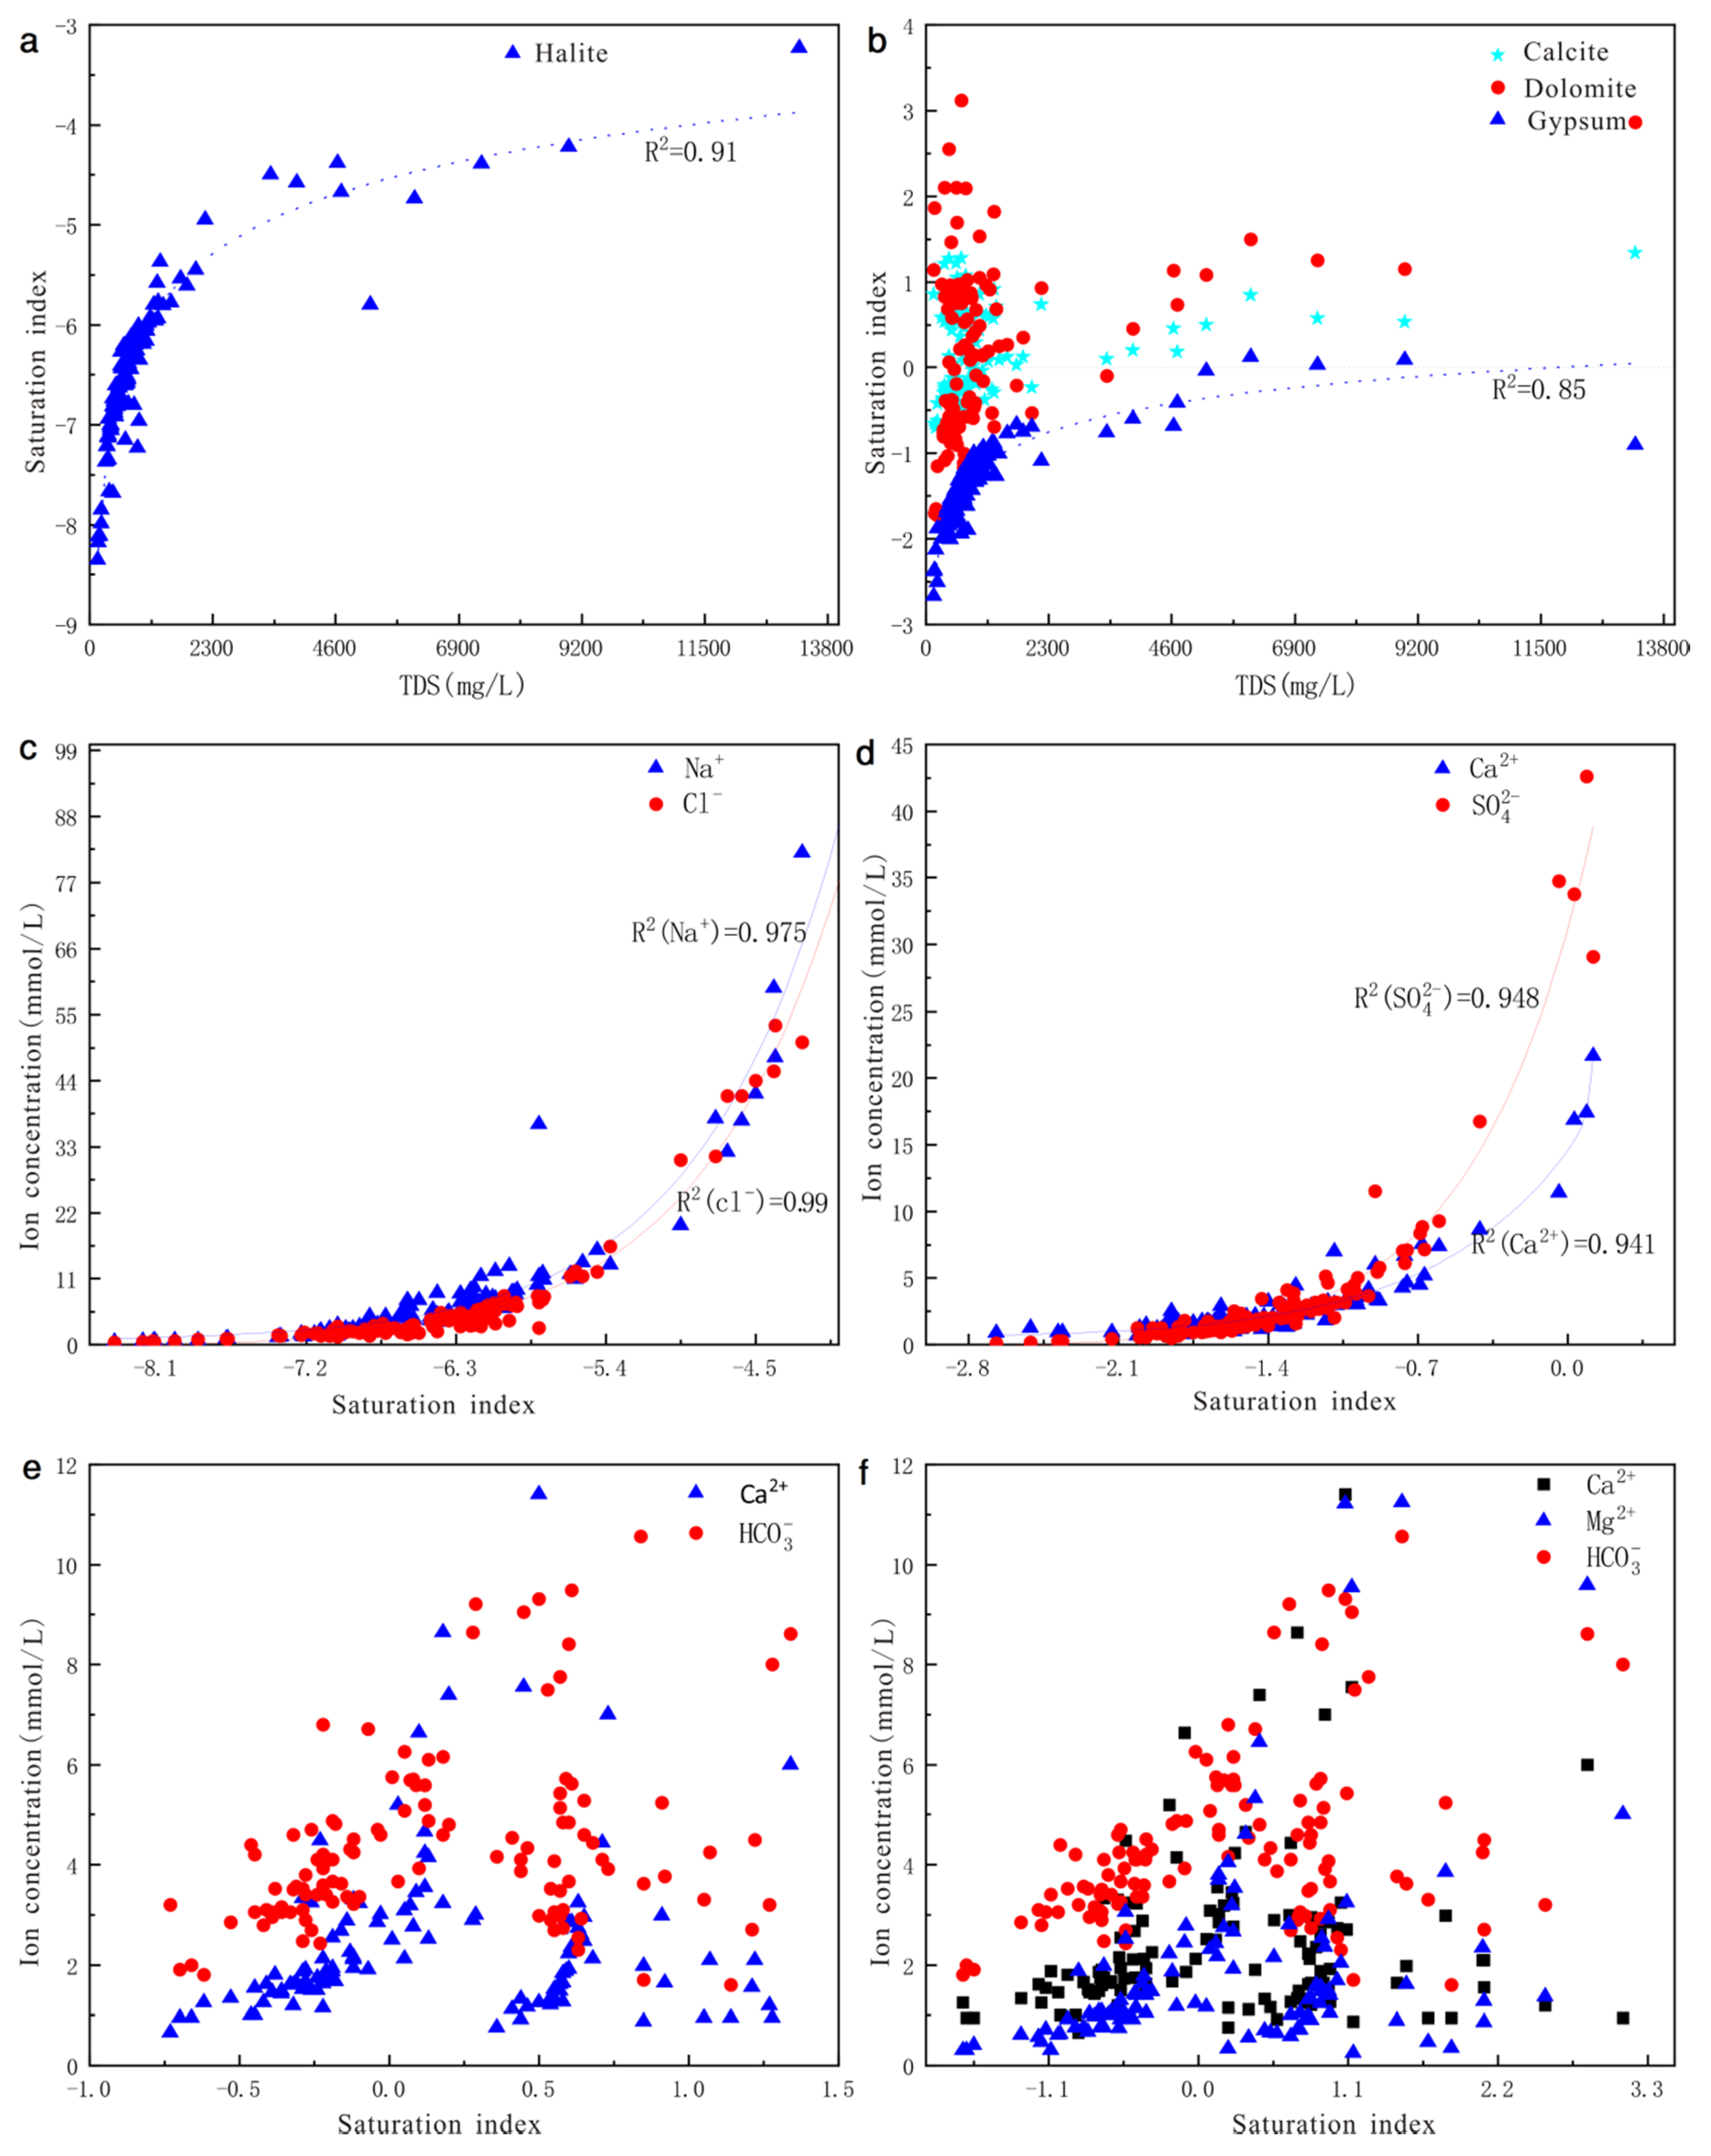
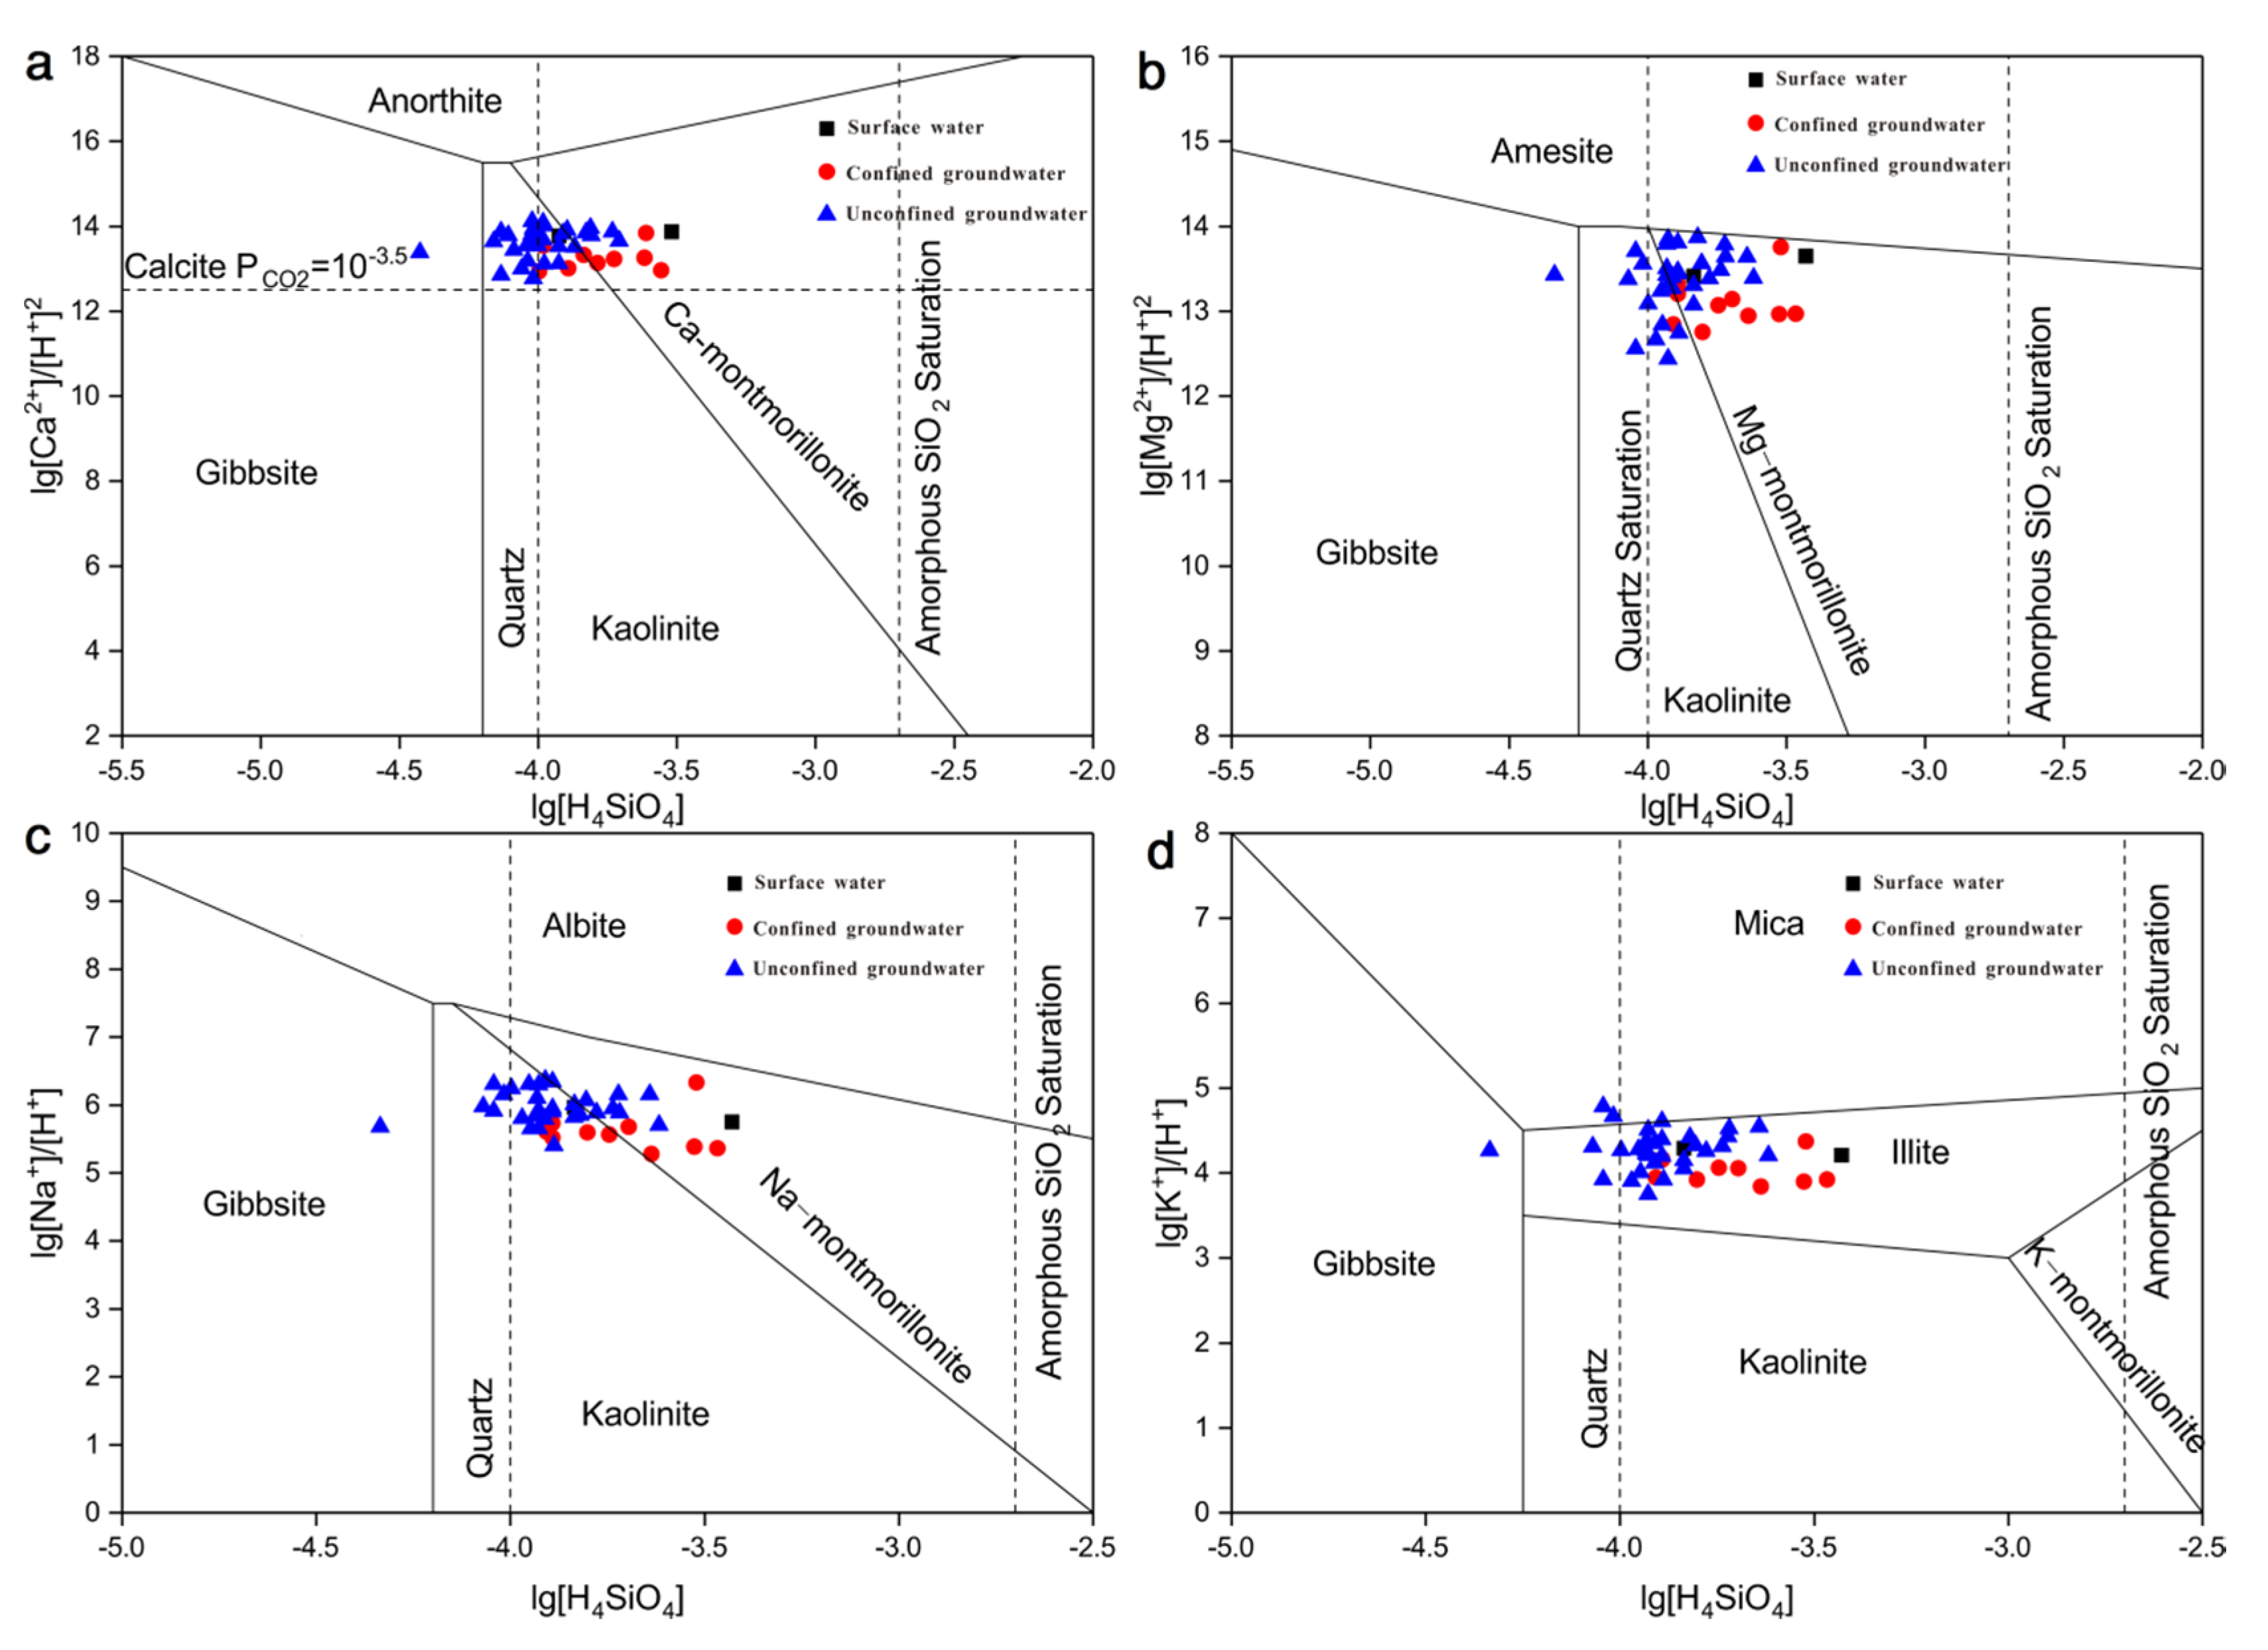
3.5. Saturation Index and Mineral Dissolution

Groundwater hydrochemistry was governed by many processes, such as groundwater flows, recharge and discharge processes, and water–rock reactions. Along the groundwater flow direction, hydrochemistry is always affected by minerals weathering in long residence time [19]. The saturation index (SI) of a mineral can be estimated by the following equation: SI = log ( K IAP K SP ) (where, KIAP is the ions activity product for a mineral equilibrium reaction, and KSP is the solubility product of the mineral). The PHREEQC software can be used to calculate the SI values of the minerals in groundwater [20]. The results of SI suggest the trend of water and mineral chemical equilibrium and water–rock interaction. If unsaturated (SI < 0), the mineral will be continuously weathered by the groundwater; if supersaturated (SI > 0), the mineral will precipitate; and if SI is close to 0, the mineral phase will remain in an equilibrium state. According to the hydrochemistry data, the saturation indices of particular minerals were calculated (Table 4).
The Saturation Index values of calcite and dolomite of a part of samples were greater than 0, and those of the other samples were less than 0 (Table 4), indicating that the carbonate minerals keep gradually from unsaturation to supersaturation status. In contrast, the SI of halite and gypsum for all groundwater samples was less than 0 (Table 4), suggesting that the halite and gypsum will continuously dissolve in groundwater.
The Saturation Index values of calcite and dolomite ranged from −0.73 to 1.34 and −1.73 to 3.12, with mean values of 0.18 and 0.21, respectively. Figure 7b showed that there was a bad correlation between SI and TDS. In addition, the concentrations of Ca2+, HCO3, Mg2+, HCO3 were not correlating with SIcalcite (Figure 7e) and SIdolomite (Figure 7f), which indicate that the weathering of calcite and dolomite did not continue, and only a part of the minerals will be continuously dissolving along the groundwater flow direction. On the contrary, SIhalite and SIgypsum were less than 0 and positively correlated with TDS (Figure 7a,b). Moreover, Na+ and Cl, Ca2+, and SO42− show high correlation coefficients (R2 equal to 0.974 and 0.915, respectively, Table 2). This suggests that the halite and gypsum will be continuing dissolved in groundwater along the flow direction. At the same time, the addition of Ca2+ from the weathering of gypsum could lead to supersaturation of calcite and dolomite, thus inhibiting the weathering of calcite and dolomite. Figure 7c,d represent the scatter plots of Na+, Cl versus SIhalite and Ca2+, SO42− versus SIgypsum, and the correlation coefficients R2 are 0.975, 0.99, 0.948, and 0.941, respectively. The dissolution of halite and gypsum can produce exponential increases of Na+, Cl and Ca2+, SO42−, suggesting that halite and gypsum are the main minerals along the flow direction.
Because the stratum of the study area is mainly the Quaternary strata containing a large amount of clay minerals, there may be dissolution of aluminosilicate minerals, especially albite, anorthite, and plagioclase. This explanation is also supported by previous studies (Table 5) [21,22].
In addition, mineral stability diagrams were another important way to assess the degree of the fluid–rock equilibrium [23]. Figure 8 shows the Ca-, Na-, K-, and Mg-aluminosilicates stability diagrams of 43 water samples in this area. The software PHREEQC was applied to calculate the activities of ions, such as Ca2+, Mg2+, Na+, K+, and H4SiO4. The stability field diagrams of Ca-, Mg-, and Na-aluminosilicates (Figure 8a–c) showed that most of the unconfined groundwater samples lay in the stability region of kaolinite, while a few unconfined and all confined groundwater samples lay in the stability region of montmorillonite. Meanwhile, a number of water samples were located in the boundary between the stability fields of kaolinite and montmorillonite. And only one unconfined groundwater sample lay in the stability field of Gibbsite. Those results of Figure 8a–c showed that kaolinite and montmorillonite were in equilibrium. On the K+-H+-SiO2 system plot (Figure 8d), all water samples fall in the stability field of illite, suggesting that illite is stable. To sum up, kaolinite, montmorillonite, and illite will be in equilibrium with the groundwater in this study area. Figure 8a–d showed that no water samples lay in the Amesite, Anorthite, Albite, or K-feldspar stability field. Some previous researches indicated that water samples keeping in equilibrium with kaolinite reflected good drainage conditions [24]. Table 6 shows the 14C age of the local groundwater within the age of 5000–7000 years, indicating that the groundwater has relatively fast-updating capacity and that the groundwater runoff condition is good.
The four main feldspars stability diagrams and HCO3 versus Na+, Ca2+, Mg2+, K+ bivariate plots indicated that there was weathering of aluminosilicate minerals, such as albite, plagioclase, anorthite, pyroxene, and amphibole in the study area (reactions of 3–7 in Table 3).

3.6. Implication for the Groundwater Resource Management

According to the result of TDS distribution along the groundwater flow direction (Figure 4), the groundwater quality in different areas and different aquifers can be concluded. As shown in Table 1, it can be learned that the confined groundwater is fresh water, even in the downstream area. However, as shown in Figure 4, along the flow direction, the unconfined groundwater was divided into three zones: fresh groundwater zone (TDS < 1 g/L), slightly salty groundwater zone (1 g/L < TDS < 3 g/L) and salty groundwater zone (TDS > 3 g/L). This can provide information for the local groundwater development. All the confined groundwater in this study area can be pumped for drinking water; however, only the fresh unconfined groundwater zone can be selected as the water resource field.
The result of the groundwater hydrochemical types (Figure 2 and Figure 4) indicates that the HCO3 type groundwater, which means high quality water, is mainly located in the northern area. The HCO3 type groundwater can be supplied for a domestic water source. The SO42− type groundwater can be supplied for agricultural and industrial consumption. Thus, this study can support the reasonable utilization and management of differentiated water. In addition, the result of the hydrochemistry difference between unconfined and confined groundwater implies the weak connection between those two aquifers in the lacustrine plain area. This can provide information for the elaborate hydrogeological modeling study of the groundwater resource assessment. Furthermore, the results of the hydrochemistry evolution indicate that the hydrochemical composition of groundwater is derived from dissolutions of evaporite minerals (halite and gypsum) and carbonate minerals (such as calcite and dolomite), aluminosilicate weathering and cation exchange. This result of mineral sources of groundwater can provide basic data for the refined groundwater pollution research.

4. Conclusions

A comprehensive analysis of hydrochemical data of 123 water samples in the Delingla area were conducted to provide a basis for understanding the major ions origins, distribution, and associated hydrogeochemical evolutions along the flow path and supporting the the local groundwater resource management.
The results showed that groundwater hydrochemistry has obvious zoning distribution in this area. TDS of groundwater is gradually increasing from the mountain area to the lacustrine plain. Furthermore, groundwater is characterized by HCO3-Ca·Mg and HCO3·SO4-Ca·Mg types in the mountain area (recharge area), SO4·HCO3-Ca·Mg and SO4·Cl-Ca·Mg types in the alluvial-lacustrine plain (runoff area), and Cl·SO4-Na and Cl-Na types in the lacustrine plain (discharge area). The ions ratio relations, mineral saturation index, and mineral stability diagrams suggest that the dominating hydrochemical processes were dissolutions of evaporite minerals (halite and gypsum) and carbonate minerals (such as calcite and dolomite), aluminosilicates weathering, and cation exchange. The results of this study can provide references for further understanding of the groundwater geochemical evolution processes in this area and other similar areas. In addition, the hydrochemistry characteristics and groundwater evolution can guide the selection of water resource fields and provide information for the elaborate assessment and protection of groundwater resources.

Author Contributions

P.Z. and G.W. conceived and review & editing the manuscript; B.Z. wrote the original draft of the manuscript; D.Z. analyzed the chemistry data; F.L. plotted the figures; S.Q. analyzed the geochemistry process in the groundwater. All authors have read and agreed to the published version of the manuscript.

Funding

This work was supported by the National Natural Science Foundation of China (Grant Nos. 41672243, U1602233, 41272269) and the China Geological Survey Program (Grant Nos. 1212011121277, 12120115046301, DD20160291, DD20189270).

Conflicts of Interest

The authors declare no conflict of interest.

References

  1. Elgallal, M.; Fletcher, L.; Evans, B. Assessment of potential risks associated with chemicals in waste water used for irrigation in arid and semiarid zones: A review. Agric. Water Manag. 2016, 177, 419–431. [Google Scholar] [CrossRef]
  2. Lu, S.; Zhang, X.; Liang, P. Influence of drip irrigation by reclaimed water on the dynamic change of the nitrogen element in soil and tomato yield and quality. J. Clean Prod. 2016, 139, 561–566. [Google Scholar] [CrossRef]
  3. Wang, L.; Dong, Y.; Xie, Y.; Song, F.; Wei, Y.; Zhang, J. Distinct groundwater recharge sources and geochemical evolution of two adjacent sub-basins in the lower shule river basin, northwest China. Hydrogeol. J. 2016, 24, 1967–1979. [Google Scholar] [CrossRef]
  4. Xiao, Y.; Shao, J.L.; Cui, Y.L.; Zhang, G.; Zhang, Q.L. Groundwater circulation and hydrogeochemical evolution in Nomhon of Qaidam Basin, northwest China. J. Earth Syst. Sci. 2017, 126, 26. [Google Scholar] [CrossRef]
  5. Jiao, J.J.; Zhang, X.; Liu, Y.; Kuang, X. Increased water storage in the Qaidam Basin, the North Tibet Plateau from GRACE gravity data. PLoS ONE 2015, 1010, e0141442. [Google Scholar] [CrossRef] [PubMed] [Green Version]
  6. Li, P.; Qian, H.; Howard, K.W.F.; Wu, J. Building a new and sustainable “Silk Road economic belt”. Environ. Earth Sci. 2015, 74, 7267–7270. [Google Scholar] [CrossRef]
  7. Moral, F.; Cruz-Sanjulian, J.J.; Olias, M. Geochemical evolution of groundwater in the carbonate aquifers of Sierra de Segura (BeticCordillera, southern Spain). J. Hydrol. 2008, 360, 281–296. [Google Scholar] [CrossRef]
  8. Gastmans, D.; Chang, H.K.; Hutcheon, I. Groundwater geochemical evolution in the northern portion of the Guarani Aquifer System (Brazil) and its relationship to diagenetic features. Appl. Geochem. 2010, 25, 16–33. [Google Scholar] [CrossRef]
  9. Zhu, P.; Su, X.; Zhang, S.; Huang, Y.; Yang, F. Study on the Interaction Relationship between Surface Water and Groundwater in Nalingguole River Alluvial Proluvial Fan. Yellow River 2014, 36, 60–64. (In Chinese) [Google Scholar]
  10. Wagh, V.M.; Panaskar, D.B.; Varade, A.M.; Mukate, S.V.; Gaikwad, S.K.; Pawar, R.S.; Muley, A.A.; Aamalawar, M.L. Major ion chemistry and quality assessment of the groundwater resources of nandedtehsil, a part of Southeast Deccan Volcanic Province, Maharashtra, India. Environ. Earth Sci. 2016, 75, 1418. [Google Scholar] [CrossRef]
  11. Piper, A.M. A graphic procedure in the geochemical interpretation of water analysis. Eos. Trans. Am. Geophys. Union 1944, 25, 914–928. [Google Scholar] [CrossRef]
  12. Subrahmanyam, K.; Yadaiah, P. Assessment of the impact of industrial effluents on water quality in Patancheru and environs, Medak district, Andhra Pradesh, India. Hydrogeol. J. 2001, 9, 297–312. [Google Scholar] [CrossRef]
  13. Gibbs, R.J. Mechanisms controlling world water chemistry. Science 1970, 170, 1088–1090. [Google Scholar] [CrossRef] [PubMed]
  14. Adams, S.; Titus, R.; Pietersen, K.; Tredoux, G.; Harris, C. Hydrochemical characteristics of aquifers near Sutherland in the western Karoo, South Africa. J. Hydrol. 2001, 241, 91–103. [Google Scholar] [CrossRef] [Green Version]
  15. Walraevens, K.; Bakundukize, C.; Mtoni, Y.E.; Van Camp, M. Understanding the hydrogeochemical evolution of groundwater in Precambrian basement aquifers: A case study of Bugesera region in Burundi. J. Geochem. Explor. 2018, 188, 24–42. [Google Scholar] [CrossRef]
  16. Kim, K. Plagioclase weathering in the groundwater system of a sandy, silicate aquifer. Hydrol. Process. 2002, 16, 1793–1806. [Google Scholar] [CrossRef]
  17. Li, P.; Wu, H.; Qian, H. Assessment of groundwater quality for irrigation purposes and identification of hydrogeochemical evolution mechanisms in Pengyang County, China. Environ. Earth Sci. 2013, 69, 2211–2225. [Google Scholar] [CrossRef]
  18. Huang, X.J.; Wang, G.C.; Liang, X.Y.; Cui, L.F.; Ma, L.; Xu, Q. Hydrochemical and stable isotope (δD and δ18O) characteristics of groundwater and hydrogeochemical processes in the Ningtiaota Coalfield, Northwest China. Mine Water Environ. 2018, 37, 119–136. [Google Scholar] [CrossRef]
  19. Wen, X.H.; Wu, Y.Q.; Wu, J. Hydrochemical characteristics of groundwater in the Zhangye Basin, Northwestern China. Environ. Geol. 2008, 55, 1713–1724. [Google Scholar] [CrossRef]
  20. Parkhurst, D.L.; Appelo, C.A.J. User’s Guide to PHREEQC (Version 2) a Computer Program for Speciation, Batch-Reaction, One-Dimensional Transport, and Inverse Geochemical Calculations: U.S Geological Survey Water-Resources Investigations Report 99-4259. 1999. Available online: https://pubs.er.usgs.gov/publication/wri994259 (accessed on 21 October 2018).
  21. Zhang, X.Y.; Ma, H.Z.; Han, F.Q.; Chen, Z.H. Mineral Assemblages and Palaeo environmental Changes of Core DG03 of Gahai Lake in Delingha Basin. Acta Sedmentol. Sin. 2007, 25, 767. (In Chinese) [Google Scholar]
  22. Zhang, X.Y.; Qu, J.W.; Zhang, W. Age model and palaeo climatic changes of DG03 core of Gahai Lake in Delingha Basin. J. Ludong Univ. 2009, 25, 68–72. (In Chinese) [Google Scholar]
  23. Xing, L.; Guo, H.; Zhan, Y. Groundwater hydrochemical characteristics and processes along flow paths in the North China Plain. J. Asian Earth Sci. 2013, 70–71, 250–264. [Google Scholar] [CrossRef]
  24. Wang, Y.; Shvartsev, S.L.; Su, C. Genesis of arsenic/fluoride-enriched soda water: A case study at Datong, northern China. Appl. Geochem. 2009, 24, 641–649. [Google Scholar] [CrossRef]
Figure 1. Schematic map of the study area and sampling sites.
Water 12 00836 g001
Figure 2. Hydrogeological profile of A–A’.
Water 12 00836 g002
Figure 3. Piper diagram of all groundwater and surface water samples.
Water 12 00836 g003
Figure 4. The distribution map of water types and Total Dissolved Solids (TDS) in the Delingha area.
Water 12 00836 g004
Figure 5. Gibbs diagrams for the major-ion composition of the groundwater in the Delingha area.
Water 12 00836 g005
Figure 6. Scatter plots showing the correlation of major cations/anions to discriminate the geochemical processes. (a) Na+ vs. Cl, (b) Na+ vs. HCO3, (c) Ca2+ vs. SO42, (d) (SO42-+HCO3) vs. (Ca2++Mg2+), (e) Ca2+ vs. HCO3, (f) Mg2+ vs. HCO3, (g)HCO3 vs. K+, (h) scatter plot of Schoeller indices.
Water 12 00836 g006
Figure 7. Saturation indices plots with selected minerals versus TDS or ion concentration. (a) SIhalite vs. TDS, (b) SIgypsum, SIcalcite, SIdolomite vs. TDS, (c) Na+, Cl vs. SIhalite, (d) Ca2+,SO42− vs. SIgypsum, (e) Ca2+, HCO3 vs. SIcalcite, (f) Ca2+,Mg2+,HCO3 vs. SIdolomite.
Water 12 00836 g007
Figure 8. Stability diagram for silicate systems (a) Ca2+-H+-SiO2, (b) Mg2+-H+-SiO2, (c) Na+-H+-SiO2, (d) K+-H+-SiO2.
Water 12 00836 g008
Table 1. Summary of descriptive statistics of different hydrochemical parameters of all the 123 samples (including 6 surface water samples, 12 confined groundwater samples, and 105 unconfined groundwater samples).
Hydrochemical ComponentsUnconfined GroundwaterConfined GroundwaterSurface Water
MinMaxAverageMinMaxAverageMinMaxAverage
K+ (mg/L)0.549.56.92.65.03.61.26.63.7
Na+(mg/L)10.81885.0227.441.9150.082.08.9262.087.9
Ca2+(mg/L)26.1696.0112.625.274.454.16.791.464.4
Mg2+(mg/L)6.1410.053.512.442.023.01.478.426.2
Cl(mg/L)14.21887.0279.147.8111.067.13.5325.0113.8
SO42−(mg/L)12.54091.0346.543.5221.0106.821.4303.0126.2
HCO3 (mg/L)97.6579.0267.8170.0335.0237.217.9391.0198.7
TDS(mg/L)146.58954.01142.0314.0662.0443.152.01246.0514.0
pH7.008.007.978.009.008.088.008.008.00
Table 2. Correlation matrix for all water samples (n = 123).
Ion K + N a + C a 2 + M g 2 + C l S O 4 2 H C O 3 TDS
K + 1.000
Na + 0.7551.000
Ca 2 + 0.5910.5401.000
Mg 2 + 0.5950.6290.8581.000
Cl 0.7770.9740.4910.5851.000
SO 4 2 0.5120.5620.9150.8900.4431.000
HCO 3 0.3800.4210.5400.6060.3740.4921.000
TDS0.7750.9370.7860.8410.8930.7980.5321.000
Table 3. Weathering of minerals reactions and ions ratio in the groundwater.
ReactionsRatio
a 1NaCl(Halite) = Na+ + ClNa:Cl = 1:1
a 2CaSO4(Gypsum) = Ca2+ + SO4Ca:SO4 = 1:1
c 32NaAlSi3O8(Albite) + 9H2O + 2H2CO3 = Al2Si2O5(OH)4 + 2Na+ + 2HCO3 + 4H4SiO4Na:HCO3 = 1:1
c 4(Na0.82Ca0.18)Al1.18Si2.82O8(Plagioclase) + 1.18CO2 + 1.77H2O = 0.82Na+ + 0.18Ca2+ + 1.18HCO3 + 0.59Al2Si2O5(OH)4 + 1.64SiO2Na:HCO3 = 0.82:1.18
Ca:HCO3 = 0.18:0.59
b 52CaAl2Si2O8(Anorthite) + 4CO2 + 6H2O = 2Al2Si2O5(OH)4 + Ca2+ + 4HCO3Ca:HCO3 = 1:2
c 6CaMg0.7Fe0.3Si2O6(Pyroxene) + 3.4CO2 + 2.3H2O = Ca2+ + 0.7Mg2+ + 2SiO2 + 3.4HCO3 + 0.3H+ + 0.3Fe(OH)3Ca:HCO3 = 1:1.7
Mg:HCO3 = 0.7:1.7
b 7Ca2Mg5Si8O22(OH)2(Ampibole) + 14CO2 + 22H2O = 2Ca2+ + 5Mg2+ + 14HCO3 + 8H4SiO4Ca:HCO3 = 2:7
Mg:HCO3 = 5:7
b 82K(Mg2Fe)(AlSi3)O10(OH)2(Biotite) + 5H2CO3 + 7H2CO3 + 7H2O = Al2Si2O5(OH)4 + 2K+ + 4Mg2+ + 2Fe(OH)3 + 4H4SiO4 + 5HCO3Mg:HCO3 = 4:5
K:HCO3 = 5:2
b 92KAlSi3O8(K-feldspar) + 9H2O + 2H2CO3 = Al2Si2O5(OH)4 + 2K+ + 2HCO3 + 4H4SiO4K:HCO3 = 1:1
b 10CaCO3 + CO2 + H2O = Ca2+ + 2HCO3Ca:HCO3 = 1:2
b 11CaMg(CO3)2 + 2CO2 + 2H2O = Ca2+ + Mg2+ + 4HCO3Ca:HCO3 = 1:2
Mg:HCO3 = 1:2
NOTE: a Taken from [14], b taken from [15], c taken from [16].
Table 4. Saturation index of minerals (carbonate, gypsum, halite, silicate, and quartz) in groundwater.
Saturation Index of MineralsMinMaxAverageStandard Deviation
SIcalcite−0.731.340.180.49
SIdolomite−1.733.120.210.97
SIgypsum−2.670.12−1.400.48
SIhalite−8.35−3.23−6.440.82
SIquartz−1.760.62−0.760.86
SIillite−11.411.51−5.815.13
SIK-feldspar−6.890.24−3.812.59
SIalbite−7.48−0.89−4.722.57
SIgibbsite−3.320.58−1.641.74
SIkaolinite−9.192.90−3.985.19
SImontmorillonite−14.211.80−7.316.62
Table 5. Mineral content percentage in the study area [21,22]. (SD: Standard Deviation, CV: Coefficient of Variation).
Mineral ContentQuartzPlagioclaseMicroclineIlliteChloriteCalciteDolomiteGypsumHalite
Mean (%)44.2211.706.087.036.0718.022.732.901.09
Max (%)77.4132.5318.3823.2223.6252.319.4983.444.62
Min (%)0.501.920.000.980.023.080.000.000.00
SD13.105.073.665.024.287.031.6212.801.28
CV (%)30.7043.3860.1471.4570.5339.0159.13441.31118.21
Table 6. Groundwater ages in the study area.
Sampling Point LocationGroundwater Age (ka)
Delingha City Water Source Well (DCWSW)5.165 ± 0.04
BK35.17 ± 0.17
QZ25.38 ± 0.2
QZ47.05 ± 0.17
Confined Groundwater of Gahai Lake5.385 ± 0.06

