Trends and Extremes of Drought Episodes in Vietnam Sub-Regions during 1980–2017 at Different Timescales


 ,
,  , , ,
, , ,  and
and
Abstract
:
1. Introduction
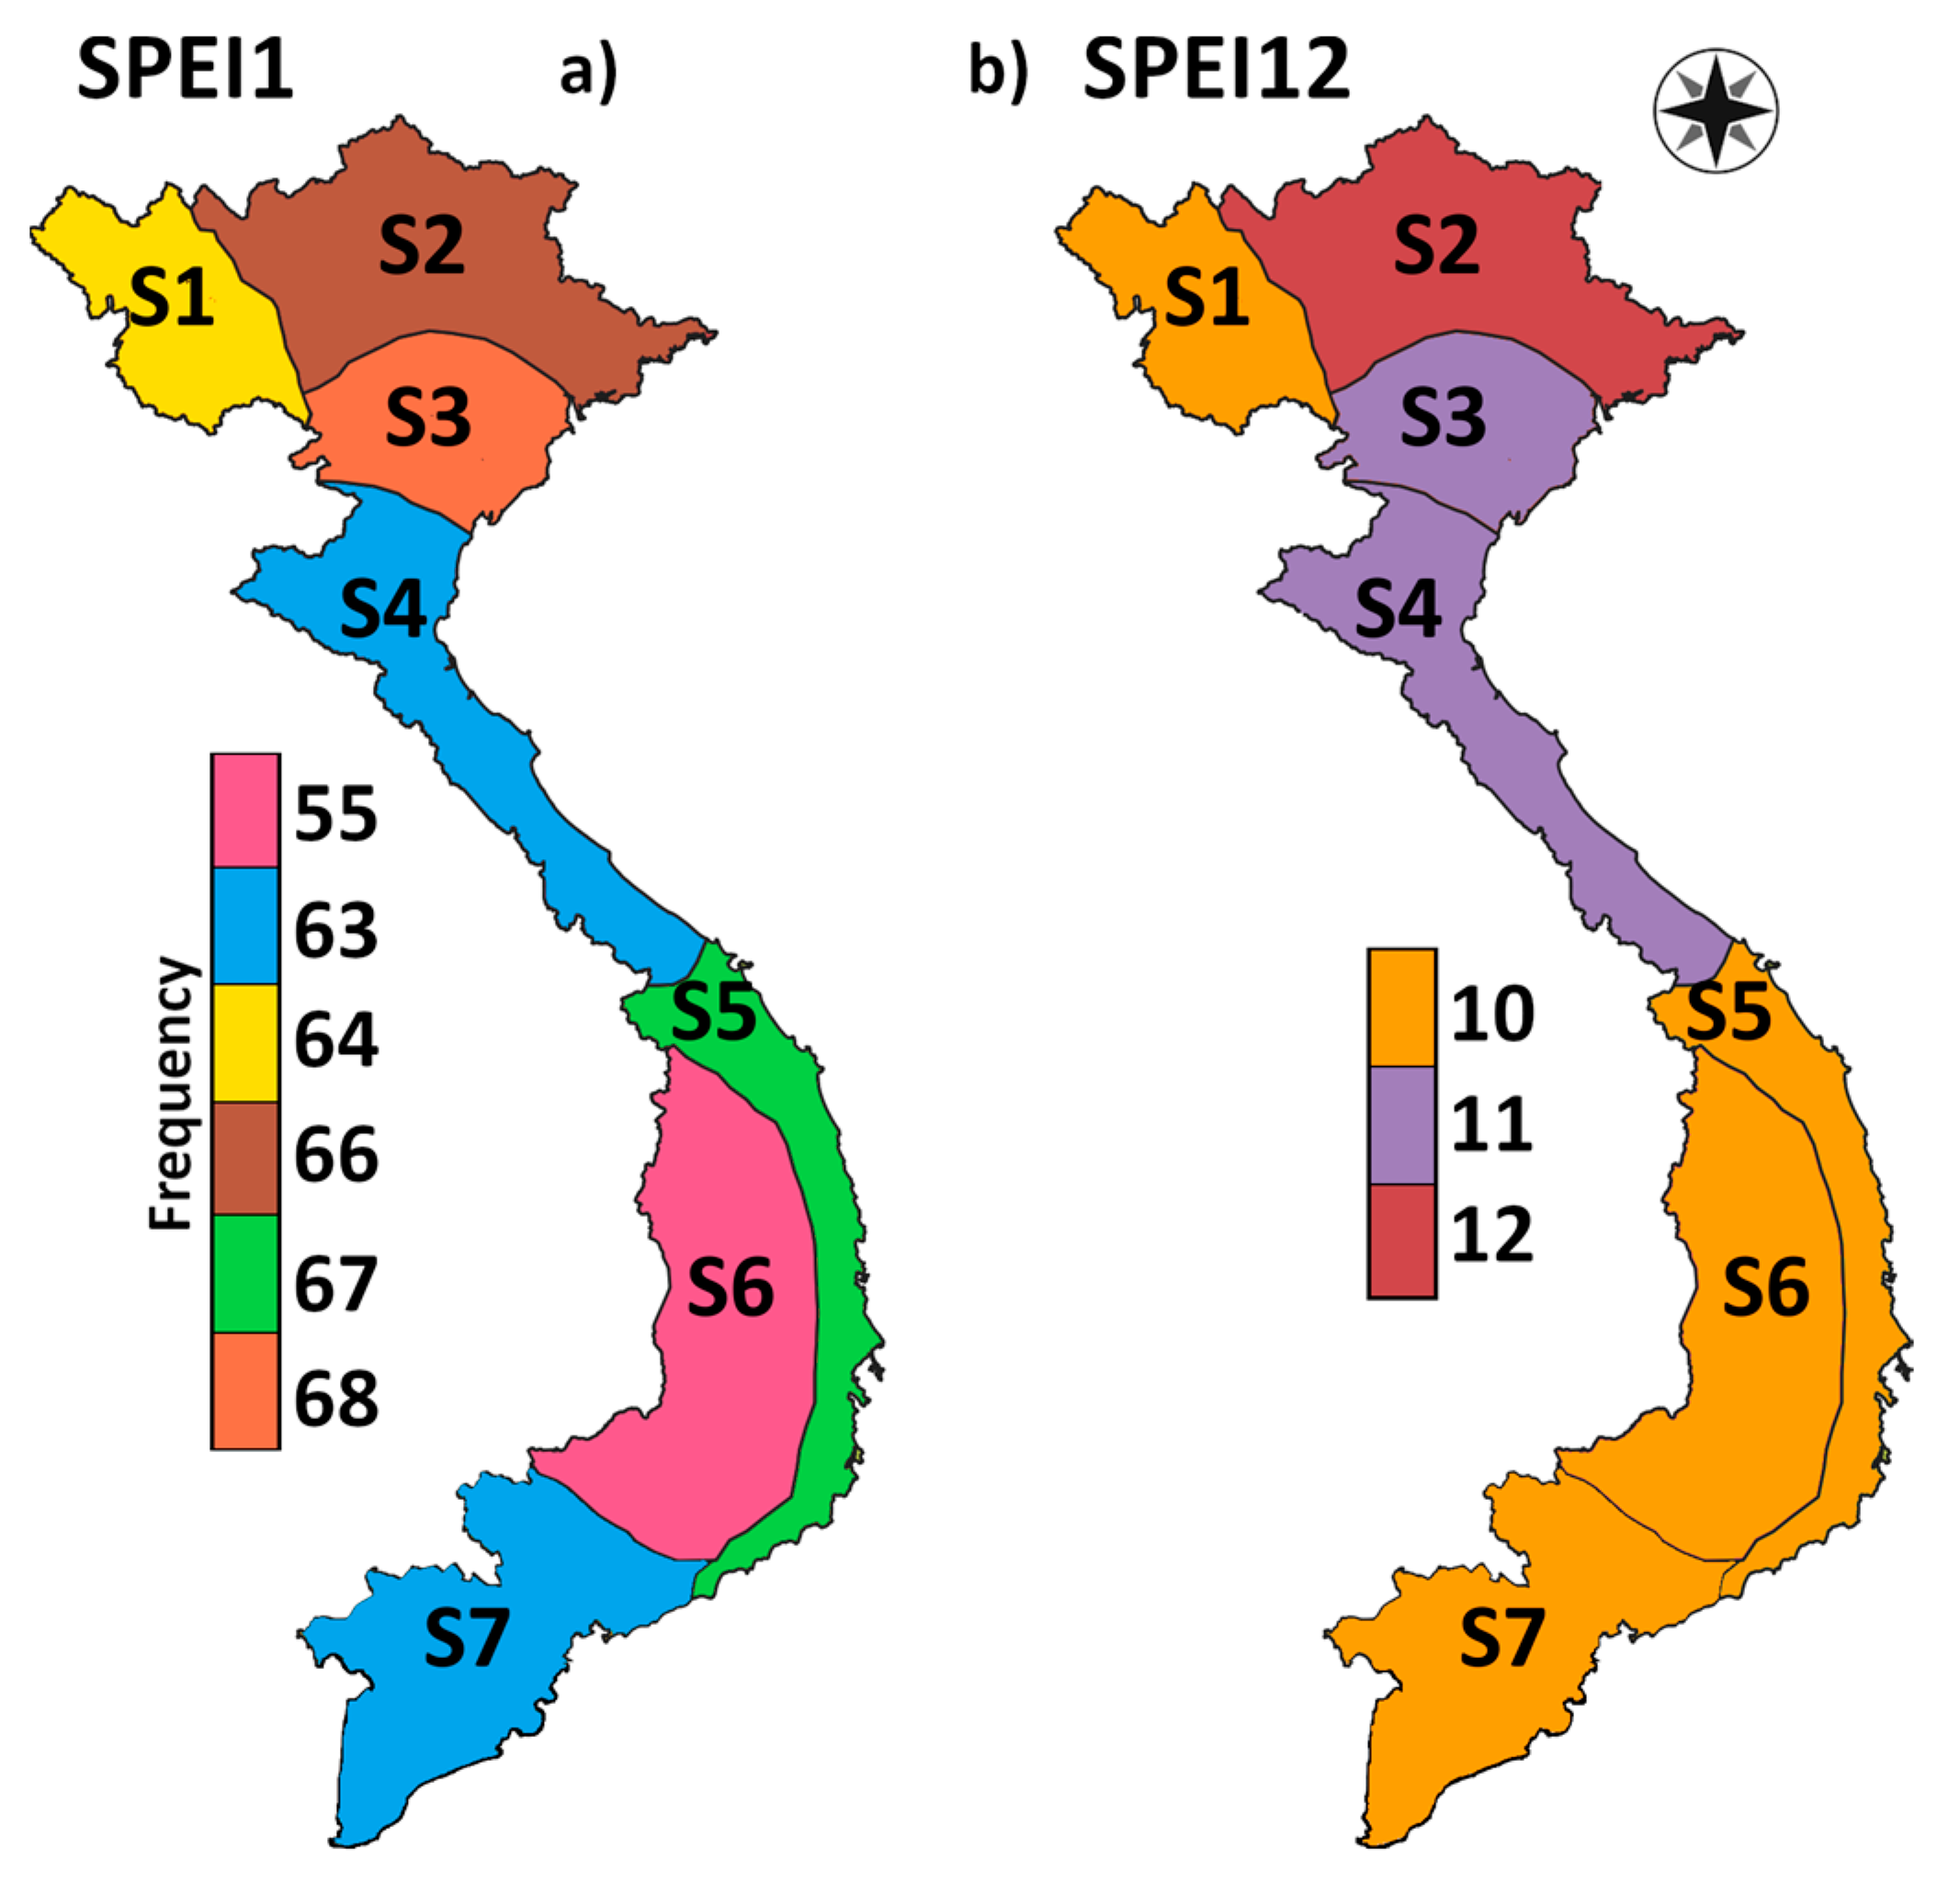
Study Area
2. Data and Methodology
2.1. Drought Identification
2.2. Data
3. Results and Discussion
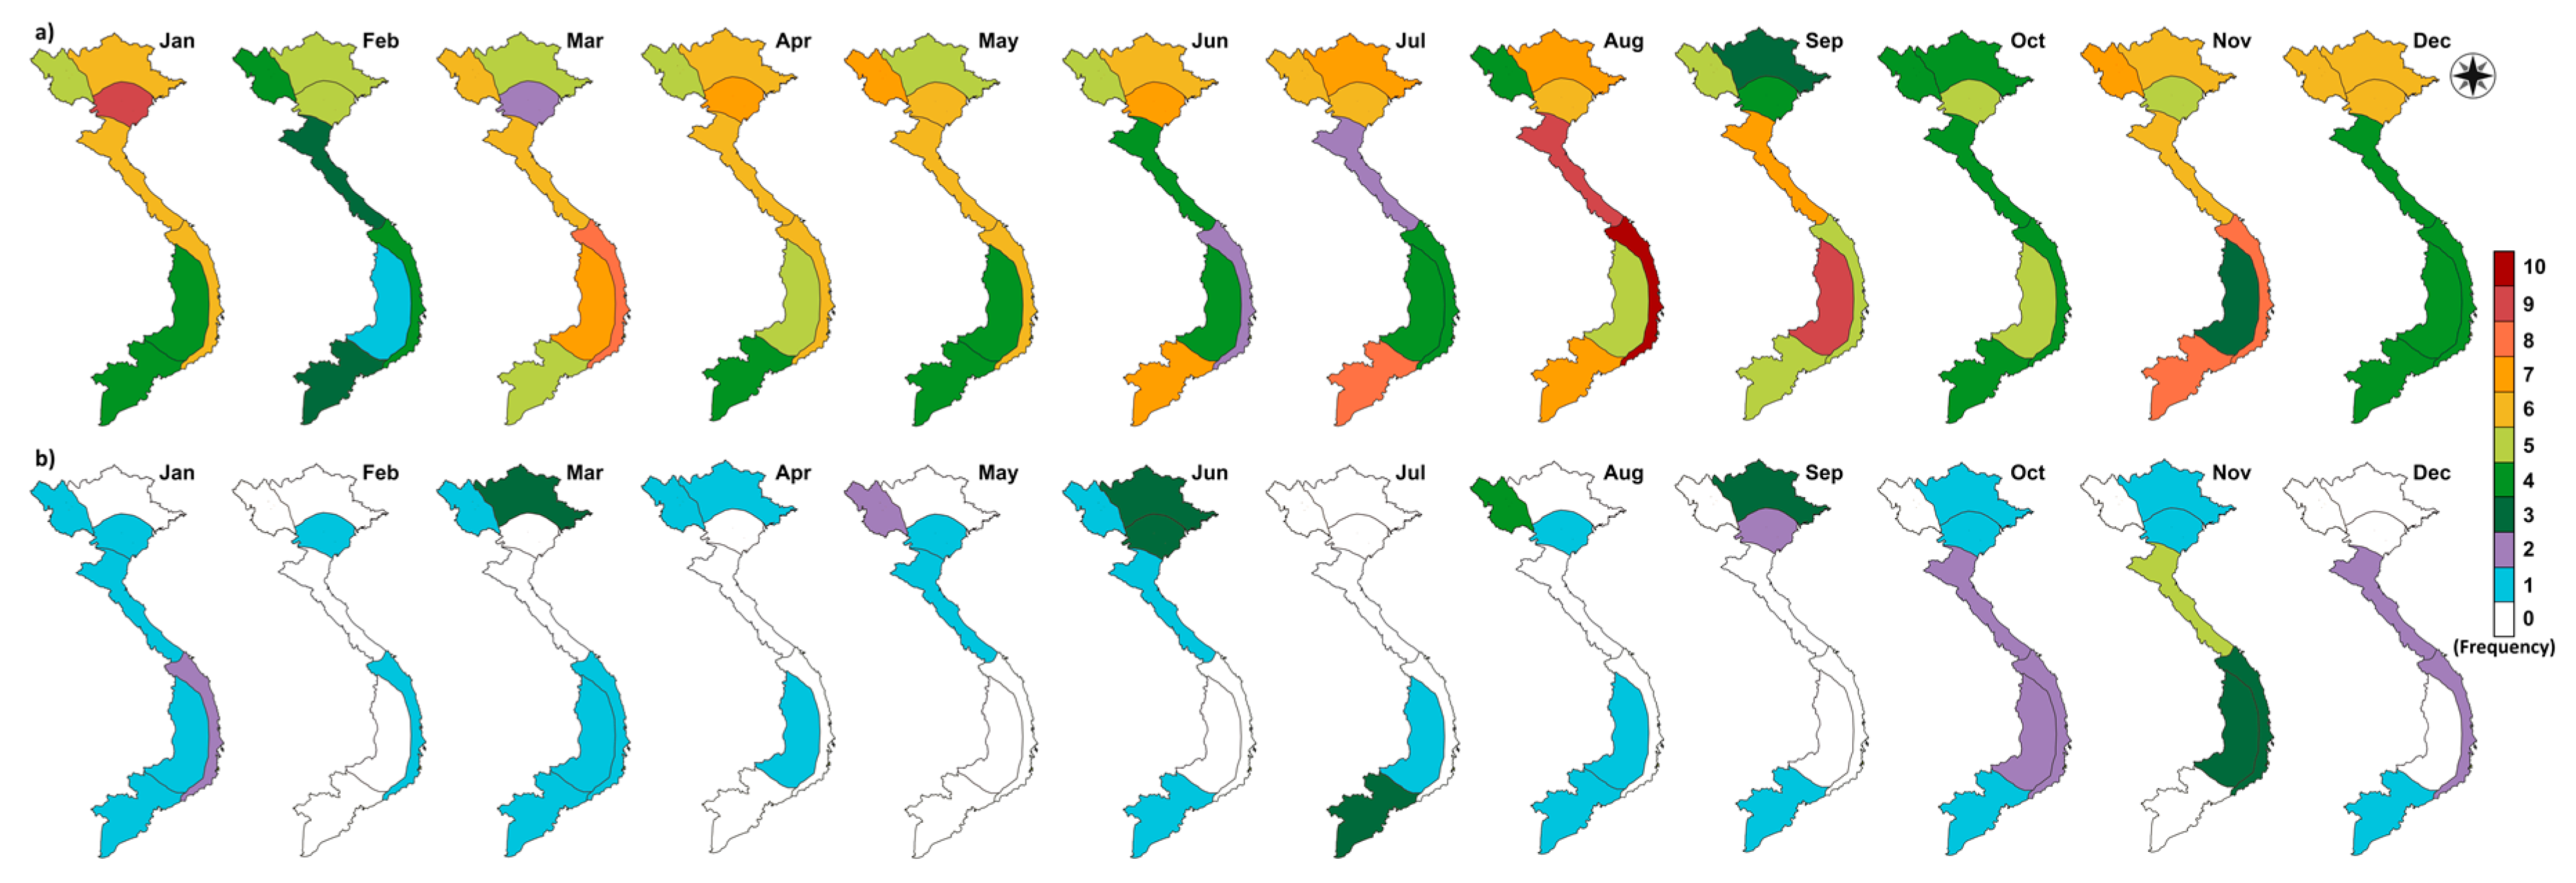
3.1. Climatological Annual Cycle
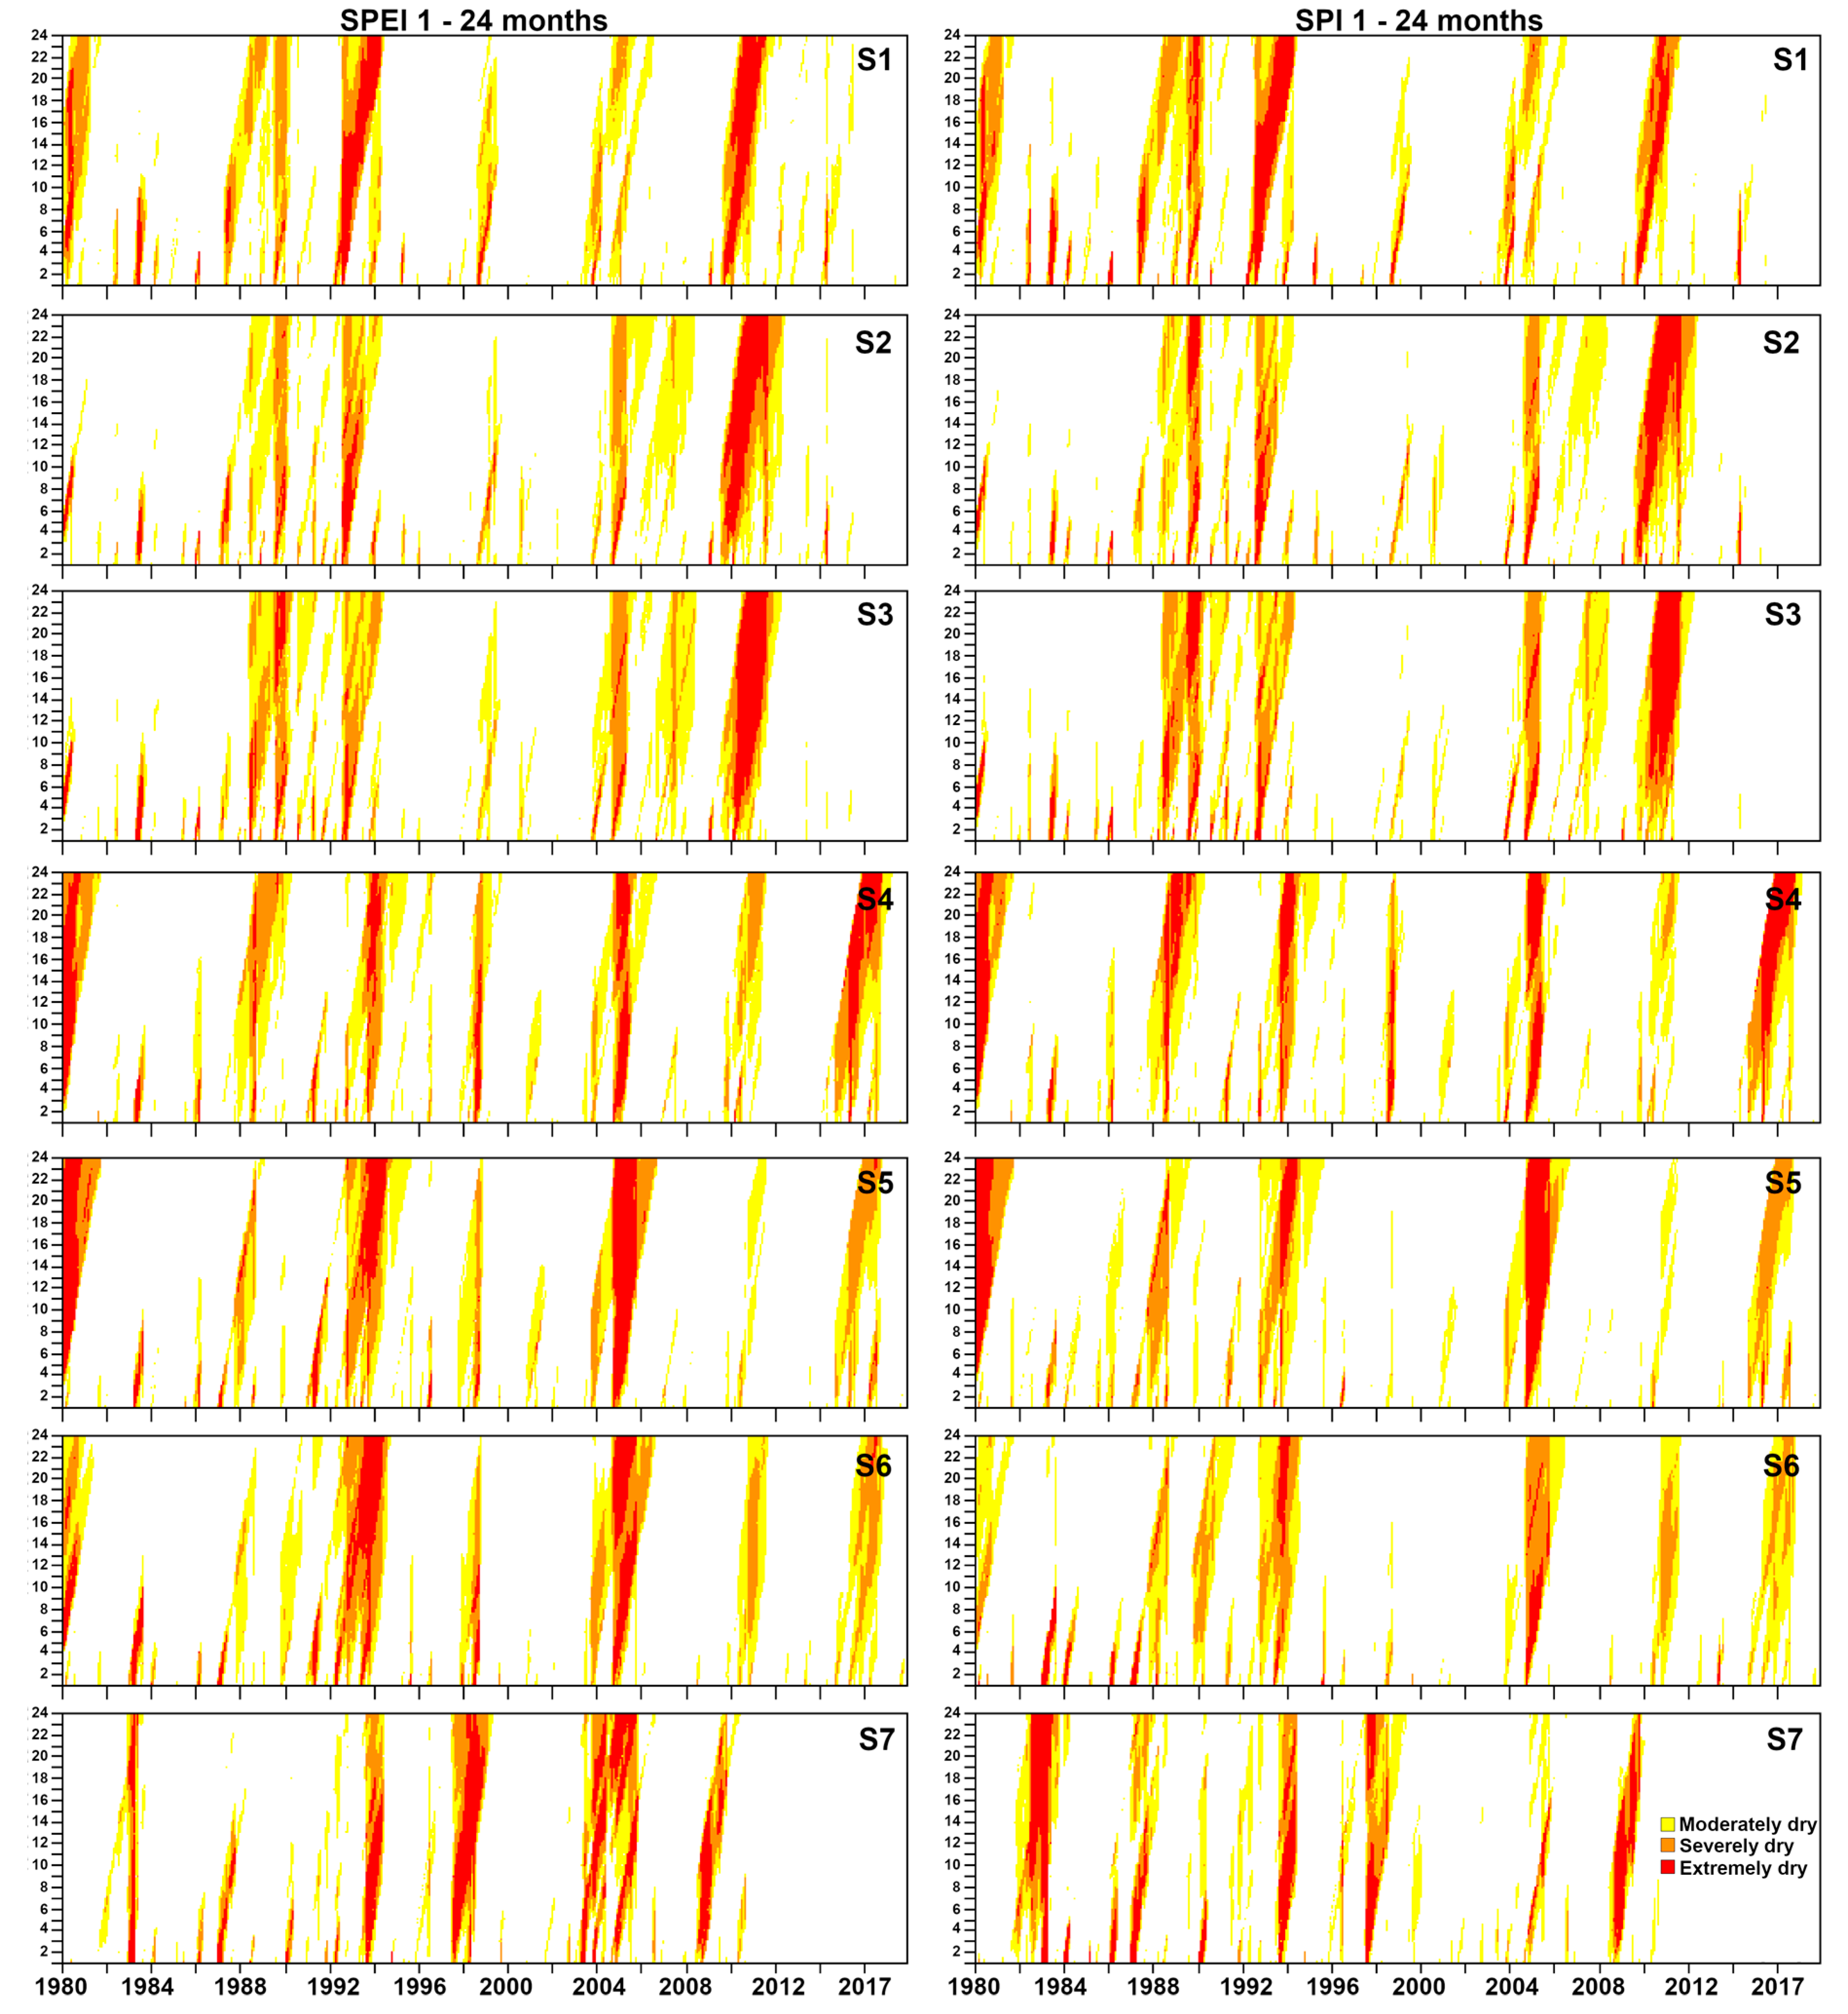
3.2. Drought Conditions
3.3. Drought Episodes
3.3.1. Characteristics of the Most Severe Meteorological Drought Episodes
3.3.2. Long-term Drought Episodes
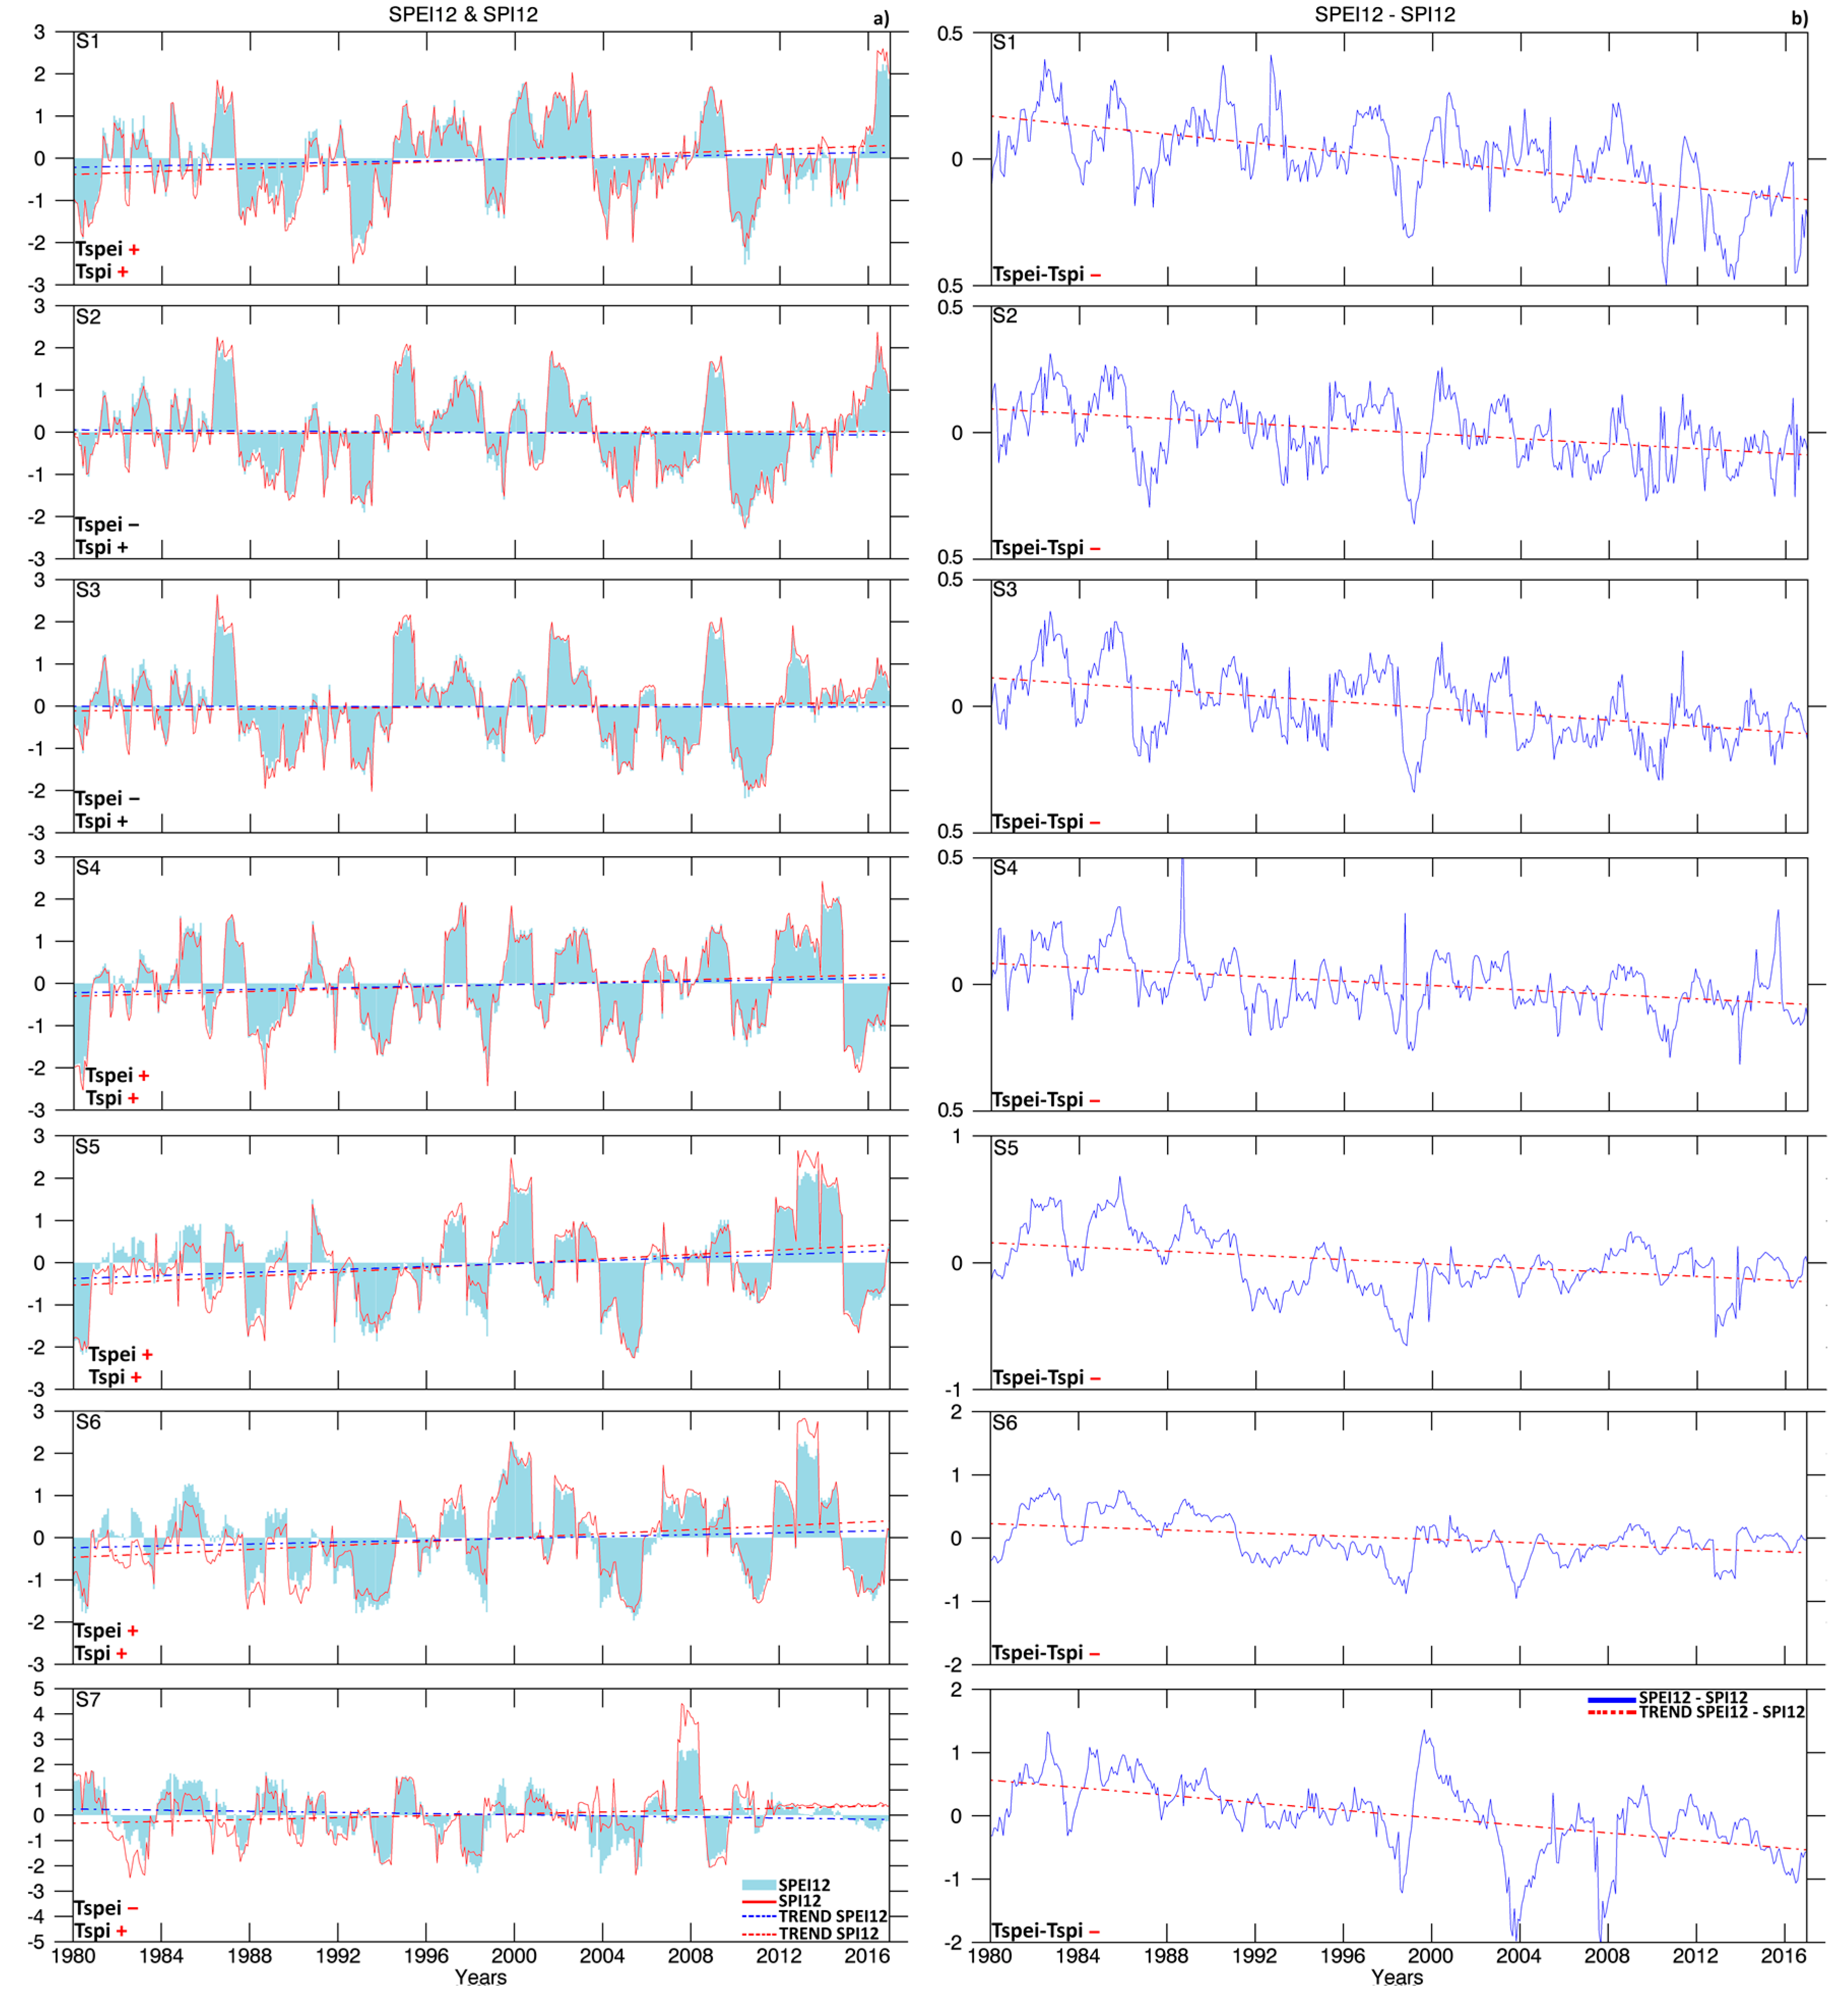
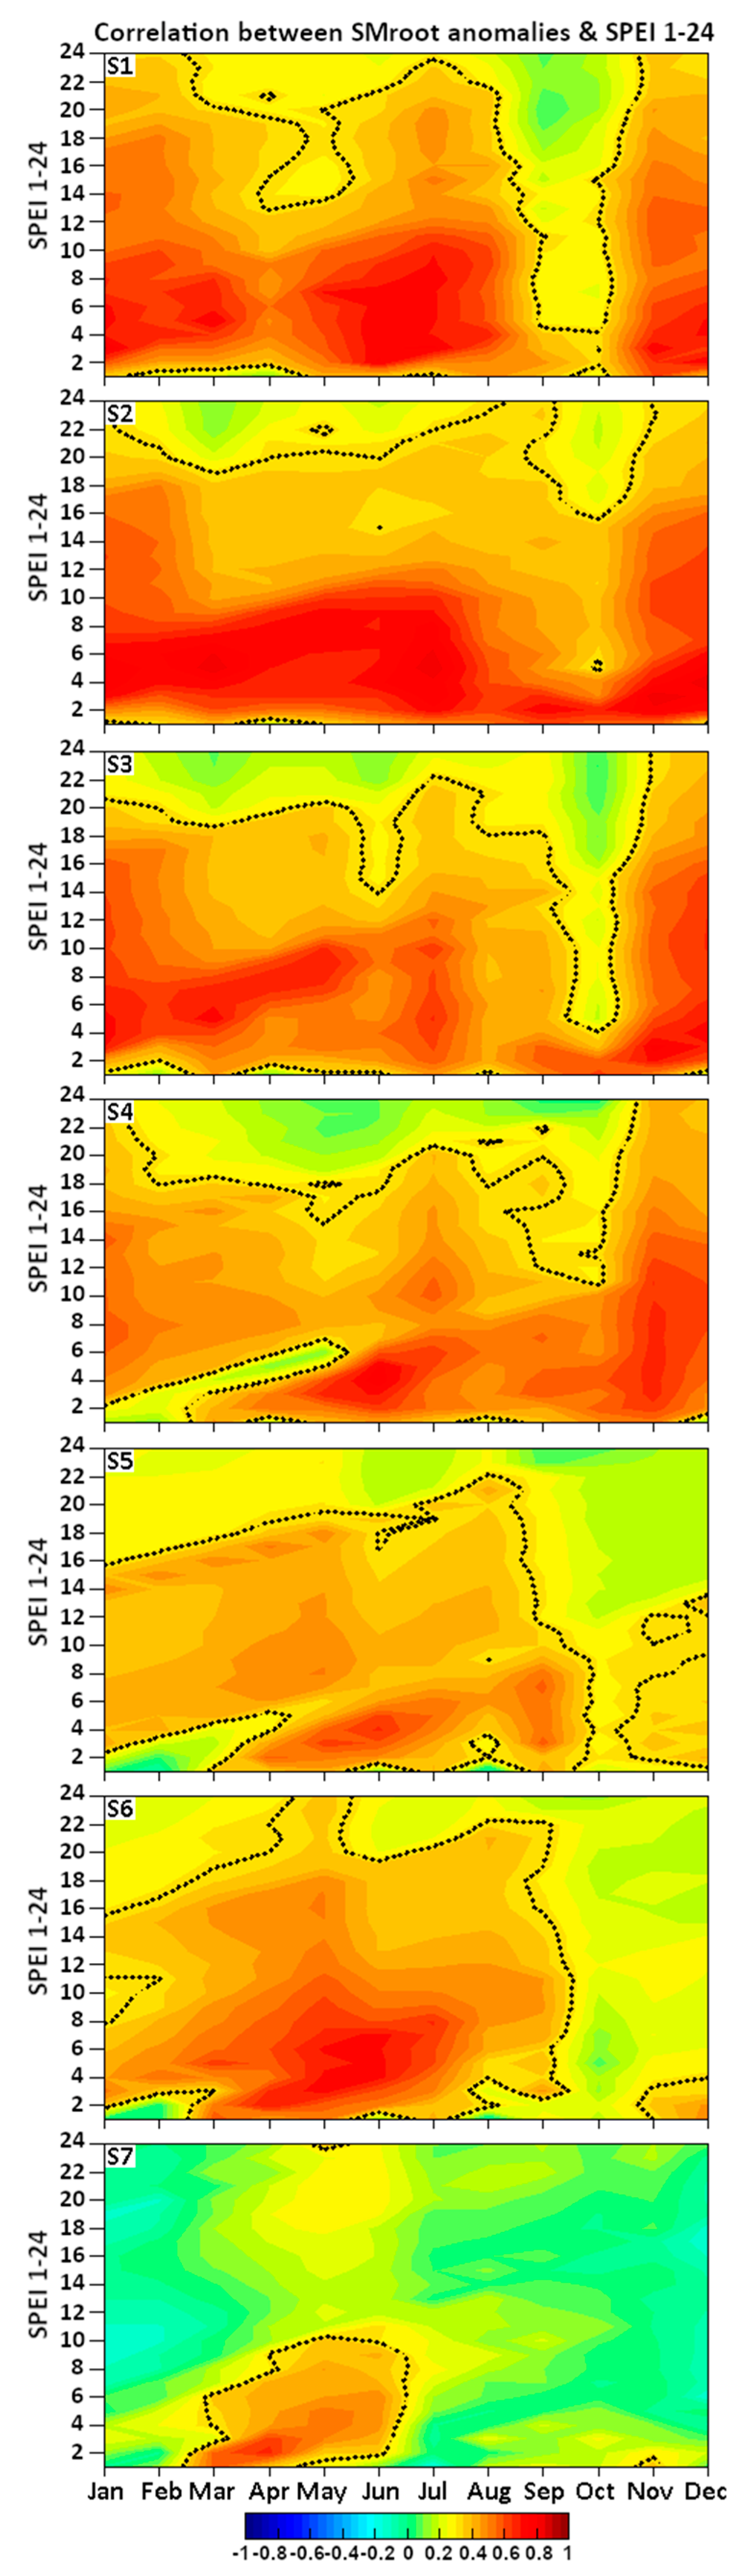
4. Drought Propagation
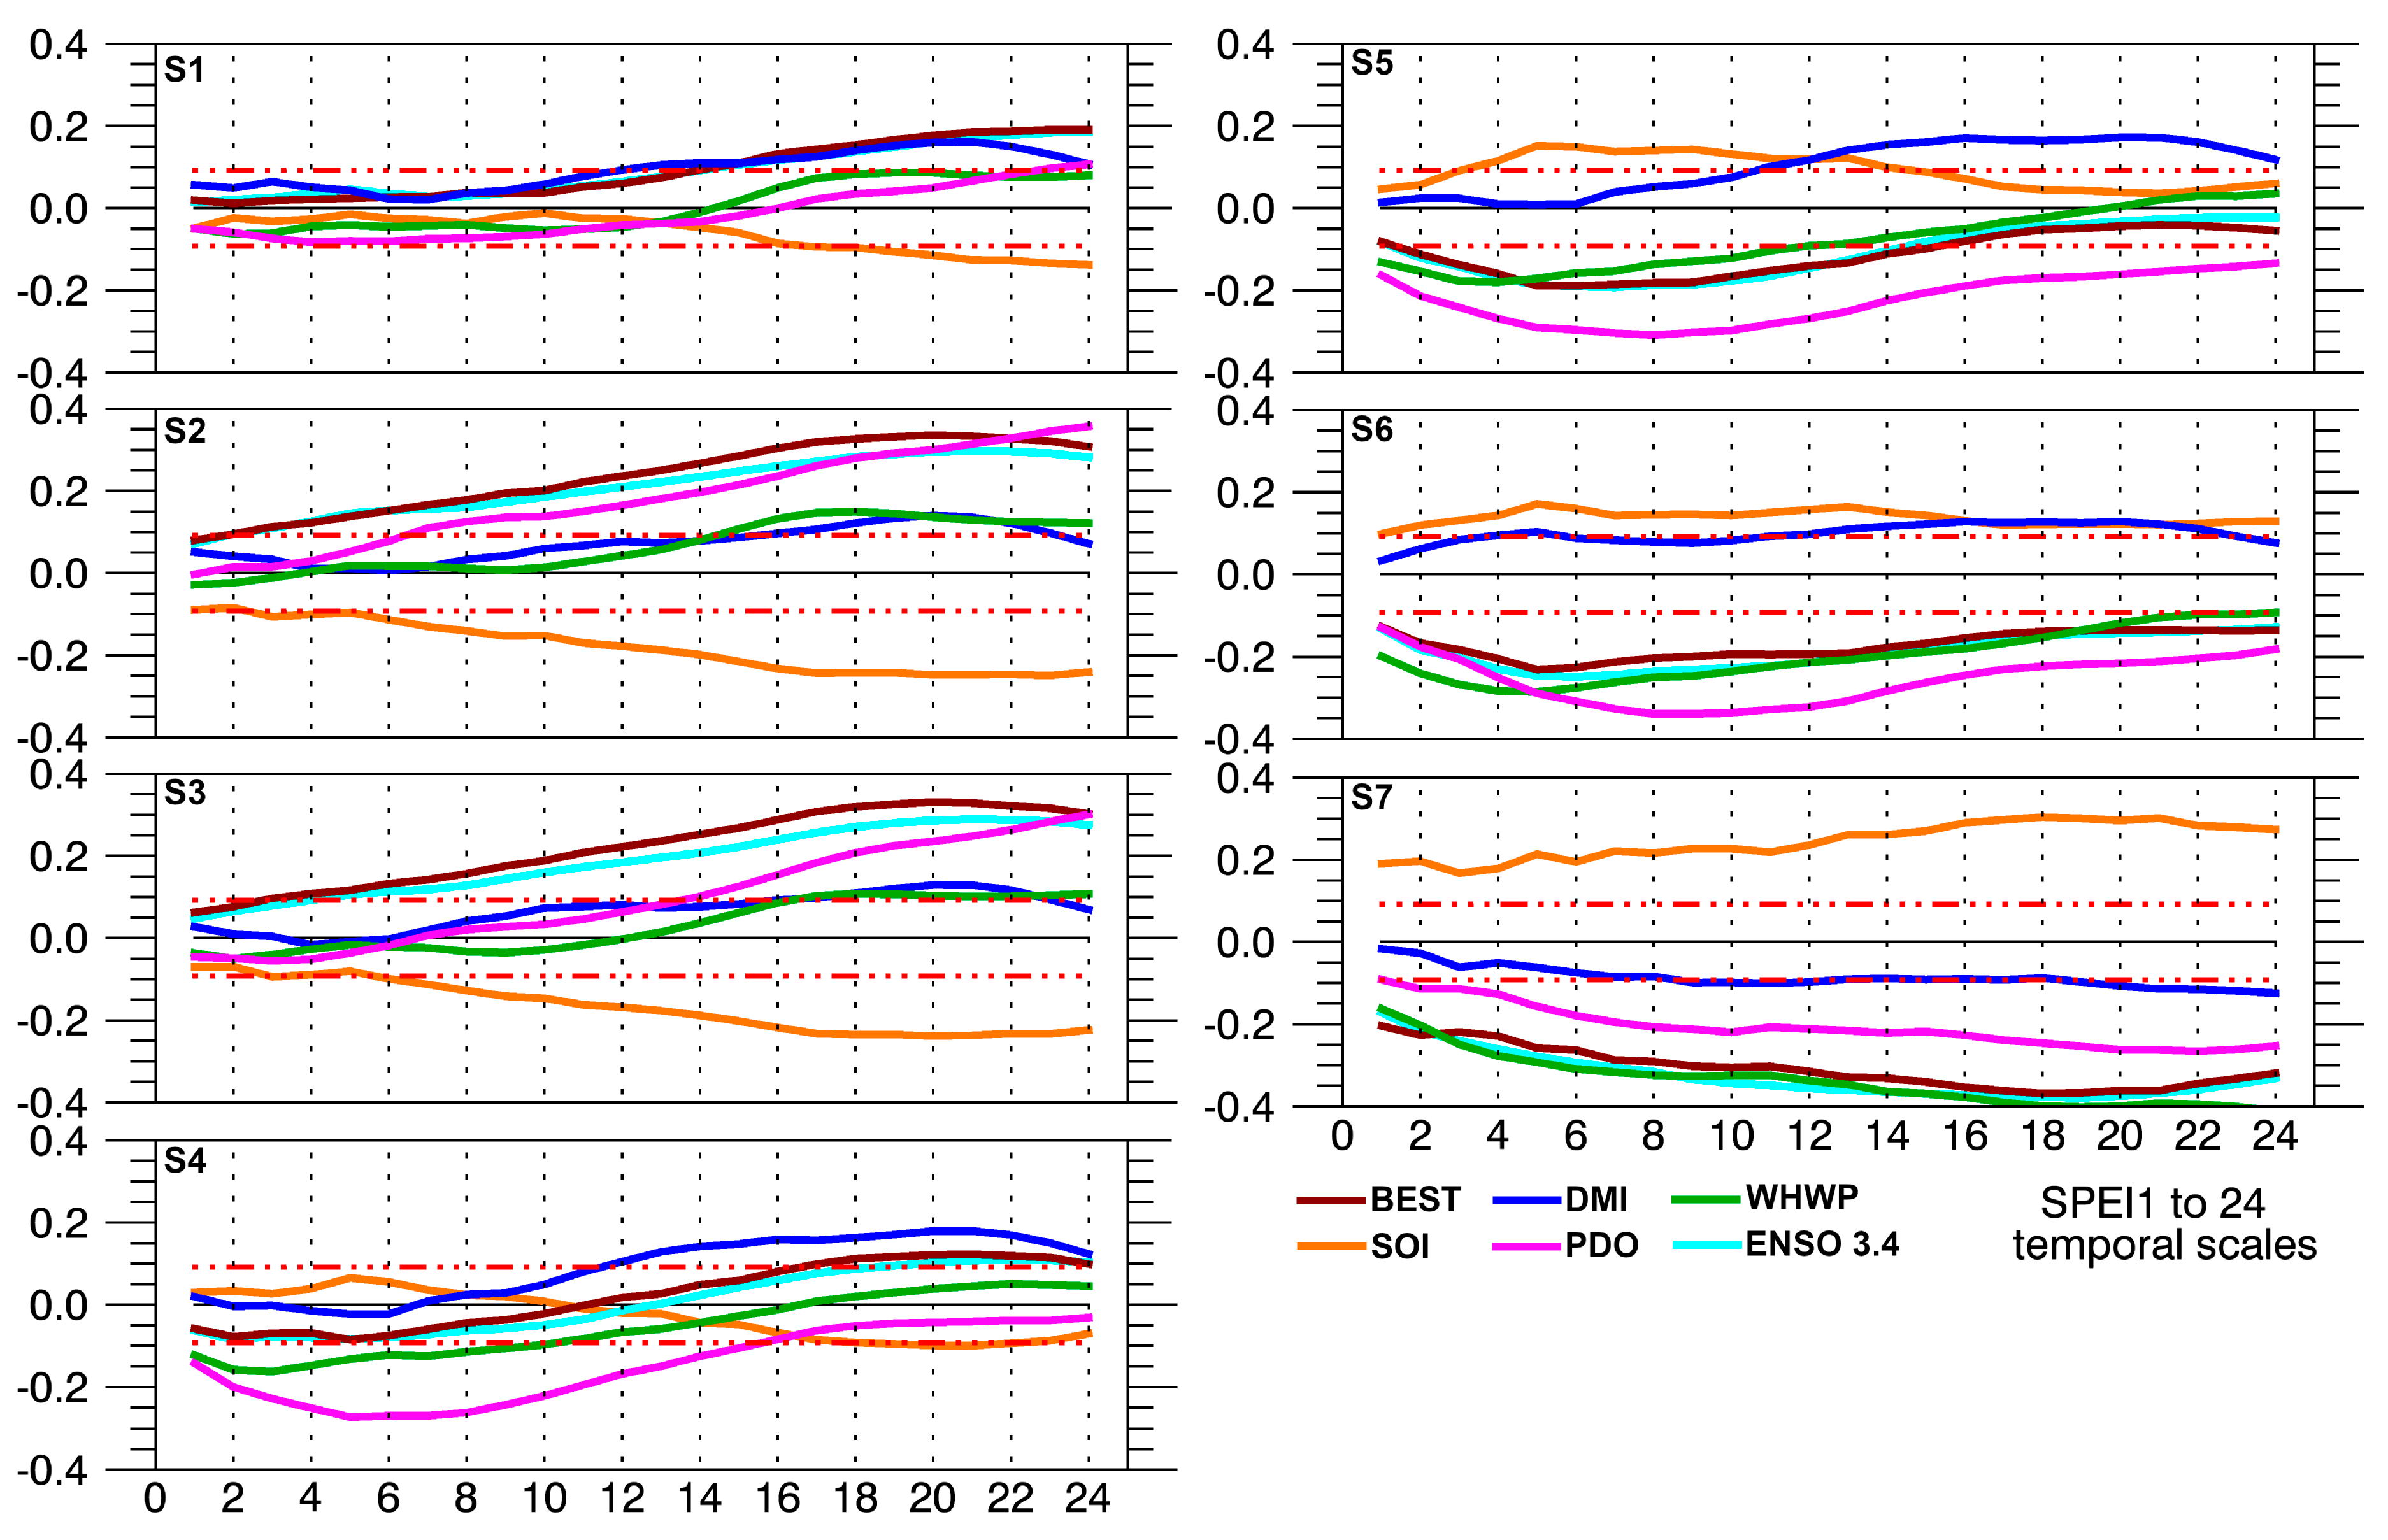
5. Drought and Teleconnection Patterns Relationship
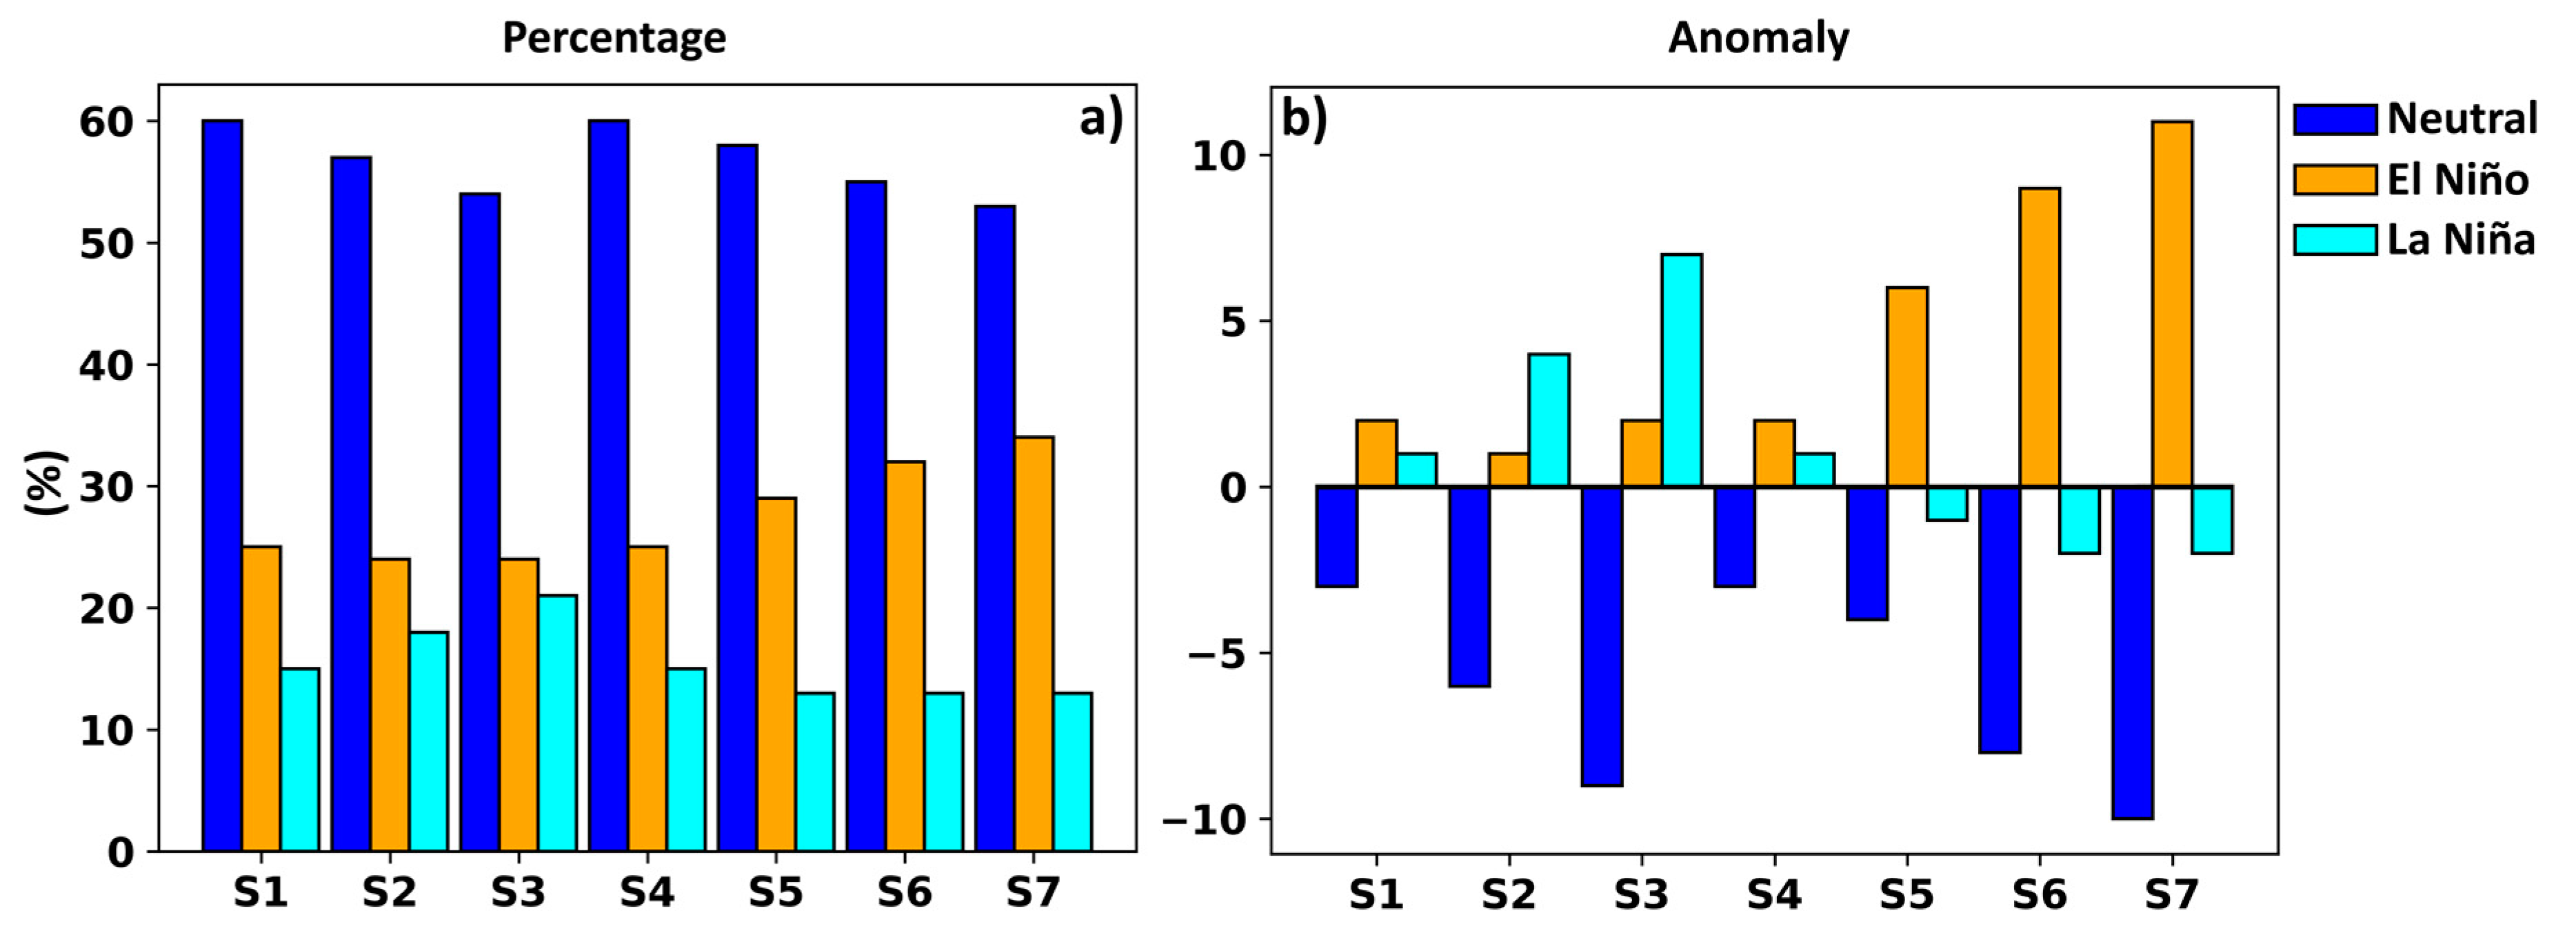
The ENSO Influence during Drought Episodes
6. Conclusions
Supplementary Materials
Author Contributions
Funding
Acknowledgments
Conflicts of Interest
References
- Mishra, A.K.; Singh, V.P. A review of drought concepts. J. Hydrol. 2010, 391, 202–216. [Google Scholar] [CrossRef]
- Dai, A. Drought under global warming: A review. WIREs Clim. Chang. 2010, 2, 45–65. [Google Scholar] [CrossRef] [Green Version]
- Trenberth, K.E.; Dai, A.; Van Der Schrier, G.; Jones, P.D.; Barichivich, J.; Briffa, K.R.; Sheffield, J. Global warming and changes in drought. Nat. Clim. Chang. 2014, 4, 17–22. [Google Scholar] [CrossRef]
- Heim, R.R. A Review of Twentieth‒Century Drought Indices Used in the United States. Bull. Am. Meteor. Soc. 2002, 83, 1149–1165. [Google Scholar] [CrossRef] [Green Version]
- Wilhite, D.A.; Sivakumar, M.V.K.; Pulwarty, R. Managing drought risk in a changing climate: The role of national drought policy. Weather Clim. Extrem. 2014, 3, 4–13. [Google Scholar] [CrossRef] [Green Version]
- Otkin, J.A.; Svodoba, M.; Hunt, E.D.; Ford, T.W.; Anderson, M.C.; Hain, C.; Basara, B. Flash Droughts: A Review and Assessment of the Challenges Imposed by Rapid-Onset Droughts in the United States. Bull. Am. Meteor. Soc. 2017, 911–919. [Google Scholar] [CrossRef]
- Naumann, G.; Alfieri, L.; Wyser, K.; Mentaschi, L.; Betts, R.A.; Carrao, H.; Spinoni, J.; Vogt, J.; Feyen, L. Global changes in drought conditions under different levels of warming. Geophys. Res. Lett. 2018, 45. [Google Scholar] [CrossRef]
- Lloyd-Hughes, B. The impracticality of a universal drought definition. Theor. Appl. Climatol. 2013, 117, 607–611. [Google Scholar] [CrossRef] [Green Version]
- Leelaruban, N.; Padmanabhan, G. Drought Occurrences and Their Characteristics across Selected Spatial Scales in the Contiguous United States. Geosciences 2017, 7, 59. [Google Scholar] [CrossRef] [Green Version]
- Wang, R.; Peng, W.; Liu, X.; Wu, W.; Chen, X.; Zhang, S. Responses of Water Level in China’s Largest Freshwater Lake to the Meteorological Drought Index (SPEI) in the Past Five Decades. Water 2018, 10, 137. [Google Scholar] [CrossRef] [Green Version]
- Tallaksen, L.M.; Van Lanen, H.A.J. Hydrological drought: Processes and estimation methods for streamflow and groundwater. In Developments in Water Science; Elsevier Science, B.V.: Amsterdam, The Netherlands, 2004; Volume 48. [Google Scholar]
- Ionita, M.; Tallaksen, L.M.; Kingston, D.G.; Stagge, J.H.; Laaha, G.; Van Lanen, H.A.J.; Scholz, P.; Chelcea, S.M.; Haslinger, K. The European 2015 drought from a climatological perspective. Hydrol. Earth Syst. Sci. 2017, 21, 1397–1419. [Google Scholar] [CrossRef] [Green Version]
- Ebi, K.L.; Bowen, K. Extreme events as sources of health vulnerability: Drought as an example. Weather Clim. Extrem. 2015, 11, 95–102. [Google Scholar] [CrossRef] [Green Version]
- World Meteorological Organization. Drought Monitoring and Early Warning: Concepts, Progress and Future Challenges. 2006. Available online: http://www.wamis.org/agm/pubs/brochures/WMO1006e.pdf (accessed on 20 November 2019).
- Keyantash, J.; Dracup, J.A. The quantification of drought: An evaluation of drought indices. Bull. Am. Meteorol. Soc. 2002, 83, 1167–1180. [Google Scholar] [CrossRef]
- Vicente-Serrano, S.M.; Van der Schrier, G.; Beguería, S.; Azorin-Molina, C.; Lopez-Moreno, J.I. Contribution of precipitation and reference evapotranspiration to drought indices under different climates. J. Hydrol. 2015, 426, 42–54. [Google Scholar] [CrossRef] [Green Version]
- Hanel, M.; Rakovec, O.; Markonis, Y.; Máca, P.; Samaniego, L.; Kysely, J.; Kumar, R. Revisitng the recent European droughts from a long-term perspective. Sci. Rep. 2018, 8, 9499. [Google Scholar] [CrossRef]
- Spinoni, J.; Naumann, G.; Vogt, J.; Barbosa, P. Meteorological Droughts in Europe: Events and Impacts: Past Trends and Future Projections. 2016. Available online: http://www.droughtmanagement.info/literature/EC-JRC_Report%20on%20Droughts%20in%20Europe_2016.pdf (accessed on 20 November 2019).
- Liberato, M.L.R. Exceptionally extreme drought in Madeira Archipelago in 2012: Vegetation impacts and driving conditions. Agric. For. Meteorol. 2017, 232, 195–209. [Google Scholar] [CrossRef]
- Wang, Z.; Li, J.; Lai, C.; Zeng, Z.; Zhong, R.; Chen, X.; Zhou, X.; Wang, M. Does drought in China show a significant decreasing trend from 1961 to 2009? Sci. Total Environ. 2017, 579, 314–324. [Google Scholar] [CrossRef]
- Hoerling, M.; Eischeid, J.; Perlwitz, J.; Quan, X.; Zhang, T.; Pegion, P. On the increased frequency of Mediterranean drought. J. Clim. 2012, 25, 2146–2161. [Google Scholar] [CrossRef] [Green Version]
- Vicente-Serrano, S.M.; Lopez-Moreno, J.I.; Beguería, S.; Lorenzo-Lacruz, J.; Sanchez-Lorenzo, A.; García-Ruiz, J.M.; Azorin-Molina, C.; Morán-Tejeda, E.; Revuelto, J.; Trigo, R.; et al. Evidence of increasing drought severity caused by temperature rise in southern Europe. Environ. Res. Lett. 2014, 9, 044001. [Google Scholar] [CrossRef]
- Naumann, G.; Spinoni, J.; Vogt, J.V.; Barbosa, P. Assessment of drought damages and their uncertainties in Europe. Environ. Res. Lett. 2015, 10, 124013. [Google Scholar] [CrossRef]
- Spinoni, J.; Antofie, T.; Barbosa, P.; Bihari, Z.; Lakatos, M.; Szalai, S.; Szentimrey, T.; Vogt, J. An overview of drought events in the Carpathian Region in 1961–2010. Adv. Sci. Res. 2013, 10, 21–32. [Google Scholar] [CrossRef] [Green Version]
- Forzieri, G.; Feyen, L.; Rojas, R.; Flörke, M.; Wimmer, F.; Bianchi, A. Ensemble projections of future streamflow droughts in Europe. Hydrol. Earth Syst. Sci. 2014, 18, 85–108. [Google Scholar] [CrossRef] [Green Version]
- Gudmundsson, L.; Seneviratne, S.I. European drought trends. Hydrol. Sci. 2015, 369, 75–79. [Google Scholar] [CrossRef] [Green Version]
- Sheffield, J.; Wood, E.F.; Roderick, M.L. Little change in global drought over the past 60 years. Nature 2012, 491, 435–438. [Google Scholar] [CrossRef] [PubMed]
- Masih, I.; Maskey, S.; Mussá, F.; Trambauer, P. A review of droughts on the African continent: A geospatial and long-term perspective. Hydrol. Earth Syst. Sci. 2014, 18, 3635–3649. [Google Scholar] [CrossRef] [Green Version]
- Nguyen, P.L.; Nguyen, M.D. Drought Adaptation and Coping Strategies among Coffee Farmers in the Central Highlands of Vietnam. J. Agric. Environ. Sci. 2018, 8, 52–66. [Google Scholar] [CrossRef]
- Qian, W.H.; Shan, X.L.; Zhu, Y.F. Ranking regional drought events in China for 1960–2009. Adv. Atmos. Sci. 2011, 28, 310–321. [Google Scholar] [CrossRef]
- Yu, M.; Li, Q.; Hayes, M.J.; Svoboda, M.D.; Heim, R.R. Are droughts becoming more frequent or severe in China based on the Standardized Precipitation Evapotranspiration Index: 1951–2010? Int. J. Climatol. 2013, 34, 545–558. [Google Scholar] [CrossRef]
- Tue, M.V.; Raghavan, S.V.; Pham, D.M.; Liong, S.Y. Investigating drought over the Central Highland, Vietnam, using regional climate models. J. Hydrol. 2015, 526, 265–273. [Google Scholar] [CrossRef]
- Vu, M.T.; Raghavan, V.S.; Liong, S.Y. Ensemble climate projection for hydrometeorological drought over a river basin in central highland. Vietnam. KSCE J. Civil Eng. 2015, 19, 427–433. [Google Scholar] [CrossRef]
- Ho, C. The Climate Change in Vietnam and Its Impact on Agricultural Sector in Vietnam. Conference in SESAM, UPLB, Philippines. 2018. Available online: https://www.researchgate.net/publication/329024730_THE_CLIMATE_CHANGE_IN_VIETNAM_AND_ITS_IMPACT_ON_AGRICULTURAL_SECTOR_IN_VIETNAM (accessed on 20 November 2019).
- Le, P.V.V.; Phan-Van, T.; Mai, K.V.; Tran, D.Q. Space-time variability of drought over Vietnam. Int. J. Climatol. 2019, 1–15. [Google Scholar] [CrossRef]
- Intergovernmental Panel on Climate Change (IPCC). Climate Change 2013: The Physical Science Basis; Contribution of Working Group I to the Fifth Assessment Report of the Intergovern-mental Panel on Climate Change; Intergovernmental Panel on Climate Change: Cambridge, UK; New York, NY, USA, 2013. [Google Scholar]
- Intergovernmental Panel on Climate Change (IPCC). Climate Change 2014: Synthesis Report; Contribution of Working Groups I, II and III to the Fifth Assessment Report of the Intergovernmental Panel on Climate Change; Pachauri, R.K., Meyer, L.A., Eds.; IPCC: Geneva, Switzerland, 2014; 151p. [Google Scholar]
- Nicholls, R.J.; Wong, P.P.; Burkett, V.R.; Codignotto, J.O.; Hay, J.; McLean, R.; Ragoonaden, S.; Woodroffe, C.D.; Abuodha, P.A.O.; Arblaster, J.; et al. Coastal systems and low-lying areas. In Climate Change 2007: Impacts, Adaptation and Vulnerability. Contribution of Working Group II to the Fourth Assessment Report of the Intergovernmental Panel on Climate Change; Parry, M.L., Canziani, O.F., Palutikof, J.P., van der Linden, P.J., Hanson, C.E., Eds.; Cambridge University Press: Cambridge, UK, 2007; pp. 315–356. [Google Scholar]
- Vien, T.D. Climate change and its impact on agriculture in Vietnam. J. ISSAAS 2011, 17, 17–21. [Google Scholar]
- Dasgupta, S.; Laplante, B.; Meisner, C.; Wheeler, D.; Yan, J. The Impact of Sea Level Rise on Developing Countries. A Comparative Analysis. World Bank Policy Research Working Paper 4136. February 2007. Available online: https://openknowledge.worldbank.org/bitstream/handle/10986/7174/wps4136.pdf?sequence=1&isAllowed=y (accessed on 20 November 2019).
- Raghavan, S.V.; Vu, M.T.; Liong, S.Y. Regional climate simulations over Vietnam using the WRF model. Theor. Appl. Climatol. 2016, 126, 161–182. [Google Scholar] [CrossRef]
- Thuck, T. Study on Droughts in the South Central and the Central Highlands. VNU J. Sci. Earth Sci. 2012, 28, 125–132. [Google Scholar]
- Nguyen, L.B.; Li, Q.F.; Ngoc, T.A.; Hiramatsu, K. Drought Assessment in Cai River Basin, Vietnam: A Comparison with Regard to SPI, SPEI, SSI, and SIDI. J. Fac. Agr. Kyushu Univ. 2015, 60, 417–425. [Google Scholar]
- Tri, D.Q.; Dat, T.T.; Truong, D.D. Application of Meteorological and Hydrological Drought Indices to Establish Drought Classification Maps of the Ba River Basin in Vietnam. Hydrology 2019, 6, 49. [Google Scholar] [CrossRef] [Green Version]
- Vu-Thanh, H.; Ngo-Duc, T.; Phan-Van, T. Evolution of meteorological drought characteristics in Vietnam during the 1961–2007. Theor. Appl. Climatol. 2014, 118, 367–375. [Google Scholar] [CrossRef]
- Nguyen, V.H.; Li, Q.F.; Nguyen, L.B. Drought forecasting using ANFIS-a case study in drought prone area of Vietnam. Paddy Water Environ. 2017, 15, 605–616. [Google Scholar] [CrossRef]
- Nguyen, L.B.; Le, M. Application of Artificial Neural Network and Climate Indices to Drought Forecasting in South-Central Vietnam. Pol. J. Environ. Stud. 2020, 29, 1293–1303. [Google Scholar] [CrossRef]
- Hung Le, M.; Perez, G.C.; Solomatine, D.; Medina, V. Studying the impact of infilling techniques on drought estimation—A case study in the South Central Region of Vietnam. In Proceedings of the 2017 Seventh International Conference on Information Science and Technology (ICIST), Da Nang, Vietnam, 16–19 April 2017; p. 292. [Google Scholar] [CrossRef]
- Nguyen, T.D. Coping with Drought in the Central Highlands—Vietnam. Ph.D. Thesis, Institute of Environment and Resources, Technical University of Denmark, 2007. Available online: https://backend.orbit.dtu.dk/ws/portalfiles/portal/127446964/MR2006_147.pdf (accessed on 20 November 2019).
- Vu, T.M.; Raghavan, S.V.; Liong, S.Y.; Mishra, A.K. Uncertainties of gridded precipitation observations in characterizing spatio-temporal drought and wetness over Vietnam. Int. J. Climatol. 2017, 38, 2067–2081. [Google Scholar] [CrossRef]
- CGIAR Research Program on Climate Change, Agriculture and Food Security—Southeast Asia (CCAFS SEA). In Assessment Report: The Drought Crisis in the Central Highlands of Vietnam; CGIAR Research Program on Climate Change, Agriculture and Food Security (CCAFS): Hanoi, Vietnam, 2016; Available online: https://ccafs.cgiar.org/publications/drought-crisis-central-highlands-vietnam#.XeQG8ZNKgdU (accessed on 20 November 2019).
- FAO UNJP/VIE/037/UNJ 2011. Climate Change Impacts on Agriculture in Vietnam. Available online: http://www.fao.org/climatechange/34068-0d42acdf5fb7c4d80f3013c038ab92ce6.pdf (accessed on 20 November 2019).
- Nguyen, D.; Renwick, J.; McGregor, J. Variations of surface temperature and rainfall in Vietnam from 1971 to 2010. Int. J. Climatol. 2014, 34, 249–264. [Google Scholar] [CrossRef]
- Sam, T.T.; Khoi, D.N.; Thao, N.T.; Nhi, P.T.; Quan, N.T.; Hoan, N.X.; Nguyen, V.T. Impact of climate change on meteorological, hydrological and agricultural droughts in the Lower Mekong River Basin: A case study of the Srepok Basin, Vietnam. Water Environ. J. 2019, 33, 547–559. [Google Scholar] [CrossRef]
- Phan, V.T.; Ngo-Duc, T.; Hageman, H.T.M. Seasonal and interannual variations of surface climate elements over Vietnam. Clim. Res. 2009, 40, 49–60. [Google Scholar] [CrossRef] [Green Version]
- Phan, V.T.; Fink, A.H.; Ngo-Duc, T.; Trinh, T.L.; Pinto, J.G.; van der Linden, R.; Schubert, D. Observed climate variations and change in Vietnam. In EWATECCOAST: Technologies for Environmental and Water Protection of Coastal Zones in Vietnam, Proceedings of the Contributions to the 4th International Conference for Environment and Natural Resources, ICENR 2014, 17—18 June 2014, Ho-Chi-Minh City, Viet Nam; Meon, P., Van Phuoc, N., Eds.; Cuvillier: Göttingen, Germany, 2014. [Google Scholar]
- Zhang, Y.S.; Li, T.; Wang, B.; Wu, G.X. Onset of the summer monsoon over the Indochina Peninsula: Climatology and interannual variations. J. Clim. 2002, 15, 3206–3322. [Google Scholar] [CrossRef]
- Ho, T.M.H.; Phan, V.T.; Le, N.Q.; Nguyen, Q.T. Extreme climatic events over Vietnam from observational data and RegCM3 projections. Clim. Res. 2011, 49, 87–100. [Google Scholar] [CrossRef] [Green Version]
- Linden, R.V.D.; Fink, A.H.; Pinto, J.G.; Phan, V.T. The dynamics of an extreme precipitation event in northeastern Vietnam in 2015 and its predictability in the ECMWF ensemble prediction system. Weather Forecast. 2017, 32, 1041–1056. [Google Scholar] [CrossRef]
- WMO&GWP. Handbook of Drought Indicators and Indices (M. Svoboda and B.A. Fuchs). Integrated Drought Management Programme (IDMP), Integrated Drought Management Tools and Guidelines Series 2. Geneva. 2016. Available online: http://www.droughtmanagement.info/literature/GWP_Handbook_of_Drought_Indicators_and_Indices_2016.pdf (accessed on 20 November 2019).
- Palmer, W.C. Meteorological Drought. 1965. Available online: https://www.ncdc.noaa.gov/temp-andprecip/drought/docs/palmer.pdf (accessed on 20 November 2019).
- Wells, N.; Goddard, S.; Hayes, M.J. A self-calibrating Palmer Drought Severity Index. J. Clim. 2004, 17, 2335–2351. [Google Scholar] [CrossRef]
- McKee, T.B.; Doesken, N.J.; Kleist, J. The relationship of drought frequency and duration to time scales. In Proceedings of the Eighth Conference on Applied Climatology, Anaheim, CA, USA, 17–22 January 1993; pp. 179–184. [Google Scholar]
- Vicente-Serrano, S.M.; Begueria, S.; Lopez-Moreno, A.J. A multiscalar drought index sensitive to global warming: The standardized precipitation evapotranspiration index. J. Clim. 2010, 23, 1696–1718. [Google Scholar] [CrossRef] [Green Version]
- Beguería, S.; Vicente-Serrano, S.M.; Reig, F.; Latorre, B. Standardized Precipitation Evapotranspiration Index (SPEI) revisited: Parameter fitting, evapotranspiration models, tools, datasets and drought monitoring. Int. J. Climatol. 2014, 34, 3001–3023. [Google Scholar] [CrossRef] [Green Version]
- Allen, R.G.; Pereira, L.S.; Raes, D.; Smith, M. Crop Evapotranspiration: Guidelines for Computing Crop Water Requirements. FAO Irrigation and Drainage Paper 56; FAO: Rome, Italy, 1998; 300p. [Google Scholar]
- Vicente-Serrano, S.M.; Beguería, S.; Lorenzo-Lacruz, J.; Camarero, J.J.; López-Moreno, J.I.; Azorin-Molina, C.; Revuelto, J.; Morán-Tejeda, E.; Sanchez-Lorenzo, A. Performance of Drought Indices for Ecological, Agricultural and Hydrological Applications. Earth Interact. 2012, 16, 1–27. [Google Scholar] [CrossRef] [Green Version]
- World Meteorological Organization. Standardized Precipitation Index User Guide. 2012. Available online: http://www.wamis.org/agm/pubs/SPI/WMO_1090_EN.pdf (accessed on 20 November 2019).
- Potop, V.; Boroneant, C.; Možný, M.; Štěpánek, P.; Skalák, P. Observed spatiotemporal characteristics of drought on various time scales over the Czech Republic. Theor. Appl. Climatol. 2014, 115, 563–581. [Google Scholar] [CrossRef]
- Beniston, M.; Stephenson, D.; Christensen, O.; Ferro, C.; Frei, C.; Goyette, S.; Halsnaes, K.; Holt, T.; Jylhä, K.; Koffi, B.; et al. Future extreme events in European climate: An exploration of regional climate model projections. Clim. Chang. 2007, 81, 71–95. [Google Scholar] [CrossRef] [Green Version]
- Dai, A. Increasing drought under global warming in observations and models. Nat. Clim. Chang. 2013, 3, 52–58. [Google Scholar] [CrossRef]
- Potop, V. Evolution of drought severity and its impact on corn in the Republic of Moldova. Theor. Appl. Climatol. 2011, 105, 1–15. [Google Scholar] [CrossRef]
- Sheffield, J.; Wood, E.F. Projected changes in drought occurrence under future global warming from multimodel, multi-scenario, IPCC AR4 simulations. Clim. Dynam. 2008, 31, 79–105. [Google Scholar] [CrossRef]
- Liu, Z.; Lu, G.; He, H.; Wu, Z.; He, J. Anomalous Features of Water Vapor Transport during Severe Summer and Early Fall Droughts in Southwest China. Water 2017, 9, 244. [Google Scholar] [CrossRef] [Green Version]
- Dolado, J.J.; Gonzalo, J.; Mayoral, L. Wald tests of I(1)against I(d) alternatives: Some new properties and an extension to processes with trending components. Stud. Nonlinear Dyn. Econom. 2008, 12, 1–32. [Google Scholar] [CrossRef] [Green Version]
- Agnew, C. Using the SPI to Identify Drought. In Drought Network News; University College London: London, UK, 2000; Volume 12, pp. 6–12. Available online: https://digitalcommons.unl.edu/droughtnetnews/1 (accessed on 20 November 2019).
- Harris, I.; Jones, P.D.; Osborn, T.J.; Lister, D.H. Updated high-resolution grids of monthly climatic observations—The CRU TS3.10 Dataset. Int. J. Climatol. 2014, 34, 623–642. [Google Scholar] [CrossRef] [Green Version]
- Miralles, D.G.; Holmes, T.R.H.; De Jeu, R.A.M.; Gash, J.H.; Meesters, A.G.C.A.; Dolman, A.J. Global land-surface evaporation estimated from satellite-based observations. Hydrol. Earth Syst. Sci. 2011, 15, 453–469. [Google Scholar] [CrossRef] [Green Version]
- Martens, B.; Miralles, D.G.; Lievens, H.; van der Schalie, R.; de Jeu, R.A.M.; Fernández-Prieto, D.; Beck, H.E.; Dorigo, W.A.; Verhoest, N.E.C. GLEAM v3: Satellite-based land evaporation and root-zone soil moisture. Geosci. Model Dev. 2017, 10, 1903–1925. [Google Scholar] [CrossRef] [Green Version]
- Kanamitsu, M.; Ebisuzaki, W.; Woollen, J.; Yang, S.K.; Hnilo, J.J.; Fiorino, M.; Potter, G. NCEP-DOE AMIP-II reanalysis (R-2). Bull. Am. Meteorol. Soc. 2002, 83, 1631–1643. [Google Scholar] [CrossRef]
- Yanai, M.; Li, C.; Song, Z. Seasonal heating of the Tibetan Plateau and its effects on the evolution of the Asian summer monsoon. J. Meteor. Soc. Jpn. 1992, 70, 319–351. [Google Scholar] [CrossRef] [Green Version]
- FAO. El niño” Event in Vietnam-Agriculture, Food Security and Livelihood Needs Assessment in Response to Drought and Salt Water Intrusion. 2016. Available online: http://www.fao.org/3/a-i6020e.pdf (accessed on 20 November 2019).
- Helsel, D.R.; Hirsch, R.M. Statistical Methods in Water Resources. U.S. Geological Survey Techniques of Water-Resources Investigations. 2002; 510p. Available online: http://water.usgs.gov/pubs/twri/twri4a3/ (accessed on 20 November 2019).
- Pendergrass, A.G.; Meehl, G.A.; Pulwarty, R.; Hobbins, M.; Hoell, A.; AghaKouchak, A.; Bonfils, C.J.W.; Gallant, A.J.E.; Hoerling, M.; Hoffmann, D.; et al. Flash droughts present a new challenge for subseasonal-to-seasonal prediction. Nat. Clim. Chang. 2020, 10, 191–199. [Google Scholar] [CrossRef]
- Wang, W.; Ertsen, M.W.; Svoboda, M.D.; Hafeez, M. Propagation of Drought: From Meteorological Drought to Agricultural and Hydrological Drought. Adv. Meteorol. 2016, 1–5. [Google Scholar] [CrossRef]
- Abatan, A.; Abiodun, B.; Gutowski, W.; Rasaq-Balogun, S. Trends and variability in absolute indices of temperature extremes over Nigeria: Linkage with NAO. Int. J. Climatol. 2017, 38, 593–612. [Google Scholar] [CrossRef]
- Coelho, C.A.S.; Cavalcanti, I.A.F.; Costa, S.; Freitas, S.R.; Ito, E.R.; Luz, G.; Santos, A.F.; Nobre, C.A.; Marengo, J.A.; Pezza, A.B. Climate diagnostics of three major drought events in the Amazon and illustrations of their seasonal precipitation predictions. Meteorol. Appl. 2012, 19, 237–255. [Google Scholar] [CrossRef]
- Barriopedro, D.; Gouveia, C.M.; Trigo, R.M.; Wang, L. The 2009/10 drought in China: Possible causes and impacts on vegetation. J. Hydrometeor. 2012, 13, 1251–1267. [Google Scholar] [CrossRef] [Green Version]
- Van Lanen, H.A.J. Drought propagation through the hydrological cycle. Climate Variability and Change—Hydrological Impacts. In Proceedings of the Fifth FRIEND World Conference, Havana, Cuba, 27 November–1 December 2006; Volume 308, p. 2006. Available online: https://pdfs.semanticscholar.org/4b33/54bd536a459fc21442da13ccd2b31ae0e7ee.pdf (accessed on 20 November 2019).
- Rahman, M.M.; Lu, M.; Kyi, K.H. Variability of soil moisture memory for wet and dry basins. J. Hydrol. 2015, 523, 107–118. [Google Scholar] [CrossRef]
- Shinoda, M.; Yamaguchi, Y. Influence of soil moisture anomaly on temperature in the Sahel: A comparison between wet and dry decades. J. Hydrometeor. 2003, 4, 437–447. [Google Scholar] [CrossRef]
- Luo, Y.; Berbery, E.H.; Mitchell, K.E.; Netts, A.K. Relationships between land surface and near-surface atmospheric variables in the NCEP North American Regional Reanalysis. J. Hydrometeor. 2007, 8, 1184–1203. [Google Scholar] [CrossRef] [Green Version]
- Folwell, S.S.; Harris, P.P.; Taylor, C.M. Large-Scale Surface Responses during European Dry Spells Diagnosed from Land Surface Temperature. J. Hydrometeorol. 2016, 17, 975–993. [Google Scholar] [CrossRef] [Green Version]
- Schaffer, B.E.; Nordbotten, J.M.; Rodriguez-Iturbe, I. Plant biomass and soil moisture dynamics: Analytical results. Proc. R. Soc. London A Math. Phys. Eng. Sci. 2015, 471. [Google Scholar] [CrossRef]
- Cammalleri, C.V.; Vogt, J.; Bisselink, B.; de Roo, A. Comparing soil moisture anomalies from multiple independent sources over different regions across the globe. Hydrol. Earth Syst. Sci. 2017, 21, 6329–6343. [Google Scholar] [CrossRef] [Green Version]
- Green, J.K.; Konings, A.G.; Alemohammad, S.H.; Berry, J.; Entekhabi, D.; Kolassa, J.; Lee, J.E.; Gentine, P. Regionally strong feedback between the atmosphere and terrestrial biosphere. Nat. Geosci. 2017, 10, 410. [Google Scholar] [CrossRef]
- Seneviratne, S.I.; Koster, R.D.; Guo, Z.; Dirmeyer, P.A.; Kowalczyk, E.; Lawrence, D.; Liu, P.; Lu, C.H.; Mocko, D.; Oleson, K.W.; et al. Soil moisture memory in AGCM simulations: Analysis of Global Land–Atmosphere Coupling Experiment(GLACE) data. J. Hydrometeorol. 2006, 7, 1090–1112. [Google Scholar] [CrossRef] [Green Version]
- Vu, T.; Mishra, A. Spatial and temporal variability of standardized precipitation index over Indochina peninsula. Cuadernos de Investigacion Geografica 2016, 42, 221–232. [Google Scholar] [CrossRef] [Green Version]
- Räsänen, T.A. Hydrological Changes in the Mekong River Basin: The Effects of Climate Variability and Hydropower Development. Ph.D. Thesis, Department of Civil and Environmental Engineering, Aalto University, Aalto, Finland, 2014. Available online: https://aaltodoc.aalto.fi/handle/123456789/13764 (accessed on 20 November 2019).


| SPEI | Probability | Category |
|---|---|---|
| >1.65 | 0.05 | Extremely humid |
| >1.28 | 0.1 | Severely humid |
| >0.84 | 0.2 | Moderately humid |
| >−0.84 and <0.84 | 0.6 | Normal |
| <−0.84 | 0.2 | Moderately dry |
| <−1.28 | 0.1 | Severely dry |
| <−1.65 | 0.05 | Extremely dry |
| Sub-Regions | SPEI01 | SPI01 | SPEI12 | SPI12 | SPEI18 | SPI18 | SPEI24 | SPI24 |
|---|---|---|---|---|---|---|---|---|
| S1 | 0.0224 | 0.0588 | 0.0810 | 0.1553 | 0.0943 | 0.1826 | 0.0694 | 0.1665 |
| S2 | −0.0051 | 0.0141 | −0.0276 | 0.0134 | −0.0510 | −0.0032 | −0.0901 | −0.0348 |
| S3 | −0.0072 | 0.0269 | −0.0035 | 0.0463 | −0.0195 | 0.0395 | −0.0519 | 0.0217 |
| S4 | 0.0132 | 0.0279 | 0.0800 | 0.1167 | 0.1096 | 0.1512 | 0.1413 | 0.1851 |
| S5 | 0.0317 | 0.0712 | 0.1483 | 0.2175 | 0.1850 | 0.2688 | 0.2093 | 0.3089 |
| S6 | 0.0142 | 0.0947 | 0.0916 | 0.1949 | 0.1079 | 0.2297 | 0.1144 | 0.2543 |
| S7 | 0.0147 | 0.1413 | −0.0934 | 0.15479 | −0.1054 | 0.2067 | −0.1280 | 0.2457 |
| Sub-Regions | SPEI01–SPI01 | SPEI12–SPI12 | SPEI18–SPI18 | SPEI24–SPI24 |
|---|---|---|---|---|
| S1 | −0.0365 | −0.0744 | −0.0885 | −0.0971 |
| S2 | −0.0192 | −0.0410 | −0.0478 | −0.0553 |
| S3 | −0.0341 | −0.0497 | −0.0590 | −0.0737 |
| S4 | −0.0147 | −0.0366 | −0.0416 | −0.0438 |
| S5 | −0.0395 | −0.0692 | −0.0837 | −0.0996 |
| S6 | −0.0805 | −0.1033 | −0.1218 | −0.1398 |
| S7 | −0.1266 | −0.2483 | −0.3121 | −0.3737 |
| SPEI01 | |||||||
|---|---|---|---|---|---|---|---|
| Region | Onset | Peak | End | Duration (months) | Severity | Intensity | Peak Value |
| S1 | Jul-2009 | Oct-2009 | Mar-2010 | 9 | 9.02 | 1.00 | −1.99 |
| S2 | Jun-2009 | Oct-2009 | Dec-2009 | 7 | 6.31 | 0.90 | −1.36 |
| S3 | May-2010 | May-2010 | Nov-2010 | 7 | 6.53 | 0.93 | −1.35 |
| S4 | Sep-2004 | Oct-2004 | Apr-2005 | 8 | 7.75 | 0.96 | −1.84 |
| S5 | Sep-2004 | Oct-2004 | Jun-2005 | 10 | 9.53 | 0.95 | −2.10 |
| S6 | Dec-1990 | May-1991 | Jul-1991 | 8 | 7.40 | 0.92 | −1.68 |
| S7 | Dec-1982 | Jan-1983 | Apr-1983 | 5 | 7.83 | 1.56 | −2.20 |
© 2020 by the authors. Licensee MDPI, Basel, Switzerland. This article is an open access article distributed under the terms and conditions of the Creative Commons Attribution (CC BY) license (http://creativecommons.org/licenses/by/4.0/).
Share and Cite
Stojanovic, M.; Liberato, M.L.R.; Sorí, R.; Vázquez, M.; Phan-Van, T.; Duongvan, H.; Hoang Cong, T.; Nguyen, P.N.B.; Nieto, R.; Gimeno, L. Trends and Extremes of Drought Episodes in Vietnam Sub-Regions during 1980–2017 at Different Timescales. Water 2020, 12, 813. https://doi.org/10.3390/w12030813
Stojanovic M, Liberato MLR, Sorí R, Vázquez M, Phan-Van T, Duongvan H, Hoang Cong T, Nguyen PNB, Nieto R, Gimeno L. Trends and Extremes of Drought Episodes in Vietnam Sub-Regions during 1980–2017 at Different Timescales. Water. 2020; 12(3):813. https://doi.org/10.3390/w12030813
Chicago/Turabian StyleStojanovic, Milica, Margarida L.R. Liberato, Rogert Sorí, Marta Vázquez, Tan Phan-Van, Hieu Duongvan, Tin Hoang Cong, Phuong N. B. Nguyen, Raquel Nieto, and Luis Gimeno. 2020. "Trends and Extremes of Drought Episodes in Vietnam Sub-Regions during 1980–2017 at Different Timescales" Water 12, no. 3: 813. https://doi.org/10.3390/w12030813