Model of Nutrient and Pesticide Outflow with Surface Water to Puck Bay (Southern Baltic Sea)


Faculty of Civil and Environmental Engineering, Gdansk University of Technology, 80-233 Gdańsk, Poland
*
Author to whom correspondence should be addressed.
Water 2020, 12(3), 809; https://doi.org/10.3390/w12030809
Submission received: 31 December 2019
/
Revised: 20 February 2020
/
Accepted: 11 March 2020
/
Published: 14 March 2020
(This article belongs to the Section Hydrology)
Abstract
:Coastal basins are particularly exposed to the adverse impact of anthropogenic stress. In many places, despite only the seasonal increase in the number of residents, progressive urbanization and associated changes in the catchment characteristics are noticeable. Puck Bay is part of the Gulf of Gdansk and belongs to the Baltic Sea. Although the area of Puck Bay is covered by the Natura 2000 Network, this has not saved it from eutrophication problems. As part of the work on a complex coastal basin analysis (WaterPUCK project), the Soil and Water Assessment Tool (SWAT) model was used to determine the agricultural impact on water quality in rivers with a flow into Puck Bay: Reda, Gizdepka, Płutnica, and Błądzikowski Stream. The results include the loads of nutrients and pesticides that flow out from the agricultural areas of Puck community into Puck Bay. In this article, special attention has been paid to the impact of precipitation on the quality of water at the outflow of rivers into the Bay of Puck, because it is a decisive element in the amount of nutrients leached along with surface runoff to watercourses and then into the Gulf. The distribution of precipitation thus affects the amount of nutrients absorbed by plants. Modeling the effects of agricultural practices, taking into account long-term meteorological forecasts, is helpful in attempts to reduce the amount of pollutants entering the Baltic Sea.
1. Introduction
The Baltic Sea region is the subject of many studies. In the 1990s, large-scale changes in the Baltic Sea began to be analyzed, with particular attention paid to water quality. Data collected since the 1960s allowed for a comprehensive analysis of the concentration variability of biogenic compounds. At the turn of the 70s and 80s, a significant increase in the amount of pollution was noted [1]. In the 1990s, it was calculated that the concentration of nitrogen and phosphorus compounds increased by 1%–4% per year [2]. The exception was ammonium, whose concentration gradually decreased by about 5% per year in 1963–1990 [2]. Due to the commencement of activities aimed at protecting the Baltic Sea [3], at the end of the 20th century a gradual decrease in the amount of fertilizers applied to arable fields began to be observed this applies to the dosing of both nitrogen and phosphorus [1,4]. This has resulted in a slow downward trend in the amount of nitrogen and phosphorus supplied from countries neighboring the Baltic Sea [5].
Currently, a great deal of research is being conducted in the Baltic Sea [6,7], and although many aspects of eutrophication have been identified and many mistakes have been eliminated, this problem has not yet been fully resolved. Simulations of the future of this reservoir are more and more often being carried out [8].
2. Materials and Methods
2.1. Study Area
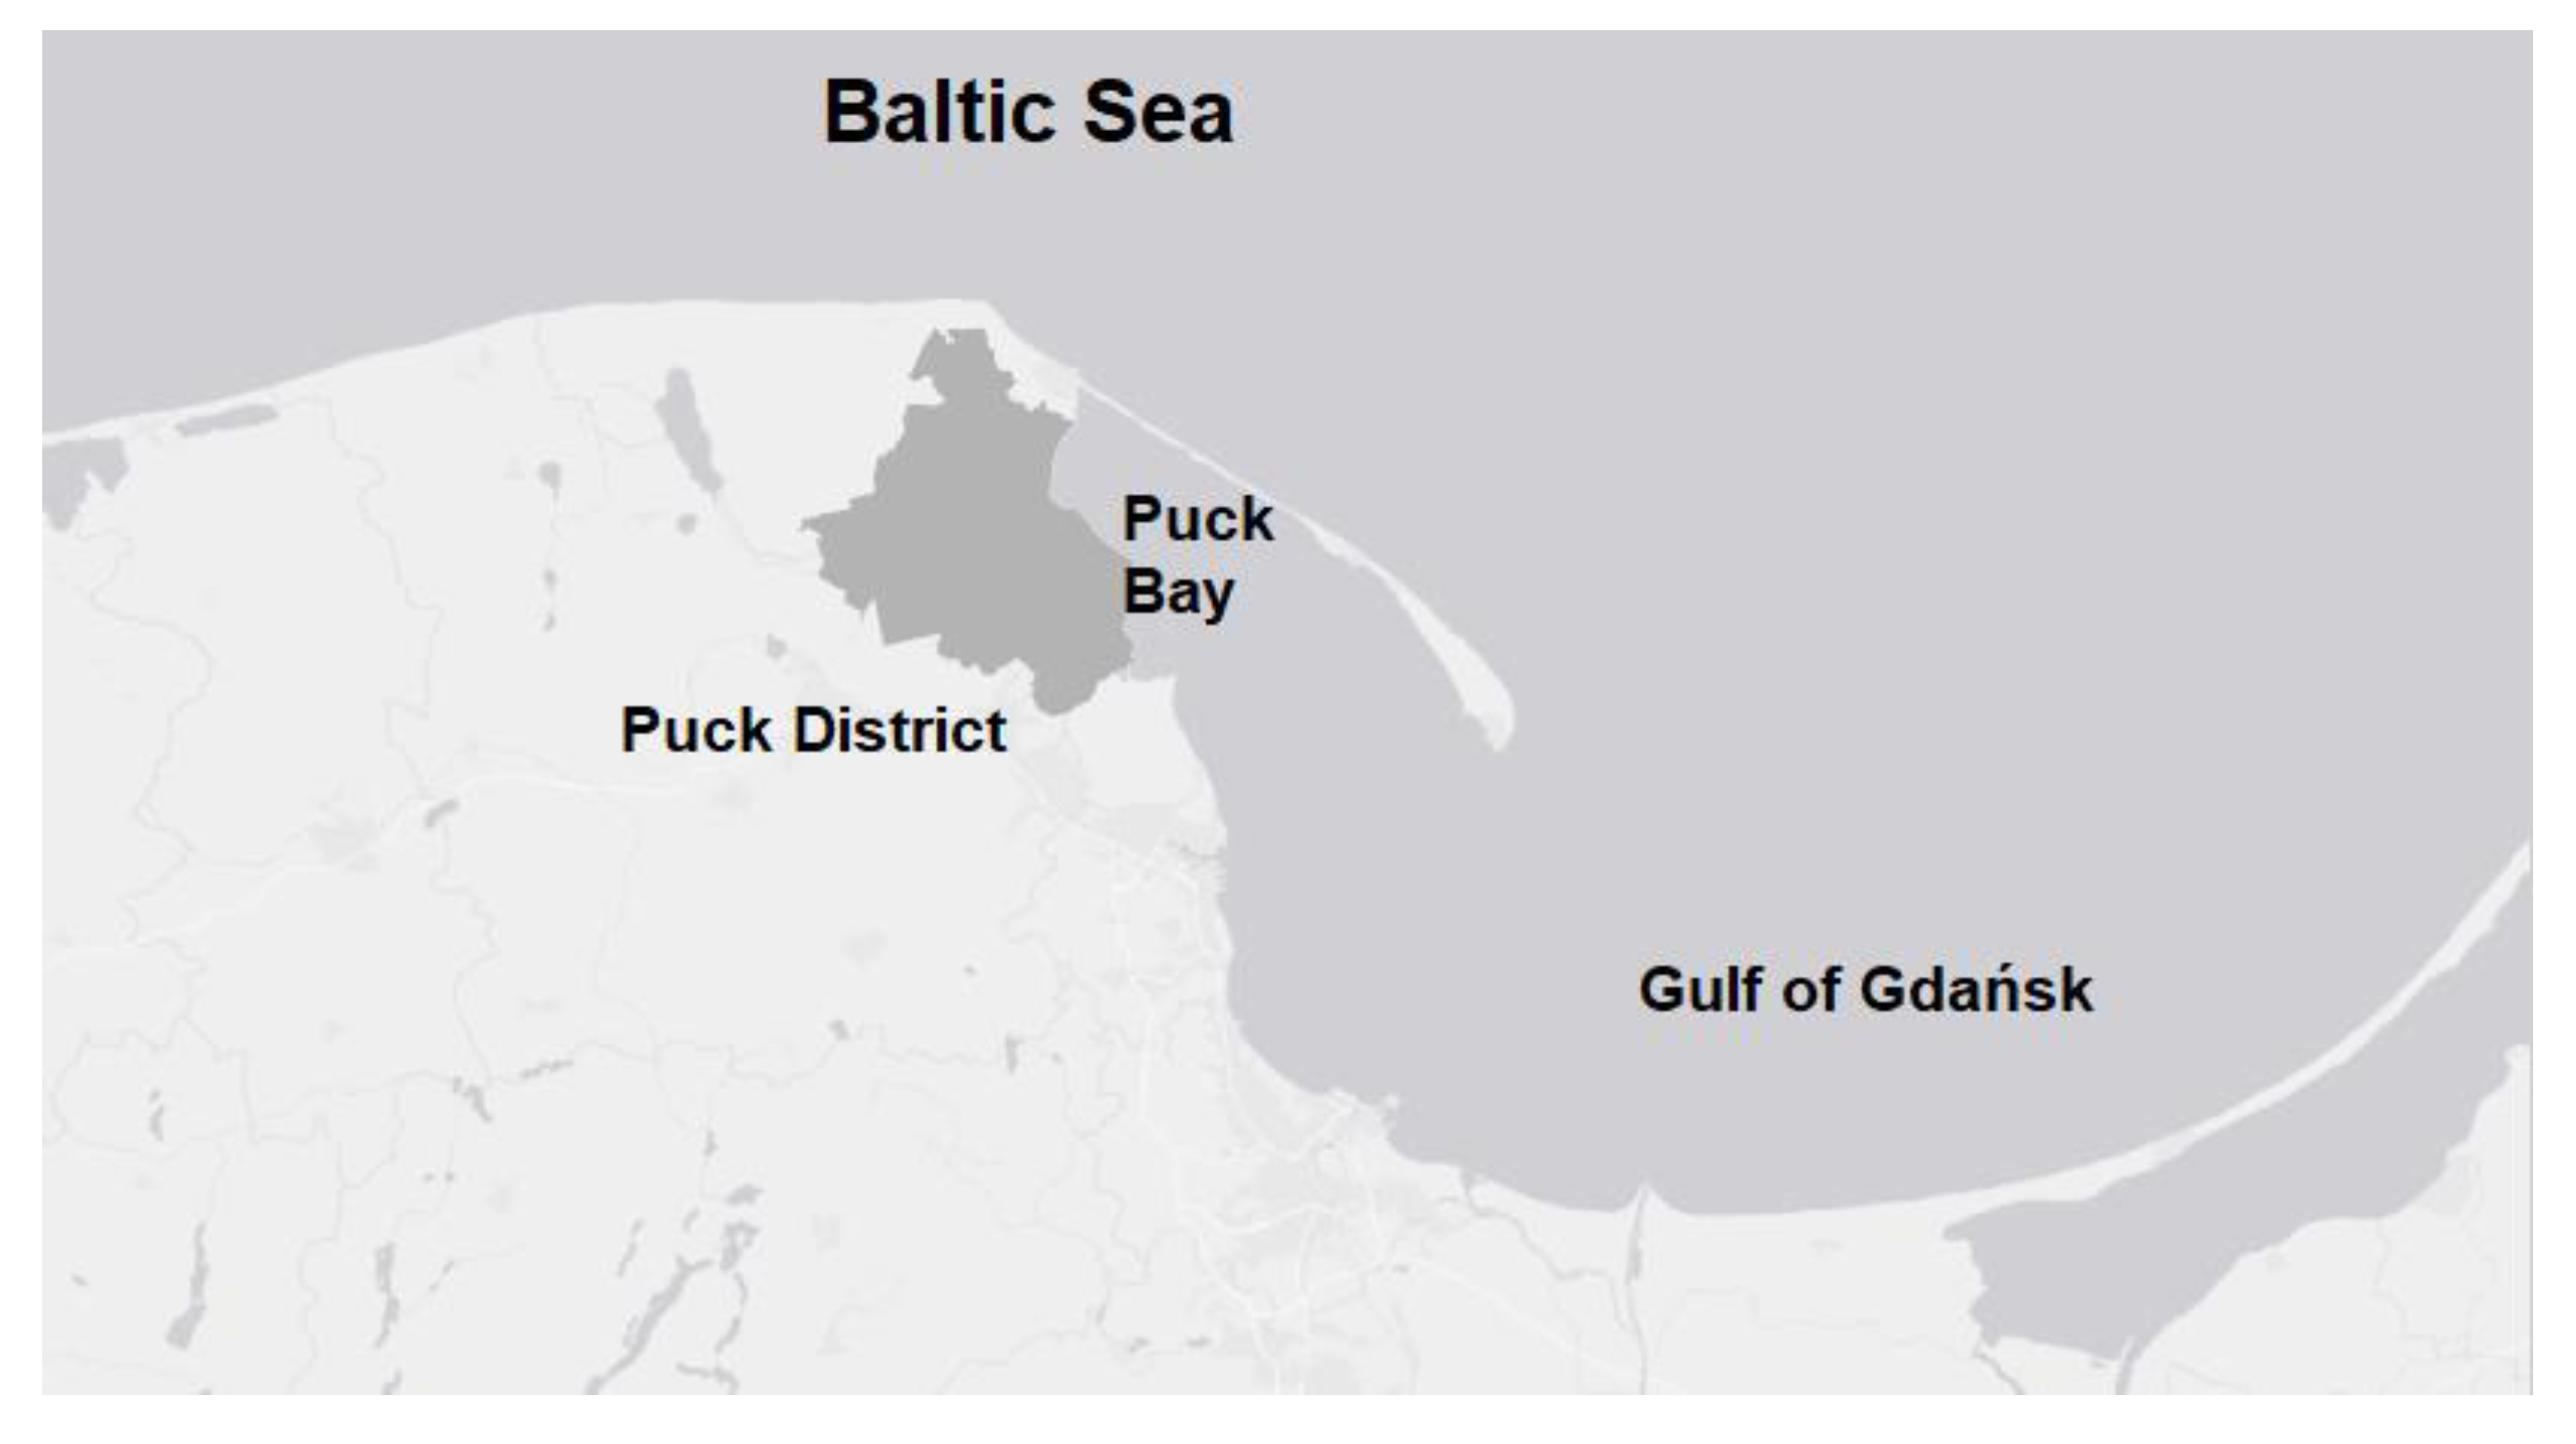
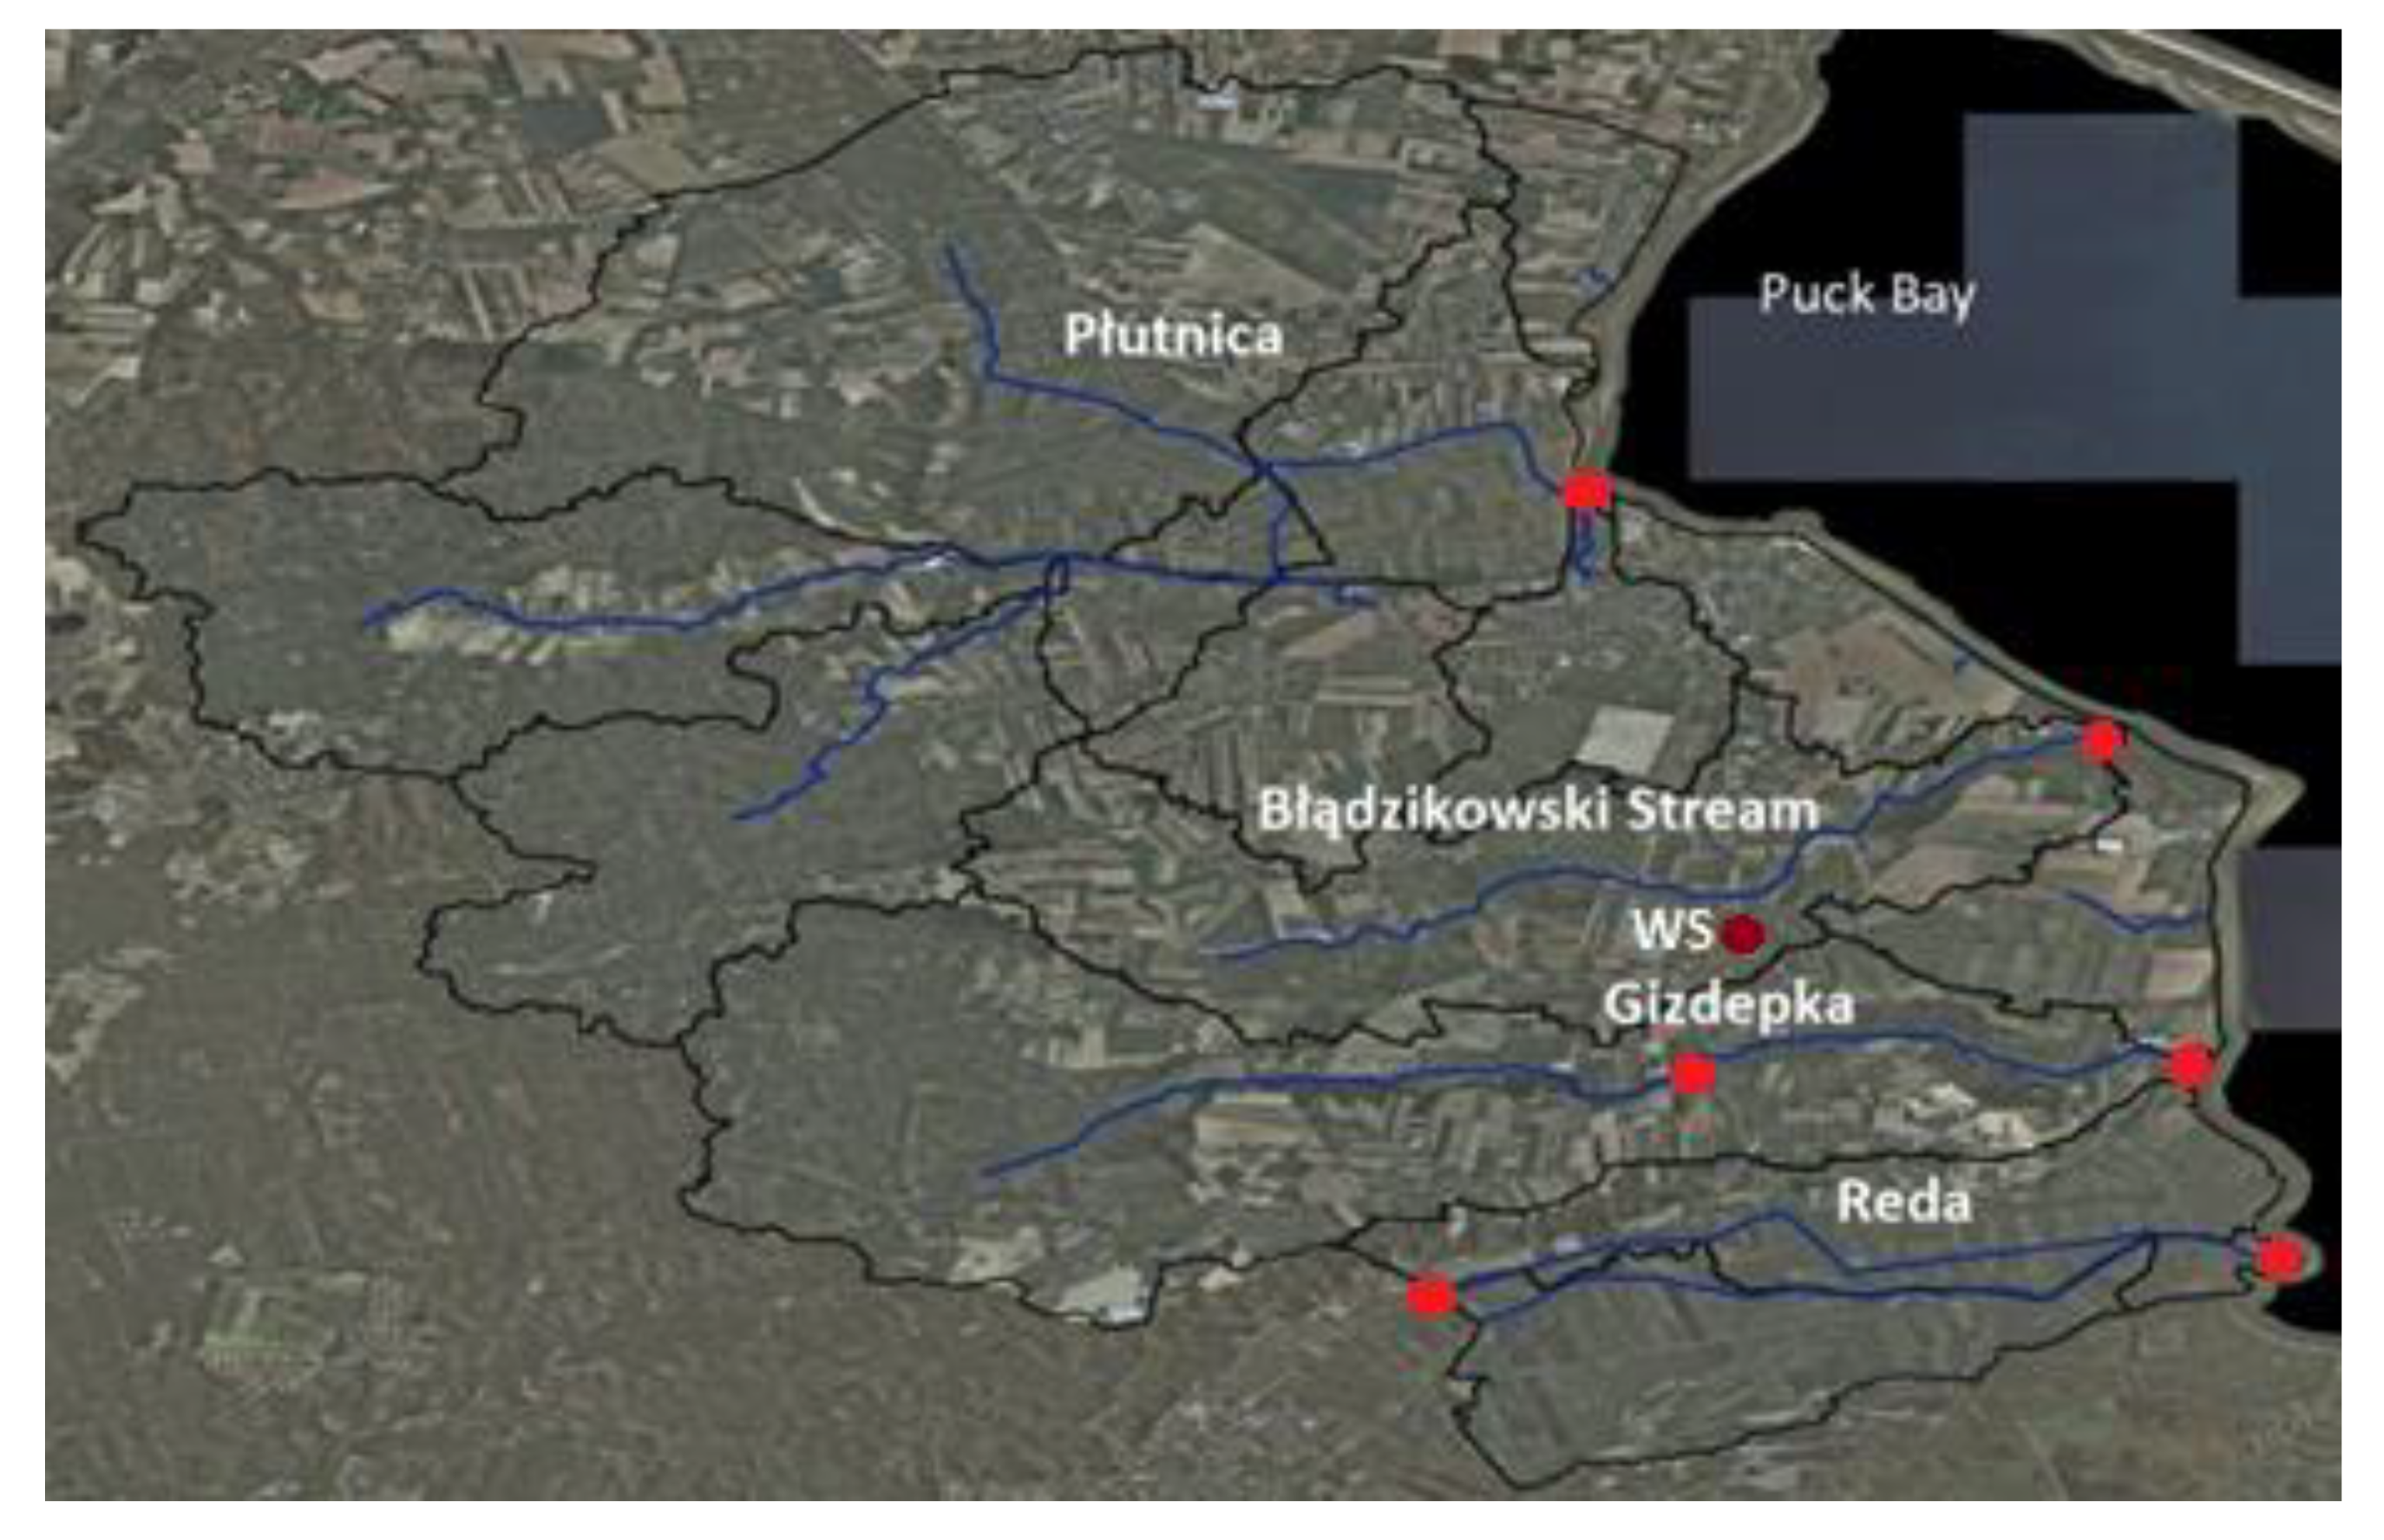
The study area is Puck Bay, located in north Poland (Figure 1), connected through the Gulf of Gdańsk to the Baltic Sea. This is one of the best-studied places in the whole Baltic Sea [9,10] but, unfortunately, like the entire Baltic Sea [11], this region is strongly affected by growing anthropopressure [12,13], in this case, mainly associated with agriculture [14,15,16]. This area is so polluted with fertilizers and pesticides that it threatens groundwater resources [17]. The soil profile is dominated by sands and sandy loam. There is an extensive peat area in the northern part of the basin, in the Płutnica river valley (Figure 2).
2.2. WaterPUCK
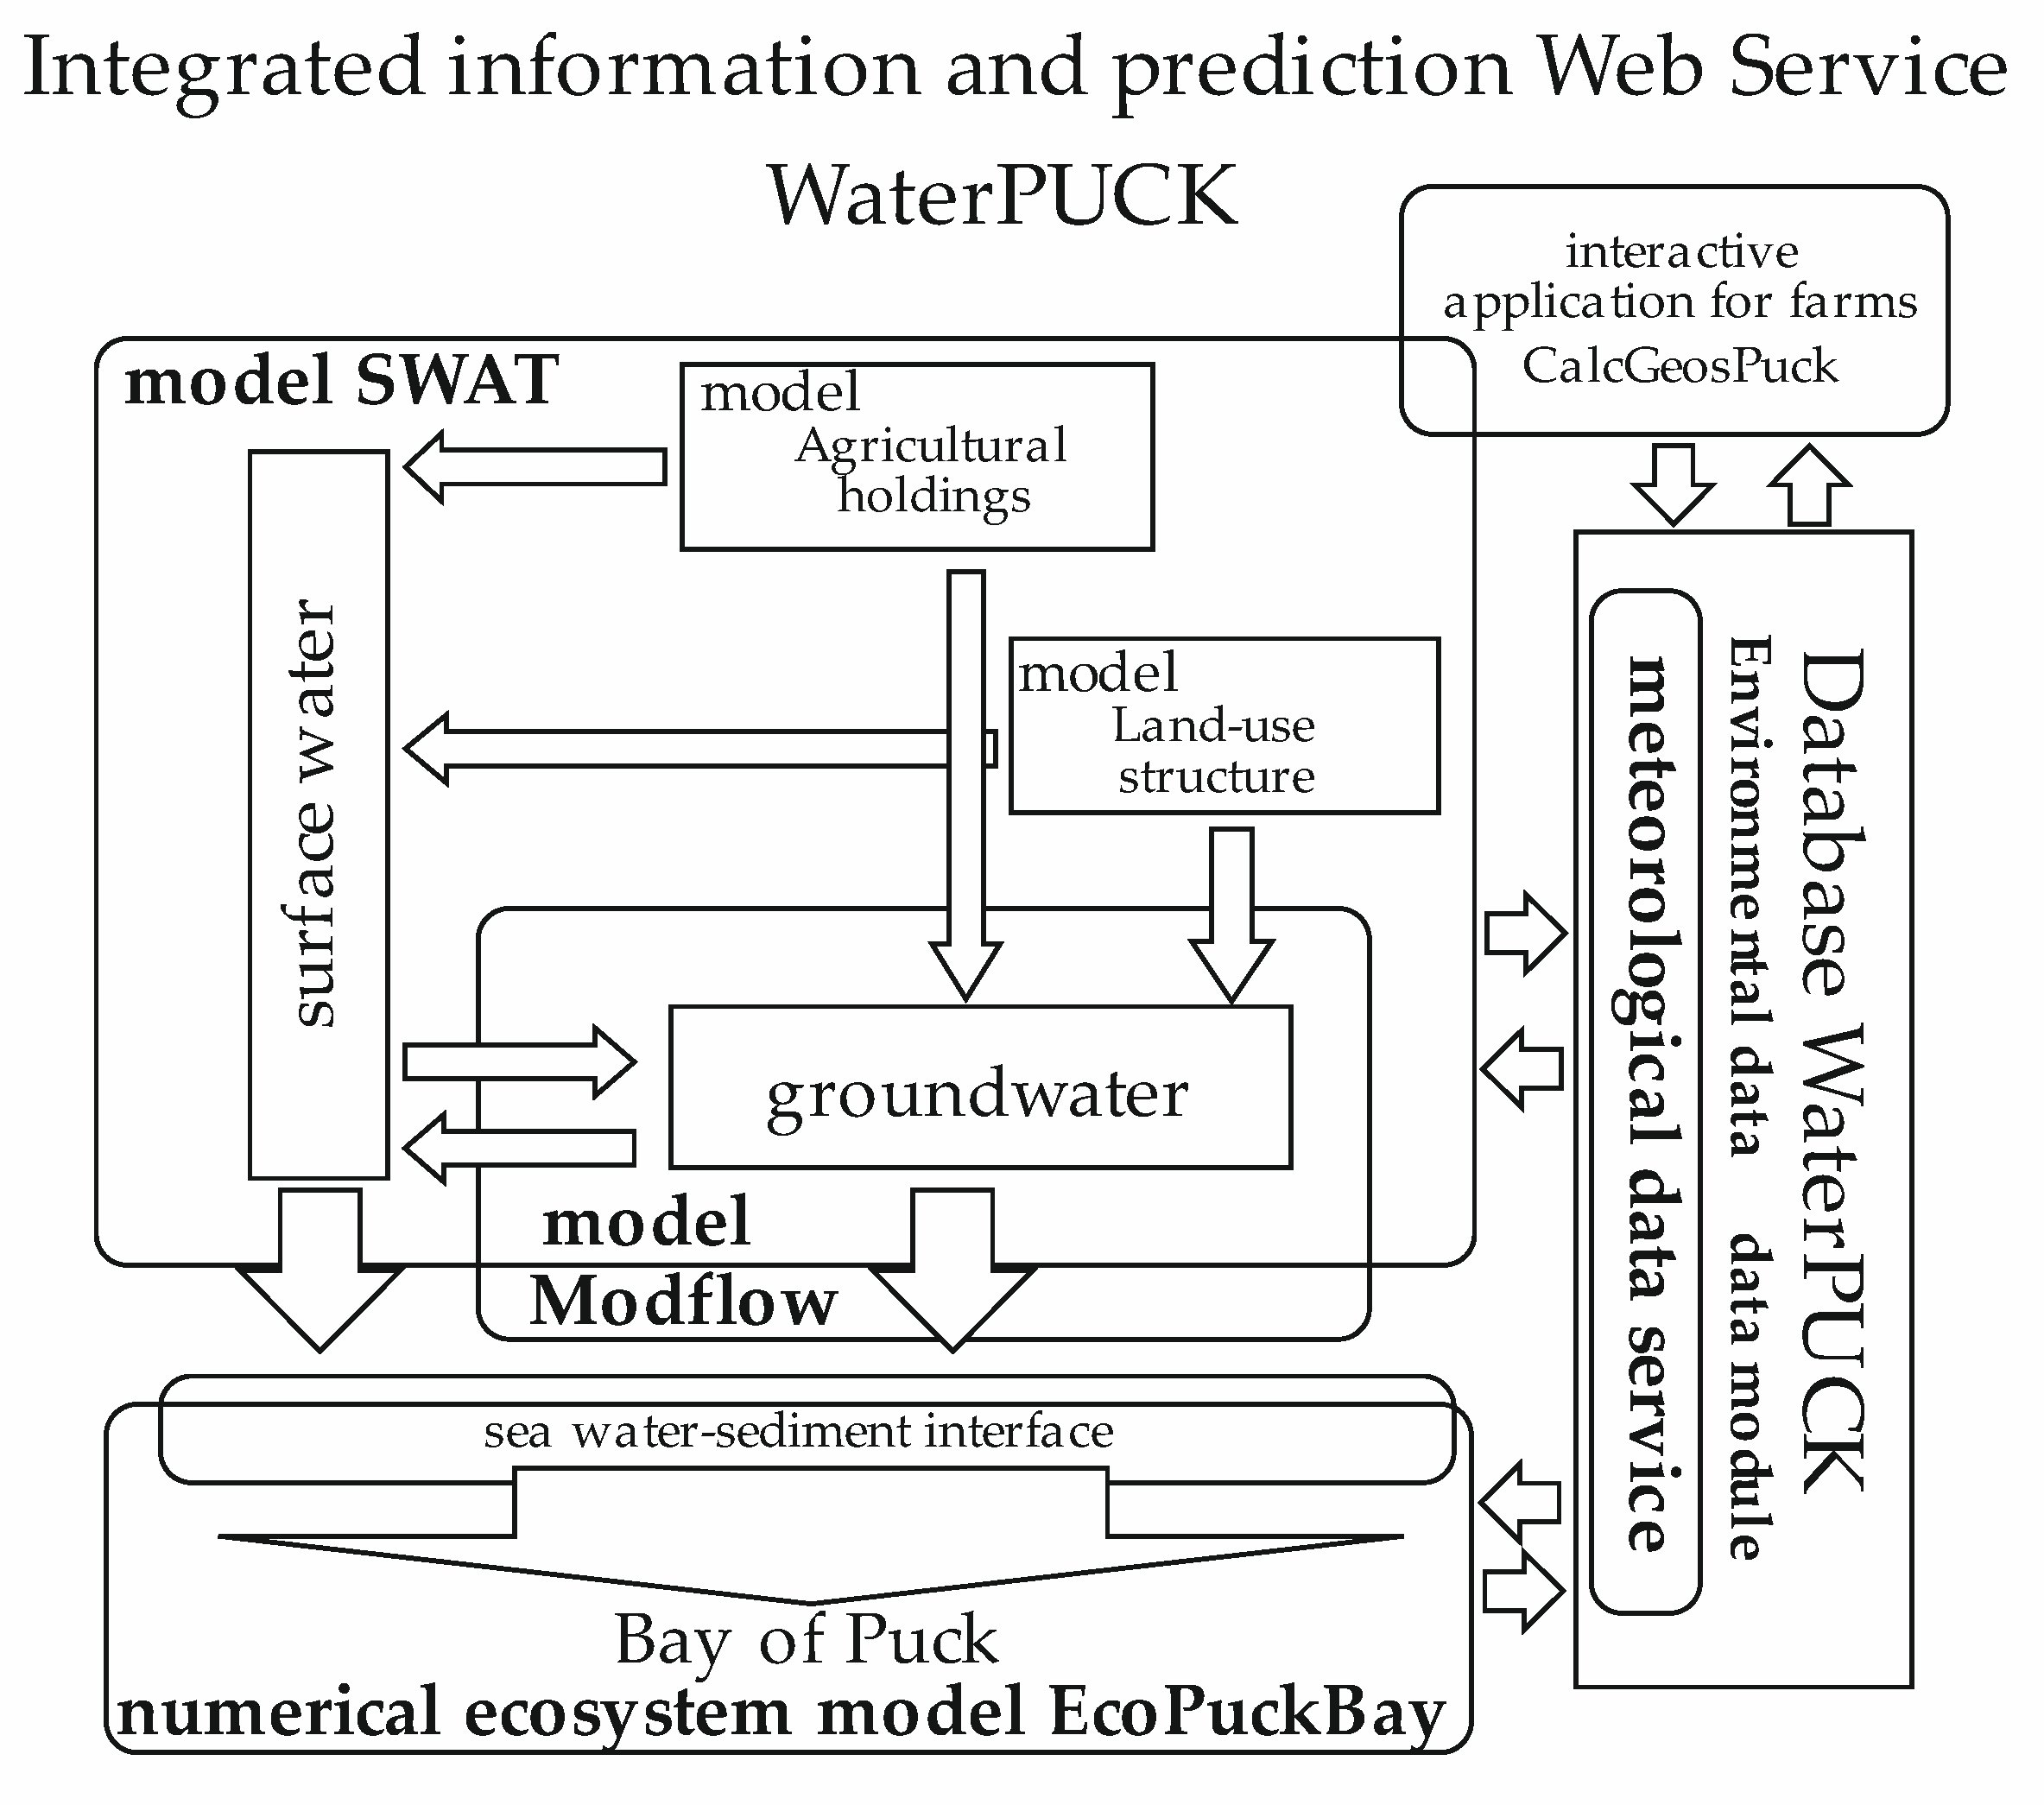
Major changes, such as afforestation, deforestation, and intensive urban development, are usually analyzed in studies related to the impact of land use in basins [18,19]. Hydrological analyses in the context of climate change are also quite common [20,21], while minor changes such as changes in farming habits are analyzed less frequently. Presented in the diagram (Figure 3), the WaterPUCK project combines surface water (SWAT) and groundwater (MODFLOW) models with a three-dimensional hydrodynamic bay model (EcoPuckBay based on the Parallel Ocean Program [22]). This system makes it possible to perform simulations related to determining the impact of changes in agricultural practices (including fertilization, changes in the type of cultivation) on the water quality of Puck Bay. Information on the proposed agricultural changes goes into the SWAT model, which provides quantitative and qualitative information about leaching to the groundwater and coastal waters. This allows the input files to be completed for the MODFLOW and EcoPuckBay models with calculated nutrients and pesticide loads [23]. The combined model works on a daily basis, taking into account both the current and forecast situation. For this purpose, real-time weather forecasts from the UM model of the Interdisciplinary Center for Mathematical Modeling at the University of Warsaw are taken [24]. Simplified simulations can also be performed by the web application: WaterPUCK—an integrated predictive and information system [25]. This article focuses on the part of the service model related to leaching compounds used in agriculture from the surface of the land.
2.3. SWAT Model
The Soil and Water Assessment Tool (SWAT) model is a tool that allows you to perform a comprehensive analysis of the water balance within a catchment area. The model, created by the USDA Agricultural Research Service, takes into account a number of meteorological parameters (precipitation, wind, humidity, temperature, and solar radiation) and information about agricultural practices (plowing, sowing, irrigation, fertilization, etc.). The model also allows for agricultural simulations including forecast yields, the amount of nutrients taken up by plants, or the amount of nutrients leached from the field. Therefore, the SWAT model is also used to optimize agricultural practices [26]. Depending on the source of meteorological information, the model can be used for real-time calculations, forecasting, or the simulation of archival events [27]. In the WaterPUCK project, the surface water runoff model uses data from the Institute of Meteorology and Water Management station, 2000–2010 (start-up period needed to stabilize ground and water conditions) [28] and ICM forecasts of the University of Warsaw, 2011–2019 [24]. The meteorological station operating in the years 2018–2019 enabled the verification of data needed for the forecasting model. The model is based on digital geodetic data such as a digital terrain model, soil cover, and land use maps. A very important element of this work was the division of the analyzed area into sub-basins and their exact parameterization [29]. Depending on the fieldwork and a series of simulation parameters, the hydrological model was prepared, then the model calibration was performed based on information from the monitoring system of rivers, operating in 2018–2019. The last step was the calibration in terms of water quality, based on information on agricultural practices specific to this area, and a chemical analysis of water samples collected in the rivers and drainage channels.
2.4. Water Balance
Surface runoff is calculated according to the SCS method:
where:
Qsurf—the accumulated runoff or rainfall excess (mm H2O)
Rday—the rainfall depth for the day (mm H2O)
Ia—the initial abstractions, which include surface storage, interception and infiltration prior to runoff (mm H2O)
S—the retention parameter (mm H2O)
Calculations related to the lateral flow use information about the terrain and soil parameters:
where:
SWly—soil water content of the layer (mm H2O)
Ksat—saturated hydraulic conductivity (mm/h)
slp—average slope of the subbasin (-)
ϕd—drainable porosity of the soil (mm/mm)
Lhill—hillslope length (m)
Percolation depends on the soil water content and percolation travel time:
where:
Δt—length of the time step (h)
TTperc—the travel time for percolation (h)
2.5. Calibration and Sensitivity Analysis of the Hydrological Model
The calibration of the SWAT model should be carried out in stages, starting from an analysis of the sensitivity of the model to changes in individual parameters, remembering to retain the real values of the changed parameters [30,31,32]. Sometimes it is necessary to separate the calibration process into seasons (e.g., wet and dry) [33]. Field studies conducted in 2017–2019 (Figure 2) were the basis for the model verification. The need for full integration of the SWAT and MODFLOW models, combined with the difficult hydrological conditions of the examined area (dense network of uncontrolled drainage systems), significantly hindered the calibration of the SWAT model. It was decided that the correct fit of the model would be determined by: the relationship between surface runoff and infiltration, and close-to-actual yield values. The CN parameter turned out to be the parameter with the most significant impact on both modeled flows in the watercourses and on the loads of biogenic compounds related to the surface runoff reaching Puck Bay. For dry years, the share of surface runoff in the catchment area’s water balance is about 12%, corresponding to 65mm. A change in CN parameters by +/– 5% resulted in a change in surface runoff in the 37–127mm range (from 7 to 22% of the water balance). For wet years, an analogous change results in obtaining surface runoff from 206 to 385 mm (from 22% to 41%). After calibration, 30% surface runoff, 30% infiltration, and 40% evapotranspiration were obtained for average hydrological conditions, while obtaining similar values to dry years for the observed flows and groundwater supply.
2.6. Pesticides
The dosage of pesticides is not easy, and many factors that reduce the full effectiveness of dosed agents should be considered. Atmospheric factors such as wind or rain, as well as the type of land cover at the time of application affect the amount of the agent that will be able to react properly, e.g., preventing weed growth [27,34]. At the time of pesticide application, the SWAT model calculates the land cover coefficient gc, and then determines on its basis which part will go to the ground and which to the plant surface [34]:
where:
pest—is the actual amount of pesticide applied (kg/ha)
pest’—is the effective amount of pesticide applied (kg/ha)
pestfol—is the amount of pesticide applied to foliage (kg/ha)
pestsurf—is the amount of pesticide applied to the soil surface (kg/ha)
apef—is the pesticide application efficiency
gc—is the fraction of the ground surface covered by plants [21]
In the next steps, processes accompanying pesticides are modeled from the moment of application to the moment of decomposition or leaving the catchment area. The main processes are wash-off (which starts under the condition of exceeding 2.54mm of rainfall/day) and degradation (photo, chemical, and biodegradation) [27]:
where:
pstf,wsh—is the amount of pesticide on foliage that is washed off the plant and onto the soil surface on a given day (kg/ha)
pstf,—is the amount of pesticide on the foliage (kg/ha)
pstf,t—is the amount of pesticide on the foliage at time t (kg/ha)
pstf,o—is the initial amount of pesticide on the foliage (kg/ha)
psts,ly,t—is the amount of pesticide in the soil layer at time t (kg/ha)
psts,ly,o—is the initial amount of pesticide in the soil layer (kg/ha)
frwsh—is the wash-off fraction for the pesticide
kp,foliar—is the rate constant for the degradation or removal of the pesticide on foliage (1/day)
kp,soil—is the rate constant for the degradation or removal of the pesticide in soil (1/day)
t—is the time elapsed since the initial pesticide amount was determined (days)
The SWAT model provides a database containing information on the half-life, adsorption coefficients, etc. for plant protection products used in the United States [34]. After public consultations, for the needs of the WaterPUCK project, it was necessary to supplement the existing database with measurements commonly used in the study area, including those containing: diflufenican, metazachlor, chlorpyrifos, anthraquinone, glyphosate.
2.7. Nutrients
Nutrient transport from the basin areas to the rivers is the result of, among others, soil weathering and erosion processes. These compounds can be transported by surface runoff, subsurface flow or percolation. To calculate the load of the substance, the calculation of the amount of water flowing out of the catchment area and the concentration of individual compounds leached from the ground must be made [27,34]. Following the example of nitrates, the concentration of nutrient compounds is calculated as follows:
where:
ConcNO3—the concentration of nitrate in mobile water for a given layer (kgN/mmH2O)
NO3ly—the amount of nitrate in the layer (kgN/ha)
wmob—the amount of mobile water in the layer (mmH2O)
- for top 10mm wmob = Qsurf + Qlat+ wperc
- for lower layers wmob = Qsurf + wperc
Θe—the fraction of porosity from which anions are excluded
SATly—the saturated water content of the soil layer (mmH2O)
2.8. Field Measurements
In order to identify the hydraulic conditions and basic parameters of pollution transport in the main watercourses in the examined catchment area, hydrometric measurements were made and a tracer study done. Hydrometric measurements were made in selected cross-sections located on the Reda, Płutnica, and Gizdepka rivers, close to the monitoring network points in which status recorders were mounted. An Acoustic Doppler Current Profiler (ADCP) RiverSurveyor S5 from SONTEK was used for measurements above 0.5m depth and 3m width. In streams with smaller parameters than the above, electromagnetic flowmeters for point measurements of water velocity were used, such as MF PRO from OTT and Flo-Mate 2000 from Marsh McBirney, and PCM4 ultrasonic flowmeters from Nivus. The results of flow measurements against the background of characteristic flows (MQmean—the mean value of the mean annual flows, MQmin—the mean value of the minimum annual flows, Qmin and Qmax flow with exceedance frequency 1% and 50%) are shown in Table 1.
During the field measurements, it was assumed that the accuracy of the devices used was consistent with the manufacturer’s specifications, and the adopted measurement procedures ensured that the measurement uncertainty would not exceed ±5%. In addition to flow measurements, geodetic measurements were also made in each section. The water level of the water surface was linked in cross-section to the sea level. Two rounds of tracer tests were also carried out using 20% Rhodamine WT as a tracer. This substance does not change the physicochemical properties of river water, is non-toxic to animals and plants, has good diffusion properties and is not adsorbed. In addition, this dye is easily detectable by measuring equipment in the samples taken. These studies provided data on the characteristics of solute transport in rivers and lag times. The measurements were made in summer and autumn 2018. During the summer fieldwork, two series of tests were carried out, on July 17, 2018 measurements were made on the Reda River, and on July 18, 2018 on the Gizdepka Stream. The second round was made in the autumn, on the Reda on November 8, 2018, and on the Gizdepka on December 6, 2018. The determinations were made with a Turner Designs Trilogy fluorometer. The results obtained from the field measurements supplemented the data obtained from the monitoring network and were used during the calibration of the SWAT model.
2.9. Calculation Scenarios
In order to check the impact of agricultural land use on nutrient runoff to the Bay of Puck, a series of simulations was carried out for different methods of agricultural land use. The assumption of homogeneous cultivation was assumed each time, i.e., for all arable fields the same plant, fertilization method, tillage, etc. Crops that most often occur in Puck commune were taken into account: winter wheat, winter triticale, barley, cereal mix, rapeseed, silage corn, potatoes, and legumes.
3. Results and Discussion
This paper presents the most important results of simulations performed for the years 2011–2018, focusing primarily on universal relationships and extreme conditions, i.e., 2017—wet year (annual rainfall total 993mm) and 2018—dry year (annual rainfall total 506mm).
3.1. Pesticides
In three cases, the model shows the presence of pesticides in surface runoff, flowing through the rivers and the Bay of Puck to the Baltic Sea. The table below (Table 2) contains pesticide loads of the analyzed area expressed in mg/ha. Dose means the dose applied to the field applied refers to the amount of substance that has reacted actively (the difference between dose and applied to loss). The compounds washed away with surface runoff can be dissolved in water and transported to watercourses and then to the Baltic Sea. Some compounds are sorbed to sediment transported with water into leach during the time step. In the case of Puck district, the doses of plant protection products are so small that no pesticides were found at the outflow from the watercourses. Field studies have shown that the problem of pesticide pollution of the surface waters of the studied catchment area is insignificant [35]. Simulations have shown that more pesticides stay in the ground than flow into the Baltic Sea, probably due to the developed system of drainage ditches temporarily holding water. Unfortunately, part of the applied dose remains on the surface of the plants during the harvest season.
The same values for winter wheat and winter triticale result from almost identical requirements for both plants (parameters describing the growth, as well as the type, date, and dose of the applied pesticide). For the remaining crops, the presence of pesticides at the outflow was almost imperceptible—this was confirmed by the analysis of water samples collected during field tests.
3.2. Nutrient
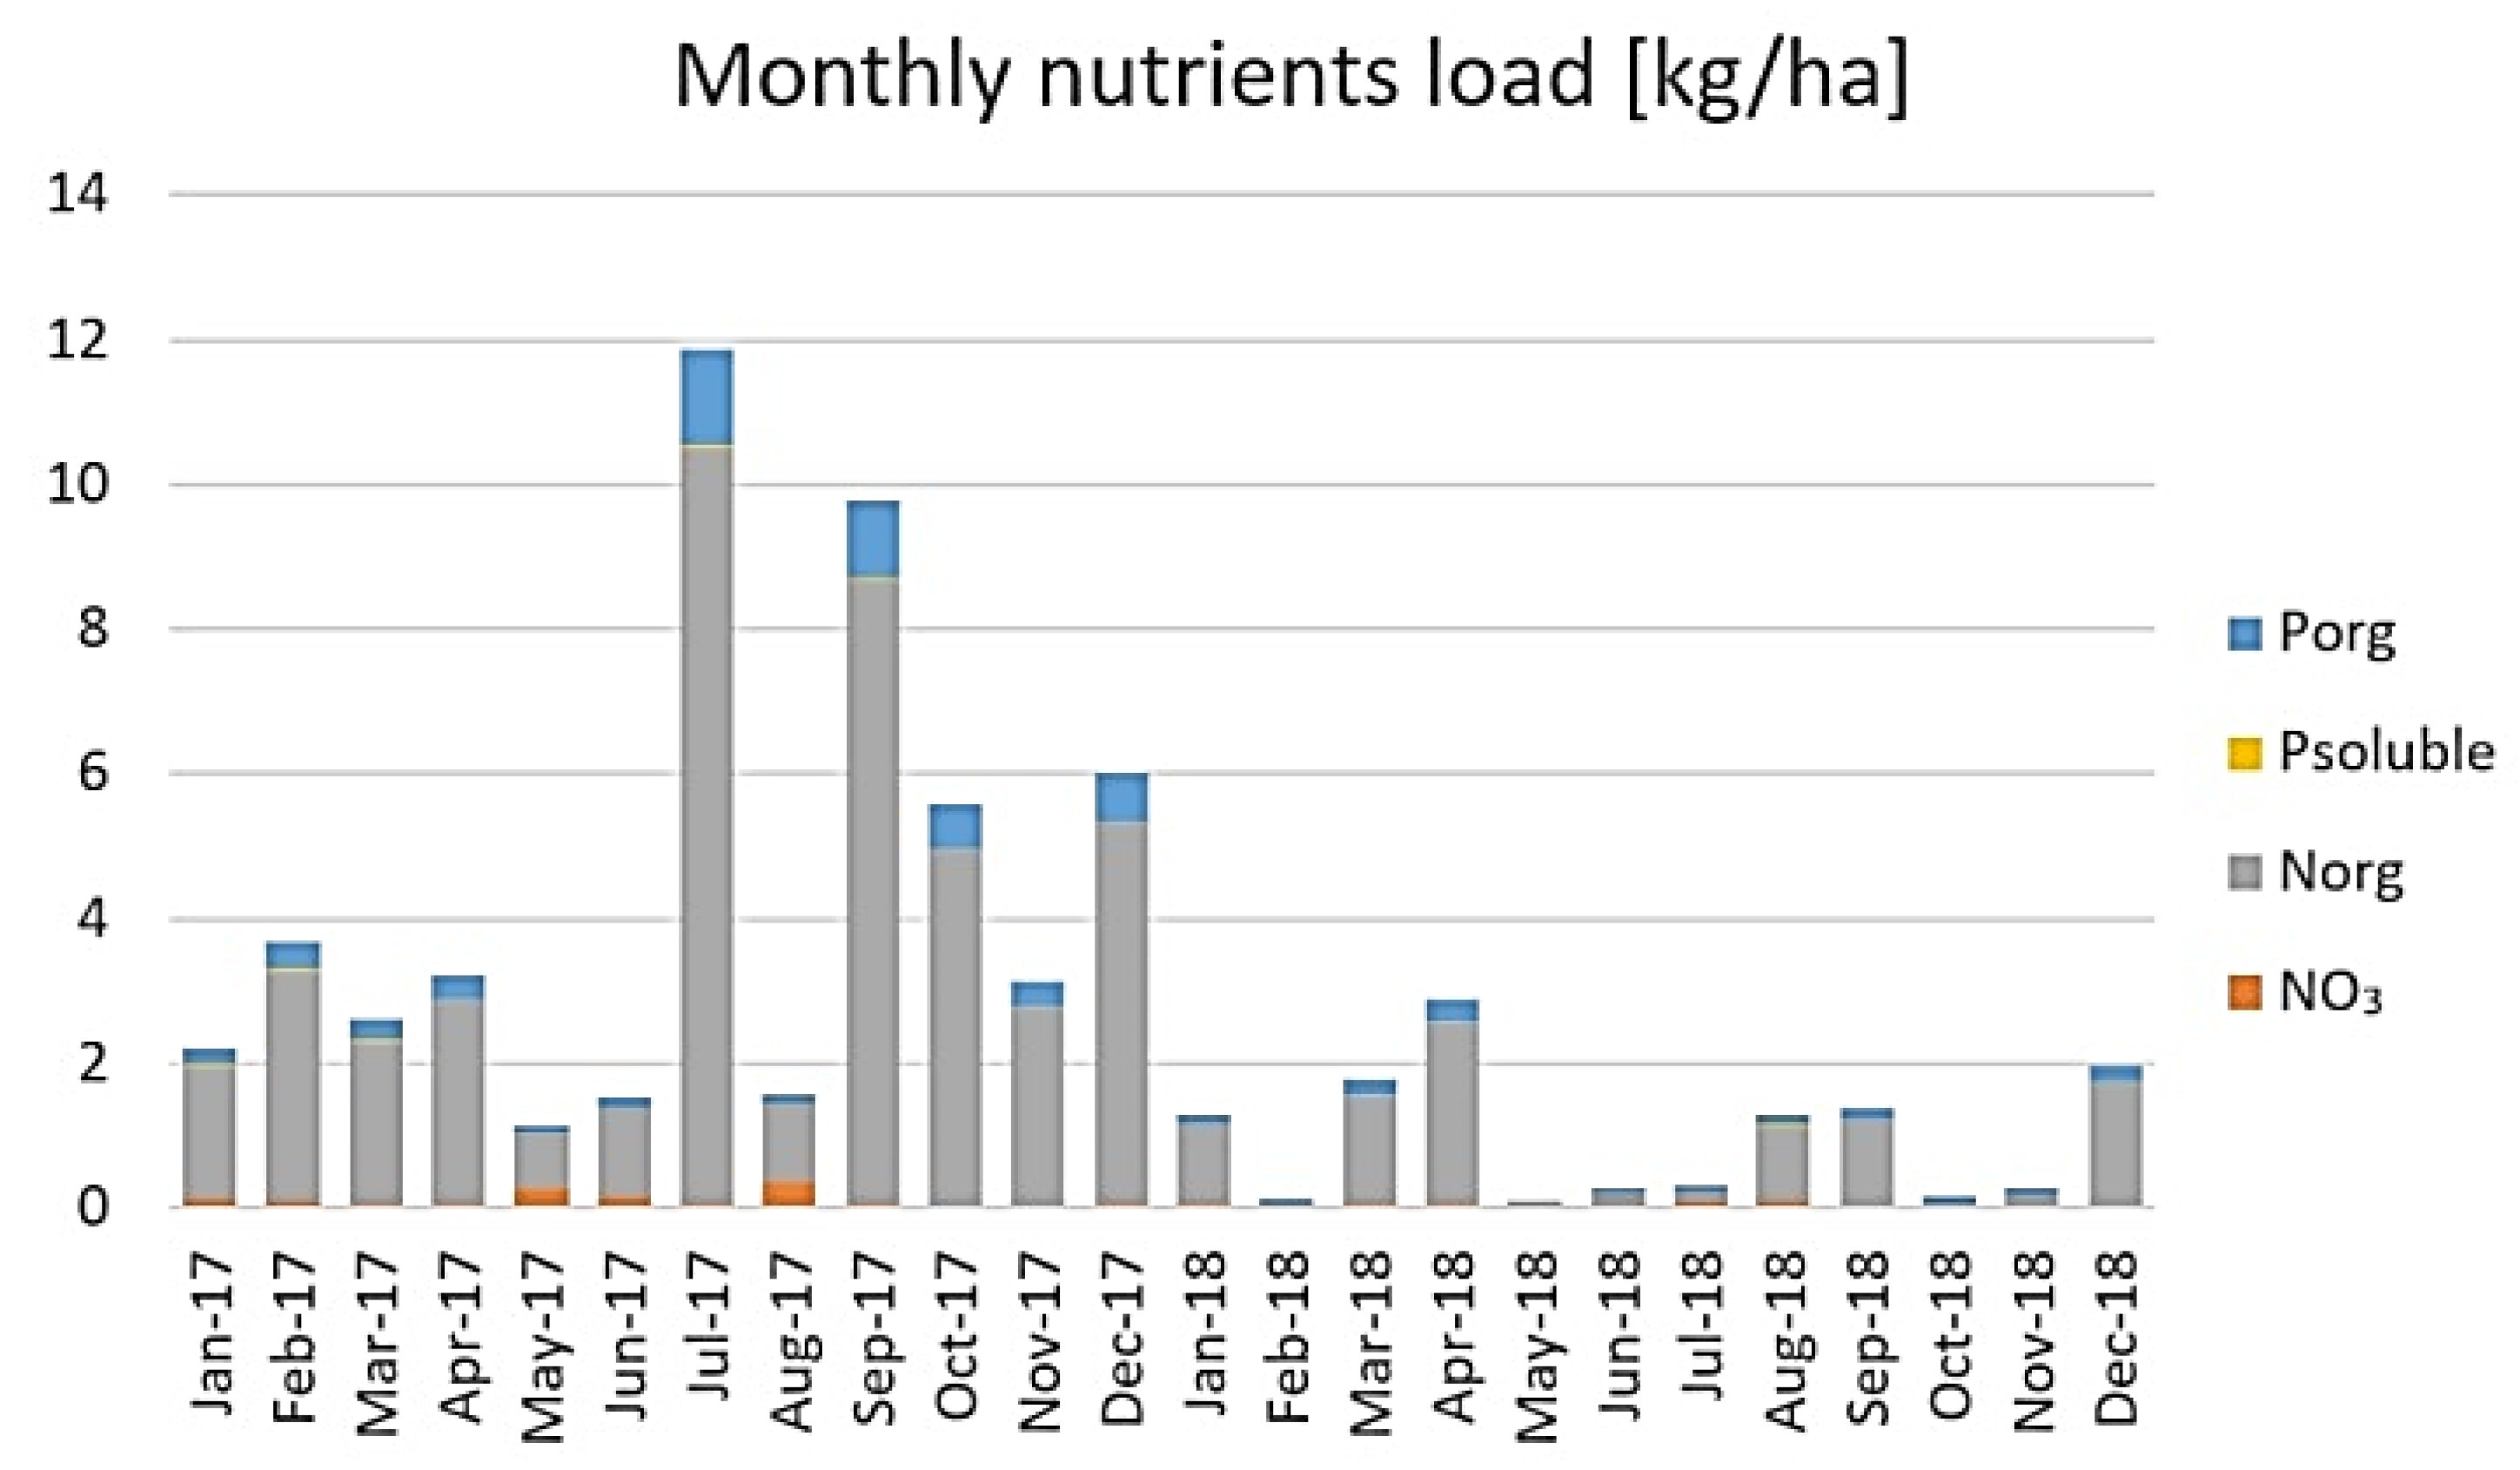
A significant correlation between the amount of precipitation and the amount of nutrient runoff from the catchment area was noted. Figure 4 shows the total sum of nutrients leaching to Puck Bay from Puck community.
The total annual nitrogen outflow from the analyzed catchment area in 2017 (wet year) was 47.61 kg/ha, and for phosphorus 5.83 kg/ha. In contrast, in the dry year 2018 (dry year), the nutrient runoff was 10.45 kgN/ha and 1.27 kgP/ha. Given the European average, this seems to be a very good result. Among the countries belonging to the Baltic Sea catchment area, there is a very large variation in the amount of lost nutrients. Total N inputs range from around 50 to more than 300 kg N per ha per year. It is significant that a greater supply of nutrients can be observed among more developed countries, which is associated with more intensified agriculture [5].
The N/P ratio in the Baltic Sea, depending on the location, ranges from 40 to 95, with the average for the entire basin at 45 [36]. On average, 8 times more nitrogen than phosphorus is supplied from the analyzed catchment area.
Spring and autumn increases in the amount of leached nutrient can be seen. Spring biogenic compound concentration is a process observed in the southern part of the Baltic Sea catchment area [37]. In the analyzed case, a high jump in nutrient concentration is noticeable in July and September 2017. It results from excess precipitation, twice exceeding the average rainfall for many years for these months (Table 3).
Differences between the results for 2017 and 2018 are due to specific hydrological conditions. In 2018, a severe drought was observed in northern Poland. Below (Table 3), is a summary of the monthly sum of precipitation for Żelistrzewo, a village located in the center of the catchment area, for the years 2017 and 2018, and monthly averages from the years 2011–2018.
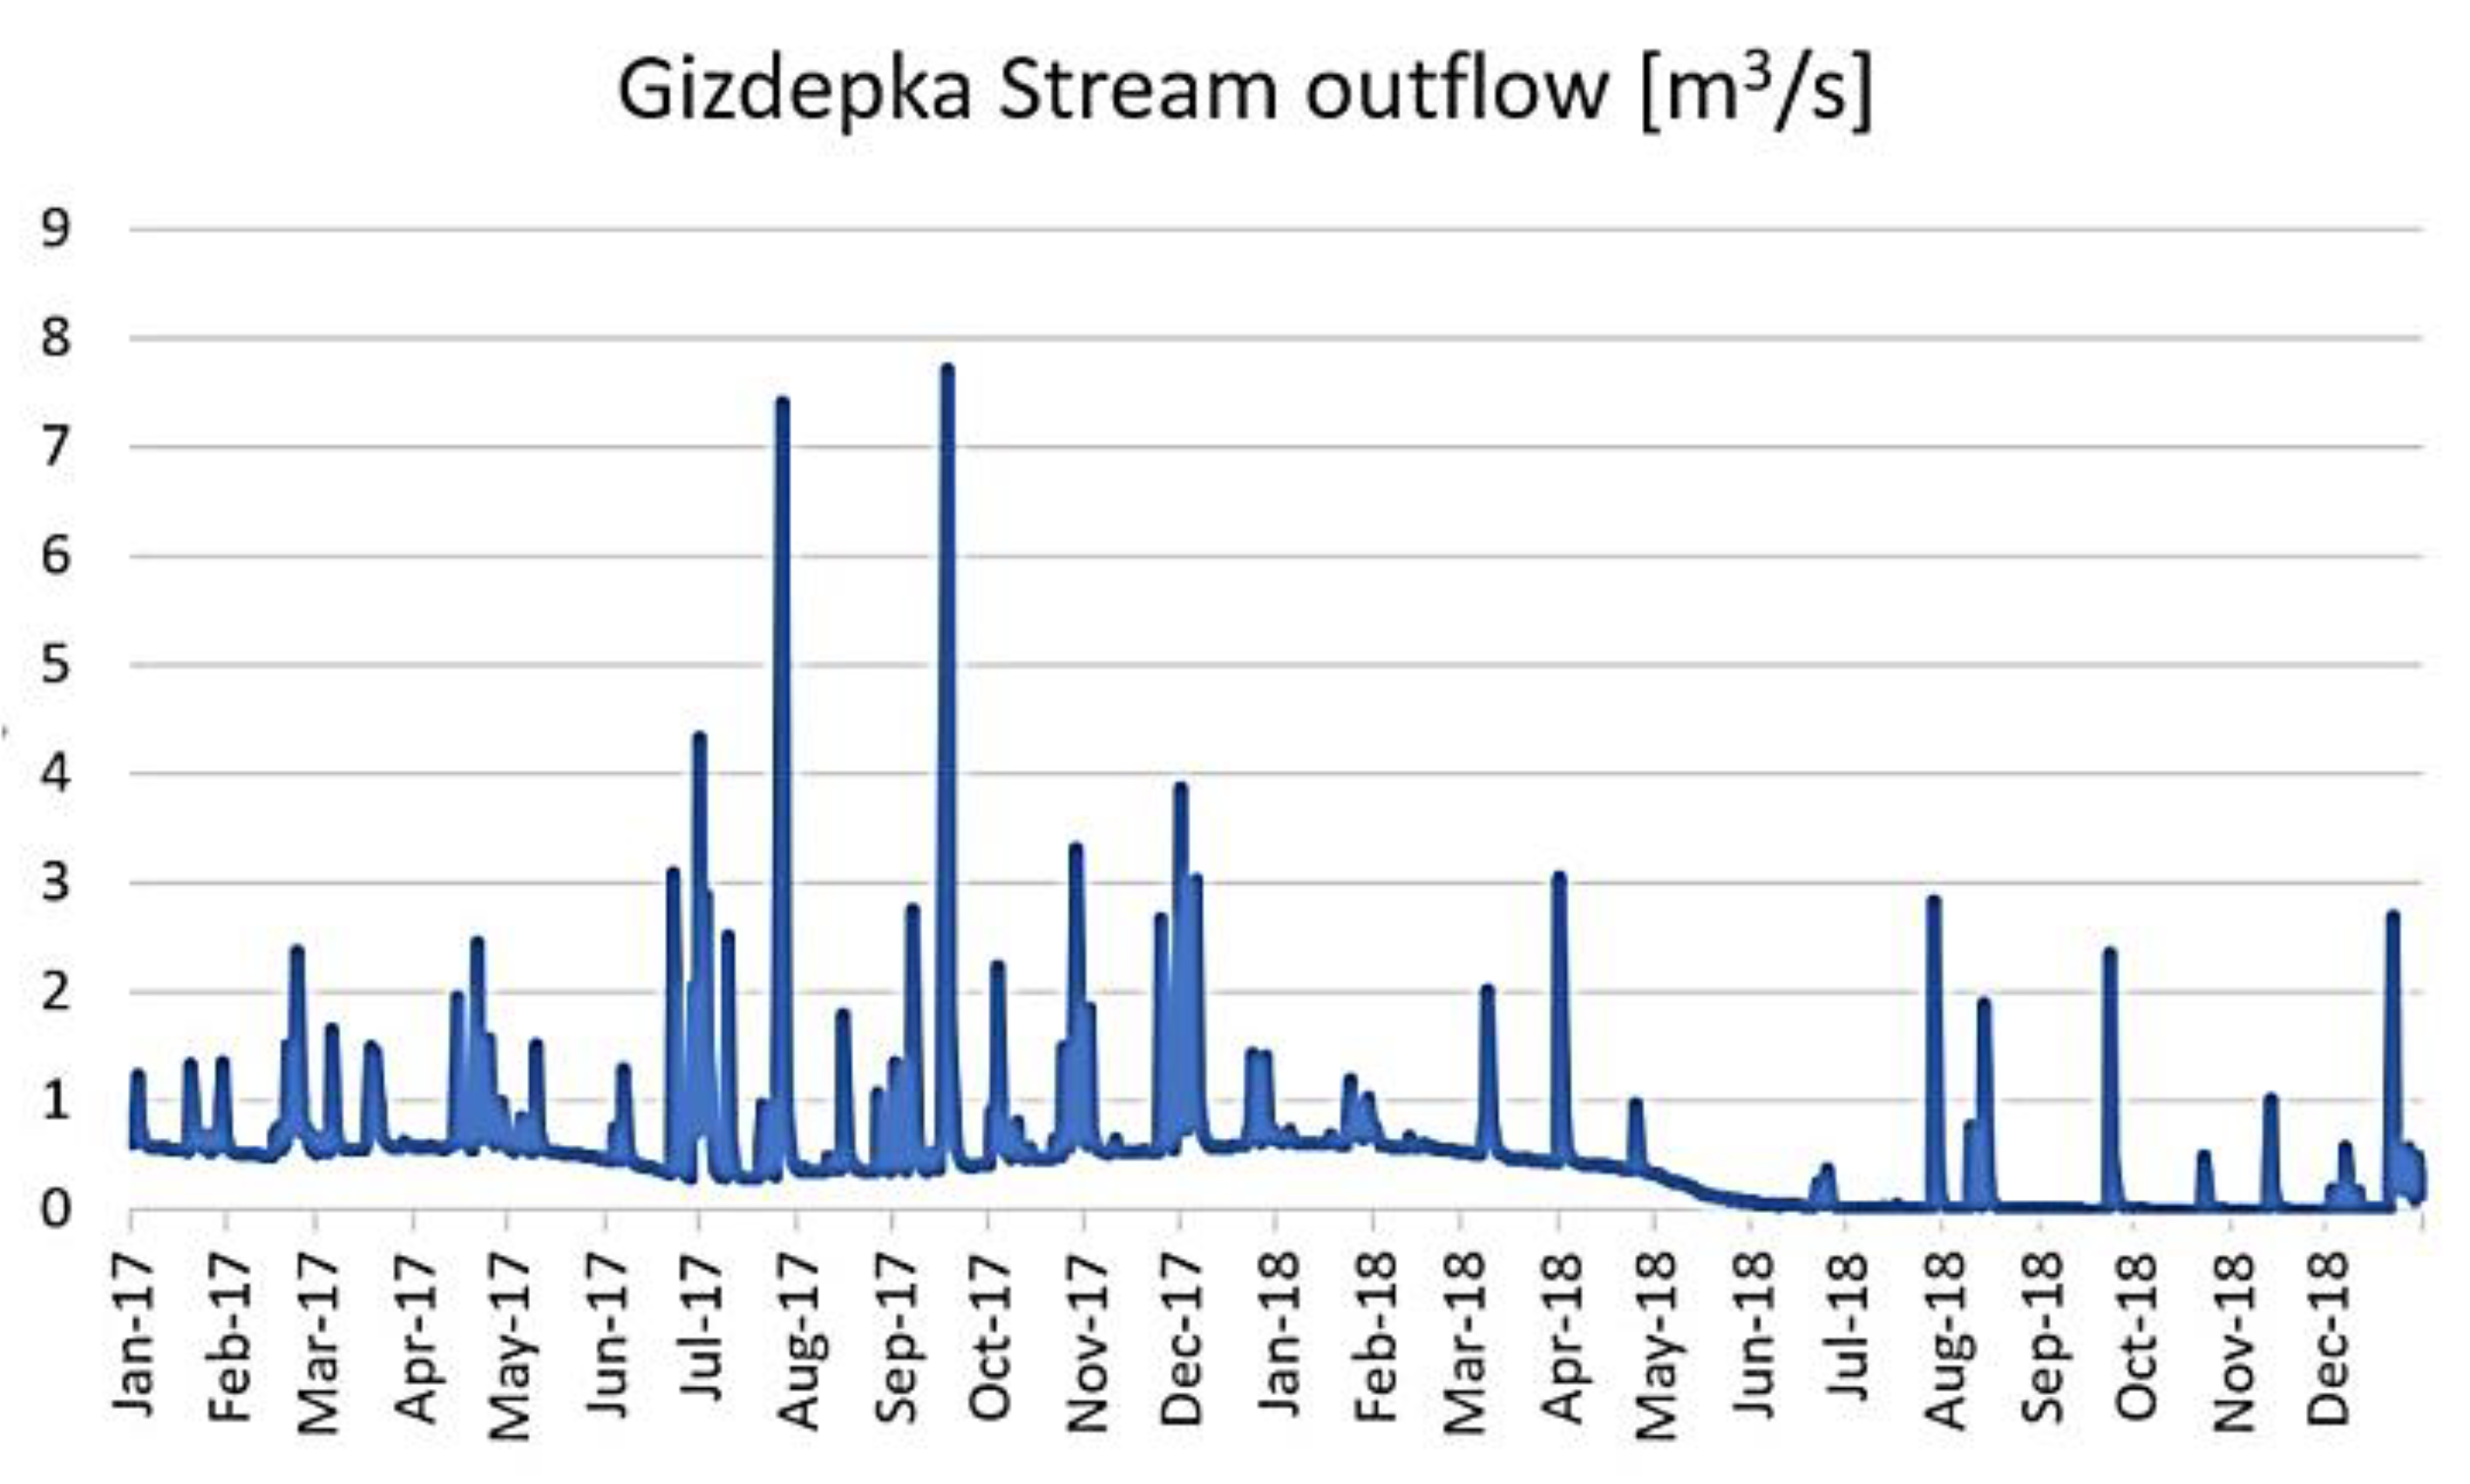
Definite differences can be seen, especially in the summer, as in July 2018 there was only 32mm of rain, instead of the average value of 102mm. This resulted in low water levels and discharges into streams. The graph below presents a characteristic hydrograph for the outflow observed in a stream in Puck commune, on the example of the Gizdepka Stream (Figure 5). The short length and quite large local slopes result in a very fast response of the basin after the rain. The water level rises rapidly after a few hours, and returns to the previous level after a day. A set of field measurements made in 2017–2019 allowed for the verification of dynamic changes in the discharges calculated in the SWAT model (Figure 6).
There is also a correlation between the amount of precipitation, the quantity of nitrates in surface runoff, and the quantity of nitrates taken by plants (Table 4). The lower the precipitation, the less compounds are washed away, and thus the plants have more time to take them from the soil.
3.3. WaterPuck Prediction and Information Service
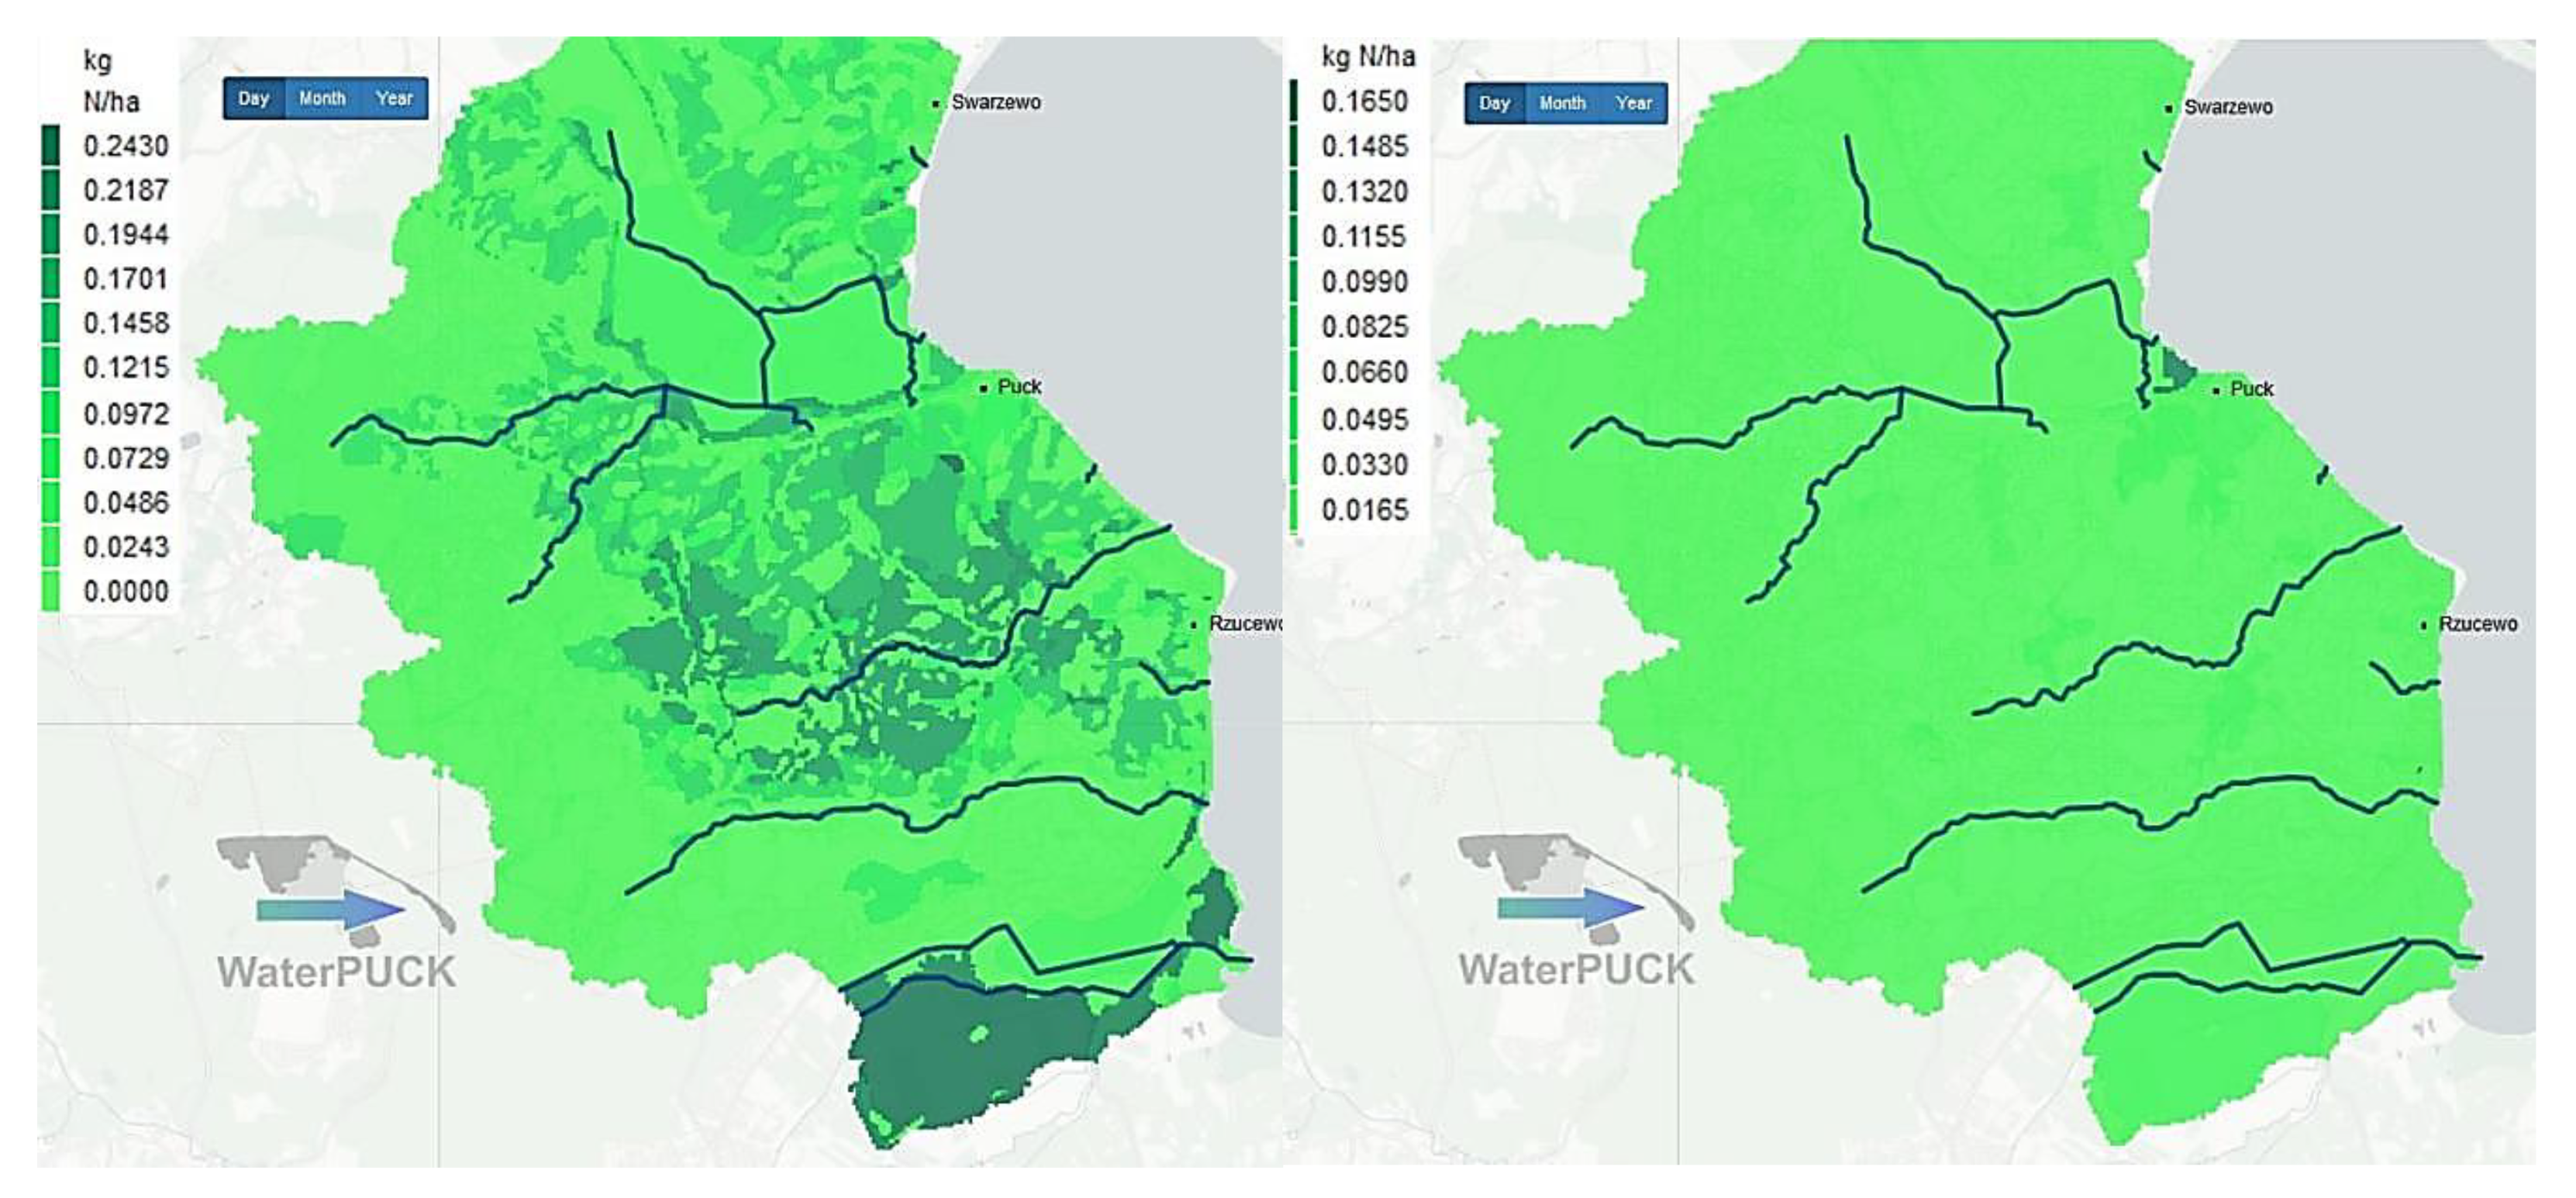
A series of simulations showed that meteorological conditions, in particular, precipitation, have the greatest impact on the outflow of nutrients from the analyzed area. The WaterPUCK predictive and information model makes it possible to check the impact of agricultural practices implemented for 3 scenarios: precipitation as for the village of Żelistrzewo located in the center of the modeled catchment area (Figure 2); high intensity rain—each time the daily rainfall was increased by 20%; low intensity rain—the daily rainfall was reduced by 20%. Figure 7 presents the results of a simulation performed on the website waterpuck.pl, where there is a comparison of the results for 28.07.2018 in two variants: high and low rain intensity. There are differences in the concentrations of nitrogen in surface runoff and spatial diversity. In the Figure to the left (high intensity), the daily sum of nitrogen which is washed out with surface runoff is from 0.02 kgN/ha, especially on the west side of the basin covered by forest (Figure 2), and up to 0.24 kgN/ha in the Reda Valley, where the soil contains a lot of nitrogen. The biggest changes in results are visible in the center of the basin (Błądzikowski Stream sub-basin (Figure 2)) where there are mostly agriculture areas. In the Figure to the right, we can see that without heavy rain, almost in the whole area, the concentration of nitrogen in surface runoff is lower than 0.08 kgN/ha, except for the small piece of land at the end of the Płutnica sub-basin (Figure 2), where many drainage channels connect.
Applications such as those available through the waterpuck.pl website can help identify sensitive areas in which special attention should be paid to the restrictions associated with the use of fertilizers. Given the complexity of the problem related to optimal fertilization, it seems reasonable to create and use predictive mathematical models for this purpose. They can support farmers’ decisions since the more nutrients run down from their area, the more money they lose on inefficient fertilization. The dose and timing of fertilization should be well thought out, taking into account changes and forecasts regarding climate change. In addition, these applications can help local authorities to ensure clean waters, particularly in the strongly eutrophied Puck Bay, which is one of the main tourist attractions of the commune.
4. Conclusions
The WaterPUCK system aims to increase the environmental quality of the ecosystems of Puck Bay under different scenarios of economic development. The growing pressure of agriculture, industry, and tourism on the environment increases the costs of maintaining the biodiversity of the Baltic Sea and of the mitigation of eutrophic processes. On this background, the results of the study presented in this paper lead to several conclusions:
(1) It should be emphasized that anthropopressure does not apply only to urbanization. Even areas, such as crop areas and even meadows used for agriculture, are a potential source of pollution of coastal, surface, and groundwater (which was the subject of parallel research under the WaterPUCK system [9]).
(2) The amount of biogenic elements taken up by plants in the analyzed area depends on atmospheric conditions, and in particular on the amount and intensity of precipitation. It should be noted that this is a coastal area with a specific microclimate.
(3) The research and simulations (carried out on their basis in SWAT) confirmed that the agricultural practices used and the doses of pesticides used do not affect the level of pollution caused by these substances in waters.
(4) The amount of nutrients in surface runoff depends not only on the type and dose of fertilizers used but also largely on atmospheric conditions. In creating legal regulations aimed at nutrients and pollutants reaching the Baltic Sea, it is worth remembering the consequences associated with the expected climate changes (often very intense rainfall).
Author Contributions
Conceptualization: D.K.; methodology: D.K. and P.W.; software: D.K.; validation: D.K. and P.W.; formal analysis, D.K.; investigation: D.K.; resources: P.W.; writing—original draft preparation: D.K.; writing—review and editing, P.Z. and T.K.; visualization: D.K.; supervision: P.Z.; project administration: P.Z. All authors have read and agreed to the published version of the manuscript.
Funding
This research was funded by National Centre for Research and Development of Poland within the BIOSTRATEG III program No. BIOSTRATEG3/343927/3/NCBR/2017.
Conflicts of Interest
The authors declare no conflict of interest.
References
- Nausch, G.; Aertebjerg, G. Anthropogenic Nutrient Load of the Baltic Sea. Limnologica 1999, 29, 233–241. [Google Scholar] [CrossRef] [Green Version]
- San, P.; Rahm, L. Nutrient Trends in the Baltic Sea. Environmetrics 1993, 4, 75–103. [Google Scholar] [CrossRef]
- Council Directive. Concerning the Protection of Waters against Pollution Caused by Nitrates from Agricultural Sources (91/676/EEC). Available online: https://eur-lex.europa.eu/legal-content/EN/TXT/PDF/?uri=CELEX:31991L0676&from=EN (accessed on 15 December 2019).
- Granéli, E.; Wallström, K.; Larsson, U.; Granéli, W.; Elmgren, R. Nutrient limitation of primary production in the Baltic Sea Area. AMBIO 1990, 19, 142–151. [Google Scholar]
- Velthof, G.L.; Lesschen, J.P.; Webb, J.; Pietrzak, S.; Miatkowski, Z.; Pinto, M.; Kros, J.; Oenema, O. Effects of implementation of nitrates directive on nitrogen emissions in the European Union. Sci. Total Environ. 2014, 468–469, 1225–1233. [Google Scholar] [CrossRef] [PubMed]
- Andersen, J.H.; Fossing, H.; Hansen, J.W.; Manscher, O.H.; Murray, C.; Petersen, D.L. Nitrogen inputs from agriculture: Towards better assessments of eutrophication status in marine waters. Ambio 2014, 43, 906–913. [Google Scholar] [CrossRef] [PubMed] [Green Version]
- Chen, Y.; Cvetkovic, V.; Destouni, G. Scenarios of Nutrient-Related Solute Loading and Transport Fate from Different Land Catchments and Coasts into the Baltic Sea. Water 2019, 11, 1407. [Google Scholar] [CrossRef] [Green Version]
- Murray, C.J.; Muller-Karulis, B.; Carstensen, J.; Conley, D.J.; Gustafsson, B.; Andersen, J.H. Past, Present and Future Eutrophication Status of the Baltic Sea. Front. Mar. Sci. 2019, 6, 2. [Google Scholar] [CrossRef] [Green Version]
- Węsławski, J.M.; Kryla-Straszewska, L.; Piwowarczyk, J.; Urbański, J.; Warzocha, J.; Kotwicki, L.; Włodarska-Kowalczuk, M.; Wiktor, J. Habitat modelling limitations—Puck Bay, Baltic Sea—A case study. Oceanologia 2013, 55, 167–183. [Google Scholar] [CrossRef] [Green Version]
- Zima, P. Simulation of the impact of pollution discharged by surface waters from agricultural areas on the water quality of Puck Bay, Baltic Sea. Euro-Mediterr. J. Environ. Integr. 2019, 4, 16. [Google Scholar] [CrossRef] [Green Version]
- Carstensen, J.; Conley, D.J.; Almroth-Rosell, E.; Asmala, E.; Bonsdorff, E.; Fleming-Lehtinen, V.; Gustafsson, B.G.; Gustafsson, C.; Heiskanen, A.S.; Janas, U.; et al. Factors regulating the coastal nutrient filter in the Baltic Sea. Ambio 2019. [Google Scholar] [CrossRef] [Green Version]
- Kruk-Dowgiałło, L.; Szaniawska, A. Gulf of Gdańsk and Puck Bay. In Ecology of Baltic Coastal Waters. Ecological Studies (Analysis and Synthesis); Springer: Berlin/Heidelberg, Germany, 2008; pp. 139–165. [Google Scholar]
- Pędziński, J.; Witak, M. Evidence of cultural eutrophication of the Gulf of Gdańsk based on diatom analysis. Oceanol. Hydrobiol. Stud. 2019, 48, 247–261. [Google Scholar] [CrossRef]
- Piniewski, M.; Kardel, I.; Giełczewski, M.; Marcinkowski, P.; Okruszko, T. Adapting Polish Agriculture to Reduce Future Nutrient Loads in a Coastal Watershed. Ambio 2014, 43, 644–660. [Google Scholar] [CrossRef] [PubMed] [Green Version]
- Wojciechowska, E.; Nawrot, N.; Matej-Łukowicz, K.; Gajewska, M.; Obarska-Pempkowiak, H. Seasonal changes of the concentrations of mineral forms of nitrogen and phosphorus in watercourses in the agricultural catchment area (Bay of Puck, Baltic Sea, Poland). Water Supply 2019, 19, 986–994. [Google Scholar] [CrossRef]
- Wojciechowska, E.; Pietrzak, S.; Matej-Łukowicz, K.; Nawrot, N.; Zima, P.; Kalinowska, D.; Wielgat, P.; Obarska-Pempkowiak, H.; Gajewska, M.; Dembska, G.; et al. Nutrient loss from three small-size watersheds in the southern Baltic Sea in relation to agricultural practices and policy. J. Environ. Manag. 2019, 252, 109637. [Google Scholar] [CrossRef]
- Potrykus, D.; Gumuła-Kawęcka, A.; Jaworska-Szulc, B.; Pruszkowska-Caceres, M.; Szymkiewicz, A. Assessing groundwater vulnerability to pollution in the Puck region (denudation moraine upland) using vertical seepage method. E3S Web Conf. 2018, 44, 147. [Google Scholar] [CrossRef]
- Nguyen, H.H.; Recknagel, F.; Meyer, W. Effects of projected urbanization and climate change on flow and nutrient loads of a Mediterranean catchment in South Australia. Ecohydrol. Hydrobiol. 2019, 19, 279–288. [Google Scholar] [CrossRef]
- Tamm, O.; Maasikamäe, S.; Padari, A.; Tamm, T. Modelling the effects of land use and climate change on the water resources in the eastern Baltic Sea region using the SWAT model. Catena 2018, 167, 78–89. [Google Scholar] [CrossRef]
- Ballard, T.C.; Sinha, E.; Michalak, A.M. Long-term Changes in Precipitation and Temperature Have Already Impacted Nitrogen Loading. Environ. Sci. Technol. 2019, 53, 5080–5090. [Google Scholar] [CrossRef]
- Donnelly, C.; Yang, W.; Dahné, J. River discharge to the Baltic Sea in a future climate. Clim. Chang. 2014, 122, 157–170. [Google Scholar] [CrossRef] [Green Version]
- Smith, R.; Gent, P. Reference Manual for the Parallel Ocean Program (POP); Los Alamos National Lab: Los Alamos, NM, USA, 2004.
- Dzierzbicka-Glowacka, L.; Janecki, M.; Szymczycha, B.; Dybowski, D.; Nowicki, A.; Kłostowska, Ż.; Obarska-Pempkowiak, H.; Zima, P.; Jaworska-Szulc, B.; Jakacki, J.; et al. Integrated Information and Prediction Web Service WaterPUCK General Concept. MATEC Web Conf. 2018, 210, 2011. [Google Scholar] [CrossRef] [Green Version]
- Interdisciplinary Centre for Mathematical and Computationalof Modelling UW, Weather Forecast. Available online: http://www.meteo.pl/index_en.php (accessed on 15 December 2019).
- Web Services WaterPuck. Available online: https://waterpuck.pl/en/start.html (accessed on 15 December 2019).
- Sun, C.; Ren, L. Assessing crop yield and crop water productivity and optimizing irrigation scheduling of winter wheat and summer maize in the Haihe plain using SWAT model. Hydrol. Process. 2014, 28, 2478–2498. [Google Scholar] [CrossRef]
- Arnold, J.G.; Kiniry, J.R.; Srinivasan, R.; Williams, J.R.; Haney, E.B.; Neitsch, S.L. Input/Output Documentation Version 2012 Soil & Water Assessment Tool; Texas Water Resources Institute: College Station, TX, USA, 2012. [Google Scholar]
- Institute of Meteorology and Water Management, Measurement and Observational Data. Available online: https://danepubliczne.imgw.pl/ (accessed on 15 December 2019).
- Kalinowska, D.; Wielgat, P.; Kolerski, T.; Zima, P. Effect of GIS parameters on modelling runoff from river basin. The case study of catchment in the Puck District. E3S Web Conf. 2018, 63, 5. [Google Scholar] [CrossRef]
- Arnold, J.G.; Moriasi, D.N.; Gassman, P.W.; Abbaspour, K.C.; White, M.J.; Srinivasan, R.; Santhi, C.; Harmel, R.D.; Van Griensven, A.; Van Liew, M.W.; et al. SWAT: Model Use, Calibration, and Validation. Trans. ASABE 2012, 55, 1491–1508. [Google Scholar] [CrossRef]
- Cao, W.; Bowden, W.B.; Davie, T.; Fenemor, A. Multi-variable and multi-site calibration and validation of SWAT in a large mountainous catchment with high spatial variability. Hydrol. Process. 2006, 20, 1057–1073. [Google Scholar] [CrossRef]
- Mengistu, A.G.; van Rensburg, L.D.; Woyessa, Y.E. Techniques for calibration and validation of SWAT model in data scarce arid and semi-arid catchments in South Africa. J. Hydrol. Reg. Stud. 2019, 25, 100621. [Google Scholar] [CrossRef]
- Zhang, D.; Chen, X.; Yao, H.; Lin, B. Improved calibration scheme of SWAT by separating wet and dry seasons. Ecol. Model. 2015, 301, 54–61. [Google Scholar] [CrossRef] [Green Version]
- Neitsch, S.L.; Arnold, J.G.; Kiniry, J.R.; Wiliams, J.R. Soil and Water Assessment Tool, Theoretical Documentation, Version 2009; Texas Water Resources Institute: College Station, TX, USA, 2009; Available online: https://swat.tamu.edu/media/99192/swat2009-theory.pdf (accessed on 15 December 2019).
- Pazikowska-Sapota, G.; Galer-Tatarowicz, K.; Dembska, G.; Wojtkiwicz, M.; Duljas, E.; Pietrzak, S.; Dzierzbicka-Glowacka, L. The impact of pesticides used at the agricultural land of the Puck commune on the environment of the Puck Bay. PeerJ 2020. under review. [Google Scholar]
- Elmgren, R.; Larsson, U. Nitrogen and the Baltic Sea: Managing Nitrogen in Relation to Phosphorus. Sci. World J. 2001, 1, 371–377. [Google Scholar] [CrossRef] [Green Version]
- Stepanauskas, R.; JØrgensen, N.O.; Eigaard, O.R.; Žvikas, A.; Tranvik, L.J.; Leonardson, L. Summer Inputs of Riverine Nutrients to the Baltic Sea: Bioavailability and eutrophication relevance. Ecol. Monogr. 2002, 72, 579–597. [Google Scholar] [CrossRef]
Figure 1.
Location of the study area.

Figure 2.
Main rivers and their sub-basins (source: geoportal.gov.pl), red point—field measurement, WS—weather station.
Figure 2.
Main rivers and their sub-basins (source: geoportal.gov.pl), red point—field measurement, WS—weather station.

Figure 3.
Scheme of the WaterPUCK project [25].
Figure 3.
Scheme of the WaterPUCK project [25].

Figure 4.
Monthly nutrients load into the stream for Polish Canola.

Figure 5.
Daily outflow from the Gizdepka Stream, 2017–2018.

Figure 6.
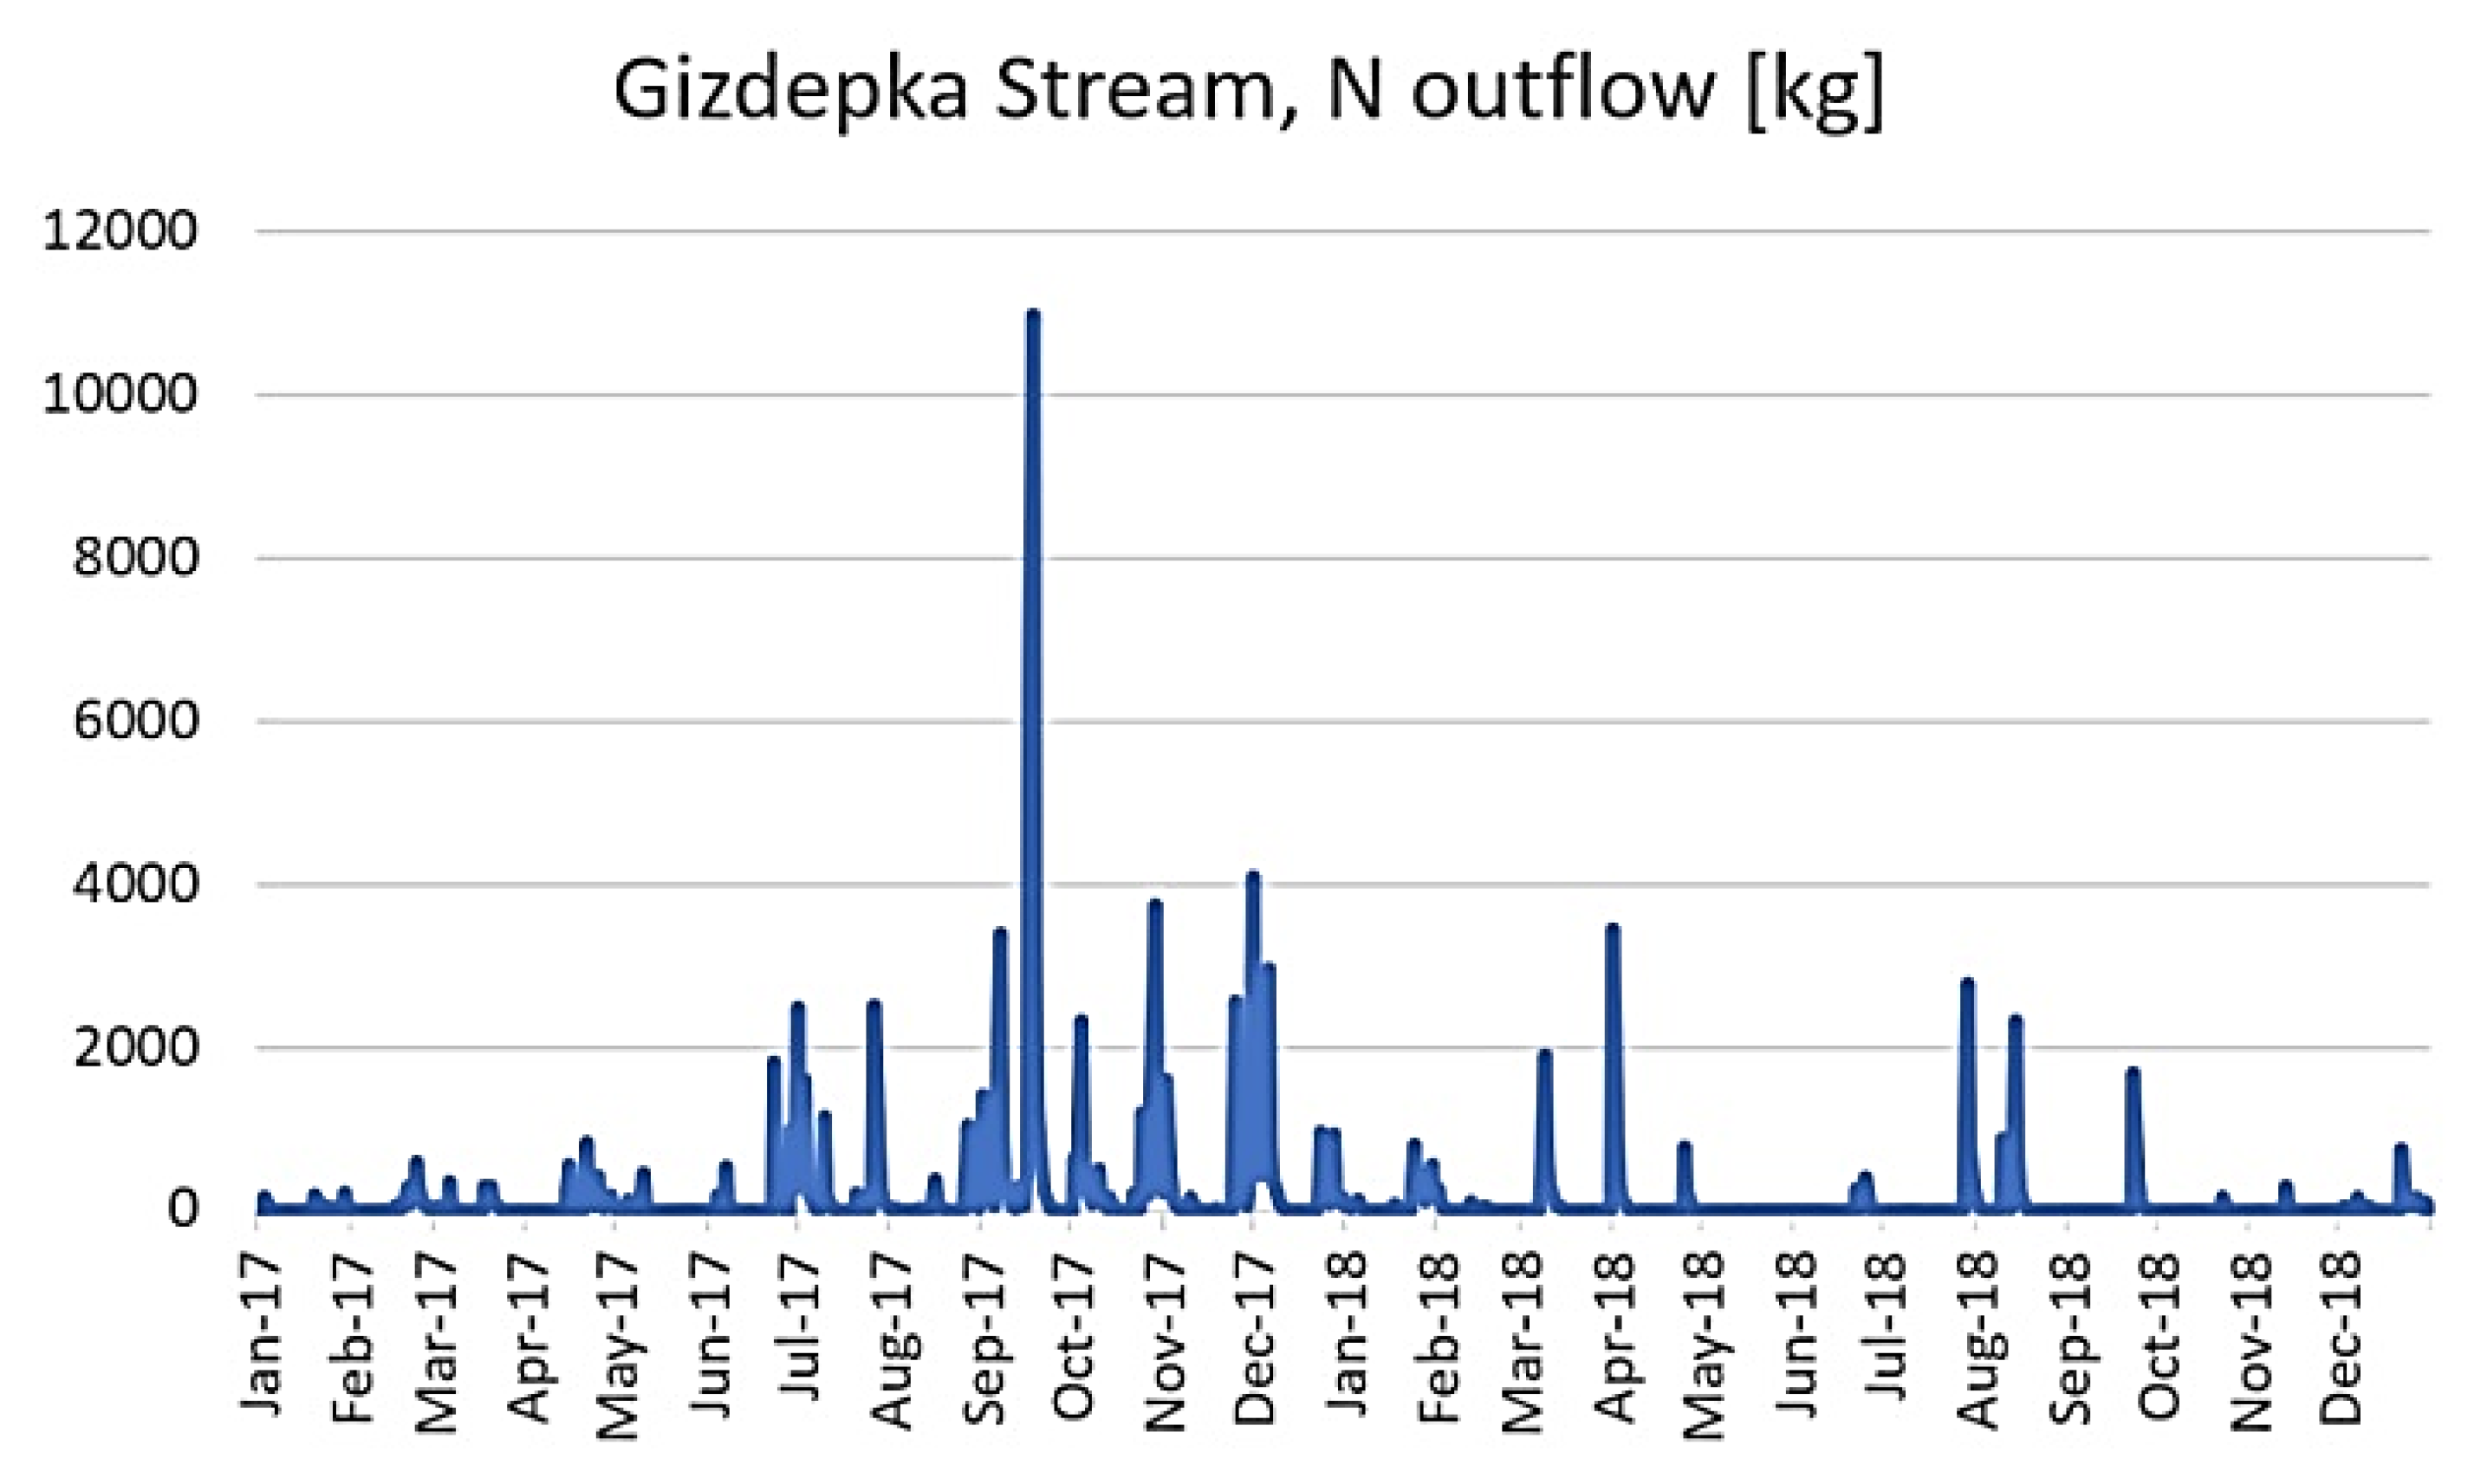
Daily outflow of nitrogen from the Gizdepka Stream, 2017–2018.

Figure 7.
Daily sum of nitrogen in surface runoff, high intensity (on the left) and low (on the right) rain scenario, July 28, 2018.
Figure 7.
Daily sum of nitrogen in surface runoff, high intensity (on the left) and low (on the right) rain scenario, July 28, 2018.


Table 1.
Results of flow measurements and characteristic flows.
| Watercourse | Flow Range during Measurements | MQmean | Qmax1% | Qmax50% | MQmin | Qmin1% | Qmin50% |
|---|---|---|---|---|---|---|---|
| (m3/s) | |||||||
| Płutnica | 0.05–0.75 | 0.60 | 8.50 | 4.34 | 0.26 | 0.06 | 0.21 |
| Gizdepka | 0.06–0.79 | 0.22 | 3.10 | 1.58 | 0.09 | 0.02 | 0.08 |
| Reda | 3.86–6.56 | 4.03 | 50.33 | 25.67 | 1.51 | 0.38 | 1.26 |
Table 2.
Results of pesticide simulations.
| Plant | Pesticide | Dose (kg/ha) | Applied (kg/ha) | Surface Runoff (mg/ha) | Final on Plant (mg/ha) | To the Baltic Sea (mg/ha) | In the Ground (mg/ha) | |
|---|---|---|---|---|---|---|---|---|
| Dissolved | Sorbed | |||||||
| Polish canola | Roundup | 1.08 | 0.41 | 289 | 3754 | 0 | 0 | 0.03 |
| Winter wheat | Diflufenican | 0.11 | 0.04 | 759 | 515 | 35 | 0 | 0.09 |
| Winter triticale | Diflufenican | 0.11 | 0.04 | 759 | 515 | 35 | 0 | 0.09 |
Table 3.
Monthly sum of precipitation.
| Monthly Sum of Precipitation (mm) | |||
|---|---|---|---|
| Month | 2017 | 2018 | The Multi-Year Average |
| 1 | 59 | 53 | 90 |
| 2 | 69 | 33 | 68 |
| 3 | 61 | 32 | 51 |
| 4 | 86 | 44 | 46 |
| 5 | 27 | 8 | 37 |
| 6 | 82 | 49 | 68 |
| 7 | 176 | 32 | 102 |
| 8 | 45 | 69 | 72 |
| 9 | 124 | 41 | 66 |
| 10 | 109 | 34 | 57 |
| 11 | 62 | 22 | 66 |
| 12 | 92 | 90 | 74 |
| sum | 993 | 506 | 797 |
Table 4.
Annual sum of nitrogen taken by the plants and leached into Puck Bay.
| Year | Annual Sum of Precipitation (mm) | NO3 Surface-Runoff | NO3 Taken by Plants |
|---|---|---|---|
| 2017 | 993 | 1.43 | 158.28 |
| 2018 | 506 | 0.54 | 181.85 |
© 2020 by the authors. Licensee MDPI, Basel, Switzerland. This article is an open access article distributed under the terms and conditions of the Creative Commons Attribution (CC BY) license (http://creativecommons.org/licenses/by/4.0/).
Share and Cite
MDPI and ACS Style
Kalinowska, D.; Wielgat, P.; Kolerski, T.; Zima, P. Model of Nutrient and Pesticide Outflow with Surface Water to Puck Bay (Southern Baltic Sea). Water 2020, 12, 809. https://doi.org/10.3390/w12030809
AMA Style
Kalinowska D, Wielgat P, Kolerski T, Zima P. Model of Nutrient and Pesticide Outflow with Surface Water to Puck Bay (Southern Baltic Sea). Water. 2020; 12(3):809. https://doi.org/10.3390/w12030809
Chicago/Turabian StyleKalinowska, Dominika, Paweł Wielgat, Tomasz Kolerski, and Piotr Zima. 2020. "Model of Nutrient and Pesticide Outflow with Surface Water to Puck Bay (Southern Baltic Sea)" Water 12, no. 3: 809. https://doi.org/10.3390/w12030809
Note that from the first issue of 2016, this journal uses article numbers instead of page numbers. See further details here.