Article

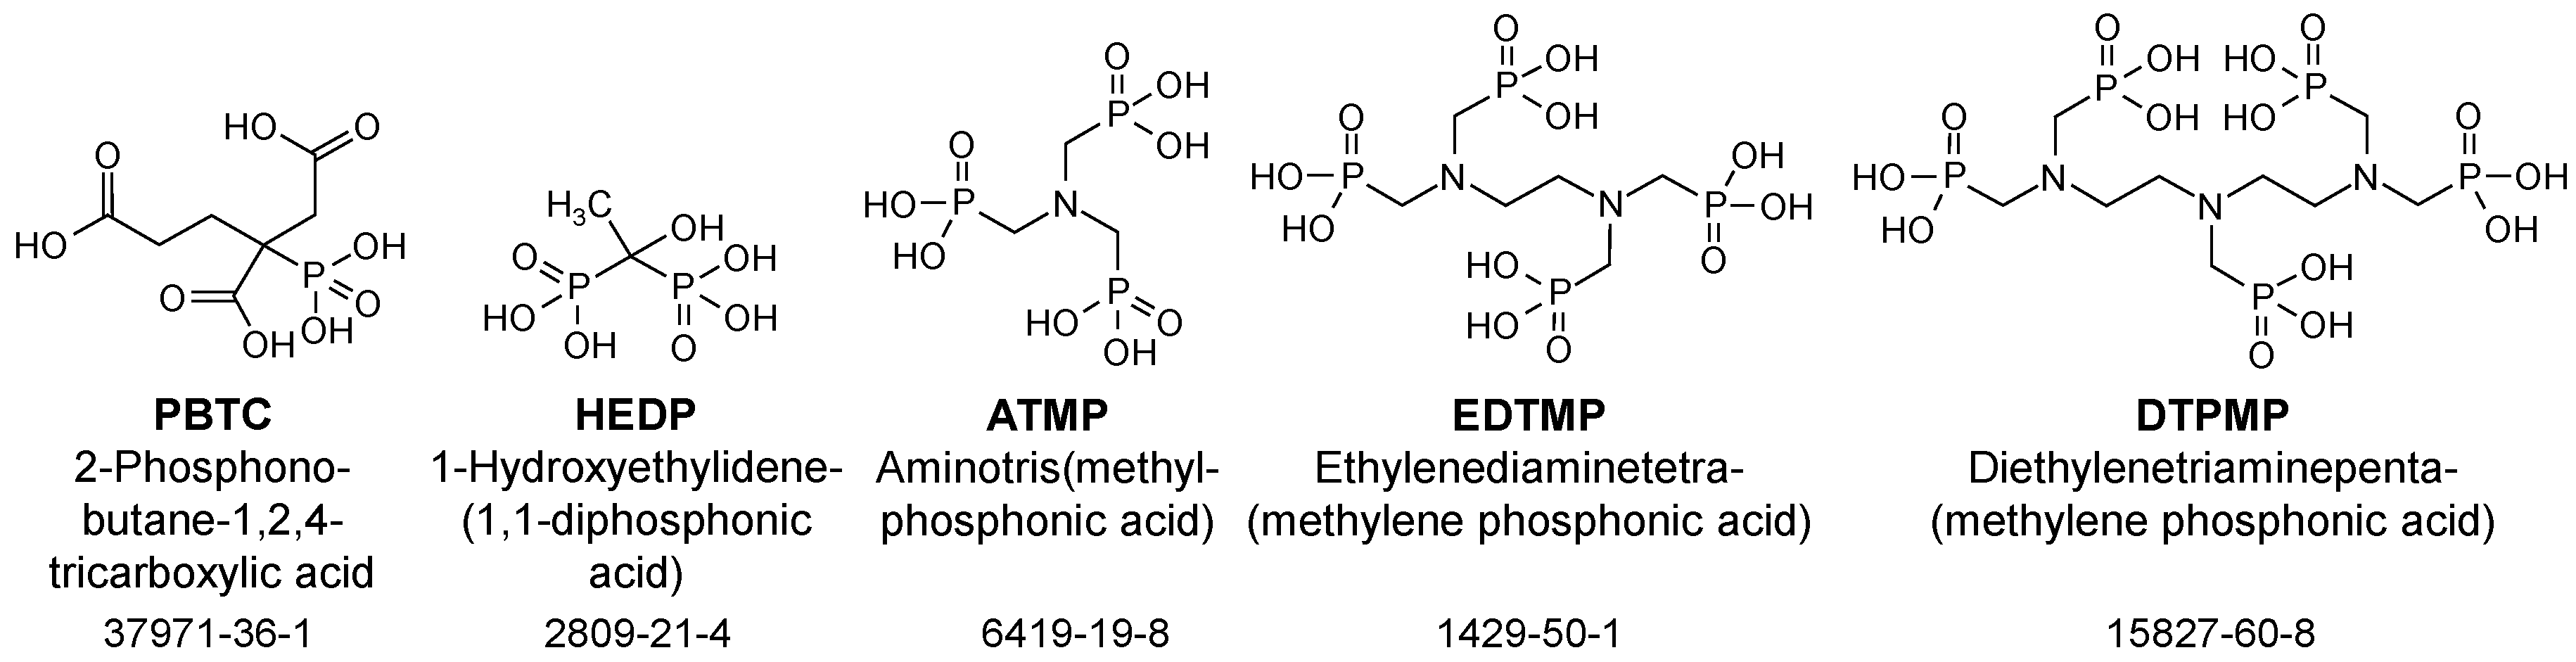
Influence of Wastewater Discharge on the Occurrence of PBTC, HEDP, and Aminophosphonates in Sediment, Suspended Matter, and the Aqueous Phase of Rivers

1
Institute for Sanitary Engineering, Water Quality and Solid Waste Management, University of Stuttgart, Bandtäle 2, 70569 Stuttgart, Germany
2
TZW: DVGW Water Technology Center, Karlsruher Straße 84, 76139 Karlsruhe, Germany
*
Author to whom correspondence should be addressed.
Water 2020, 12(3), 803; https://doi.org/10.3390/w12030803
Submission received: 10 January 2020 / Revised: 4 March 2020 / Accepted: 8 March 2020 / Published: 13 March 2020
(This article belongs to the Section Water Quality and Contamination)

Abstract

:
Sediment, suspended matter (SM), and water of a large river (Neckar; River1) and a small river (Körsch; River2) were analyzed for the phosphonates 2-phosphonobutane-1,2,4-tricarboxylic acid (PBTC), 1-hydroxyethylidene (1,1-diphosphonic acid) (HEDP), aminotris (methylphosphonic acid) (ATMP), ethylenediaminetetra (methylene phosphonic acid) (EDTMP), and diethylenetriaminepenta (methylene phosphonic acid) (DTPMP). Ten samplings were performed at intervals of one to two months during one year, each covering the relevant matrices before and behind the discharge point of a wastewater treatment plant (WWTP). In River1, the total concentration of dissolved phosphonate did not change significantly (2.4–5.8 µg/L before vs. 2.5–6.6 µg/L behind WWTP; p = 0.9360). In River2, it increased significantly from <0.1–1.6 µg/L to 19–39 µg/L (p < 0.0001). Based on the median, the total phosphonate load in River1 sediment increased 1.9-fold (6.7–29.4 mg/kg before vs. 17.8–53.5 mg/kg behind WWTP; p = 0.0033) and in River2 by a factor of eight (1.8–5.0 mg/kg before vs. 18.1–51.4 mg/kg behind WWTP; p < 0.0001). This indicates that phosphonates discharged by WWTPs adsorb onto solid particles and accumulate in the sediment. In the case of River2, the SM load could reach values of 1000–1710 mg/kg behind the WWTP, presumably due to the introduction of insufficiently retained activated sludge particles of >2000 mg/kg phosphonate loads. In general, the nitrogen-free phosphonates PBTC and HEDP were most predominant in both dissolved and adsorbed form, of which HEDP had the highest adsorption affinity.

Graphical Abstract

1. Introduction

The phosphonates 2-phosphonobutane-1,2,4-tricarboxylic acid (PBTC), 1-hydroxyethylidene (1,1-diphosphonic acid) (HEDP), aminotris (methylphosphonic acid) (ATMP), ethylenediaminetetra (methylene phosphonic acid) (EDTMP), and diethylenetriaminepenta (methylene phosphonic acid) (DTPMP) (Figure 1) are used as complexing agents in detergents, care, and cleaning agents and in several industrial processes. 94,000 t/a of these phosphonates were consumed in 2012 [1]. As their consumption is increasing while little is known about their environmental fate, they have shifted into the focus of environmental authorities [2]. Due to natural elimination mechanisms [3,4,5], a long-term release of bioavailable ortho-phosphate from phosphonates in waters, thus, a contribution to eutrophication cannot be excluded [2]. However, because of a lack of robust and sufficiently sensitive analysis methods, until recently, only a few data have been reported on dissolved phosphonate concentrations in rivers: 0.3–1.6 µg/L HEDP and 0.1–1.3 µg/L DTPMP in six German rivers [6], 8–70 µg/L DTPMP in a German stream [7], and 94 ng/L PBTC and 88 ng/L HEDP in a Chinese river [8]. In these studies, only a few random samples were analyzed, so that possible long-term variations and the influence of wastewater treatment plant discharge on rivers remain unclear.
From laboratory experiments, phosphonates are known for their outstanding adsorption affinity towards mineral surfaces [9,10,11]. Consequently, a fractionated view is of particular interest (dissolved in aqueous phase vs. adsorbed on particulate matter and sediments). However, the loads of individual anthropogenic phosphonates on sediment and suspended matter (SM) have hitherto not been investigated.
In a previous study, Rott et al. [12] reported a comprehensive characterization of the behavior of the above-mentioned five phosphonates in different stages of two German wastewater treatment plants (WWTPs). This study revealed that up to 80% of the phosphonates in the WWTP influent can be present in adsorbed form. The sum of dissolved and adsorbed phosphonates in the inflow reached 1.55 mg/L. The nitrogen-free phosphonates PBTC and HEDP made up the largest proportion of the total phosphonate content in the WWTP influent and effluent. The lowest elimination was recorded for PBTC, which so far has been investigated only to a limited extent. The current study presents parallel measurements of the receiving waters of these two WWTPs before and behind the wastewater discharge point (WWD) regarding the dissolved concentrations of the five phosphonates, as well as their loads on SM and the top layer of sediment on a large time-scale. In addition, the distribution of phosphonates in different layers of Rhine River sediment is shown. Thus, for the first time, sediment and SM loads of these five important phosphonates are presented.
For this purpose, a newly developed analytical method based on ion exchange chromatography coupled to tandem mass spectrometry with electrospray ionization (IC-ESI-MS/MS) applying isotope-labeled internal standards was used [13]. This method allows the extraction of >95% phosphonates from solid samples and their quantification down to 0.1 mg/kg on SM and sediment. An automated concentration step enables comparatively low limits of quantification (LOQs) for dissolved phosphonates in surface water (0.04–0.16 µg/L).

2. Materials and Methods

2.1. Sampling Concept

2.1.1. General Information

The main WWTP Stuttgart-Mühlhausen/Germany (WWTP1) with its receiving water Neckar (River1, Figure A1) and the WWTP Stuttgart-Möhringen/Germany (WWTP2) with its receiving water Körsch (River2, Figure A2) were sampled 10 times at intervals of 1 to 2 months. The samples were taken in the years 2016 and 2017 with the aim of covering an overall evenly distributed range throughout the calendar weeks. Samples were taken before and behind the WWD. At each sampling, the GPS coordinates of all sampling points (Table A1) and the water level of River1, as well as the flow rates of River2 and each WWTP, were recorded (Figure A3). Whereas liquid random samples and sediment samples (top layer) were taken on all 10 sampling dates, SM samples were obtained on three sampling dates from River1 and on four sampling dates from River2. The concentrations of the suspended solids are shown in Figure A4. All samples were analyzed with regards to their content of PBTC, HEDP, ATMP, EDTMP, and DTPMP. Additionally, a sediment core down to a depth of 66 cm from the Rhine (River3) was analyzed for phosphonates in different sediment layers.

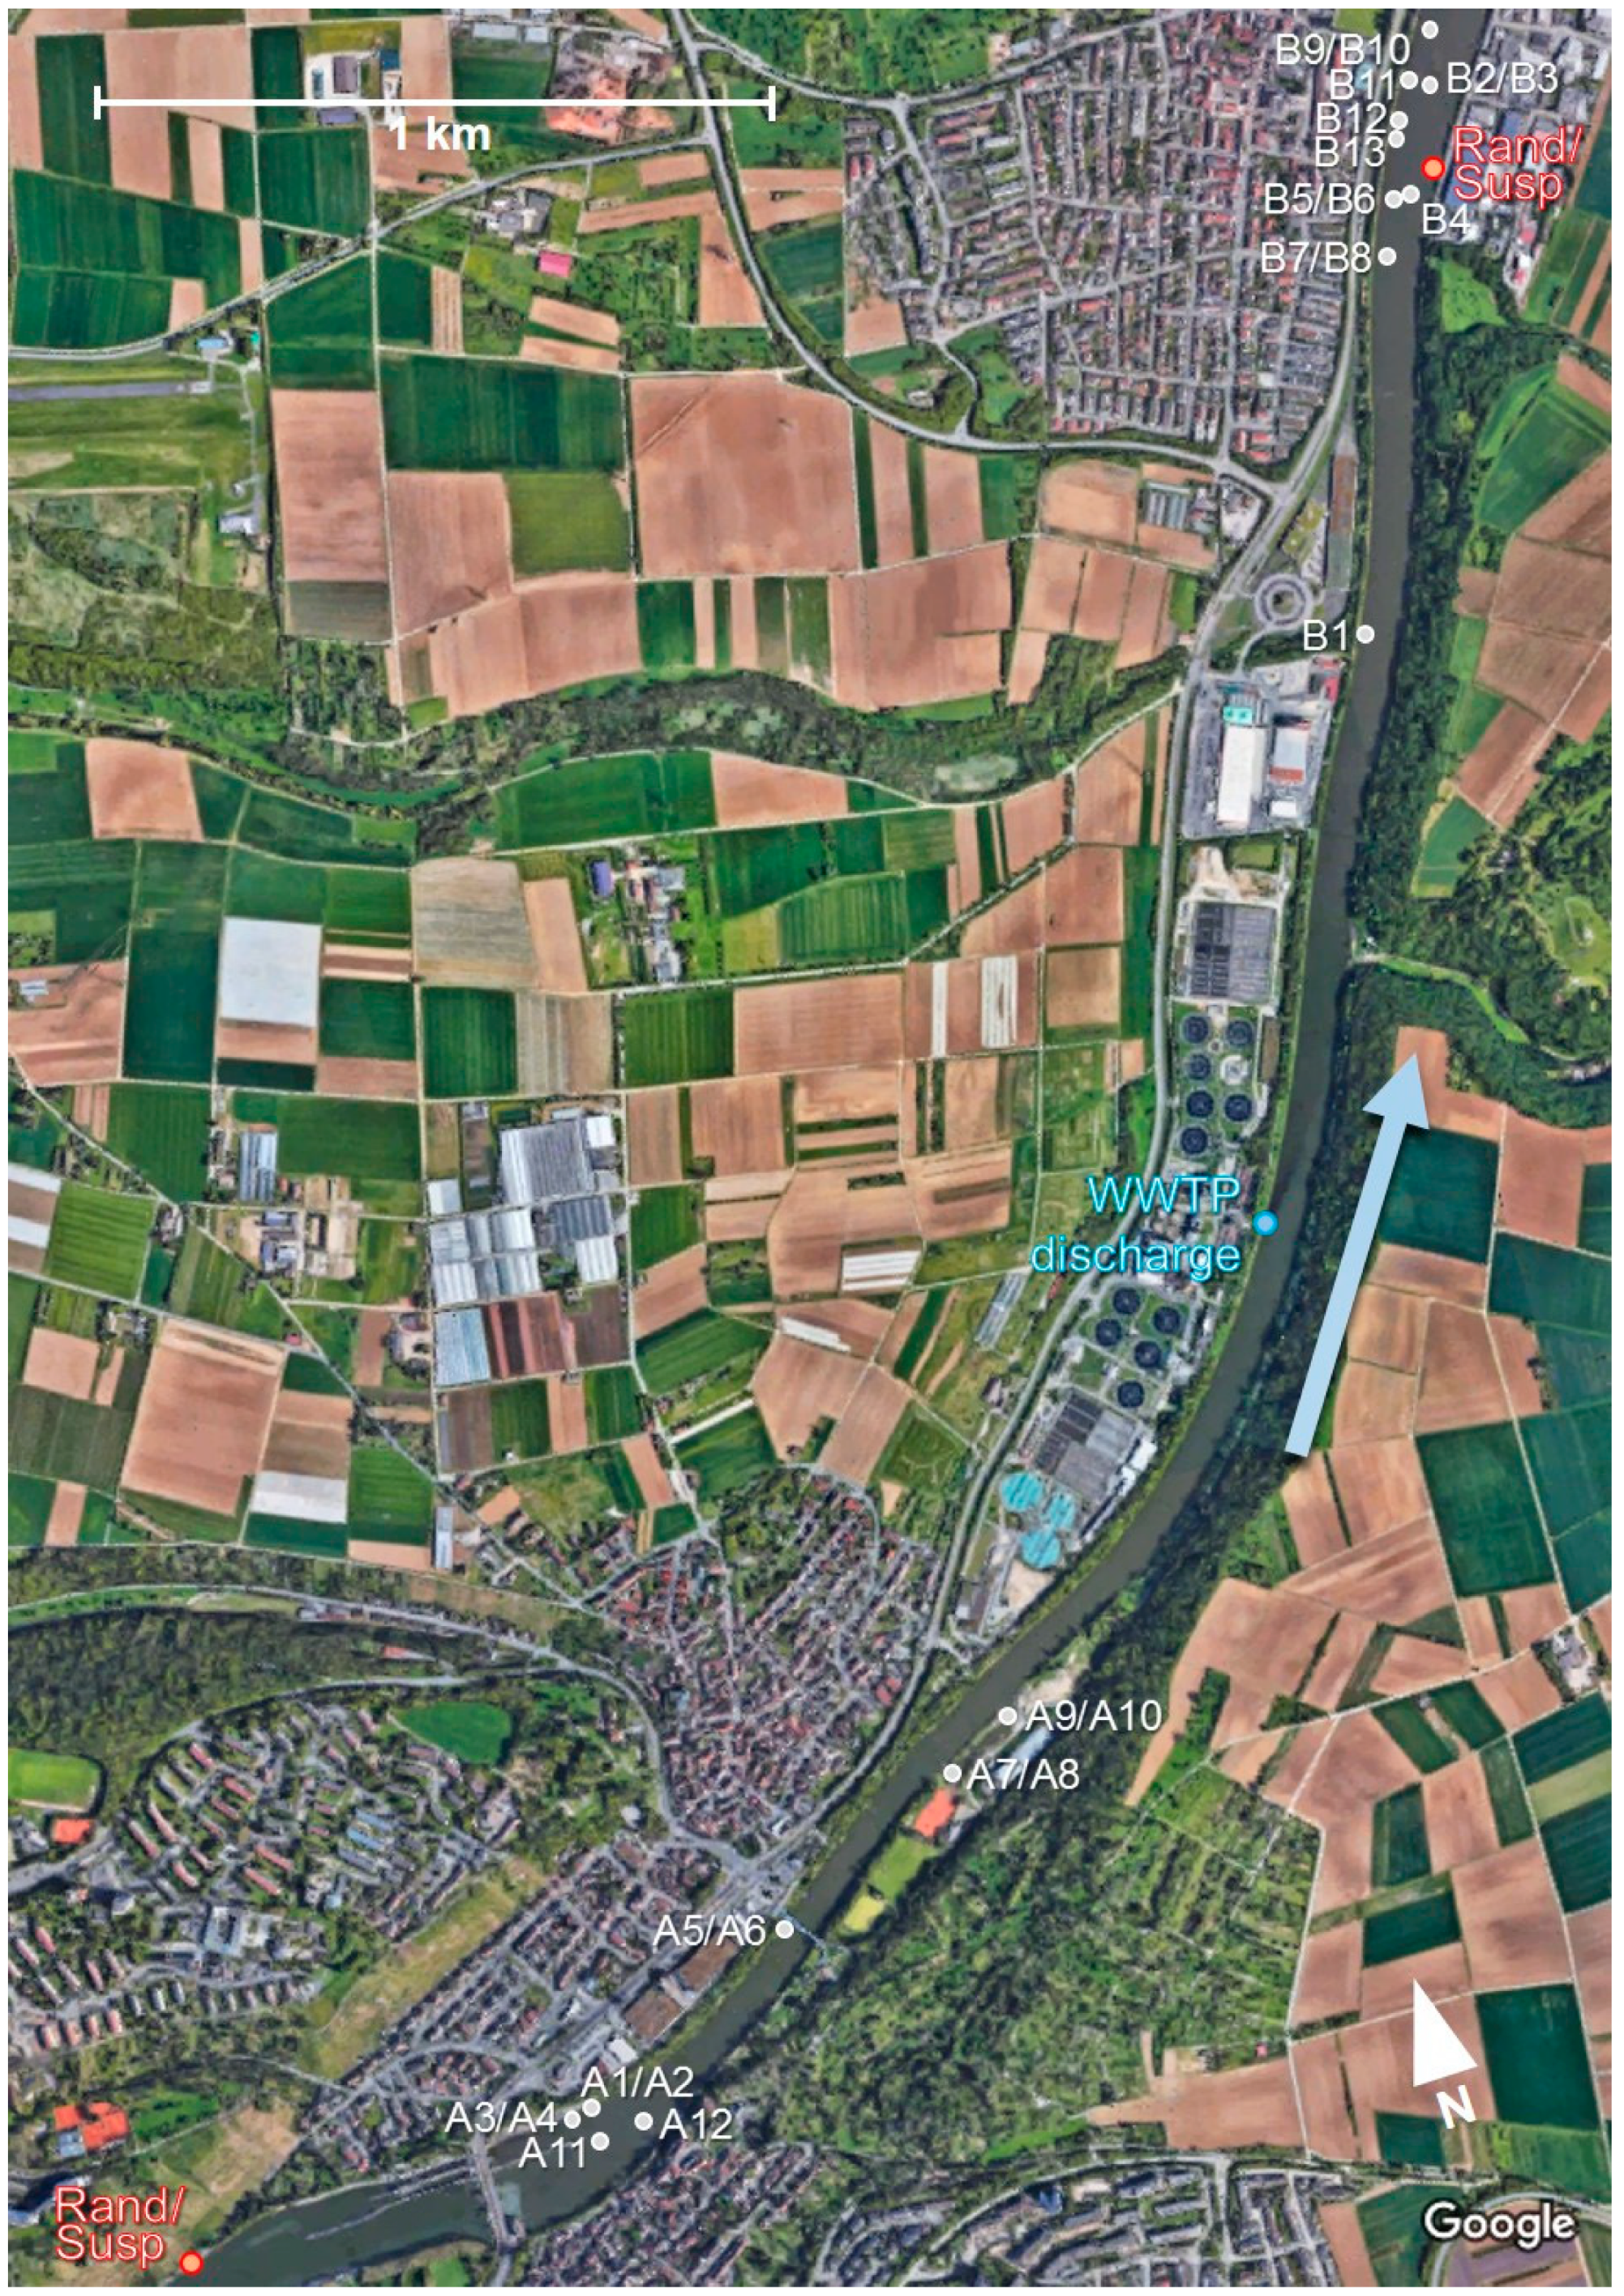
2.1.2. River1 and WWTP1

WWTP1 (1.2 million population equivalents, 60 million m3/a wastewater, one of the ten largest WWTPs in Germany) is constructed in a typical setup (primary sedimentation, anaerobic/anoxic/aerobic tanks, chemical P precipitation, secondary sedimentation). The secondary effluent is directed to a rapid sand filtration stage, the effluent of which is discharged into the Neckar River. The maximum flow rate of WWTP1 (7.5 m3/s) is comparatively low compared to the typical runoff (~290 m3/s) of its receiving water. For more information on WWTP1, see Rott et al. [12].
The positions and GPS coordinates of all sampling points in River1 are depicted in Figure A1 and Table A1. The location of the SM sample and liquid random sample before the WWD was about 300 m upstream of a weir (in Figure A1, bottom-left). This location was chosen because a small jetty with bollard allowed the sampling close to the center of the river. The location for obtaining the liquid random sample and SM sample behind the WWD was 1650 m downstream of the WWTP (total distance (d) between the sampling point before and behind the WWD: ~4 km). A complete mixing of the WWTP effluent in River1 up to this sampling location is to be expected. Assuming a mean flow velocity (v) of 1 m/s, the time (t) between the samplings of both locations should account for ~70 min (Equation (1)). The actual mean time interval of the samplings, usually carried out between 9:00 a.m. and 11:30 a.m., was 90 min (median: 70 min).
t = d v = 4000   m 1 m s = 70   min
River1 has a canal-like structure and, thus, mainly contains coarse sediment. In order to obtain a representative image of the riverbed, multiple different points, each meters apart, were sampled both before and behind the WWD. The sediment samples before the WWTP (A1 to A12) were taken downstream of the above-mentioned weir, as only here was it possible to enter the river with an inflatable dinghy and directly pass on to the sampling points behind the WWTP without a barrier (Figure A1). The distance between the sediment sample points before the WWD and WWTP1 varied from 890 m to 1820 m, and the sediment sampling points behind the WWD were located 950–1890 m from WWTP1 (B1: 950 m and B2–B13: 1520–1890 m). During the first sampling (CW31), 10 different sediment samples (A1–A10 and B1–B10) were taken each before and behind the WWD. Until the fourth sampling, 5–6 points were sampled and individually processed and analyzed for their phosphonate content. From the fifth sampling onwards, 5–6 single samples were taken and, after freeze-drying, mixed in equal proportions and analyzed as a composite sample.

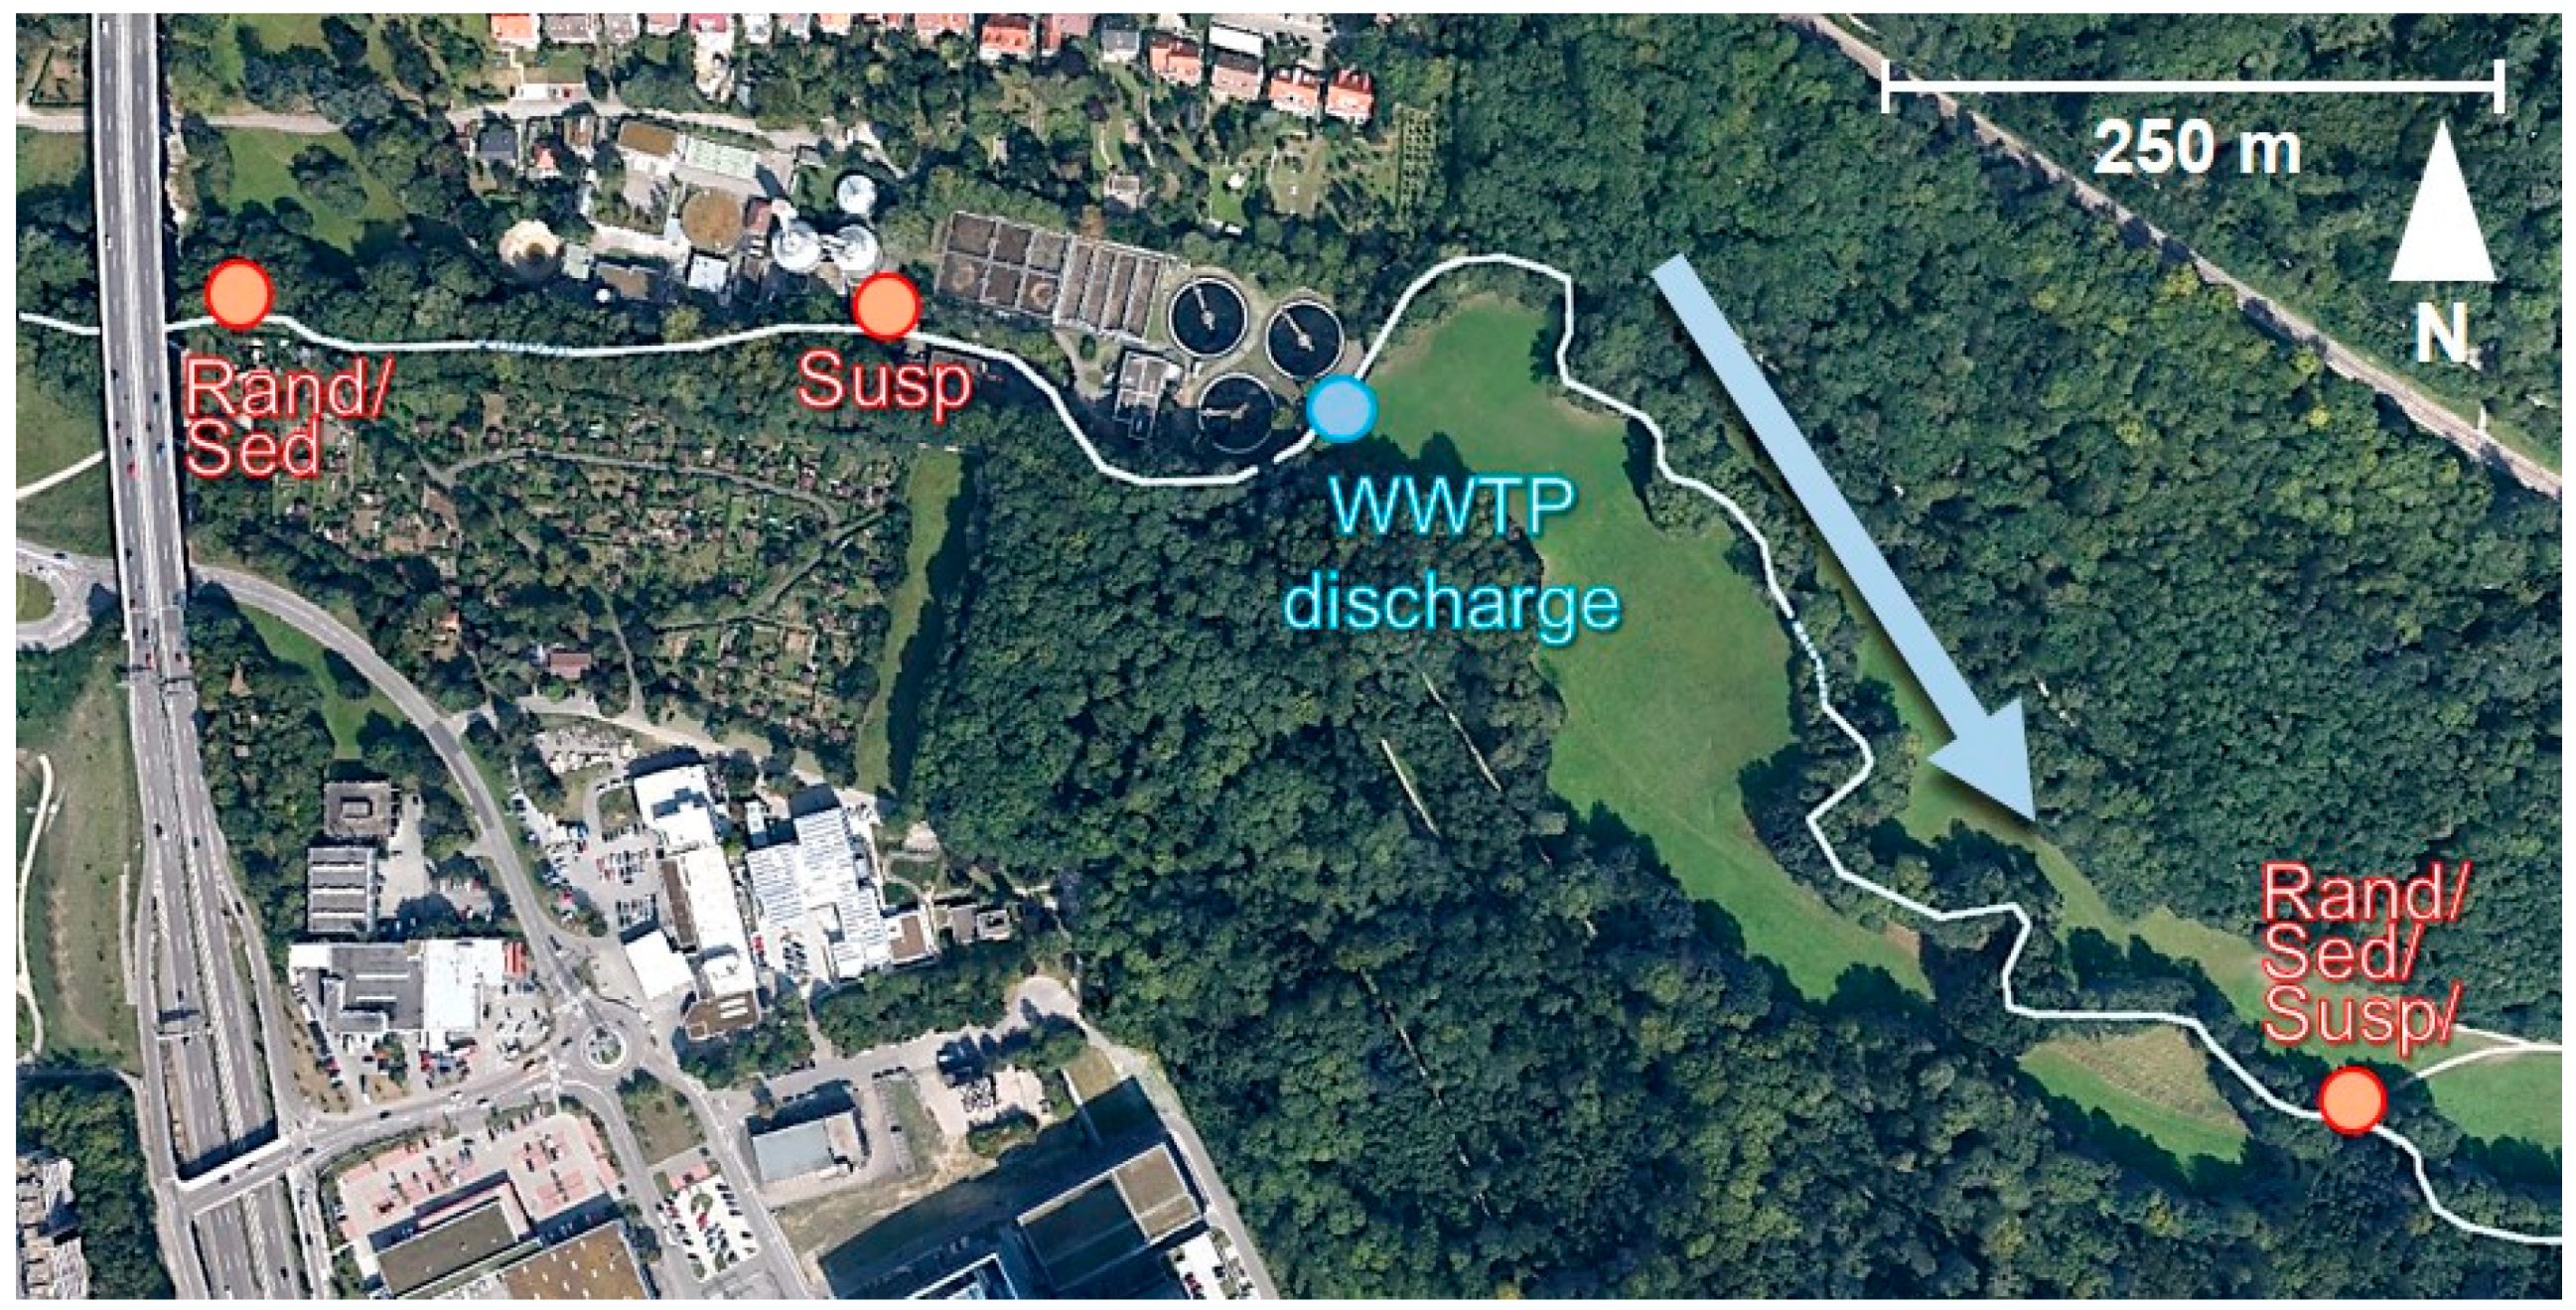
2.1.3. River2 and WWTP2

WWTP2 (160,000 population equivalents, 6–7 million m3/a wastewater, medium-sized WWTP) is constructed in a typical setup (primary sedimentation, anaerobic/anoxic/aerobic tanks, chemical P precipitation, secondary sedimentation). Its dry weather inflow of 100–200 L/s is about ten times the dry weather flow of its receiving water Körsch (10–20 L/s).
The position and GPS coordinates of the sampling points in River2 are shown in Figure A2 and Table A1. Liquid random samples and sediment samples before the WWTP were taken ~470 m (d1) from the WWD in a natural area. Since this site was not accessible with the submersible pump for the sampling of SM, the SM sampling position upstream of the WWD was located on the grounds of the WWTP (220 m from the WWD). At this location, River2, still unpolluted by the WWTP effluent, flows through a sediment-free canal below a bridge, allowing the direct access with the submersible pump. The SM, liquid random sample, and sediment sampling point behind the WWTP was located 700 m (d2) from the WWD. This distance was sufficient for a complete mixing of the WWTP effluent with the river water. At this location, the center of the river could be sampled from a bridge. At a flow rate of approximately 15 L/s (Q1) upstream and approximately 100–200 L/s (Q2) downstream of the WWD and a flow cross-section of ~0.05 m2 (A1) upstream and ~0.25 m2 (A2) downstream of the WWD, the time interval (t) between both sampling locations should have therefore accounted for approximately 40–55 min (Equation (2)). Both the actual mean value (53 min) and the median (48 min) fell within this range. Sampling was usually carried out between 9:30 a.m. and 11:30 a.m.
t = d 1 Q 1 A 1 + d 2 Q 2 A 2 = 40 55   min
Sediment samples were taken both before and behind the WWD at five different points each within a radius of 10 m. After freeze-drying, these five samples were mixed in equal proportions and analyzed for their phosphonate content as a composite sample.

2.1.4. River3 Sediment

Table A1 contains the GPS coordinates of the sampling location in River3. The sediment core was taken in November 2015 at a water depth of 1.80 m.

2.2. Sampling Procedure

2.2.1. Liquid Random Samples

The liquid random sample was taken as distant from the riverbank as possible using a clean sampling cup. For this purpose, the sampler was immersed approximately 1-m-deep below the water surface in order to avoid the collection of floating materials. The samples were stored at 4 °C in the dark before phosphonate analysis. Phosphonates are stable for a prolonged period of time under these conditions [14].

2.2.2. Sediment

Samples of the upper sediment layer (max. 10 cm) were collected in River1 using an Ekman grab sampler mounted on a small crane on an inflatable dinghy. The supernatant water was decanted, and the fine fraction of solids was freeze-dried (Alpha 2–4; Martin Christ Gefriertrocknungsanlagen GmbH, Osterode am Harz, Germany). Due to the shallow water body of River2, a shovel could be used to sample the upper sediment layer. To remove a sediment core from River3, a transparent PVC pipe was rammed from a floating platform into the sediment and subsequently pulled out through vacuum. Lyophilized solids were stored in plastic boxes at room temperature. Before analysis, the samples were freed from coarse material, manually pre-homogenized in a porcelain mortar, sieved through a stainless-steel sieve (1 mm mesh width), and finely ground.

2.2.3. Suspended Matter

River water (500–1000 L) from the interior of the water body was pumped into 1-m3 tanks by use of a submersible pump and a power generator. Within 5 days, the SM was separated by a tubular centrifuge CEPA Z41 (Carl Padberg Zentrifugenbau GmbH, Lahr, Germany) at 100–200 L/h and 20,000 rpm under continuous stirring of the water in the sample tank. On the first sampling of River1, the centrifuge CEPA Z101H was used. The primarily obtained pasty SM fraction was freeze-dried before analysis (Christ Alpha 2–4). The porous and finely dispersed solids were stored in plastic boxes at room temperature and directly extracted.

2.3. Analytical Methods
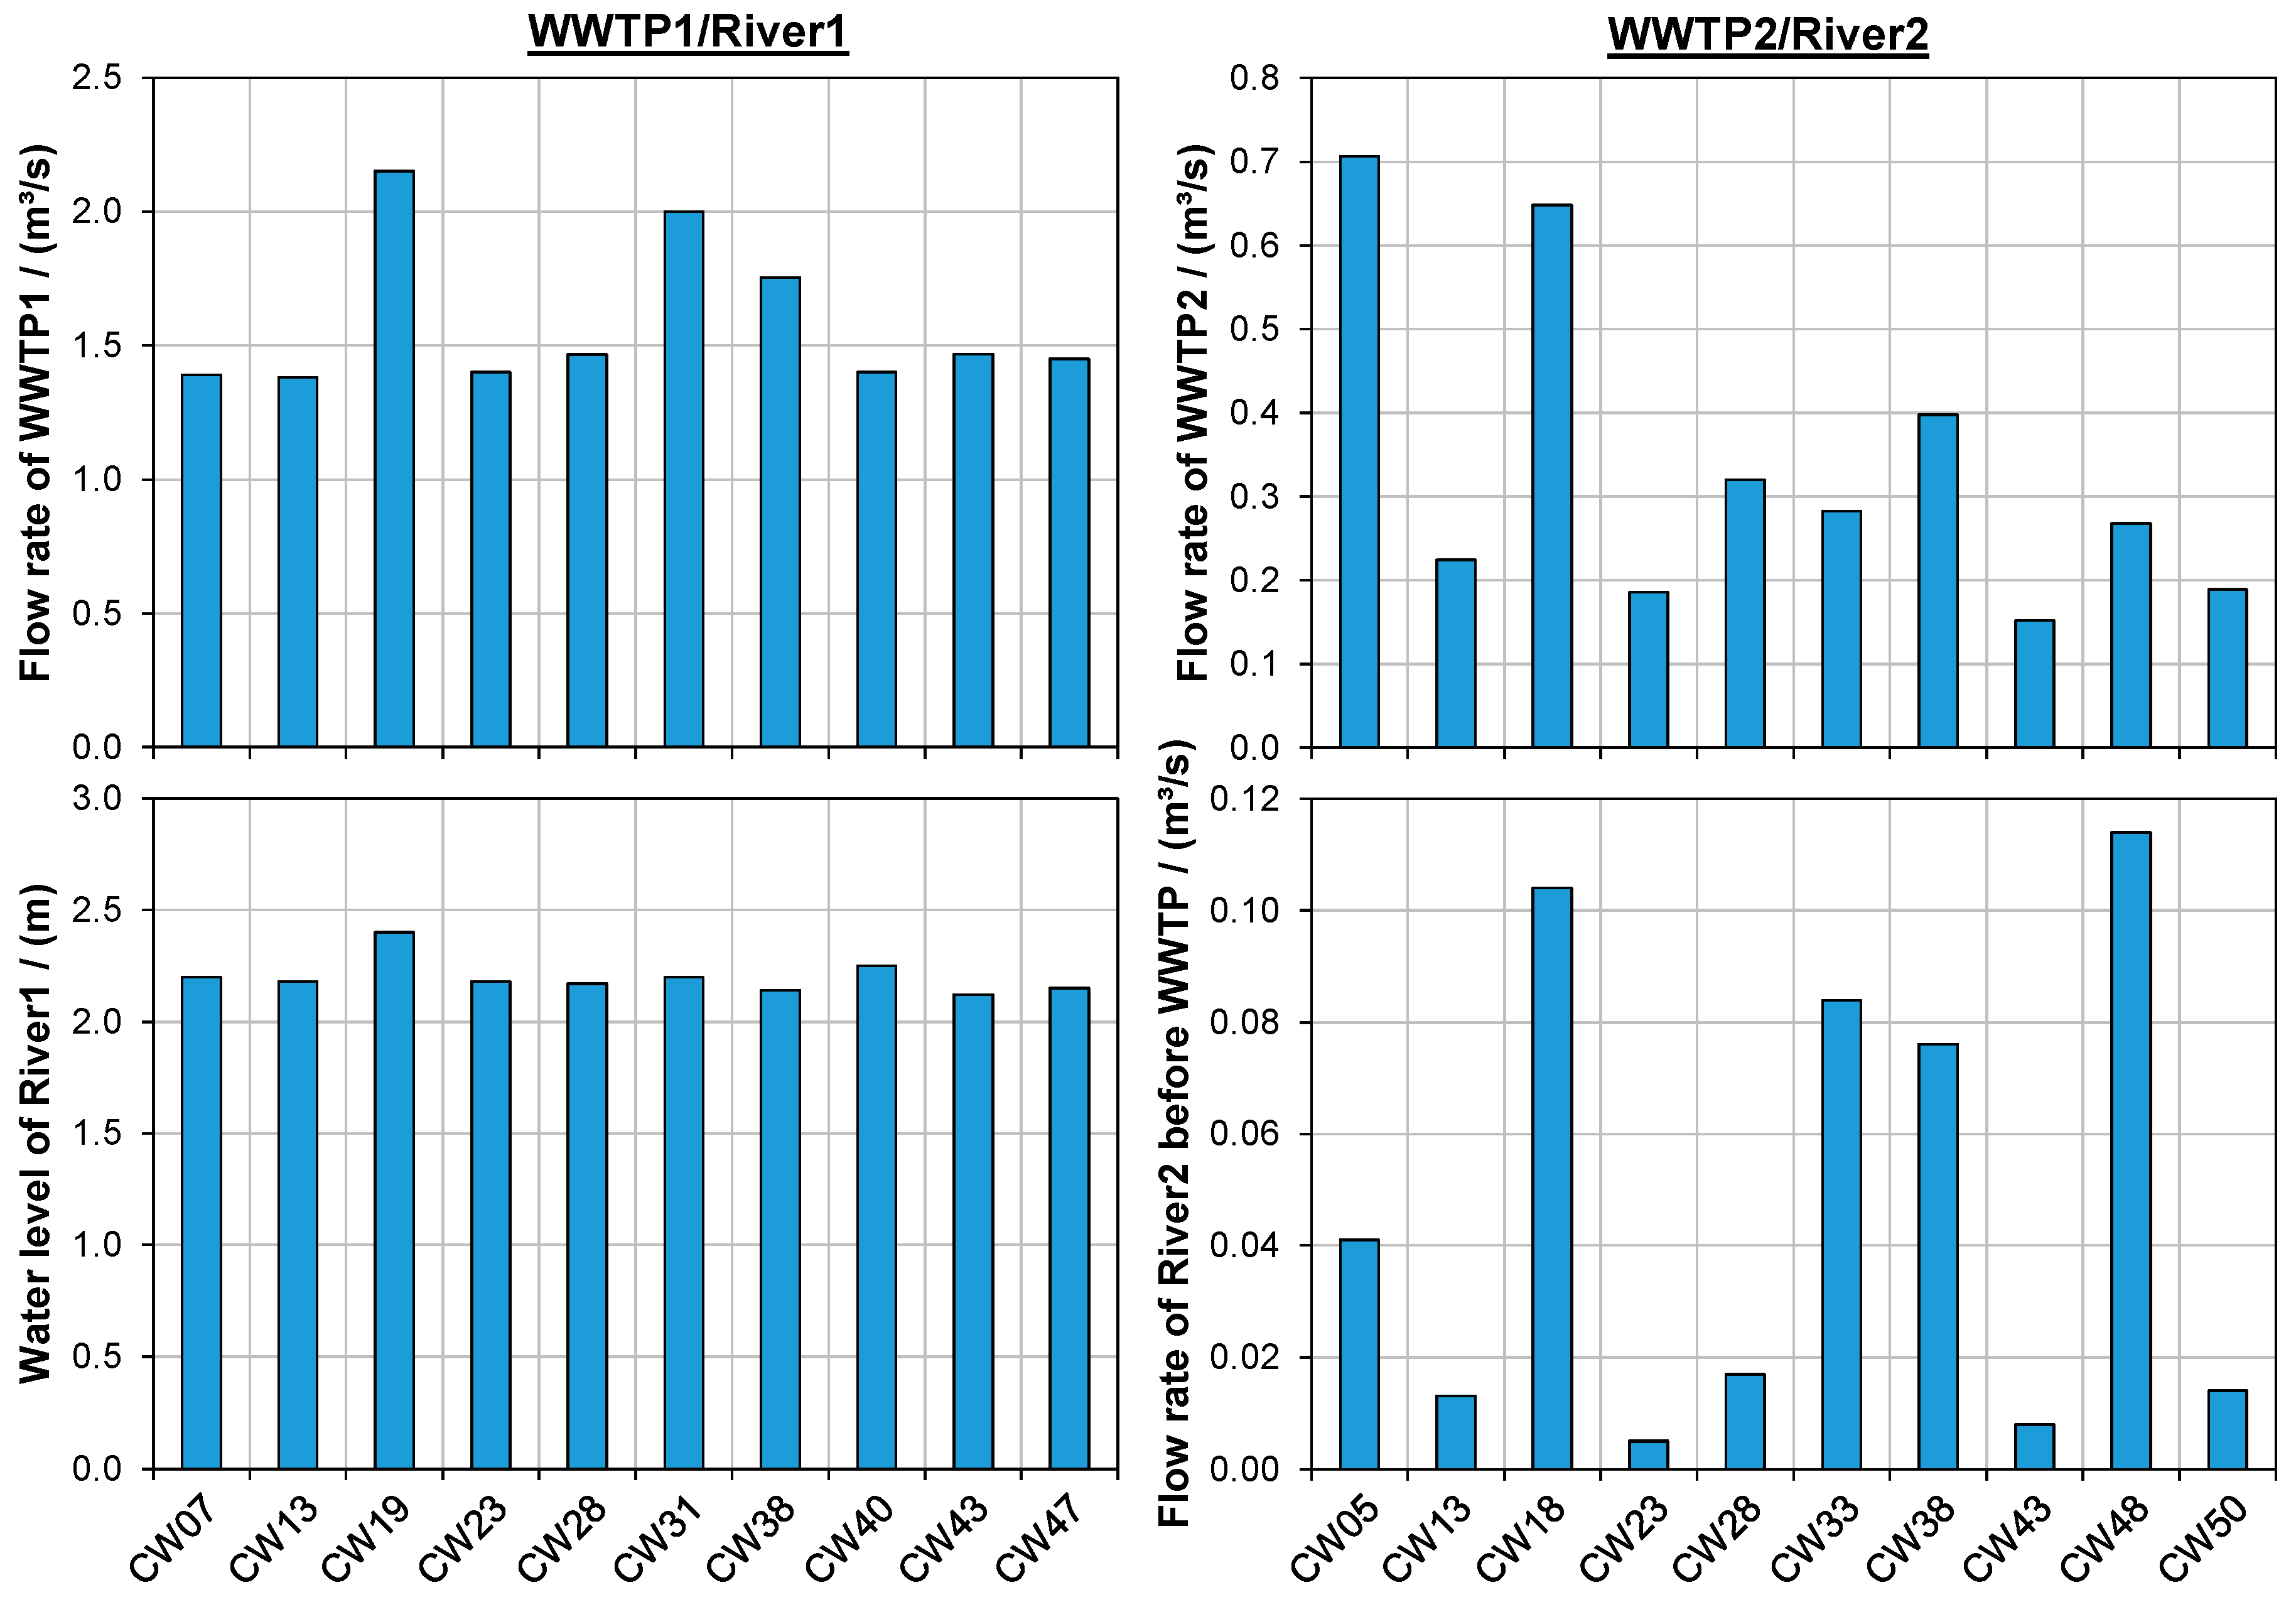
2.3.1. Flow Rates

The flow rates of the WWTPs at the time of sampling were obtained from the corresponding operators. At each sampling, the water level of River1 was recorded using a staff gauge upstream of the WWD (Table A1). At this point, River1 has a width (b) of 130 m. Assuming that the water level (h) is linearly proportional to the flow rate (Q), the flow rate of the weir-regulated river can be approximated by Equation (3) (v = 1 m/s).
Q = v   ×   b   ×   h = 130 m 2 s   ×   h
In order to determine the flow rate of River2, a sample of the WWTP effluent was always taken simultaneously with the river water samples before (“R, A”) and behind (“R, B”) the WWD. As the WWTP flow rate at the time of sampling was known, the flow rate of River2 could be calculated, for example, according to the UV-absorbance at 254 nm (c) using a mass and flow balance in accordance with Equations (4)–(6) [15]. Possible adsorption processes between the WWD and the river sampling point behind the WWD were neglected.
c R , A   ×   Q R , A + c WWTP   ×   Q WWTP = c R , B   ×   Q R , B
Q R , A + Q WWTP = Q R , B
Q R , A = Q WWTP c R , B     c WWTP c R , A     c R , B

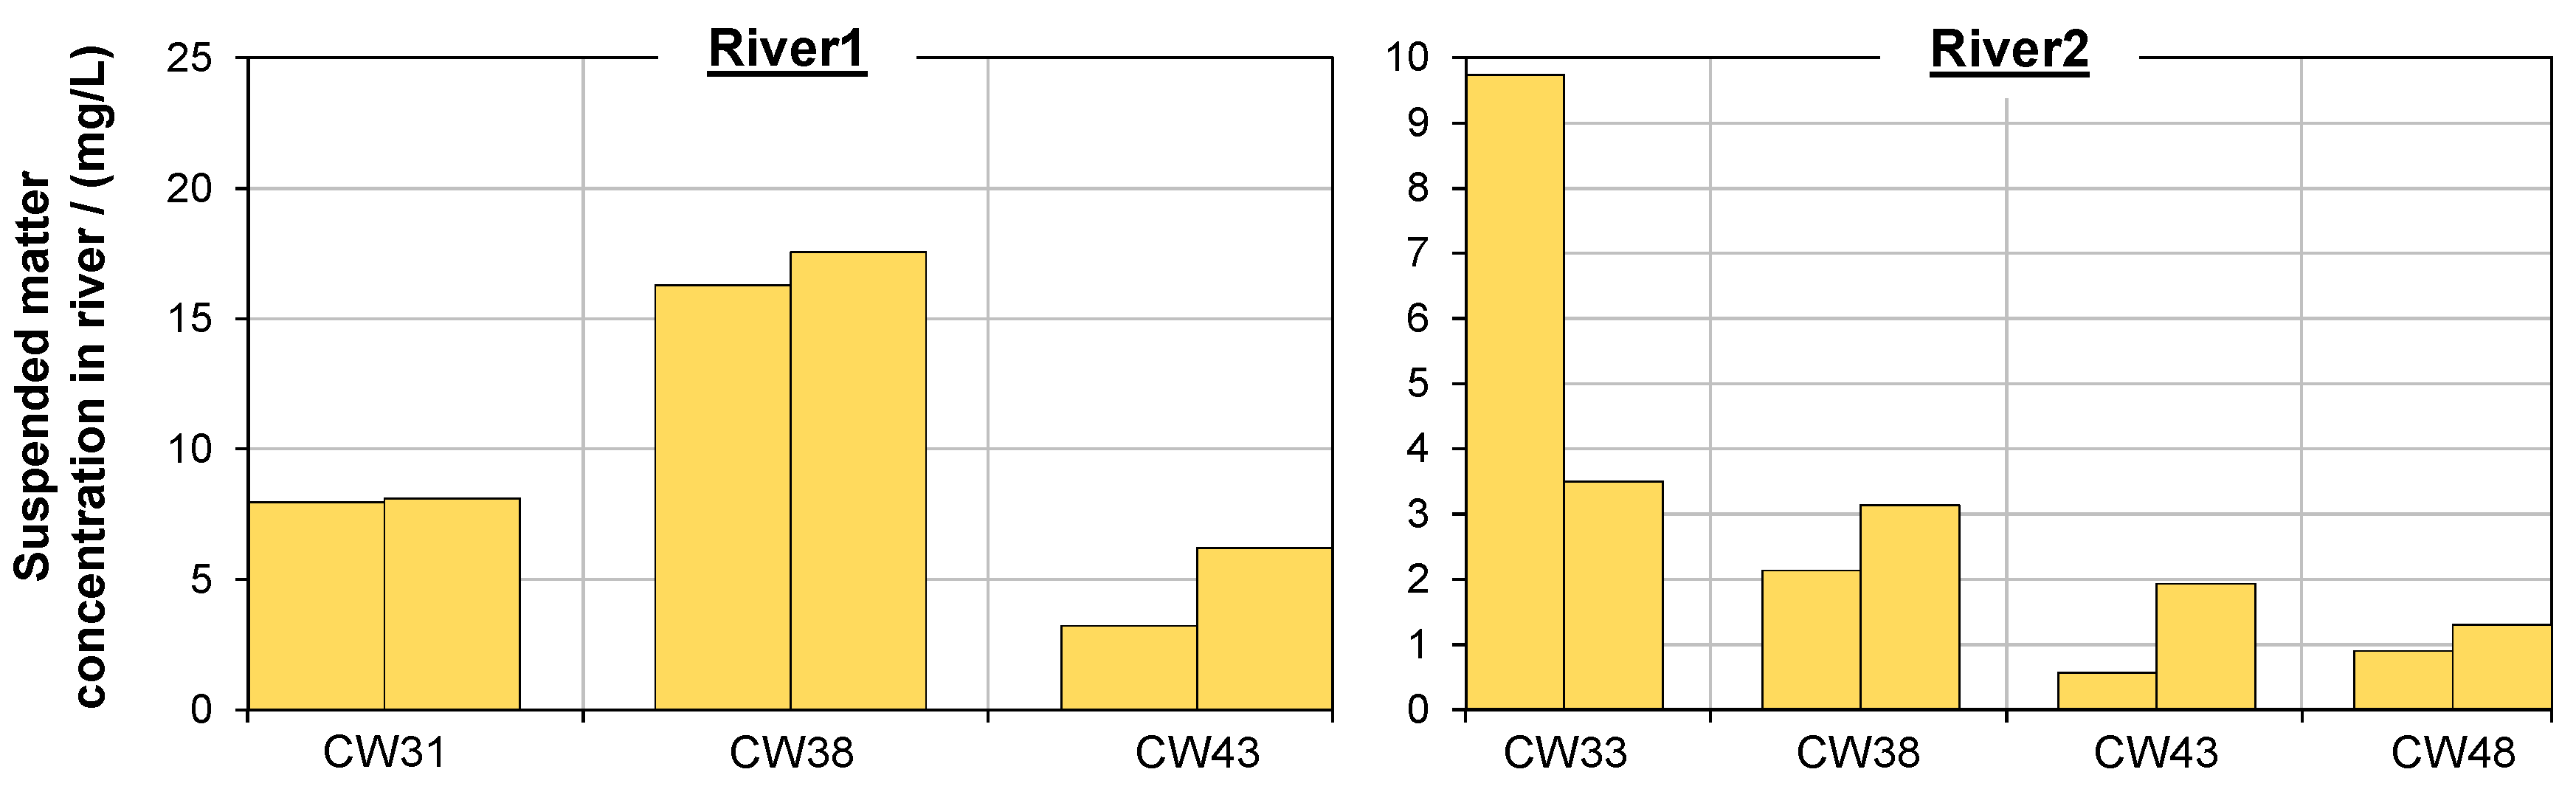
2.3.2. Suspended Matter Concentration

The water volume centrifuged for the extraction of SM was recorded. The quotient of the dry mass of the SM after lyophilization and the initial sample volume resulted in the SM concentration of the sample.

2.3.3. Sample Preparation for Phosphonate Analysis

The background and validation of the sample preparation techniques used for this study have already been presented in detail by Armbruster et al. [13] in another publication. In this paragraph, this preparation technique is described briefly. Lyophilized solid samples (0.5 g of sediment or SM) were first homogenized, mixed with isotope-labeled internal standards, and then digested using an extraction medium (15 mL) of sodium hydroxide (0.5 mol/L) and nitrilotriacetic acid trisodium salt (NTA; 0.1 mol/L) in an ultrasonic bath for 1 h at 50 °C. After centrifugation and separation of the supernatant, this extraction step was repeated (exception: no repetition was performed during the extraction of the first three sediment samples of River1 and the first sediment sample of River2; here, the determined loads may be slightly lower than usual due to incomplete extraction). An extraction efficiency of >95% was reported for the procedure with repeated extraction. The supernatants were combined in equal proportions and quantified by direct determination via IC-ESI-MS/MS after cation exchange (AG MP-50; Bio-Rad Laboratories GmbH, Munich, Germany). Liquid river samples were processed by filtration (syringe filter, 0.45 µm), subsequent doping with diluted internal phosphonate standard, and cation exchange.

2.3.4. Phosphonate Analysis per IC-ESI-MS/MS

Phosphonates were quantified via anion exchange chromatography in accordance with Armbruster et al. [13]. Chromatographic separation was performed on an ion chromatograph (ICS 5000; Dionex, Sunnyvale, California, United States) using an anion exchange column (AS16 ionPac; Thermo, Dreieich, Germany) and a sodium hydroxide gradient (18 mmol/L to 120 mmol/L) with a constant proportion of 20% methanol. The method involves a ten-minute washing step with dilute eluent (18 mmol/L sodium hydroxide) immediately after injection, facilitating the chromatographic separation of interfering anions with low charge (e.g., chloride, sulfate, and phosphate, deriving from the sample) and NTA (from the extraction medium for solid samples). Detection was carried out by electrospray ionization coupled to tandem mass spectrometry (ESI-MS/MS). This chromatography was applied uniformly to all samples. Whereas the solid extracts allowed the determination of the analytes by direct measurement at an injection volume of 25 µL, the aqueous river samples were concentrated on the chromatography column using an automated concentration procedure with multiple injections (5 × 100 µL) at diluted eluent flow. The LOQs for dissolved phosphonates in aqueous river samples were 0.04–0.16 µg/L, depending on the phosphonate (0.05 µg/L PBTC, 0.13 µg/L HEDP, 0.04 µg/L ATMP, 0.07 µg/L EDTMP, and 0.16 µg/L DTPMP). The LOQ for solid samples was 0.1 mg/kg phosphonate. Reliability and robustness of the method are significantly enhanced by the use of isotope-labeled internal standards and were described in detail in the respective publication.

2.4. Statistical Evaluation

Boxplot diagrams show the minimum value, the first quartile, the median, the third quartile, and the maximum value (from bottom to top). Linear regression was used to estimate the correlation between two datasets. Student’s t-test was used to determine the significance of change in total phosphonate concentration/load in River1/River2 due to WWTP discharge (Table A2 and Table A4) and to test the significance of correlation (Table A3). Coefficients of determination (R2), correlation coefficients (R), t-statistics values (t), and probability values (p) were determined using the Analysis ToolPak of MS Excel (two-tailed t-test with significance level α = 0.05).

3. Results and Discussion

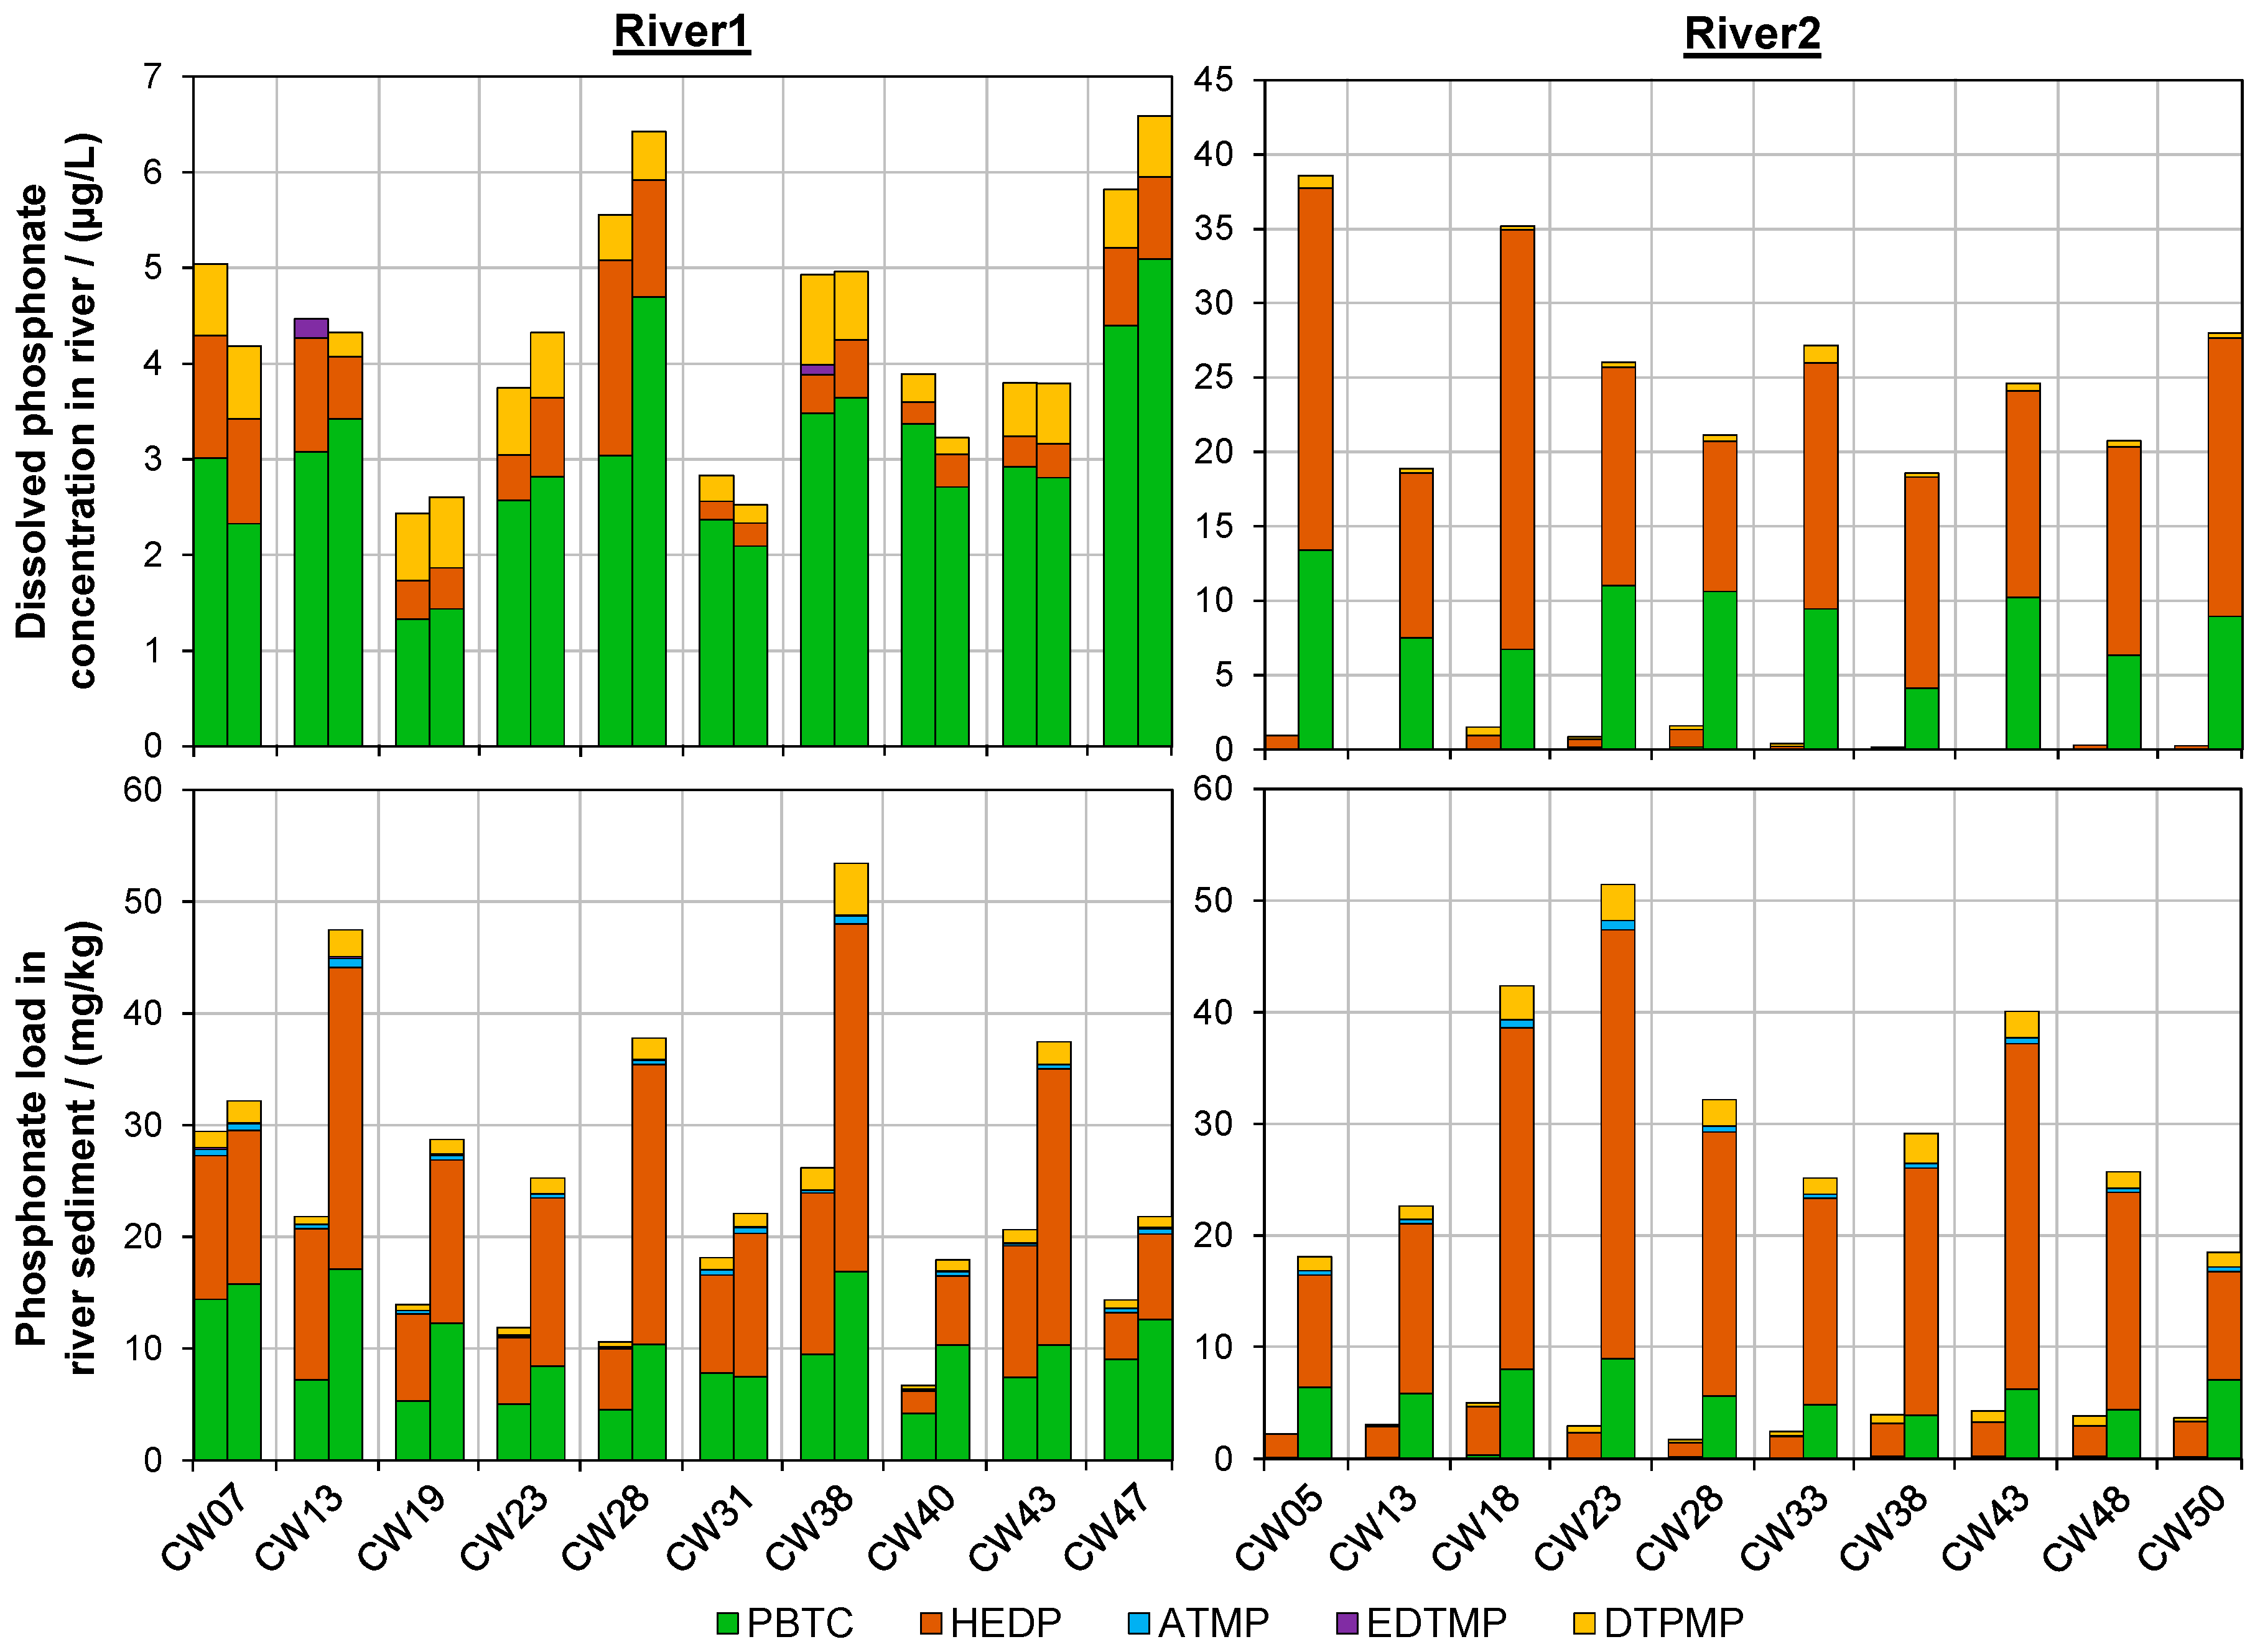
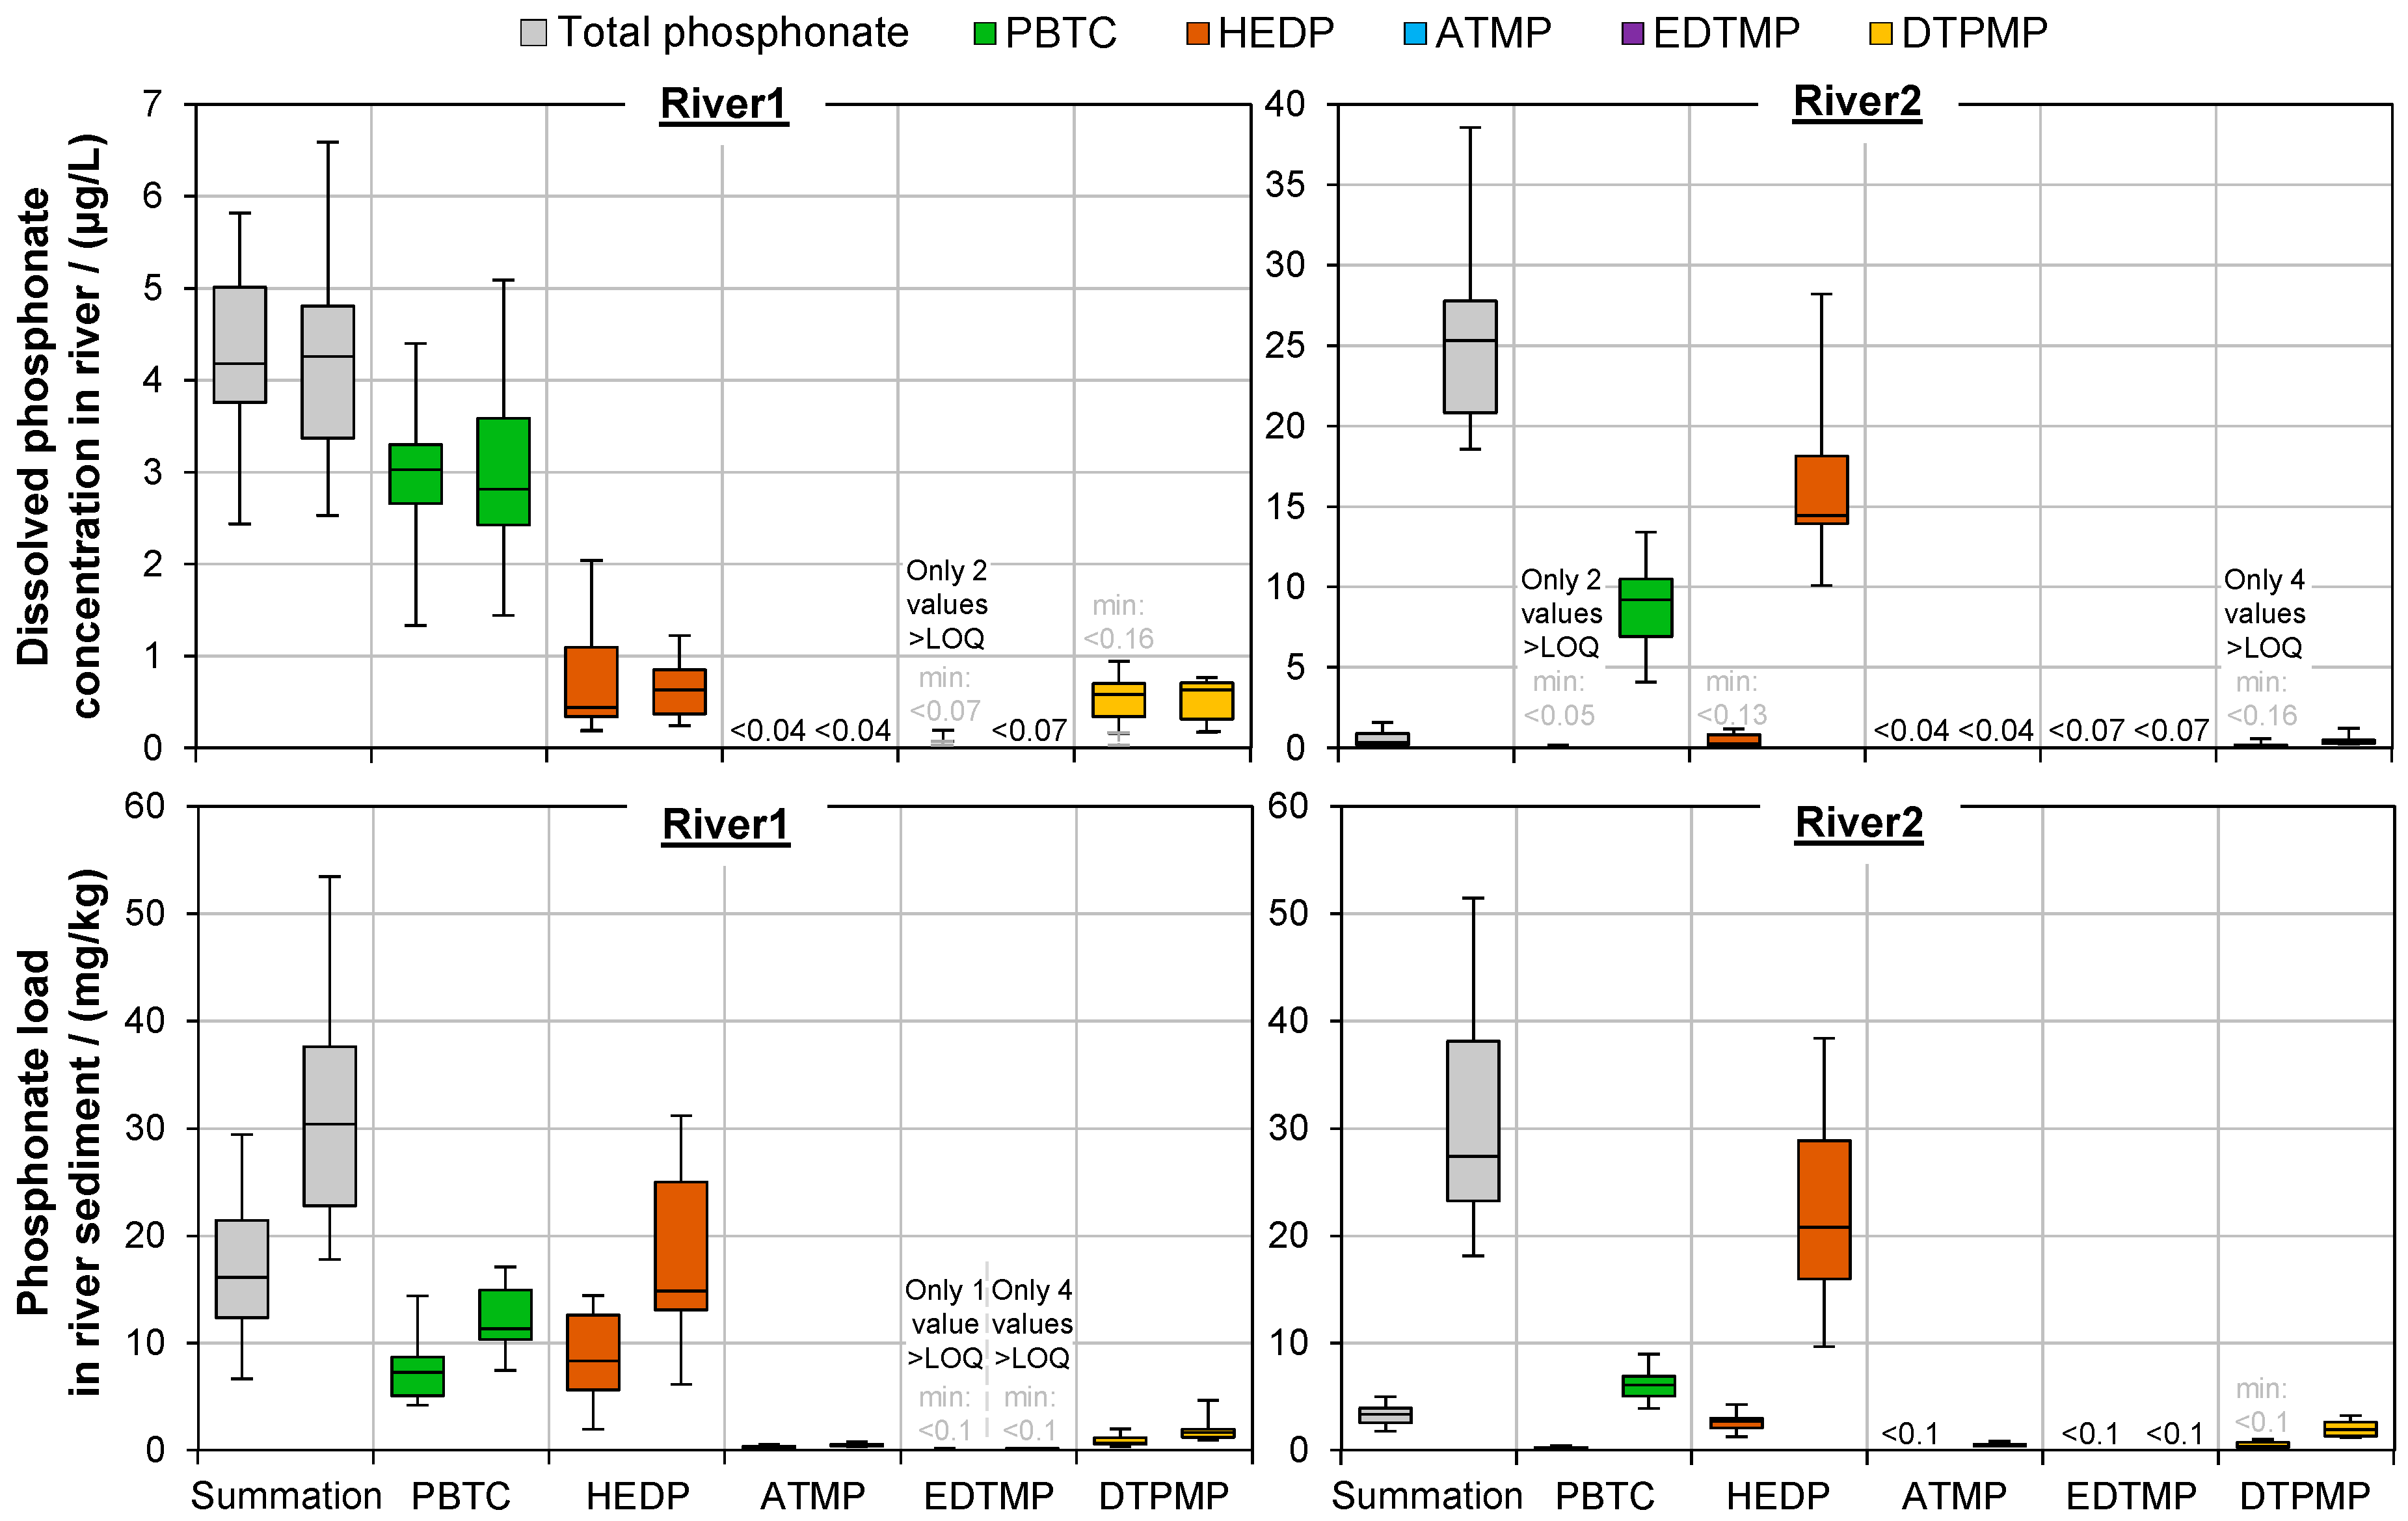
3.1. Dissolved Phosphonates (Liquid Random Samples)

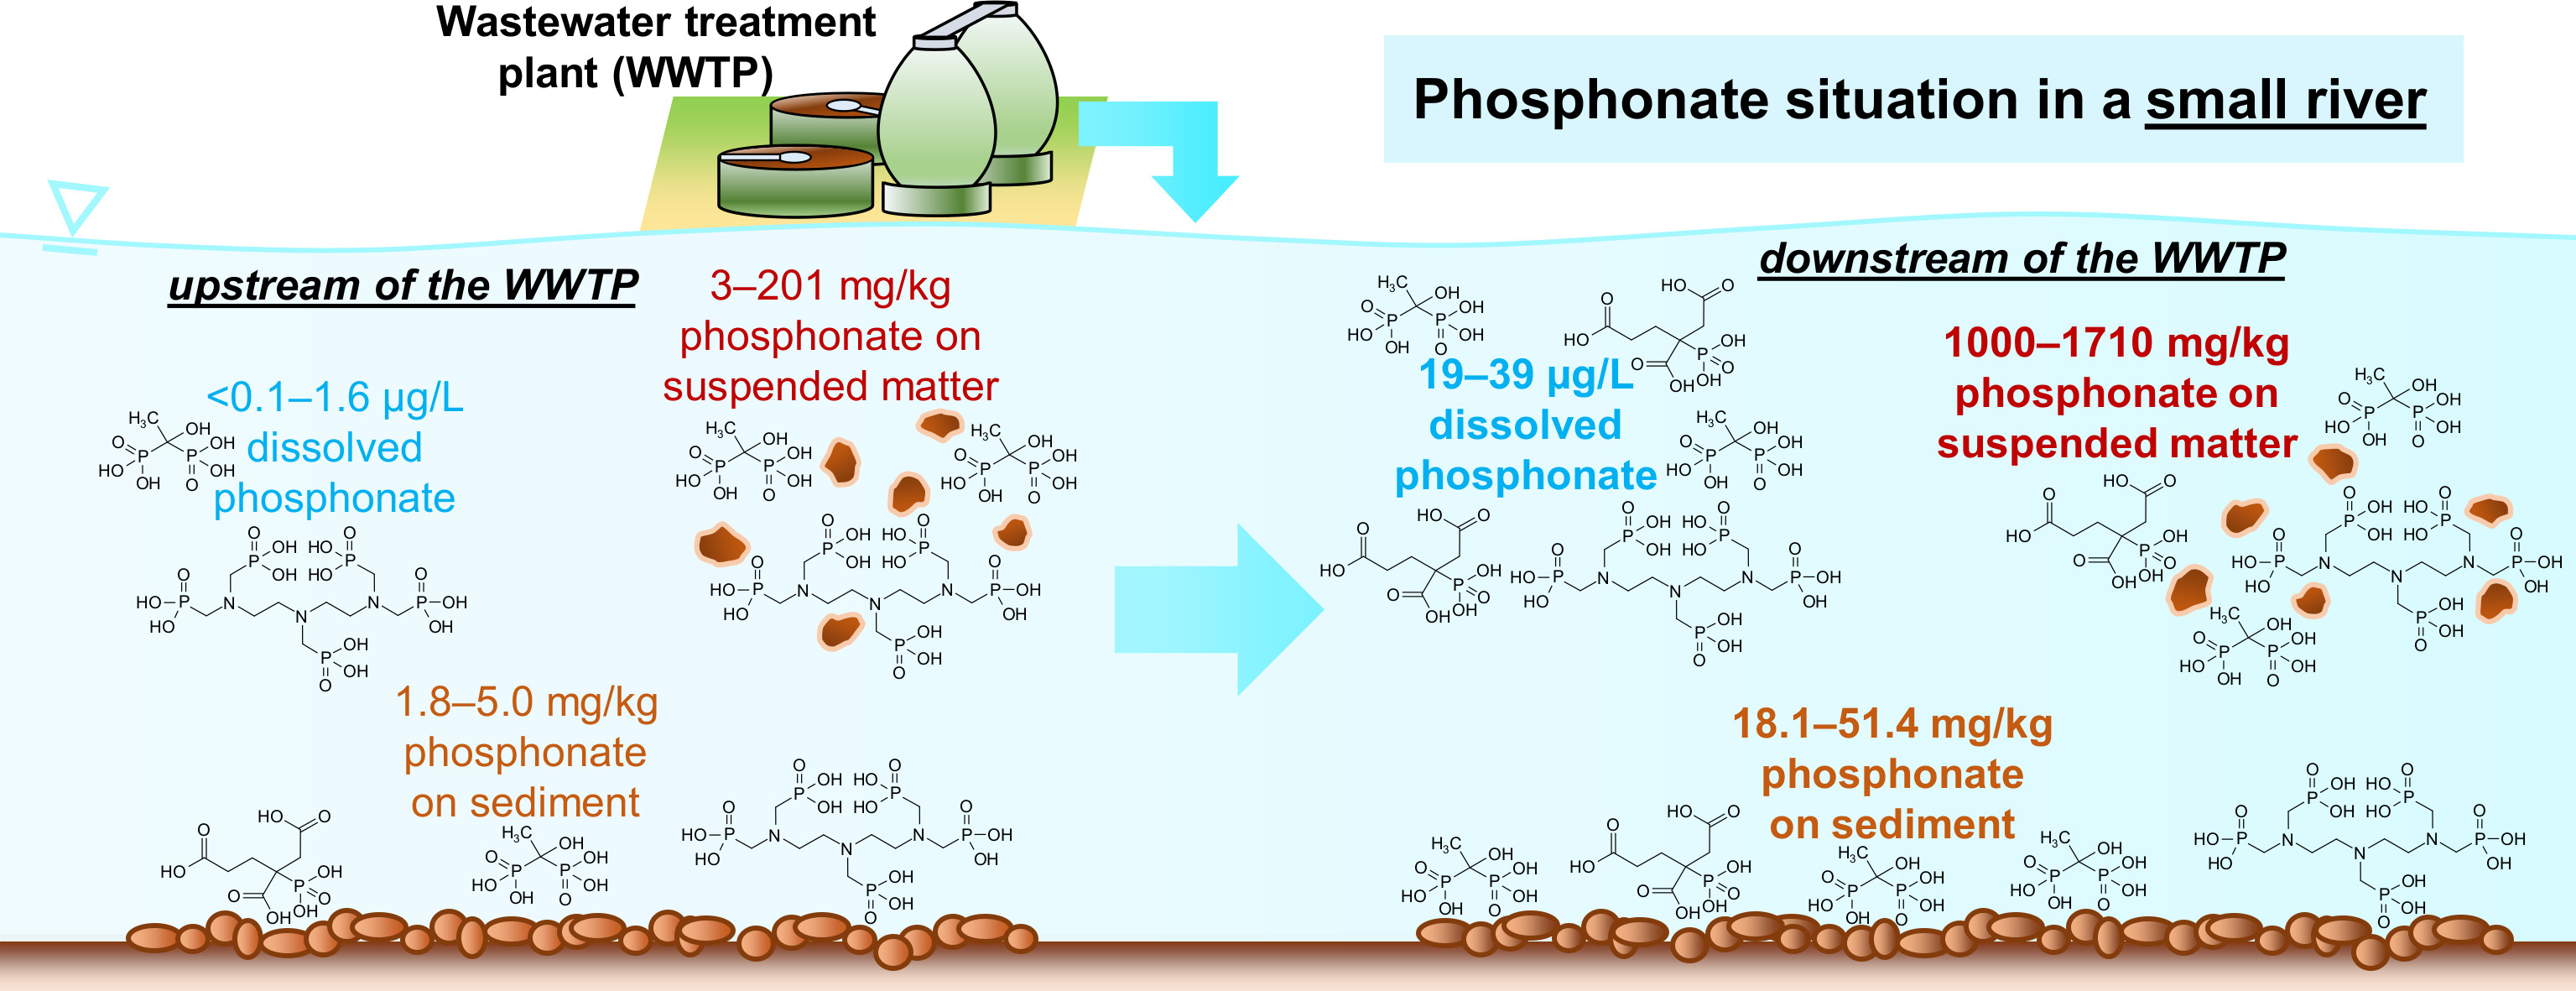
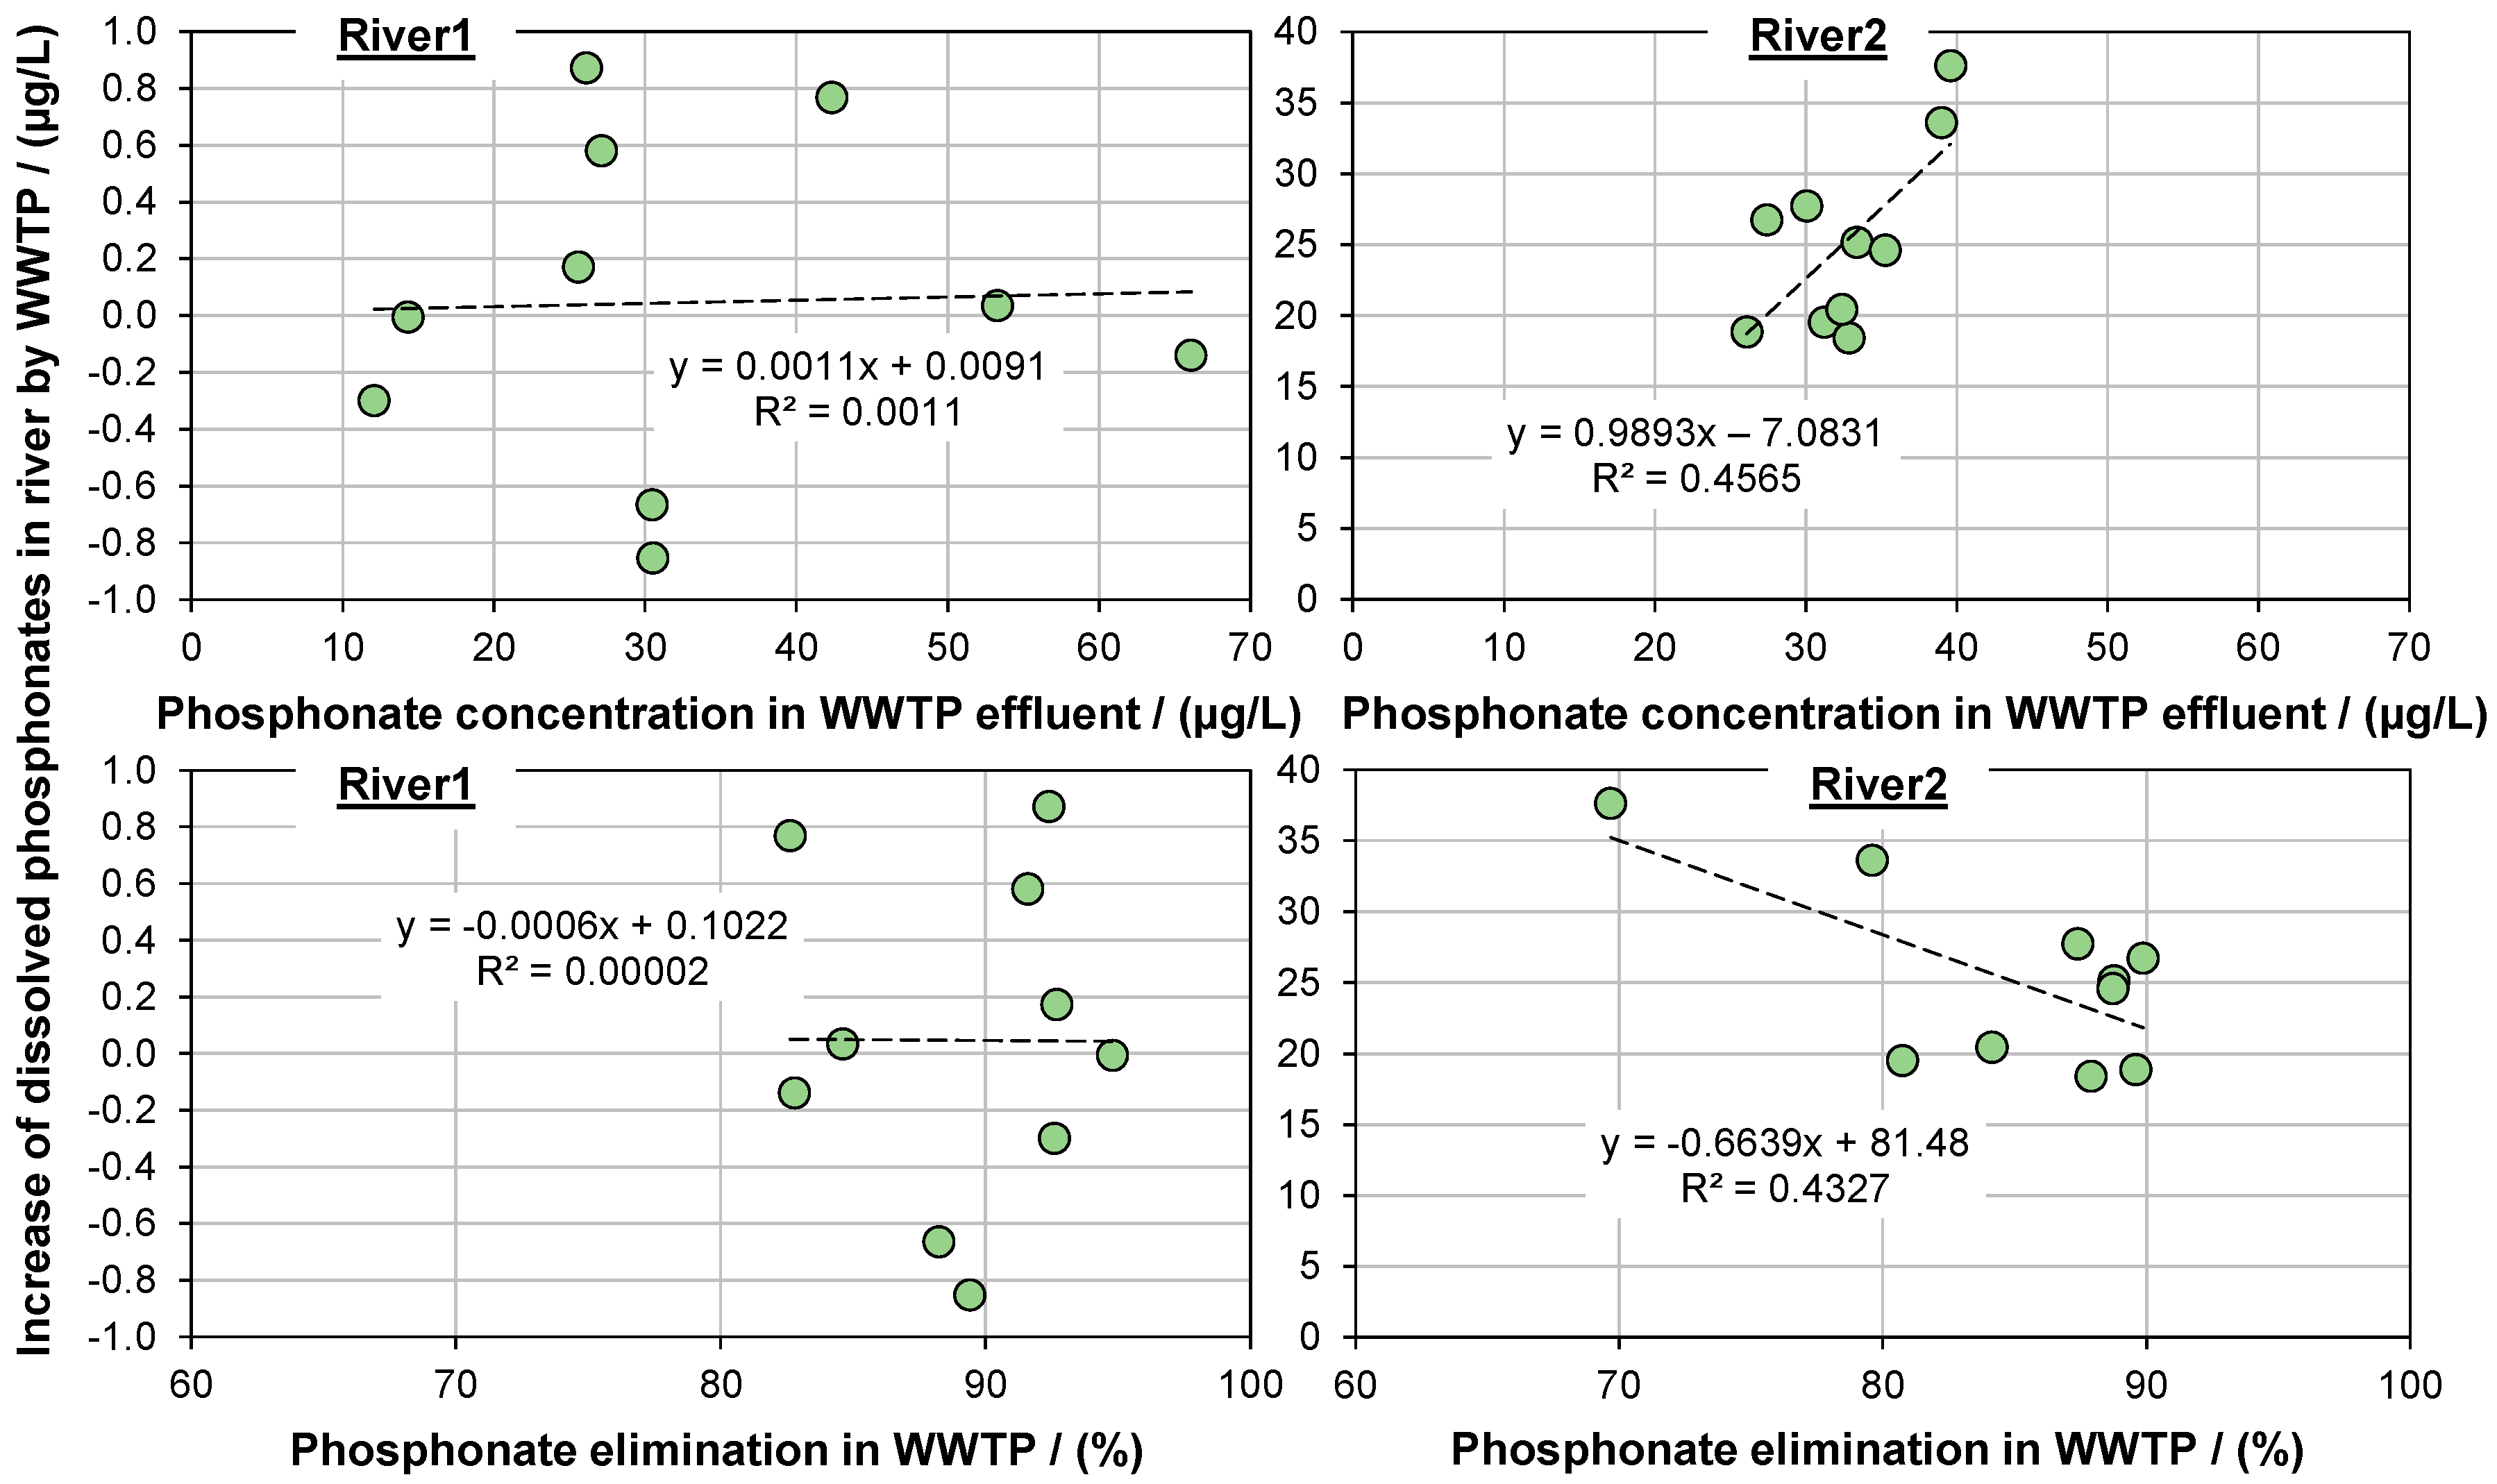
3.1.1. Impact of WWTP

In Figure 2 (top), the concentrations of dissolved phosphonates in both rivers before and behind the WWD are plotted according to the sample date. Figure 3 (top) provides an overview of the typical distribution of all phosphonates before and behind the WWD using boxplots. In River1, the total dissolved phosphonate concentration before the WWD ranged from 2.4 µg/L to 5.8 µg/L. Behind the WWD, it was insignificantly different (2.5–6.6 µg/L) (p = 0.9360; Table A2). With a contribution of 70%–72% (Table 1), PBTC was the phosphonate with the highest concentration both before and behind the WWD, followed by HEDP. In River2, the total dissolved phosphonate concentration increased significantly due to the WWD (from <0.1–1.6 µg/L to 19–39 µg/L; with <0.0001, the p-value was considerably below the significance level of 0.05; Table A2), adding up to a factor of 75 (based on the medians). In contrast to River1, HEDP was the phosphonate with the highest abundance in River2 with a contribution of 64%–74%. In both rivers, ATMP and EDTMP were below their LOQs in most samples. Except for the samples of River2 before the WWD, DTPMP was generally the phosphonate with the third-highest abundance.
The strong impact of WWTP2 on River2 is illustrated in Figure 4, comparing the increase of dissolved phosphonate concentrations in the rivers with the effluent concentrations and elimination of phosphonates in the WWTPs [12]. Whereas no correlation could be observed for River1/WWTP1, a significant increase in phosphonate concentration of River2 was observed when the effluent of WWTP2 had elevated phosphonate concentrations (despite relatively low coefficients of determination of <0.46, the significance of correlation was high with p < 0.039; Table A3). This observation can be explained by the flow rate of WWTP2 (0.15–0.71 m3/s) exceeding the runoff of its receiving water (0.01–0.11 m3/s) by factors of 2–37 and the phosphonate concentration of the effluent (26–40 µg/L, median: 33 µg/L) exceeding the phosphonate concentration of River2 before the WWD (<LOQ–1.60 µg/L) by a factor of 97 (based on the medians). The phosphonate composition of the river water behind the WWD was comparable to the WWTP effluent (PBTC: 6–14 µg/L, median: 10 µg/L; HEDP: 16–31 µg/L, median: 20 µg/L). DTPMP was the third-most prevalent phosphonate in the effluent (<2.3–5.4 µg/L, median: <2.3 µg/L), whereas ATMP and EDTMP were below their LOQs.
The flow rate of WWTP1 (1.38–2.15 m3/s), in contrast, accounted for only 0.5%–0.7% of the flow rate of River1 (276–312 m3/s). Due to the strong dilution, no considerable increase in the dissolved phosphonate concentration of River1 due to the WWD of WWTP1 was noted despite the dissolved phosphonate concentration in the effluent of WWTP1 (12–66 µg/L, median: 29 µg/L) exceeding the phosphonate content of River1 before the WWD by a factor of seven (based on the medians).

3.1.2. Possible Environmental Impacts

Complexing agents have the potential to remobilize heavy metals from sediment and, thus, endanger aquatic organisms and contaminate bank filtrate [16]. Consequently, the remobilization potential of phosphonates has been investigated in several batch extraction tests on a laboratory scale [17,18,19,20,21]. It was found that, in particular, iron, chromium, and zinc were primarily remobilized at a polyphosphonate concentration of ≥50 µg/L. The remobilization of heavy metals of high toxicity, such as cadmium, lead, and mercury, was observed at phosphonate concentrations of >0.3–1.0 mg/L [2].
Since phosphonates are demanding analytes, little is known about their presence in the environment. As a result, only model calculations had been performed until the 2010s, aiming at the estimation of their river water concentrations. Gledhill and Feijtel [18], for example, calculated an average concentration of dissolved polyphosphonates of 0.25 µg/L for Western European countries in the early 1990s. However, this value is no longer applicable, as phosphonate consumption has increased considerably [2]. Jaworska et al. [22] reported model concentrations of 0.32–4.90 μg/L HEDP, 0.07–1.15 μg/L ATMP, 0.09–1.38 µg/L EDTMP, and 0.04–0.64 μg/L DTPMP for the Netherlands in the early 2000s. Only recently, further developments in analytics allowed the determination of dissolved concentrations of phosphonates in some rivers with sufficiently low LOQs (Schmidt et al. [6]: IC-ICP-MS; Wang et al. [8]: LC-MS/MS after derivatization). In six German rivers, Schmidt et al. [6] detected HEDP with 0.3–1.6 µg/L and DTPMP with 0.1–1.3 µg/L. ATMP and EDTMP were below their LOQs of 0.095 µg/L and 0.117 μg/L (no data on PBTC). In a Chinese river, PBTC and HEDP were detected at 0.094 µg/L and 0.088 µg/L, respectively (aminophosphonates were below their LOQs of 0.008–0.200 µg/L, also showing a predominance of nitrogen-free phosphonates) [8]. In contrast to these relatively low phosphonate concentrations, Müller and Sacher [7] were able to detect DTPMP concentrations of 8–70 µg/L in a small stream serving as a receiving water for the concentrate of a reverse osmosis plant. It must be considered that in some antiscalant products, the contribution of the nominal compound DTPMP to the total pool of DTPMP and DTPMP-related aminomethylenephosphonic acid derivatives may only range from 40% to 70% [23]. Consequently, further undeclared synthesis by-products and degradation products, belonging to the extended chemical group of phosphonates, may have been introduced into the stream in addition to DTPMP. Thus, the actual phosphonate concentration in the stream may have exceeded 70 µg/L. Up to now, no study investigating the impact of WWTPs on the phosphonate content in water bodies has been carried out.
The highest dissolved phosphonate concentration determined in the current study was 39 µg/L (in River2). In conjunction with the results by Müller and Sacher [7], it appears likely that local phosphonate concentrations may considerably exceed the average concentration predicted by former studies and the 50 µg/L threshold for the theoretical remobilization of transition metals. However, assuming the concentration limits of the laboratory tests are transferable to reality, a remobilization of the toxic heavy metals cadmium, lead, and mercury is not yet to be expected, even in rivers with low flow rates. It is noteworthy that laboratory tests can only marginally depict the real fluctuation of phosphonate adsorption on sediments, and in-depth field investigations on the heavy metal remobilization by phosphonates are still lacking.
Although it is assumed that phosphonates do not undergo significant degradation in the activated sludge process, some publications report that phosphonates can be degraded to a certain degree by microorganisms or algae during prolonged periods of time (induction of C−P lyase or phosphonatase enzymes) [5,24,25]. When comparing the growth of colony-forming units on nonselective and selective nutrient media from seven environmental samples (soil, lake water, activated sludge, river water, aerobic compost, and landfill sludge), Schowanek and Verstraete [5] found the following average proportions of phosphonate-utilizing microorganisms: HEDP: 0.18%, EDTMP: 2.49%, and DTPMP: 1.31%. Furthermore, polyphosphonates also appear to be subject to very slow hydrolysis, which is more pronounced for aminophosphonates (conversion of phosphonate-P to inorganic P per day under incubation conditions in the dark: 0.5‰ for HEDP and 6‰–15‰ for aminophosphonates) [5]. Phosphonates also undergo abiotic degradation to biologically available orthophosphate either photolytically (UV/Fe) or catalytically (Mn2+/O2) [3,4]. However, these processes are also slow and vary for each phosphonate. The Mn2+-complexes of the nitrogen-free phosphonates, for example, do not undergo catalytic degradation in the presence of oxygen [3,26]. The pronounced dominance of HEDP found in this study can therefore be well-explained due to its high hydrolysis stability, persistence against degradation by Mn2+/O2, and the very rare occurrence of HEDP-utilizing microorganisms.
The median phosphonate-P concentration of 0.7 µg/L in River1 before and behind the WWD can be regarded as unproblematic, as oligotrophy is assumed at <10 µg/L P in waters [27]. The same applies to River2 before the WWD (0.1 µg/L phosphonate-P; median). Behind the WWD in River2, on the other hand, the phosphonate-P concentrations of 4.3–9.3 µg/L (5.6 µg/L median) were considerably higher and, therefore, more critical.
Concerning toxicity, phosphonates are considered harmless for a wide range of aquatic organisms if present in the concentrations expected in treated wastewater and the aqueous environment [2,16,18,20,22,28]. The toxically effective concentrations of phosphonates in various fish studies and Daphnia magna tests were determined as >100 mg/L. Thus, even for River2 downstream of the WWD, no major toxicity risk due to phosphonates is expected.

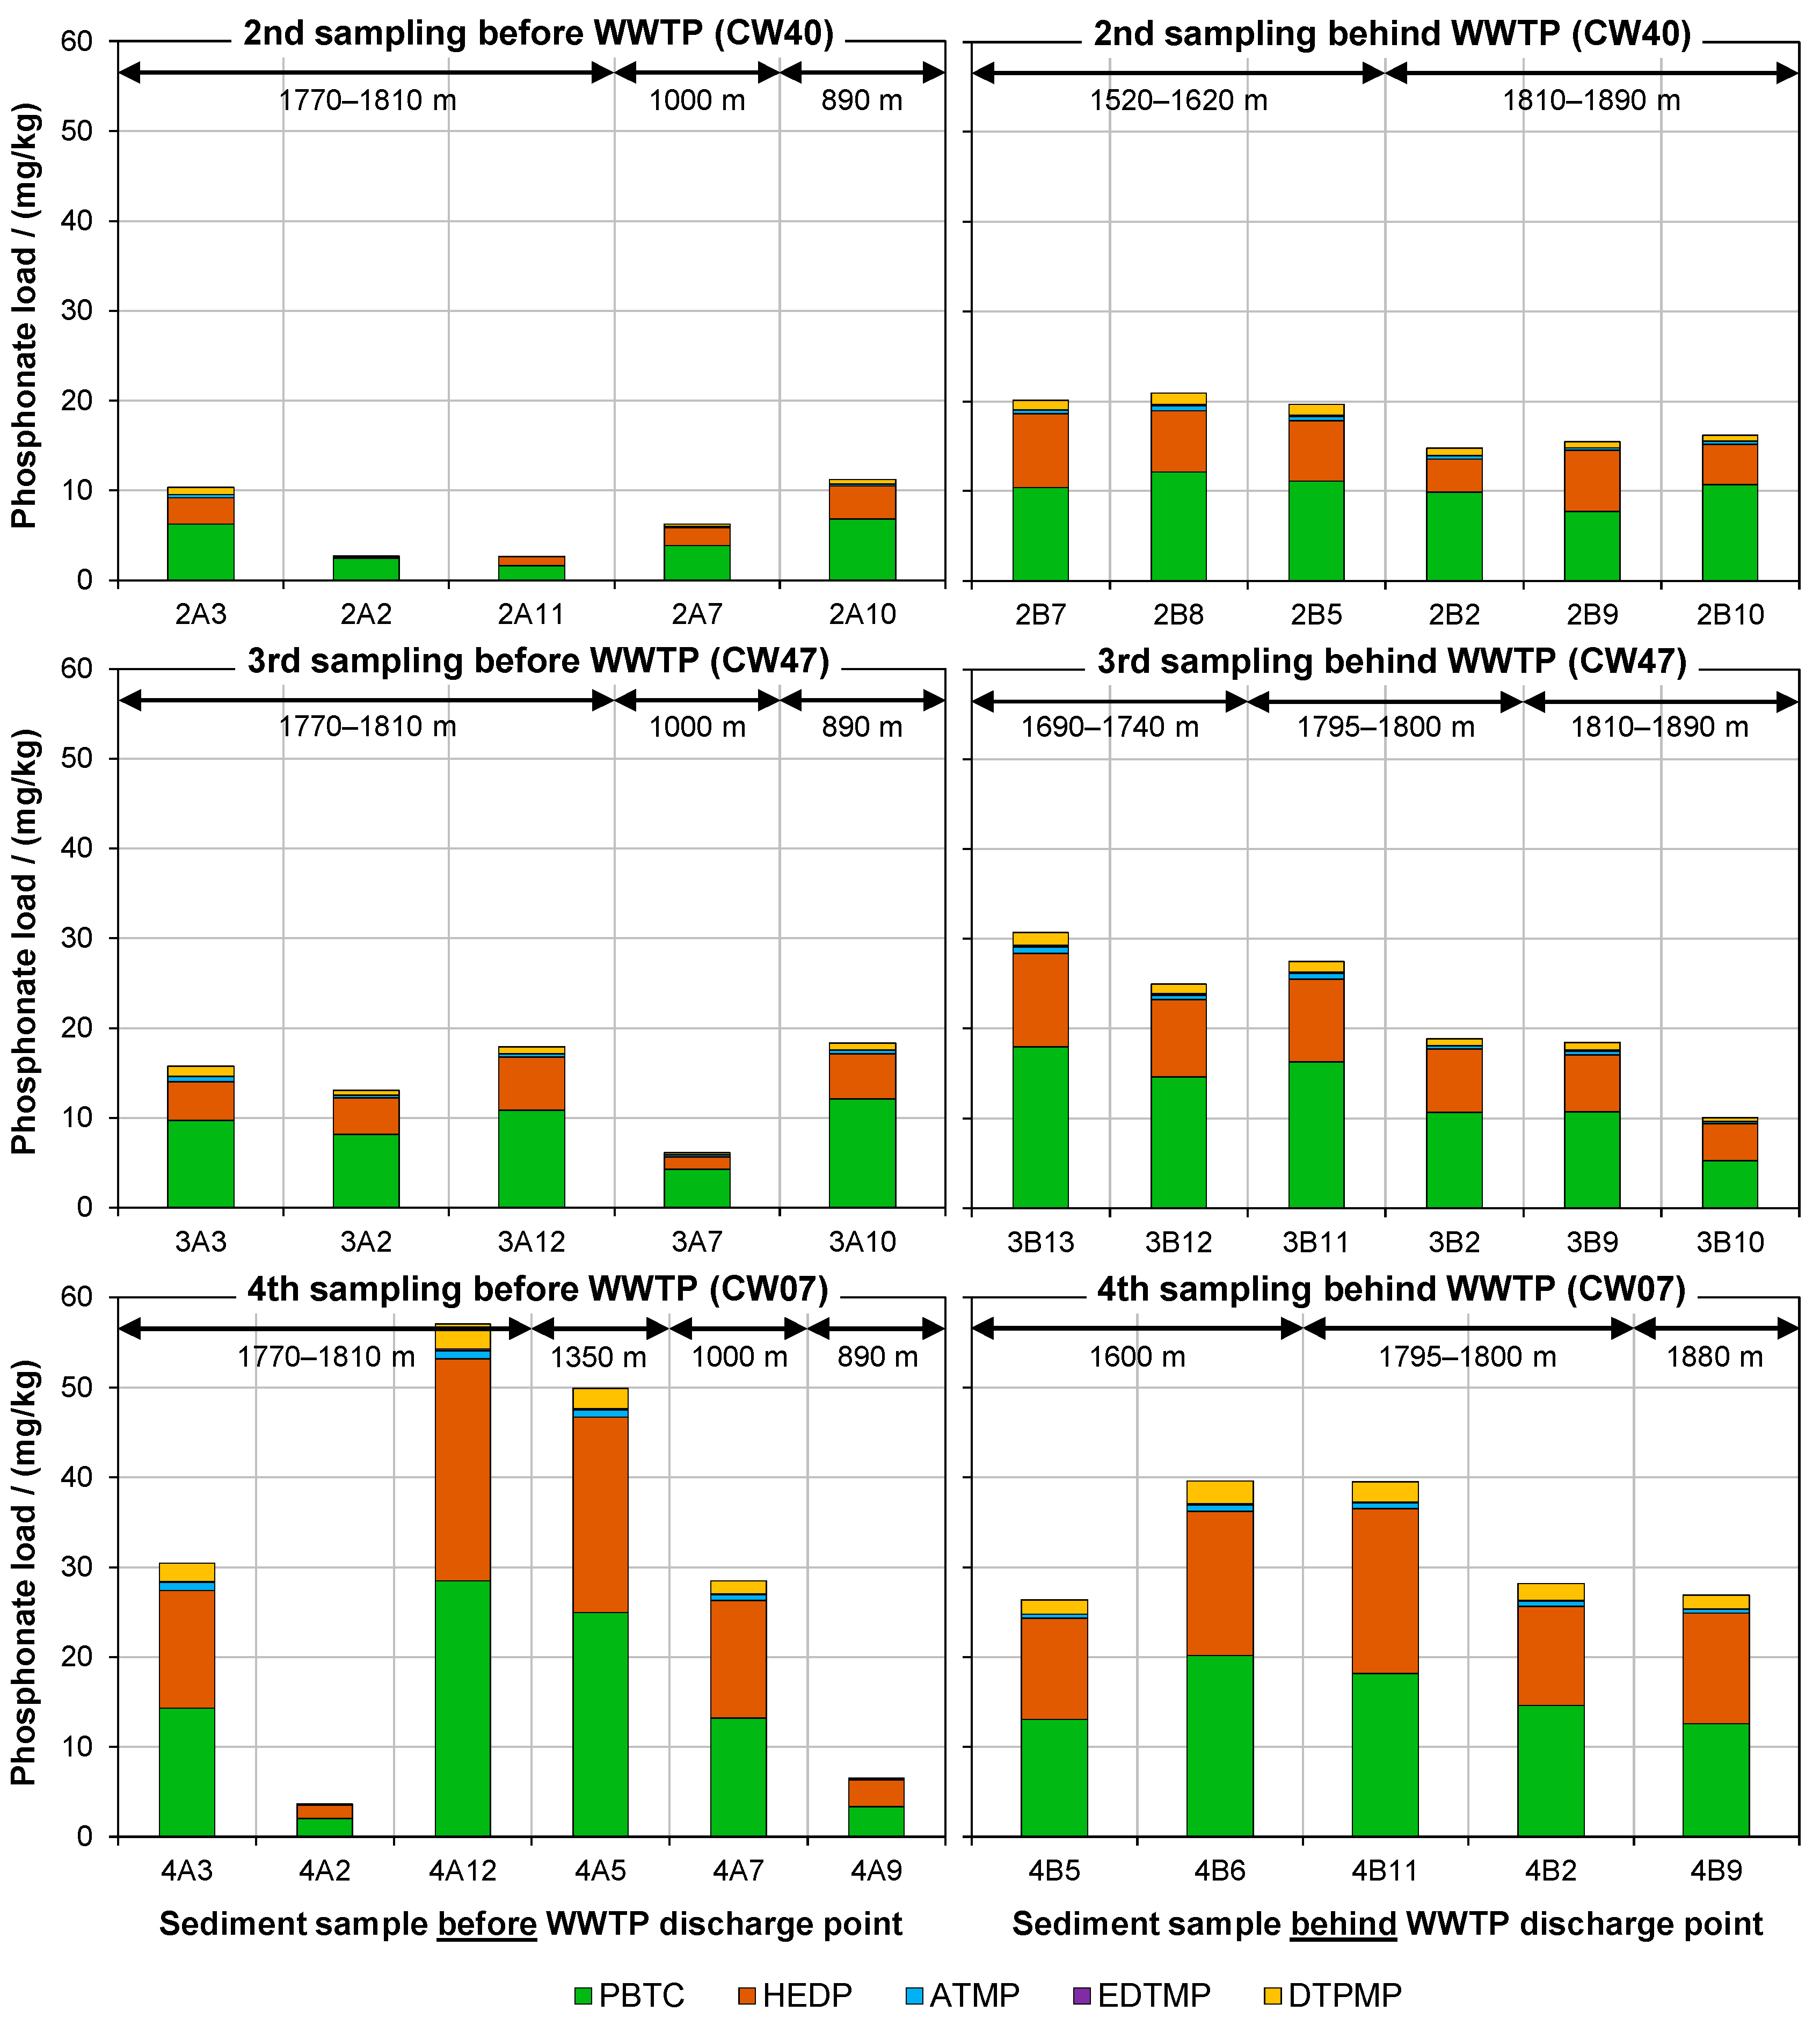
3.2. Phosphonates Adsorbed to Sediment

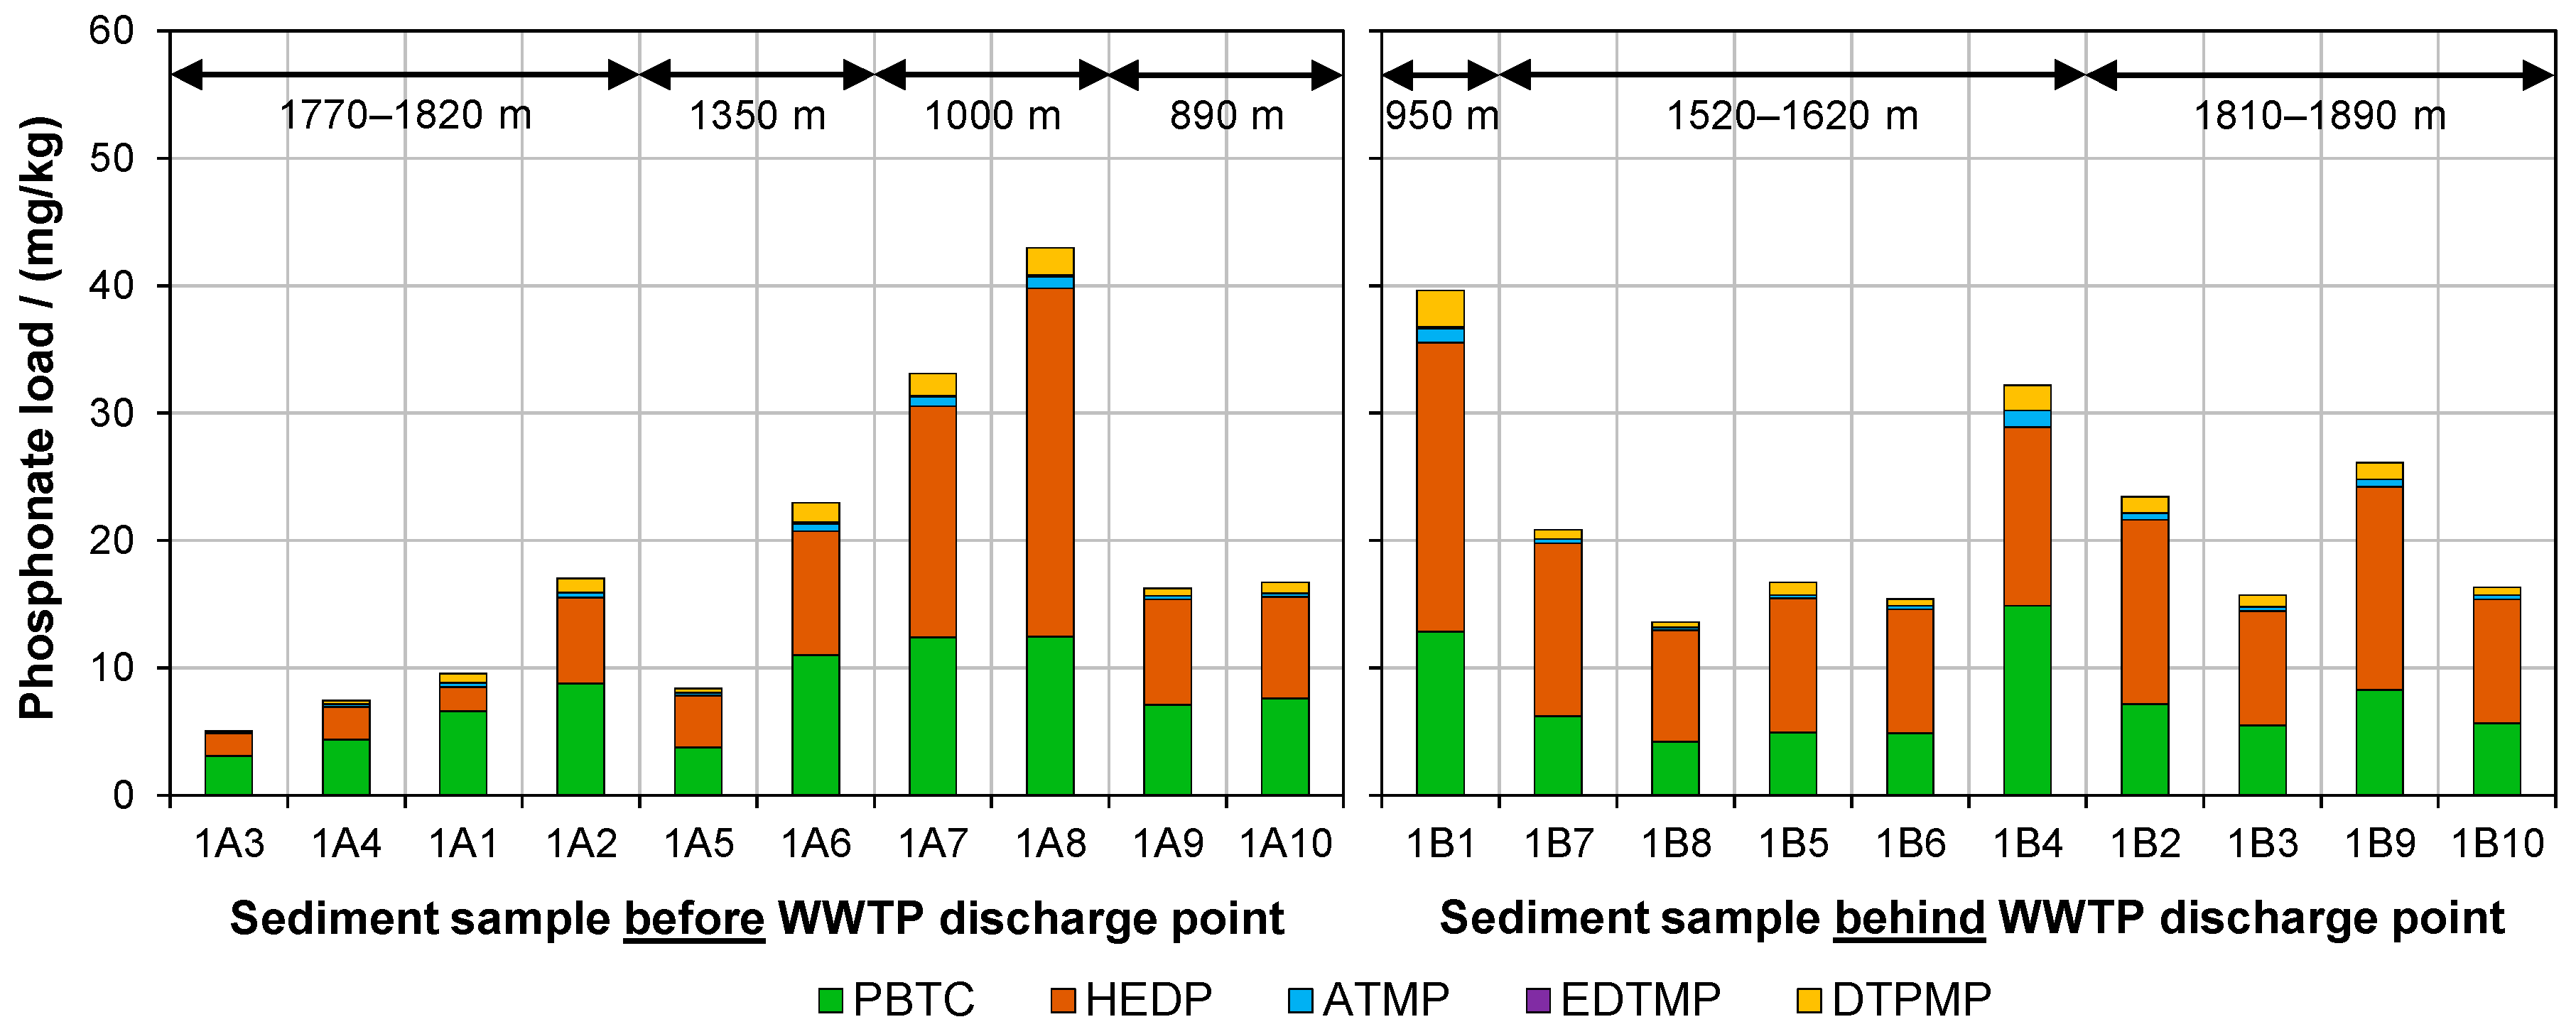
3.2.1. Individual Analysis of Different Sediment Samples

In order to examine the constitution of the riverbed with regard to the phosphonate burden, 5–10 individual samples were taken before and behind the WWD on the first four samplings of River1 (CW31, CW40, CW47, and CW07) and analyzed separately (Figure 5: first sampling, Figure A5: second to fourth sampling). The phosphonate loads varied strongly depending on the sampling point in the riverbed. In some cases, samples taken before the WWD had higher loads than samples taken behind the WWD. Since the matrix of the individual samples differed considerably (sandy/gravelly vs. muddy), this observation came as no surprise. The coarse-grained matrix had a lower potential for phosphonate adsorption than the fine-grained matrix of the muddy samples. Although the samples were sieved, complete removal of the sand was impossible. An overall increase of the phosphonate load of sediment due to the WWD became apparent, as for each sampling the mean value behind the WWD was higher than before the WWD (Table A4). However, this increase was only significant for one of the four samplings (second sampling: p = 0.0011; the other samplings: p > 0.079; Table A4). The sediment load did not seem to substantially depend on the distance between the sampling point and the WWD.

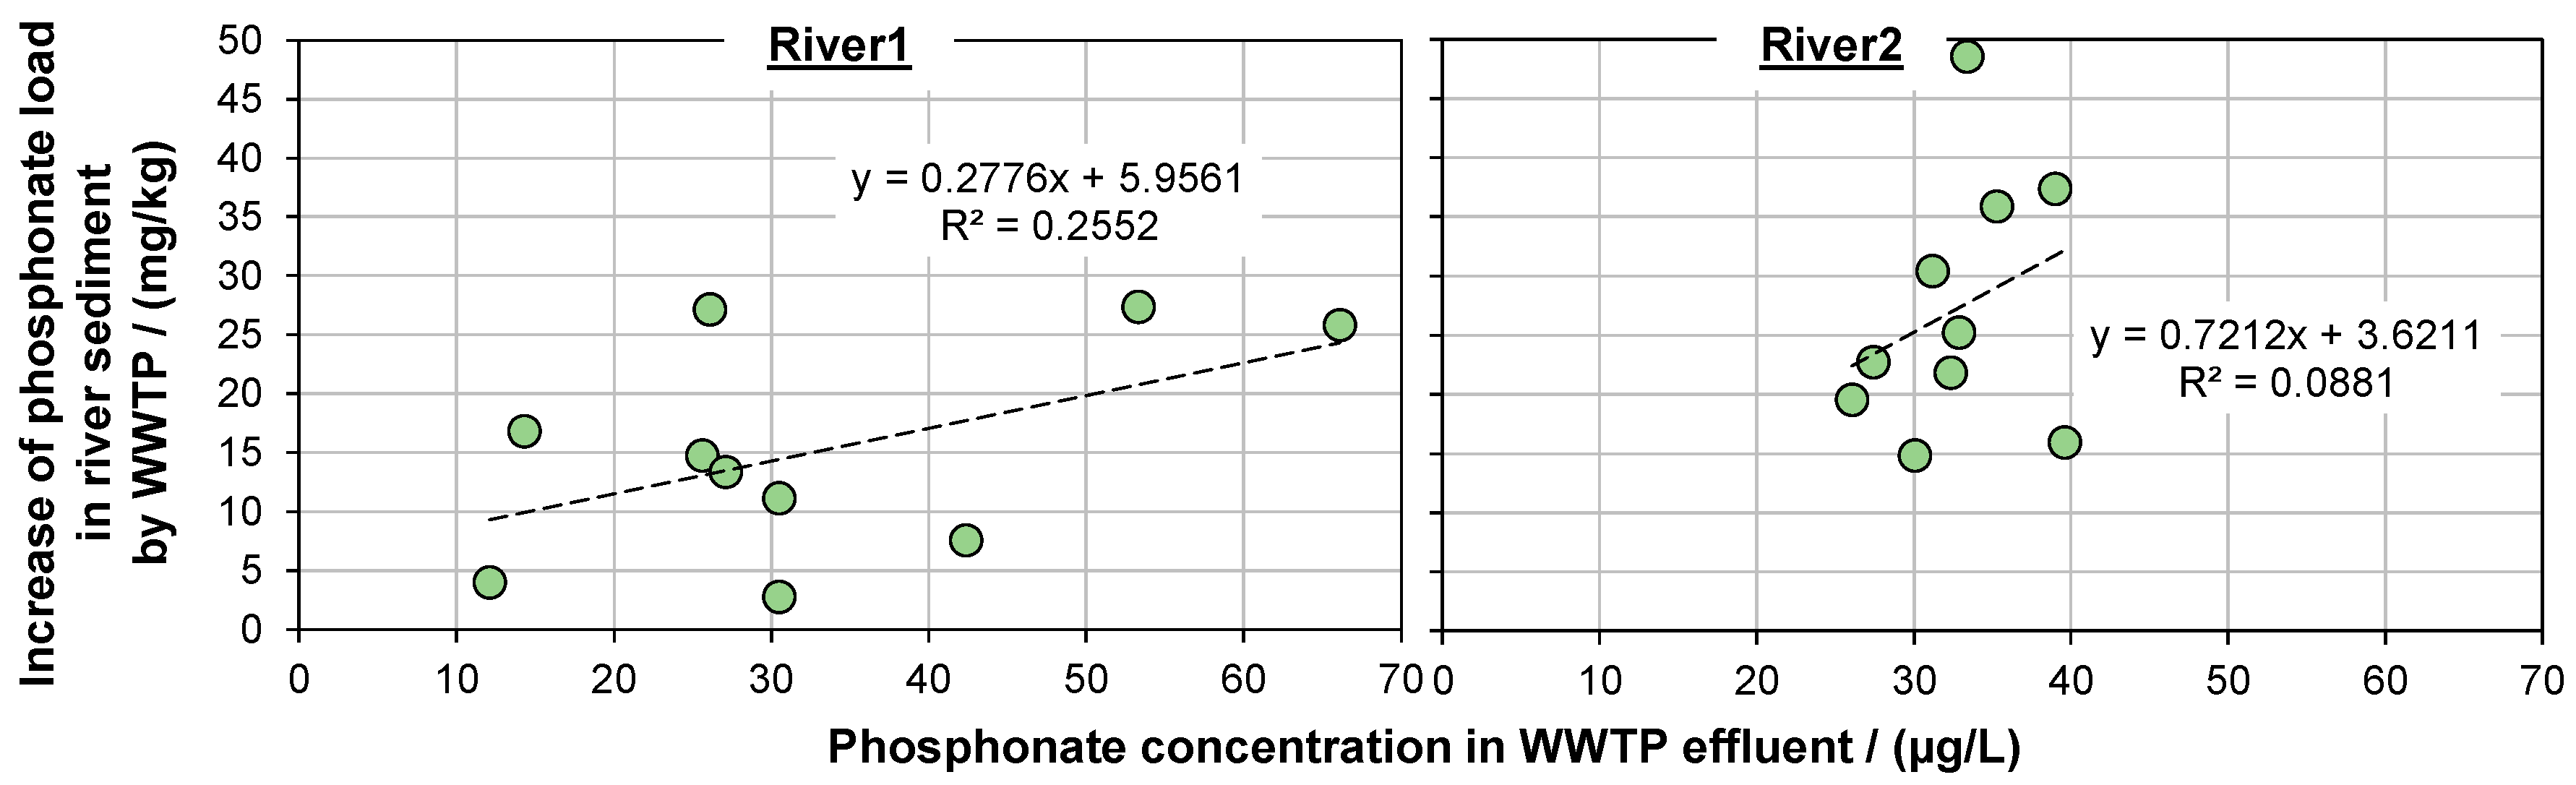
3.2.2. Impact of WWTP

The phosphonate loads of the river sediments before and behind the WWD are plotted in Figure 2 (bottom). Figure 3 (bottom) summarizes the typical distribution by means of boxplots. From the individually analyzed sediment samples (first four samplings), the mean values of the phosphonate loads were used for further calculations (Table A4). Before the WWD, the total phosphonate load was remarkably higher in River1 (6.7–29.4 mg/kg) than in River2 (1.8–5.0 mg/kg), reflecting the fact that River2 has a negligible wastewater burden prior to the discharge of WWTP2 (Section 3.1.1). Behind the WWD, the loads of both rivers were comparable (River1: 17.8–53.5 mg/kg; River2: 18.1–51.4 mg/kg). Based on the median, the total phosphonate load of River1 increased by a factor of one point nine and of River2 by a factor of eight due to the WWD. This increase was significant for both rivers (River1: p = 0.0033; River2: p < 0.0001; Table A2). The case of River1 is particularly interesting, as for this river, no significant increase of the dissolved phosphonate concentration was observed (Figure 2 top). This implies that the concentration of dissolved phosphonates cannot be used as an indicator for the influence of WWD on the total phosphonate burden of rivers. Figure 6 indicates only a weak nonsignificant correlation between the increase of the sediment phosphonate load and the dissolved phosphonate concentration of the WWTP effluent (River1: p = 0.1364; River2: p = 0.4050; Table A3), implying that the adsorption on sediment is slightly delayed in time (a stronger influence on the dissolved concentration of River2 was recorded; Figure 4).
In both rivers, the load of each phosphonate was higher behind the WWD. Even the load of ATMP and EDTMP, although being constantly below their LOQs in the WWTP effluents, increased due to the WWD. The fact that, in River1, the proportions of HEDP and DTPMP in the total phosphonate load increased, whereas the proportion of PBTC decreased, implies that the two polyphosphonates tend to adsorb stronger than the monophosphonate PBTC (Table 1). This hypothesis is supported by the fact that PBTC (3–25 µg/L, median: 13 µg/L) was present in similar concentrations to HEDP (7–38 µg/L, median: 13 µg/L) in the effluent of WWTP1 [12]. PBTC also had a lower adsorption potential than HEDP towards the particles in the influents of both WWTPs [12]. This was attributed to the three carboxyl groups of the PBTC molecule, which have a lower adsorption potential than the phosphonate groups. In River2 sediment, the load of all phosphonates drastically increased due to the WWD, most pronounced in the case of HEDP. Given that PBTC has a lower adsorption potential than HEDP (c.f. the shift of sediment phosphonate composition in River1) and the dissolved concentration of HEDP exceeded the PBTC concentration in the WWTP2 effluent by a factor of two (medians: 20 µg/L HEDP and 10 µg/L PBTC) [12], the outstanding HEDP proportion of ~72% in the total phosphonate load behind the WWD appears plausible (Table 1). DTPMP was generally the third-most abundant phosphonate in the sediment (with exception of River2 sediment before the WWD), and ATMP and EDTMP contributed with the lowest shares.
Taking into account the water density (1 kg/L), the range of dissolved phosphonate concentration in both rivers corresponds to <0.1–39 µg/kg of water. These values are approximately 1000-fold lower than the phosphonate loads of the corresponding sediments, ranging from 1.8 mg/kg to 53.5 mg/kg. The current results suggest that phosphonates adsorb onto solid particles and have sufficient stability to spread with the particle flow along the riverbed, likely accumulating in the sediment over long distances.

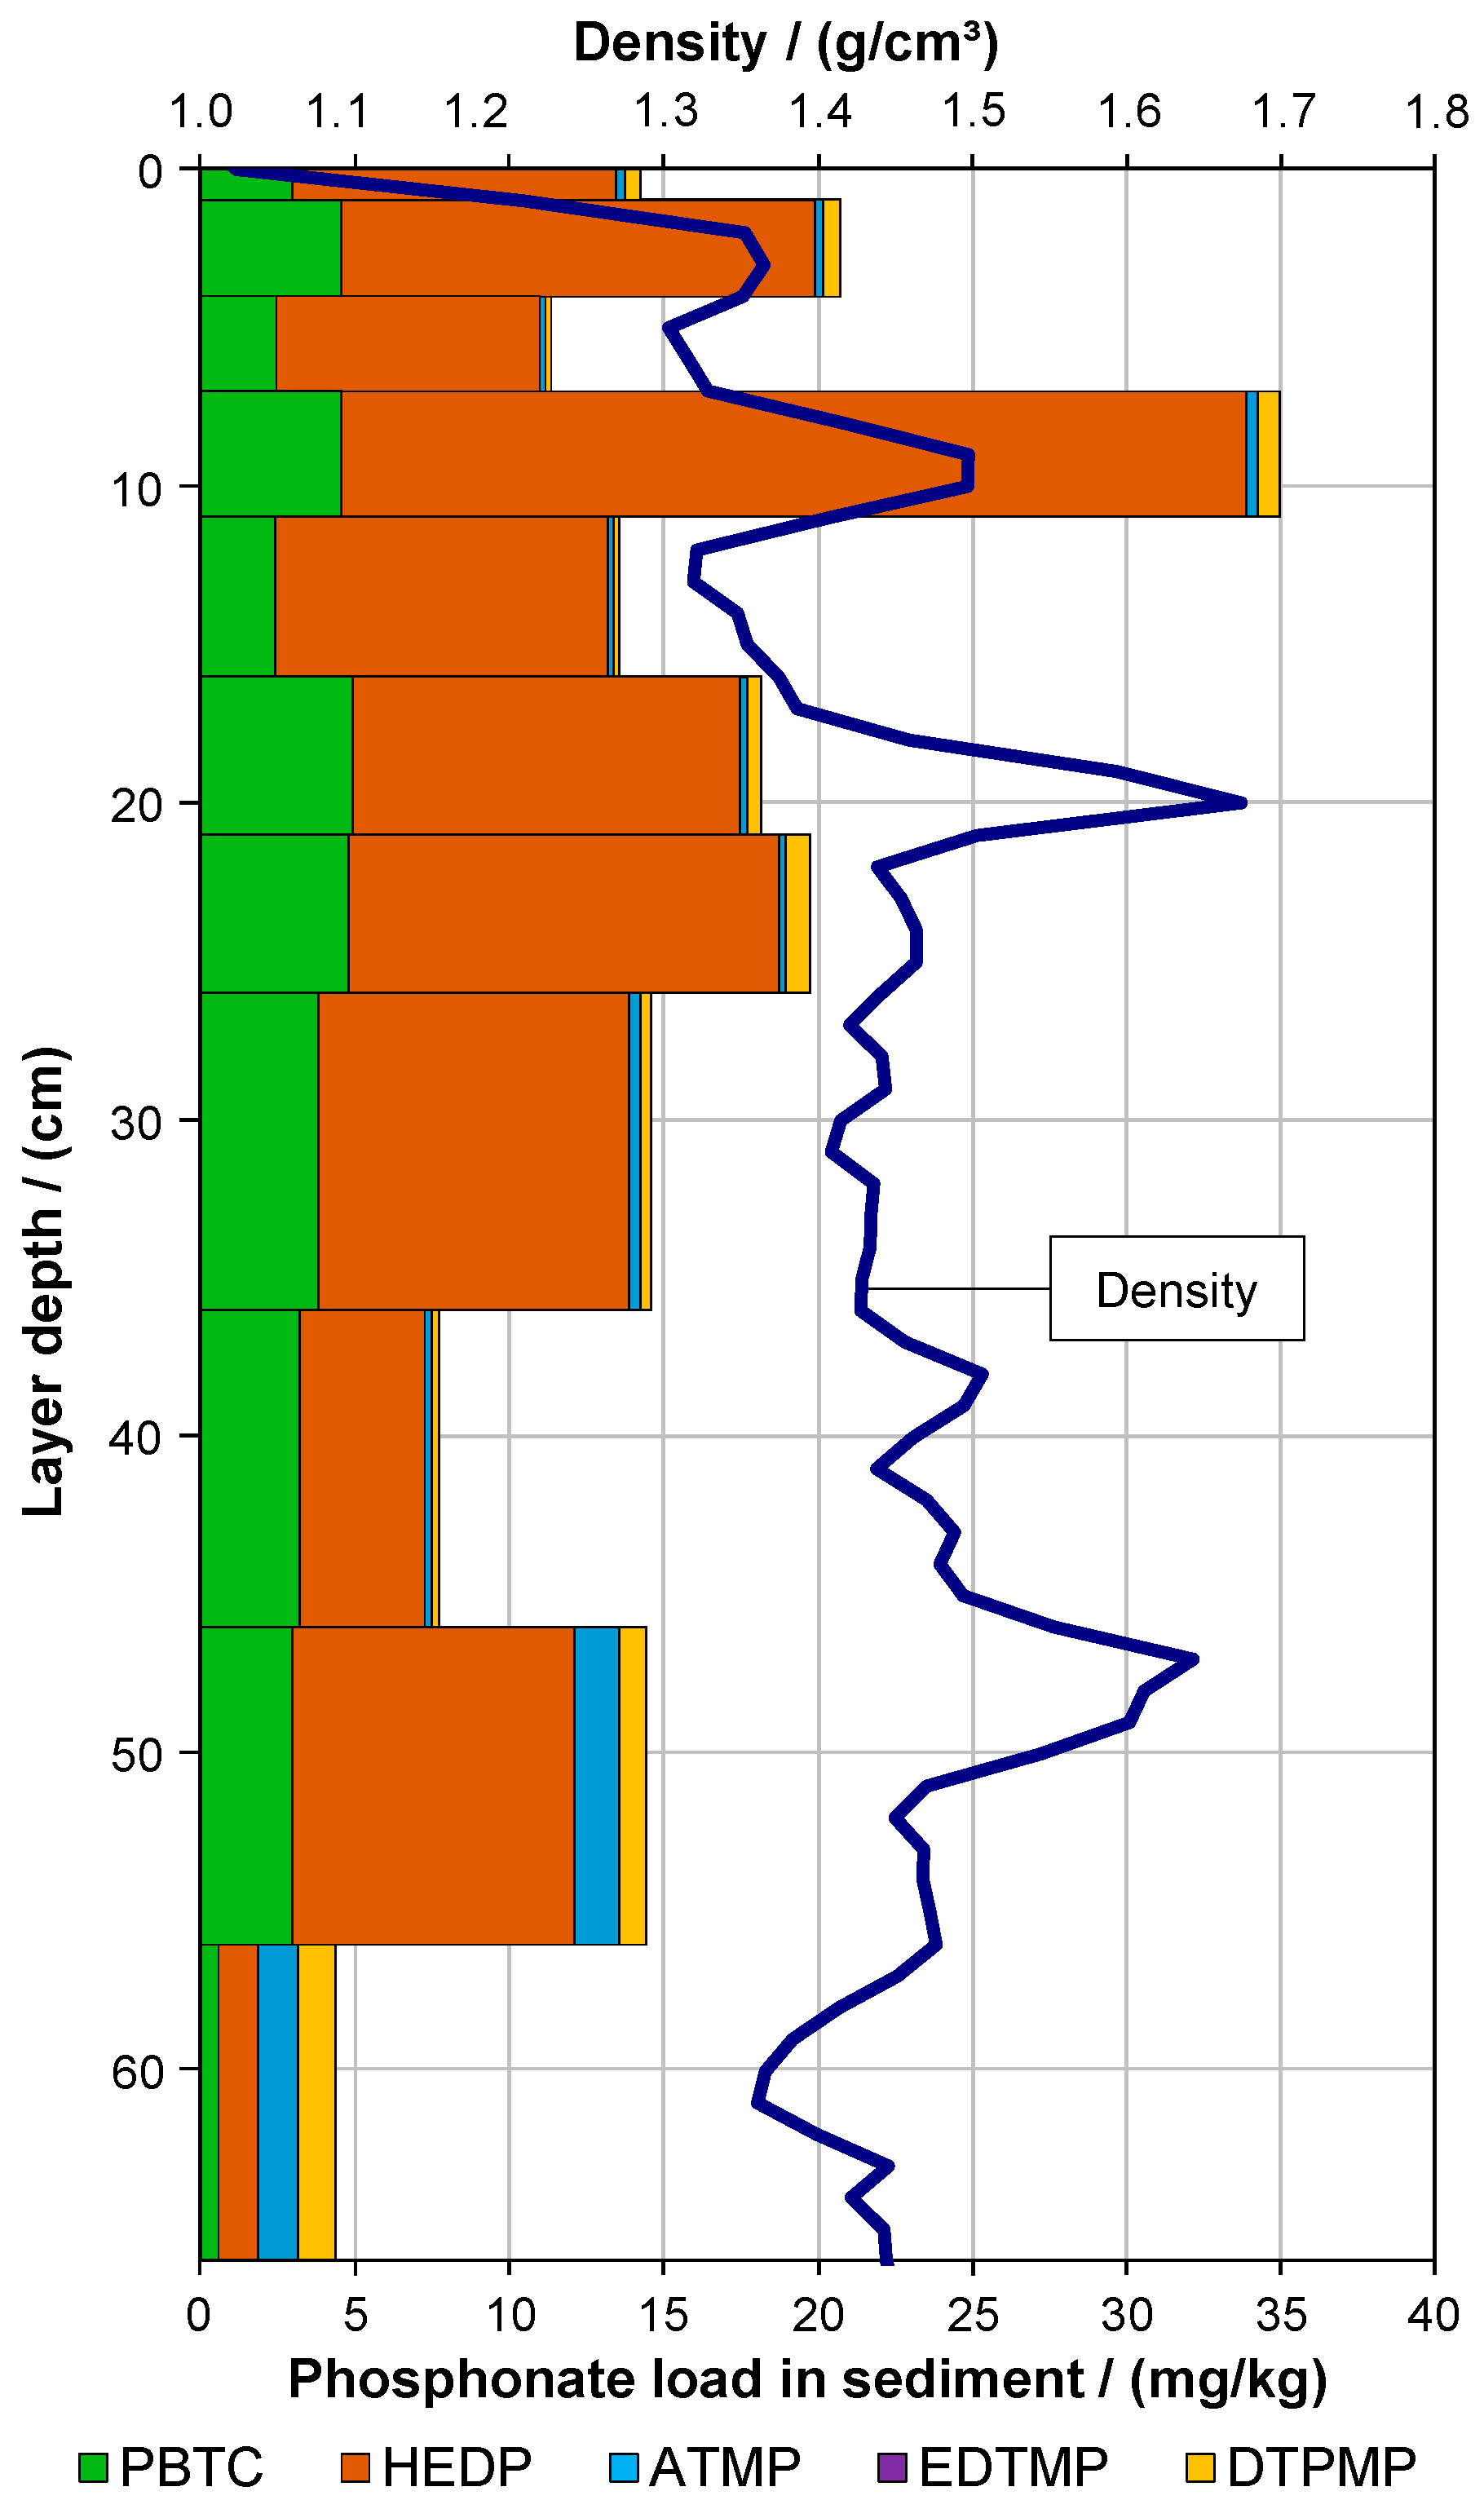
3.2.3. Phosphonate Distribution in Different Layers of Sediment

The hypothesis of phosphonate accumulation in the sediment is supported by the phosphonate distribution along a sediment depth profile of River3 (Figure 7). In the top 10 cm of the sediment, phosphonate loads of up to 35 mg/kg were determined. At a depth of 66 cm, phosphonates could still be detected at 4.4 mg/kg. Down to a depth of 46 cm, nitrogen-free phosphonates accounted for >94% (ATMP and DTPMP were present at loads of <1 mg/kg down to this depth). However, this proportion decreased to 29% in the deeper layers. EDTMP was present below the LOQ in all samples. On average, the total phosphonate load was 13.9 mg/kg. Distinct fluctuations of the phosphonate content were noticeable throughout the profile, largely reflecting the heterogeneous stratification of the sediment. Layers of elevated density had a larger proportion of finely granular material, such as silt and clay, and, thus, a higher porosity.
The high proportions of nitrogen-free phosphonates, observed down to a depth of 46 cm, were also determined for River1 and River2 sediments. As discussed in Section 3.1.2, hydrolysis, biodegradation, and O2-mediated degradation of aminophosphonates complexed with Mn2+ are typical degradation pathways for phosphonates. Regarding these mechanisms, HEDP appears to be the most stable polyphosphonate. Due to the lack of nitrogen within the molecular structure, a similar stability may be expected for PBTC. Another important phosphonate elimination mechanism is degradation by UV light. As a rule, this degradation is favored if the phosphonates are present as complexes, e.g., with Fe-ions. The direct photolytic degradation of EDTMP and DTPMP has also been observed to a lesser extent [29,30]. Regarding the degradation by UV/Fe, the following reactivity pattern was found: PBTC > HEDP > ATMP (the applied UV power was insufficient for the degradation of EDTMP and DTPMP) [31]. Thus, in contrast to the aforementioned mechanisms, nitrogen-free phosphonates are expected to be of higher susceptibility to the combination of UV light and metal ions. However, since UV light usually does not reach the riverbed, a degradation of phosphonates in this form is unlikely in the sediment. Considering the assumption of Nowack [32] that the biodegradability of phosphonates in heterogeneous systems is generally reduced in comparison to homogeneous systems (Zaranyika and Nyandoro [33] observed this behavior for glyphosate), an accumulation in the sediment is to be expected, particularly for the nitrogen-free phosphonates PBTC and HEDP.
At layers below 46 cm, the proportion and load of aminophosphonates increased considerably. As already mentioned, in environmental samples, more aminophosphonate-utilizing than HEDP-utilizing bacteria are found [5]. It is thus possible that the lack of bacteria in the deeper layers of sediment led to less biodegradation of aminophosphonates as compared to the upper layers. The occurrence of phosphonates in the sediment also depends on other factors such as redox potential and unknown reaction pathways [34]. Further studies on the degradation pathways of phosphonates and the emergence of metabolites in sediments are required.

3.2.4. Comparison with Literature

31P-solid-state-NMR (nuclear magnetic resonance spectroscopy) was used to determine the proportion of organic phosphonates in the total phosphorus content of various sediment samples [35,36,37]. This method is suitable for determining phosphonates in mixtures as a sum parameter with other organic phosphorus species. However, a qualitative statement regarding individual phosphonates or a distinction between biogenic and anthropogenic phosphonates cannot be made.
With this method, Ahlgren et al. [35] determined total phosphorus loads between 830 mg/kg and 880 mg/kg in the sediments of three oligotrophic mountain lakes in Sweden. In addition to orthophosphate, pyrophosphate, polyphosphate, orthophosphate monoesters, phospholipids, and DNA components, phosphonates were identified as components of freshwater lake sediments. Phosphonates accounted for 1.2%–2.7%, which corresponds to 10–22 mg/kg phosphonate-P. Assuming that the typical P mass fraction in phosphonates is 20%–30%, a phosphonate load of 35–110 mg/kg may be deduced. It can be assumed that a large proportion of the phosphonates was of biogenic origin, such as 2-aminomethylphosphonic acid or various methylphosphonic acids [38]. Furthermore, the authors assumed that phosphonates are rarely recycled from the sediment, as microorganisms prefer to utilize compounds containing phosphate groups.
Benitez-Nelson et al. [37] determined phosphonate-P loads of 4–7 mmol/kg in the anoxic sediment of the Gulf of Cariaco (Caribbean). This corresponded to 13%–23% of the total phosphorus content. Again, taking into account the typical P mass fraction, phosphonate loads of 600–1000 mg/kg can be deduced. These loads are one order of magnitude higher than the loads determined by Ahlgren et al. [35], which is no surprise since Ahlgren et al. investigated very clean mountain lakes. Bai et al. [36] determined a phosphonate-P load of up to 5.8 mg/kg in the sediment of a eutrophic freshwater lake in China, which accounted for 0.32% of the total phosphorus content. No phosphonates were found in 16 of 18 sediment samples in other parts of the lake.
The current study presents the first analyses of individual anthropogenic phosphonate loads in sediments. To date, sediment loads of individual anthropogenic phosphonates have only been modeled for waters in the Netherlands in the early 2000s (0.08–1.18 mg/kg HEDP, 0.02–0.30 mg/kg ATMP, 0.008–0.18 mg/kg EDTMP, and 0.003–0.10 mg/kg DTPMP) [22]. However, these predicted values were orders of magnitude below the loads determined for the two rivers in the current study. The investigations using 31P-solid-state-NMR, describing comparatively high phosphonate loads in different kinds of sediment, confirm the hypothesis that considerable amounts of biogenic phosphonates may have been adsorbed on the sediments investigated in this current study (c.f. [13]).

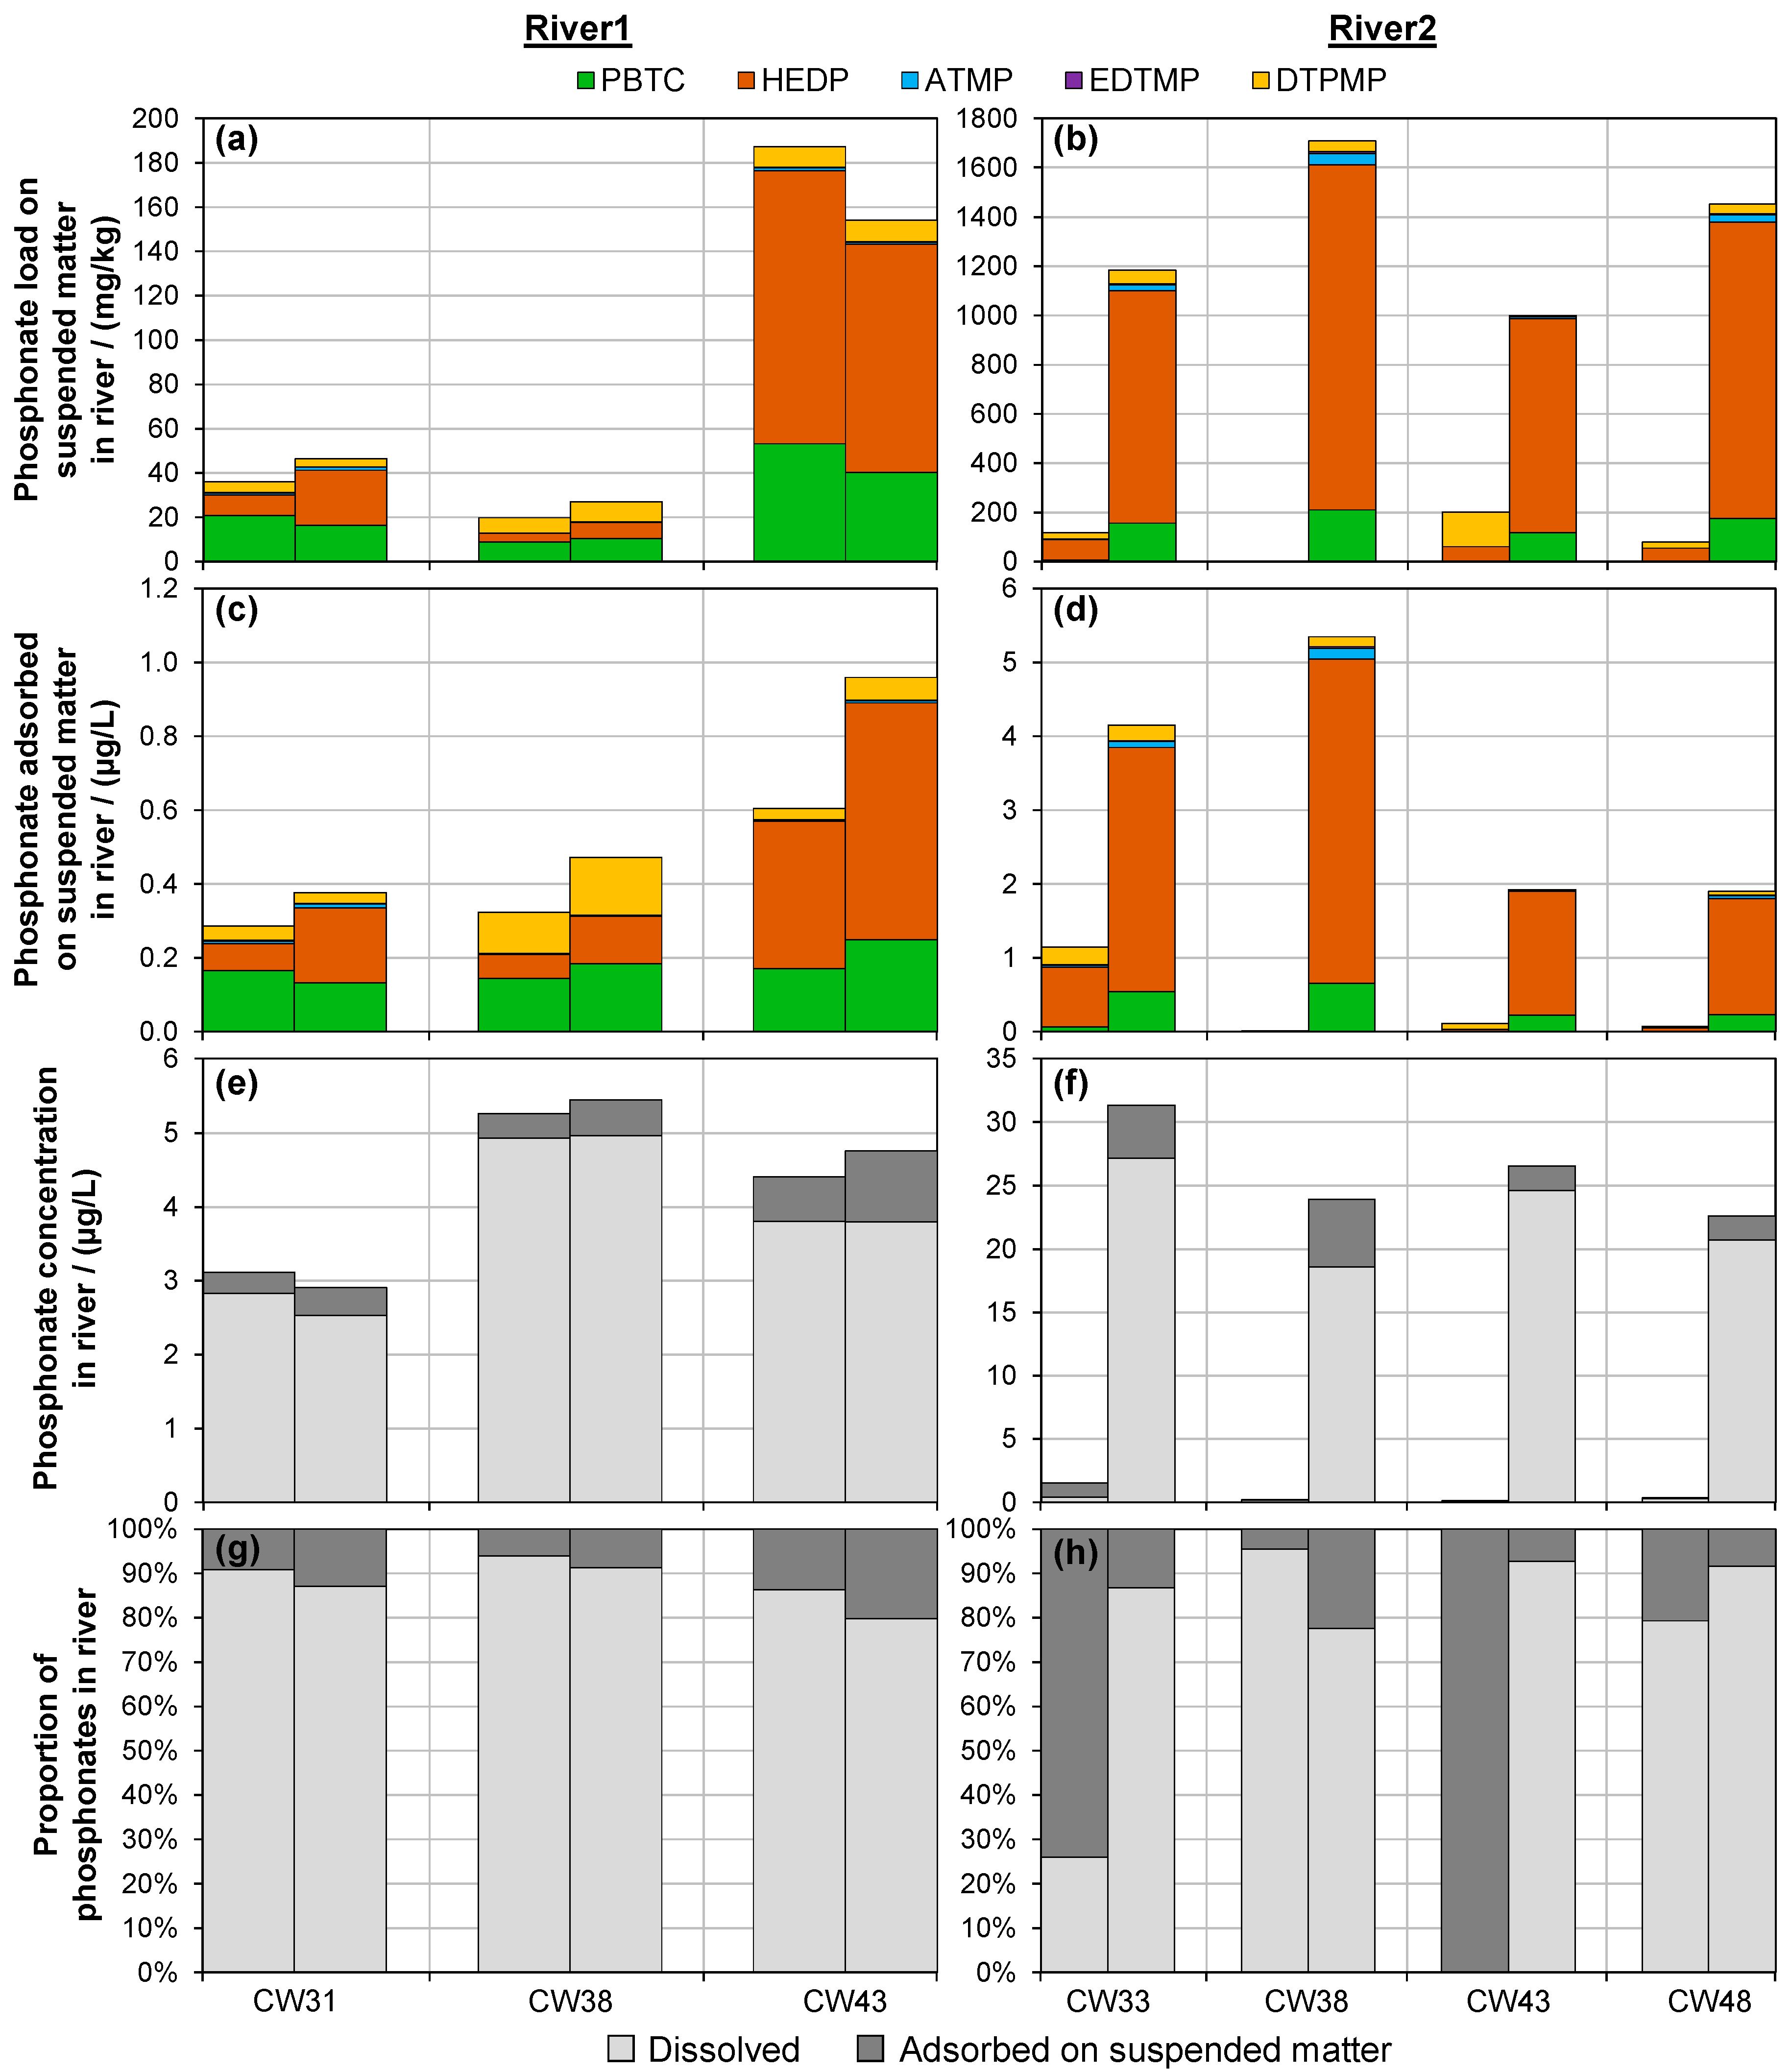
3.3. Phosphonates Adsorbed to Suspended Matter

Figure 8a summarizes the phosphonate loads of SM in River1 both upstream and downstream of the WWD. The phosphonate loads in CW43 (154–187 mg/kg total phosphonate) were considerably higher than the loads of samples taken on two other days (CW31 and CW38: 20–46 mg/kg total phosphonate). Only in CW31 and CW38, elevated phosphonate loads were determined behind the WWD. Thus, no general significant increase of phosphonate load on the SM was found (p = 0.9405; Table A2). With 56%–59%, HEDP had the largest share of all phosphonates, followed by PBTC, DTPMP, ATMP, and EDTMP (in decreasing order; Table 1). This distribution largely correlated with the loads determined in the sediment. The SM loads determined in CW31 and CW38 were in a similar range as in the River1 sediment (6.7–53.5 mg/kg; Figure 2), implying that the SM mainly consisted of whirled-up sediment particles. In CW43, on the other hand, considerably elevated loads as compared to the sediment were found before and behind the WWD. The increased SM phosphonate burden was already present upstream of WWTP1. A possible cause could be a temporary reduction in the elimination performance of a WWTP located upstream of WWTP1. In CW43, average flow rates were recorded for River1 and WWTP1. Thus, there is no indication for a possible discharge of storm water overflow.
A different situation was observed in the case of River2 (Figure 8b). Whereas the phosphonate load of SM was between 3 mg/kg and 201 mg/kg before the WWD, the WWD caused a drastic increase of SM loads to records between 1000 mg/kg and 1710 mg/kg (this increase was highly significant: p = 0.0045). The phosphonate loads of SM thus exceeded the sediment loads, both before and behind the WWD, by a multiple (before WWD: 1–48 times and behind WWD: 25–59 times). Whereas HEDP and DTPMP contributed with each 48% to the total phosphonate load on SM before the WWD, PBTC was hardly present (3%) (Table 1). In the sediment before the WWD, PBTC contributed also marginally with only 6%. Behind the WWD, HEDP increased to 83% and represented the dominating phosphonate. This appears plausible, since HEDP had the highest concentration in the WWTP2 effluent [12]. The fact that even before the WWD high SM phosphonate loads with a similar composition as in the sediment were determined, it implies that SM before the WWD largely consisted of whirled-up sediment particles. Lacking coarse sand particles, these SM samples had a more finely dispersed matrix than the sediment samples, resulting in enhanced average phosphonate loads.
The highest loads of all investigated solid samples were found on the SM of River2 behind the WWD. The outstanding difference between the loads before and behind the WWD implies that activated sludge particles may have been incompletely retained by the secondary clarification of WWTP2 and discharged with the effluent. Since in WWTP1, sludge particles are efficiently removed by tertiary sand filtration, a likewise observation was not made during the monitoring of River1. The SM loads found in River2 behind the WWD were between 1000 mg/kg and 1710 mg/kg. As the WWD was slightly diluted by River2, and thus mixed with particles of less phosphonate loads, it is possible that the phosphonate load on the initially discharged activated sludge particles was higher. From a Europe-wide phosphonate balance, Rott et al. [2] estimated a phosphonate load of 1200–1500 mg/kg on average European sewage sludge. For Germany, harboring both WWTP1 and WWTP2 and being accountable for ~10% of the global phosphonate consumption, a typical sewage sludge load of 2100–2700 mg/kg was estimated [26]. In both WWTP influents, phosphonates were adsorbed with loads of 200–1000 mg/kg (≈primary sludge load) [12]. Thus, the phosphonate load in activated sludge may have exceeded 2000 mg/kg. Consequently, the recorded SM loads are in agreement with the predicted phosphonate loads of activated sludge.
The product of the SM concentration per liter (in mg/L, Figure A4) and the phosphonate load on the SM (transformed into µg/mg) corresponds to the mass concentration of the adsorbed phosphonates per liter of water (in µg/L) (Figure 8c, d). The maximum concentration of phosphonates adsorbed on SM was only 1.0 µg/L in River1 and 5.4 µg/L in River2. In all samplings of River1, the adsorbed concentration was slightly higher behind the WWD than before, indicating that WWTP1 has an influence on the SM contamination. This influence, however, should only be regarded as empirical, as due to the too-small number of samples, no relevant significance could be determined (p = 0.4095; Table A2). On the contrary, the increase of the concentration of SM-adsorbed phosphonate in River2 was highly significant (p = 0.0288). In Section 3.2.2, it was concluded that, in the long-term, phosphonates discharged by the WWTP accumulate in the sediment. It appears that a small proportion of the discharged dissolved phosphonates rapidly adsorbs to SM.
With <20%, the proportion of SM-adsorbed phosphonates in River1, both upstream and downstream of the WWD (Figure 8e,g) and in River2 downstream of the WWD (Figure 8f,h), turned out to be comparatively low (>80% dissolved phosphonates). During two samplings (CW33 and CW43) of River2 before the WWD, the SM proportion was larger. In these cases, however, the concentrations of dissolved phosphonates were exceptionally low (all analytes <LOQ in CW43).

4. Conclusions

A large river (Neckar; River1) and a small river (Körsch; River2) were sampled each ten times at intervals of one to two months before and behind the discharge of WWTPs. The dissolved concentrations and the sediment and SM loads of the phosphonates PBTC, HEDP, ATMP, EDTMP, and DTPMP were determined. In River1, the total concentration of dissolved phosphonates did not change significantly (2.4–5.8 µg/L before vs. 2.5–6.6 µg/L behind WWTP; p = 0.9360) due to the very strong dilution of the wastewater in the river. In River2, on the other hand, it increased significantly from <0.1–1.6 µg/L to 19–39 µg/L (p < 0.0001) due to the flow rate of the WWTP exceeding the flow rate of the receiving water by factors of 2–37. Based on the median, the total phosphonate load in River1 sediment increased one point nine-fold (6.7–29.4 mg/kg before vs. 17.8–53.5 mg/kg behind WWTP; p = 0.0033) and eight-fold in the sediment of River2 (1.8–5.0 mg/kg before vs. 18.1–51.4 mg/kg behind WWTP; p < 0.0001). Accordingly, even in large waters, the phosphonates discharged by WWTPs exert a quantifiable influence on the river system. They possess sufficient stability to adsorb onto solid particles and accumulate in the sediment. This hypothesis was supported by the fact that considerable loads of phosphonates were found even at a depth of 66 cm in the sediment of the large river Rhine. The phosphonate load of SM in River1 hardly differed before and behind the WWTP (20–187 mg/kg; p = 0.9405). In River2, the SM load increased significantly from 3–201 mg/kg to 1000–1710 mg/kg (p = 0.0045), presumably due to the presence of insufficiently retained activated sludge particles (>2000 mg/kg phosphonate). In general, the nitrogen-free phosphonates PBTC and HEDP were predominant in both dissolved and adsorbed form, of which HEDP was found to have the highest adsorption affinity. ATMP and EDTMP were present in the smallest proportions (each <2% of total phosphonate content) in all river phases examined. DTPMP was generally the third-most abundant phosphonate. Degradation pathways and metabolites of phosphonates should be the subject of further research.

Author Contributions

Conceptualization: E.R., D.A., O.H., and R.M.; phosphonate analysis: D.A. and O.H.; sampling and standard parameter analysis: E.R.; writing—original draft preparation: E.R, D.A., and O.H.; writing—review and editing: E.R., D.A., and O.H.; project administration: O.H. and R.M.; and funding acquisition: O.H., R.M., D.A., and E.R. All authors have read and agreed to the published version of the manuscript

Funding

This work was funded by the German Environment Agency as part of the UFOPLAN 3715651410 Project.

Acknowledgments

We wish to thank Marcus Gast (German Environment Agency) for the support and fruitful discussions. We gratefully thank Beat Schmutz (TZW) for his support during the laborious sample preparations and Ellen Raith-Bausch (ISWA) for her support during the standard parameter analysis. We also gratefully thank Gerhard Schmid, Bojan Skodic, Steffen Hägele, and Henning Eickhoff from the Institute for Modelling Hydraulic and Environmental Systems of the University of Stuttgart for their support during sediment sampling.

Conflicts of Interest

The authors declare no conflicts of interest.

Appendix A

Table A1. GPS coordinates of all sampling points in River1, River2, and River3.
SampleGPS Coordinates
WWTP1/River1 (Neckar)
Random & suspended matter sample (before WWTP discharge)48.838389°9.217667°
Staff gauge48.838972°9.225972°
Sediment samples A1 & A248.839042°9.226697°
Sediment samples A3 & A448.838944°9.225989°
Sediment samples A5 & A648.840700°9.231569°
Sediment samples A7 & A848.842014°9.235975°
Sediment samples A9 & A1048.842556°9.237314°
Sediment sample A1148.838453°9.226544°
Sediment sample A1248.838464°9.227325°
WWTP discharge point48.848306°9.245583°
Random & suspended matter sample (behind WWTP discharge)48.861750°9.255333°
Sediment sample B1 (close to WWTP)48.855917°9.251108°
Sediment samples B2 & B348.863006°9.255792°
Sediment sample B448.861456°9.254706°
Sediment samples B5 & B648.861411°9.254250°
Sediment samples B7 & B848.860744°9.253806°
Sediment samples B9 & B1048.863692°9.256000°
Sediment sample B1148.863050°9.255214°
Sediment sample B1248.862575°9.254783°
Sediment sample B1348.862250°9.254631°
WWTP2/River2 (Körsch)
Random sample & sediment samples (before WWTP discharge)48.716768°9.163746°
Suspended matter sample (before WWTP discharge)48.716624°9.167035°
WWTP discharge point48.716298°9.169461°
Random sample, sediment samples, and suspended matter sample (behind WWTP discharge)48.713647°9.175183°
River3 (Rhine)
Sediment sample for depth profile48.101389°7.580611°
Figure A1. Sampling points of liquid random samples (Rand), suspended matter samples (Susp), and sediment samples (white points, A: before WWD and B: behind WWD) of River1 (Google Maps).
Water 12 00803 g0a1
Figure A2. Sampling points of liquid random samples (Rand), suspended matter samples (Susp), and sediment samples (Sed) of River2 (Google Maps).
Water 12 00803 g0a2
Figure A3. Flow rates of WWTPs and River2, as well as the water level of River1, during sampling in different calendar weeks (CW).
Water 12 00803 g0a3
Figure A4. Suspended matter concentrations in both rivers investigated before (left columns) and behind the WWD (right columns).
Water 12 00803 g0a4
Figure A5. Phosphonate loads on sediment samples from the second (CW40), third (CW47), and fourth (CW07) sampling, which were taken at different points in River1 and analyzed individually (meters indicate the distance to the WWD; key “2A1” or “2B1”: 2: second sampling, A/B: before/behind the WWD, 1: sediment location).
Water 12 00803 g0a5
Table A2. Statistical analysis regarding the change of total phosphonate content between before and behind the WWTP (two-tailed t-test; null-hypothesis: no difference between two samples; α = 0.05).
FigureRiverConcentrationMean (Before WWTP)Mean (Behind WWTP)Var. (Before WWTP)Var. (Behind WWTP)tp
2 Top-left1µg/L diss.4.254.301.241.96−0.08150.9360
2 Top-right2µg/L diss.0.6025.880.3645.16−11.851<0.0001
2 Bottom-left1mg/kg sed.17.3032.3751.60135.79−3.48140.0033
2 Bottom-right2mg/kg sed.3.3130.531.02120.95−7.7938<0.0001
8A1mg/kg SM81.1175.838535.064703.470.07950.9405
8C1µg/L SM0.410.600.030.10−0.95620.4095
8E1µg/L SM & diss.4.264.361.161.72−0.10890.9185
8B2mg/kg SM100.381336.176777.4595,976.0−7.71040.0045
8D2µg/L SM0.333.330.292.92−3.34270.0288
8F2µg/L SM & diss.0.5426.100.4614.69−13.1330.0010
α: significance level; diss.: dissolved; p: probability value; sed.: sediment; SM: suspended matter; t: t-statistics value; Var.: variance; bold marking: value below the significance level.
Table A3. Statistical analysis of correlation data (two-tailed t-test; null-hypothesis: no correlation; α = 0.05).
FigureRiverR2Rtp
4 Top-left10.00110.03290.09320.9280
4 Top-right20.45650.67562.59200.0320
4 Bottom-left1<0.0001−0.0049−0.01370.9894
4 Bottom-right20.4327−0.6578−2.47020.0387
6 Left10.25520.50521.65580.1364
6 Right20.08810.29680.87910.4050
p: probability value; R: correlation coefficient; R2: coefficient of determination; t: t-statistics value; bold marking: value below the significance level.
Table A4. Mean concentrations and coefficients of variation (CV) of individually quantified random sediment samples taken at different locations in River1.
CWNo. of SamplesSummationPBTCHEDPATMPEDTMPDTPMP
mg/kgmg/kgmg/kgmg/kgmg/kgmg/kg
3110 before WWTP18.007.738.840.41<LOQ1.02Mean
-459259-63CV/(%)
10 behind WWTP21.987.4512.830.53<LOQ1.17Mean
-493472-64CV/(%)
Significance of increase in total phosphonate: t = −0.8676, p = 0.3985
405 before WWTP6.664.191.960.15<LOQ0.36Mean
-547368-91CV/(%)
6 behind WWTP17.8010.316.130.40<LOQ0.96Mean
-142828-27CV/(%)
Significance of increase in total phosphonate: t = −5.3294, p = 0.0011
475 before WWTP14.249.014.140.39<LOQ0.70Mean
-344137-45CV/(%)
6 behind WWTP21.7712.597.630.470.120.96Mean
-3730424434CV/(%)
Significance of increase in total phosphonate: t = −1.9756, p = 0.0796
076 before WWTP29.4214.4012.860.560.161.44Mean
-7574682876CV/(%)
5 behind WWTP32.1715.7313.800.570.111.96Mean
-2123222421CV/(%)
Significance of increase in total phosphonate: t = −0.2983, p = 0.7756
CV: share of standard deviation in mean value; CW: calendar week; LOQ: limit of quantification; p: probability value; t: t-statistics value (two-tailed t-test, α = 0.05); bold marking: value below the significance level.

References

  1. European Phosphonate Association. Phosphonates in Detergents; EPA Detergent Phosphonates Dossier: Brussels, Belgium, 2013. [Google Scholar]
  2. Rott, E.; Steinmetz, H.; Metzger, J.W. Organophosphonates: A review on environmental relevance, biodegradability and removal in wastewater treatment plants. Sci. Total Environ. 2018, 615, 1176–1191. [Google Scholar] [CrossRef] [PubMed]
  3. Nowack, B.; Stone, A.T. Degradation of Nitrilotris(methylenephosphonic Acid) and Related (Amino)Phosphonate Chelating Agents in the Presence of Manganese and Molecular Oxygen. Environ. Sci. Technol. 2000, 34, 4759–4765. [Google Scholar] [CrossRef]
  4. Matthijs, E.; de Oude, N.T.; Bolte, M.; Lemaire, J. Photodegradation of ferric ethylenediaminetetra(methylenephosphonic acid) (EDTMP) in aqueous solution. Water Res. 1989, 23, 845–851. [Google Scholar] [CrossRef]
  5. Schowanek, D.; Verstraete, W. Phosphonate utilization by bacterial cultures and enrichments from environmental samples. Appl. Environ. Microbiol. 1990, 56, 895–903. [Google Scholar] [CrossRef] [Green Version]
  6. Schmidt, C.K.; Raue, B.; Brauch, H.-J.; Sacher, F. Trace-level analysis of phosphonates in environmental waters by ion chromatography and inductively coupled plasma mass spectrometry. Int. J. Environ. Anal. Chem. 2014, 94, 385–398. [Google Scholar] [CrossRef]
  7. Müller, U.; Sacher, F. Effects of Drinking Water Softening Concentrates in Flowing Waters (Auswirkungen von Konzentraten der Trinkwasserenthärtung in Fließgewässern); Final report project: 333/2012 No. 71; TZW, DVGW Water Technology Center: Karlsruhe, Germany, 2016. [Google Scholar]
  8. Wang, S.; Sun, S.; Shan, C.; Pan, B. Analysis of trace phosphonates in authentic water samples by pre-methylation and LC-Orbitrap MS/MS. Water Res. 2019, 161, 78–88. [Google Scholar] [CrossRef]
  9. Fischer, K. Sorption of chelating agents (HEDP and NTA) onto mineral phases and sediments in aquatic model systems: Part I: Sorption onto clay minerals. Chemosphere 1991, 22, 15–27. [Google Scholar] [CrossRef]
  10. Fischer, K. Distribution and elimination of HEDP in aquatic test systems. Water Res. 1993, 27, 485–493. [Google Scholar] [CrossRef]
  11. Rott, E.; Nouri, M.; Meyer, C.; Minke, R.; Schneider, M.; Mandel, K.; Drenkova-Tuhtan, A. Removal of phosphonates from synthetic and industrial wastewater with reusable magnetic adsorbent particles. Water Res. 2018, 145, 608–617. [Google Scholar] [CrossRef]
  12. Rott, E.; Happel, O.; Armbruster, D.; Minke, R. Behavior of PBTC, HEDP, and Aminophosphonates in the Process of Wastewater Treatment. Water 2020, 12, 53. [Google Scholar] [CrossRef] [Green Version]
  13. Armbruster, D.; Rott, E.; Minke, R.; Happel, O. Trace-level determination of phosphonates in liquid and solid phase of wastewater and environmental samples by IC-ESI-MS/MS. Anal. Bioanal. Chem. 2019, in press. [Google Scholar] [CrossRef] [PubMed]
  14. Fürhacker, M.; Lesueur, C.; Pfeffer, M.; Köllensperger, G.; Popp, M.; Mentler, A. Phosphonates—AMPA (Aminomethylphosphonic Acid). Assessing Origin, Environmental Concentrations and Photolysis Degradation (Phosphonate—AMPA (Aminomethylphosphonsäure). Herkunftsabschätzung, Umweltkonzentrationen und Photolyseabbau); Final report (project no. 1378); Institute of Sanitary Engineering and Water Pollution Control: Vienna, Austria, 2005. [Google Scholar]
  15. Launay, M.A.; Dittmer, U.; Steinmetz, H. Organic micropollutants discharged by combined sewer overflows—Characterisation of pollutant sources and stormwater-related processes. Water Res. 2016, 104, 82–92. [Google Scholar] [CrossRef]
  16. HERA. Human & Environmental Risk Assessment on Ingredients of European Household Cleaning Products. Phosphonates; (CAS 6419-19-8; 2809-21-4; 15827-60-8); HERA: Brussels, Belgium, 2004. [Google Scholar]
  17. Bordas, F.; Bourg, A.C.M. Effect of Complexing Agents (EDTA and ATMP) on the Remobilization of Heavy Metals from a Polluted River Sediment. Aquat. Geochem. 1998, 4, 201–214. [Google Scholar] [CrossRef]
  18. Gledhill, W.E.; Feijtel, T.C.J. Environmental Properties and Safety Assessment of Organic Phosphonates Used for Detergent and Water Treatment Applications. In Detergents; Oude, N.T., Ed.; Springer: Berlin/Heidelberg, Germany, 1992; pp. 261–285. ISBN 978-3-662-14983-6. [Google Scholar]
  19. Günther, K.; Henze, W.; Umland, F. Mobilization behavior of thallium and cadmium in a river sediment (Mobilisationsverhalten von Thallium und Cadmium in einem Flußsediment). Anal. Bioanal. Chem. 1987, 327, 301–303. [Google Scholar] [CrossRef]
  20. Knepper, T.P.; Weil, H. Study on the Entry of Synthetic Chelating Agents and Compounds Exhibiting Complexing Properties into the Aquatic Environment (Studie zum Eintrag synthetischer Komplexbildner und Substanzen mit komplexbildenden Eigenschaften in die Gewässer). Vom Wasser 2001, 97, 193–232. [Google Scholar]
  21. Müller, G.; Steber, J.; Waldhoff, H. On the influence of hydroxyethanediphosphonic acid on phosphate elimination with FeCl3 and the remobilization of heavy metals: Results of laboratory and field tests (Zum Einfluß von Hydroxyethandiphosphonsäure auf die Phosphatelimination mit FeCl3 und die Remobilisierung von Schwermetallen: Ergebnisse von Labor- und Feldversuchen). Vom Wasser 1984, 63, 63–78. [Google Scholar]
  22. Jaworska, J.; van Genderen-Takken, H.; Hanstveit, A.; van de Plassche, E.; Feijtel, T. Environmental risk assessment of phosphonates, used in domestic laundry and cleaning agents in the Netherlands. Chemosphere 2002, 47, 655–665. [Google Scholar] [CrossRef]
  23. Armbruster, D.; Müller, U.; Happel, O. Characterization of phosphonate-based antiscalants used in drinking water treatment plants by anion-exchange chromatography coupled to electrospray ionization time-of-flight mass spectrometry and inductively coupled plasma mass spectrometry. J. Chromatogr. A 2019, 1601, 189–204. [Google Scholar] [CrossRef]
  24. Forlani, G.; Prearo, V.; Wieczorek, D.; Kafarski, P.; Lipok, J. Phosphonate degradation by Spirulina strains: Cyanobacterial biofilters for the removal of anticorrosive polyphosphonates from wastewater. Enzyme Microb. Technol. 2011, 48, 299–305. [Google Scholar] [CrossRef]
  25. Raschke, H.; Rast, H.-G.; Kleinstück, R.; Sicius, H.; Wischer, D. Utilization of 2-phosphonobutane-1,2,4-tricarboxylic acid as source of phosphorus by environmental bacterial isolates. Chemosphere 1994, 29, 81–88. [Google Scholar] [CrossRef]
  26. Rott, E. Investigations on the Elimination of Phosphorus from Phosphonate-Containing Industrial Wastewaters (Untersuchungen zur Elimination von Phosphor aus phosphonathaltigen Industrieabwässern); DIV Deutscher Industrieverlag GmbH: Munich, Germany, 2016; ISBN 978-3-8356-7349-6. [Google Scholar]
  27. The Control of Eutrophication of Lakes and Reservoirs; Ryding, S.-O.; Rast, W. (Eds.) Unesco: Paris, France, 1989; ISBN 1-85070-257-8. [Google Scholar]
  28. Schöberl, P.; Huber, L. Ecologically relevant data on non-surfactant ingredients in detergents and cleaners (Ökologisch relevante Daten von nichttensidischen Inhaltsstoffen in Wasch- und Reinigungsmitteln). Tenside Surfact. Det. 1988, 25, 99–107. [Google Scholar]
  29. Kuhn, R.; Jensch, R.; Bryant, I.M.; Fischer, T.; Liebsch, S.; Martienssen, M. The influence of selected bivalent metal ions on the photolysis of diethylenetriamine penta(methylenephosphonic acid). Chemosphere 2018, 210, 726–733. [Google Scholar] [CrossRef] [PubMed]
  30. Kuhn, R.; Tóth, E.; Geppert, H.; Fischer, T.; Liebsch, S.; Martienssen, M. Identification of the Complete Photodegradation Pathway of Ethylenediaminetetra(methylenephosphonic acid) in Aqueous Solution. Clean Soil Air Water 2017, 45, 1500774. [Google Scholar] [CrossRef]
  31. Rott, E.; Minke, R.; Bali, U.; Steinmetz, H. Removal of phosphonates from industrial wastewater with UV/FeII, Fenton and UV/Fenton treatment. Water Res. 2017, 122, 345–354. [Google Scholar] [CrossRef] [PubMed]
  32. Nowack, B. Environmental chemistry of phosphonates. Water Res. 2003, 37, 2533–2546. [Google Scholar] [CrossRef]
  33. Zaranyika, M.F.; Nyandoro, M.G. Degradation of glyphosate in the aquatic environment: An enzymic kinetic model that takes into account microbial degradation of both free and colloidal (or sediment) particle adsorbed glyphosate. J. Agric. Food Chem. 1993, 41, 838–842. [Google Scholar] [CrossRef]
  34. Fischer, K. Sorption of chelating agents (HEDP and NTA) onto mineral phases and sediments in aquatic model systems. Chemosphere 1992, 24, 51–62. [Google Scholar] [CrossRef]
  35. Ahlgren, J.; Reitzel, K.; Danielsson, R.; Gogoll, A.; Rydin, E. Biogenic phosphorus in oligotrophic mountain lake sediments: Differences in composition measured with NMR spectroscopy. Water Res. 2006, 40, 3705–3712. [Google Scholar] [CrossRef]
  36. Bai, X.; Ding, S.; Fan, C.; Liu, T.; Shi, D.; Zhang, L. Organic phosphorus species in surface sediments of a large, shallow, eutrophic lake, Lake Taihu, China. Environ. Pollut. 2009, 157, 2507–2513. [Google Scholar] [CrossRef]
  37. Benitez-Nelson, C.R.; O’Neill, L.; Kolowith, L.C.; Pellechia, P.; Thunell, R. Phosphonates and particulate organic phosphorus cycling in an anoxic marine basin. Limnol. Oceanogr. 2004, 49, 1593–1604. [Google Scholar] [CrossRef] [Green Version]
  38. Kittredge, J.S.; Roberts, E. A Carbon-Phosphorus Bond in Nature. Science 1969, 164, 37–42. [Google Scholar] [CrossRef] [PubMed]
Figure 1. Overview of the phosphonates investigated in this study with their CAS numbers.
Water 12 00803 g001
Figure 2. Concentrations of dissolved phosphonates (top) and phosphonate loads of sediments (bottom) in the two investigated rivers before (left columns) and behind the wastewater discharge points (WWDs) (right columns) in each calendar week.
Water 12 00803 g002
Figure 3. Boxplots (minimum, first quartile, median, third quartile, and maximum) of the concentrations of dissolved phosphonates (top) and phosphonate loads of sediments (bottom) in the two investigated rivers before (left boxplot) and behind the WWDs (right boxplot). LOQ: limit of quantification.
Water 12 00803 g003
Figure 4. Increase of the total dissolved phosphonate concentrations (concentration behind minus concentration before WWDs) in both rivers as a function of the total dissolved phosphonate concentrations in the wastewater treatment plant (WWTP) effluents (top) and as a function of the degree of phosphonate elimination in the respective WWTPs (bottom) (WWTP data from Rott et al. [12]).
Water 12 00803 g004
Figure 5. Phosphonate loads of sediment samples from the first sampling (CW31) taken at different locations in River1 and analyzed individually (meters indicate the distance to the WWD, key “1A1”/”1B1”: 1: first sampling, A/B: before/behind the WWD, 1: sampling point).
Water 12 00803 g005
Figure 6. Increase of the sediment phosphonate loads (load behind minus load before the WWD) in both rivers as a function of the dissolved phosphonate concentrations in the WWTP effluents (WWTP data from Rott et al. [12]).
Water 12 00803 g006
Figure 7. Distribution of phosphonate load and sediment density in different layers of a River3 sediment core sample.
Water 12 00803 g007
Figure 8. Phosphonate content on suspended matter (SM) in the two investigated rivers before (left columns) and behind the WWD (right columns) in each calendar week. Single analytes (ad), total phosphonate (eh), phoshonate load on SM (a,b), phosphonate content of the river water with respect to adsorbed phosphonate on SM (c,d), absolute phosphonate content of river water: dissolved vs. adsorbed on SM (e,f), and relative phosphonate content of river water: dissolved vs. adsorbed on SM (g,h).
Water 12 00803 g008
Table 1. Contribution of single phosphonates to the total phosphonate content of the three different river phases (in % by mass) (determination: summation of the concentrations and loads of each individual phosphonate (sumind) and of total phosphonates (sumtot) over all samples; quotient of sumind and sumtot). WWTP: wastewater treatment plant.
RiverPhasePosition Related to WWTPPBTCHEDPATMPEDTMPDTPMP
River1DissolvedBefore69.617.20.00.712.5
Behind72.315.40.00.012.3
SedimentBefore42.850.21.70.15.2
Behind37.555.01.60.15.8
Suspended matterBefore34.056.10.80.48.7
Behind29.559.41.00.39.8
River2DissolvedBefore5.374.30.00.020.4
Behind34.164.00.00.01.9
SedimentBefore6.479.20.00.014.4
Behind20.171.61.70.06.6
Suspended matterBefore3.248.30.90.147.5
Behind12.382.72.00.32.7

