Urban Nutrient Emissions in Denmark in the Year 1900
by
 , ,
, ,
Sarah Brudler
1 ,
,
Karsten Arnbjerg-Nielsen
1,
Emma Barnhøj Jeppesen
2,
Camilla Bitsch
1,
Mikkel Thelle
2 and
Martin Rygaard
1,* 1
Urban Water Systems, Department of Environmental Engineering, Technical University of Denmark, Bygningstorvet, Building 115, 2800 Kgs. Lyngby, Denmark
2
School of Culture and Society–Danish Centre for Urban History, Aarhus University, Jens Chr. Skous Vej 5, 8000 Aarhus, Denmark
*
Author to whom correspondence should be addressed.
Water 2020, 12(3), 789; https://doi.org/10.3390/w12030789
Submission received: 25 February 2020
/
Revised: 9 March 2020
/
Accepted: 10 March 2020
/
Published: 12 March 2020
(This article belongs to the Section Water Quality and Contamination)
Abstract
:Pre-industrial emission levels can serve as a basis to set emission requirements in current conditions to approximate natural circulation of resources and protect the environment. In Denmark, the year 1900 has been set as a reference for water regulation purposes. Reliable measurements from this time are not available. To define reference conditions, we estimate point source emissions of nutrients from Danish towns in 1900 based on historic documentation and current quantitative data. The flow of nutrients emitted by humans and animals and in industrial wastewater is quantified based on the assessment of typical discharge routes in a set of model towns. We find that point source emissions were significant, with 4261 t nitrogen and 764 t phosphorous emitted from towns in 1900. The main source were human excrements (61%), followed by excrements of animals held in towns (32%) and industry (6%). Further, 59% of nutrients were discharged directly to water, 22% were used as fertilizer on agricultural soil and 19% were emitted to soil via landfills and spills. Current point source emissions of nutrients to water (6600 t N/year and 900 t P/year) are significantly higher, revealing a need for radical reductions if historic emission levels should not be exceeded in the future.
1. Introduction
Water has been used to transport waste and harmful substances away from humans for thousands of years [1]. Protecting humans from adverse effects leads to a shifting of burdens towards ecosystems, where discharges of nutrients and harmful substances negatively affect life on land and under water. Simultaneously, water pollution endangers drinking water resources. The United Nations define the access to clean water and sanitation, the protection of life on land and below water as central goals for sustainable development [2]. In order to meet these goals, targeted wastewater management and treatment is necessary.
Even though the collection, treatment and discharge of wastewater are regulated in large parts of the world, it is not a trivial task to set emission requirements. In this paper, we focus on nutrient emissions, which potentially cause freshwater and marine eutrophication and a degraded oxygen saturation levels. Extensive agriculture, animal husbandry, industrialisation, large scale urbanisation and other human activities have changed the natural nutrient circle to a level that exceeds the planetary boundaries [3,4]. Major reductions in nutrient emissions are necessary to prevent severe environmental damage. However, human life is (currently) only possible if nutrients are used as fertilizer to produce food. We therefore need to define emission requirements that do not negatively affect human life, while at the same time approximating the natural nutrient cycle as closely as possible.
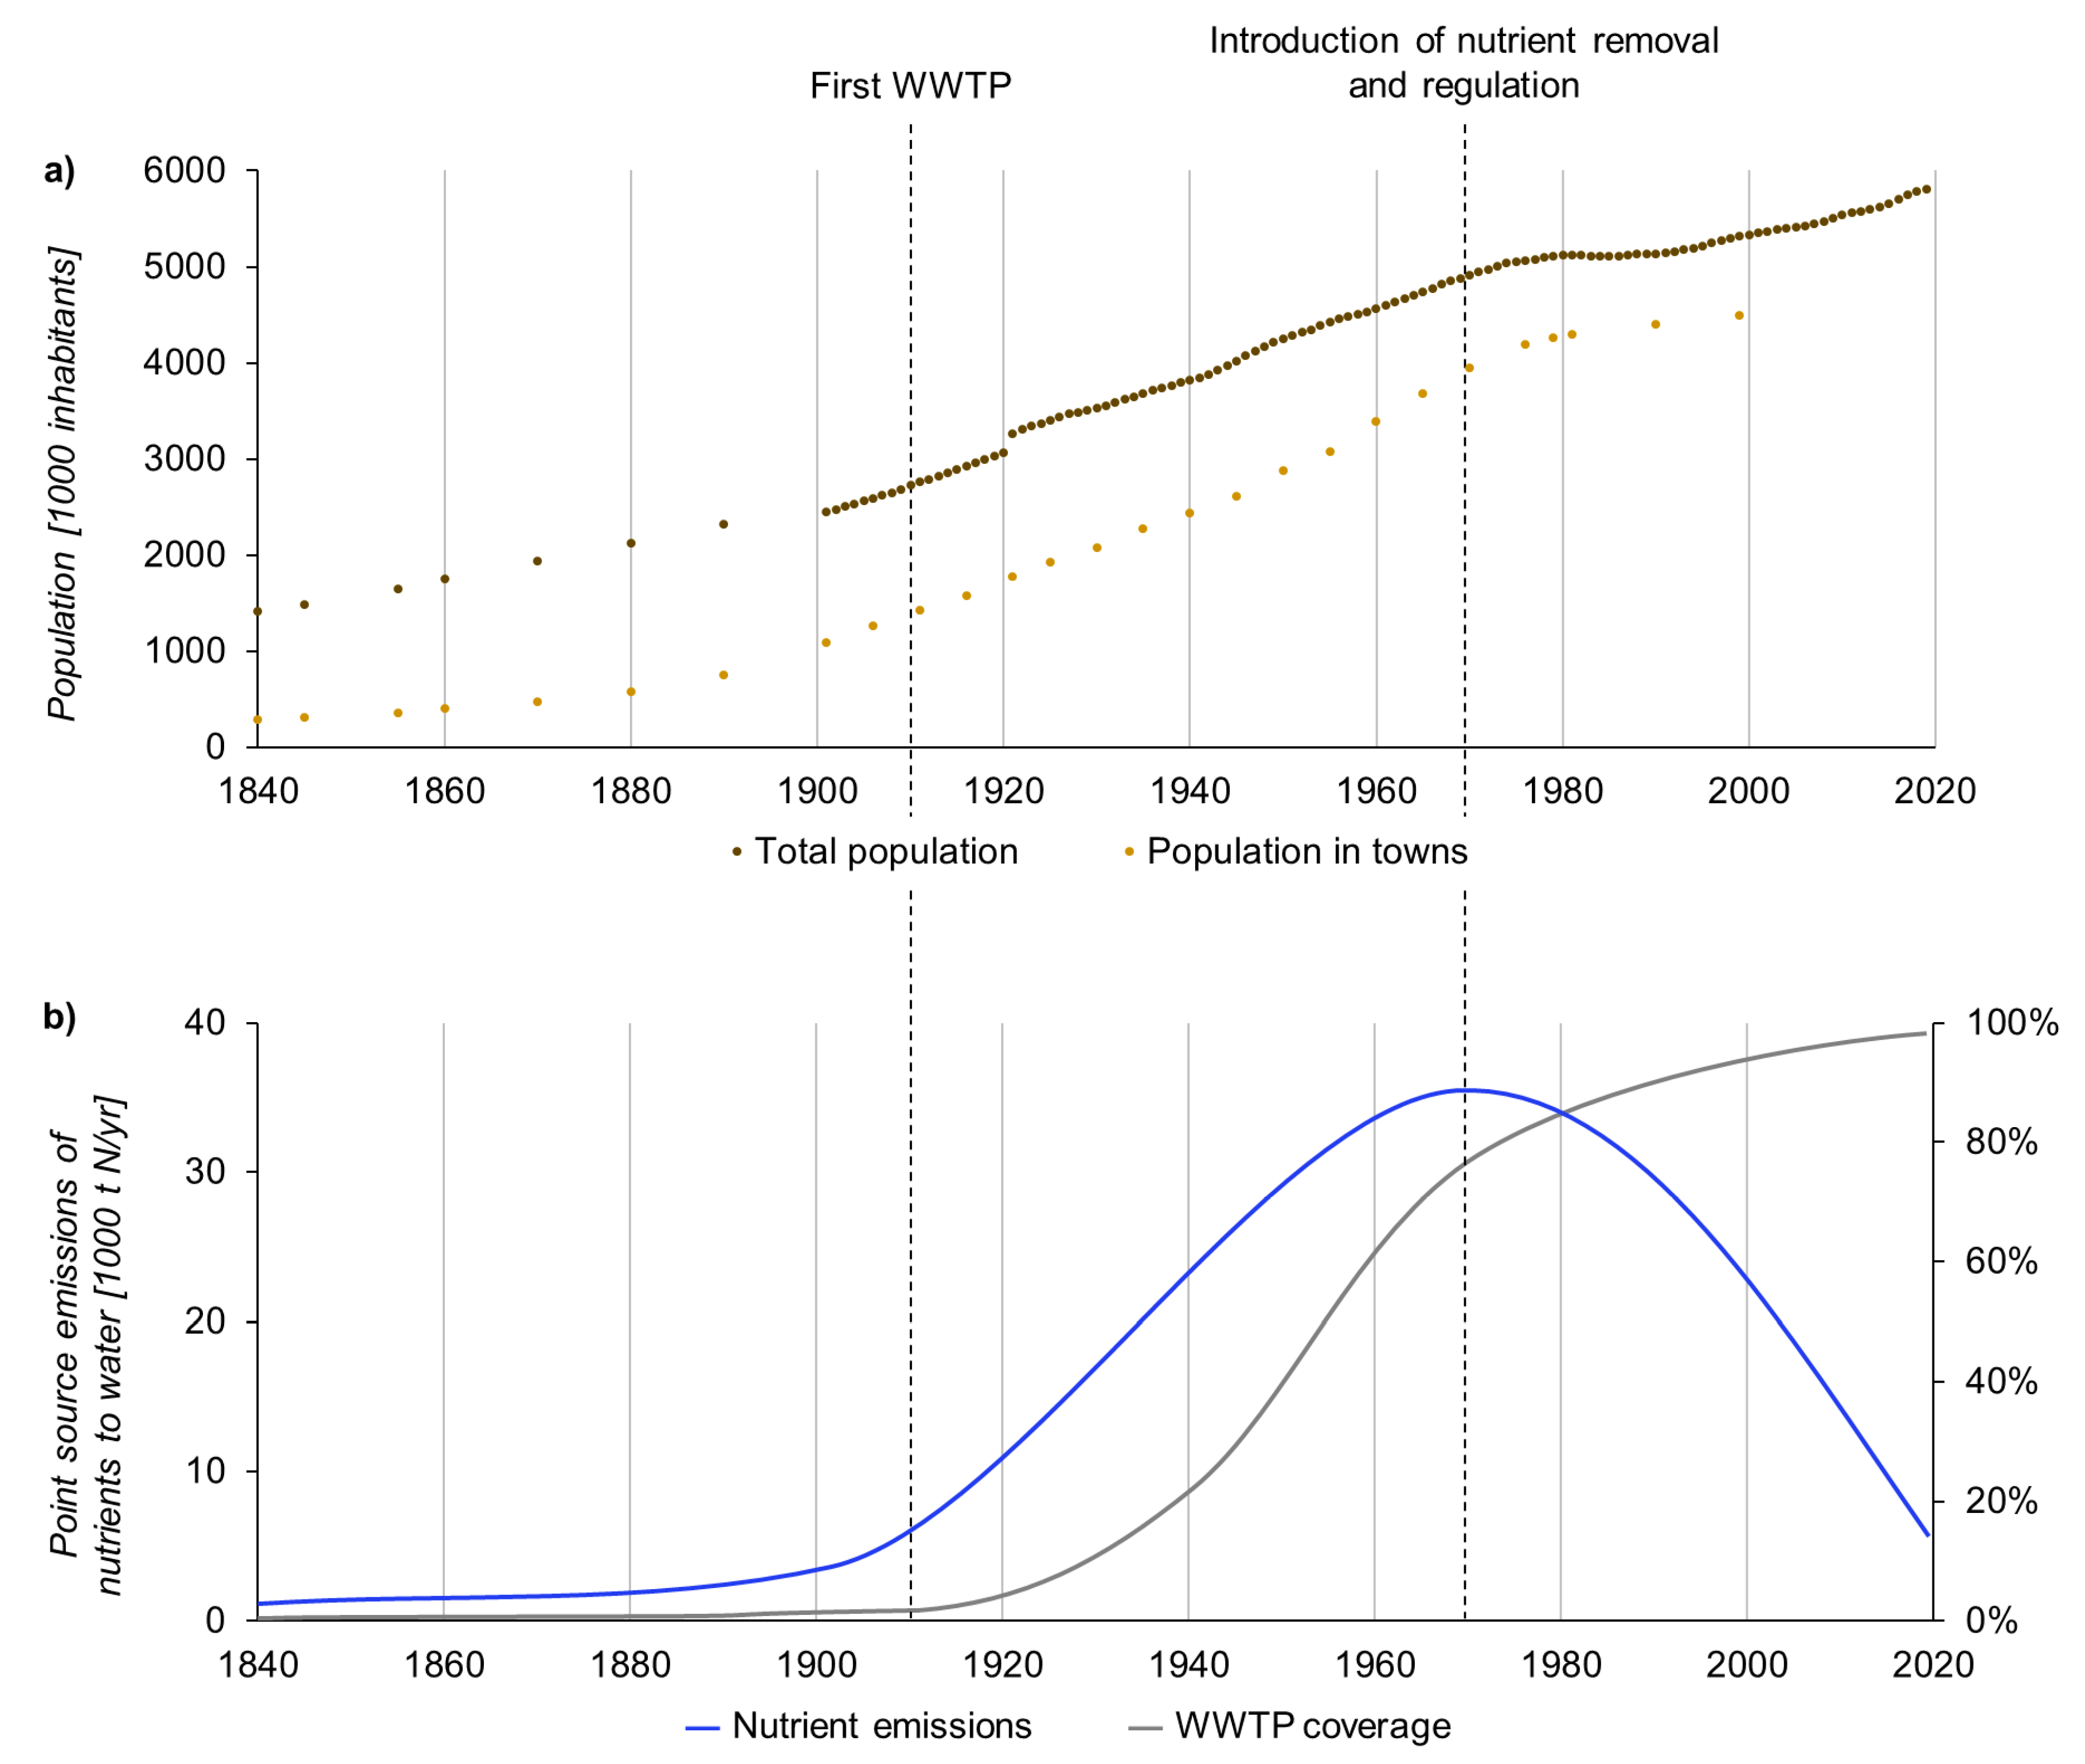
The EU Water Framework Directive proposes using historical data for defining acceptable reference conditions, if no undisturbed site is available [5,6]. The aim is to reinstate pre-industry emission levels in order to approximate an undisturbed nutrient cycle and limit adverse environmental impacts. In Denmark, the year 1900 has been defined as the reference year for determining a high ecological status of coastal waters due to data availability [7]. However, it is questionable if the condition of surface waters can be described as undisturbed at that point in time (Figure 1).
The year 1900 is characterized by rapid societal and technological changes in Denmark. Large parts of the population migrated to towns in the second half of the 19th century and by 1901, 39% of the Danish population lived in towns [8]. Industries centred around towns were growing, while agriculture remained the predominant income source in more rural areas [14,15]. Emissions from industries were largely unregulated, and wastewater treatment did not exist [16]. An increasing population implied a higher focus on sanitation by installing hygienic barriers between humans and excrements and other waste [17,18]. However, the rate of technology uptake varied significantly between towns. While underground sewers were widely installed in Copenhagen by 1900, smaller towns still used bucket latrines for human excrements (faeces and urine) and wastewater was discharged in open gutters or collected in dumpsites. Simple septic tanks were first introduced around 1900 and the first wastewater treatment plants were constructed in the 1920s [13]. Although no national assessments based on reliable measurements are available before 1989, a steady increase of nitrogen and phosphorous emissions can be assumed due to industrialisation and population growth [11]. This development only ended due to the introduction of nutrient removal at the wastewater treatment plants, stricter regulations for wastewater discharges in the 1970s and regulation of agricultural discharges from 1985 (Figure 1). Measurements show substantial decreases in nutrient loads to receiving waters from both diffuse and point sources after 1990 [11,12]. This estimated trend is in line with published data from European lakes, where long-term historical measurements or paleolimnological records are available, e.g., Lake Constance in Germany [19] and Loch Leven in the UK [20].
The evolution of water use and sanitation has been described qualitatively on global and national level, e.g., from a technical [1] or societal viewpoint [21]. Only rarely, environmental effects have been considered [22]. Qualitative descriptions of hygienic conditions and technological development in Denmark can be found in historical sources, e.g., in town chronicles [23] or public speeches and discussions [24,25]. In the past decades, these sources have been collected in reviews, often with a focus on the Danish capital Copenhagen [18,26,27]. However, if historical conditions should be used as a quantitative reference for present regulation, it is necessary to estimate emissions at a point in time with no or only insufficient measurements. Quantitative descriptions and assessments are rare, mainly focusing on economic parameters only indirectly linked to emissions, e.g., the number of buckets for human excrements or the fraction of towns using open gutters [28,29]. Historic emissions in Denmark have only been quantified for diffuse sources, using agricultural, land use, climate and hydrologic data [7]. A similar approach was chosen by Muhammed et al. [30] to model the effect of agricultural land use to the nutrient balance in the UK from 1800 until 2010. Bouraoui et al. [31] included both diffuse and point sources into their assessment of nutrient emissions to European coastal waters, but only covered more recent decades, where measurements are available. They concluded that point source emissions have contributed significantly to overall nutrient loads to receiving waters in the assessed period from 1985 to 2005. Historical point source emissions from 1800 until today were only quantified by Naden et al. [32], who estimated nutrient emissions from domestic wastewater based on population data and milestones, e.g., the introduction of the water closet or phosphorous regulations. They assumed that nutrients from human waste were emitted to receiving water only via sewers, with sewer connectivity being estimated rather than calculated based on historical documentation. Alternative discharge paths, e.g., ditches and gutters, and wastewater from animal husbandry and industry were not included. Furthermore, only direct emissions to water and no emissions to soil were considered.
For the first time, we quantify pre-industrial nutrient point source emissions from Danish towns to water and soil to serve as a reference for emission requirements. Emissions from humans, animals and industries in towns are included and the uncertainty is assessed. Novel elements of the study include the development of a method to calculate pre-industrial nutrient flows based on qualitative historical and quantitative present data. We base our estimate on the upscaling of the assessment of representative towns for which we have collected detailed data, instead of national averages. We evaluate the magnitude of calculated emissions from human activities to determine the appropriateness of the year 1900 as a reference. Further, we compare historical emissions to present day conditions to evaluate necessary changes in current practices and regulation.
2. Materials and Methods
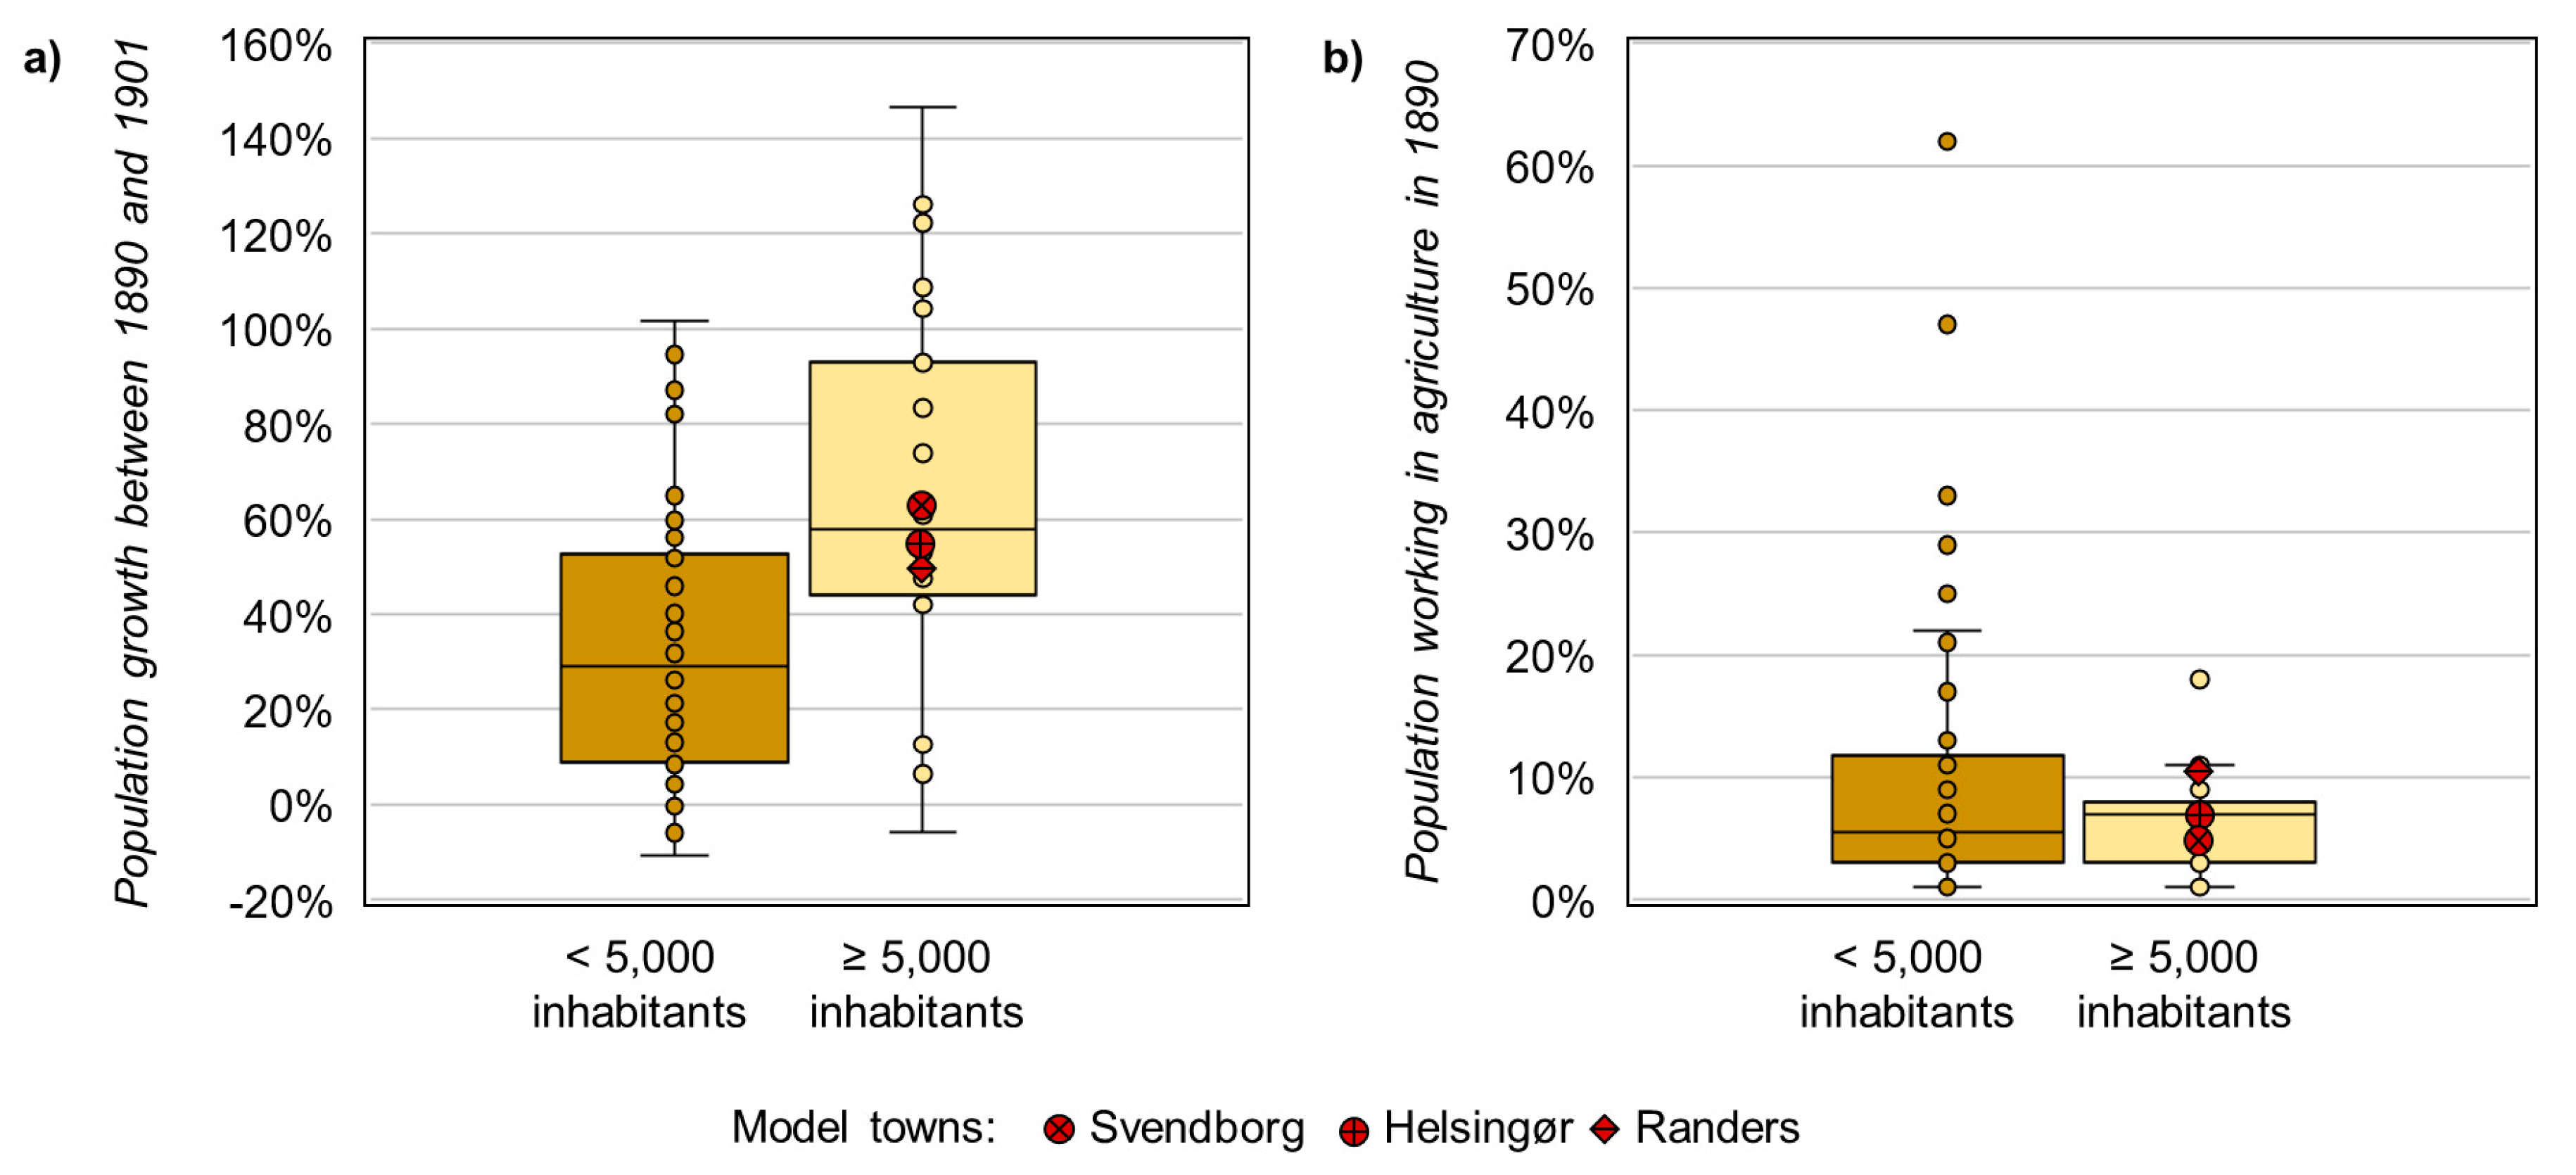
The assessment of emissions from towns first requires a definition of the term “town”. In historic sources, settlements with as little as 200 inhabitants are listed as towns [8]. We assumed that small settlements were less developed and closer to rural settlements, recirculating human and animal excrements directly as fertilizer on fields and in gardens. These emissions are considered non-urban, diffuse sources of nutrient emissions and are hence not included in this study. We defined a population threshold of 5000 as a minimum to be included in the assessment. We tested this cut-off criterion by analyzing two parameters, which are well-documented and reflect the transformation of Danish towns around the turn of the century: The population growth in individual towns and the fraction of the population working in agriculture, i.e., the occupation pattern. Both parameters were evaluated for towns (more than 5000 inhabitants) and settlements (less than 5000 inhabitants) to identify correlations and trends.
An individual assessment of nutrient cycles for each town was impossible due to limited or missing documentation for large parts of the country. Instead, we selected a set of model towns with representative characteristics and analysed these in more detail to conclude typical conditions. The selection of the model towns was based on (a) proximity to median population growth and occupation pattern; (b) data availability and (c) geographical distribution.
Animals and industries were also considered as sources of nutrient emissions. Their potential significance was evaluated qualitatively based on historic data, and relevant sources were included in the assessment.
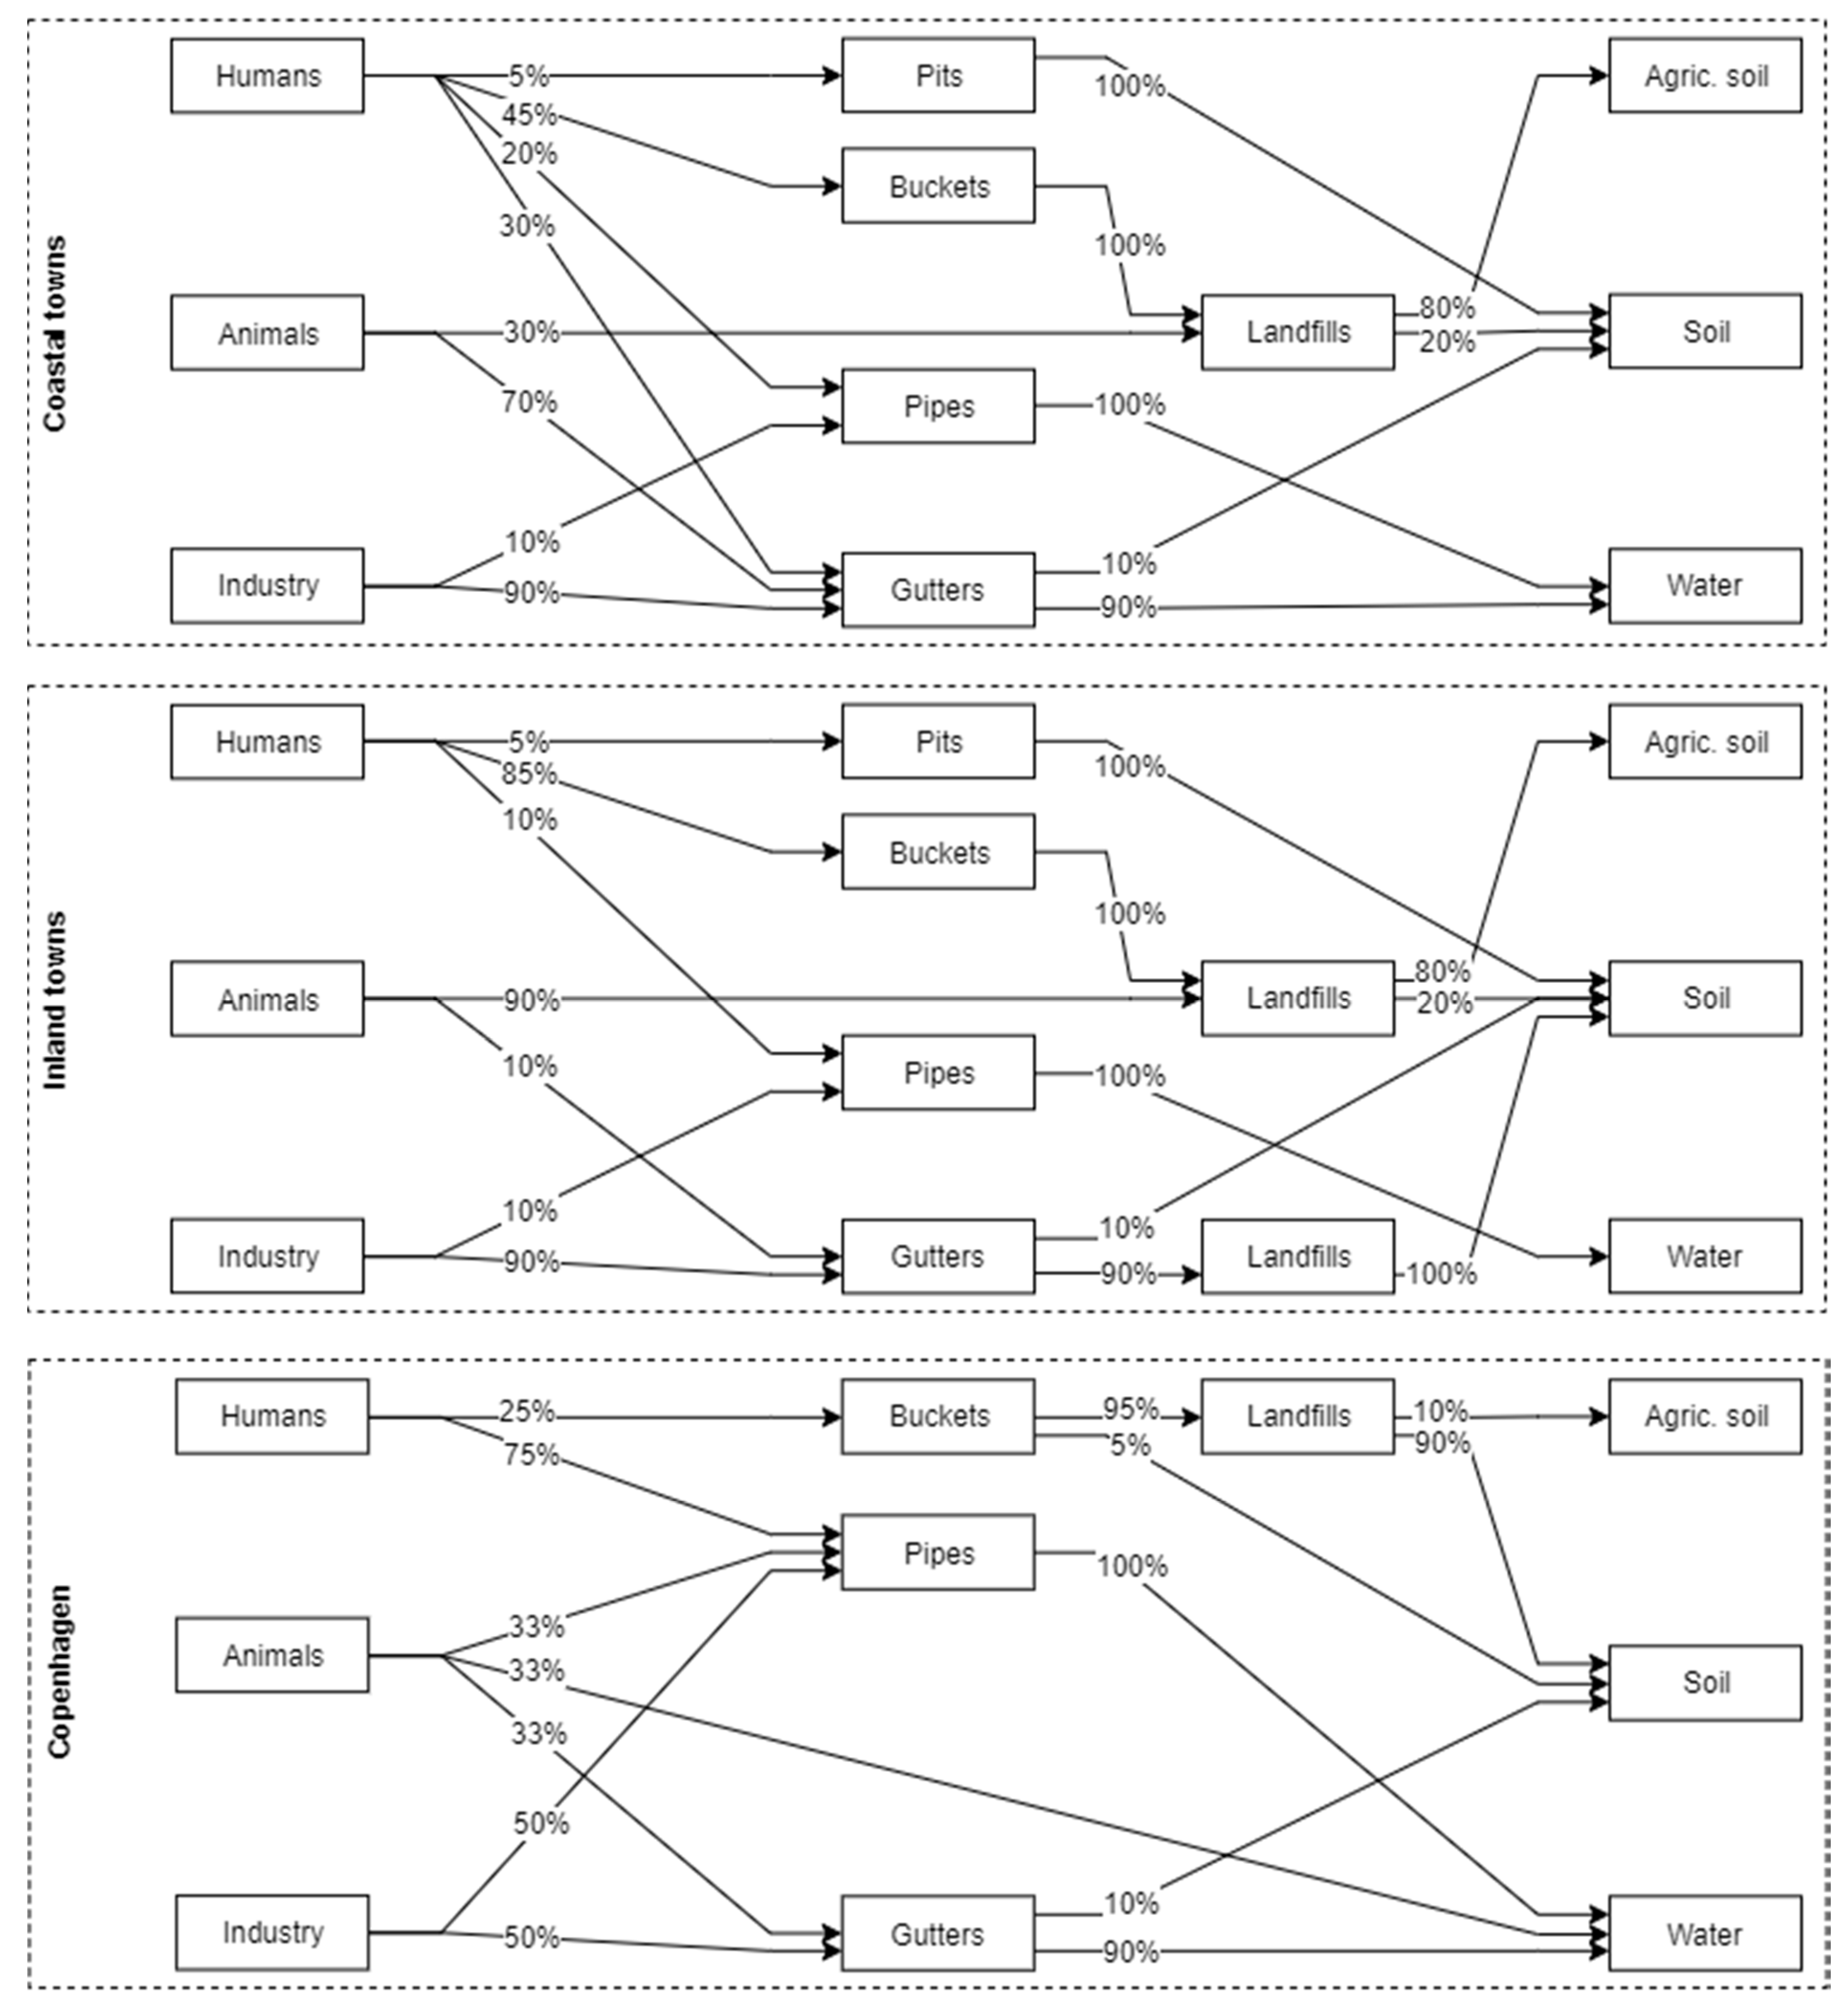
Data regarding the infrastructure, regulations and processes to collect and dispose waste from humans, animals and industry were collected from historical documents for the model towns and complemented with documentation of other towns. Quantitative data are scarce and often only provide limited information, e.g., the total length of the sewer pipes in a town, which does not allow conclusions regarding the sewer connectivity. The collected quantitative data were combined with qualitative information and then translated into quantitative flow charts specifying the flow of emissions from humans, animals and industry. Separate flow charts were developed for coastal and inland towns and Copenhagen.
The discharge of nutrients N from a person, animal or industry was termed initial nutrient emission. When possible, we used historic data records of initial nutrient emissions from animals, humans, dairies and slaughterhouses (Table 1). Where no historic data sources were available, we adjusted present day emissions by a reduction factor fred, representing the assumed ratio between historic and current emission loads.
The initial nutrient load from human excrements in town i was calculated using
The initial nutrient load from animal excrements in town i was calculated using:
Wastewater generated at slaughterhouses and dairies was limited, as piped systems were not yet implemented. We therefore used the lowest wastewater production reported for current slaughterhouses and dairies reported in literature, and combined it with the highest reported nutrient concentration [33,34].
We assumed that in every large town, there was a dairy to provide milk products for all its inhabitants [35]. To calculate emissions from dairies, we calculated the average consumption of milk per person by dividing the total dairy production by the total population [8,36]. The initial nutrient load from dairy processing in town i was calculated using:
Due to a lack of detailed data, it was assumed that each slaughterhouse processes the same amount of animals per year [36,37]. The initial nutrient loads from slaughterhouse k was calculated using:
Emissions to water, agricultural soil, and soil were calculated for each town based on the developed flow paths and calculated initial loads. Emissions to water included discharges from pipes and gutters. Excrements used as fertilizer outside of the towns were considered emissions to agricultural soil. All losses along transport routes, infiltration and disposal of waste in pits and landfills were counted as emissions to soil.
We identified three main sources of uncertainty: the flow paths of nutrients (Supplementary Figure S1), the initial load of nutrients from human and animal excrements, and the minimum population for inclusion of towns in the assessment. For each source, we tested alternative values for significant parameters and compared resulting nutrient emissions to the baseline scenario (Table 2).
3. Results
3.1. Cut-Off Criteria and Model Towns
In 1900, 29 towns had 5000 or more inhabitants, which in total accounts for 34% of the total Danish population in 1900 [8]. These towns showed widely varying characteristics, with population growth ranging between −6% and +773% between 1880 and 1901 (median: +58%) and the fraction of the town population working in agriculture ranging between 1% to 18% in 1890 (median: 6%) [8,38]. Analysing these parameters for smaller settlements with less than 5000 inhabitants reveals a difference between settlements and towns: The population growth of settlements is distinctively lower, with a median increase of only 29%, compared to 58% for towns. Furthermore, occupation patterns dominated by agriculture only occur in smaller towns, with up to 62% of the population working in farming or fishing (Figure 2). The cut-off criteria, excluding all smaller settlements due to their rural characteristics, is therefore considered valid for a nation-wide assessment. However, there is no clear correlation between population size and population growth or occupation patterns. This is reflecting the extremely dynamic development of towns around the turn of the century, with some settlements exploding in size, while others rapidly diminishing [38]. Industrialisation and societal changes have not developed evenly throughout the country, making generalisations difficult.
To approximate typical conditions, three model towns with representative characteristics were analysed in more detail. Svendborg, Helsingør, and Randers were selected as their population growth and occupation patterns were close to median values (Figure 2). Furthermore, they are geographically distributed over Denmark (Zealand, Funen and Jutland) and historic data was available. All model towns, like most larger towns at the time, were connected to the railway, which enabled trade and industrial growth [39,40]. Svendborg and Helsingør have direct access to the sea, which most often was an important factor for growth and industrialisation. Randers is connected to the sea by the river Gudenå, entering Randers Fjord, and is therefore considered to have the characteristics of a coastal town. Five inland towns not located at the coast or at a major water body with direct connection to the sea were assessed separately. We also analysed Copenhagen individually, since its size and level of industrialisation was distinctively different from all other Danish towns. In 1900, roughly 500,000 people lived in Copenhagen, which accounted for 45% of the Danish town population and 19% of the total population [8].
Even with agriculture not being the main source of income for the majority of town population, animals were often held for self-supply in the beginning of the 20th century [36,41,42]. In total, more than 40,000 animals were held in towns in 1900, with horses and cattle each accounting for one third of animals, followed by pigs, sheep and goats [43]. Excrements of these animals were included as a source of nutrient emissions in the assessment.
Slaughterhouses, dairies and tanneries were present in all model towns. We made a general assumption that resources were used as efficiently as possible and by-products were often reused in industry. The organic waste of breweries was fed to cows, and the skimmed milk was redistributed from dairies to farms as feed for animals [36,44]. This limited the nutrient emissions of industry in 1900. Tanneries were assumed to mainly emit toxic substances, especially chromium, and were therefore not considered as a significant nutrient source. While big dairies were primarily found in towns with more than 5000 inhabitants, large slaughterhouses were also located in smaller towns [37]. To include every significant industrial source of nutrient emissions, all large slaughterhouses (also outside towns) and large dairies (in towns) were included in this assessment.
3.2. Discharge Paths for Excrements and Wastewater
In the 19th century, most Danish towns changed from having simple pits for human waste towards a bucket system [26,28,45]. In 1899, 44 out of 72 Danish towns had a bucket system and 29, at least partially, had pits for human waste [29]. All three model towns had almost completely shifted towards a bucket system in the year 1900. However, only some towns, e.g., Randers, had organized collection and disposal of these buckets by private companies, which sold the buckets to surrounding farmers [46]. Excrements of humans and animals were the main source for fertilizer used in agriculture in 1900, with artificial fertilizer only accounting for 7% [47]. In many cases, small dumpsites inside or on the border of the town were used to discharge both human and animal waste, often with significant spill during the transport from the individual households [48]. These dumpsites were emptied by surrounding farmers only one to two times per year [28]. The resulting stench and hygienic problems were perceived as annoyances, e.g., in Svendborg [23]. We therefore suspect that the preferred way of disposal was by direct discharge to water and that dumpsites were mainly used in towns with limited access to water, i.e., in inland towns (Figure 3).
Water closets (WC) were very rarely installed in 1900. Only 44 WCs were reported in Helsingør [49] and approximately 100 in Randers, which were connected to septic tanks which often overflowed [46]. WCs were slowly implemented in Copenhagen (around 5000 in 1900), where it was legalised to connect WCs to the subsurface sewer system in 1897 [50]. A resistance against connecting WCs to sewers was mainly based on economic reasons: The estimated 30,000 buckets in Copenhagen were collected at night and transported to four dumpsites outside of Copenhagen, from which they were sold to farmers [44]. The fraction of sold buckets decreased steadily during the 19th century, and in 1900 it was less than 10% (Supplementary Table S1) [28]. Industrial discharges were largely unregulated not only in smaller towns, but also in Copenhagen, and direct discharges to nearby surface waters were very common in the 19th century, which is e.g., documented for tanneries and slaughterhouses [44,51].
Gutters largely replaced ditches in the 19th century, which decreased, but could not completely prevent infiltration of wastewater [26,46]. The installation of sewer and water distribution pipes began in the end of the 19th century in all three model towns [23,26,46]. The development of sewers often focused on the town centre and specific problematic areas like slaughterhouses, as e.g., reported for Esbjerg [52]. While some towns, e.g., Roskilde, already were completely connected to sewers in 1900, others still only had gutters [26,53]. Wastewater from pipes and gutters was often discharged directly to the nearest surface water body, e.g., to Gudenåen in Randers [54]. If a direct connection to surface water was not possible or feasible, we presumed that wastewater was discharged to dumpsites outside the town, as reported e.g., for parts of Svendborg [23] (Figure 3).
Around 250,000 people moved to Copenhagen around the change of the century because of rapidly growing industries and connected job possibilities. There was a severe lack of housing and families were often forced to live in basements or one-room apartments [55]. This development accelerated the installation of pipes and gutters, leading to an extensive sewer system already in 1900 [18,27,56]. The system was initially designed for industrial wastewater, but it is estimated that 75% of human excrements were discharged to sewers illegally by either disposing excrements through the kitchen pipes or by throwing them on the streets, even before it was legalised in 1897 [18,44]. Pipes and gutters discharged to canals, lakes, and the harbour with a direct connection to the open sea [28], which lead to a high level of pollution in surface water bodies. Sources of the time described the canals and lakes malodorous and portrayed the sea between Køge and Copenhagen as brown [57,58].
3.3. Initial Emissions
Reported emissions of nutrients in human excrements are around 4 kg N/pers/year and 0.7 kg P/pers/year [31,32,59,60,61,62]. The relative consumption of carbohydrates like grains and potatoes was higher and vegetables, fruit and protein rich food sources like dairy products and meat were less available in 1900 compared to current conditions [63]. A lower intake of these food groups leads to lower nutrient emissions [31]. Furthermore, the total calorie intake was around 25% lower than today [55,64]. We therefore estimated 25% less nutrient emissions per person in 1900 than current emissions, which using Equation (1) leads to initial emissions of 3.0 kg N/pers/year and 0.5 kg P/pers/year (Table 3 and Supplementary Table S1).
The excretion of nutrients from animals depends on the ability to process nutrients and the feed. Pigs, e.g., cannot process phosphorous, and therefore excrete a large fraction of the intake [65]. Protein rich feed reduces the nitrogen demand and excretion, which was not known in 1900 [65]. We therefore assumed a 25% decrease in addition to using minimum emissions reported for present conditions [66]. Using Equation (2), initial emissions were calculated as 6.5 to 45 kg N/animal/year and 1.3 to 7.5 kg P/animal/year (Table 3). Numbers of animals were available for 26 out of 29 towns [43]. For the remaining three towns, the median number of animals in all other towns was used to calculate total emissions.
Modern dairies produce a minimum of 0.5 L of wastewater per produced litre of dairy products, which contains a maximum of 663 mg N/L and 154 mg P/L [34]. In 1900, a total of 2,460,000 t of dairy products were produced [36]. Initial emissions from dairy production of 0.3 kg N/pers/year and 9.1 kg P/pers/year were calculated using Equation (3) (Table 3).
A total of 72,800 t of cattle, 3000 t of horses, 116,600 t of pigs and 17,000 t of sheep were processed in large Danish slaughterhouses [36]. Modern slaughterhouses produce a minimum of 3000 L of wastewater per t of throughput, with maximum concentrations of 1.4 mg N/L and 0.1 mg P/L [33]. Using Equation (4), this leads to initial emissions of 27 kg N/year and 2 kg P/year per slaughterhouse. Randers, Esbjerg, and Odense had larger productions due to their position and importance for trade [37]. For these three towns, we assumed twice the calculated initial emissions from slaughterhouses.
3.4. Emissions from Towns to Water, Soil and Agricultural Soil
Emissions from humans, animals and industry were calculated for each town individually (Figure 4). A total of 4261 t nitrogen and 764 t of phosphorous were emitted from towns and slaughterhouses in 1900. The largest share of emissions was discharged to water (2531 t N/year, and 462 t P/year). Emissions to soil (811 t N/year and 143 t P/year) and agricultural soil (919 t N/year and 159 t P/year) were also significant. Copenhagen was the largest single point source of nitrogen and phosphorous (53%). Coastal towns contributed with 47% and less than 1% of the total nutrient emissions stemmed from inland towns (Table 4).
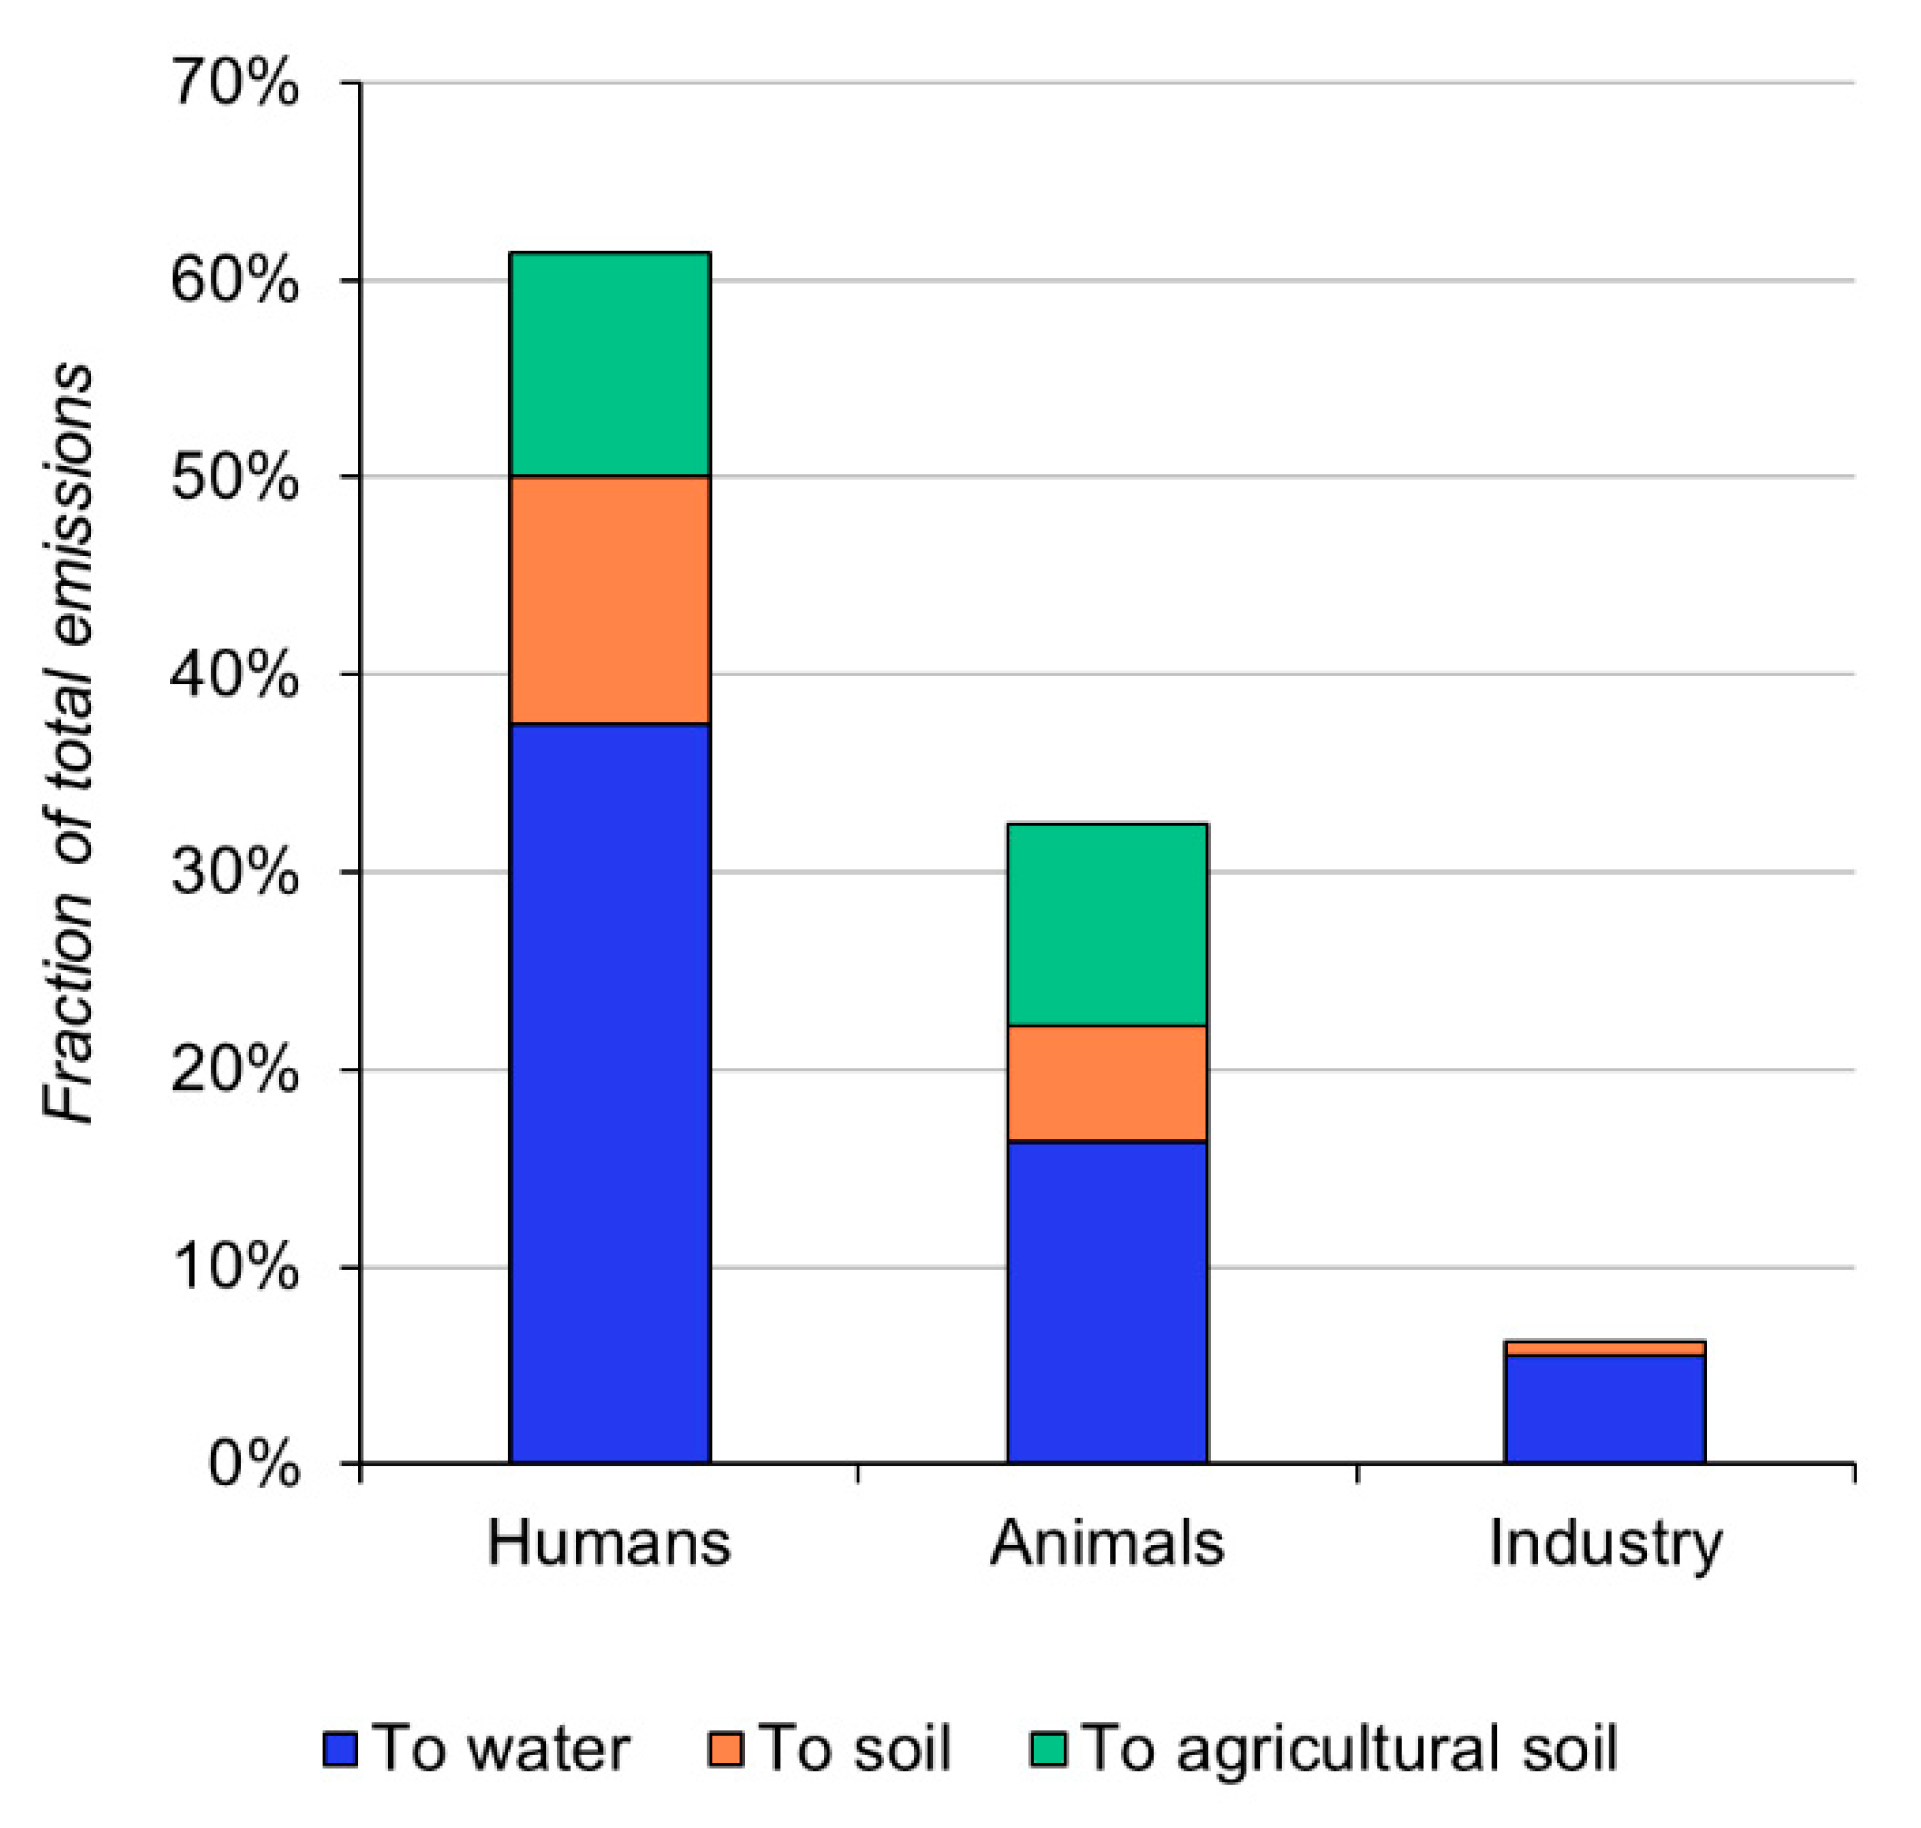
Further, 61% of nutrients emitted from towns stemmed from human excrements (2615 t N/year and 449 t P/year). The second most important emission source in towns were animals (1382 t N/year and 243 t P/year). Initial emissions from industry were one order of magnitude lower than emissions from humans or animals (264 t N/year and 72 t P/year). The majority of nutrients from all three sources was discharged directly to receiving water bodies (60%). Moreover, 21% of nutrients were used as fertilizer on agricultural soil, stemming to almost equal parts from humans (482 t N/year and 81 t P/year) and animals (437 t N/year and 77 t P/year). Industrial wastewater was not used as fertilizer on agricultural soil. Nutrients emitted to soil via landfills, pits, and transport spills significant stemmed from human excrements (533 t N/year and 92 t P/year), which were often transported in buckets (Figure 5 and Supplementary Figure S1).
3.5. Main Uncertainties
Nutrient emissions to water were most sensitive to changes in the initial load of nutrients in animal and human excrements (Figure 6). In the baseline scenario, we estimated a 25% reduction of values reported for present conditions. Assuming no reduction increases the emissions by 30%, and a reduction factor of 50% of present values decreases the emissions by 30%. The excretion of nutrients correlates directly to the nutrient intake, a highly uncertain parameter, as no measured values exist for 1900. A more accurate estimate would require analysing diet and feed in more detail. The inclusion of smaller towns with less than 5000 inhabitants lead to a maximum increase of 12% in resulting emissions to freshwater. Similarly, changes in the flow path did not cause significant changes to the resulting nutrient emissions to water (−4% to +4%). We did not differentiate flow paths for solid and liquid waste, which carry different fractions of the initial nutrient loads. Urine contains more nitrogen and infiltrates more easily than faeces, which possibly led to higher emissions of nitrogen than phosphorous to soil. A detailed assessment of the different paths lies outside the scope of this assessment.
The calculated emissions are based on average conditions in Danish towns in 1900. However, towns were developing very differently and the source and fate of emissions varied widely. It has not been the scope of our study to conduct a detailed mapping of nutrient emissions and routing for each individual town and therefore our results must be interpreted with caution for individual towns. The values are, as such, a qualified indication of magnitude rather than an exact account of nutrient loads from point sources in 1900 because the focus has been on obtaining a robust national estimate of emissions. A more detailed assessment of individual towns and industries, based on a review of local historic archives, could develop town specific mass balances. This would improve the assessments of emissions to local surface waters, but would be problematic due to limited data availability and is not expected to markedly affect the calculated national estimate.
4. Discussion
Nutrient emissions from human activities were significant already in 1900. Historical sources describe surface waters at that time as brown, foul-smelling sources of diseases. The construction of sewers was a reaction to the unsanitary conditions in growing towns, aiming to transport waste away from humans and towards surface waters. These historical observations challenge the choice of the year 1900 as a reference to describe undisturbed conditions.
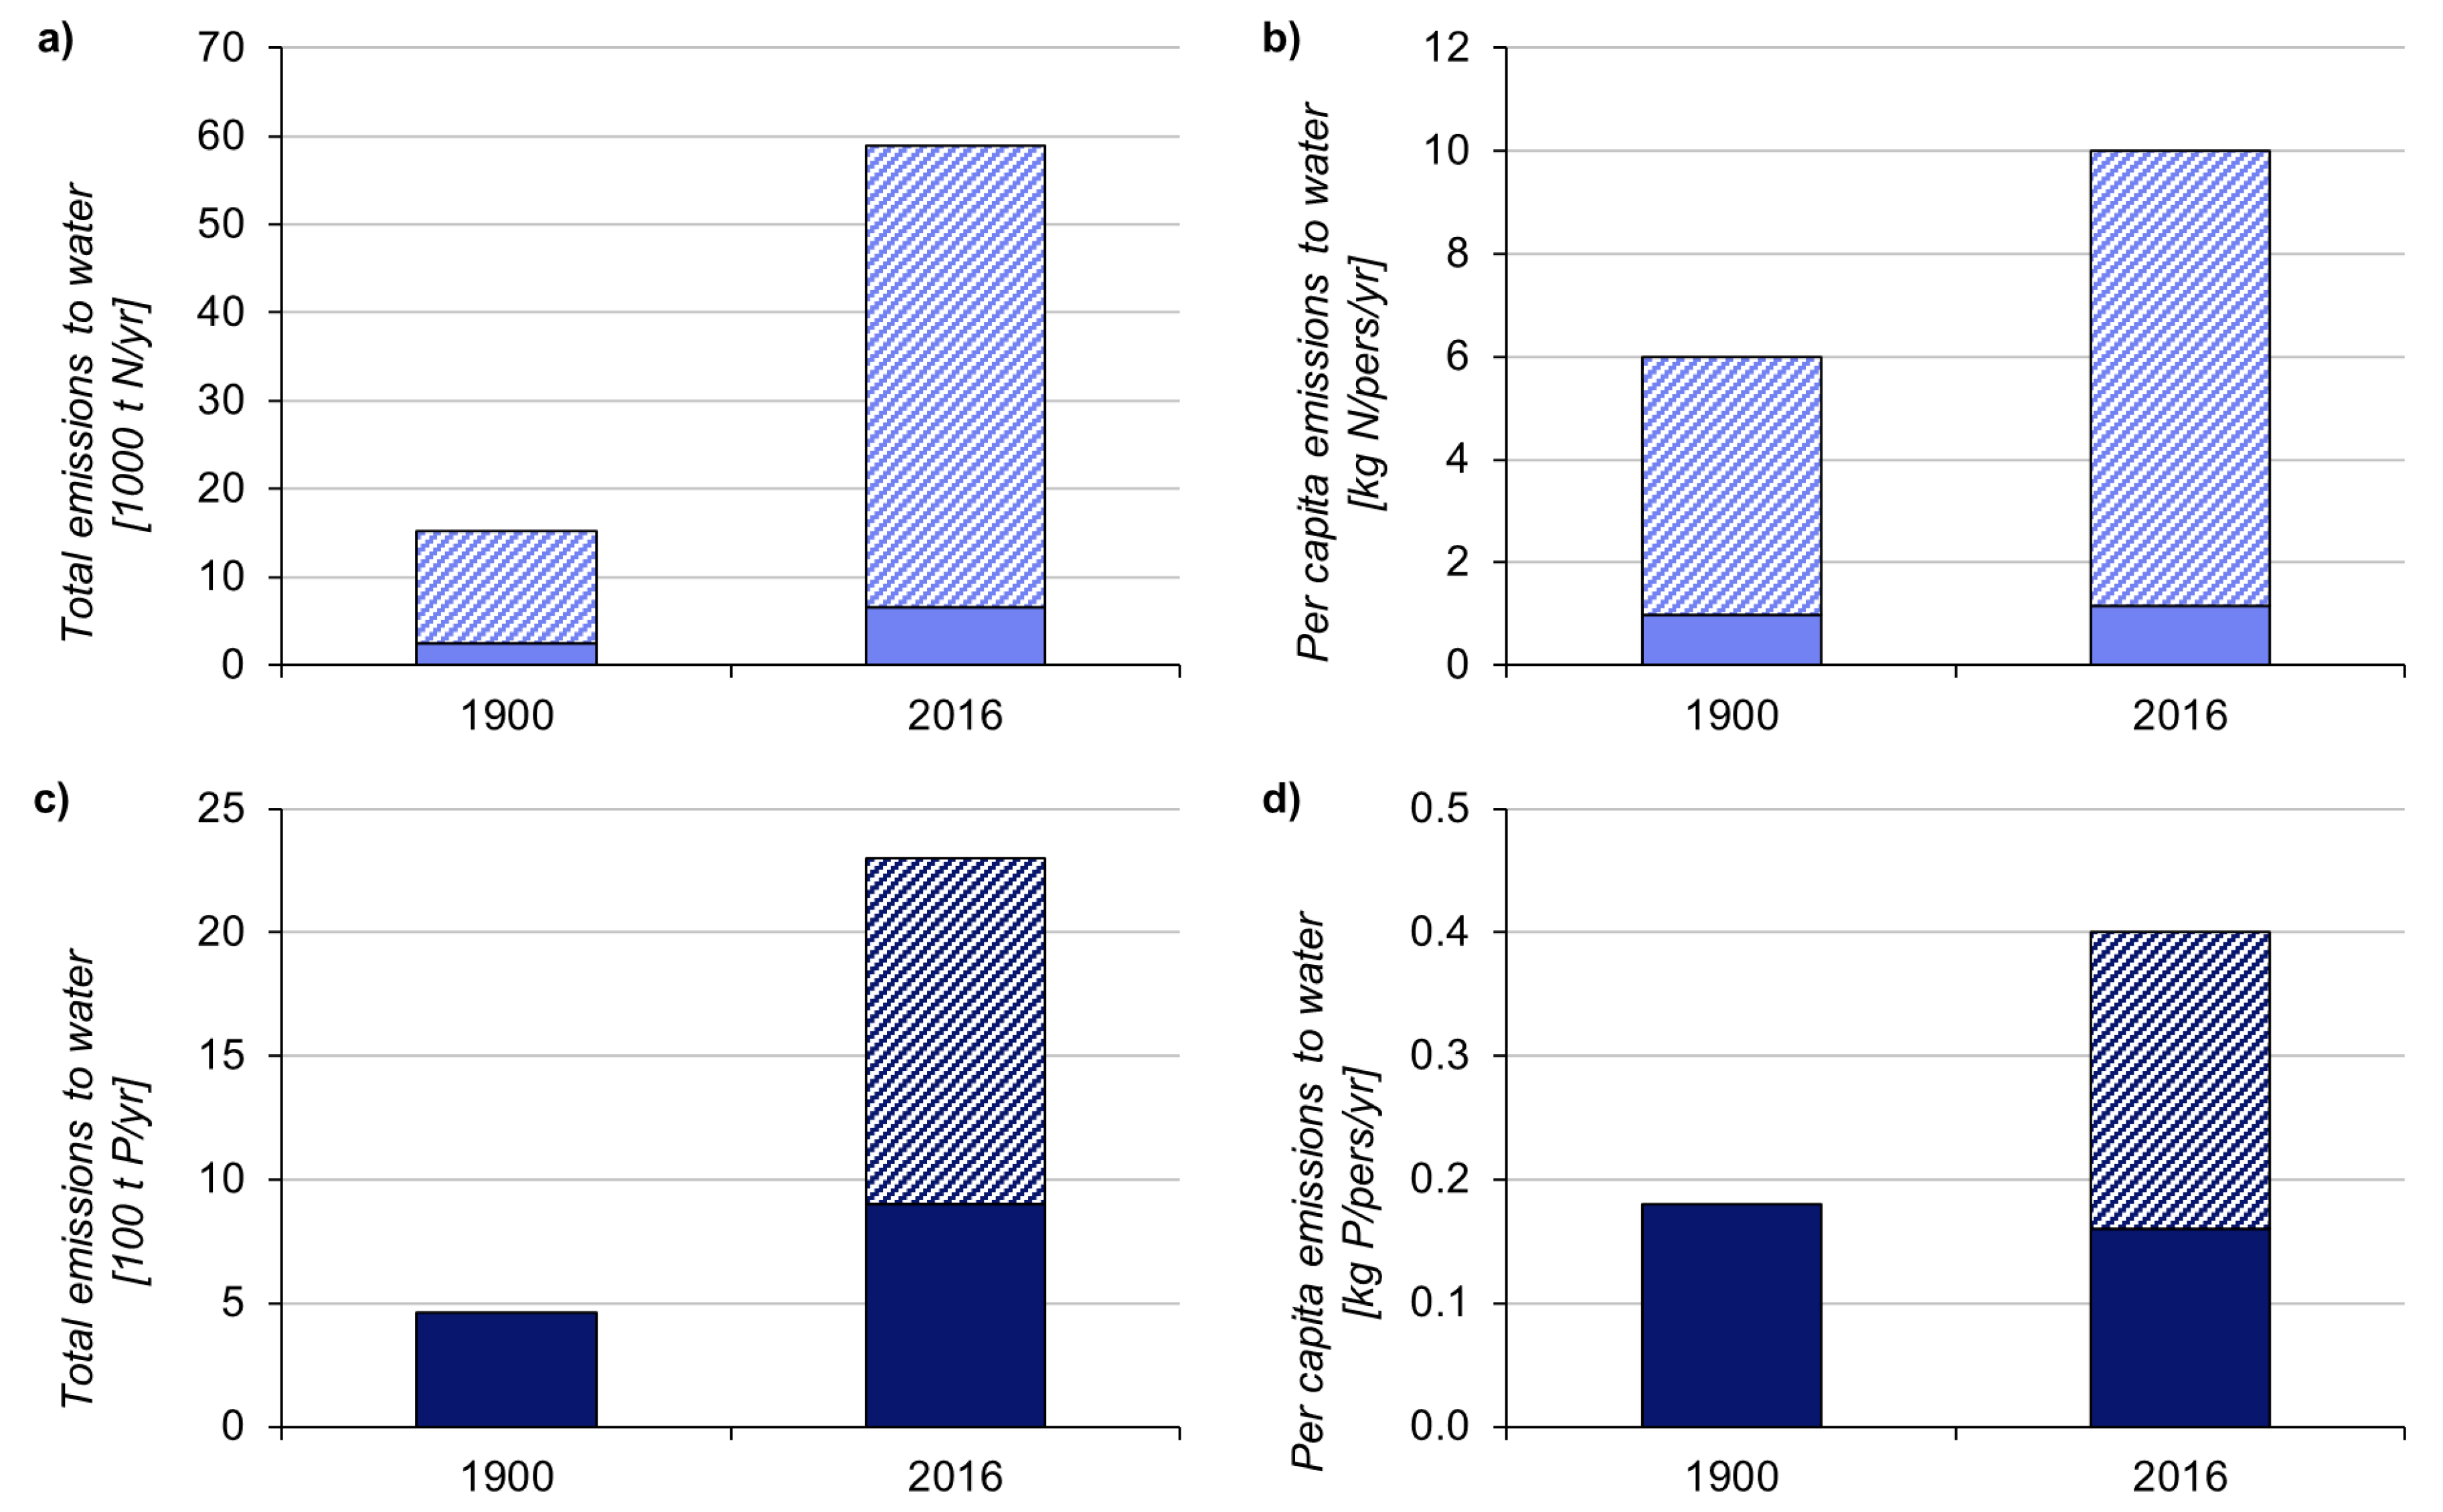
When looking at absolute nutrient emissions, we observe a significant increase since 1900. Point source emission to water increased from 2531 t N/year and 462 t P/year in 1900 to 6600 t N/year and 900 t P/year in 2016 [68] (Figure 7). This is an increase of 161% for nitrogen and 95% for phosphorous point source emissions, which is mainly caused by a growing population (+121% between 1900 and 2016) [8,69]. However, if we normalize point source emissions to the total population, we see that point source emissions did not grow proportionally to population. Per capita point source nitrogen emissions increased more moderately (18%, from 0.97 kg N/pers/year to 1.15 kg N/pers/year), and phosphorous emissions even slightly decreased (−11%, 0.18 kg P/pers/year to 0.16 kg P/pers/year) between 1900 and 2016 (Figure 7). This is due to technological advances and increased WWTP coverage, where more than 80% of nutrients are removed [70] (Figure 1). This further questions the suitability of the year 1900 as a reference condition, as per capita emissions were not significantly lower than today.
Besides point source emissions, diffuse sources of nutrients have to be considered when defining emission requirements. Assuming 1.2 mg N/L and 250 mm national average runoff in 1900, 12,718 t of nitrogen were discharged from agricultural areas to water in 1900 [7]. Together with point source emissions, this leads to an estimated 15,249 t N/year emitted to water in 1900. In 2016, a total of 59,000 t N/year was emitted to water [71], of which 6600 t stemmed from point sources [68]. While total nitrogen emissions increased by 287% between 1900 and 2016, the relative contribution of emissions from point sources decreased from 17% to 11%. Since no data for phosphorous emissions from diffuse sources in 1900 are available, we cannot make the same comparison of total emissions.
We can observe the same trends, but more moderately, when we normalize total emissions to population. Total per capita emissions increased by 53% (10 kg N/pers/year to 7 kg N/pers/year), with the contribution of point sources emissions decreasing from 18% to 13% (Figure 7). This shows that emissions from diffuse sources increased more than point source emissions, indicating a need for stricter regulation especially for emissions from diffuse sources. This also highlights the importance of choosing a reference frame. The need to reduce emissions is more pronounced when looking at absolute emissions, than when we normalize emissions to account for population growth. Achieving emissions levels as in 1900 would require significant reductions in both diffuse and point source emissions. However, this would not be sufficient to accomplish undisturbed conditions, which would require further and more drastic removal of nutrients from both agricultural runoff and urban discharges.
Supplementary Materials
The following are available online at https://www.mdpi.com/2073-4441/12/3/789/s1, Table S1: detailed calculations and references for each emission source and individual towns, Supplementary Figure S1: alternative flow charts for uncertainty analysis.
Author Contributions
The authors contributed to this article as follows: conceptualization, S.B., M.R. and K.A.-N.; methodology, S.B., M.R., K.A.-N. and M.T.; data collection and literature review, S.B., C.B., M.T. and E.B.J.; calculations, S.B.; uncertainty analysis, S.B.; writing—original draft preparation, S.B.; writing—review and editing, S.B., M.R., K.A.-N., C.B., M.T. and E.B.J.; visualization, S.B. and M.R.; supervision, M.R.; project administration, M.R.; funding acquisition, K.A.-N. All authors have read and agreed to the published version of the manuscript.
Funding
This research was funded by the Environmental Protection Agency Denmark.
Acknowledgments
The authors would like to thank Dan Rosbjerg for providing help finding relevant literature and giving feedback.
Conflicts of Interest
The authors declare no conflict of interest.
References
- de Feo, G.; Antoniou, G.; Fardin, H.F.; El-Gohary, F.; Zheng, X.Y.; Reklaityte, I.; Butler, D.; Yannopoulos, S.; Angelakis, A.N. The historical development of sewers worldwide. Sustain 2014, 6, 3936–3974. [Google Scholar] [CrossRef] [Green Version]
- United Nations. The Sustainable Development Goals Report 2019; United Nations Publications: New York, NY, USA, 2019. [Google Scholar]
- Rockström, J.; Steffen, W.; Noone, K.; Persson, Å.; Chapin, F.S.; Lambin, E.; Lenton, T.M.; Scheffer, M.; Folke, C.; Schellnhuber, H.J.; et al. A safe operating space for humanity. Nature 2009, 46, 472–475. [Google Scholar] [CrossRef] [PubMed]
- Steffen, W.; Richardson, K.; Rockström, J.; Cornell, S.E.; Fetzer, I.; Bennett, E.M.; Biggs, R.; Carpenter, S.R.; de Vries, W.; de Wit, C.A.; et al. Planetary boundaries: Guiding human development on a changing planet. Science 2015, 347. [Google Scholar] [CrossRef] [PubMed] [Green Version]
- European Commission. Common Implementation Strategy for the Water Framework Directive (2000/60/EC). Guidance Document No. 5. Transitional and Coastal Waters—Typology, Reference Conditions and Classification Systems; Office for Official Publications of the European Communities: Luxembourg, 2003; Volume 5. [Google Scholar]
- European Commission. Common Implementation Strategy for the Water Framework Directive (2000/60/EC). Guidance Document No. 10. River and Lakes—Typology, Reference Conditions and Classification Systems; Office for Official Publications of the European Communities: Luxembourg, 2003. [Google Scholar]
- Poulsen, J.R.; Thodsen, H.; Larsen, S.E.; Ovesen, N.B.; Kronvang, B.; Chrisensen, B.T.; Olesen, J.E.; Eriksen, J.; Ellermann, T.; Christensen, J.H.; et al. Estimation of Nitrogen Concentrations from Root Zone to Marine Areas Around the Year 1900. In Scientific Report from DCE—Danish Centre for Environment and Enegery No. 241; Jensen, P.N., Ed.; Aarhus Univerity, DCE—Danish Centre for Environment and Energy: Aarhus, Denmark, 2017. [Google Scholar]
- Matthiessen, C.W. Danske Byers Folketal 1801–1981; Statistiske Undersøgelser Nr. 42; Danmarks Statistik Trykkeri: Copenhagen, Denmark, 1985. [Google Scholar]
- Statistics Denmark. Nøgletal om Befolkningen (HISB3); Statistics Denmark: Copenhagen, Denmark, 2019; Available online: www.statistikbanken.dk/HISB3 (accessed on 18 February 2019).
- Statistics Denmark. Befolkningen i 150 år; Danmarks Statistiks trykkeri: Copenhagen, Denmark, 2000. [Google Scholar]
- Ertebjerg, G.; Andersen, J.H.; Hansen, O.S. Nutrients and Eutrophication in Danish Marine Waters. A Challenge for Science and Management; Ertebjerg, G., Andersen, J.H., Hansen, O.S., Eds.; Ministry of the Environment, Danish Environmental Protection Agency & National Environmental Research Institute: Copenhagen, Denmark, 2003.
- Jeppesen, E.; Sndergaard, M.; Lauridsen, T.L.; Kronvang, B.; Beklioglu, M.; Lammens, E.; Jensen, H.S.; Kohler, J.; Ventela, A.M.; Tarvainen, M.; et al. Danish and other European experiences in managing shallow lakes. Lake Reserv. Manag. 2007, 23, 439–451. [Google Scholar] [CrossRef] [Green Version]
- Christensen, S.B. Vand i byerne—Fra middelalderen til nyere tid. In De Ferske Vandes Kulturhistorie; Ferskvands Centret: Silkeborg, Denmark, 2004; pp. 236–247. [Google Scholar]
- Hyldtoft, O. Københavns Industrialisering 1840–1914; Systime: Herning, Denmark, 1984. [Google Scholar]
- Boje, P.; Hyldtoft, O. Økonomiske, geografiske og demografiske aspekter. In Urbaniseringsprocesser i Norden: Det XVII. Nordiske Historikermøte Trondheim 1977. Del 3, Industrialiseringens Første Fase; Blom, G.A., Ed.; Universitetsforlaget: Oslo, Norway, 1977; pp. 13–94. [Google Scholar]
- Engberg, J. Det Heles Vel. Forureningsbekæmpelsen i Danmark fra Loven om Sundhedsvedtægter i 1850′erne til Miljøloven 1974; Miljøkontrollen: Copenhagen, Denmark, 1999. [Google Scholar]
- Møller, J.F. Biologismer: Naturvidenskab og Politik ca. 1850–1930. Ph.D. Thesis, Faculty of Humanities, University of Copenhagen, Copenhagen, Denmark, 2003. [Google Scholar]
- Lindegaard, H. Ud af røret? Planer, Processer og Paradokser Omkring det Københavnske Kloaksystem 1840–2001. Ph.D. Thesis, Technical University of Denmark, Kgs. Lyngby, Denmark, 2001. [Google Scholar]
- Müller, G. Clear Constance. Water Qual. Int. 1997, 9/10, 30–33. [Google Scholar]
- May, L.; Defew, L.H.; Bennion, H.; Kirika, A. Historical changes (1905–2005) in external phosphorus loads to Loch Leven, Scotland, UK. Hydrobiologia 2012, 681, 11–21. [Google Scholar] [CrossRef] [Green Version]
- Blackbourn, D. The Conquest of Nature: Water, Landscape, and the Making of Modern Germany; W. W. Norton: New York, NY, USA, 2006. [Google Scholar]
- Pritchard, S.B. Confluence—The Nature of Technology and the Remaking of the Rhône; Harvard University Press: Cambridge, MA, USA, 2011. [Google Scholar]
- Bro-Jørgensen, J.O. Svendborg Købstads Historie. Bind 2; Svendborg By: Svendborg, Denmark, 1959. [Google Scholar]
- Lassen, K.C. Om Bortførselen og Udnyttelsen af Fækalstoflerne i nogle af de større Byer i vore Nabolande. Foredrag i det Kgl. Landhusholdningsselskab den 30 November 1892. Tidsskr. Landøkonomi 1892, 5, 657–685. [Google Scholar]
- Aamodt, A.E. Dansk Ingeniørsforenings Møde om Renovationssagen (Diskussion). Ingeniøren 1894, 28, 45–52. [Google Scholar]
- Kongstad, M. Skidt, Smitteveje og Sanitet. Kloakeringens Betydning for Hygiejnen i Esbjerg ca 1880–1904; School of Culture and Society, Aarhus University: Aarhus, Denmark, 2016. [Google Scholar]
- Iversen, U.O. Byens Plan og Hygiejniske Interesser. Hygiehnebevægelsen og Byplanlægning i København 1844–1865; The Saxo Institute, University of Copenhagen: Copenhagen, Denmark, 2004. [Google Scholar]
- Gædeken, C.G.; Carøe, K.; Hoff, E.M.; Ulrik, A.; Schierbeck; Ambt, C.; Meyer, J.; Rump, J. Renovationsvæsenet i København og Danske Provinsbyer. Særtryk af Tidsskrift for Sundhedspleje; Jacob Lunds Boghandel: Copenhagen, Denmark, 1894. [Google Scholar]
- Carlsen, J.N.G. Danmarks Kultur ved aar 1900: Som Slutning af et Hundredaars Udvikling; Carlsen, J.N.G., Starcke, C.N., Olrik, H.T., Eds.; E. Bojesen: Copenhagen, Denmark, 1900. [Google Scholar]
- Muhammed, S.E.; Coleman, K.; Wu, L.; Bell, V.A.; Davies, J.A.C.; Quinton, J.N.; Carnell, E.J.; Tomlinson, S.J.; Dore, A.J.; Dragosits, U.; et al. Impact of two centuries of intensive agriculture on soil carbon, nitrogen and phosphorus cycling in the UK. Sci. Total Environ. 2018, 634, 1486–1504. [Google Scholar]
- Bouraoui, F.; Grizzetti, B.; Aloe, A. Long Term Nutrient Loads Entering European Seas. In JRC scientific and Technical Reports; Publications Office of the European Union: Luxembourg, 2011. [Google Scholar]
- Naden, P.; Bell, V.; Carnell, E.; Tomlinson, S.; Dragosits, U.; Chaplow, J.; May, L.; Tipping, E. Nutrient fluxes from domestic wastewater: A national-scale historical perspective for the UK 1800–2010. Sci. Total Environ. 2016, 572, 1471–1484. [Google Scholar] [CrossRef] [PubMed] [Green Version]
- Verheijen, L.A.H.M.; Wiersema, D.; Pol, L.W.H.; De Wit, J. Management of Waste from Animal Product Processing; International Agriculture Center: Wageningen, The Netherlands, 1996. [Google Scholar]
- Rad, S.J.; Lewis, M.J. Water utilisation, energy utilisation and waste water management in the dairy industry: A review. Int. J. Dairy Technol. 2013, 67. [Google Scholar] [CrossRef]
- Christensen, J. Fra Andelsmejerier til Arla Foods 1882–2012. Available online: https://danmarkshistorien.dk/leksikon-og-kilder/vis/materiale/fra-andelsmejerier-til-arla-foods-1882-2012/ (accessed on 20 February 2019).
- Statistics Denmark. Agricultural Statistics 1900–1965. Volume II–Livestock and Livestock Products and Cosumption of Feeding Stuffs. In Statistiske Undersøgelser Nr. 25; Danmarks Statistik: Copenhagen, Denmark, 1969. [Google Scholar]
- Krak, T. Fortegnelse over Danmarks Ældste Forretninger—Oprettet Mellem 1100 og 1911 Som stadig var aktive i 1950; Erik Rosenkamp, Ed.; LFL’s Bladfond: London, England, 2008. [Google Scholar]
- Dansk Center for Byhistorie. Danmarks Købstæder. Available online: http://ddb.byhistorie.dk/koebstaeder/#indhold (accessed on 18 February 2019).
- Fertner, C. Digitalisering af det historiske jernbanenetværk. Jernbanen 2012, 6, 42–43. [Google Scholar]
- Madsen, H.H. Skæv og National: Dansk Byplanlægning 1830 til 1938; Dirckinck-Holmfeld, K., Ed.; Bogværket: Nykøbing Sjælland, Denmark, 2009. [Google Scholar]
- Mikkelsen, J. Købstadslandbruget og Kampen om Byernes Naturlige Ressourcer. Landbohistorisk Tidsskr. 2012, 2, 9–44. [Google Scholar]
- Mikkelsen, J. Danmarks Statistiks arkiv og landbohistorisk forskning. Landbohistorisk Tidsskr. 2010, 7, 106–135. [Google Scholar]
- Trap, J.P. Statistisk-Topographisk Beskrivelse af Kongeriget Danmark. 3. Udgave 1898–1906; Weitemeyer, H., Falbe-Hansen, V.A., Westergaard, H., Eds.; G.E.C. Gads Boghandel: Copenhagen, Denmark, 1906. [Google Scholar]
- Iversen, L. Kampen for Liv—Fem Danske Forebyggelsessucceser; Statens Institut for Folkesundhed: København, Denmark, 2017. [Google Scholar]
- Budde, V. Om Bortskaffelsen af de menneskelige Affaldsstoffer fra større Byer med særligt Hensyn til Forholdene i Kjøbenhavn. Ugeskr. Læger 1884, 4. [Google Scholar]
- Hyldegaard, I.M. Randers. Fra Handelsplads til Storkommune 1000–1975; Randers Amts Historiske samfund: Randers, Denmark, 2002. [Google Scholar]
- Statistics Denmark. Landbrugsstatistik 1900–1965. Bind I—Landbrugsareal og Høstudbytte samt Gødningsforbrug; Statistiske Undersøgelser Nr. 22; Danmarks Statistik: Copenhagen, Denmark, 1968. [Google Scholar]
- Steensberg, A. Dagligliv I Danmark I Det Nittende og Tyvende Århundrede. Bind II; Nyt Nordisk Forlag: Copenhagen, Denmark, 1964. [Google Scholar]
- Pedersen, K. Helsingør Vandforsyning 1895–1995; Helsingør Kommunes Tekniske Forvaltning: Helsingør, Denmark.
- Lützen, K. Byen Tæmmes. Kernefamilie, Sociale Reformer og Velgø- Renhed i 1800-Tallets København; Reitzel, H., Ed.; BIBLIOTEKDK: Copenhagen, Denmark, 1998. [Google Scholar]
- Christensen, V. København I Kristian den Ottendes og Frederik den Syvendes tid 1840–1857; G.E.C. Gads Forlag: København, Denmark, 1912. [Google Scholar]
- Esbjerg Kommune Esbjerg Byhistoriske Arkiv. Available online: http://eba.esbjergkommune.dk/esbjergs-historie/tidslinje.aspx (accessed on 20 February 2019).
- Fang, L. Roskilde—Begivenheder og deres Årstal; Available online: http://eba.esbjergkommune.dk/esbjergs-historie/tidslinje.aspx (accessed on 18 February 2019).
- Jensen, P.E. Afløbsforhold og Spildevandsplanlægning i Randers fra 1860–1930; Randers, Denmark, 1989. [Google Scholar]
- Staun, S.R. Familiens liv og Hverdag år 1900: Århundredeskiftet, Børneliv, Mad og Køkken, Ægteskab, Bolig, Arbejde 2002; Arbejdermuseet: Copenhagen, Denmark, 2002. [Google Scholar]
- Eriksen, J.M. Fra Stinkende Rendestene til Computerstyrede Kloakker: Københavns Kloakker Gennem 150 år; Københavns Energi: Copenhagen, Denmark, 2007. [Google Scholar]
- Andersen, U. Kampen om Kloakkerne Stopper Aldrig. Available online: https://ing.dk/artikel/kampen-om-kloakkerne-stopper-aldrig-135062 (accessed on 21 February 2019).
- Hilden, H.P. Skrald, Storby og Miljø—En Beretning om Københavns Kamp mod Affaldet Gennem 200 år; Renholdningsselskabet 1898: Copenhagen, Denmark, 1973. [Google Scholar]
- Holtze, A.; Backlund, A. Kompostering og Eferkompostering af Humane Restprodukter Indehold i Afvandet “Sort” Spildevand. In Økologisk Byfornyelse og Spildevandsrensning, Nr. 39; Miljøstyrelsen: Copenhagen, Denmark, 2003. [Google Scholar]
- Wrisberg, S.; Eilersen, A.M.; Nielsen, S.B.; Clemmesen, K.; Henze, M.; Magid, J. Vurdering af Muligheder og Begrænsninger for Recirkulering af Næringsstoffer fra by til Land. Økologisk Byfornyelse og Spildevandsrensning, Nr. 14; Miljøstyrelsen: Copenhagen, Denmark, 2001. [Google Scholar]
- Hevesy, G.; Hahn, L.; Rebbe, O. Excretion of Phosphorus. Kgl. danske vidensk. Selsk. Biol. Medd. 1939, 14, 23. [Google Scholar]
- Rose, C.; Parker, A.; Jefferson, B.; Cartmell, E. The characterization of feces and urine: A review of the literature to inform advanced treatment technology. Crit. Rev. Environ. Sci. Technol. 2015, 45, 1827–1879. [Google Scholar] [CrossRef] [PubMed] [Green Version]
- Jensen, T. Fødevareforbrug i Danmark i Det 20. Århundrede: Tre Perspektiver på Fødevareforbrugets Langsigtede Udviklinger. Ph.D. Thesis, Faculty of Humanities, Copenhagen University, Copenhagen, Denmark, 2011. [Google Scholar]
- Roser, M.; Ritchie, H. Food Supply; Available online: https://ourworldindata.org/food-supply (accessed on 20 February 2019).
- Manitoba. Properties of Manure; Manitoba Agriculture, Food and Rural Development: Province of Manitoba, MB, Canada, 2015. [Google Scholar]
- Hong, B.; Swaney, D.P.; Mörth, C.M.; Smedberg, E.; Eriksson Hägg, H.; Humborg, C.; Howarth, R.W.; Bouraoui, F. Evaluating regional variation of net anthropogenic nitrogen and phosphorus inputs (NANI/NAPI), major drivers, nutrient retention pattern and management implications in the multinational areas of Baltic Sea basin. Ecol. Modell. 2012, 227, 117–135. [Google Scholar] [CrossRef]
- Agency for Data Supply and Efficiency Danmark. Denmark 1:1.000.000, Vektor; Kortforsyningen: Copenhagen, Denmark, 2019. [Google Scholar]
- Miljøstyrelsen. Punktkilder 2016; Miljøstyrelsen: Copenhagen, Denmark, 2018. [Google Scholar]
- Statistics Denmark. Folketal 2019. Available online: https://www.dst.dk/da/Statistik/emner/befolkning-og-valg/befolkning-og-befolkningsfremskrivning/folketal (accessed on 20 February 2019).
- Danish Nature Agency. Opdatering af Nøgletal for Miljøfarlige Forurenende Stoffer i Spildevand fra Renseanlæg; Miljøministeret Naturstyrelsen: Copenhagen, Denmark, 2014. [Google Scholar]
- Jensen, P.N.; Boutrup, S.; Fredshavn, J.R.; Nielsen, V.V.; Svendsen, L.M.; Blicher-Mathiese, G.; Thodsen, H.; Johansson, L.S.; Hansen, J.W.; Therkilldsen, O.R.; et al. Vandmiljø og Natur 2016. NOVANA. Tilstand og Udvikling—Faglig Sammenfatning. Videnskabelig Rapport nr. 274; Aarhus Universitet DCE-National Center for Miljø og Energi, GEUS, Miljøstyrelsen: Aarhus, Denmark, 2018. [Google Scholar]
Figure 1.
Historical development from 1840 until today of (a) the Danish total population and town population, based on [8,9,10]; (b) estimated development of nutrient emissions to receiving water and fraction of households and industry connected to wastewater treatment plants (WWTP), based on [11,12]. Milestones are marked with vertical lines and based on [11,12,13].

Figure 2.
Box plots showing (a) the population growth between 1880 and 1901 [8]; (b) the fraction of agricultural workers in 1890 [38]; in 25 towns (>5000 inhabitants) and 55 smaller settlements (<5000 inhabitants). The points represent the values for single towns, with red points representing model towns. The boxes show the 25% and 75% quantiles and points outside of the whiskers and are considered outliers. The vertical lines within the boxes show the median.

Figure 3.
Estimated flows of excrements from humans and animals and wastewater from industries in Danish coastal and inland towns and in Copenhagen in 1900.
Figure 3.
Estimated flows of excrements from humans and animals and wastewater from industries in Danish coastal and inland towns and in Copenhagen in 1900.

Figure 4.
Danish towns with more than 5000 inhabitants in 1900. The pie chart for each city illustrates the fraction of nutrients that was emitted to water, soil or agricultural soil. The pie charts areas are sized relative to each other to illustrate the magnitude of total emissions. The population size and total nitrogen emissions from each town are listed in the table to the right. Background map from Agency for Data Supply and Efficiency [67].

Figure 5.
Fraction of total nutrient emissions stemming from humans and animals in towns with more than 5000 inhabitants and industry (slaughterhouses and dairies) to water, landfill and agricultural soil in 1900.
Figure 5.
Fraction of total nutrient emissions stemming from humans and animals in towns with more than 5000 inhabitants and industry (slaughterhouses and dairies) to water, landfill and agricultural soil in 1900.

Figure 6.
Relative changes in nutrient emissions to water in seven alternative scenarios, compared to the baseline scenario: 1.a increased use of buckets from Copenhagen by farmers; 1.b 50% less pipes; 1.c 50% more pipes; 2.a reduction factor of 50% for present nutrient loads from human and animal excrements; 2.b. no reduction factor for present nutrient loads from human and animal excrements; 3.a inclusion of all small settlements (<5000 inhabitants) as inland towns; 3.b inclusion of all small settlements (<5000 inhabitants) as coastal towns.

Figure 7.
Nitrogen emissions from point (solid bars) and diffuse (hatched bars) sources to water in 1900 and 2016, (a) total and (b) normalized to total population; and phosphorous emissions from point (solid bars) and diffuse (hatched bars) sources to water in 1900 and 2016, (c) total and (d) normalized to total population. No data regarding diffuse phosphorous emissions in 1900 was available.


Table 1.
Quantitative parameters collected for the calculation of initial nutrient loads (both nitrogen and phosphorous) from humans, animals and industries. For values and references for each parameter, please refer to the results section and Supplementary Table S1.
Table 1.
Quantitative parameters collected for the calculation of initial nutrient loads (both nitrogen and phosphorous) from humans, animals and industries. For values and references for each parameter, please refer to the results section and Supplementary Table S1.
| Parameter | Unit | Description | Source |
|---|---|---|---|
| Ptotal | (pers) | Total population in Denmark in 1900 | Historical data |
| Pi | (pers) | Population in town i in 1900 | Historical data |
| Ai,j | (animalj) | Number of animal j in town i in 1900 | Historical data |
| nslaughter | (-) | Number of slaughterhouses in 1900 | Historical data |
| Ihuman | (kg/pers/year) | Nutrient load in human excrements per year | Current data |
| Ianimal,j | (kg/animalj/year) | Nutrient load per animal j (pigs, cattle, horses, sheep and goats) per year | Current data |
| fred | (-) | Reduction factor to account for differences in nutrition and feed | Estimate based on historical and current data |
| WWdairy | (LWW/Lproc) | Wastewater volume generated per volume of processed milk | Current data |
| WWslaughter | (LWW/kgproc) | Wastewater volume generated per mass of processed animals | Current data |
| IWW,dairy | (kg/LWW) | Nutrient load in wastewater from dairies | Current data |
| IWW,slaughter | (kg/LWW) | Nutrient load in wastewater from slaughterhouses | Current data |
| Procdairy, total | (lproc/year) | Volume of milk processed per year * | Historical data |
| Procslaughter,total | (kgproc/year) | Mass of processed animals per year * | Historical data |
* It is assumed that the processed volume (mass) is approximately equal the produced volume (mass).
Table 2.
Tested alternative scenarios for selected parameters, characterized by a high uncertainty.
| Source of Uncertainty | Parameter | Baseline | Alternative |
|---|---|---|---|
| 1. Flow paths of nutrients | 1.a Fraction of buckets from Copenhagen sold to farmers | 10% | 80% |
| 1.b Fraction of waste disposed to pipes | 10–20% of human excrements 10% of industrial wastewater | 50% decrease | |
| 1.c Same as 1.b | Same as 1.b | 50% increase | |
| 2. Initial load of nutrients from human and animal excrements | 2.a Initial load of nutrients from human and animal excrements | 75% of present values | 50% of present values |
| 2.b Same as 2.a | Same as 2.a | 100% of present values | |
| 3. Minimum population for inclusion of towns in the assessment | 3.a Towns with less than 5000 inhabitants | Excluded | Included as inland towns |
| 3.b Same as 3.a | Same as 3.a | Included as coastal towns |
Table 3.
Estimated intial emission of nutrients from humans, animals and industry in 1900, based on values reported in current literature reduced by 25% to account for differences in nutrition and animal feed.
Table 3.
Estimated intial emission of nutrients from humans, animals and industry in 1900, based on values reported in current literature reduced by 25% to account for differences in nutrition and animal feed.
| Source | Nitrogen | Phosphorous |
|---|---|---|
| Human excrements | 3.0 kg/pers/year | 0.5 kg/pers/year |
| Animal excrements | ||
| Cattle and horses | 45.0 kg/animal/year | 7.5 kg/animal/year |
| Pigs | 6.8 kg/animal/year | 2.3 kg/animal/year |
| Sheep and goats | 6.5 kg/animal/year | 1.3 kg/animal/year |
| Industry | ||
| Dairies | 0.3 kg/pers/year | 0.1 kg/pers/year |
| Slaughterhouses | 27 kg/slaughterhouse/year | 2 kg/slaughterhouse/year |
Table 4.
Nutrient emissions to water, landfill or soil and agricultural soil from coastal towns, inland towns, Copenhagen and slaughterhouses in 1900. Emissions to landfill or soil include spill during transport and overflows.
Table 4.
Nutrient emissions to water, landfill or soil and agricultural soil from coastal towns, inland towns, Copenhagen and slaughterhouses in 1900. Emissions to landfill or soil include spill during transport and overflows.
| Source | Emission to Water (t/year) | Emission to Landfill or Soil (t/year) | Emission to Agricultural Soil (t/year) | Total (t/year) | ||||
|---|---|---|---|---|---|---|---|---|
| N | P | N | P | N | P | N | P | |
| Coastal towns | 1182 | 218 | 309 | 54 | 600 | 102 | 2091 | 374 |
| Inland towns | 13 | 2 | 114 | 21 | 280 | 50 | 407 | 73 |
| Copenhagen | 1336 | 242 | 388 | 68 | 40 | 7 | 1764 | 317 |
| SUM | 2531 | 462 | 811 | 143 | 919 | 159 | 4261 | 764 |
© 2020 by the authors. Licensee MDPI, Basel, Switzerland. This article is an open access article distributed under the terms and conditions of the Creative Commons Attribution (CC BY) license (http://creativecommons.org/licenses/by/4.0/).
Share and Cite
MDPI and ACS Style
Brudler, S.; Arnbjerg-Nielsen, K.; Jeppesen, E.B.; Bitsch, C.; Thelle, M.; Rygaard, M. Urban Nutrient Emissions in Denmark in the Year 1900. Water 2020, 12, 789. https://doi.org/10.3390/w12030789
AMA Style
Brudler S, Arnbjerg-Nielsen K, Jeppesen EB, Bitsch C, Thelle M, Rygaard M. Urban Nutrient Emissions in Denmark in the Year 1900. Water. 2020; 12(3):789. https://doi.org/10.3390/w12030789
Chicago/Turabian StyleBrudler, Sarah, Karsten Arnbjerg-Nielsen, Emma Barnhøj Jeppesen, Camilla Bitsch, Mikkel Thelle, and Martin Rygaard. 2020. "Urban Nutrient Emissions in Denmark in the Year 1900" Water 12, no. 3: 789. https://doi.org/10.3390/w12030789
Note that from the first issue of 2016, this journal uses article numbers instead of page numbers. See further details here.