Deciphering Morphological Changes in a Sinuous River System by Higher-Order Velocity Moments


1
Department of Civil Engineering, Indian Institute of Technology, Guwahati 781039, India
2
School of Engineering, University of Basilicata, 85100 Potenza, Italy
*
Author to whom correspondence should be addressed.
Water 2020, 12(3), 772; https://doi.org/10.3390/w12030772
Submission received: 29 January 2020
/
Revised: 7 March 2020
/
Accepted: 9 March 2020
/
Published: 11 March 2020
(This article belongs to the Special Issue Flow Hydrodynamic in Open Channels: Interaction with Natural or Man-Made Structures)
Abstract
:Bank erosion in a sinuous alluvial channel is a continuous phenomenon resulting in bank instability and migration of sediment. In this study, flume experiments were conducted in a sinuous channel to investigate its morphological changes and hydrodynamics. High-order velocity fluctuation moments are analyzed at outer and inner banks to explain the morphological variation in a sinuous river channel. The variance of streamwise velocity fluctuations on both banks of the sinuous channel follows a logarithmic law from a particular depth. In the outer bend region, the magnitude of velocity fluctuation moment is significant, indicating erosion. The trend of velocity fluctuation at higher even-order moments is similar to the variance of streamwise velocity fluctuations where the outer bend magnitude is greater than the inner bend. The premultiplied probability density functions (PDFs) and the flatness factor show greater magnitude in the outer bend of the channel as compared to the inner bend.
1. Introduction
The study of turbulence in a sinuous channel is a complex topic as compared to a straight channel. There is uniformity in a straight channel in both banks; however, in a sinuous channel, there are continuous erosion and deposition processes at outer and inner banks, respectively. Turbulence studies in a sinuous channel have been discussed quite elaborately over the past 2–3 decades. Researchers such as Rozovskiῐ [1], Anwar [2], de Vriend and Geldof [3], Blanckaert and Graf [4], Booij [5], Sukhodolov and Kaschtschejewa [6], and Engel and Rhoads [7] have studied the turbulent characteristics of both infield and laboratory and forwarded theories and articles regarding the uniqueness of flow behaviour. Several researchers (e.g., [8,9]) have also explained the relations between turbulence characteristics and erosion at the outer bank. Blanckaert [10] stated that the Reynolds shear stress (RSS) in a sinuous bend indicates the presence of helical flow, which contributes to the erosion and deposition processes. Esfahani and Keshavarzi [11] studied the bursting process by octant analysis. Their study was based on two models of and bend angle. They found that the effect of river bends on flow characteristics and bursting events is inversely proportional to the curvature of the bend. The velocity distribution at channel bends is conflicting. In sinuous bends, the maximum velocity is not found always towards the outer bend because of the velocity redistribution [3,12]. de Vriend and Geldof [3] mentioned that there is a shift of maximum velocity in the inner bend before the flow enters the bend apex. This paper aims to address that the mean velocity may not be always higher towards the outer bend. Thus, the paper highlights the erosion and deposition patterns in a sinuous channel by analyzing the high-order streamwise velocity fluctuations.
Previous studies have testified the morphological changes in a sinuous channel [13,14,15]. In sinuous channel, the shifting of centerline and migration of sediment is a continuous process. Experiments conducted with erodible beds in a meandering channel have reported bed formations as point bars, mid-channel bars, free bars, and sand bars [16,17,18,19]. Xu and Bai [12] in their experiments with erodible bed and fixed walls, observed depositional bars at the inner bank and pools at the outer bank. Zhang et al. [20] observed the flood events in a step-pool channel. Scour appeared in the pool at threshold condition, and after which the scour depth increased linearly until the step collapsed. Riverbanks are vulnerable to erosion, and recent studies have been done in riverbanks of Langat River in Malaysia [21] and Parlung Tsangpo River in China [22]. Under natural conditions in rivers, the flow turbulence governs the bed deformation and channel migration [23]. Small-scale physical models of sinuous channels were prepared successfully in the laboratory [24,25,26,27], although it is very challenging to simulate a dynamic realistic sinuous channel. However, to find a solution to a specific problem to understand the fundamentals of river processes, experimental channels are quite useful to explore the mechanisms associated. In this study, scale effects were neglected, and a laboratory study was conducted to assess flow turbulence effects.
Many researchers have worked towards high-order velocity moments in the turbulent boundary layer to acquire the information on flow behaviour. Meneveau and Marusic [28] studied the higher-order moments of velocity fluctuations at different Reynolds numbers and presented a generalized logarithmic law. de Silva et al. [29] studied the statistical properties of wall turbulence using higher-order moments of streamwise velocity fluctuations. They found that at higher Reynolds numbers, the even-order moments follow the logarithmic behaviour. Sharma and Kumar [30] studied the higher-order structure functions for seepage-affected channels. They found that higher-order moments of velocity fluctuations increase with the application of downward seepage. Another parameter called the flatness factor or Kurtosis helps in observing the distribution of the fluctuating velocity. Meneveau and Marusic [28] in their study estimated the Reynolds number dependence on sub-Gaussian statistics. The flatness factor evaluated in the inertial region is below the Gaussian value 3 and found no noticeable dependence of the Reynolds number on sub-Gaussianity.
The previous studies present the significance of the high-order velocity moments and the correlation of the turbulent flow with sediment transport. Previously, outer bend erosion was explained by using various turbulent parameters such as Reynolds shear stress, turbulent intensities, and turbulent kinetic energy. However, the previous studies had not addressed the scope to understand the fluvial morphology in association with the higher-order velocity fluctuations. Here, we have considered only the streamwise velocity to analyze the higher-order velocity fluctuations. Though the velocity field is three-dimensional in our channel and has an impact on the morphology, the study has been limited to acknowledge specifically the scour and deposition at the outer and inner bend, respectively. In this paper, firstly, we have analyzed the mean streamwise velocity and the morphology of the sinuous channel. The morphological behaviour around the bend apex (i.e., scour and deposition) needed more insights, for which the mean velocity distribution is not sufficient to make a statement on the bed deformation. Concerning this, we have applied the high-order structure function to understand the scour and deposition in a sinuous bend.
2. Experimental Methods and Program
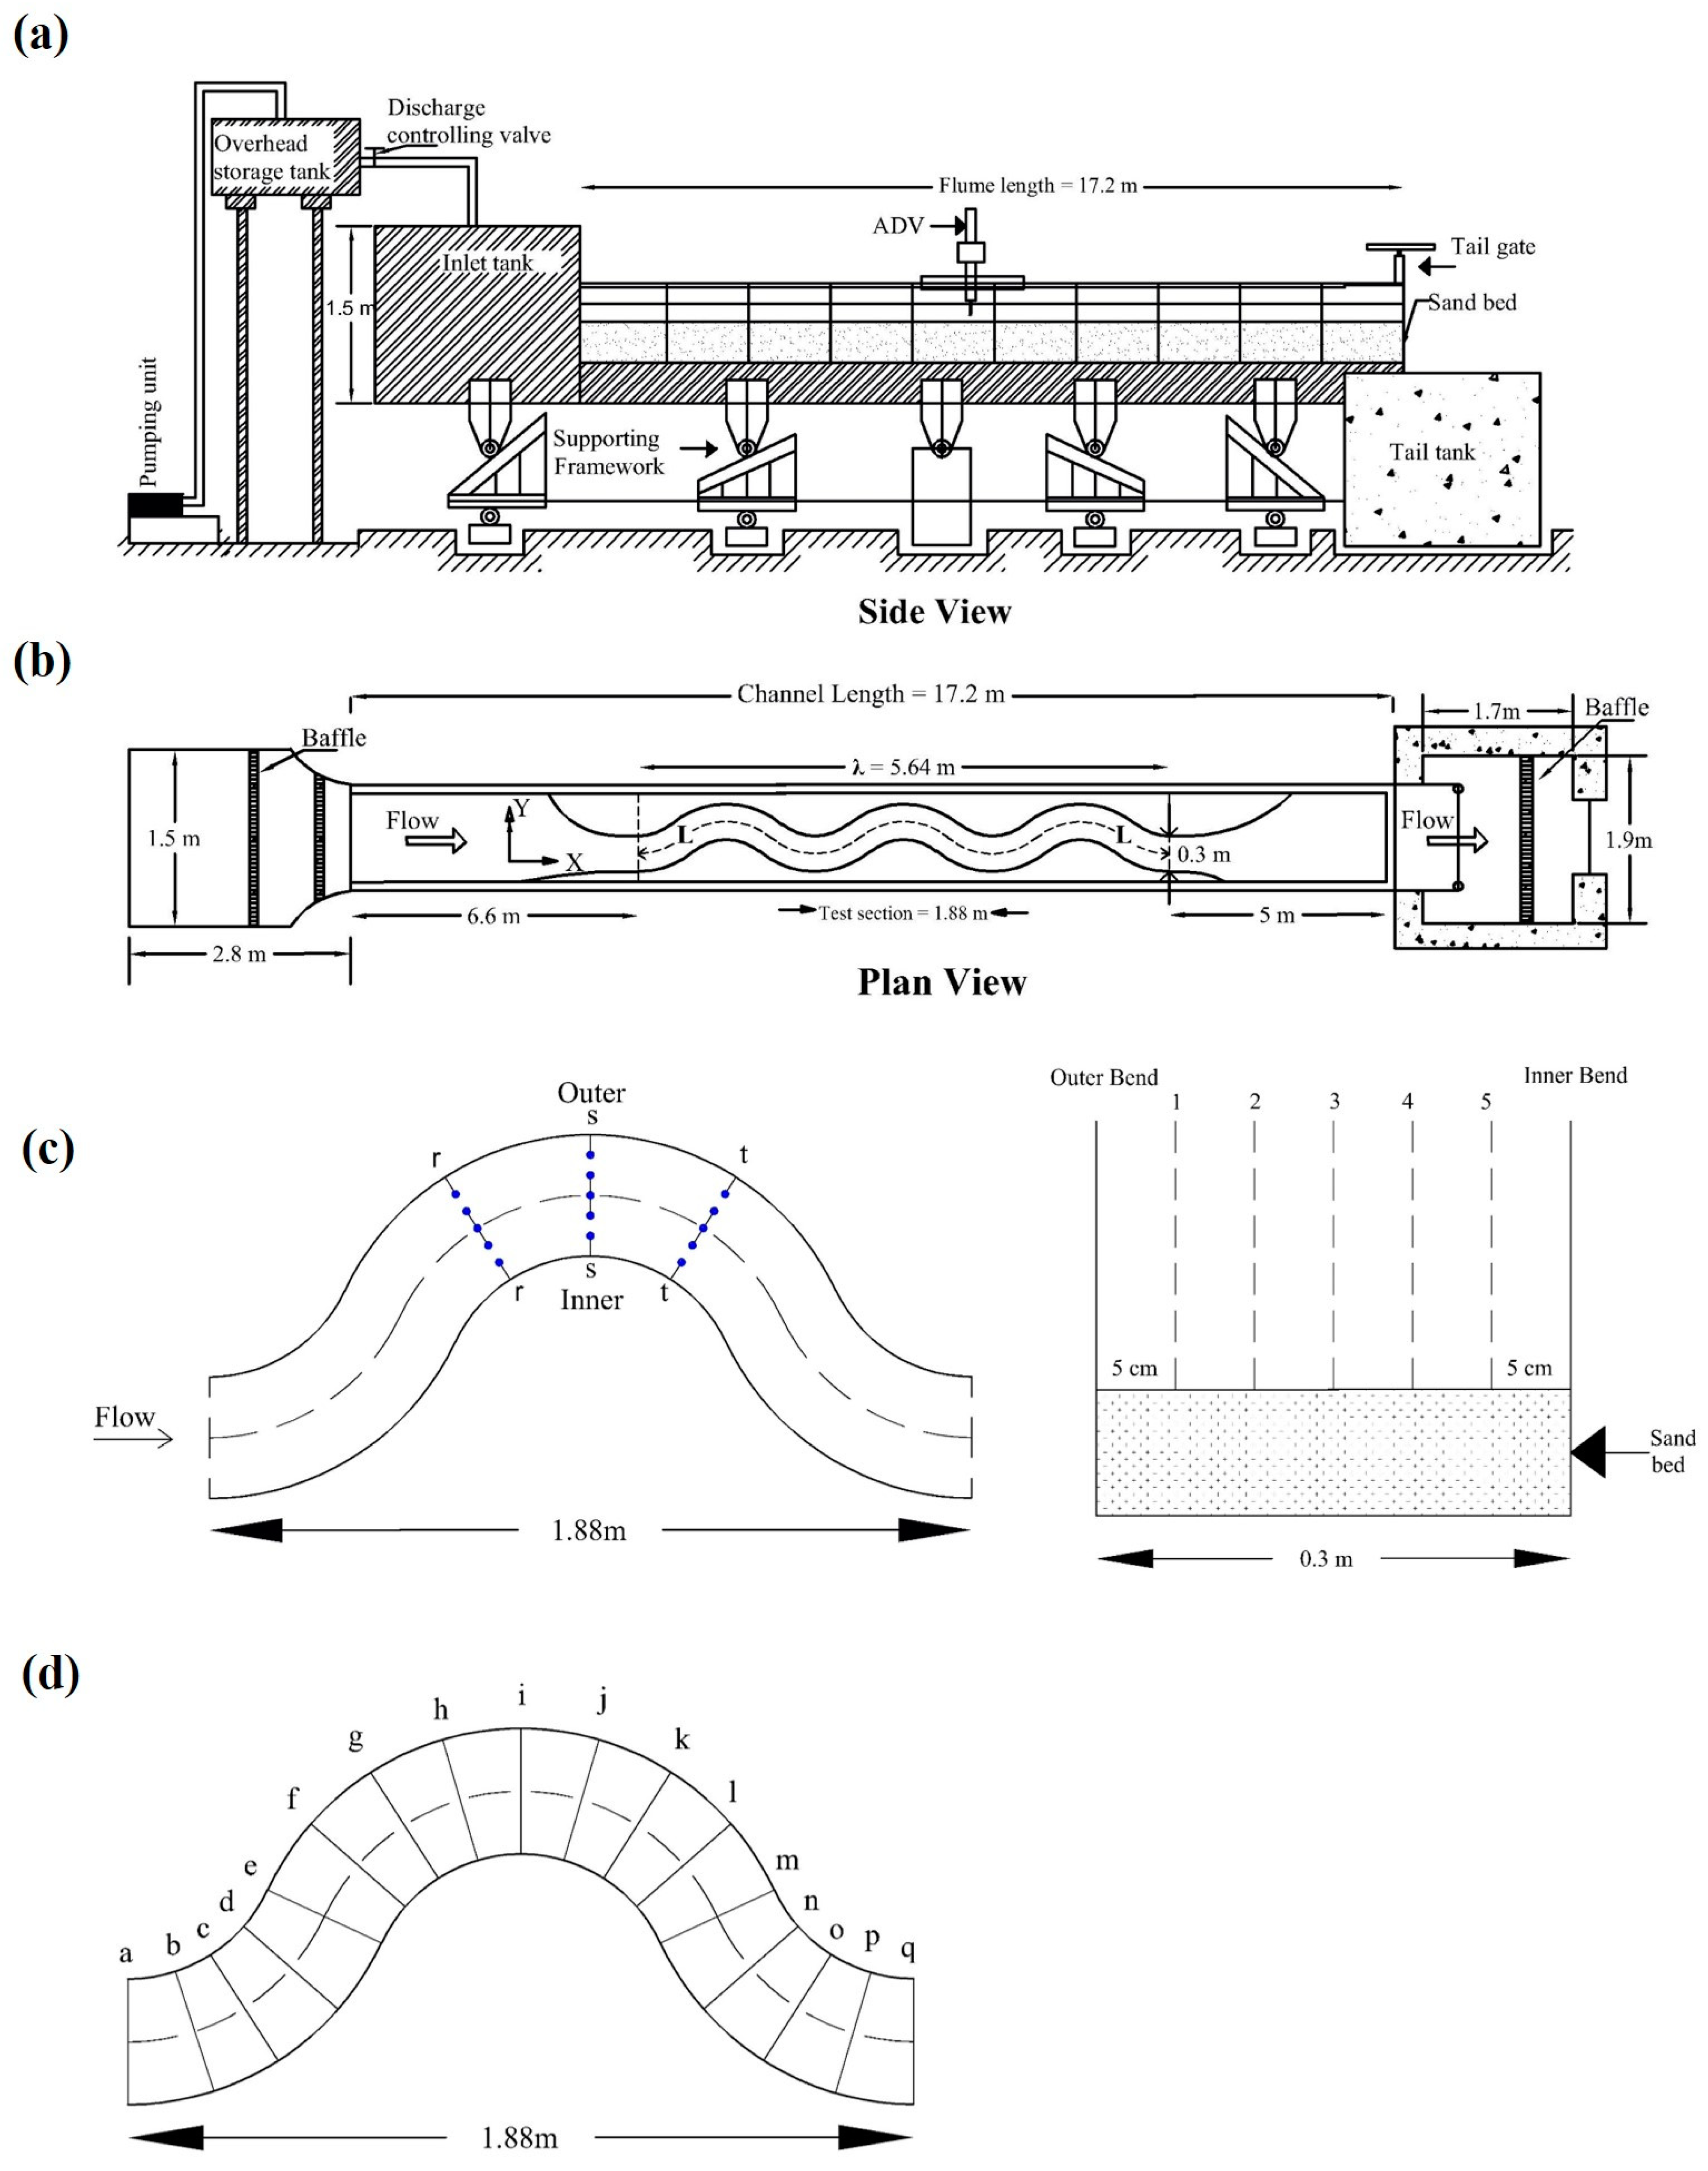
The experiments were conducted in a glass-sided recirculating flume of length and width (Figure 1). In the main channel, we constructed a rectangular sinuous channel with rigid sides of length and width . The centerline of the sinuous channel follows the sine-generated function forwarded by Leopold and Langbein [31]. The function is expressed as
where is the maximum angle the channel makes with the downvalley axis, is the angle at distance measured along the centerline of the channel, and is the arc length (length along the centerline of the channel between two repeating points). The channel centerline at the crossover made an angle of with the horizontal, known as the deflection angle. The channel sinuosity was calculated as [32], where and are the arc length and wavelength of the meander, respectively (Figure 1b). The wavelength was calculated as [33], where is the width of the sinuous channel. The calculated sinuosity and wavelength were equal to and , respectively. At the entry and exit of the sinuous channel, guide vanes were provided to direct the flow into and out from the sinuous channel smoothly. The flow was administered into the main channel from an overhead tank with the help of a control valve. The water first falls into an inlet tank ( length, width, and deep) at the upstream of the flume and it gradually enters the main channel. A tailgate at the downstream of the flume manages the flow depth during experiments. The main channel discharge was measured using a rectangular notch located at the downstream end of the channel. The experiments were conducted on a uniform river sand bed of median diameter . The flow discharge attained was equal to with a flow depth of . The flow depth was measured along the centerline of the channel. In our study, the channel achieved the Reynolds number and Froude number as and , respectively. Therefore, we have maintained a subcritical flow condition (Froude number ) and turbulent flow condition (Reynolds number ). We have physically modeled a sinuous channel in a laboratory flume. Scale effects may arise in physical modeling of sediment transport processes when all the forces in the model and the real field river flows are nonidentical. As gravity is the primary driving force in open channel flows, we tried to achieve a Froude number similar to field conditions. In the field study by Engel and Rhoads [23], the onsite Froude number is about (subcritical flow), and the Reynolds number ranges from to (turbulent flow). The Froude number observed in our tests is very close to the field conditions. Therefore, scale effects due to this may be negligible. However, the Reynolds number of the laboratory flow is greater than . Most of the river flows are turbulent and in the hydraulic rough regime, where losses are independent of the Reynolds number. Therefore, the Reynolds number of the laboratory flows was greater than and the shear Reynolds number was achieved greater than 70 so that the laboratory flow was in the fully turbulent hydraulic rough regime to better account for the losses [24].
The instantaneous flow velocities and in three directions (streamwise), (transverse), and (vertical) were measured by a velocimeter. The instantaneous velocities are equal to the sum of mean velocities ( and ) and fluctuating velocities ( and ) in the form , , and . The experimental investigation of recording the velocity and morphological changes were performed along the second bend of the sinuous channel. We used an acoustic doppler velocimeter (ADV) by Nortek® (vectrino+ 4-beam down-looking probe, Nortek AS, 1351 Rud, Norway) to record the velocity data at five locations (1, 2, 3, 4, and 5) of the bend at section and (Figure 1c). The velocimeter works on the principle of Doppler effect and has four downward-looking probes with the sampling volume located beneath the central transmitter. Readings were taken at the five locations throughout the flow depth. At each point of measurement, the velocimeter recorded samples for (sampling rate ). For higher-order statistical analysis, Schwarz et al. [34] recommended that at least samples should be collected.
The uncertainty associated with the ADV measurements was tested by taking pulses for a duration of recorded at near-bed depth , where is upward and is positive in the vertical direction (Table 1). The data collected from the ADV contains spikes, and therefore it should be filtered. The data were filtered using the acceleration threshold method [35]. During the measurement, the signal-to-noise ratio (SNR) and correlation were greater than 15 dB and 60%–70%, respectively. The correlations were reduced by ± 5% approximately near the channel bed [36]. The spikes were filtered such that the despiked data satisfies the Kolmogorov’s law in the inertial subrange (Figure 2), where the acceleration threshold value ranged from to by trial and error [37].
To examine the morphological changes along the bend, we used the ultrasonic ranging system (URS). It is a SeaTek® (1.0 cm diameter model, Seatek SPa diesels, Lombardy, Italy,) manufactured instrument consisting of eight transducers. In this instrument, the transducer acts as both transmitter and receiver. The transducer first transmits a pulse of 10-microsecond duration, and then this pulse travels through the water and reflects off a target. The reflected signal travels back to the transducer and is detected back by the electronics. The system has an accuracy of . The uncertainty associated with the URS measurements was evaluated by taking 16 sample recordings at the center of the bend (Table 2). The URS measured the bed elevation along the bend in 17 sections (Figure 1d). The transducers were mounted on a trolley and were aligned horizontally in a single line to track the changes. The URS tracks the distance (in centimeters) between the channel bed and the water surface.
3. Results and Discussions
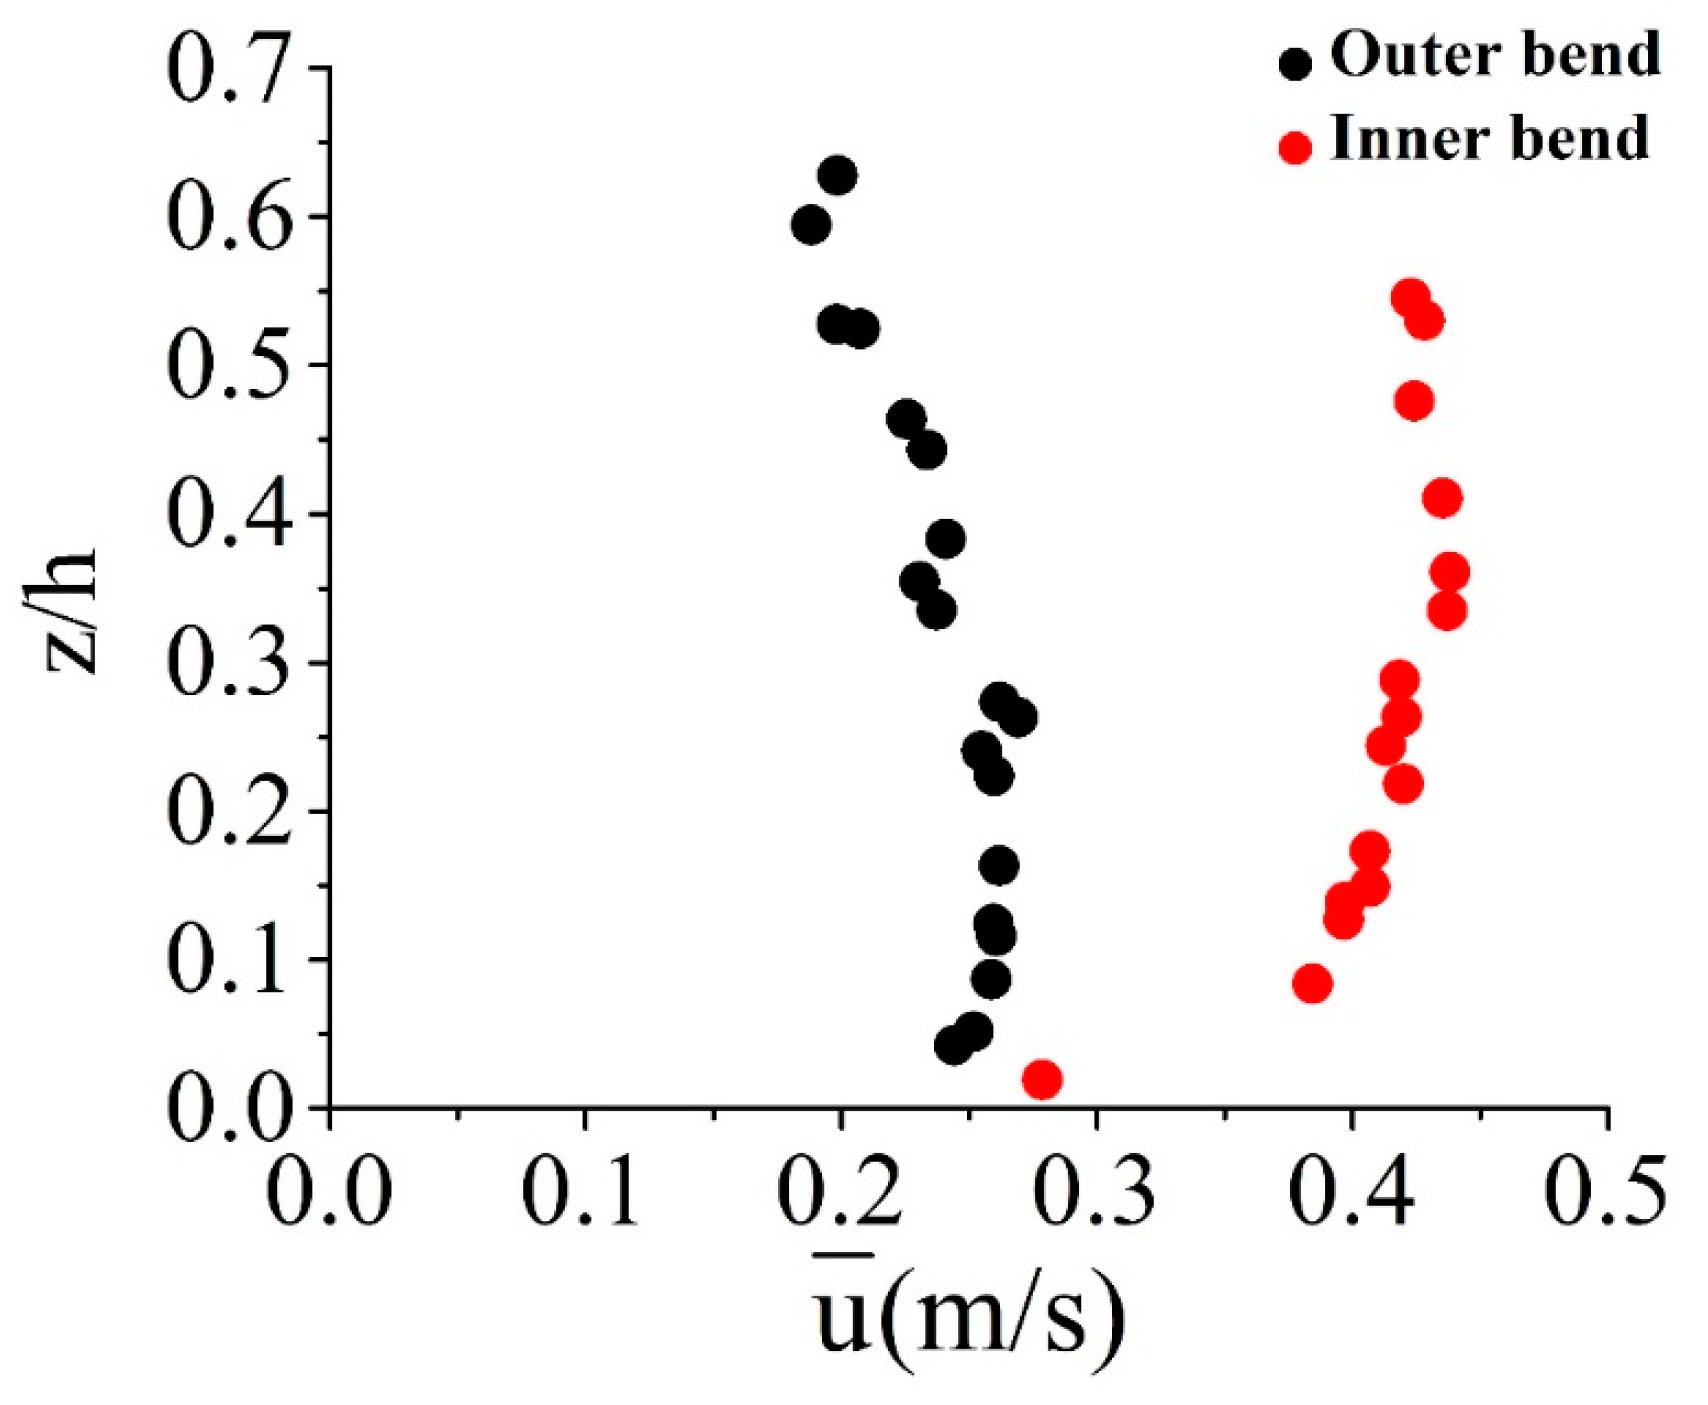
The velocity profile in the outer (location 1) and inner (location 5) bend of the section of the sinuous channel is shown in Figure 3. The mean velocities , , and in streamwise, transverse, and vertical directions are calculated as:
where n is the total sample number. In Figure 3, we observe that the magnitude of inner velocity is more when compared to the outer bend of the channel throughout the flow depth. This result is similar to that found by the authors of the papers [3,12,38] who claimed that the velocity is greater in the inner bend than outer because of velocity redistribution. Rozovskiῐ [1] considered the logarithmic distribution for the streamwise velocity profile expressed as:
where U is the depth-averaged streamwise velocity, κ is the von Kármán constant, C is the Chézy coefficient, and (z is the height to the point of measurement above channel bed, and h is the flow depth). The experimental profiles of the streamwise velocity in our study show an acceptable correlation with Equation (5).
Contour plots show the mean velocity distribution across three sections and (Figure 4). The mean velocity is maximal towards the inner bend. In section , the velocity is distributed throughout the channel width. This finding reveals that the mean velocity is not always greater towards the outer bend. Due to the inward skewing, the main velocity may take longer time to reach the outer bend, and therefore the maximum velocity is redistributed mostly towards the inner bend. Shams et al. [38] observed higher streamwise velocity towards the inner boundary in their study on a physical and laboratory-scale model.
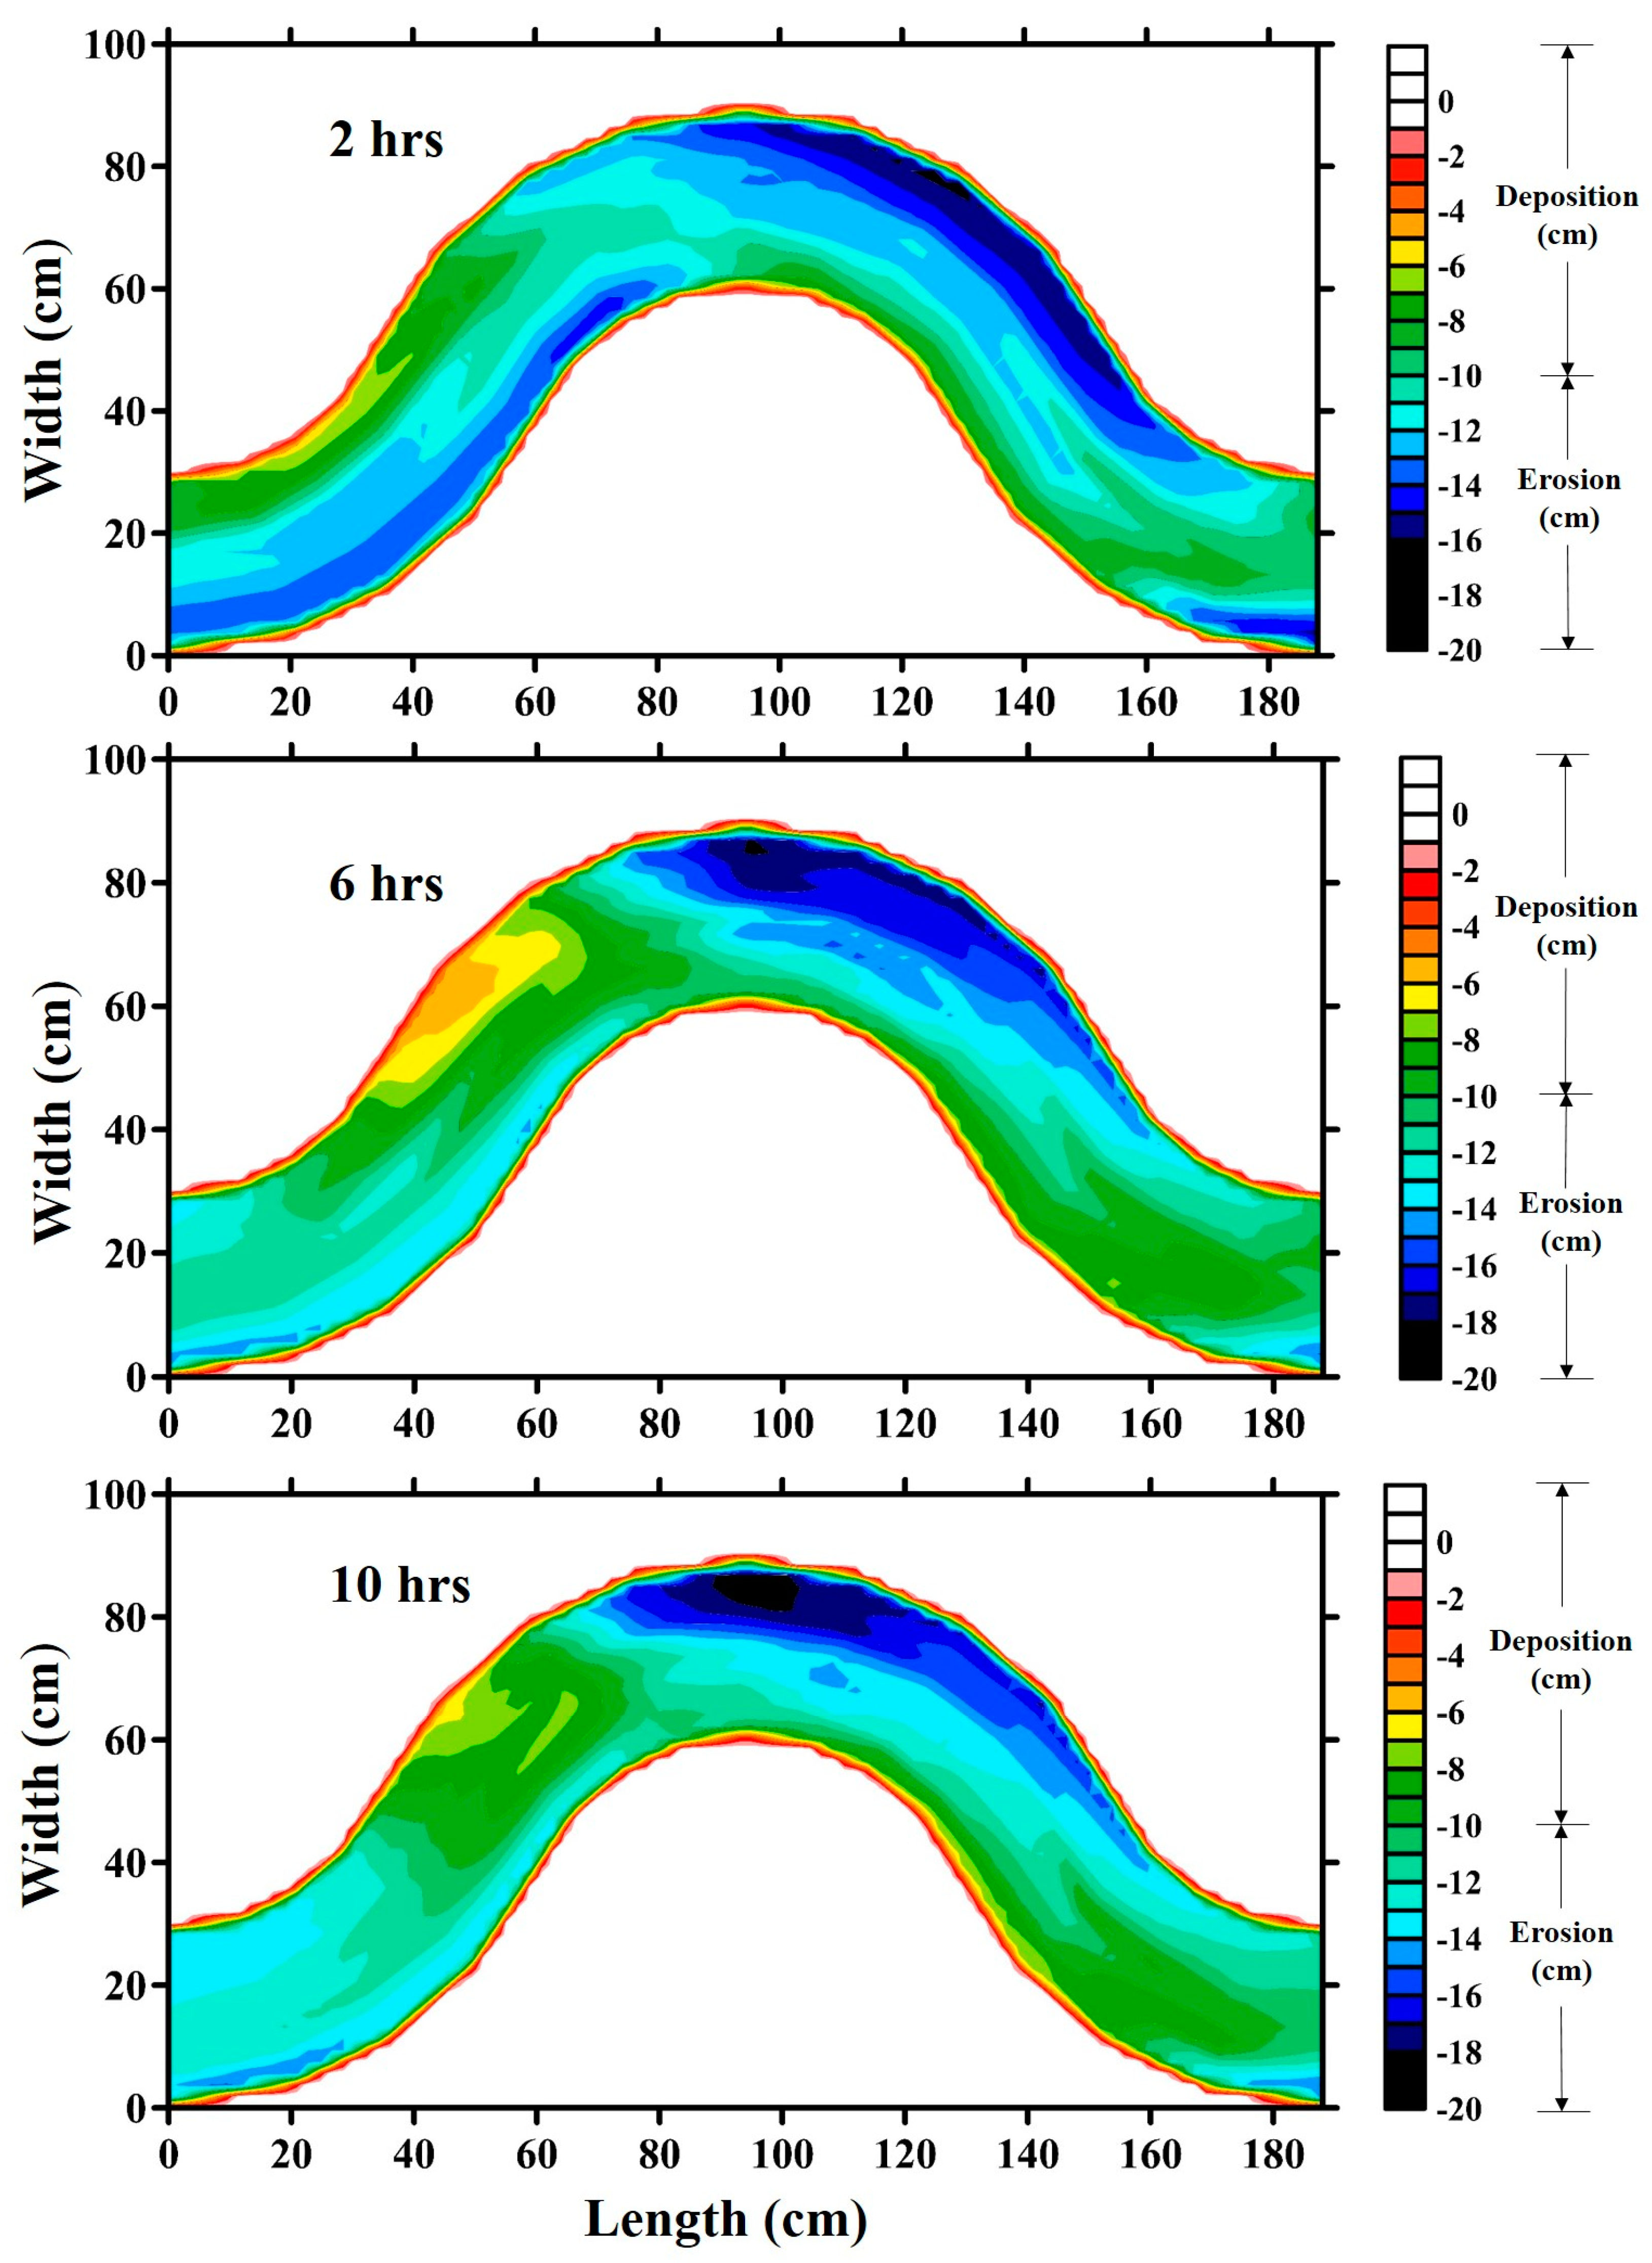
The morphological changes are also analyzed along a bend of the sinuous channel. The variations in an alluvial bed are visible in the channel. The contour plots of the morphological changes were represented using the Surfer® (Golden Software, Colorado, US) [39] at different time intervals (Figure 5). After the desired discharge was achieved in the channel, the morphology readings were taken at intervals of and h Readings were taken up to h, and after which no significant changes were noticed in the bend. It can be seen that the outer bend experiences erosion, which is increasing over time [40,41]. With the acquired flow discharge, visible transport of the sediment took place. The flow interaction in bends allows the sediment to move in a transverse or radial direction (perpendicular to the direction of flow) across the bend. This motion of sediment is due to the established secondary currents in bends. Previous studies [8,10,15] have already focused on the average turbulent parameters such as the bed shear stresses, Reynolds stresses, and secondary currents to explain the scour and deposition in bends. Here, we have focused on the high-order turbulence characteristics and how they affect the morphological processes in a sinuous river. Investigation at 2 h shows the initial development of variation in the bed along the outer and inner bend. With time (6 and 10 h), the scour depth at the outer bend is prominent.
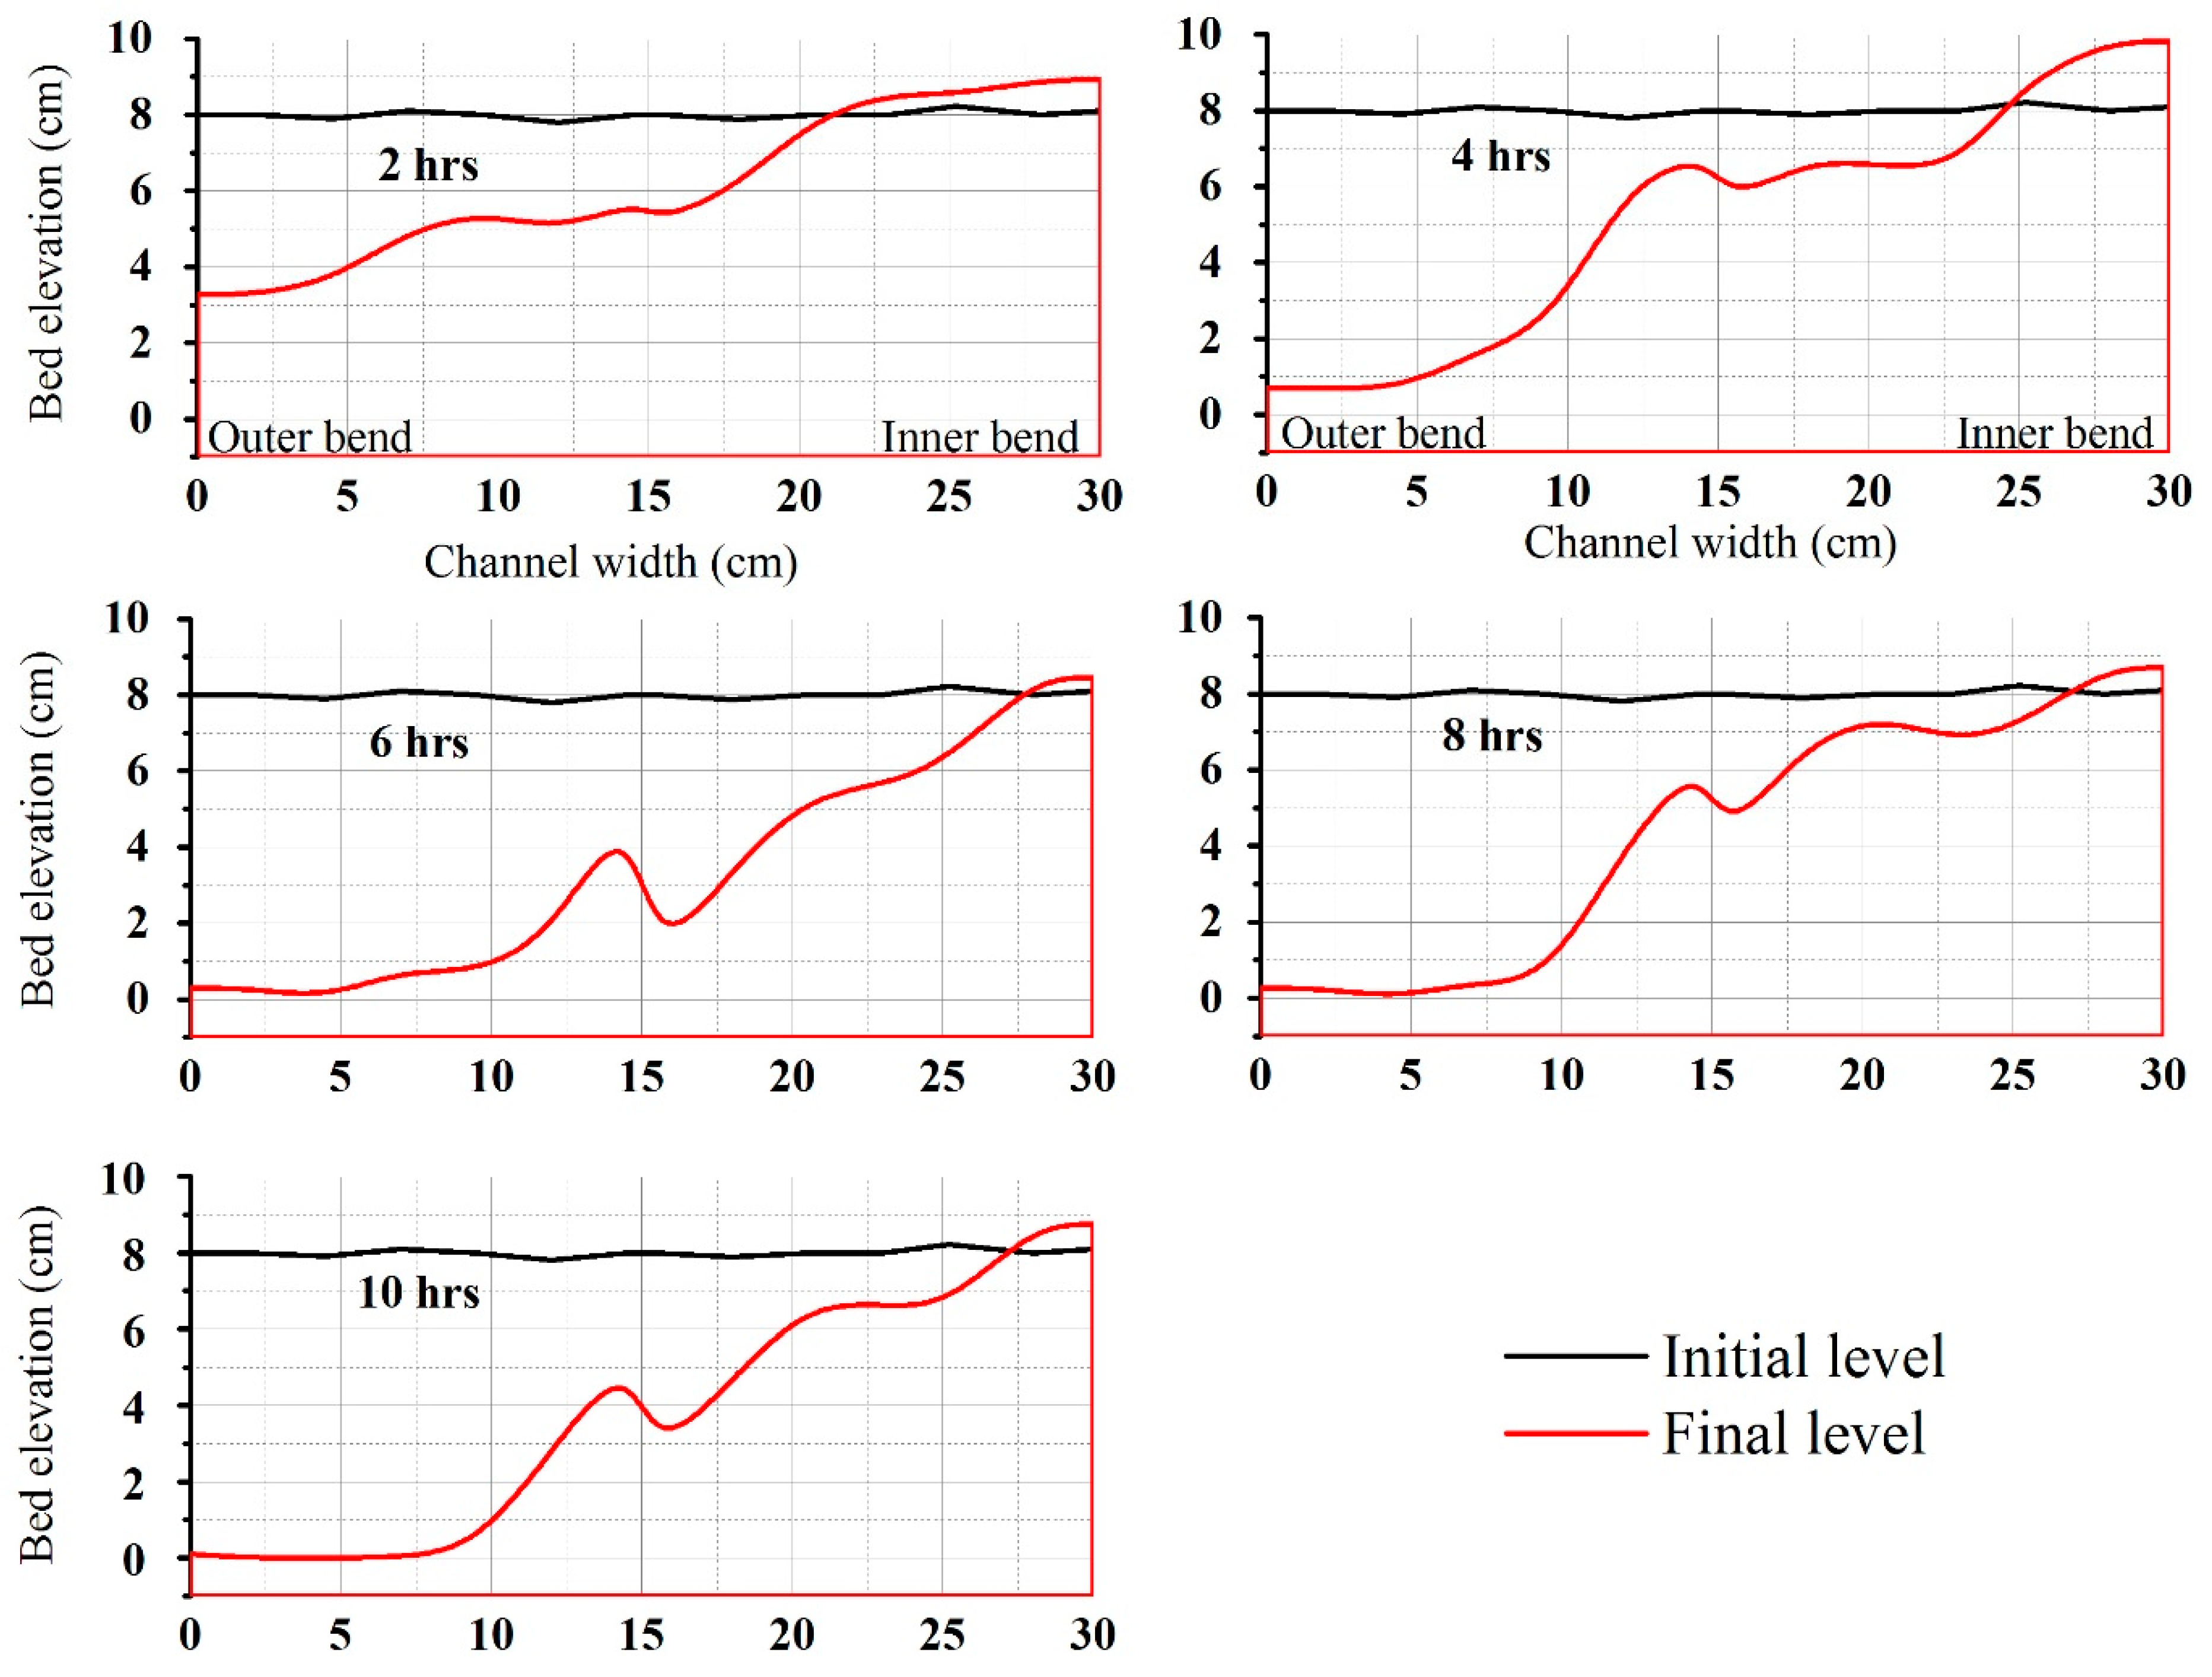
The cross-sectional bed elevation across the bend apex (section i) is shown in Figure 6. Considering the initial level as the datum, the outer bend experiences erosion, which has increased with time. At the outer bend of section i, the depth of scour after 2 h run was found to be 4.35 cm. After 10 h run, the scour depth was estimated to be 7.99 cm. The extreme lower point in the vertical axis is the maximum depth the scour has reached. There is sediment below this point, and thus the scour has not touched the rigid bed of the channel. The flow characteristic and the channel planform play a significant role in the development of morphological changes in a channel. However, the observed morphological changes in the sinuous channel do not conform to the velocity distribution given in Figure 3 and Figure 4. Hence, this conflicting behaviour might be explained by higher-order velocity moments.
The velocity profile in both the outer and inner banks varies, as the pressure forces on the banks are different. The logarithmic law of mean velocity profile in the inertial region (i.e., inner flow zone) is given as:
where [=] is the shear velocity and (bed shear stress) is found out by using the TKE (turbulent kinetic energy) method, is the kinematic viscosity of water, is the wall distance (i.e., distance from the bed), is the von Kármán constant, and is the constant. The value of and for the channel are and , respectively.
Many previous efforts by various researchers were put forward to understand the erosion and deposition behaviour in the outer and inner bend of a sinuous channel. In this section, this behaviour of a sinuous channel will be looked upon from the perspective of structure function. Here, we establish a relation between higher-order velocity moments with the erosion and deposition across sinuous bend. The erosion is a result of the transport of sediment particles. From the granular perspective, the motion of a sediment particle depends upon the balance of drag force exerted by the fluid flow and submerged weight of the particle. The classical turbulence parameter associated with transport is the average bed shear stress When exceeds (critical bed shear stress), erosion is expected. In our experiments, the sand bed was in motion. Moreover, the tractive stress depends upon the fluid velocity above the particle . Therefore, the behaviour of instantaneous component of velocity fluctuations becomes significant to erosion, as the instantaneous drag force is directly dependent on it. Hence, we have analyzed higher moments of turbulence in the inner and outer bend.
Studies by various researchers [42,43,44] have found a logarithmic nature of velocity fluctuations, which is given as:
where is the nondimensional fluctuating component of streamwise velocity and is the boundary layer thickness. The velocity fluctuating moments raised to the root follows logarithmic nature as proposed by Meneveau and Marusic [28]:
where is the distance to the wall and where and can be theoretically expressed as , as per Gaussian statistics.
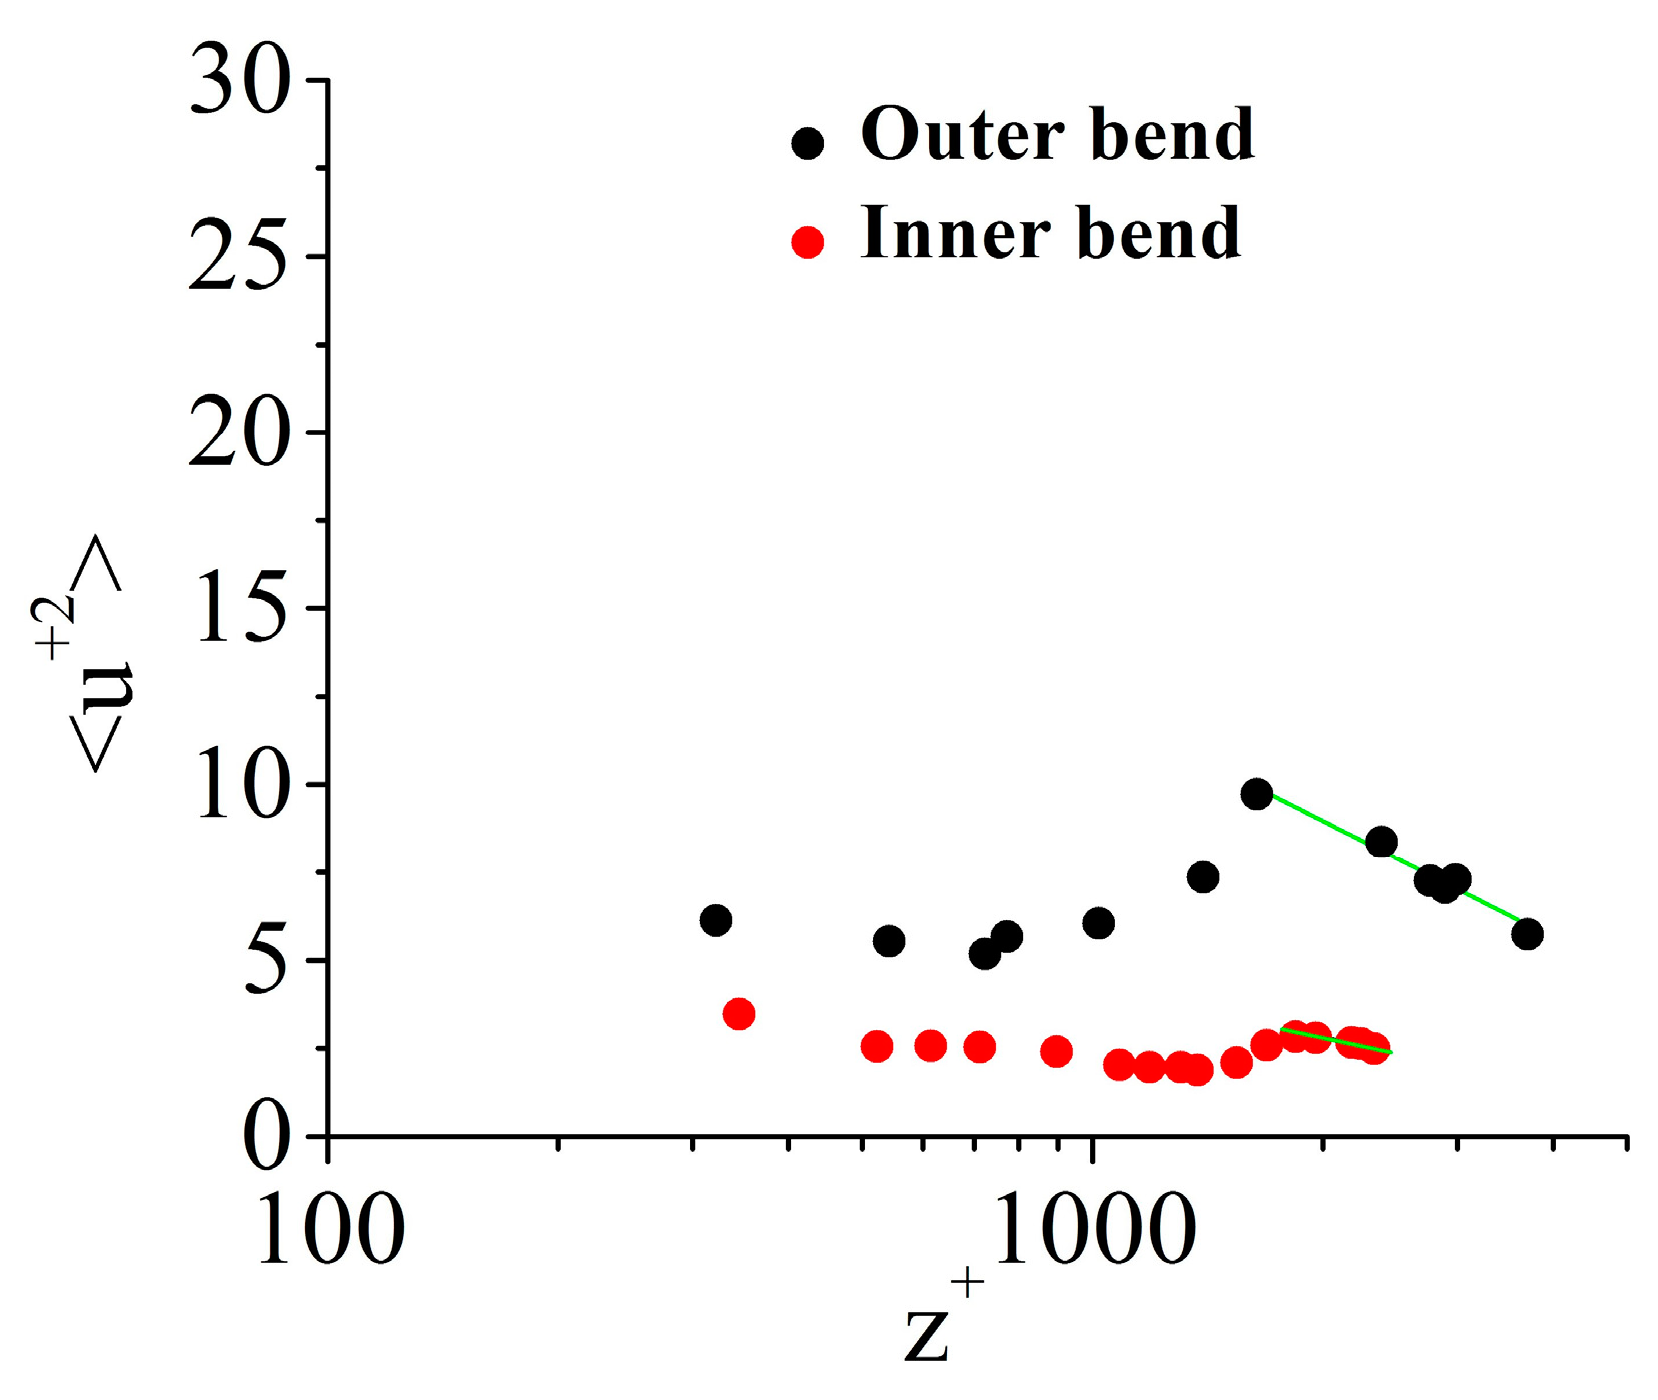
Figure 7 shows the variance in streamwise velocity comparing the inner and outer bends of a sinuous river channel. Both the profiles tend to follow a logarithmic profile after a depth of > 1000 and tend to approach zero asymptotically after a particular depth . The magnitude of outer bend variance is higher when compared to the inner bend of the channel. This point indicates the erosional behaviour in a sinuous bend. The outer bend of the sinuous channel possesses more magnitude in fluctuating velocity from the mean velocity than the inner bend. However, the mean velocity of the inner bend is more in magnitude than the outer bend, as shown in Figure 3 and Figure 4. This point indicates that outer bend erosion mostly depends on the velocity fluctuation or deviation from mean velocity rather than the mean velocity. The constants for Equation (7) are: for outer bend and for inner bend of the channel. From this, we can understand that as we move from outer to the inner bend, the constants also decrease. This point indicates that the logarithmic law constants are dependent on the flow impact location of the sinuous channel.
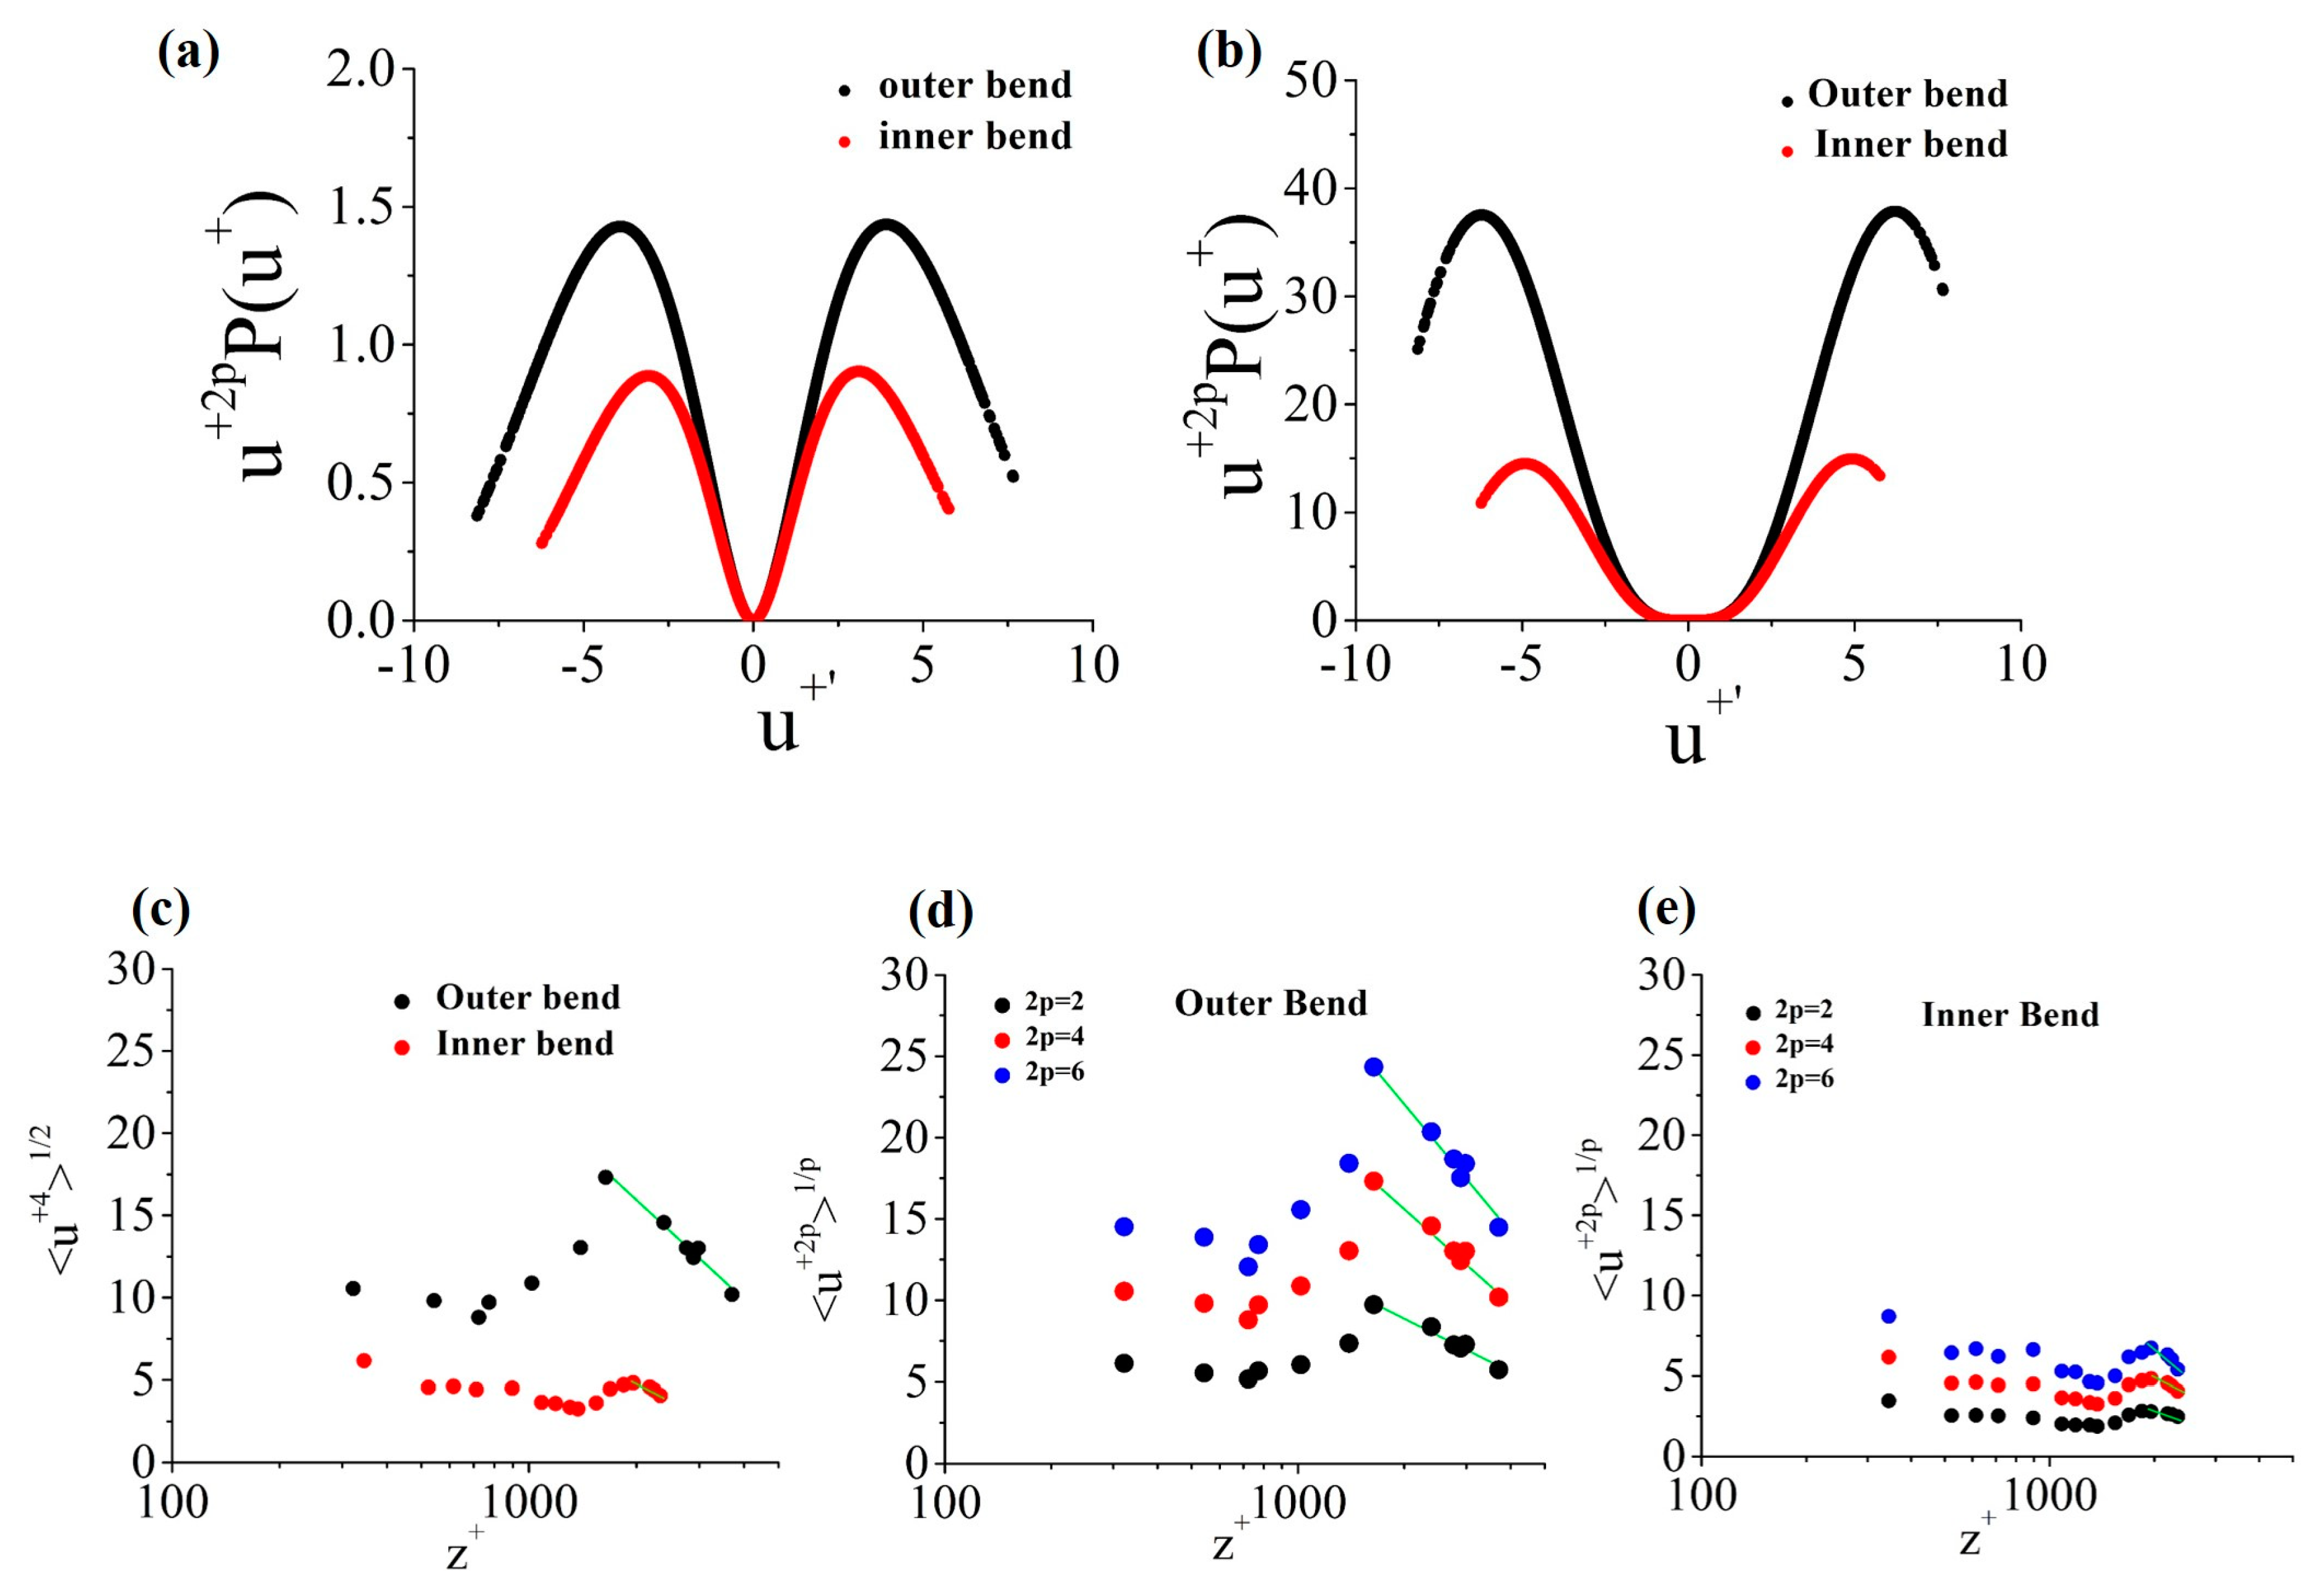
The relationship between structure function and outer bend erosion can be further established by analyzing the higher-order velocity moments (Equation (8)). Before investigating the higher-order moments of velocity fluctuations, we have to check the convergence of higher-order moments. It was achieved by multiplying the marginal probability density function (PDF) by the velocity fluctuation moments in the near-bed region. Marginal PDF is defined as the probability of values of continuous random variable (say P) without referring to the values of the other variable (say Q). In the present study, marginalized PDF of streamwise velocity (u) is considered. Figure 8a,b show premultiplied PDFs for and , respectively at flow depth . Here, we notice that the area covered by the moments of order and for both outer and inner bend, respectively, are captured by the available data. In other words, we can say that there is convergence at higher-order moments. Furthermore, the premultiplied velocity fluctuation PDFs is greater in the case of outer bend, indicating that the outer bend suffers from erosion.
Higher-order moments for and were calculated with respect to flow depth. Figure 8c shows higher-order moments for . The result is similar to that of , where both outer and inner bend profiles follow logarithmic law. The outer bend fluctuation is more as compared to inner bend, which indicates more erosion chances in the outer bend. The fitted constants values for are for the outer bend and for the inner bend of the sinuous channel. This result was similar to moments where constants are greater in the outer bend of the channel. The magnitude of higher-order moments was also compared for outer and inner bends of the sinuous channel. Figure 8d,e show higher-order moments for , and at different flow depths for outer and inner bends in a sinuous channel, respectively. We observe that as the order of moments increases, the magnitude also tends to increase. Both the profiles for outer and inner bends at different order moments tend to follow the logarithmic nature and asymptotically tend to zero after some distance. For higher moment, i.e., etc., it follows the same trend.
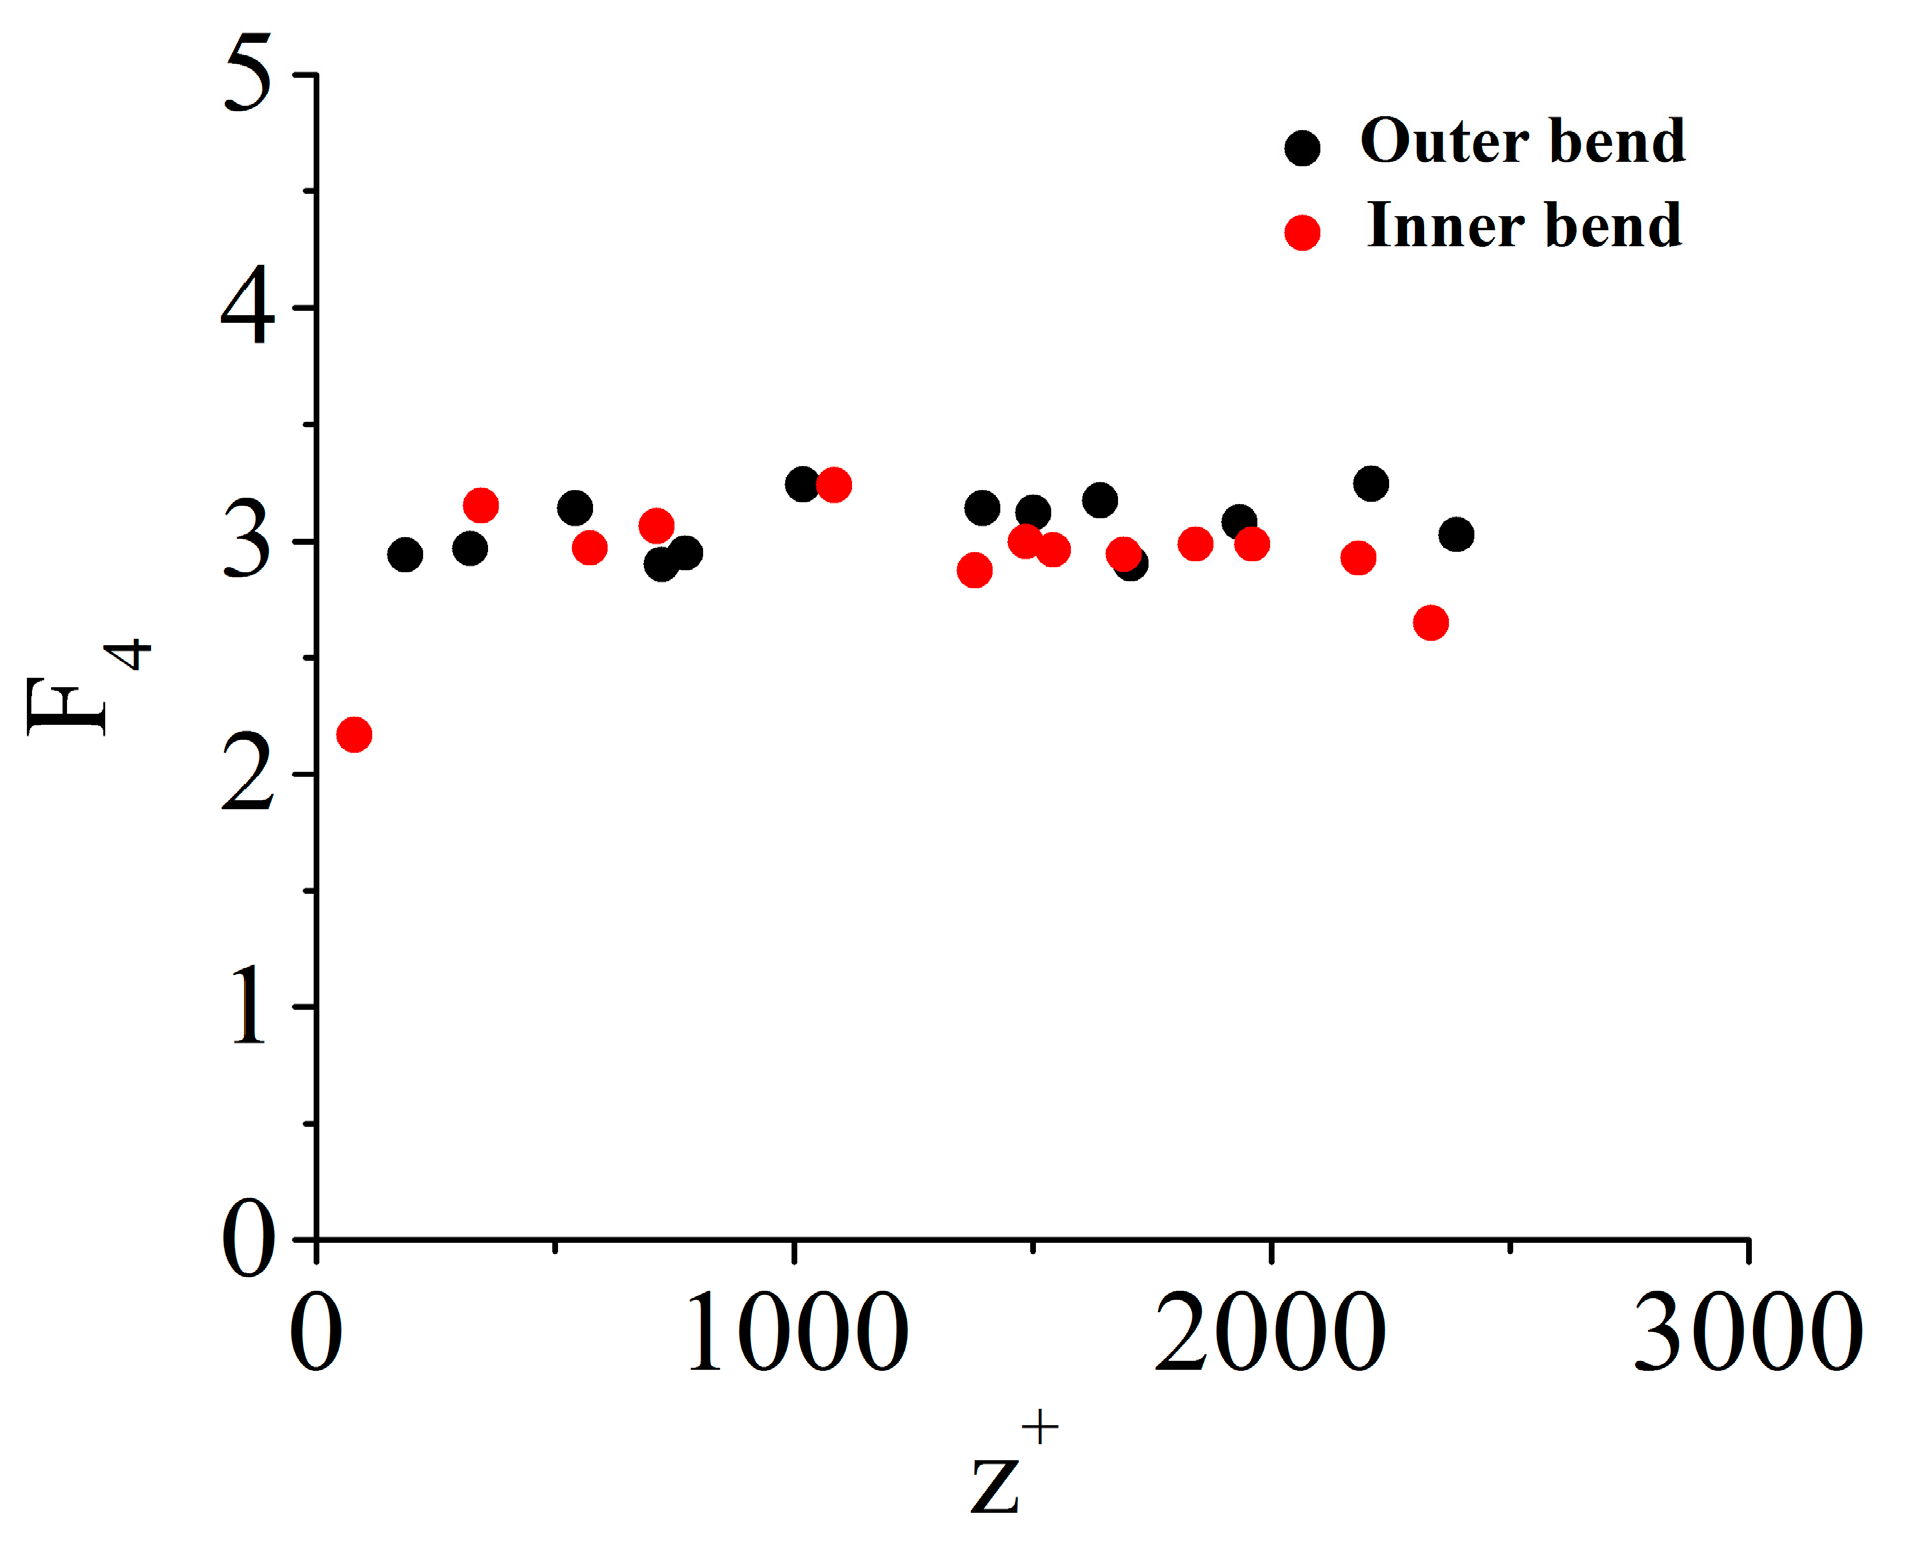
Further investigation was carried to see the flatness or kurtosis in the inner and outer bend of the channel (Figure 9). The flatness factor of streamwise velocity was calculated as:
The flatness factor in the outer bend of the channel is greater than that in the inner bend. From Figure 9, we can comment that from , the flatness in the outer bend has increased in comparison to the inner bend. Most points in the outer bend follow which represents distribution with a peaky signal characteristic. On the other hand, points in the inner bend follow representing distribution with a flat characteristic. The average kurtosis of the outer bend is , and that of inner bend is throughout the flow depth. This characteristic indicates the erosional behaviour in the outer bend.
4. Conclusions
Higher-order moments of streamwise velocity fluctuations were studied to explain the erosional behaviour of the outer bend of a sinuous river channel. The higher-order moments in association with the morphological changes of a channel contribute a novel approach to understand the turbulent nature in a sinuous channel. The stresses are found higher in the outer bend, which are well reported earlier in the literature. Analyzing the high-order velocity fluctuations has provided clear insights into the scour mechanism near the outer wall of the sinuous bend. The profile of the velocity fluctuations for inner and outer bends at higher moments and show logarithmic nature from a particular depth . In all these cases, the magnitude of outer bend velocity fluctuation is more when compared to the inner bend. Premultiplied PDFs for and for outer bend are greater than those of the inner bend. Both the points indicate that though the mean velocity at inner bend is higher than the outer bend, its erosional behaviour mainly depends on the fluctuations from the mean velocity. Further, the constants of the logarithmic law for velocity fluctuations depend on the location of the flow impact in the sinuous channel. The flatness factor or kurtosis of streamwise velocity was also found to be slightly higher in the outer bend as compared to inner bend. A similar investigation can be carried out with field data. The analysis of structure function can also be applicable to different sediment particles, flow condition, and numerical modeling.
Author Contributions
J.T. and J.B. did the experimentation, analysis, and wrote the first draft of the manuscript; B.K. supervised the work; J.T., J.B., B.K., and G.O. completed the final draft. All authors have read and agreed to the published version of the manuscript.
Funding
This research received no external funding.
Conflicts of Interest
The authors declare no conflict of interest.
References
- Rozovskiῐ, I.L. Flow of Water in Bends of Open Channels; Academy of Sciences of the Ukrainian SSR: Kiev, Ukraine, 1957. [Google Scholar]
- Anwar, H.O. Turbulent structure in a river bend. J. Hydraul. Eng. 1986, 112, 657–669. [Google Scholar] [CrossRef]
- De Vriend, H.J.; Geldof, H.J. Main flow velocity in short river bends. J. Hydraul. Eng. 1983, 109, 991–1011. [Google Scholar] [CrossRef]
- Blanckaert, K.; Graf, W.H. Mean flow and turbulence in open-channel bend. J. Hydraul. Eng. 2001, 127, 835–847. [Google Scholar] [CrossRef]
- Booij, R. Modeling the flow in curved tidal channels and rivers. In Proceedings of the International Conference on Estuaries and Coasts, Hangzhou, China, 9–11 November 2003; pp. 786–794. [Google Scholar]
- Sukhodolov, A.; Kaschtschejewa, E. Turbulent flow in a meander bend of a lowland river: Field measurements and preliminary results. In Proceedings of the River Flow 2010, Braunschweig, Germany, 8–10 September 2010; Dittrich, A., Koll, K., Aberle, J., Geisenhainer, P., Eds.; River Flow 2010. Karlsruhe: Bundesanstalt für Wasserbau. S. 309-316. [Google Scholar]
- Engel, F.L.; Rhoads, B.L. Velocity profiles and the structure of turbulence at the outer bank of a compound meander bend. Geomorphology 2017, 295, 191–201. [Google Scholar] [CrossRef]
- Graf, W.H.; Blanckaert, K. Flow around bends in rivers. In Proceedings of the 2nd International Conference New Trends in Water and Environmental Engineering for Safety and Life: Eco-Compatible Solutions for Aquatic Environments, Capri, Italy, 24–28 June 2002; pp. 1–9. [Google Scholar]
- Blanckaert, K. Topographic steering, flow recirculation, velocity redistribution, and bed topography in sharp meander bends. Water Resour. Res. 2010, 46. [Google Scholar] [CrossRef]
- Blanckaert, K. Analysis of coherent flow structures in a bend based on instantaneous-velocity profiling. In Proceedings of the 3rd International Symposium on Ultrasonic Doppler Methods for Fluid Mechanics and Fluid Engineering, EPFL, Lausanne, Switzerland, 9–11 September 2002. [Google Scholar]
- Esfahani, F.S.; Keshavarzi, A. Effect of different meander curvatures on spatial variation of coherent turbulent flow structure inside ingoing multi-bend river meanders. Stoch. Environ. Res. Risk Assess. 2011, 25, 913–928. [Google Scholar] [CrossRef]
- Xu, D.; Bai, Y. Experimental study on the bed topography evolution in alluvial meandering rivers with various sinuousnesses. J. Hydro-Environ. Res. 2013, 7, 92–102. [Google Scholar] [CrossRef]
- Binns, A.D.; da Silva, A.M.F. Meandering bed development time: Formulation and related experimental testing. Adv. Water Resour. 2015, 81, 152–160. [Google Scholar] [CrossRef]
- Huggett, R.J. Fundamentals of Geomorphology, 4th ed.; Routledge—Taylor & Francis Group: New York, NY, USA, 2017. [Google Scholar]
- Da Silva, A.M.; Ebrahimi, M. Meandering Morphodynamics: Insights from Laboratory and Numerical Experiments and Beyond; American Society of Civil Engineers: Reston, VA, USA, 2017. [Google Scholar] [CrossRef]
- Whiting, P.J.; Dietrich, W.E. Experimental studies of bed topography and flow patterns in large-amplitude meanders: 2. Mechanisms. Water Resour. Res. 1993, 29, 3615–3622. [Google Scholar] [CrossRef]
- Whiting, P.J.; Dietrich, W.E. Experimental studies of bed topography and flow patterns in large-amplitude meanders: 1. Observations. Water Resour. Res. 1993, 29, 3605–3614. [Google Scholar] [CrossRef]
- Termini, D. Experimental observations of flow and bed processes in large-amplitude meandering flume. J. Hydraul. Eng. 2009, 135, 575–587. [Google Scholar] [CrossRef]
- Luchi, R.; Zolezzi, G.; Tubino, M. Modelling mid-channel bars in meandering channels. Earth Surf. Process. Landf. 2010, 35, 902–917. [Google Scholar] [CrossRef]
- Zhang, C.; Xu, M.; Hassan, M.A.; Chartrand, S.M.; Wang, Z.; Ma, Z. Experiment on morphological and hydraulic adjustments of step-pool unit to flow increase. Earth Surf. Process. Landf. 2019, 45, 280–294. [Google Scholar] [CrossRef]
- Abidin, R.Z.; Sulaiman, M.S.; Yusoff, N. Erosion risk assessment: A case study of the Langat River bank in Malaysia. Int. Soil Water Conserv. Res. 2017, 5, 26–35. [Google Scholar] [CrossRef]
- Choi, C.E.; Cui, Y.; Au, K.Y.K.; Liu, H.; Wang, J.; Liu, D.; Wang, H. Case study: Effects of a partial-debris dam on riverbank erosion in the Parlung Tsangpo River, China. Water 2018, 10, 250. [Google Scholar] [CrossRef] [Green Version]
- Engel, F.L.; Rhoads, B.L. Interaction among mean flow, turbulence, bed morphology, bank failures and channel planform in an evolving compound meander loop. Geomorphology 2012, 163, 70–83. [Google Scholar] [CrossRef]
- Heller, V. Scale effects in physical hydraulic engineering models. J. Hydraul. Res. 2011, 49, 293–306. [Google Scholar] [CrossRef]
- Peakall, J.; Ashworth, P.J.; Best, J.L. Meander-bend evolution, alluvial architecture, and the role of cohesion in sinuous river channels: A flume study. J. Sediment. Res. 2007, 77, 197–212. [Google Scholar] [CrossRef]
- Braudrick, C.A.; Dietrich, W.E.; Leverich, G.T.; Sklar, L.S. Experimental evidence for the conditions necessary to sustain meandering in coarse-bedded rivers. Proc. Natl. Acad. Sci. USA 2009, 106, 16936–16941. [Google Scholar] [CrossRef] [Green Version]
- Coz, J.L.; Michalkova, M.; Hauet, A.; Comaj, M.; Dramais, G.; Holubová, K.; Piégay, H.; Paquier, A. Morphodynamics of the exit of a cutoff meander: Experimental findings from field and laboratory studies. Earth Surf. Process. Landf. J. Br. Geomorphol. Res. Group 2010, 35, 249–261. [Google Scholar] [CrossRef] [Green Version]
- Meneveau, C.; Marusic, I. Generalized logarithmic law for high-order moments in turbulent boundary layers. J. Fluid Mech. 2013, 719. [Google Scholar] [CrossRef] [Green Version]
- De Silva, C.M.; Marusic, I.; Woodcock, J.D.; Meneveau, C. Scaling of second-and higher-order structure functions in turbulent boundary layers. J. Fluid Mech. 2015, 769, 654–686. [Google Scholar] [CrossRef] [Green Version]
- Sharma, A.; Kumar, B. High-Order Velocity Moments of Turbulent Boundary Layers in Seepage Affected Alluvial Channel. J. Fluids Eng. 2018, 140, 81204. [Google Scholar] [CrossRef]
- Leopold, L.B.; Langbein, W.B. River meanders. Sci. Am. 1966, 214, 60–73. [Google Scholar] [CrossRef]
- Yalin, M.S. River Mechanics; Pergamon Press: Oxford, UK, 1992. [Google Scholar]
- Yalin, M.S.; Da Silva, A.M.F. Fluvial Processes; IAHR Monograph: Delft, The Netherlands, 2001. [Google Scholar]
- Schwarz, A.C.; Plesniak, M.W.; Murthy, S.N.B. Response of turbulent boundary layers to multiple strain rates. J. Fluid Mech. 2002, 458, 333–377. [Google Scholar] [CrossRef]
- Goring, D.G.; Nikora, V.I. Despiking acoustic Doppler velocimeter data. J. Hydraul. Eng. 2002, 128, 117–126. [Google Scholar] [CrossRef] [Green Version]
- Dey, S.; Das, R.; Gaudio, R.; Bose, S.K. Turbulence in mobile-bed streams. Acta Geophys. 2012, 60, 1547–1588. [Google Scholar] [CrossRef]
- Deshpande, V.; Kumar, B. Turbulent flow structures in alluvial channels with curved cross-sections under conditions of downward seepage. Earth Surf. Process. Landf. 2016, 41, 1073–1087. [Google Scholar] [CrossRef]
- Shams, M.; Ahmadi, G.; Smith, D.H. Computational modeling of flow and sediment transport and deposition in meandering rivers. Adv. Water Resour. 2002, 25, 689–699. [Google Scholar] [CrossRef]
- Golden Software, LLC. 809 14th Street, Golden, Colorado 80401. Available online: https://www.goldensoftware.com/ (accessed on 10 March 2020).
- Rahman, M.; Nagata, N.; Hosoda, T.; Muramoto, Y. Experimental study on morphological process of meandering channels with bank erosion. Proc. Hydraul. Eng. 1996, 40, 947–952. [Google Scholar] [CrossRef]
- Da Silva, A.M.F.; El-Tahawy, T.; Tape, W.D. Variation of flow pattern with sinuosity in sine-generated meandering streams. J. Hydraul. Eng. 2006, 132, 1003–1014. [Google Scholar] [CrossRef]
- Nezu, I. Turbulent Structure in Open-Channel Flows. English Translation of the Japanese Dissertation of Iehisa Nezu. 1977. Available online: https://repository.tudelft.nl/islandora/object/uuid%3Aa41f39c2-fce6-4647-bd7a-1d412c720ed7 (accessed on 10 March 2020).
- Marusic, I.; Kunkel, G.J. Streamwise turbulence intensity formulation for flat-plate boundary layers. Phys. Fluids 2003, 15, 2461–2464. [Google Scholar] [CrossRef]
- Hultmark, M.; Vallikivi, M.; Bailey, S.C.C.; Smits, A.J. Turbulent pipe flow at extreme Reynolds numbers. Phys. Rev. Lett. 2012, 108, 94501. [Google Scholar] [CrossRef] [PubMed] [Green Version]
Figure 1.
Schematic diagram of the experimental setup showing: (a) Side view of the experimental flume; (b) plan view of the experimental setup; (c) section and where velocities were measured at locations 1, 2, 3, 4, and 5; (d) sections from to where ultrasonic ranging system (URS) readings were made to track morphological changes.

Figure 2.
Power spectra of unfiltered and filtered velocity time-series at outer and inner bends. is the velocity power spectra of the streamwise velocity , which is a function of frequency (in Hz).
Figure 2.
Power spectra of unfiltered and filtered velocity time-series at outer and inner bends. is the velocity power spectra of the streamwise velocity , which is a function of frequency (in Hz).

Figure 3.
Streamwise velocity profile at the outer (location 1) and inner bends (location 2) of the sinuous channel.
Figure 3.
Streamwise velocity profile at the outer (location 1) and inner bends (location 2) of the sinuous channel.

Figure 4.
Contour plots of streamwise velocity at the bend cross-sections (a) and (c) of the sinuous channel.
Figure 4.
Contour plots of streamwise velocity at the bend cross-sections (a) and (c) of the sinuous channel.

Figure 5.
Morphological changes along the second bend of the sinuous channel after 2, 6, and 10 h. This bend was selected because it was unaffected by the entry and exit conditions.
Figure 5.
Morphological changes along the second bend of the sinuous channel after 2, 6, and 10 h. This bend was selected because it was unaffected by the entry and exit conditions.

Figure 6.
Cross-sectional morphological changes across the bend apex (section i) after 2, 4, 6, 8, and 10 h.
Figure 6.
Cross-sectional morphological changes across the bend apex (section i) after 2, 4, 6, 8, and 10 h.

Figure 7.
Streamwise velocity variance in turbulent boundary layers for flow at inner and outer bends of the sinuous river channel.
Figure 7.
Streamwise velocity variance in turbulent boundary layers for flow at inner and outer bends of the sinuous river channel.

Figure 8.
Premultiplied probability density functions (PDF) of normalized velocity fluctuations at with moments (a) and (b) . (c) Moments of order for streamwise velocity as a function of wall-normal distance. Moments of different orders of streamwise velocity fluctuation as a function of wall normal distance for flow subjected to (d) outer bend and (e) inner bend.

Figure 9.
Flatness factor as a function of the wall distance for outer and inner bend of the sinuous channel.
Figure 9.
Flatness factor as a function of the wall distance for outer and inner bend of the sinuous channel.


Table 1.
Uncertainty test of acoustic doppler velocimeter (ADV) data.*
| Standard Deviation | ||||||
| Uncertainty (%) |
*, , and are the root mean square values of and respectively.
Table 2.
Uncertainty test for ultrasonic ranging system (URS) measurements.
| Standard Deviation | |
|---|---|
| Uncertainty (%) |
© 2020 by the authors. Licensee MDPI, Basel, Switzerland. This article is an open access article distributed under the terms and conditions of the Creative Commons Attribution (CC BY) license (http://creativecommons.org/licenses/by/4.0/).
Share and Cite
MDPI and ACS Style
Taye, J.; Barman, J.; Kumar, B.; Oliveto, G. Deciphering Morphological Changes in a Sinuous River System by Higher-Order Velocity Moments. Water 2020, 12, 772. https://doi.org/10.3390/w12030772
AMA Style
Taye J, Barman J, Kumar B, Oliveto G. Deciphering Morphological Changes in a Sinuous River System by Higher-Order Velocity Moments. Water. 2020; 12(3):772. https://doi.org/10.3390/w12030772
Chicago/Turabian StyleTaye, Jyotismita, Jyotirmoy Barman, Bimlesh Kumar, and Giuseppe Oliveto. 2020. "Deciphering Morphological Changes in a Sinuous River System by Higher-Order Velocity Moments" Water 12, no. 3: 772. https://doi.org/10.3390/w12030772
Note that from the first issue of 2016, this journal uses article numbers instead of page numbers. See further details here.