Article

Earthquake-Induced Spring Discharge Modifications: The Pescara di Arquata Spring Reaction to the August–October 2016 Central Italy Earthquakes

1
Dipartimento di Fisica e Geologia, Università di Perugia, Via Pascoli snc, 06123 Perugia, Italy
2
Dipartimento SIMAU, Università Politecnica delle Marche, Via Brecce Bianche 12, 60122 Ancona, Italy
3
Regione Umbria, Servizio Risorse Idriche e Rischio Idraulico, Piazza Partigiani 1, 06124 Perugia, Italy
4
Dipartimento di Scienze, Università degli Studi Roma Tre, Largo S. Leonardo Murialdo 1, 00146 Rome, Italy
*
Author to whom correspondence should be addressed.
Water 2020, 12(3), 767; https://doi.org/10.3390/w12030767
Submission received: 27 January 2020 / Revised: 20 February 2020 / Accepted: 3 March 2020 / Published: 10 March 2020
(This article belongs to the Section Water Use and Scarcity)

Abstract

:
Co-seismic changes in groundwater regime are often observed after moderate to strong earthquakes. The 24 August 2016 Mw 6.0 extensional Amatrice earthquake, which was the first event of a long-lasting seismic sequence, including the 30 October 2016 Mw 6.5 Norcia event, triggered a significant discharge alteration to the Pescara di Arquata spring, located in the Umbria-Marche Apennines (Northern Apennines, Central Italy) and exploited for drinking purposes. During the first five months after the first mainshock, an extra flow of about 30% was recorded, while both water chemistry and temperature did not show significant changes. Thereafter, the spring discharge decreased significantly, and at the end of 2019 it was still lower than normal. The Standardized Precipitation Index (SPI) indicates that these low mean monthly discharge values are not related to particularly dry conditions. The increase in post-seismic depletion coefficients indicates that the aquifer empties faster than it did during the inter-seismic period. The observed transient increase and subsequent decrease of discharge are consistent with a transient, earthquake-related increase in hydraulic conductivity.

1. Introduction

Earthquakes are historically known to cause hydrogeological modifications, including changes in chemical composition [1,2], streamflow [3,4,5,6,7,8,9], and spring characteristics [10,11]. In particular, long-lasting spring and stream excess flows are known to accompany major normal faults and strike-slip faults earthquakes [9,10,11], although discharge increases have been also detected for thrust faults induced earthquakes (see, for example [5,12]). According to Sibson [13], for normal faults, fluid movement is favored along the fault strike (along the σ2) during the inter-seismic period when the fault surface mainly behaves as a barrier. During the seismic shock, if the earthquake is strong enough to break through the entire seismogenic layer (or even to cause surface ruptures), the fault rock becomes a highly permeable layer, which drains fluids from the uplifting foot-wall to the subsiding hanging-wall.
As reported by Mohr et al. [12], discharge increases after earthquakes, observed mainly on stream gauges, can be explained by three mechanisms: (i) changes in static strain determining aquifer geometry modifications, pore pressure changes and consequent variations of hydraulic gradient i [3]; (ii) dynamic strain effects such as consolidation and shaking of water out of the unsaturated zone [5,6,7,8,14]; (iii) increased permeability due to dynamic strain [4,9,11,12,15,16,17,18].
Increase of spring and streamflow discharge due to extensional tectonics are common effects in the Italian Apennines. Esposito et al. [19] described, among others, the consequences of the 1980 Irpinia earthquake, which caused hydrogeological effects as far as 200 km; in particular, a significant increase of the Caposele spring flow was observed, which returned to normal conditions after about one year.
Amoruso et al. [16] described the hydrogeological changes that occurred after the 2009 L’Aquila earthquake. These effects included the sudden disappearance of some springs located along the normal fault responsible for the earthquake, an immediate discharge increase of both the drainages along the Gran Sasso highway tunnel and other springs, and, in the following months, an increase of the water table elevation of the Gran Sasso fractured aquifer. According to the authors, these changes were related to the increase of permeability at the aquifer scale, which caused hydraulic heads raising in the discharge zones and their lowering in recharge areas.
Relating to the same earthquake, Adinolfi Falcone et al. [20] indicated that, in agreement with the observed gradual return to the pre-seismic situation, the observed changes have non-permanent effects because they can be due to a fracture cleaning, rather than to the formation of new micro cracks.
Petitta et al. [9] described the hydrogeological effects of the 2016–2017 seismic sequence in Central Italy, providing preliminary considerations on the causes of the observed phenomena. The authors considered data from 22 sites, located in a wide area, within 100 km from the epicenter. They found that post-seismic discharge from rivers and springs had increased, overall, more than 9 m3/s, with a consequent groundwater release of more than 1 × 10⁸ m3 over 6 months. These effects can be due to both an increase of bulk hydraulic conductivity (K) at the aquifer scale and, partly, to other mechanisms, such as shaking and/or squeezing effects related to intense subsidence in the core of the affected area or breaching of hydraulic barriers.
Valigi et al. [11] analysed the effects of the 2016 seismic sequence in the Norcia Plane, close to the epicenter of the 30 October event. They found that at least 2.4 m3/s of groundwater was added to the original baseflow amount of the Sordo River with the additional discharge mainly fed by the basal carbonate aquifer stored in the Sibillini Massif, east of the Norcia Plain.
Mastrorillo et al. [21] analysed the consequences of the 2016 Central Italy seismic sequence on the fractured carbonate Basal aquifer of Valnerina–Sibillini Mts, here interpreted by means of basin-in-series conceptual model in which the thrusts and extensional faults have clearly influenced the groundwater flow directions before and after the seismic sequence. A significant discharge surplus was observed, not explained only by the increase in hydraulic conductivity, evaluated to be less than 20%, but also by a shift in the piezometric divide of the hydrogeological system, which could have caused a potentially permanent change in the Basal aquifer, lowering the discharge amount of the eastern springs.
Di Matteo et al. [22] showed that the 2016 seismic sequence changed the recession processes of the Nera River. Post-seismic recession curves, related to a non-Darcian flow, show that after the earthquake, the system empties faster than it did before, when the recession curves were consistent with a Darcian flow. If this effect persists, the Nera River flow will be more variable than it was in the past, causing significant problems to water-using productive activities.
Some studies relied upon the hydrograph analysis of streams baseflow, the streamflow component provided by groundwater, to investigate the mechanisms responsible for discharge variation due to earthquakes. In particular, some authors used the baseflow recession curve [5,6,15], which is known to be related to aquifer geometry and parameters [5,22,23], to verify whether the increase of discharge was directly related to an increase in hydraulic conductivity.
Following a moderate to strong earthquake crisis, the comparison between the previously known recession curve trend and an extra discharge released by the aquifer, unrelated to precipitation and recharge, allows to estimate the extra water volume due to seismic events [24].
The present work analyses the effects of the normal faulting Central Italy 2016–2017 seismic sequence (Mwmax = 6.5) on the Pescara di Arquata spring, located on the eastern side of Sibillini Mountains at 926 m above sea level (Figure 1).
The aquifer feeding this spring is contained in a fractured carbonate synclinal core not connected to the basal aquifer. Basal groundwater systems of the same area located west of the Sibillini Mountains experienced a significant and sometimes long-lasting discharge increase [9,11,21,25], while those located east of the Sibillini Mountains experienced a discharge decrease [21]. On the contrary, Pescara di Arquata spring first experienced an increase of discharge, lasting five months after the earthquake. Later on, the spring discharge started to decrease significantly. At the end of 2019, the spring discharge was still lower than normal.

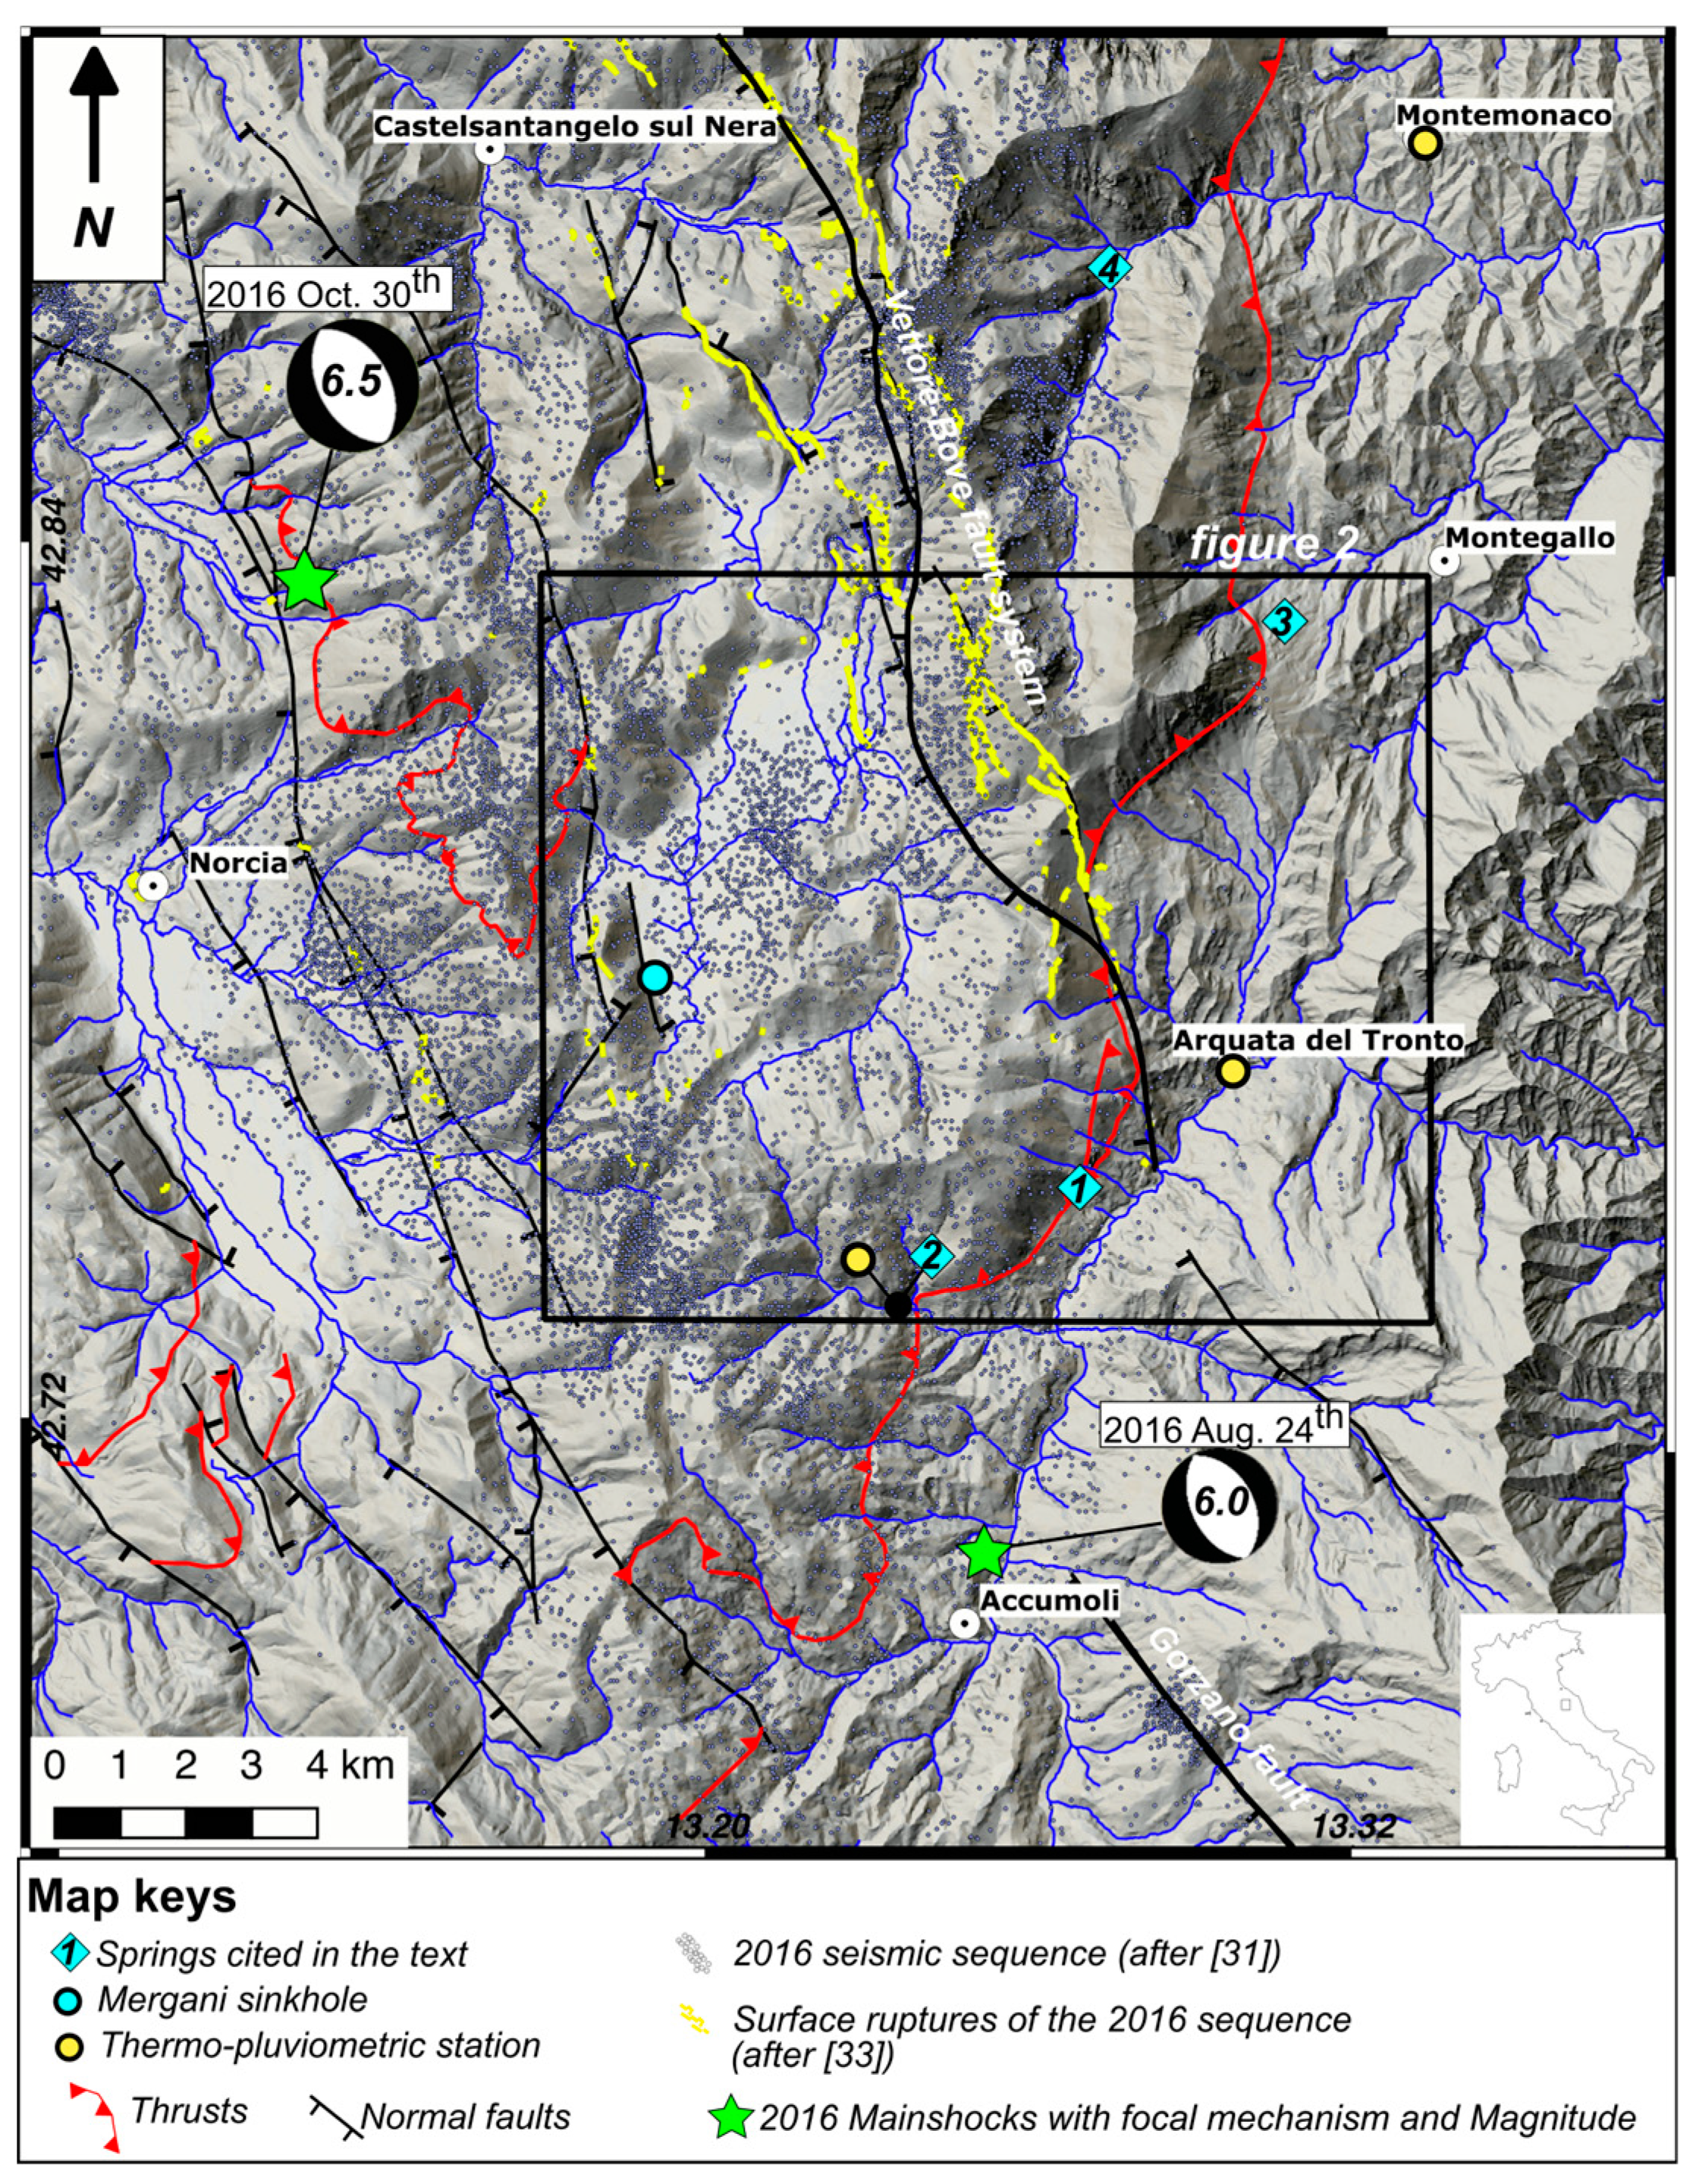
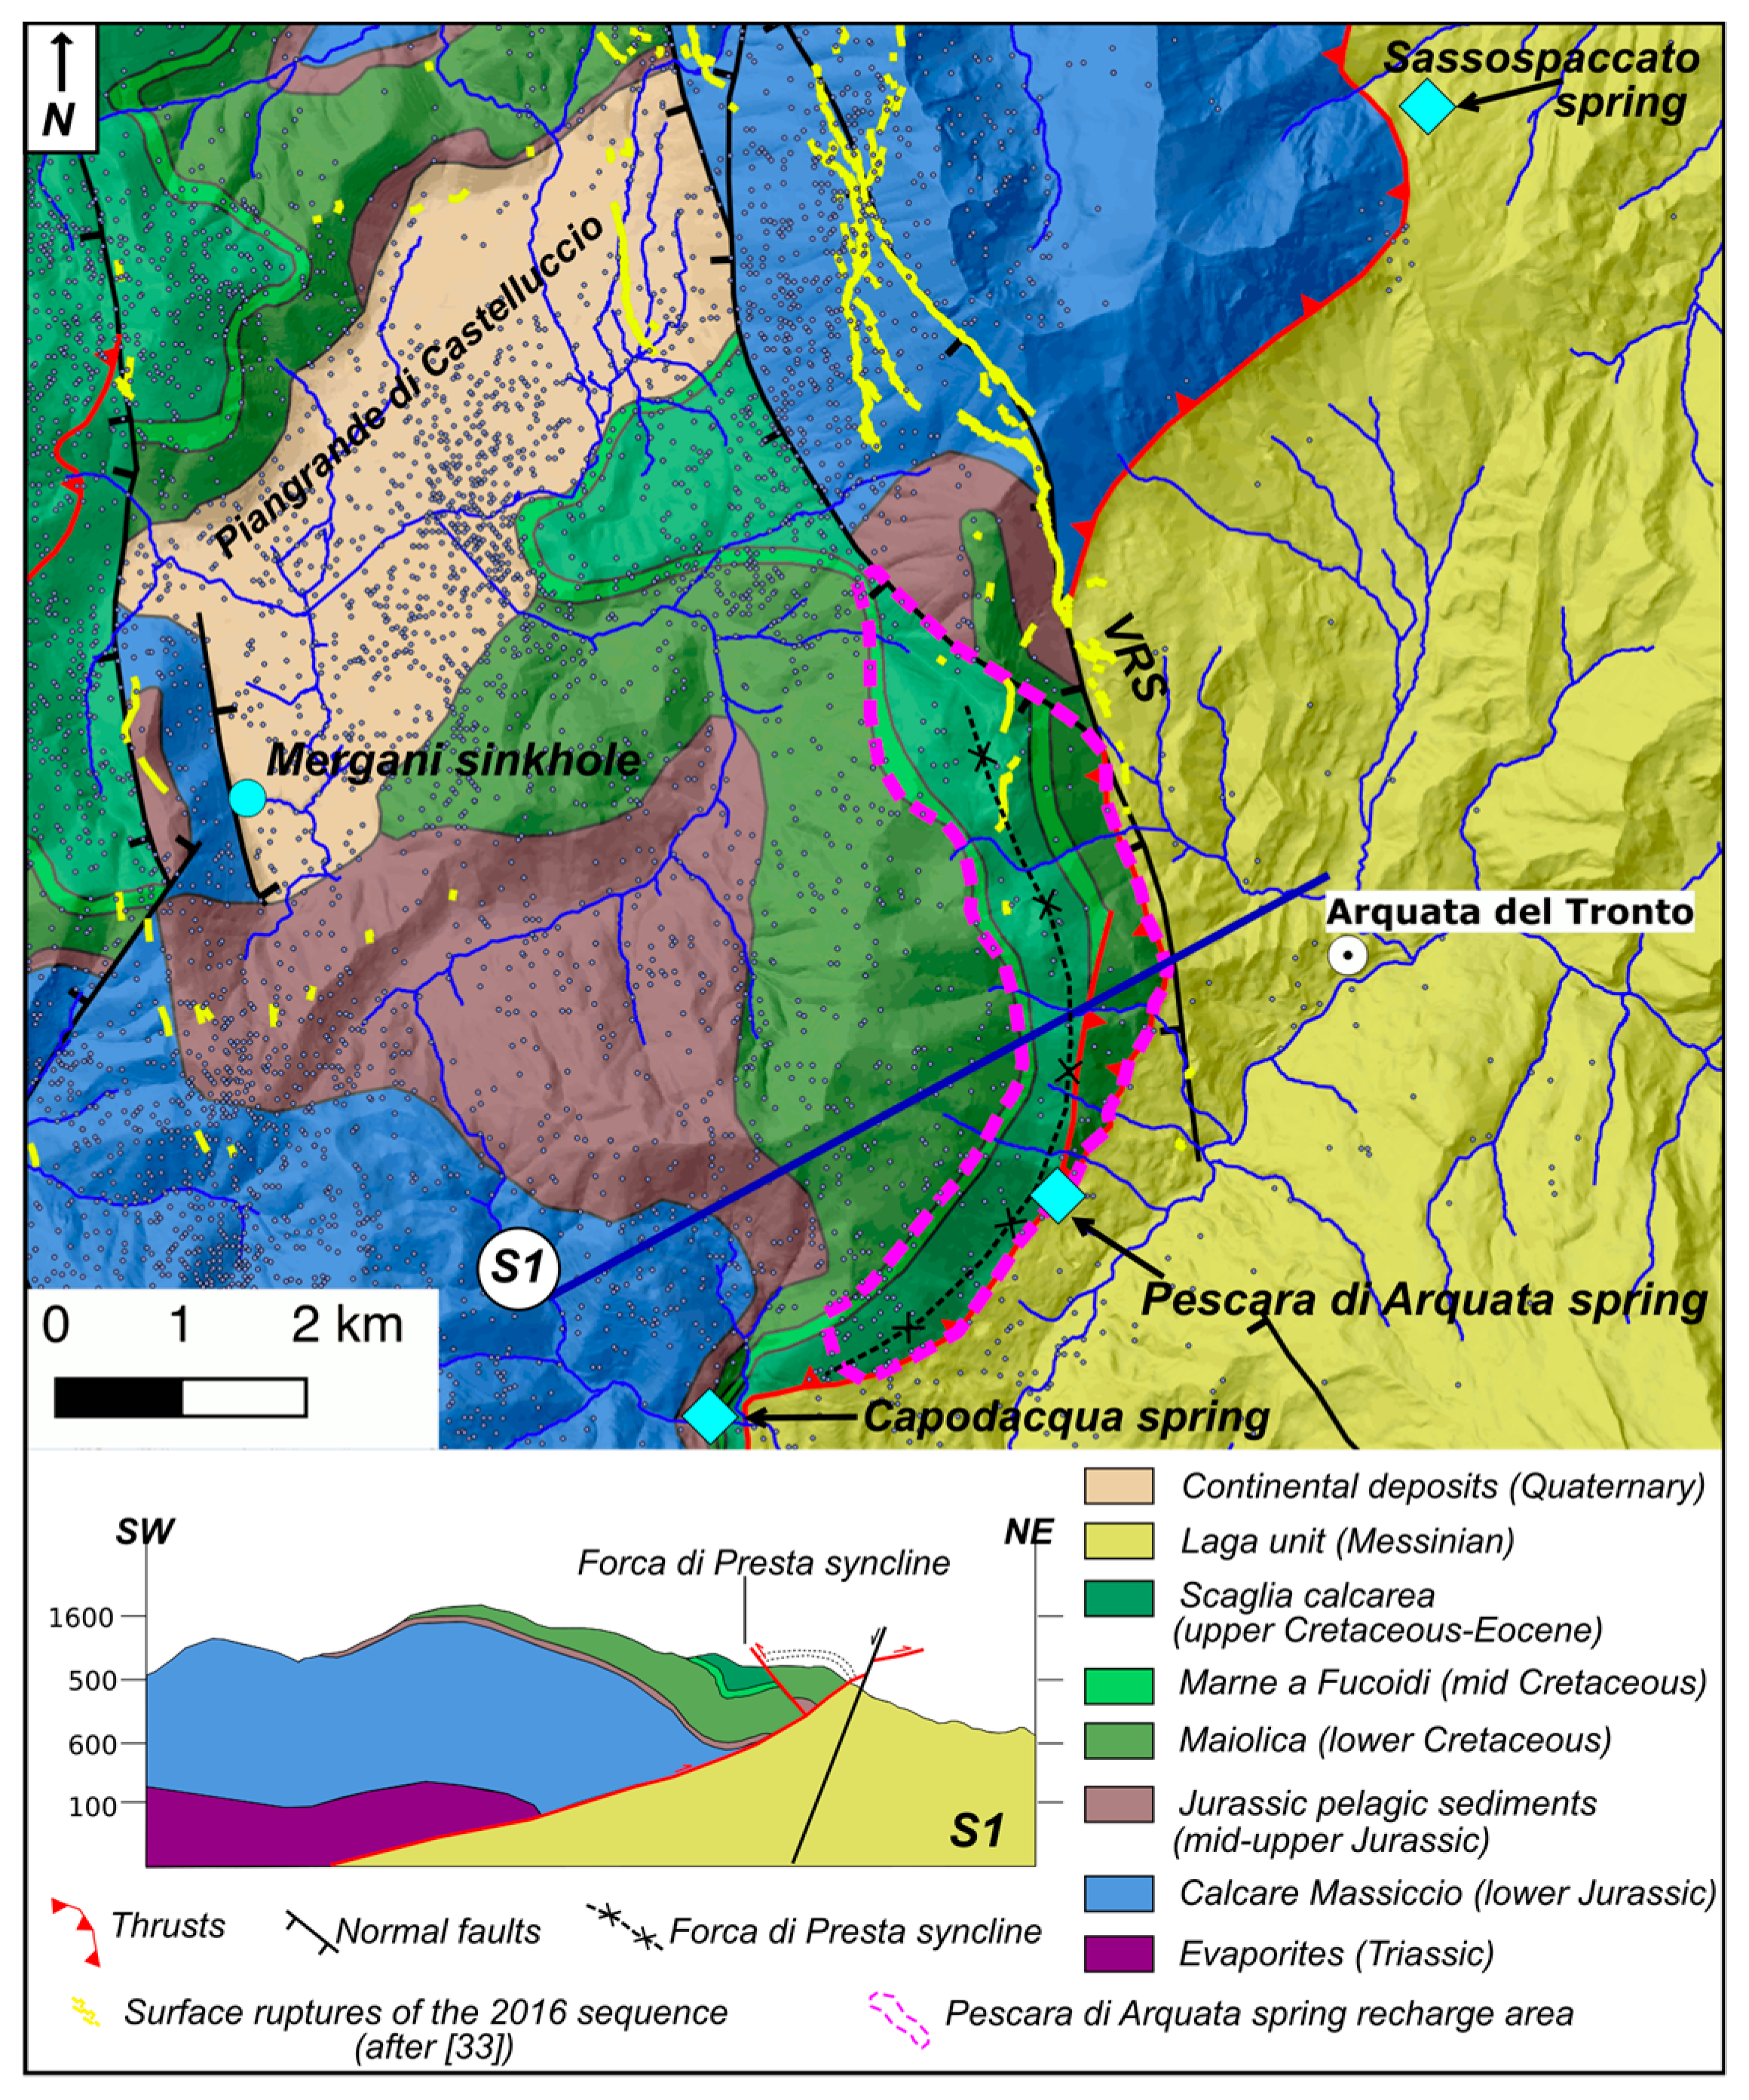
2. Geological and Hydrogeological Setting

2.1. Geology

The Pescara di Arquata spring is located 926 m above sea level on the south-eastern side of the Sibillini Mountains, which are part of the carbonate reliefs of the Umbria-Marche Apennines (Central Italy; Figure 1). These are made up of a thick carbonate shelf unit (Early Jurassic), overlain by pelagic sediments (Early Jurassic–Oligocene) and overlying Triassic evaporites, which do not crop in the area. The structural setting of these reliefs is the result of a compressive tectonic stage (Late Miocene–Early Pliocene), which generated the thrust and folds chain, followed by extensional tectonic (early Pleistocene–present). The main compressional tectonic element is represented by the Sibillini Mountains thrust, located slightly east of the spring (Figure 2), which causes the Early Jurassic–Cretaceous carbonatic multilayer to overthrust the Laga Flysch (Messinian) [26,27,28].
The main fold structures of the area include anticlines and synclines, one of which is the Forca di Presta syncline (Figure 2). All the compressional structures are dissected by a series of NW-SE trending normal faults related to the extensional tectonic stage, active since the early Pleistocene. These faults produced a general vertical downthrown towards the SW of more than 2 km, and they are responsible for most of the seismicity of the area [28,29,30,31]. The extensional belt in the area is composed, from NW to SE, by the SW-dipping Monte Vettore-Monte Bove fault system (VBFS) and the Mt. Gorzano fault. These faults were activated during the 2016–2017 earthquake sequence, which lasted 6 months and was characterized by the occurrence of more than 9 events with Mw > 5.0. The mainshocks of the sequence were recorded near Accumoli on 24 August and near Norcia on 30 October 2016. In the study area, along the Vettoretto–Redentore fault segment (VRS), several co-seismic surface ruptures were recorded after both the August and October mainshocks [28,32,33,34,35].

2.2. Hydrogeology

The hydrogeological setting of the area is strongly connected with the stratigraphic and structural features of the Umbria-Marche domain. In the surrounding reliefs, the most massive, thick and calcareous formations of the Umbria-Marche sedimentary sequence host two different aquifers: (i) the main one is located in the Calcare Massiccio (a highly porous, karsified and fractured Early Jurassic shelf limestone) and Corniola formations, and (ii) the second one is hosted in the Maiolica formation, a highly fractured stratified pelagic limestone (lower Cretaceous) with a thickness up to 400 m. These two aquifers can be considered hydraulically independent at a local scale, as they are stratigraphically separated from each other by a Jurassic sequence, mostly composed of siliceous and marly limestones, acting as an aquitard. However, in the regional hydrogeological framework, a single aquifer (Basal aquifer) is usually recognized comprehending the above-mentioned aquifers.
Above these two, other upper aquifers are located inside the Scaglia Bianca and Scaglia Rossa formations (also known, in overall, as Calcareous Scaglia, late Cretaceous–middle Eocene), made of thin to medium-layered pelagic limestones. The Marne a Fucoidi formation (middle-Cretaceous), made of marly sediments, represents the aquiclude stratigraphically dividing the Basal aquifer and the Scaglia aquifers [36,37,38].
In this stratigraphic context, the groundwater circulation is also deeply influenced by the structural setting described above. The core of anticlines and synclines generally represent recharge areas stratigraphically delimited by low permeability formations in correspondence of which springs often emerge. The compressive structures, such as the thrusts, generally act as a no-flow boundaries, whereas the role of the extensional faults is more debated; they can act as preferential drainage paths, putting in contact different aquifers otherwise isolated from each other for stratigraphic reasons, or they can act as no flow boundaries [39]. The role of the faults in favoring groundwater movement also changes from the inter-seismic to the co-seismic period [13].
The Pescara di Arquata is one of the main springs emerging on the eastern side of the Sibillini Mountains and has been exploited for drinking purposes since 1955; its water supplies, among others, the main city of this area, Ascoli Piceno. The spring emerges from the Scaglia Calcarea aquifer hosted in the core of the Forca di Presta syncline, close to the Sibillini Mountains thrust, which acts as a no-flow boundary. The low permeability marly formations of Scaglia Variegata and Scaglia Cinerea (middle Eocene, Oligocene) are involved in the thrust deformation and locally crop out in the spring area.
The Pescara di Arquata spring recharge area is estimated to be about 7 km2 wide and roughly corresponds with the core of the Forca di Presta syncline (Figure 2). On the basis of new geological surveys, this area is slightly modified with respect to that considered by other authors [40,41], but the extension is unchanged. The main groundwater flow is NNW-SSE oriented, approximately parallel to the syncline axe. The average annual spring discharge is 263 L/s considering data from 1933 to 2010 [41] while it is about 250 L/s if we consider data from 1960 to 2001 [40,42,43]. On the basis of these values, it cannot be excluded that the recharge area slightly extends beyond the indicated boundaries. Former tracer studies performed before the seismic sequence demonstrated a hydraulic connection between the Pescara di Arquata spring and the Mergani sinkhole [44], draining the surface waters of the Piangrande di Castelluccio, located west of the spring (Figure 1). Nonetheless, this sinkhole is in connection with many other water bodies, springs and rivers located within the Valnerina–Sibillini Mountains water system, towards which it drains a much higher amount of water [38]. The contribution of this sinkhole to the Pescara di Arquata spring discharge is therefore considered negligible here, and no part of the Piangrande is included in the Pescara di Arquata recharge area. New tracer tests and isotopic analyses investigations, presently ongoing, will be aimed at determining whether the hydraulic connection between the Mergani sinkhole and the Pescara di Arquata spring has been modified by the seismic sequence.

3. Materials and Methods

3.1. Geochemical Investigations

Geochemical sampling of the Pescara di Arquata spring was performed in order to investigate possible variations in chemical composition after the seismic events. Sampling started on 30 August 2016, six days after the seismic event of Amatrice (Mw 6.0). Seven samples were collected up to May 2019.
For each sample, temperature, electrical conductivity, pH, Eh and alkalinity were measured in the field. Alkalinity determination was carried out by acid titration with HCl 0.01 N. Water samples for laboratory analyses were filtered with 45 µm filters and collected in 50 mL polyethylene bottles. The samples for the cation analysis were immediately acidified in the field with 0.5 mL of 1:1 diluted HCl.
The concentration of SO4, NO3, Cl and F were determined by ion chromatography, Ca and Mg were determined by atomic absorption (AA) flame spectroscopy on the HCl-acidified sample, whereas Na and K were determined by atomic emission (AE) flame spectroscopy. All the laboratory analytical methods and the field determinations had an accuracy better than 2%. The total analytical error, evaluated by checking the charge balance, was better than 5% for all samples and about 2.5% on average.

3.2. Time Series Analysis

Climatic data recorded from October 1984 to September 2019 in three rainfall and temperature stations, and discharge data recorded on Pescara di Arquata spring, were used in this study.
Continuous daily discharge measurements for the Pescara di Arquata spring were provided by the local water supply authority (CIIP S.p.A. Servizio Idrico Integrato) since 2003; data are available on a monthly scale from 1984 to 2002.
Rainfall data from Capodacqua and Arquata del Tronto climatic stations and temperature data from Montemonaco were used to define climatic characteristics (Table 1). All stations are located on the eastern side of the Sibillini Mountains (Figure 1) and are managed by Regione Marche Civil Protection (Centro Funzionale Multirischi).

3.3. Analysis of Spring Hydrograph

Discharge data form the Pescara di Arquata spring are available on a monthly scale from 1984 to 2002, and on a daily scale from 2003 to September 2019. In the latest interval, the average annual discharge was 229 L/s.
Data allowed to determine the average monthly and annual discharge, the variability index according to Meinzer [45] and the lowest discharge values within this time span.
Daily discharge data were used to study the spring depletion curves. The recession periods were studied by using Maillet equation, Tison equation and the linear model. The analysis showed that the Maillet equation [46] is the one better fitting the data.
According to Maillet, depletion curves can be described by Equation (1):
Q t = Q 0 e α t ,
where Q0 is the discharge at the beginning of the depletion period (t0), Qt is the discharge at time t (calculated from t0) and the parameter α is a depletion coefficient.
Maillet depletion coefficients were determined on every depletion period individuated along the analyzed time interval.
Monthly data were used to study the relationship between discharge and SPI at different time scales.
The same data were used to determine the average discharge over the hydrologic year, here meant as the 12-month-long period from October to next September. The annual discharge was therefore compared with the hydrologic year water surplus.
Finally, the hydrograph was used to evaluate the excess of outflow recorded after the Mw 6.0 seismic shock (24 August 2016). This was done by subtracting from the total discharge recorded from October 2016 to February 2017 the discharge estimated by assuming that, if the earthquakes had not occurred, the former recession curve would have continued undisturbed until December 2016.

3.4. Water Surplus Estimation

Monthly rainfall and temperature data were used to estimate the monthly water surplus over the investigated period by using the Thornthwaite–Mather method [47], which is one of the most reliable procedures to estimate monthly, and consequently annual, water budget [48]. The surplus was calculated on an annual basis on the hydrogeological year (from October to next September). The Thornthwaite equation is used to estimate potential evapotranspiration (PE) and actual evapotranspiration (AE). The difference between monthly rainfall (R) and AE corresponds to monthly water surplus (WS).

3.5. Standardized Precipitation Index (SPI)

The Standardized Precipitation Index (SPI, [49]) was used to investigate how climatic conditions were related to discharge variations. SPI values, at a time scale from 1 to 24 months, were calculated for the Capodacqua and Arquata del Tronto rainfall stations, which are the rainfall stations closest to Pescara di Arquata spring, for which the longest and most reliable mean daily discharge data series are available (January 1985–September 2019).
The aim of this analysis was to determine the occurrence of particularly dry or wet conditions and their relations with the monthly discharge of Pescara di Arquata Spring.
The SPI is the number of standard deviations that the observed value would deviate from the long-term mean, for a normally distributed random variable. In the SPI computation, cumulated rainfalls over different time scales (1, 2, 3 … n months) were fitted to a gamma probability distribution and then transformed into a normal distribution. For a given data time series of precipitation xi as x1, x2 … xn, the SPI is defined by Equation (2):
SPI = x i   x   ¯ σ x
where x   ¯ is the arithmetic mean of rainfall and σx is the standard deviation. For a defined timescale, SPI equal to 0 implies that there is no deviation from the mean. Positive values of SPI indicate wet periods, while negative values indicate dry periods compared with the normal conditions of the area analyzed. The severity of drought events increases when SPI values are highly negative.
Table 2 shows the classification of drought severity based on the SPI values.

4. Results

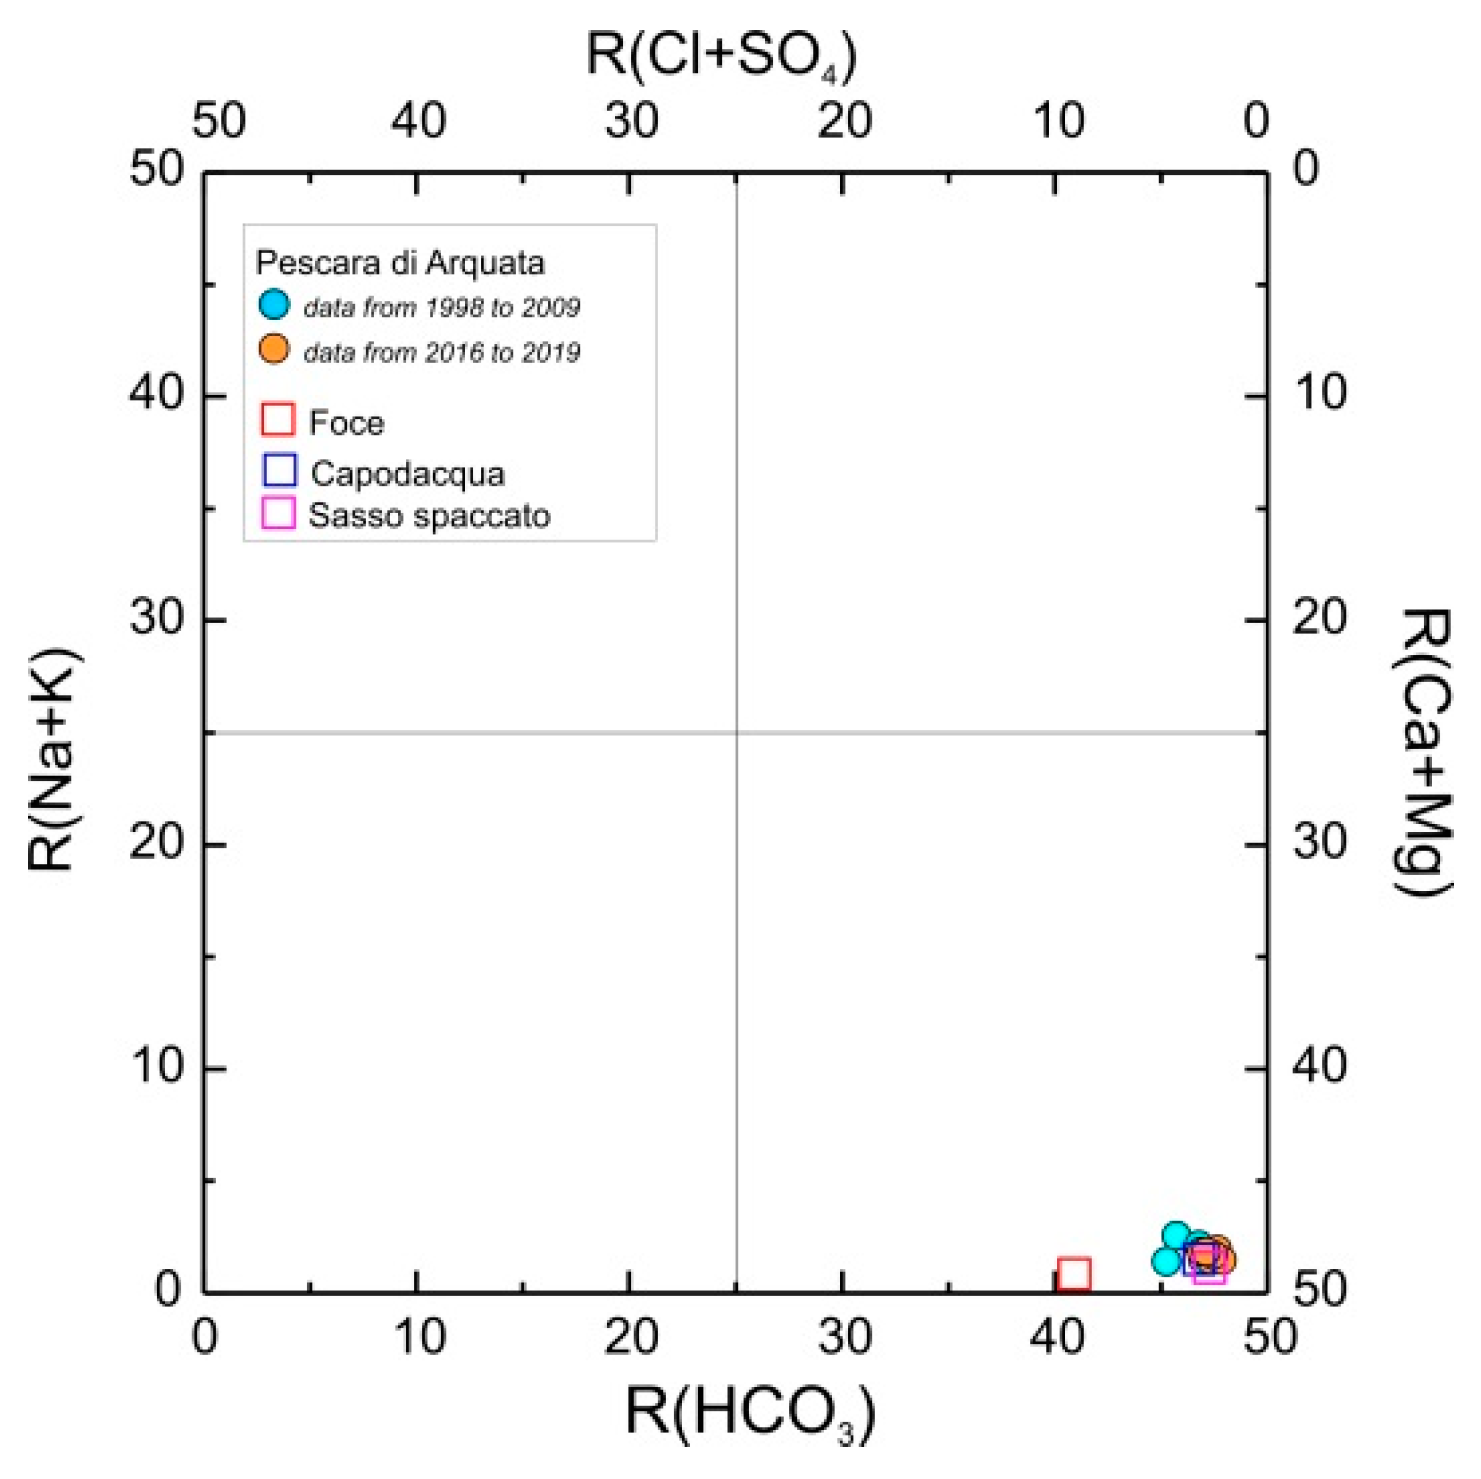
4.1. Chemical Composition of Water

Physical parameters and chemical concentrations of major elements of the Pescara di Arquata spring water collected from 30 August 2016 are reported in Table 3, together with bibliographic data referred to the period from 1998 to 2009 [40,50] and with data of other springs located on the eastern side of the Sibillini Massif, both south and north of Pescara di Arquata spring. The Pescara di Arquata spring water is characterized by Ca-HCO3 composition (Figure 3) and, during the observation period, by temperatures from 7.9 to 9.1 °C, pH values from 7.59 to 7.99 and electrical conductivity from 247 to 265 μS/cm (Table 3). Comparing the new data with those available from previous works, both the physical–chemical parameters and water composition did not show remarkable variations after the earthquake. Considering as a reference the composition of 2009 that, unlike the former ones, was obtained with the same methodologies, only a slight increase of HCO3 after the seismic events, followed by a decrease, can be noted.

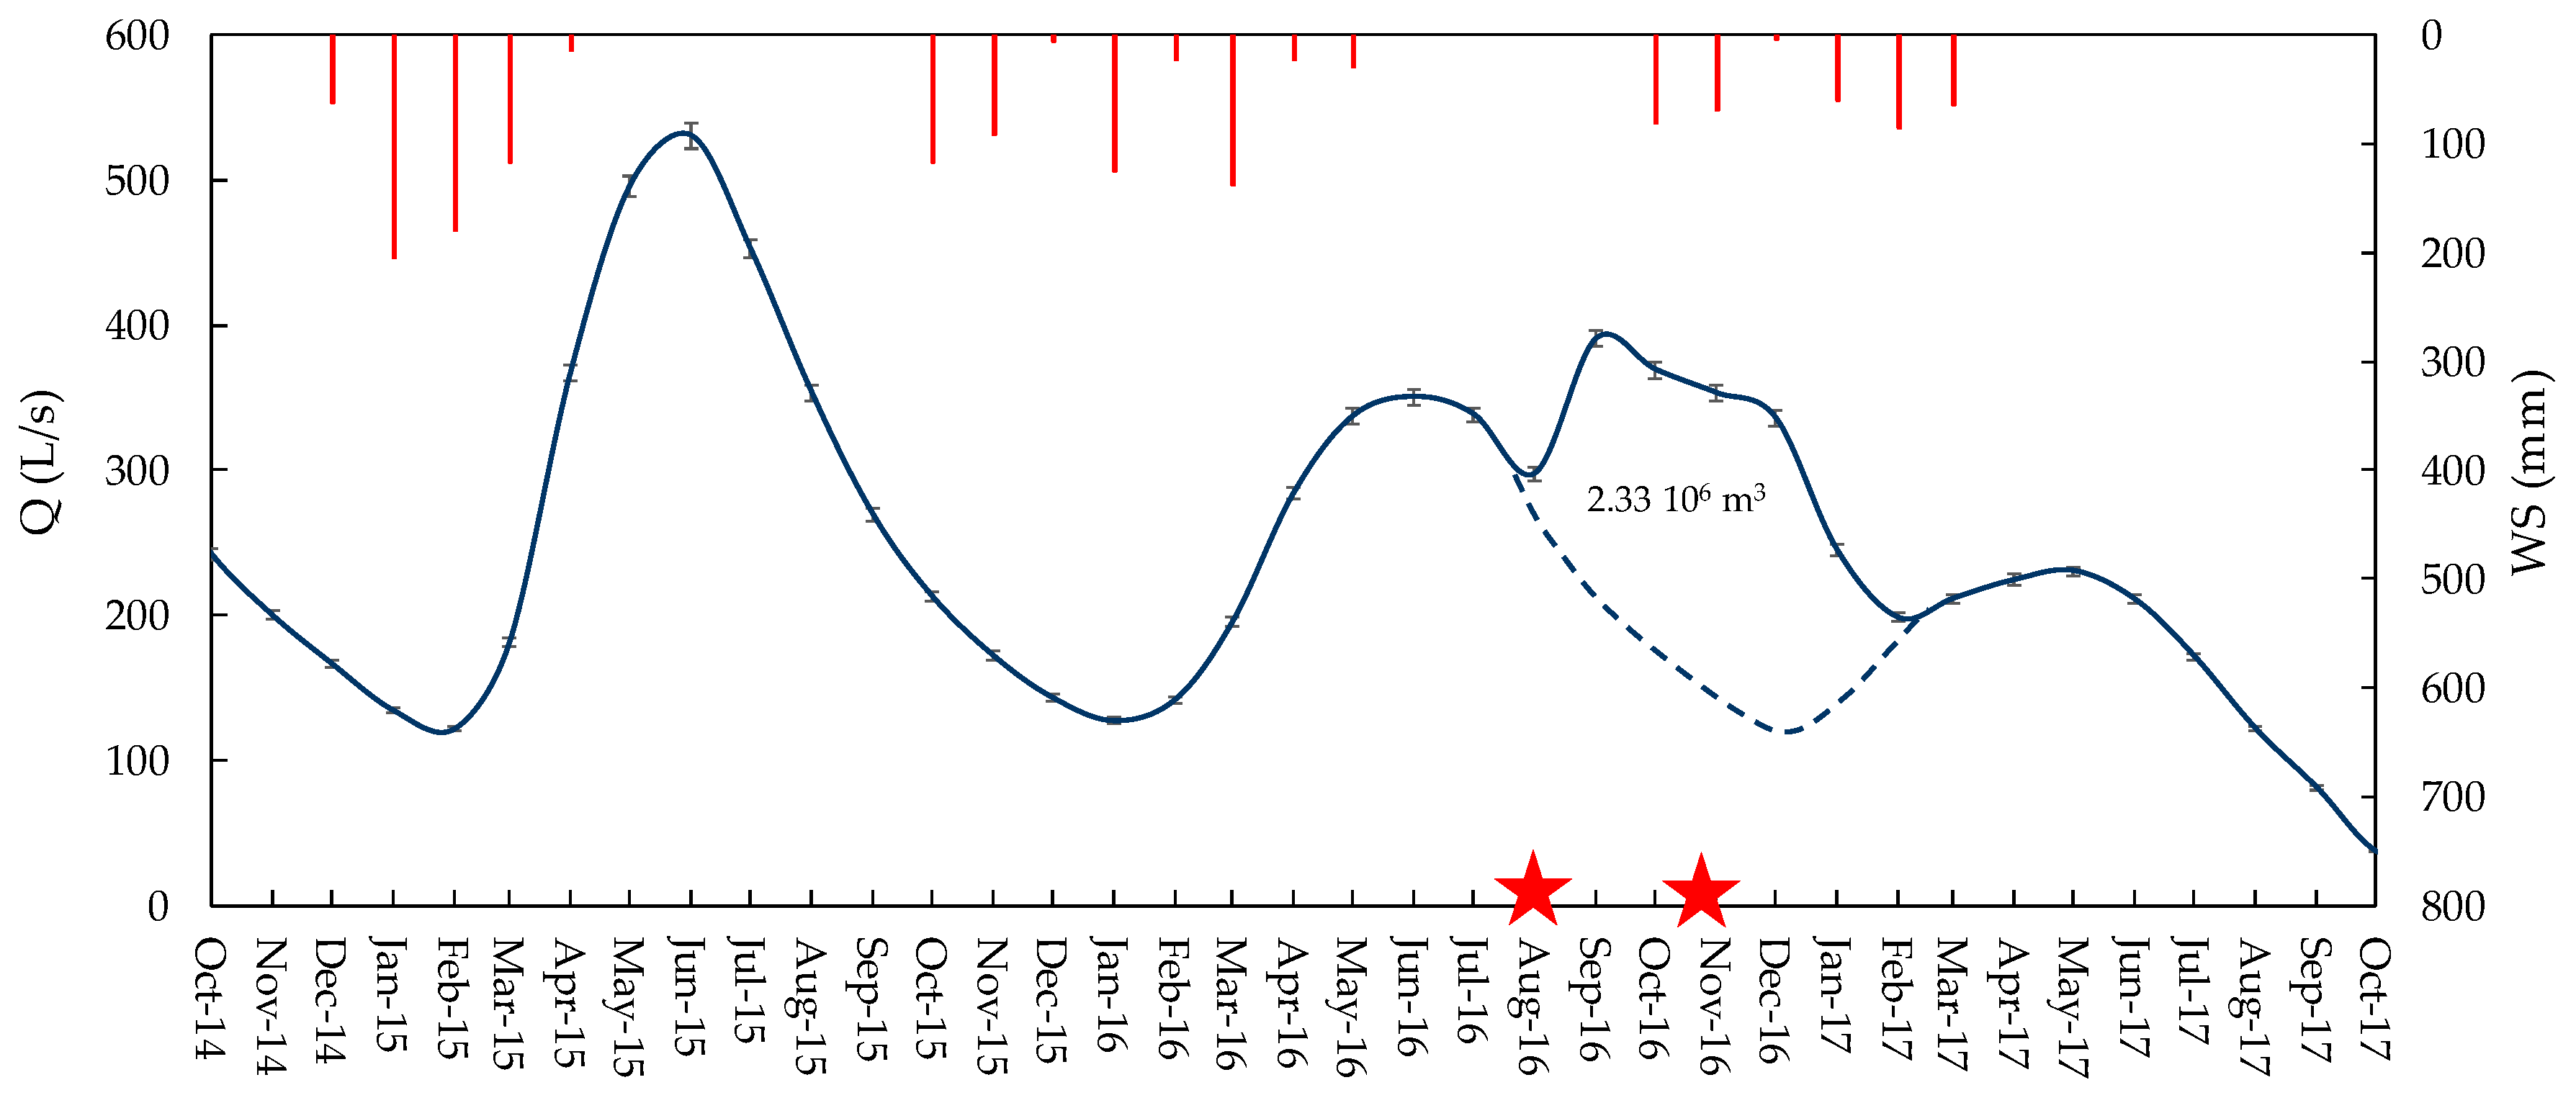
4.2. Analysis of Spring Hydrograph

In the investigated period, the minimum discharge of the Pescara di Arquata spring has been about 22 L/s and the maximum one about 575 L/s. According to the Meinzer classification [45] the spring can be classified as variable.
The analysis of the hydrograph highlighted two different effects related to the seismic sequence.
As a first effect, the hydrograph showed a significant discharge increase recorded after the Mw 6.0 seismic shock of August 2016. The discharge increased from about 300 L/s to more than 390 L/s, despite the recharge was almost absent (Figure 4), so that this increase can be attributed to the effects of the earthquake. The mentioned main shock occurred during the recession period, which for this spring was well described by the Maillet equation, with a depletion coefficient α of 4.09 × 10⁻³ day−1. In accordance with the methods proposed by other authors [51], we extrapolated this recession rate until next December, usually corresponding to the yearly end of the recession, and reconstructed the hypothetical hydrograph without the earthquake effects. On this basis, we estimated the amount of excess water which was released by the spring for more than five months, from the end of August 2016 to February 2017. During this time interval, other strong seismic shocks occurred in the same area. Among these, the strongest of the whole seismic sequence was recorded on 30 October 2016 (Mw 6.5).
The estimated excess outflow was about 2.33 × 10⁶ m3, corresponding to about 30% of the average annual amount of groundwater flowing from January 2003 to August 2016, before the first event of the seismic sequence. The calculated excess flow cannot relate to the water surplus, which was more than zero only after October 2016, when the discharge had already reached its maximum.
As a second effect, it can be observed that the recovery after recession did not lead to discharge values as high as it would be expected on the basis of the water surplus estimated from October 2016 to March 2017.

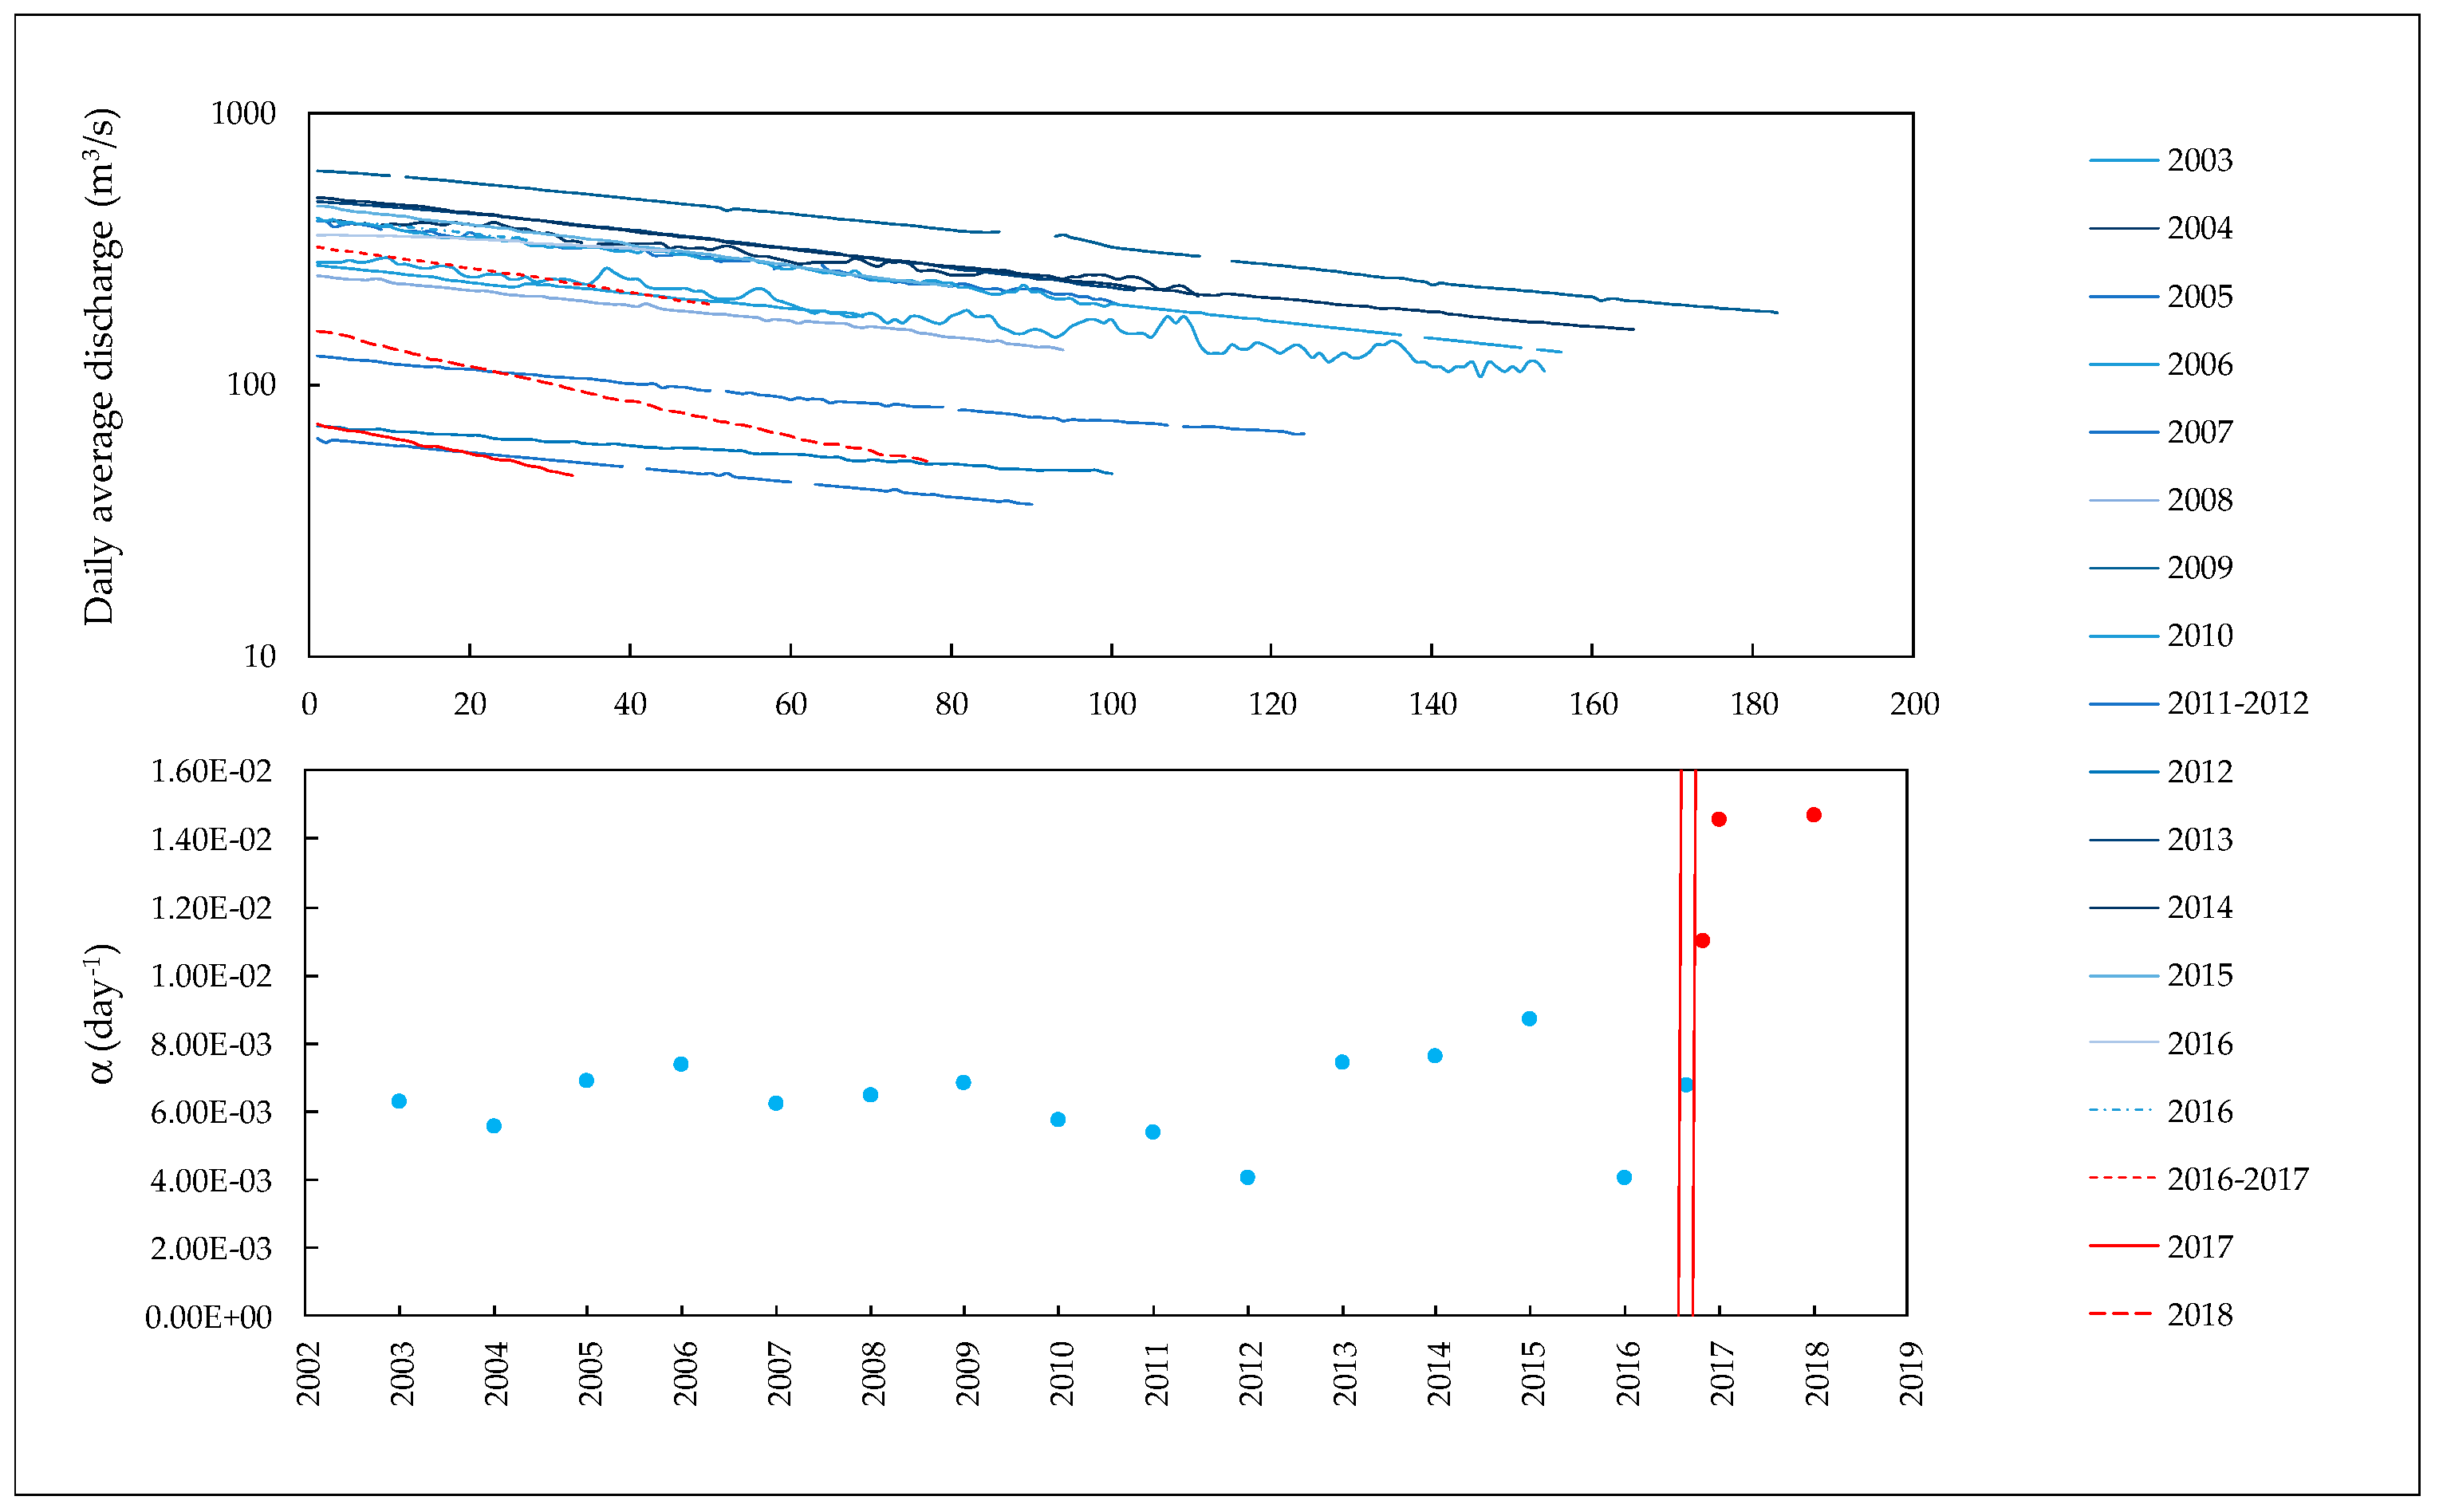
4.3. Depletion Coefficients

The analysis of daily discharge measurements allowed us to determine the Maillet depletion coefficients (α) of the recession periods recorded in the 2003–2018 interval (Table 4).
The α coefficient of 2016 was calculated in two intervals, the first (27 June–10 August) prior to, and the second (2 October–29 October) after the first shock of the seismic sequence (Amatrice earthquake, 24 August 2016). The α coefficient for the 19 December 2016–6 February 2017 period refers to the first recession interval recorded after the 30 October 2016 Norcia mainshock. It can be observed that the average value of the Maillet depletion coefficient α before the Norcia 2016 seismic sequence was 6.35 × 10⁻³ day−1 (standard deviation = 1.31 × 10⁻³ day−1) and, unlike in other Apennine springs [52,53], the α values were similar even for highly different initial discharge (Q0). On the contrary, since the first depletion period recorded after the 30 October 2016 Norcia earthquake, the α coefficient significantly increased, with an average value of 1.34 × 10⁻² day−1 (standard deviation = 2.11 × 10⁻³ day−1), as it can be observed in Figure 5.
Such increase in α values could be related either to a change in aquifer parameters (hydraulic conductivity) or to a modification of aquifer geometry.

4.4. Water Surplus Estimation

Figure 6 shows that the annual water surplus calculated by means of the Thornthwaite–Mather method (hydrogeological year from October to September) and the corresponding mean annual discharge of Pescara di Arquata spring had the same trend until 2016. On the contrary, starting from 2017 the trends changed: in 2017 the spring discharge was higher than the water surplus would suggest, indicating an outflow excess, while in 2018 it continued to lower despite a significant increase of water surplus. Between October 2018 and September 2019, the two trends were similar again, but the spring discharge reached a very low value compared with the relatively high water surplus values in both years. This is probably due to the negative discharge trend recorded between October 2017 and September 2018, which led the spring discharge to very low values despite the positive trend of water surplus recorded in the same period.

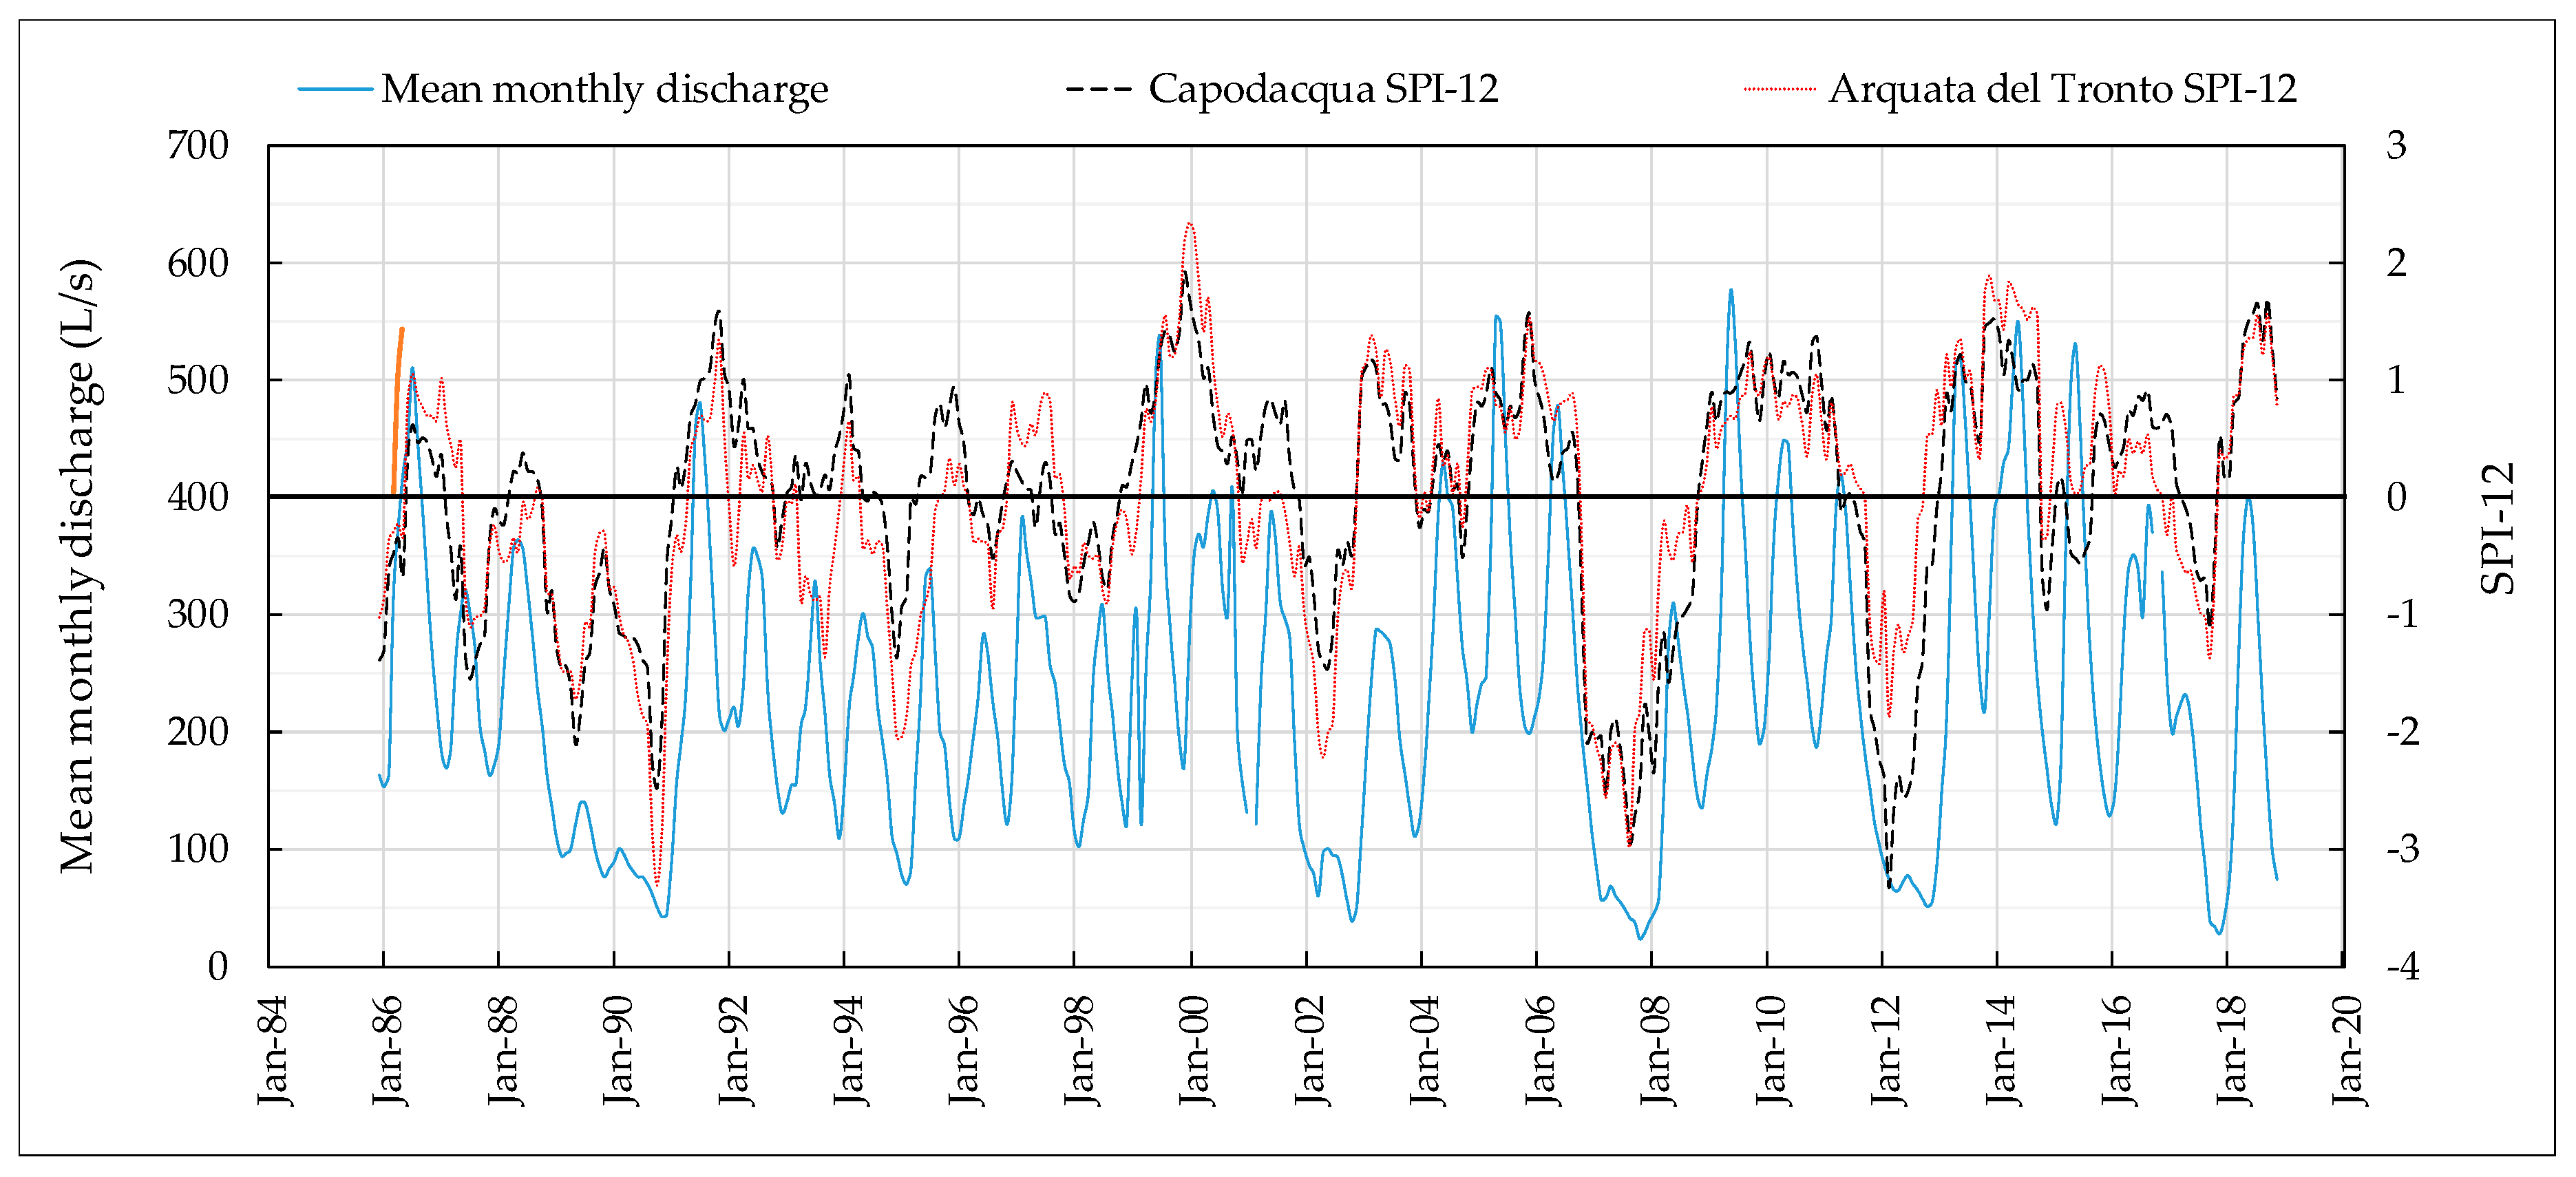
4.5. SPI and Spring Discharge

This analysis shows that the best correlation between discharge and SPI values was found when SPI was calculated at a time scale of 12 months (SPI-12), with a Pearson correlation coefficient between average monthly discharge and SPI-12 of 0.60.
Figure 7 shows the SPI-12 values for the January 1985–September 2019 interval, for both Arquata del Tronto and Capodacqua; SPI-12 data are plotted together with monthly discharge data of Pescara di Arquata spring, these last being calculated from daily discharge measurements.
The SPI-12 shows approximately the same trend in both rainfall stations, with simultaneous minimum and maximum values.
It can be observed that in six circumstances (1989, 1990, 1995, 2002, 2006–2007 and 2011–2012), SPI-12 was lower than −2 (extremely dry conditions) in at least one of the analyzed rainfall stations, while it was lower, or just slightly higher than −1.5 (severely dry conditions) in both of them. In 1990, SPI-12 was lower than −1.5 for seven months (from June to November), with peaks lower than −2 from September to November in both stations. Dry conditions lasted particularly long in 2006–2007, with SPI-12 lower than −2, or just slightly higher, from December 2006 to November 2007 in both stations. In 2011–2012, highly negative SPI-12 values (SPI-12 < −2) were calculated for the Capodacqua station from November to the next September.
As far as the wet periods are concerned, the SPI-12 was steadily higher than 1.5 or even higher than 2 in the least in three intervals. This indicates that conditions from very to extremely wet occurred in 1999–2000, 2013–2014 and 2018. Two wet periods were particularly long-lasting in 1999–2000 (from November to May) and in 2013–2014 (from November to September), whereas the wet period occurred in 2018 was shorter (from August to October).
The average monthly discharge of Pescara di Arquata spring was about 230 L/s, while the minimum discharge was about 22 L/s and the maximum one about 575 L/s. It can be observed in Figure 7 that the maximum annual discharge usually occurred around May, whereas the minimum discharge values were usually recorded in December or January.
The hydrograph shows that only six times along the entire period—namely in 1990, 2002, 2007, 2012, 2017 and 2019—the mean monthly discharge fell below 50 L/s. In all these periods except in 2017 and 2019, the very low discharge values corresponded to SPI-12 lower than, or very close to, −2 for at least 7 months in one or both of the analyzed rainfall stations. On the contrary, in 2017, SPI-12 values between −1 and −1.5 (moderately dry) for just one month (October 2017) corresponded to a discharge even lower than 30 L/s; in 2019, discharge values of about 40 L/s were associated to SPI-12 values close to 0 (near-normal conditions).

5. Discussion

The analysis of the Pescara di Arquata spring hydrograph shows that, in the short term, the Amatrice 2016 mainshock (Mw 6.0) triggered a strong discharge increase, which lasted until February 2017. In this time interval, during which the 30 October Mw 6.5 Norcia earthquake also occurred, the total discharge increase was on the order of 30% more than the pre-seismic discharge.
Considering the absence of any marked trend in the salinity of the waters, it is very unlikely that a post-earthquake mixing with waters coming from the Basal aquifer occurred, these being generally more saline and SO4 rich in the Northern Apennines [50]. A direct connection between the Scaglia aquifer feeding the Pescara di Arquata spring and the aquifer feeding the Foce di Montemonaco spring (“Foce” in Table 4), located about 12 km north of Pescara di Arquata and mainly fed by the Calcare Massiccio formation, can be excluded. The SO4 content of Foce di Montemonaco spring is, in fact, about 22 mg/L, much higher than that of the Pescara di Arquata spring both before and after the earthquakes (Table 4). At the same time, the hypothesis of the arrival of water from the aquifers feeding other springs located nearby, like Capodacqua and Fluvione, cannot be investigated on the basis of the chemical composition. In fact, although the groundwater circuits feeding these springs involve the Basal aquifer, their water composition is rather similar to that of Pescara di Arquata, except for a slightly higher content in Mg and SO4. The presently ongoing isotopic analyses will hopefully help to clarify possible hydrological connections between the aquifers feeding these springs after the seismic events.
Starting from 2018, both the maximum and minimum monthly discharge values were low with respect to their respective averages.
The low discharge values recorded in 2018 and 2019 were not associated with particularly low SPI-12. This index indicates moderately dry conditions for June 2018 (−1.5 < SPI-12 < −1) and very wet conditions for December 2018 (SPI-12 > 1.5).
The analysis of the recession periods recorded from 2003 to 2018 shows that, after the 2016–2017 seismic sequence, the aquifer feeding the Pescara di Arquata spring emptied faster than it did before, with an average α coefficient increasing from 6.35 × 10⁻³ d−1 before the earthquakes to 1.27 × 10⁻² d−1 after them.
Several models were proposed in the literature to explain discharge increase of springs and streams following moderate to large earthquakes in different tectonic contexts.
The immediate (1–2 days) reaction of the Pescara di Arquata spring to the Mw 6.0 Amatrice earthquake was an increase in discharge of about 100 L/s. The total discharge increase until February 2017 was about 30% of the pre-earthquake discharge. Discharge increases of the same kind were explained in literature by different mechanisms. The fractured and locally fissured nature of carbonate aquifers favored a quick co-seismic response in terms of both pore pressure propagation and/or dynamic strain modifications, which may induce temporary changes in permeability. In karst and fractured aquifers, most of the mid- and long-term effects on groundwater flow can be due to the formation of microcracks [54], unlocking of pre-existing fractures and fracture cleaning and/or fracture dilatancy and closure [4,15,55,56]. The ultimate effect of all these phenomena is an increase in bulk hydraulic conductivity at the aquifer scale, followed by changes to the hydraulic head, which increases close to the discharge zones and correspondingly decreases in the recharge areas [10,57]. In such cases, numerical modeling of fault activity and consequent changes in hydraulic conductivity in the near field have shown that (i) discharge is high when the trend of the fault coincides with the groundwater flow direction, and (ii) springs discharge decreases in the upstream part of the system and increases in the downstream part [58].
Concerning the Pescara di Arquata spring, we observe that the main groundwater flow feeding the spring is roughly parallel to the Forca di Presta syncline axe and to the Monte Vettore Monte Gorzano fault system, activated during the 2016 seismic sequence (Figure 1). Surface faulting on the Vettoretto-Redentore fault segment (VRS), which is part of the Vettore-Bove fault system, occurred during both the 24 August and the 30 October mainshocks. The associated co-seismic ruptures propagated along the southern VRS, as far as Arquata del Tronto, with cumulative local displacements locally higher than 2 m [28,35]. A permeability enhancement of the aquifer feeding the spring is consistent with the observed discharge increase and is supported by the occurrence of co-seismic fracturing in the spring recharge area, along a fault in the same directions as the main groundwater flow feeding the spring.
On the basis of available piezometric data, Mastrorillo et al. [21] estimated that the hydraulic conductivity increase related to the 24 August Amatrice earthquake in the Sibillini Mountains basal aquifer was approximately 13%. Unfortunately, in this case, as in many other cases when dealing with mountain aquifers [59], piezometric data are not available, so that the hydraulic conductivity increase cannot be quantified directly.
An enhancement in hydraulic conductivity is also supported by the increase of the calculated α depletion coefficients after the seismic sequence since α is known to be directly proportional to hydraulic conductivity (αK).
Hydraulic conductivity changes could be permanent or temporary. For the Pescara di Arquata spring, besides the immediate discharge increase, it was observed that the spring discharges three years after the earthquakes remained lower than expected on the basis of the estimated recharge amount. We suggest that these low discharge values can be justified by a transient increase of hydraulic conductivity, which has led to an exceptional and excessive emptying of the aquifer groundwater reserve.
The aquifer emptying triggering the extra flow has necessarily led a progressive drop of the water table; if the hydraulic conductivity (K) increase was permanent, the system would have evolved towards a new equilibrium until the K × i product was the same as it was before the earthquake. The discharge would have, therefore, progressively lowered until reaching values consistent with the water surplus available for recharge, and the relationship between water surplus and discharge would have been similar to those observed before the earthquake. Nonetheless, this kind of mechanism cannot explain the very low discharge values observed in 2018 and 2019, not accompanied by severe drought and consequently low water surplus. In fact, the progressive discharge lowering should have arrested after the new equilibrium was reached, without getting down to the very low values recorded in 2018 and 2019.
On the contrary, the observed behavior is consistent with the hypothesis of a transient hydraulic conductivity increase. In our interpretation the co-seismic permeability increase related to fracturing and fracture emptying was followed by a progressive fracture healing that, in the long run, will bring the permeability to standard inter-seismic values. Nonetheless, the aquifer emptying occurred during the five months following the Amatrice earthquake reduced the hydraulic gradient, which, therefore, is still presently too low to guarantee “normal” discharge, considering that permeability, after an initial and sudden increase, is decreasing. It can be supposed that the system will go back to the previous equilibrium only when the water table, and consequently the hydraulic gradient, will rise to pre-earthquake values. This will be accompanied by a progressive reduction of α coefficient, consistent with the gradual hydraulic conductivity reduction. The recharge reaching the aquifer since the recharge season started at the end of 2017 is only partially contributing to spring discharge since it is also consumed to reintegrate the water lost due to the aquifer emptying consequent to the earthquake. This explains the low discharge values observed since 2018.
Former studies about the hydrogeological effects of the 2016 seismic sequence in the same area showed that the long-term discharge and groundwater level increase observed on groundwater systems west of the Sibillini Mountains [9,11,21,22] corresponded to long-term discharge decrease on some spring systems located East of the Sibillini Mountains, fed by the Basal aquifer [21]. These two opposite effects can be explained by the same mechanism, which includes a hydraulic conductivity increase due to faulting and a consequent lowering and eastward shift of the groundwater divide, penalizing the eastern side of the Sibillini Mountains [21].
Nonetheless, although the Pescara di Arquata spring is located East of the Sibillini Mountains, its long-term discharge decrease cannot be related to the above-mentioned mechanism. This is due to the peculiar geological setting of the spring, fed by an aquifer virtually isolated, located at high elevation and unconnected with the Basal aquifer. In the case of the Pescara di Arquata spring, the discharge evolution after the seismic sequence (initial extra flow and subsequent significant discharge decrease) is well explained by the transient increase of hydraulic conductivity. These findings confirm that, even in the frame of a well-known groundwater scheme of a specific area (Northern Apennines in this case), it is important to define the local and specific geological setting of any strategic groundwater system, to better asses what it could be its evolution due to perturbations related to external factors [60] such as earthquake sequences.

6. Conclusions

The 2016 seismic sequence triggered a significant discharge alteration to the Pescara di Arquata spring. The modification in discharge was neither accompanied by changes in water chemistry nor in temperature, suggesting that the aquifer feeding the spring did not change significantly. Within the spring recharge area, along the Monte Vettoretto fault segment, a series of co-seismic surface ruptures were observed after the mainshocks, with significant offsets [28,32,33,34,35].
An extra flow of about 30% of the average annual discharge was recorded for the first five months after the first mainshock (24 August 2016). Later on, the spring discharge was lower than expected based on the estimated water surplus, and the increase of the depletion coefficients indicates that the aquifer feeding the spring empties faster than it did before the earthquake.
The low discharge values recorded during five months after the first mainshock are not related to particularly dry conditions, as indicated by the SPI. This suggests a permeability increase as the main process for the modification observed in the spring.
In systems such as the investigated one, where the activated faults strike almost parallel to the main groundwater flow feeding the spring, a transient increase in aquifer hydraulic conductivity explains the observed modification of groundwater regime.
The Pescara di Arquata spring is fed by an aquifer relatively isolated from the groundwater flow of the main Basal aquifer. In this kind of system, the amount and timing of discharge variations following moderate to strong earthquakes can be different from those related to deeper and wider regional aquifers, the discharge of which can be influenced both by permeability modifications and groundwater divide migration [21]. Understanding the details of the mechanisms leading to these different behaviors and their mutual interaction is fundamental to comprehend the overall response of carbonate water systems to earthquakes.

Author Contributions

Conceptualization, D.V., C.C. (Costanza Cambi), D.F., F.M.; methodology, D.V., D.F., C.C. (Costanza Cambi), L.M.; data curation, D.V. hydrogeological and climatic data, D.F. hydrogeological and climatic data, C.C. (Costanza Cambi) hydrogeological and climatic data, F.M. Geological data, C.C. (Carlo Cardellini) geochemical data, G.B. geochemical data, A.T. tracer test data; writing—original draft preparation, C.C. (Costanza Cambi), F.M.; writing—review and editing, D.V., D.F., C.C. (Costanza Cambi), C.C. (Carlo Cardellini), G.B., R.C., L.M., F.M. and A.T.; supervision, D.V.; project administration, D.V.; funding acquisition, D.V. All authors have read and agreed to the published version of the manuscript.

Funding

This research was financed by Regione Umbria, Italy, Funds for “Interventi di emergenza previsti dall’Ordinanza del Capo del Dipartimento di Protezione Civile del 26 agosto 2016, n. 388”.

Acknowledgments

We kindly acknowledge C.I.I.P Servizio idrico Integrato for providing discharge data of the Pescara di Arquata spring, and the Regione Marche—Servizio Protezione Civile, Centro Funzionale Multirischi per la meteorologia, l’idrologia e la sismologia for providing meteorological data.

Conflicts of Interest

The authors declare no conflict of interest.

References

  1. Claesson, L.; Skelton, A.; Graham, C.; Dietl, C.; Mörth, M.; Torssander, P.; Kockum, I. Hydrogeochemical changes before and after a major earthquake. Geology 2004, 32, 641–644. [Google Scholar] [CrossRef]
  2. Skelton, A.; Andrén, M.; Kristmannsdóttir, H.; Stockmann, G.; Mörth, C.-M.; Sveinbjörnsdóttir, Á.; Jónsson, S.; Sturkell, E.; Guðrúnardóttir, H.R.; Hjartarson, H. Changes in groundwater chemistry before two consecutive earthquakes in Iceland. Nat. Geosci. 2014, 7, 752. [Google Scholar] [CrossRef] [Green Version]
  3. Muir-Wood, R.; King, G.C.P. Hydrological signatures of earthquake strain. J. Geophys. Res. 1993, 98, 22035–22068. [Google Scholar] [CrossRef]
  4. Rojstaczer, S.; Wolft, S.; Micheli, R. Permeability enhancement in the shallow crust as a cause of earthquake-induced hydrological changes. Nature 1995, 373, 237–239. [Google Scholar] [CrossRef]
  5. Manga, M. Origin of postseismic streamflow changes inferred from baseflow recession and magnitude-distance relations. Geophys. Res. Lett. 2001, 28, 2133–2136. [Google Scholar] [CrossRef] [Green Version]
  6. Manga, M.; Brodsky, E.E.; Boone, M. Response of streamflow to multiple earthquakes: Streamflow and earthquakes. Geophys. Res. Lett. 2003, 30. [Google Scholar] [CrossRef]
  7. Montgomery, D.R. Streamflow and water well responses to earthquakes. Science 2003, 300, 2047–2049. [Google Scholar] [CrossRef] [Green Version]
  8. Manga, M.; Rowland, J.C. Response of Alum Rock springs to the 30 October 2007 Alum Rock earthquake and implications for the origin of increased discharge after earthquakes. Geofluids 2009, 9, 237–250. [Google Scholar] [CrossRef]
  9. Petitta, M.; Mastrorillo, L.; Preziosi, E.; Banzato, F.; Barberio, M.D.; Billi, A.; Cambi, C.; De Luca, G.; Di Carlo, G.; Di Curzio, D.; et al. Water-table and discharge changes associated with the 2016–2017 seismic sequence in central Italy: Hydrogeological data and a conceptual model for fractured carbonate aquifers. Hydrogeol. J. 2018, 26, 1009–1026. [Google Scholar] [CrossRef] [Green Version]
  10. Wang, C.-Y.; Manga, M. New streams and springs after the 2014 Mw6.0 South Napa earthquake. Nat. Commun. 2015, 6, 7597. [Google Scholar] [CrossRef] [Green Version]
  11. Valigi, D.; Mastrorillo, L.; Cardellini, C.; Checcucci, R.; Di Matteo, L.; Frondini, F.; Mirabella, F.; Viaroli, S.; Vispi, I. Springs discharge variations induced by strong earthquakes: The Mw 6.5 Norcia event (Italy, 30 October 2016). Rend. Online Soc. Geol. Ital. 2019, 47, 141–146. [Google Scholar] [CrossRef]
  12. Mohr, C.H.; Manga, M.; Wang, C.-Y.; Korup, O. Regional changes in streamflow after a megathrust earthquake. Earth Planet. Sci. Lett. 2017, 458, 418–428. [Google Scholar] [CrossRef] [Green Version]
  13. Sibson, R.H. Fluid flow accompanying faulting: Field evidence and models. In Maurice Ewing Series; Simpson, D.W., Richards, P.G., Eds.; American Geophysical Union: Washington, DC, USA, 2013; pp. 593–603. ISBN 978-1-118-66574-9. [Google Scholar]
  14. Mohr, C.H.; Manga, M.; Wang, C.; Kirchner, J.W.; Bronstert, A. Shaking water out of soil. Geology 2015, 43, 207–210. [Google Scholar] [CrossRef]
  15. Wang, C.-Y.; Wang, C.-H.; Kuo, C.-H. Temporal change in groundwater level following the 1999 (Mw = 7.5) Chi-Chi earthquake, Taiwan. Geofluids 2004, 4, 210–220. [Google Scholar] [CrossRef] [Green Version]
  16. Amoruso, A.; Crescentini, L.; Petitta, M.; Rusi, S.; Tallini, M. Impact of the 6 April 2009 L’Aquila earthquake on groundwater flow in the Gran Sasso carbonate aquifer, Central Italy. Hydrol. Process. 2011, 25, 1754–1764. [Google Scholar] [CrossRef]
  17. Manga, M.; Wang, C.-Y. Earthquake hydrology. In Treatise on Geophysics, 2nd ed.; Schubert, G., Ed.; Elsevier: Oxford, UK, 2015; pp. 305–328. [Google Scholar]
  18. Hosono, T.; Yamada, C.; Shibata, T.; Tawara, Y.; Wang, C.-Y.; Manga, M.; Rahman, A.T.M.S.; Shimada, J. Coseismic groundwater drawdown along crustal ruptures during the 2016 Mw 7.0 Kumamoto Earthquake. Water Resour. Res. 2019, 55, 5891–5903. [Google Scholar] [CrossRef] [Green Version]
  19. Esposito, E.; Pece, R.; Porfido, S.; Tranfaglia, G. Hydrological anomalies connected to earthquakes in southern Apennines (Italy). Nat. Hazards Earth Syst. Sci. 2001, 1, 137–144. [Google Scholar] [CrossRef] [Green Version]
  20. Adinolfi Falcone, R.; Carucci, V.; Falgiani, A.; Manetta, M.; Parisse, B.; Petitta, M.; Rusi, S.; Spizzico, M.; Tallini, M. Changes on groundwater flow and hydrochemistry of the Gran Sasso carbonate aquifer after 2009 L’Aquila earthquake. Ital. J. Geosci. 2012, 131, 459–474. [Google Scholar]
  21. Mastrorillo, L.; Saroli, M.; Viaroli, S.; Banzato, F.; Valigi, D.; Petitta, M. Sustained post-seismic effects on groundwater flow in fractured carbonate aquifers in central Italy. Hydrol. Process. 2019. [Google Scholar] [CrossRef] [Green Version]
  22. Di Matteo, L.; Dragoni, W.; Azzaro, S.; Pauselli, C.; Porreca, M.; Bellina, G.; Cardaci, W. Effects of earthquakes on the discharge of groundwater systems: The case of the 2016 seismic sequence in the central Apennines, Italy. J. Hydrol. 2020, 583, 124509. [Google Scholar] [CrossRef]
  23. Brutsaert, W.; Lopez, J.P. Basin-scale geohydrologic drought flow features of riparian aquifers in the southern great plains. Water Resour. Res. 1998, 34, 233–240. [Google Scholar] [CrossRef]
  24. Celico, P. Prospezioni Idrogeologiche; Liguori editore: Naples, Italy, 1986. [Google Scholar]
  25. Checcucci, R.; Mastrorillo, L.; Valigi, D. Acque sotterranee e terremoti: Alcune considerazioni sugli effetti Della sismicità Sulla disponibilità Della risorsa idrica in Valnerina. Acque Sotter. Ital. J. Groundw. 2017, 6, 75–77. [Google Scholar]
  26. Lavecchia, G. II sovrascorrimento dei Monti Sibillini: Analisi cinematica e strutturale. Boll. Soc. Geol. Ital. 1985, 104, 161–194. [Google Scholar]
  27. Pierantoni, P.; Deiana, G.; Galdenzi, S. Stratigraphic and structural features of the Sibillini Mountains (Umbria-Marche Apennines, Italy). Ital. J. Geosci. 2013, 132, 497–520. [Google Scholar] [CrossRef]
  28. Brozzetti, F.; Boncio, P.; Cirillo, D.; Ferrarini, F.; de Nardis, R.; Testa, A.; Liberi, F.; Lavecchia, G. High-resolution field mapping and analysis of the August–October 2016 coseismic surface faulting (central Italy earthquakes): Slip distribution, parameterization, and comparison with global earthquakes. Tectonics 2019, 38, 417–439. [Google Scholar] [CrossRef] [Green Version]
  29. Boncio, P.; Brozzetti, F.; Ponziani, F.; Barchi, M.; Lavecchia, G.; Pialli, G. Seismicity and extensional tectonics in the northern Umbria-Marche Apennines. Mem. Soc. Geol. Ital. 1998, 52, 55. [Google Scholar]
  30. Porreca, M.; Minelli, G.; Ercoli, M.; Brobia, A.; Mancinelli, P.; Cruciani, F.; Giorgetti, C.; Carboni, F.; Mirabella, F.; Cavinato, G.; et al. Seismic reflection profiles and subsurface geology of the area interested by the 2016–2017 earthquake sequence (Central Italy). Tectonics 2018, 37, 1116–1137. [Google Scholar] [CrossRef]
  31. Chiaraluce, L.; Di Stefano, R.; Tinti, E.; Scognamiglio, L.; Michele, M.; Casarotti, E.; Cattaneo, M.; De Gori, P.; Chiarabba, C.; Monachesi, G.; et al. The 2016 central Italy seismic sequence: A first look at the mainshocks, aftershocks, and source models. Seismol. Res. Lett. 2017, 88, 757–771. [Google Scholar] [CrossRef]
  32. Pucci, S.; De Martini, P.M.; Civico, R.; Villani, F.; Nappi, R.; Ricci, T.; Azzaro, R.; Brunori, C.A.; Caciagli, M.; Cinti, F.R.; et al. Coseismic ruptures of the 24 August 2016, M w 6.0 Amatrice earthquake (central Italy). Geophys. Res. Lett. 2017, 44, 2138–2147. [Google Scholar] [CrossRef]
  33. Civico, R.; Pucci, S.; Villani, F.; Pizzimenti, L.; De Martini, P.M.; Nappi, R.; Group, O.E.W. Surface ruptures following the 30 October 2016 M w 6.5 Norcia earthquake, central Italy. J. Maps 2018, 14, 151–160. [Google Scholar]
  34. Iezzi, F.; Mildon, Z.; Walker, J.F.; Roberts, G.; Goodall, H.; Wilkinson, M.; Robertson, J. Coseismic throw variation across along-strike bends on active normal faults: Implications for displacement versus length scaling of earthquake ruptures. J. Geophys. Res. Solid Earth 2018, 123, 9817–9841. [Google Scholar] [CrossRef]
  35. Villani, F.; Pucci, S.; Civico, R.; De Martini, P.M.; Cinti, F.R.; Pantosti, D. Surface faulting of the 30 October 2016 M w 6.5 central Italy earthquake: Detailed analysis of a complex coseismic rupture. Tectonics 2018, 37, 3378–3410. [Google Scholar] [CrossRef]
  36. Nanni, T. Caratteri idrogeologici delle Marche. In L’ambiente Fisico delle Marche; S.E.C.L.A. s.r.l.: Florence, Italy, 1991. [Google Scholar]
  37. Mastrorillo, L.; Baldoni, T. Quantitative hydrogeological analysis of the carbonate domain of the Umbria Region. Ital. J. Eng. Geol. Environ. 2009, 137–155. [Google Scholar]
  38. Mastrorillo, L.; Petitta, M. Hydrogeological conceptual model of the upper Chienti River Basin aquifers (Umbria-Marche Apennines). Ital. J. Geosci. 2014, 133, 396–408. [Google Scholar] [CrossRef]
  39. Bense, V.F.; Gleeson, T.; Loveless, S.E.; Bour, O.; Scibek, J. Fault zone hydrogeology. Earth Sci. Rev. 2013, 127, 171–192. [Google Scholar] [CrossRef]
  40. Dragoni, W.; Speranza, G.; Valigi, D. Impatto delle variazioni climatiche Sui sistemi idrogeologici: II caso della sorgente Pescara di Arquata (Appennino umbro-marchigiano, Italia). Geol. Tec. Ambient. 2003, 3, 27–35. [Google Scholar]
  41. Celico, P. Studio Idrogeologico per la Redazione dello S.I.A. Necessario per il Rinnovo della Concessione di Derivazione della Sorgente Pescara d’Arquata (Arquata del Tronto—AP); C.I.I.P.: Ascoli Piceno, Italy, 2011. [Google Scholar]
  42. Boni, C. Hydrogeological study for identification, characterisation and management of groundwater resources in the Sibillini Mountains National Park (central Italy). Ital. J. Eng. Geol. Environ. 2010, 2, 21–39. [Google Scholar]
  43. Petitta, M. Integrazione della Base Conoscitiva per la Gestione della Risorsa Idrica Sotterranea del Parco Nazionale dei Monti Sibillini; Technical Report for internal use; Parco Nazionale dei Monti Sibillini: Visso, Italy, 2011; p. 101. [Google Scholar]
  44. Tazioli, A.; Dipartimento SIMAU, Università Politecnica delle Marche, Ancona, Italy. Personal communication, 2019.
  45. Meinzer, O.E. Outline of Ground-Water Hydrology, with Definitions; USGS: Reston, VA, USA, 1923; Volume 494. [Google Scholar]
  46. Maillet, E.T. Essais d’Hydraulique Souterraine et Fluviale (Underground and River Hydrology); Hermann: Paris, France, 1905; p. 215. [Google Scholar]
  47. Thornthwaite, C.W.; Mather, J.R. The water balance. Publ. Climatol. 1955, 8, 104. [Google Scholar]
  48. Scozzafava, M.; Tallini, M. Net infiltration in the Gran Sasso Massif of central Italy using the Thornthwaite water budget and curve-number method. Hydrogeol. J. 2001, 9, 461–475. [Google Scholar] [CrossRef]
  49. McKee, T.B.; Doesken, N.J.; Kleist, J. The relationship of drought frequency and duration to time scales. In Proceedings of the Eighth Conference on Applied Climatology, Anaheim, CA, USA, 17–22 January 1993. [Google Scholar]
  50. Chiodini, G.; Cardellini, C.; Caliro, S.; Chiarabba, C.; Frondini, F. Advective heat transport associated with regional Earth degassing in central Apennine (Italy). Earth Planet. Sci. Lett. 2013, 373, 65–74. [Google Scholar] [CrossRef]
  51. Celico, P. Relazioni tra idrodinamica sotterranea e terremoti in Irpinia (Campania). Rend. Soc. Geol. Ital. 1981, 4, 103–108. [Google Scholar]
  52. Fiorillo, F. The recession of spring hydrographs, focused on karst aquifers. Water Resour. Manag. 2014, 28, 1781–1805. [Google Scholar] [CrossRef]
  53. Fiorillo, F.; Pagnozzi, M.; Stevanović, Z.; Ventafridda, G. Main hydrological features and recharge analysis the Caposele spring catchment, Southern Italy. Acta Carsologica 2019, 48. [Google Scholar] [CrossRef] [Green Version]
  54. Casini, S.; Martino, S.; Petitta, M.; Prestininzi, A. A physical analogue model to analyse interactions between tensile stresses and dissolution in carbonate slopes. Hydrogeol. J. 2006, 14, 1387–1402. [Google Scholar] [CrossRef]
  55. Elkhoury, J.E.; Brodsky, E.E.; Agnew, D.C. Seismic waves increase permeability. Nature 2006, 441, 1135–1138. [Google Scholar] [CrossRef]
  56. Wang, C.Y.; Manga, M. Earthquakes influenced by water. Lect. Notes Earth Sci. 2010, 114, 125–139. [Google Scholar]
  57. Galassi, D.M.P.; Lombardo, P.; Fiasca, B.; Di Cioccio, A.; Di Lorenzo, T.; Petitta, M.; Di Carlo, P. Earthquakes trigger the loss of groundwater biodiversity. Sci. Rep. 2015, 4, 6273. [Google Scholar] [CrossRef]
  58. Gudmundsson, A. Active fault zones and groundwater flow. Geophys. Res. Lett. 2000, 27, 2993–2996. [Google Scholar] [CrossRef]
  59. Cambi, C.; Valigi, D.; Di Matteo, L. Hydrogeological study of data-scarce limestone massifs: The case of Gualdo Tadino and Monte Cucco structures (central Apennines, Italy). Boll. Geofis. Teor. Appl. 2010, 51, 345–360. [Google Scholar]
  60. Di Matteo, L.; Valigi, D.; Cambi, C. Climatic characterization and response of water resources to climate change in limestone areas: Considerations on the importance of geological setting. J. Hydrol. Eng. 2013, 18, 773–779. [Google Scholar] [CrossRef] [Green Version]
Figure 1. Area affected by the seismic crisis in 2016. Green stars represent the Mw ≥ 6.0 mainshocks, and dark grey dots are all the earthquakes recorded during the seismic sequence.
Water 12 00767 g001
Figure 2. Hydrogeological map of the study area. Purple line delimits the Pescara di Arquata spring recharge area.
Water 12 00767 g002
Figure 3. Langelier–Ludwig diagram showing the chemical composition of Pescara di Arquata spring water from 1998 up to 2019 and that of springs located nearby. The blue circles refer to the 1998–2001 period, whereas the orange circles refer to the period from 2016 to 2019.
Water 12 00767 g003
Figure 4. Estimation of excess outflow from October 2016 to February 2017. The red bars represent the estimated monthly water surplus (WS). The blue line represents the mean monthly discharge (Q). The dashed blue line represents the hypothetical spring hydrograph if the depletion period was undisturbed by the earthquakes. The red stars indicate the 24 August 2016 Mw 6.0 Amatrice earthquake and the 30 October 2016 Mw 6.5 Norcia earthquake.
Water 12 00767 g004
Figure 5. The depletion coefficients, α, for the years 2003–2018. Blue lines and dots indicate pre-earthquake recession periods, red lines and dots are related to post-earthquake periods. Vertical red bars indicate the 24 August and the 30 October 2016 seismic shocks.
Water 12 00767 g005
Figure 6. Annual water surplus and mean annual discharge from October 2003 to September 2019.
Water 12 00767 g006
Figure 7. SPI-12 values from 1985 to 2019 for Capodacqua and Arquata del Tronto rainfall stations and mean monthly discharge values of Pescara di Arquata spring.
Water 12 00767 g007
Table 1. Average annual temperature and rainfall stations analyzed.
StationTime IntervalCoordinates WGS 84 Projection UTM 33NElevation
(m a.s.l.)
Average Annual Temperature (°C)Average Annual Rainfall (mm)
EastNorth
Arquata del Tronto1984–20193606594736980720-1222
Capodacqua1984–20193556074733240842-1164
Montemonaco1984–2019363392475103099511.9-
Table 2. Classification of drought conditions based on the SPI values [49].
ConditionRange
Extremely wetSPI ≥ 2.0
Very wet1.5 ≤ SPI < 2.0
Moderately wet1.0 ≤ SPI < 1.5
Near normal−1.0 < SPI < 1.0
Moderately dry−1.5 < SPI ≤ −1.0
Severely dry−2.0 < SPI ≤ −1.5
Extremely drySPI ≤ −2.0
Table 3. Chemical data of Pescara di Arquata spring before and after the seismic sequence and compared with that of springs located nearby.
NameDateT °CpHEh mVCond. µS/cmCa mg/LMg mg/LNa mg/LK mg/LHCO3 mg/LCl mg/LSO4 mg/LNO3 mg/LF mg/L
Pescara12 November1998 §na7.6na25452.361.112.970.64137.474.633.871.80na
Pescara13 December 1999 §na7.8na25148.580.951.390.49114.394.163.81.35na
Pescara12 December 2000 §na7.6na24651.281.071.560.53136.683.392.351.53na
Pescara12 November 2001 §na7.7na23850.930.962.510.34139.343.223.180.93na
Pescara3 July 2009 *87.5422626545.001.421.250.38165.503.441.530.920.02
Pescara30 August 20168.17.84na24751.101.121.970.82166.073.601.591.820.05
Pescara7 October 20167.97.7316526449.800.891.610.34168.064.131.921.740.04
Pescara15 November 20168.17.5920426054.601.121.950.35171.723.311.581.690.08
Pescara12 May 20179.17.8326226049.881.031.910.29161.043.631.901.470.11
Pescara15 September 20178.37.7122626348.201.172.140.12153.424.821.452.020.17
Pescara2 October 20188.27.9021025647.201.321.880.12171.113.571.531.590.06
Pescara23 May 20198.47.9911926548.401.421.970.47140.003.661.691.450.03
Capodacqua3 July 2009 *8.57.6623826148.003.661.600.43173.154.603.270.790.06
Sasso spaccato3 July 2009 *6.67.5121724231.6010.631.080.26161.223.173.140.840.04
Foce3 July 2009 *6.77.7218523034.2010.190.700.35144.392.5721.991.040.13
§ data from [40]; * data from [50]; na = not available; T = temperature; Cond.= electrical conductivity.
Table 4. Maillet depletion coefficients α and values of Q0 for the analyzed recession periods. Data under the red line are related to post 30 October 2016 recession periods.
YearRecession PeriodQ0 (L/s)α Maillet (day−1)
20035 July–16 December2706.28 × 10−3
20044 August–22 November4025.57 × 10−3
20052 August–10 November4016.88 × 10−3
2006–20074 August 2006–26 January 20074067.37 × 10−3
200722 June–19 September596.26 × 10−3
200822 August–23 November2496.46 × 10−3
200921 June–20 December6076.86 × 10−3
201026 September–3 December2725.77 × 10−3
2011–20129 December 2011–10 April 20121285.41 × 10−3
201223 August–30 November714.08 × 10−3
201316 July–26 October4677.48 × 10–3
201414 July–25 December4877.63 × 10−3
201517 July–4 October4538.72 × 10−3
201627 June–10 August3514.09 × 10−3
20162 October–29 October4056.80 × 10−3
2016–201719 December 2016–6 February 20173221.10 × 10−2
201724 September–26 October721.46 × 10−2
201810 August–31 December3121.47 × 10−2

