Multicomponent Water Effects on Rotating Machines Disk Erosion
by
 ,
,
Chunxia Yang
1,*, 
Shanshan Hou
1,
Junhui Xu
1,
Yuquan Zhang
1,*,
Yuan Zheng
1,
E Fernandez-Rodriguez
2 and 
Daqing Zhou
1 1
College of Energy and Electrical Engineering, Hohai University, Nanjing 211100, China
2
Technological Institute of Merida, Technological Avenue, Merida 97118, Mexico
*
Authors to whom correspondence should be addressed.
Water 2020, 12(3), 757; https://doi.org/10.3390/w12030757
Submission received: 8 February 2020
/
Revised: 2 March 2020
/
Accepted: 3 March 2020
/
Published: 10 March 2020
(This article belongs to the Section Hydraulics and Hydrodynamics)
Abstract
:When sand particles are entrained into carrier flow, such as liquid, a strong interaction occurs with the surface of the metallic material, resulting in serious erosion damage. However, the effect of the physical properties of particles and materials on erosion characteristics has not been well studied. In this paper, the erosion-wear behavior of a rotating disc surface under the action of solid–liquid two-phase flow was studied by using the discrete particle model (DPM). The wear effects on the surface of sample due to particle diameter (d = 0.1 mm, d = 0.2 mm, d = 0.3 mm, d = 0.4 mm), particle volume fraction (CV = 2%, CV = 3%, CV = 4%, CV = 5%), and particle inlet velocity (v = 1.05 m/s, v = 2.05 m/s, v = 3.05 m/s, v = 4.05 m/s) were analyzed using representative values of operating conditions of rotating machines. The results show that the wear amount increases exponentially with the radius, whilst the maximum wear amount increases faster than the average wear amount with the particle volume fraction. The surface wear grows inversely with the particle diameter but slightly with the particle inlet velocity. A case study of stainless steel samples at different radius positions on the surface of rotating disc is carried out using a mixed velocity of sand and water of 2.05 m/s, an average particle size of 0.1 mm, and a concentration of CV = 2.5%. The experiments show the wear amount increases with the radius on the surface of the rotating disc, just as predicted by the numerical simulation. Two important findings emerge from the study: (1) the wear morphology of the specimen surface develops from two to three regions; (2) when the basal body is rotating at high speed, the wear degree is influenced more by the circumferential than particle inlet velocity. The wear morphology was observed by using a scanning electron microscope (SEM). It exhibited a mixture of fine and coarse scratches and pits, and the distribution of these varied according to the radial distance of the disc.
1. Introduction
In many engineering applications, the erosion of materials in sand–fluid flow is a serious problem, which can damage the surface of equipment, increase the maintenance cost of equipment, and even lead to safety problems. Therefore, the understanding of the solid–liquid two-phase flow is particularly relevant for avoiding mechanical degradation, including the elaboration of erosion-resistant materials and erosion prevention programs for industry-related applications.
With the rapid development of industry, agriculture, catering industry and so on, large amounts of wastewater have been produced on the earth, resulting in a serious shortage of water resources. Recycling the nonfecal contaminated water, commonly referred to as grey water, has been identified as being potentially important for alleviating water resources and sustainable development of cities’ water infrastructure. Radin et al. [1], for instance, monitored the impact on the environment of the reuse of household grey water for garden irrigation. Monitoring results showed the greywater quality values for BOD (biochemical oxygen demand), TSS (total suspended solids), and pH which sometimes fell outside the range as stipulated in the guidelines. Giving this treatment, before the disinfection, removes unnecessary suspended substances in the collected water. Thus, certain wear by solid particles (erosion) appears in the water treatment systems (majority ash type). In the process of erosion, the sand entrained in the fluid carrier collides with the surface of the component, causing a serious wear damage to the component [2,3,4,5]. This complex wear process usually depends on many factors [6,7,8,9], such as particle, impact, sand component, and fluid flow parameters. However, the system of wastewater classification is somewhat problematic and may be obtained by using intelligent photonic sensors in the wastewater. The results by M. Borecki et al. [10] show that intelligent photonic sensors are capable of classifying wastewater parameters and can be easily operated. The proposed sensors work in contact with the examined liquid. In the literature, the relative importance of flow state and particle behavior on erosion rate has been debated using numerical and experimental techniques. Oluwaseun E. Adeeji et al. [11] analyzed the local wear variables of the high-precision erosion model under the complex geometry conditions. The simulations show the dispersion of particles at the elbow is enhanced, resulting in more uniformly distributed local wear variables. Zhang et al. [12] studied the erosion wear of high-pressure pipes during hydraulic fracturing slurry flow based on the DPM method. The numerical results indicate the most likelihood of maximal erosion rates, particle concentration values, and pressures occur at the outer wall of the elbow. The maximal erosion part at the inner wall is near to the elbow outlet. Ou et al. [13] conducted the numerical prediction on the erosion wear of a coal slurry transmission pipeline. They used the dense discrete phase model-kinetic theory of granular flow (DDPM-KTGF) and a modified erosion model to calculate the particle trajectories and erosion rates. Zhu et al. [14] used the CFD-DPM, based on the Euler Lagrange and erosion model, to solve the liquid–solid two-phase flow and predict the erosion distribution. This numerical model, previously verified experimentally, showed that the erosion mainly occurs on the outer and lower surface and downstream pipe of U-bend. Nemitallah et al. [15] pointed out the influence of flow rate, particle size, and pipe material on the erosion downstream of the sharp edge hole; although, research has suggested the particle shape also affects the erosion rate [16,17,18,19]. Desale et al. [20] showed that the erosion of ductile materials is both a function of the size and hardness of the erosion agent and of its shape and density. Therefore, particles with high density and low shape factor will lead to deep pits and high surface roughness. A computational study of the particle size effect on a jet erosive wear device was proposed by Aponte et al. [21]. Their results showed that the erosion rate with smaller particles was affected by fluid; since small particles tend to follow the flow streamlines, while larger particles move according to the conditions imposed by the jet at its outlet. The effective impingement angle against the surface was lower for small than large particles. As a result, the angle of maximum erosion rate, between the jet and the sample’s surface, for small particles increased. Aponte [22] assessed the complexities of the erosive wear of a Francis turbine at different operating points by using a CFD multiobjective optimization methodology. V.B. Nguyen et al. [23] studied the influence of particle size on erosion characteristics through experiments and numerical simulation. The results showed that the erosion rate first increases but then decreases with the particle size, reaching a maximum with a particle size of 150 μm. Mansouri et al. [24] used CFD simulations with low Stokes number (in this condition the particles tend to follow the streamlines of the fluid) to characterize the particle impact velocity and impingement angle on the surface, which is affected by the fluid flow, and frequency at specific locations on the specimen. The simulations were correlated with the measured erosion depth of the specimen subjected to the impingement jet tests.
With regards to erosion mechanisms, four types may be identified: chipping, sliding, ploughing, and cutting [25,26]. Desalea et al. [27] investigated in a slurry pot tester the effect of particle size on the erosion wear of an alloy (AA 6063). Eight different sized quartz particles with mean size varying between 37.5 and 655μm were used. The wear specimens were rotated inside the pot at 3 m/s velocity with an orientation angle of 30° and 90° in a sand–water mixture of 20% concentration (by weight). The results confirmed the positive association between erosion wear and mean particle size. Mahboobeh et al. [28] suggest the particle size increases slightly the amount of ploughing, with the surface softening also becoming more pronounced due to higher probability of penetration and deformation (plastic) of the surface layer. The results show that the erosion mechanism of sand is indentation and extrusion when the particle size is below 200 μm, and ploughing when it is above 200 μm. Tarodiya and Grandhi [29] studied experimentally the wear treatment of solid–liquid mixture in the pump shell of centrifugal slurry pump. Two kinds of sand slurry with equal particle size were used in the experiment under two pump speeds and two flow rates. The wear sample (1.5 × 1.5 × 0.01 cm3) of AISI304L steel was fixed at different positions along the centerline of the casing wall. In each case, scanning electron microscope (SEM) images of the worn samples were also examined to study the failure of materials at different locations. Bhushan D. Nandre et al. [30] studied the effect of impact angle on slurry erosion wear of four different ductile materials: AISI SS304, AA 6063, Copper, and Brass. The erosion wear due to solid–liquid mixture of Indian Standard sand and tap water at different impact angles showed typical ductile erosion behavior for the selected materials. The angle of the maximum erosion was 22.5° for AISI SS 304, 45° for AA 6063, 22.5° for Copper, and 30° for Brass. Akbar Jafari et al. [31] compared the abrasive and erosion wear characteristics of four kinds of wear-resistant steels. In order to study the corrosion behavior, an experimental device was developed to allow the sample to move in the mud environment. For abrasive wear, the pin disc method was used, where the sample plays the role of pin movement on the circular abrasive disc. Different pushing forces, samples onto the disc, were used in the tests. A comparison was made on the microstructure, hardness, and erosion wear properties of the samples. Interestingly, the highest hardened steel did not necessarily result in the highest wear-resistant steel. Valtonen et al. [32] simulated the wear behavior of the cutting edge in the laboratory scale with several application-oriented abrasive and impact abrasive wear testing methods. The wear surfaces and cross-sections of the original cutting edge and the test samples were characterized, and the wear behaviors were compared with each other. Work hardening of the steels occurred in all cases, but the amount of plastic deformation and the depth of the wear scars varied. Nguyen et al. [23] used the wet erosion test-bed to set the mixing velocity of sand and water as 30 m/s, and took different average particle sizes of 50, 80, 150, 350, 450, and 700 μm. A transition of erosion profile, from "W" to "U" shape, occurred with the increase of sand size. Nguyen et al. [25] tested the slurry erosion of stainless steel SUS-304 by using new advanced erosion test rig, where the multiphase flows of alumina sand and water were utilized as the erodents. Initially the erosion rate was high but reduced (gradually) subsequently. In addition, the erosion rate increased with impact velocity. The surface roughness increased with either increasing testing time or impact velocity. Hloch et al. [33] observed the effects of hydrodynamic ductile erosion on aluminum through a pulsed water jet moving in an inclined trajectory. Different erosion regimes were obtained by moving the pulsating water jet head and gradually changing the standoff distance along the inclined trajectory. With a gradual increase in the standoff distance (from 5 to 90 mm), the observed erosion regimes were observed in terms of micro-pitting action, crack and crater formation, and material folding and upheaving. Despite the research on solid–liquid two-phase flow erosion wear has made certain progress [34,35,36], experimental findings about the wear of hydraulic rotating machinery is limited, and the wear law caused by the rotation of solid components (such as turbine runner) needs further study. Therefore, this paper seeks to explain the development of the erosion and wear of rotating parts in the context of the physical properties of the particles. The numerical and experimental data for this study is collected using a simplified rotating disc.
2. Experiment Investigation
Both qualitative and quantitative methods were adopted in the wear effect analysis. By measuring the wear amount of stainless steel (ASTM201) at different linear speeds, the surface morphology of the samples on different disc surface radii was obtained. Then, the influence of the surface evolution in the process of wear was studied, forming the basis for the change of the wear mechanism.
2.1. Experimental Setup
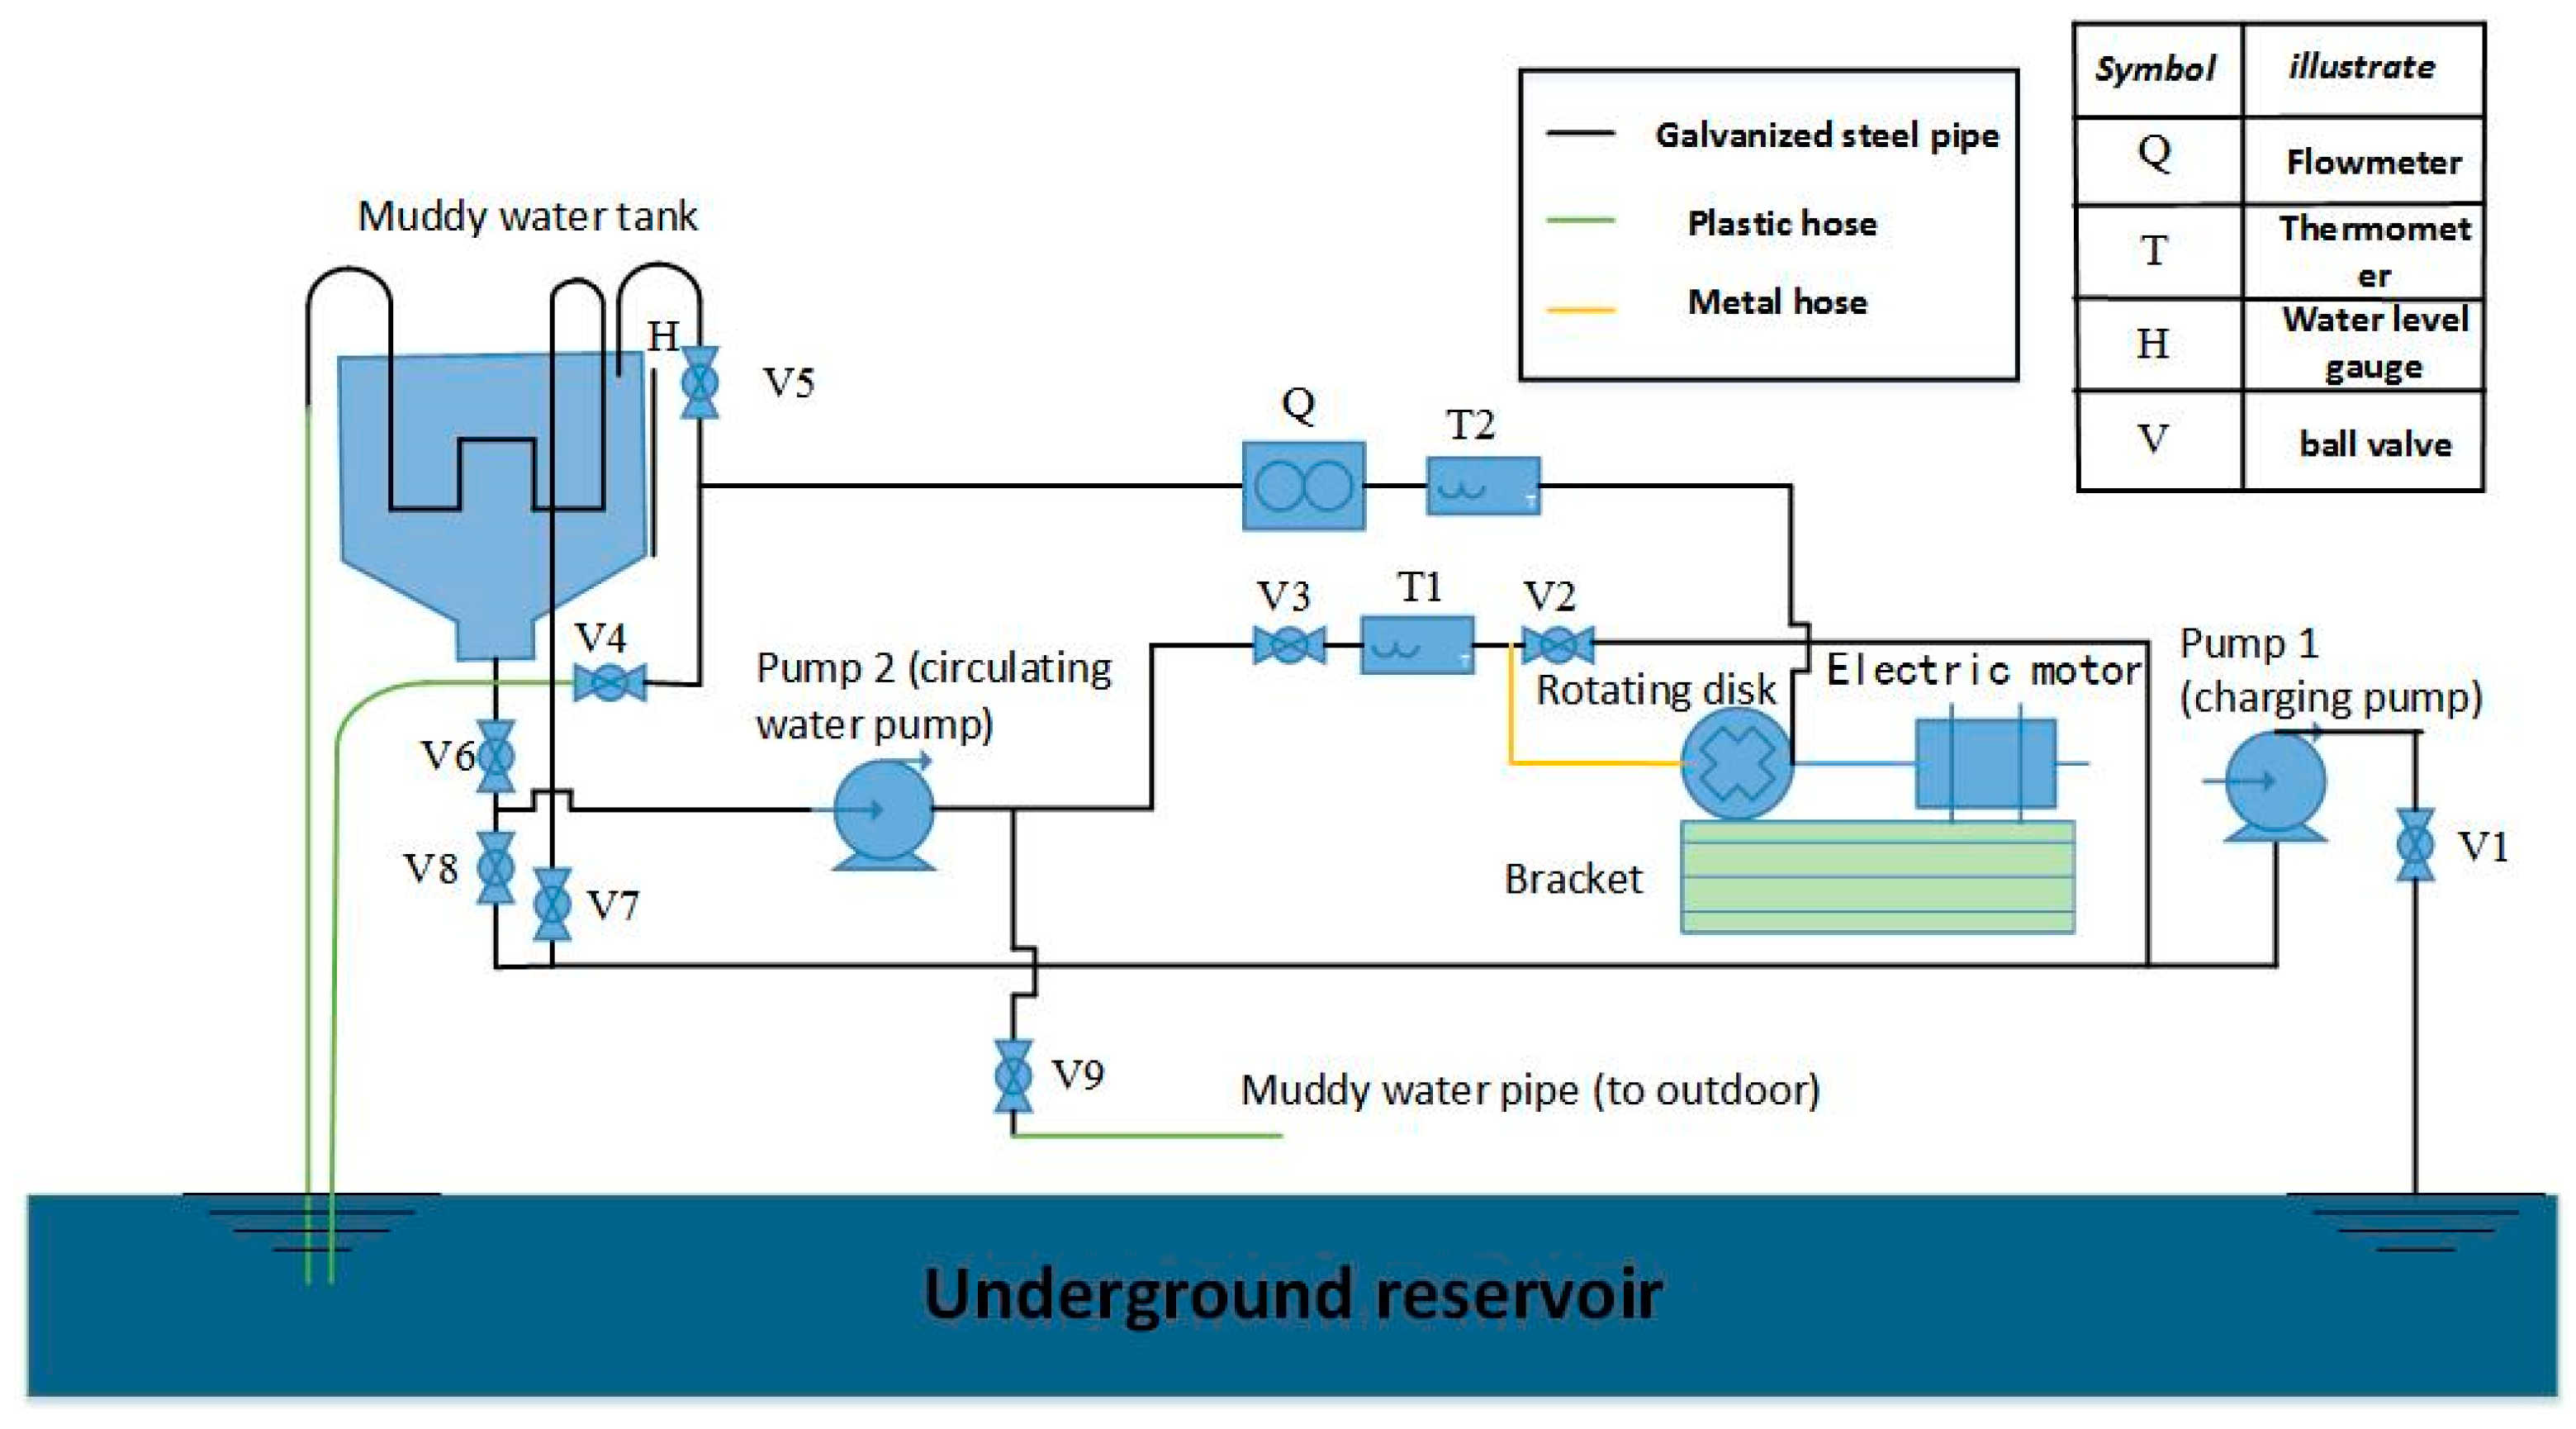
A circulatory, automated erosion test system, based on a motor-driven disc within muddy flow, was developed as shown in Figure 1. The equipment was mainly composed of muddy water, a water tank, cooling water system, rotating disc chamber, water pump, and measuring instruments.
Water was pumped from the underground reservoir to the muddy tank (where the sand and water mix) and then to the rotating disc. The speed of the particles was 2.05 m/s, and the volume fraction was 2.5%. The sediments measured, on average, 0.1 mm and caused damage on samples, purposely embedded at the 79/90th and 5/8th of the disc outer diameter (D = 360 mm). Thus, the test and disc surface were the same.
The test sample was processed into a cylinder with a diameter of 28 mm and a thickness of 6 mm. In order to reduce the influence of surface roughness on the abrasion process, all the abraded samples were polished prior to the tests. The angular speed of the disc (ω) was set to 3000 rpm by using a variable frequency motor and converter. As a result, the linear speed of the sample was obtained by v = ωD/2.
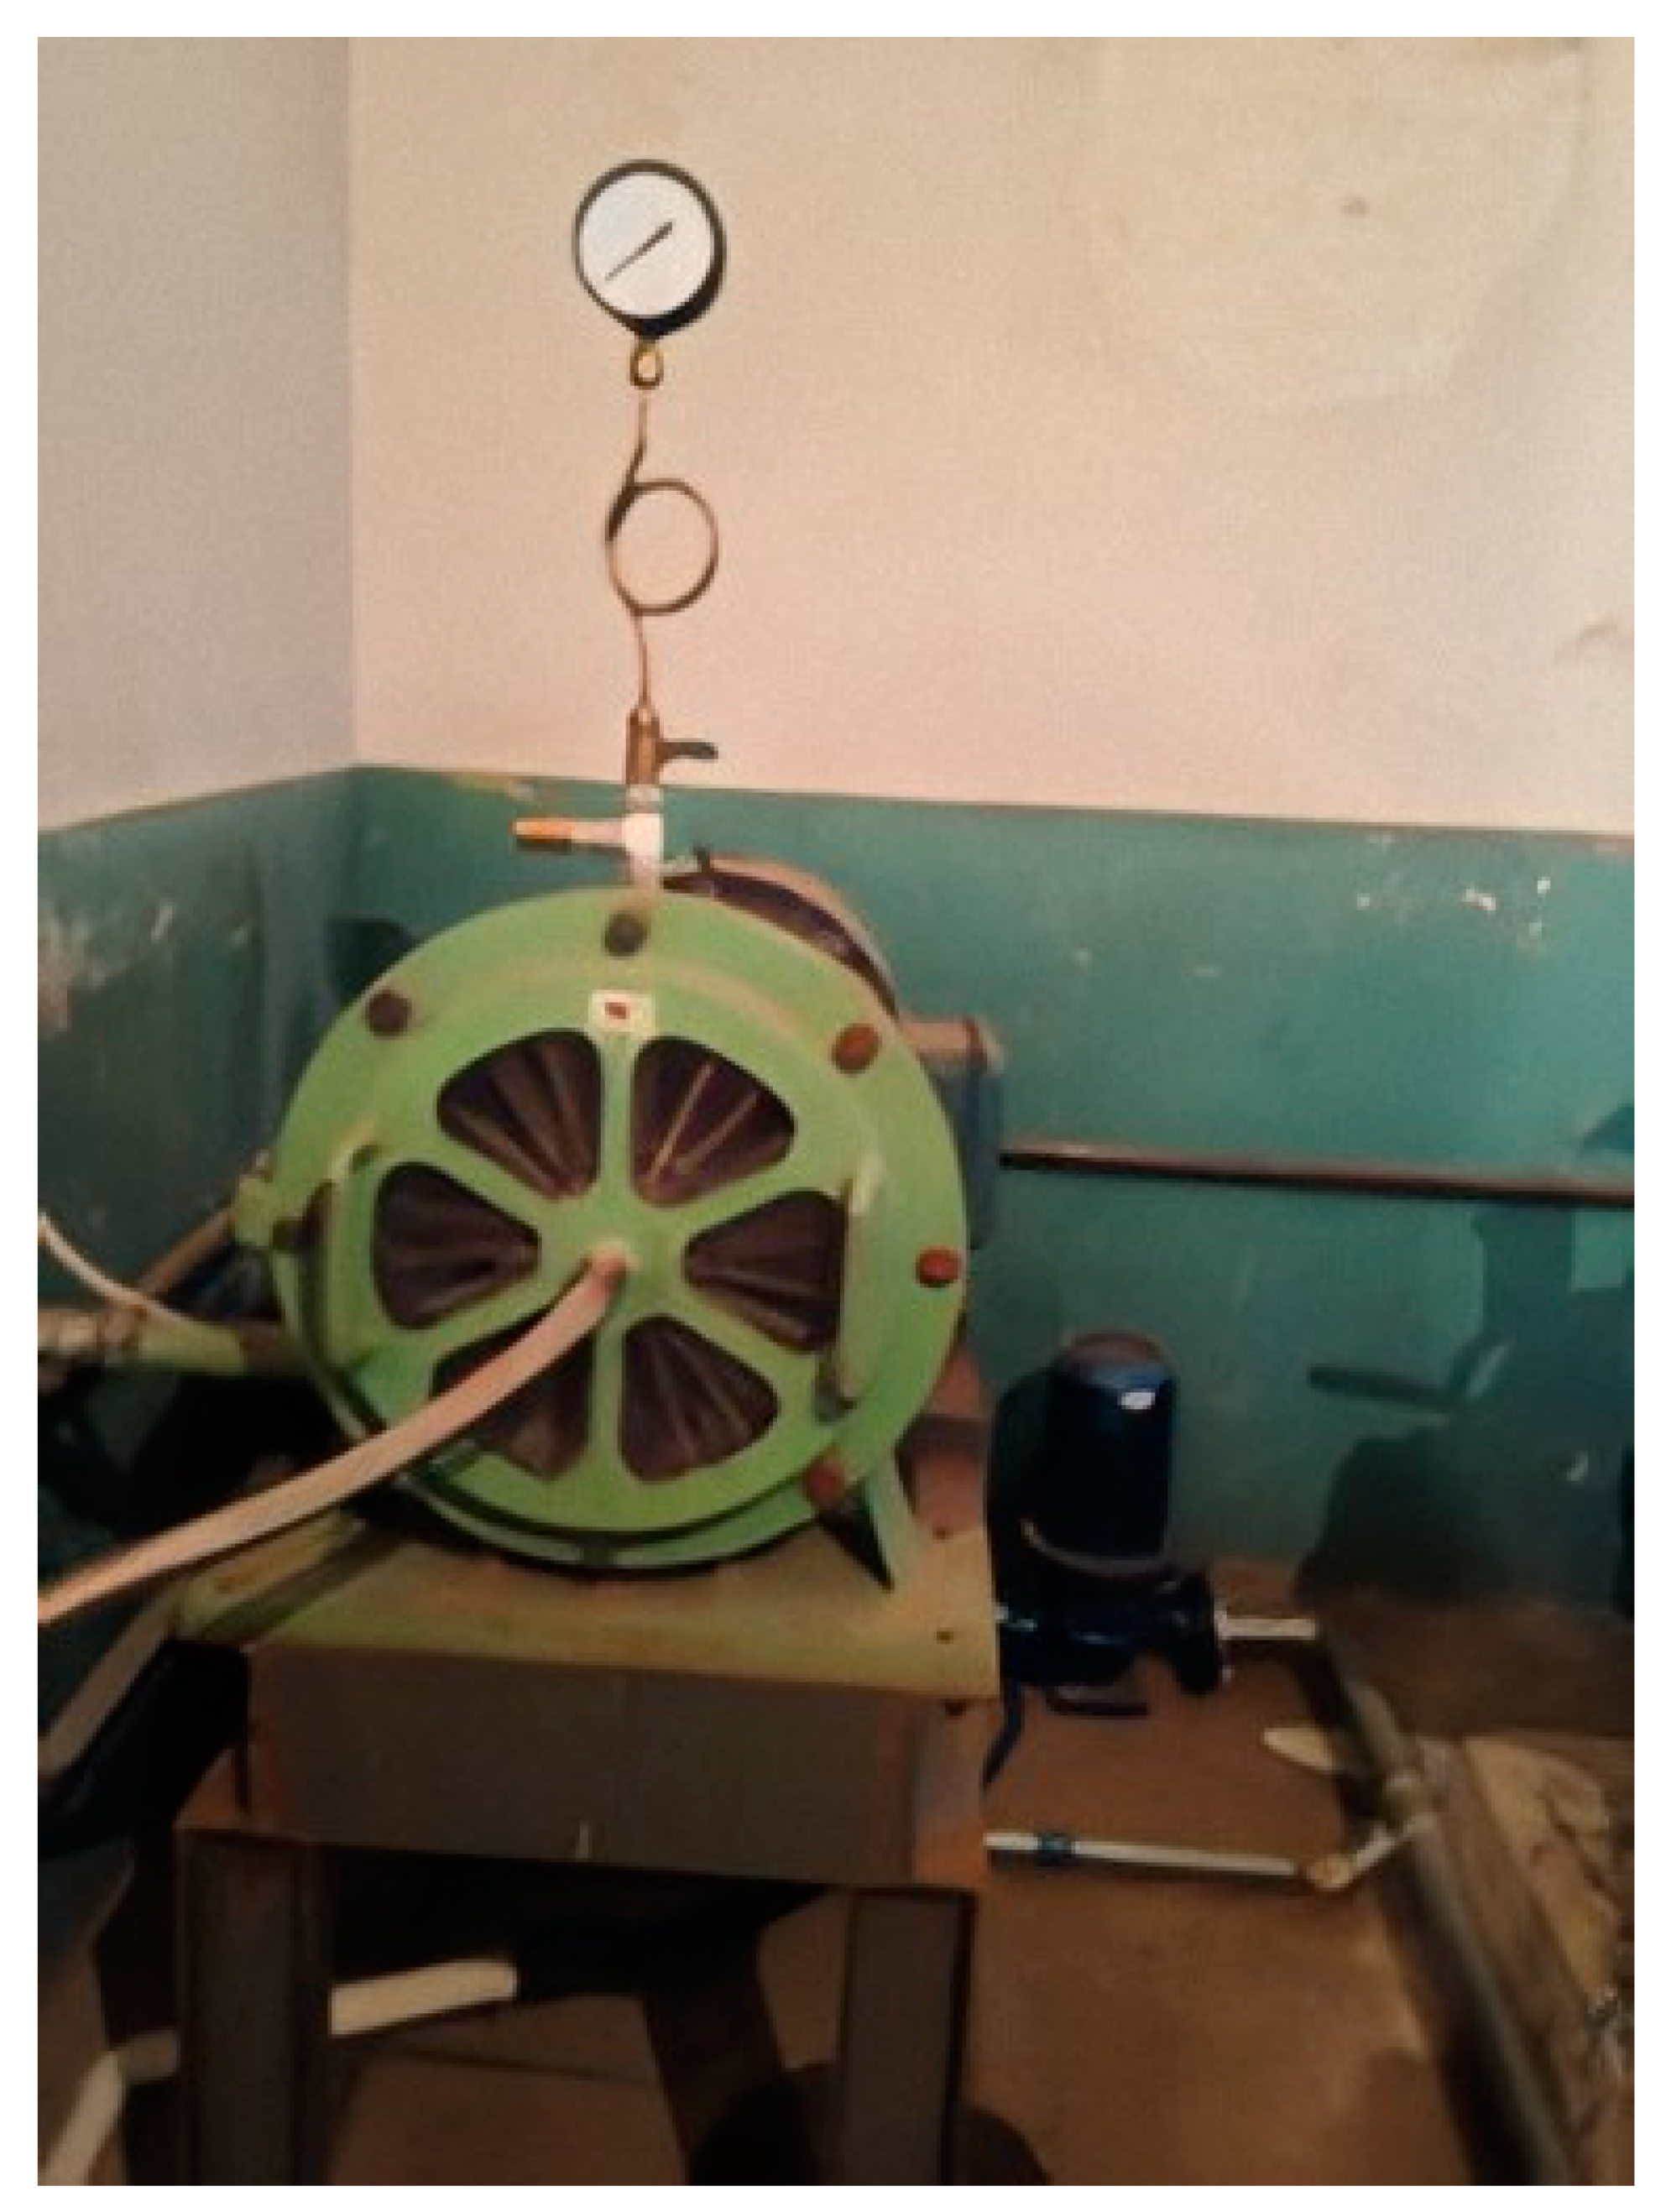
Ball valves were installed across different sections of the pipelines. Prior to the disc, a flowmeter measured the speed of the flow, a pressure gauge measured the pressure, and a thermometer measured the temperature. A water gauge indicated the level. The system photos are shown in Figure 2 and Figure 3.
2.2. Experimental Measurements
The wear weighing and morphology observation on the test sample was obtained after 12 h of continuous erosion operation. Once the worn samples were extracted from the disc, these were cleaned and then dried to avoid possible sources of error. Weight of the sediment laden water and mass of the sample was obtained using an electronic balance with an accuracy of 1 × 10⁻⁴ g. Two groups of data were recorded in total, by repeating the above steps.
The wear loss rate was calculated by the following Equation (1):
where: El is the weight loss rate of the wear, whilst Ebt and Eat are the weight of the sample prior to and after the test, respectively.
3. Numerical Approach
3.1. Multiphase Flow Model
The Eulerian–Lagrangian method [37] is used to simulate the multiphase flow of liquid water with sand particles. The water is a continuous phase, whereas the sand is a discrete phase. The instantaneous motion of turbulence is controlled by the Reynolds Averaged Navier–Stokes (RANS) equations. The RANS equations decompose the physical quantity of the fluid particle at any time into the sum of a mean value and a pulsation. Luo et al. [38] simulated the flow field in a small oxidation ditch by the RANS equation. The flow pattern was analyzed in detail, and both trials and simulations were found to be similar. The Realizable k-ε turbulence model is used to effectively simulate the turbulent flow in the rotating region. The Realizable k-ε model gives a new formulation for turbulent viscosity and dissipation rate and is comparatively new from the other k-ε turbulence models. Ilieva [39] applied the Realizable k-ε turbulence model in the research of erosion failure mechanisms in turbine stage with twisted rotor blades.
The DPM model is used to simulate the movement of particles in water flow. This model is suitable for solid–liquid two-phase flow with particle volume fraction less than 10%. In the DPM model, the volume fraction of the second phase (particle phase) is regarded as very small and thin. Therefore, the interaction between particles and the influence of particle volume fraction on the continuous phase are considered negligible. The particle motion is solved in Lagrangian coordinate system. By taking X direction as an example, it becomes: [40].
where u is the velocity of the fluid, m/s; up is the velocity of the particles, m/s; μ is the dynamic viscosity of the fluid, Pa·s; ρ is the density of the fluid, kg/m3; ρp is the density of the particles, g/m3; dp is the diameter of the particles, m; Re is the relative Reynolds number; CD is the drag coefficient; gx is the acceleration of X-component gravity, m/s2; and Fx is the other force in X direction, N.
Roza et al. [41] used the DPM method to simulate the particle flow path in the sedimentation tank. They analyzed and compared the flow characteristics of different particle diameter and volume fraction fluid. Based on the DPM method, Han Wei et al. [42] studied the abrasion of the upper and lower surface of the end clearance of the movable guide vane of the hydraulic turbine under the condition of different inlet speed, sand size, and sand volume fraction.
The general Equation (6) of wear per unit area and time is [40]:
where ER, the erosion wear rate, means the amount of wear per unit area and per unit time, kg/(m2·s); N, particle number; mp, particle mass flow rate, kg/s; C (dp), particle diameter function; θ, particle impact angle; f(θ), impact angle function; up, particle relative wall velocity, m/s; b(v), function of relative velocity; and Aface, micro element area of impact wall.
3.2. Geometry Model
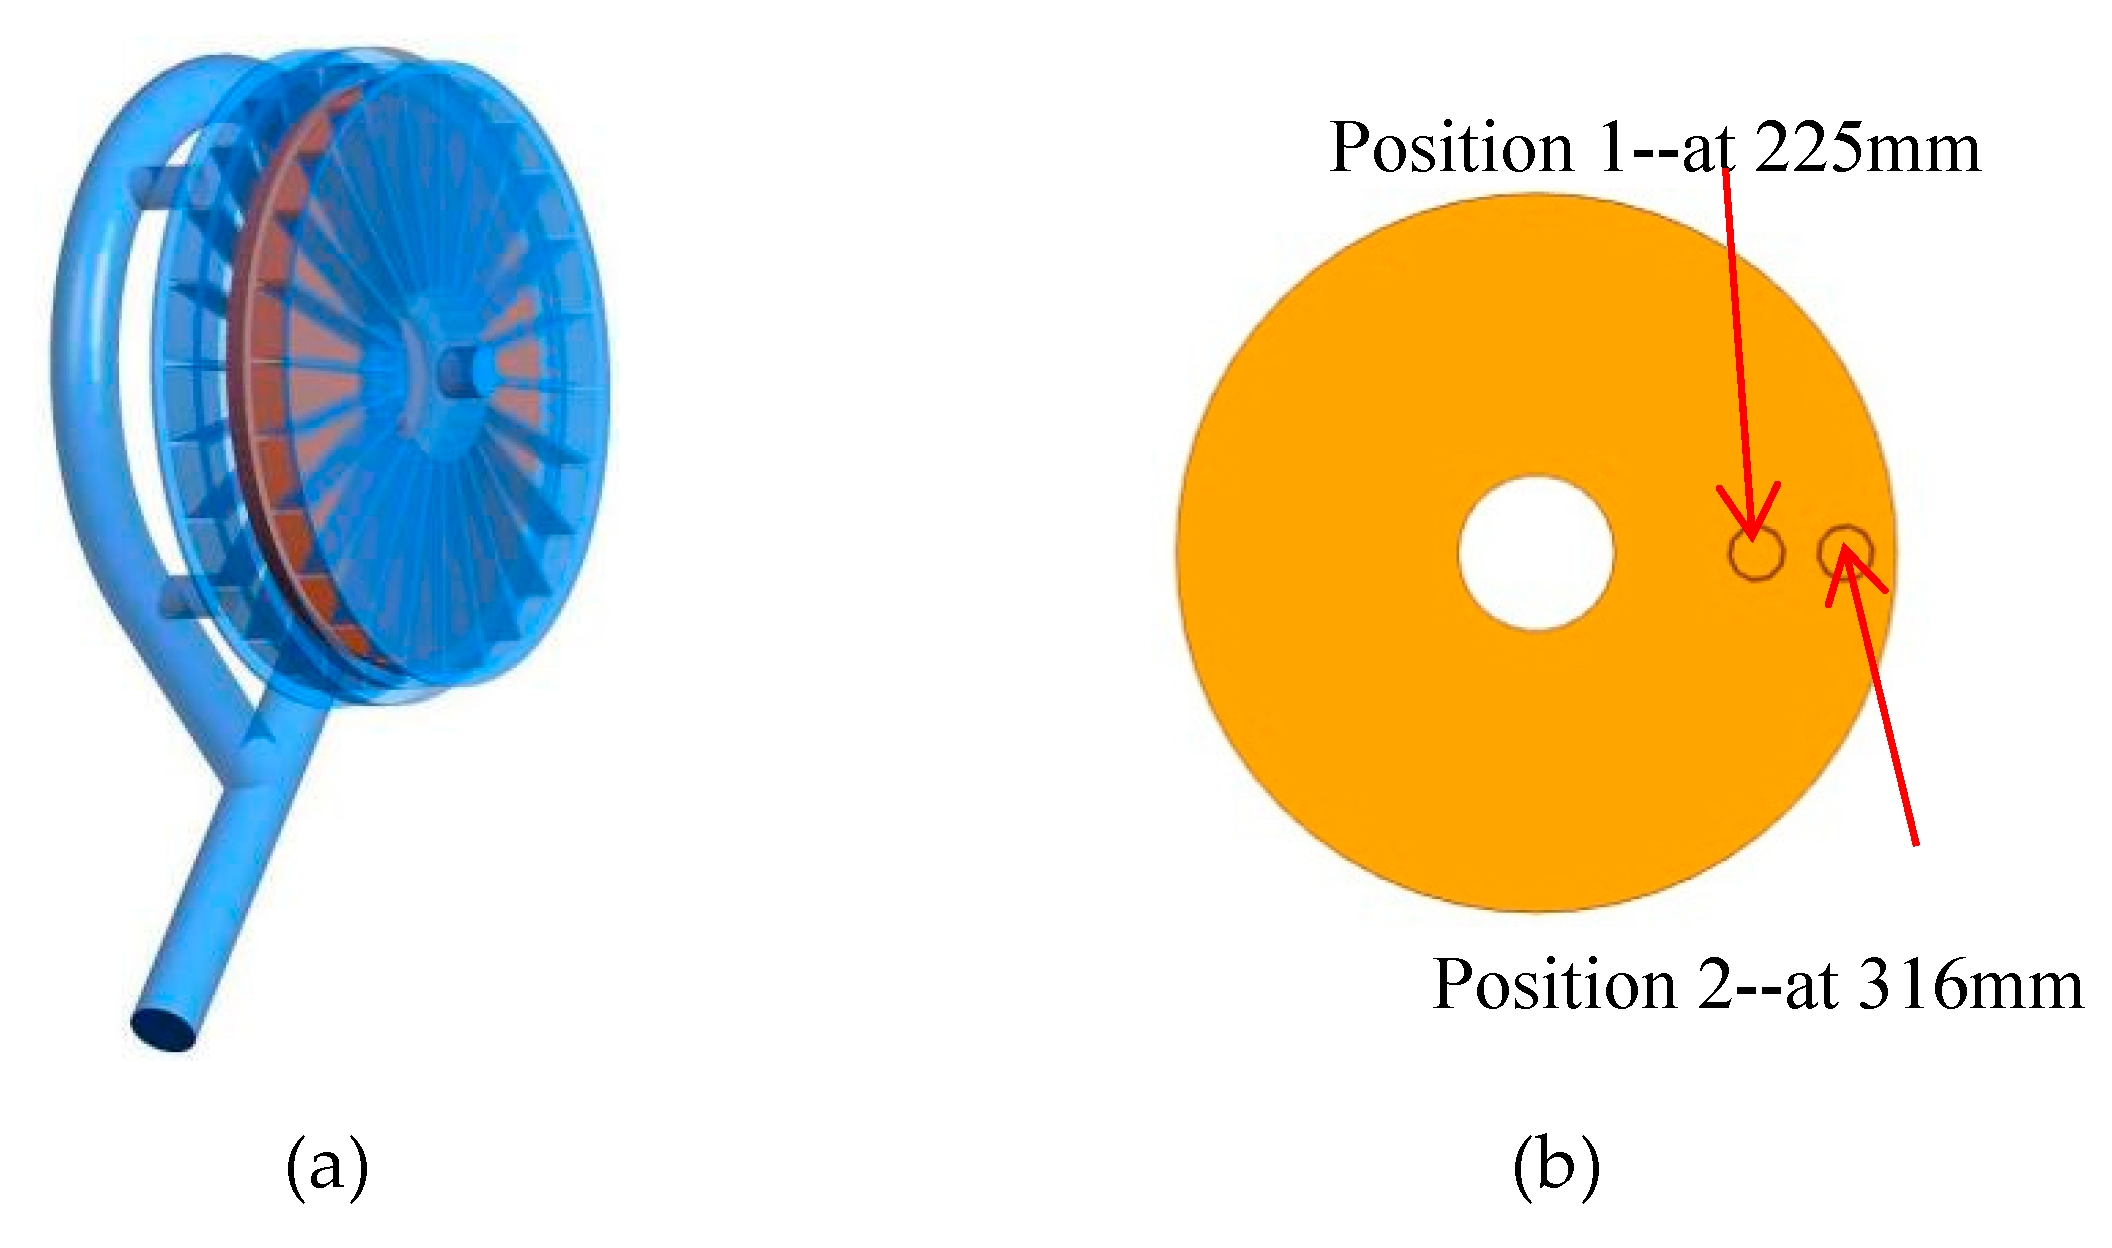
The geometric model of numerical simulation was based on the structure of physical test, using Unigraphics NX commercial software for three-dimensional modeling. The calculation domain was established, to ensure the physical phenomena and scour behavior of multiphase flow is captured in the simulations. The overall flow channel of the rotating disc is shown in Figure 4a. The surface of rotating disc, the side facing the particle incident direction, is shown in Figure 4b. Two stainless steel samples were positioned from the disc origin at 225 mm (Position 1) and 316 mm (Position 2). The structure of the numerical simulation model was divided into box shell, front baffle, rotating disc surface, rear baffle, and annular outlet pipe. There were 24 cascades evenly distributed in the front and rear baffles. The outer diameter of the disc was 360 mm, and the diameter of the circular surface of the water inlet was 32 mm.
3.3. Numerical Methods
An unstructured tetrahedron mesh was divided in the whole rotating disc model by using the ICEM CFD software. The grid independence was verified with the values of the maximum erosion wear. Figure 5 shows that when the number of grids reaches 6.147 million, the maximum wear tends to be stable. Therefore, the total number of grids of 6.147 million was chosen. Figure 6 illustrates the divided grids of the model.
The boundary condition of the inlet side was the velocity inlet, and of the outlet, the free flow. The density of the solid particles was 2800 kg/m3, and the rotating speed of the rotating disc was 3000 rpm. The k-ε turbulence model in fluent software was used to simulate the single-phase steady state of the liquid phase. Once the single-phase converged, the discrete phase was added and the DPM model was added to simulate the unsteady state of the solid–liquid two-phase flow. The wall surface was slip free. In the unsteady state simulation, the DPM behavior of the wall was set to reflect, whereas the erosion calculation model was simultaneously used. By using the coupled method, the unsteady time step was set to 0.0005 s, and the total solution time was 0.75 s.
4. Results, Analysis, and Discussion
The effect of changing one out of three wear mechanisms values (particle volume fraction, diameter, and inlet velocity) on the surface model was investigated under four representative conditions of full-scale experiments. Thus, a total of 12 studied conditions were given, as shown in Table 1.
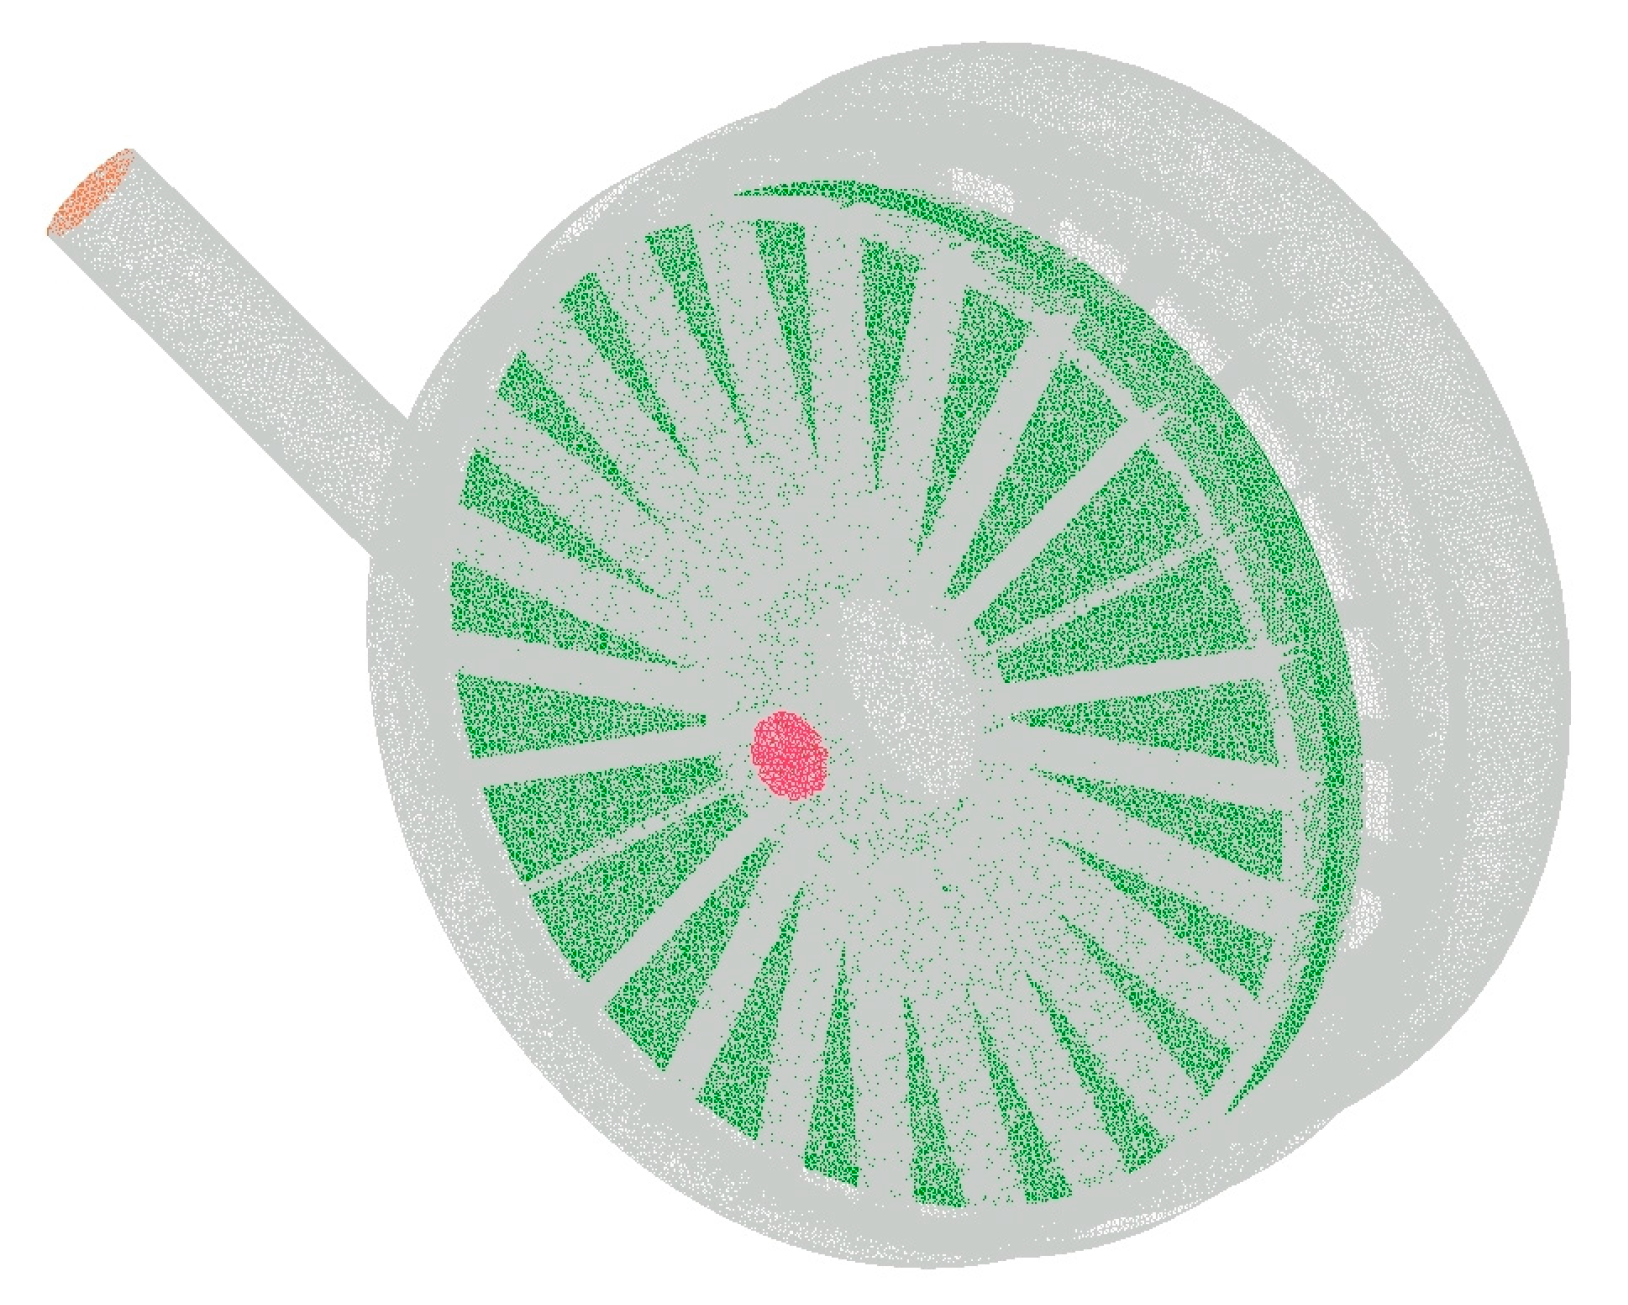
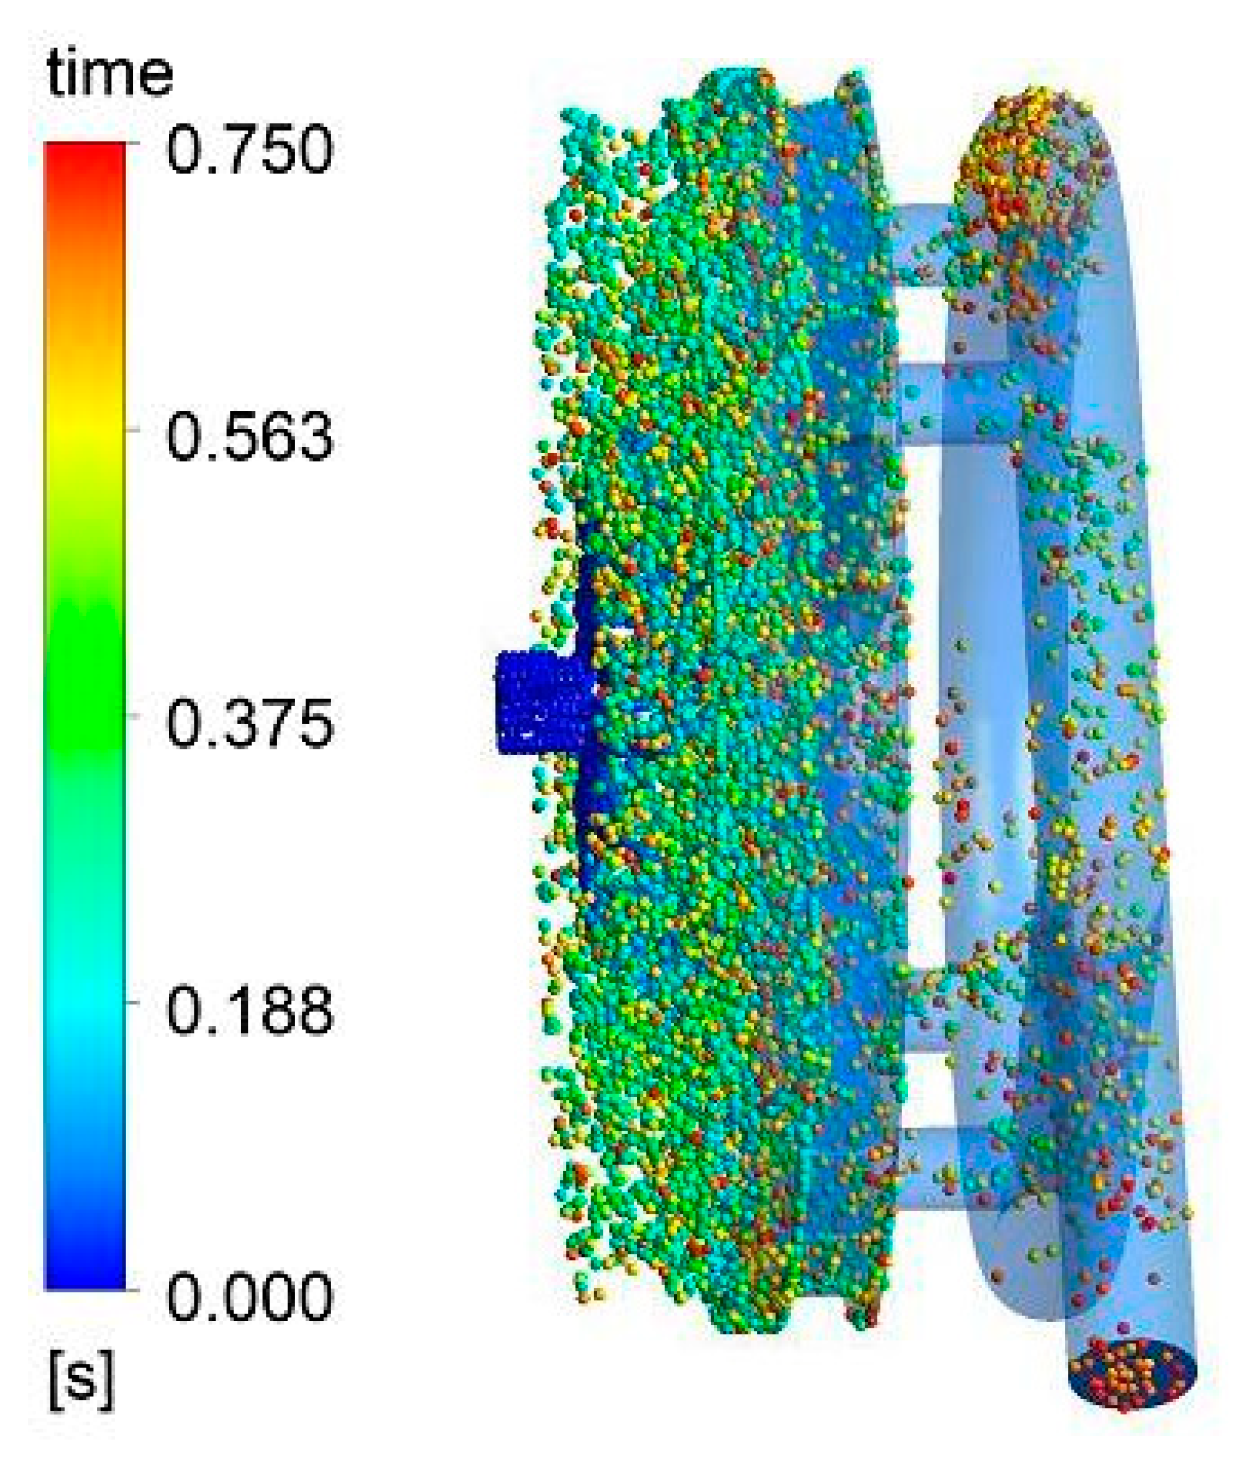
In order to understand how wear is developed on the test sample, the corresponding study (condition 1) of the rotating surface was chosen to analyze the movement of the particle, the erosion distribution, and the wear dependence with radius. Based on the movement simulation (Figure 7), the particles initially enter the rotating disc from the inlet, but then collide and reflect due to front and rear baffle plates and the rotating disc surface. Thereafter, they are discharged along with the water.
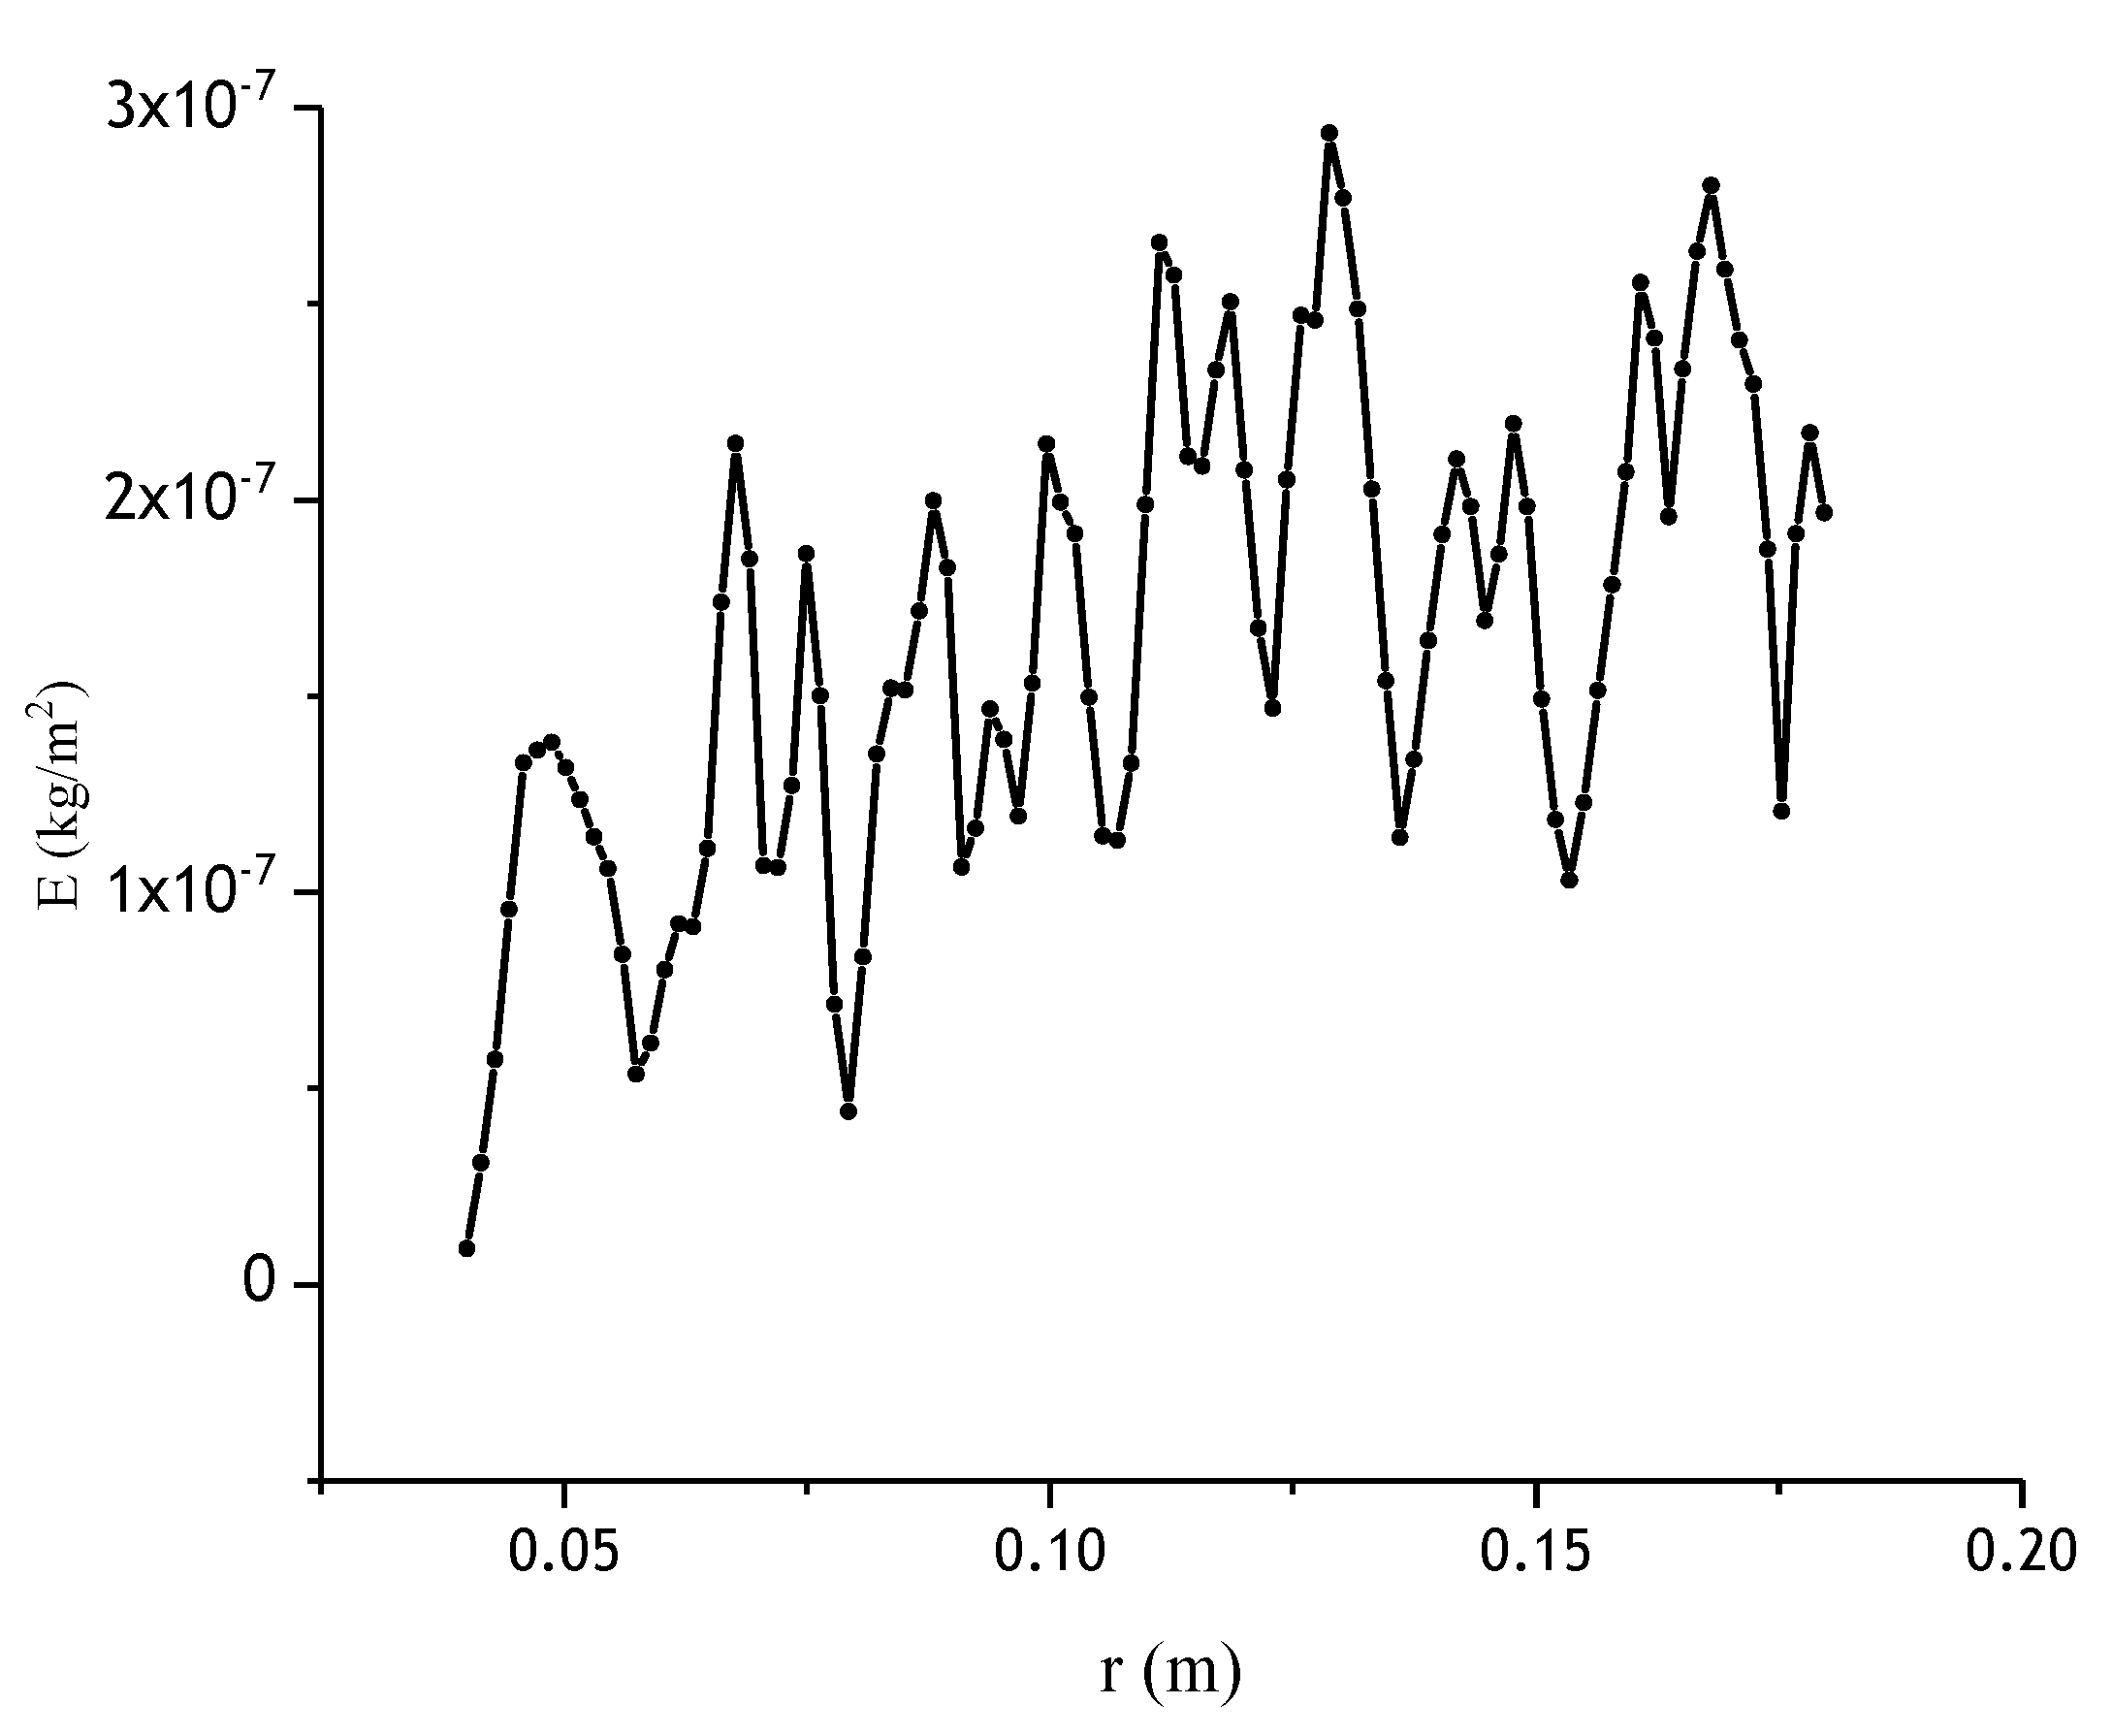
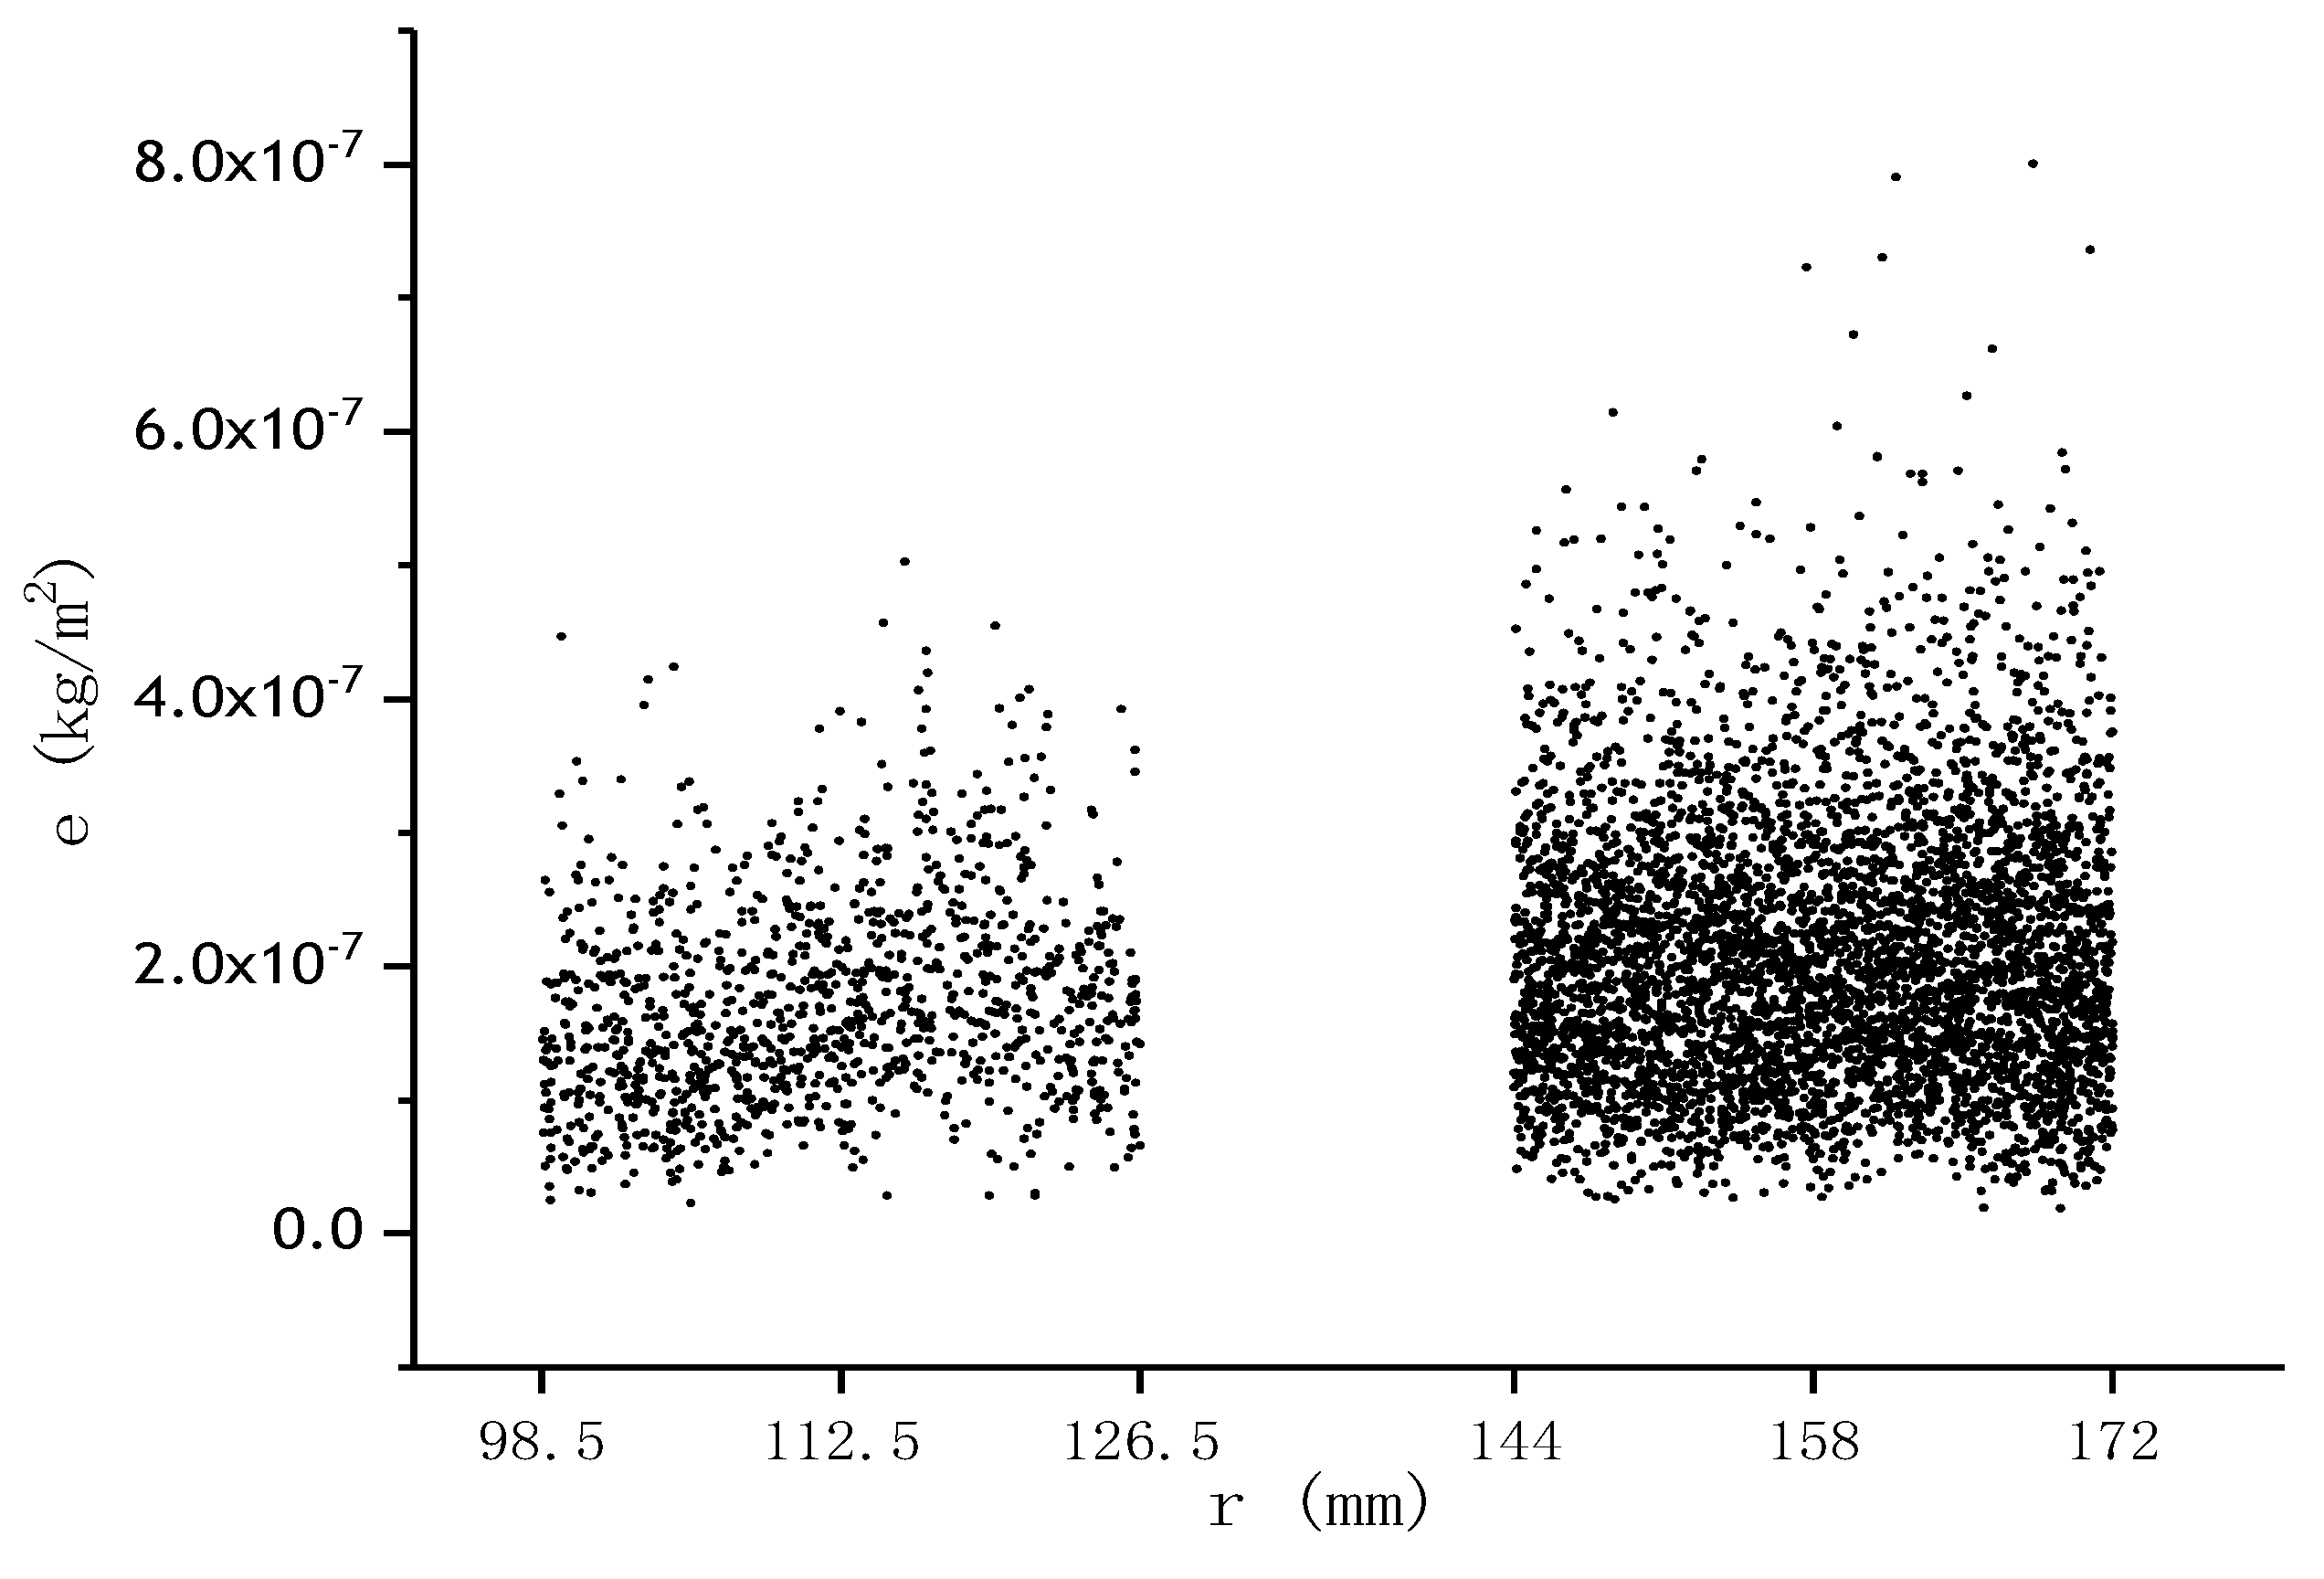
To illustrate the erosion depth, a cloud chart of the wear on the surface of the rotating disc was obtained, as shown in Figure 8. Clearly, the wear occurs in the shape of spots and the wear amount E (E, the weight loss of the disc after the numerical simulation) increases in a chaotic shape along the radius path, as a result of particles trailing the water flow (Figure 9).
For high-speed cases, the centrifugal force plays a key role, that is, the larger the radius, the greater the speed of the flow and particles. Thus, the impact of particles on the disc and the wear are increased.
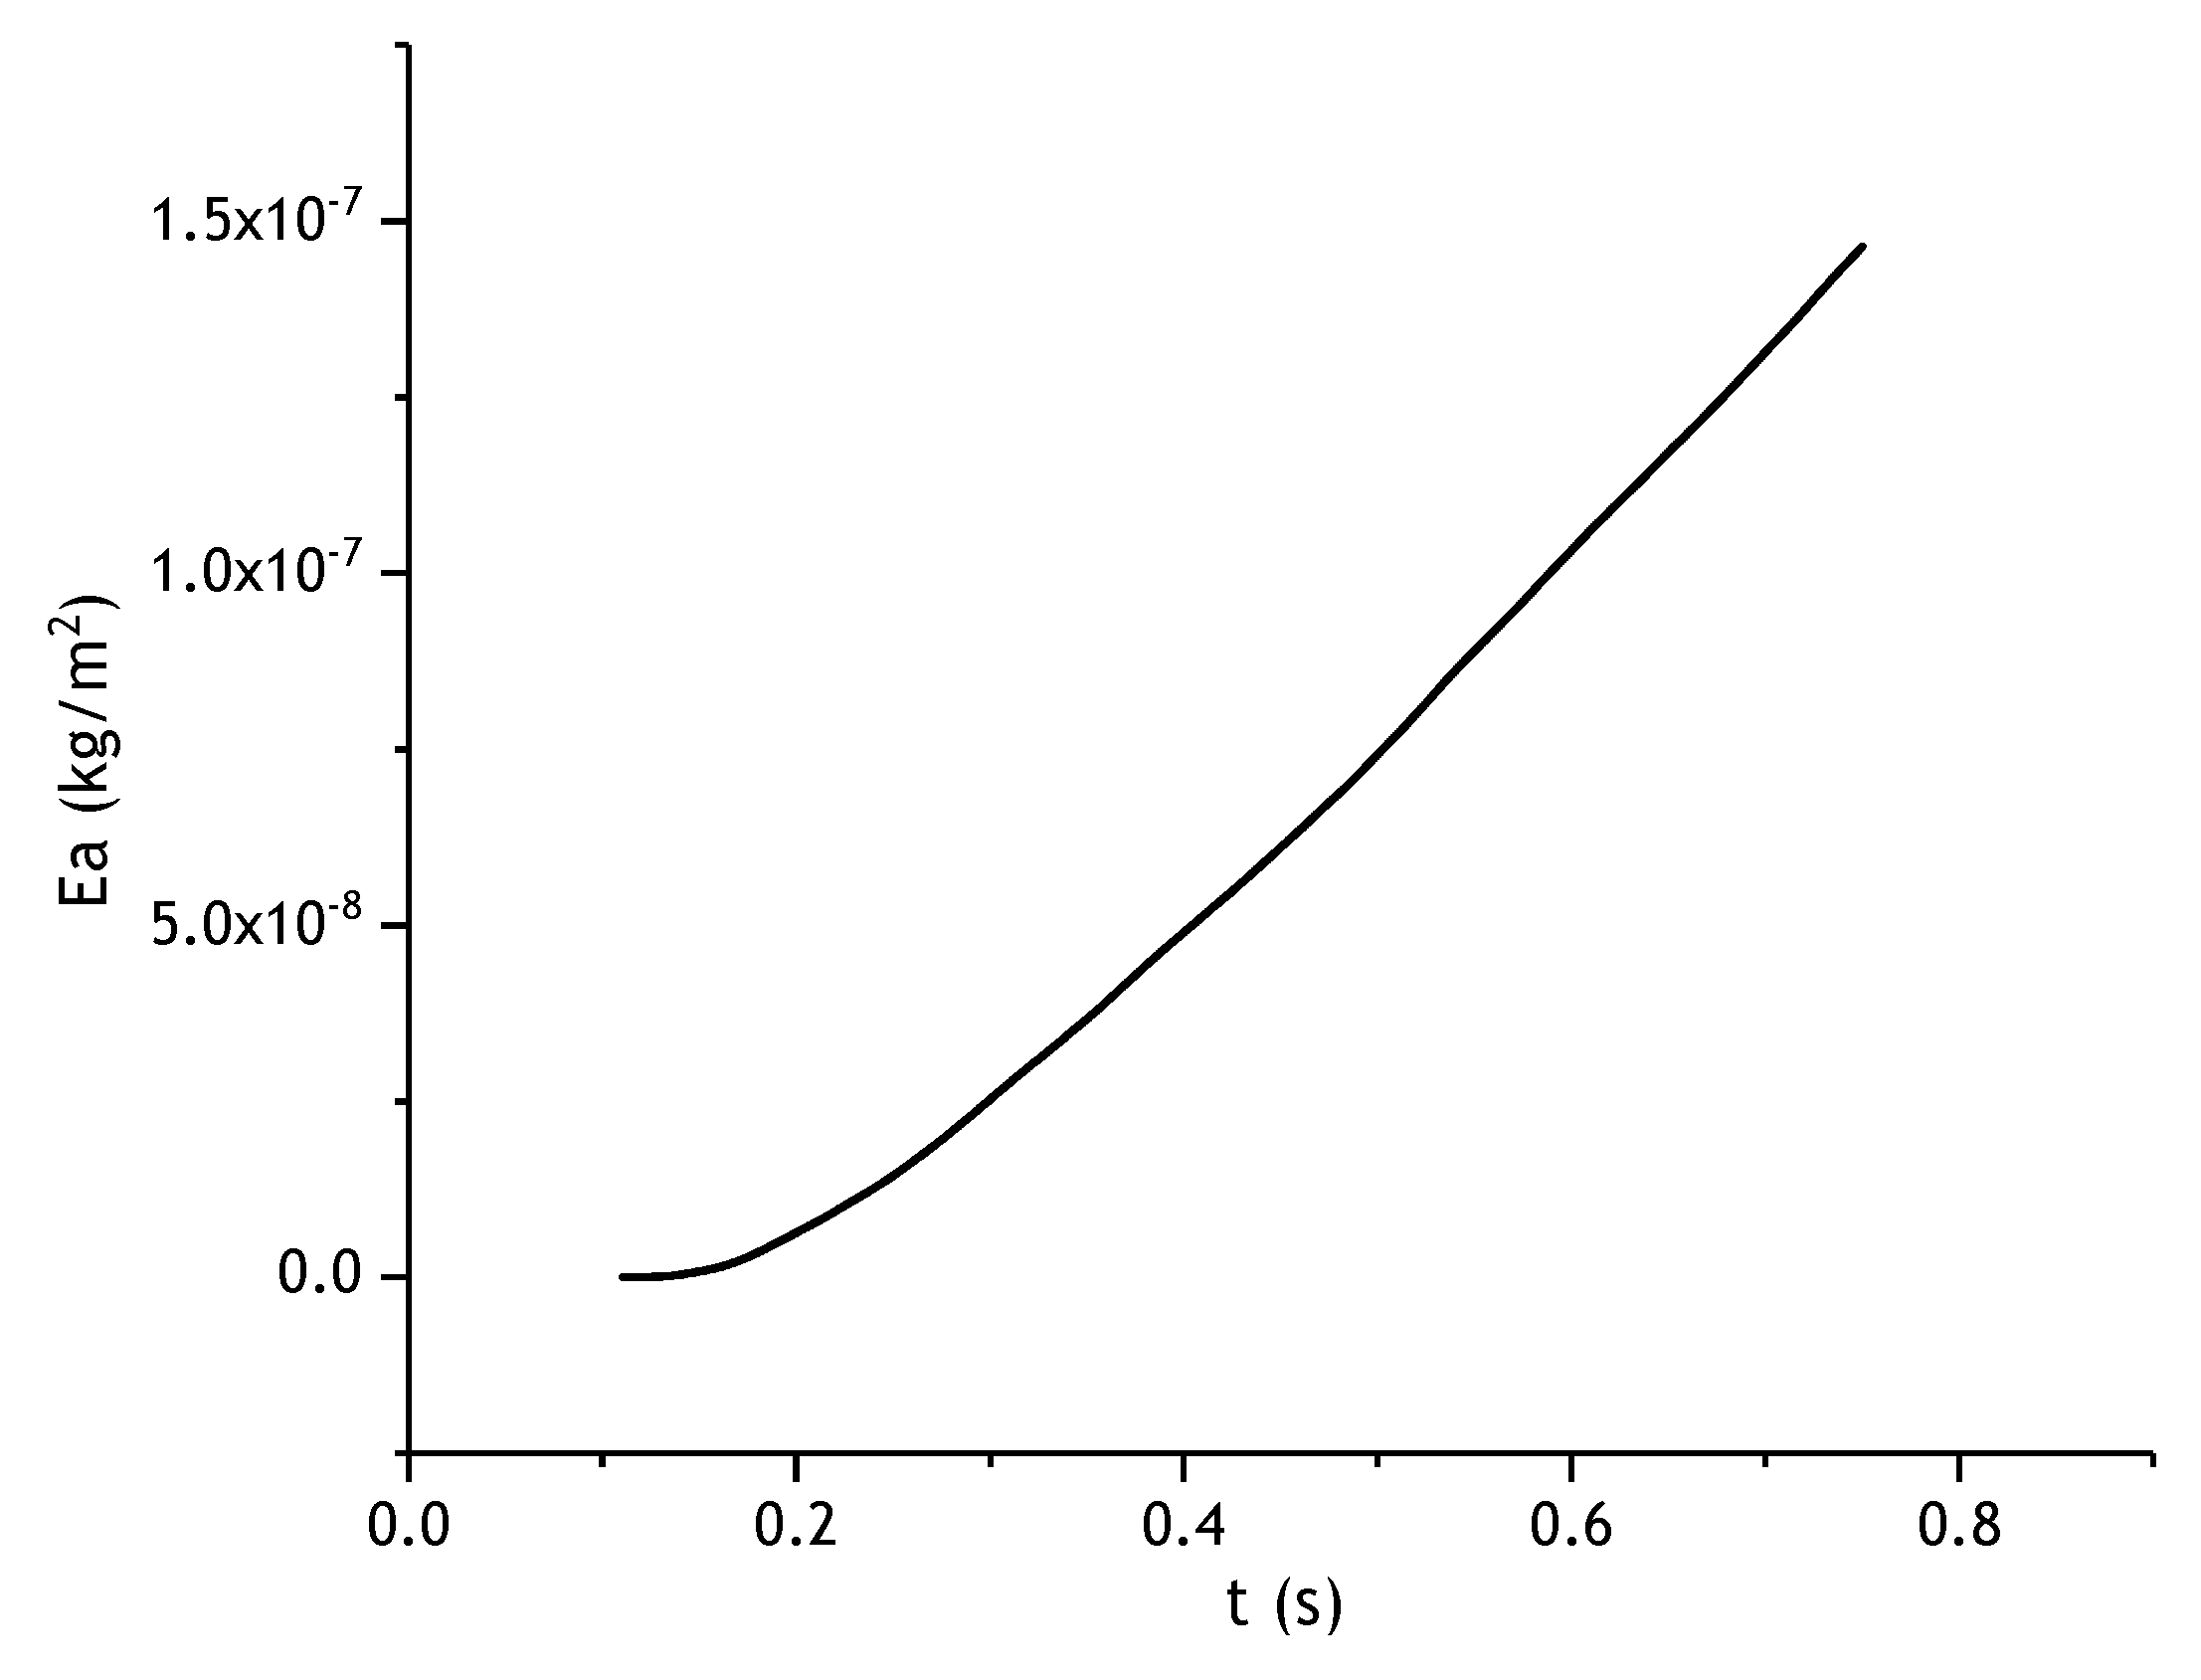
Figure 10 shows the change curve of average wear amount Ea with time. It can be seen that initially (0–0.2 s), prior to particles arriving at the disc surface, the average wear on the disc surface is basically 0, but then this increases exponentially with time. Since the wear is a time-accumulating process, the longer the particles act on the disc, the greater the average wear of the disc.
Figure 11 shows the wear distribution expected in the disc samples of diameters 225 and 316 mm. It can be seen from Figure 8 and Figure 9 that the wear degree increases with the radius. As expected from Figure 11, the surface wear of the sample behaves chaotically but increases, on both average and peak terms, along the radius. This disorder is mainly related to the irregular movement of the particles impacting the surface of the specimen.
4.1. Effect of Solid Particle Diameter on Wear
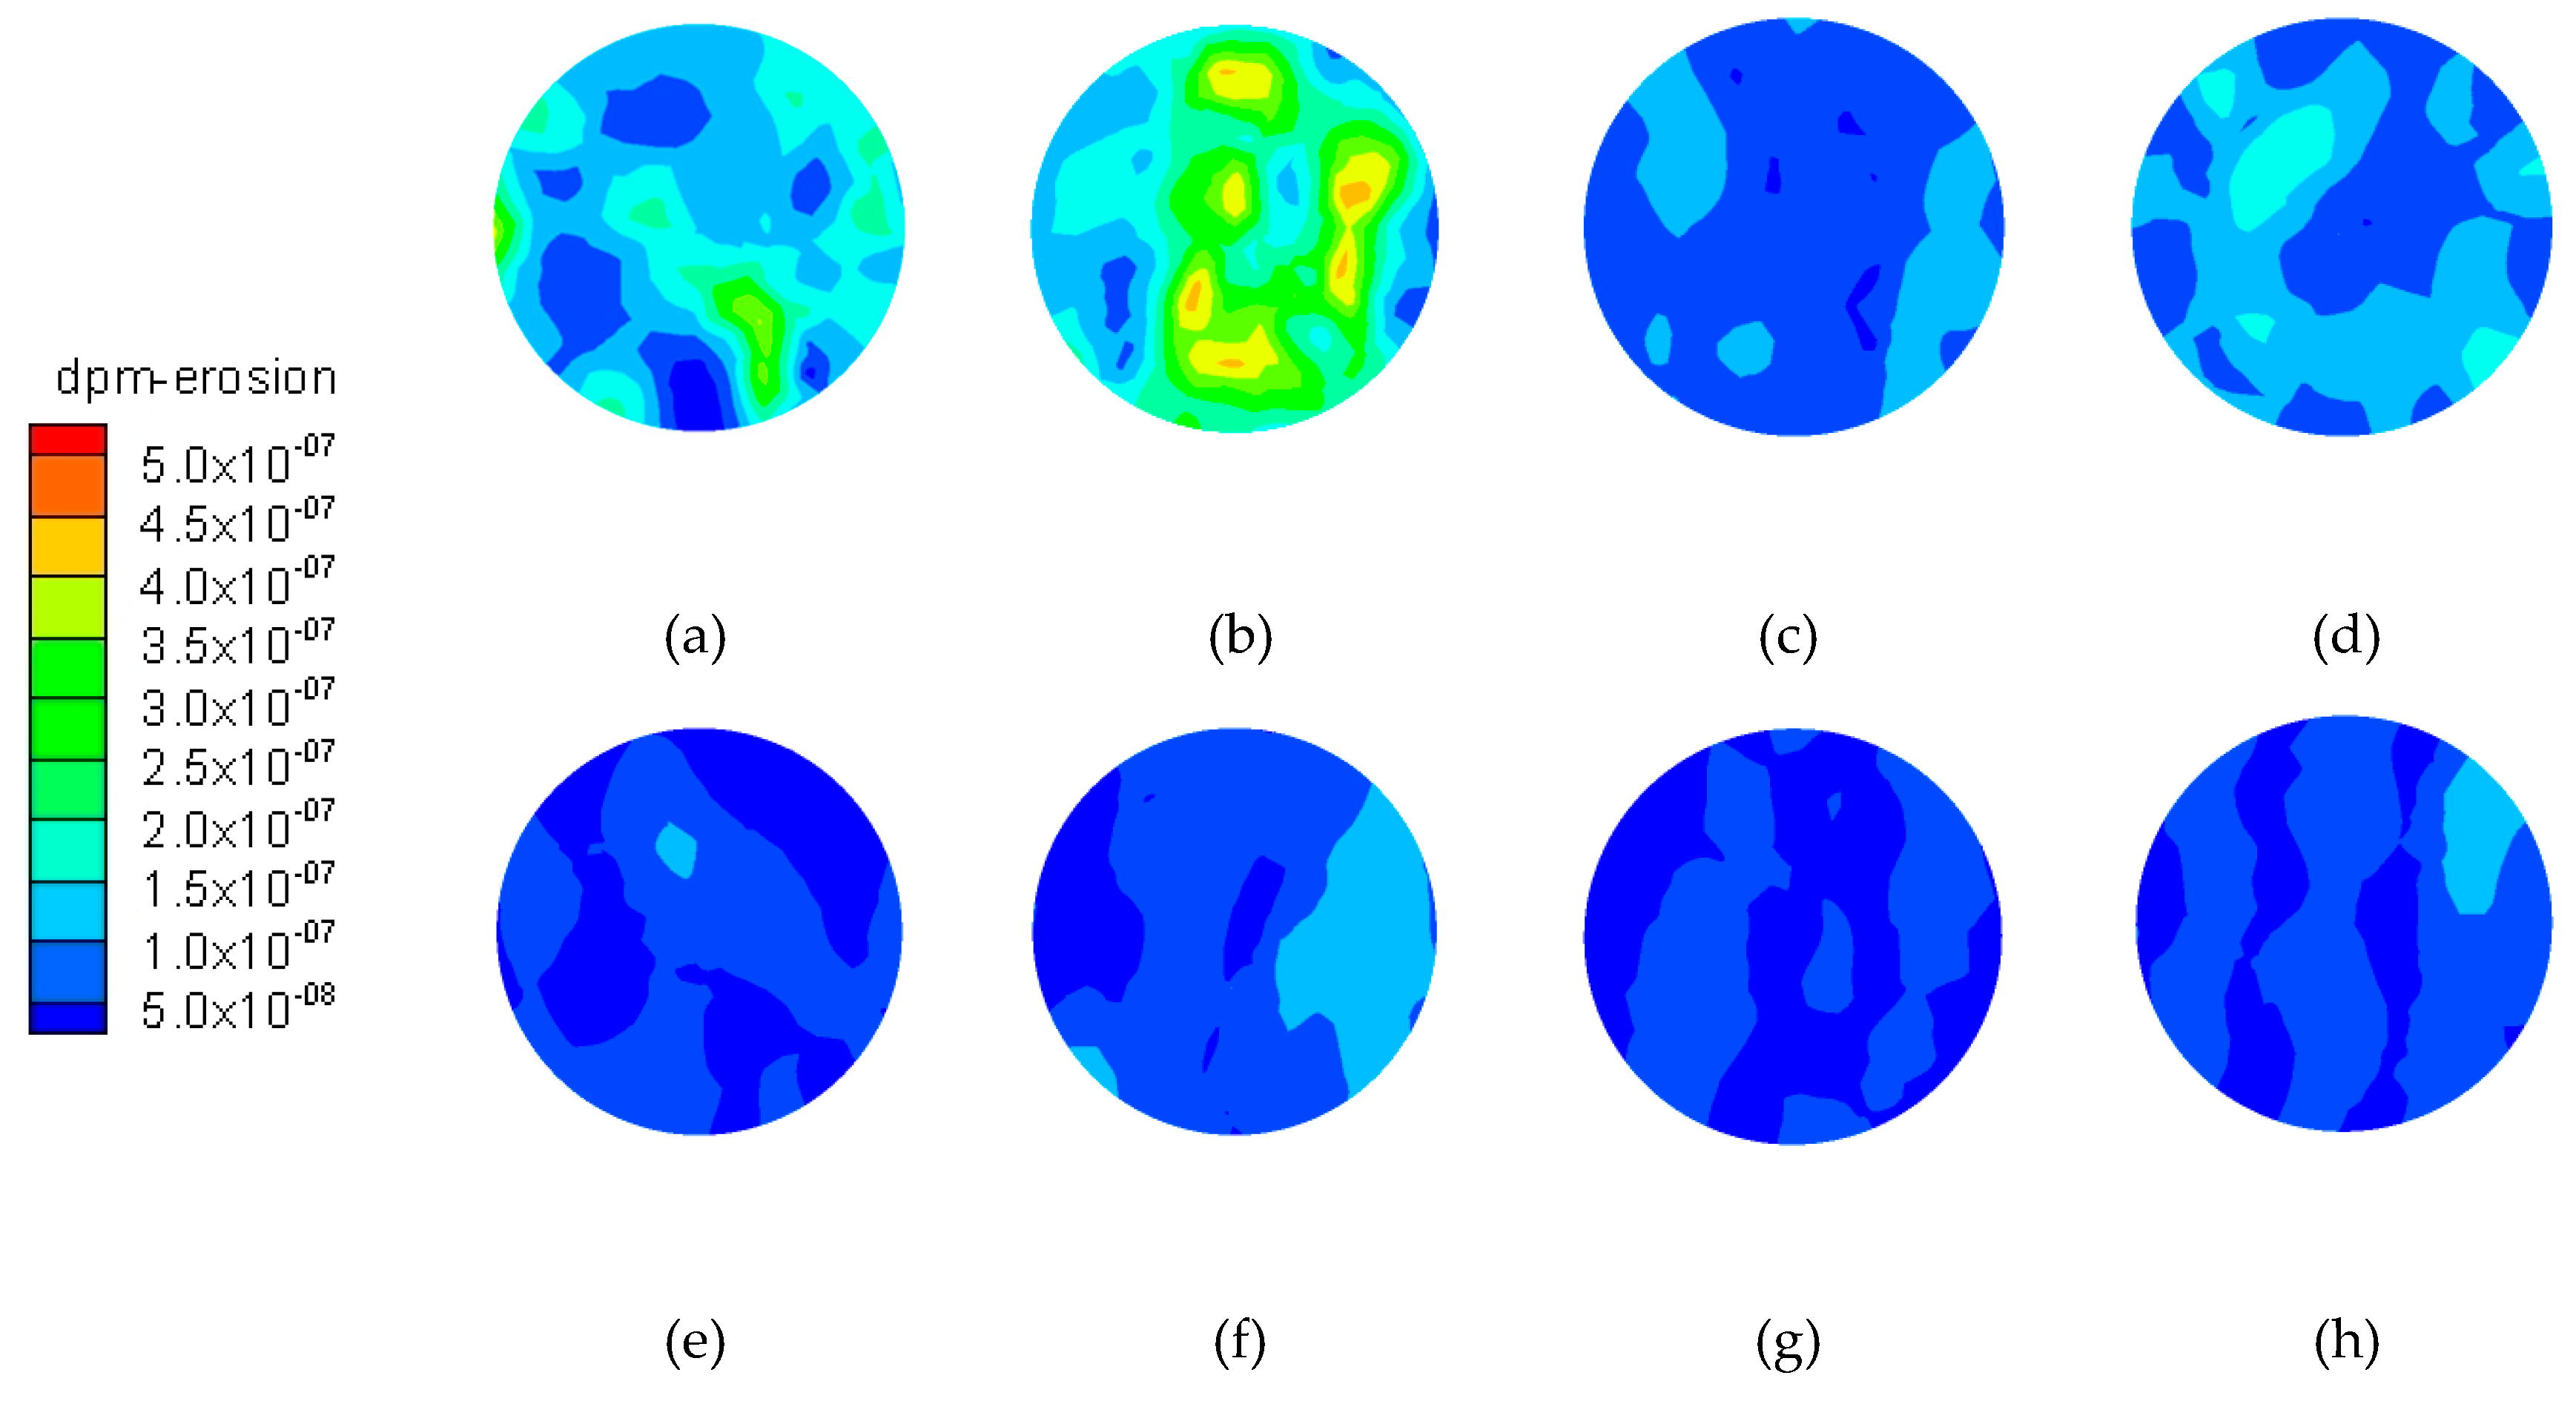
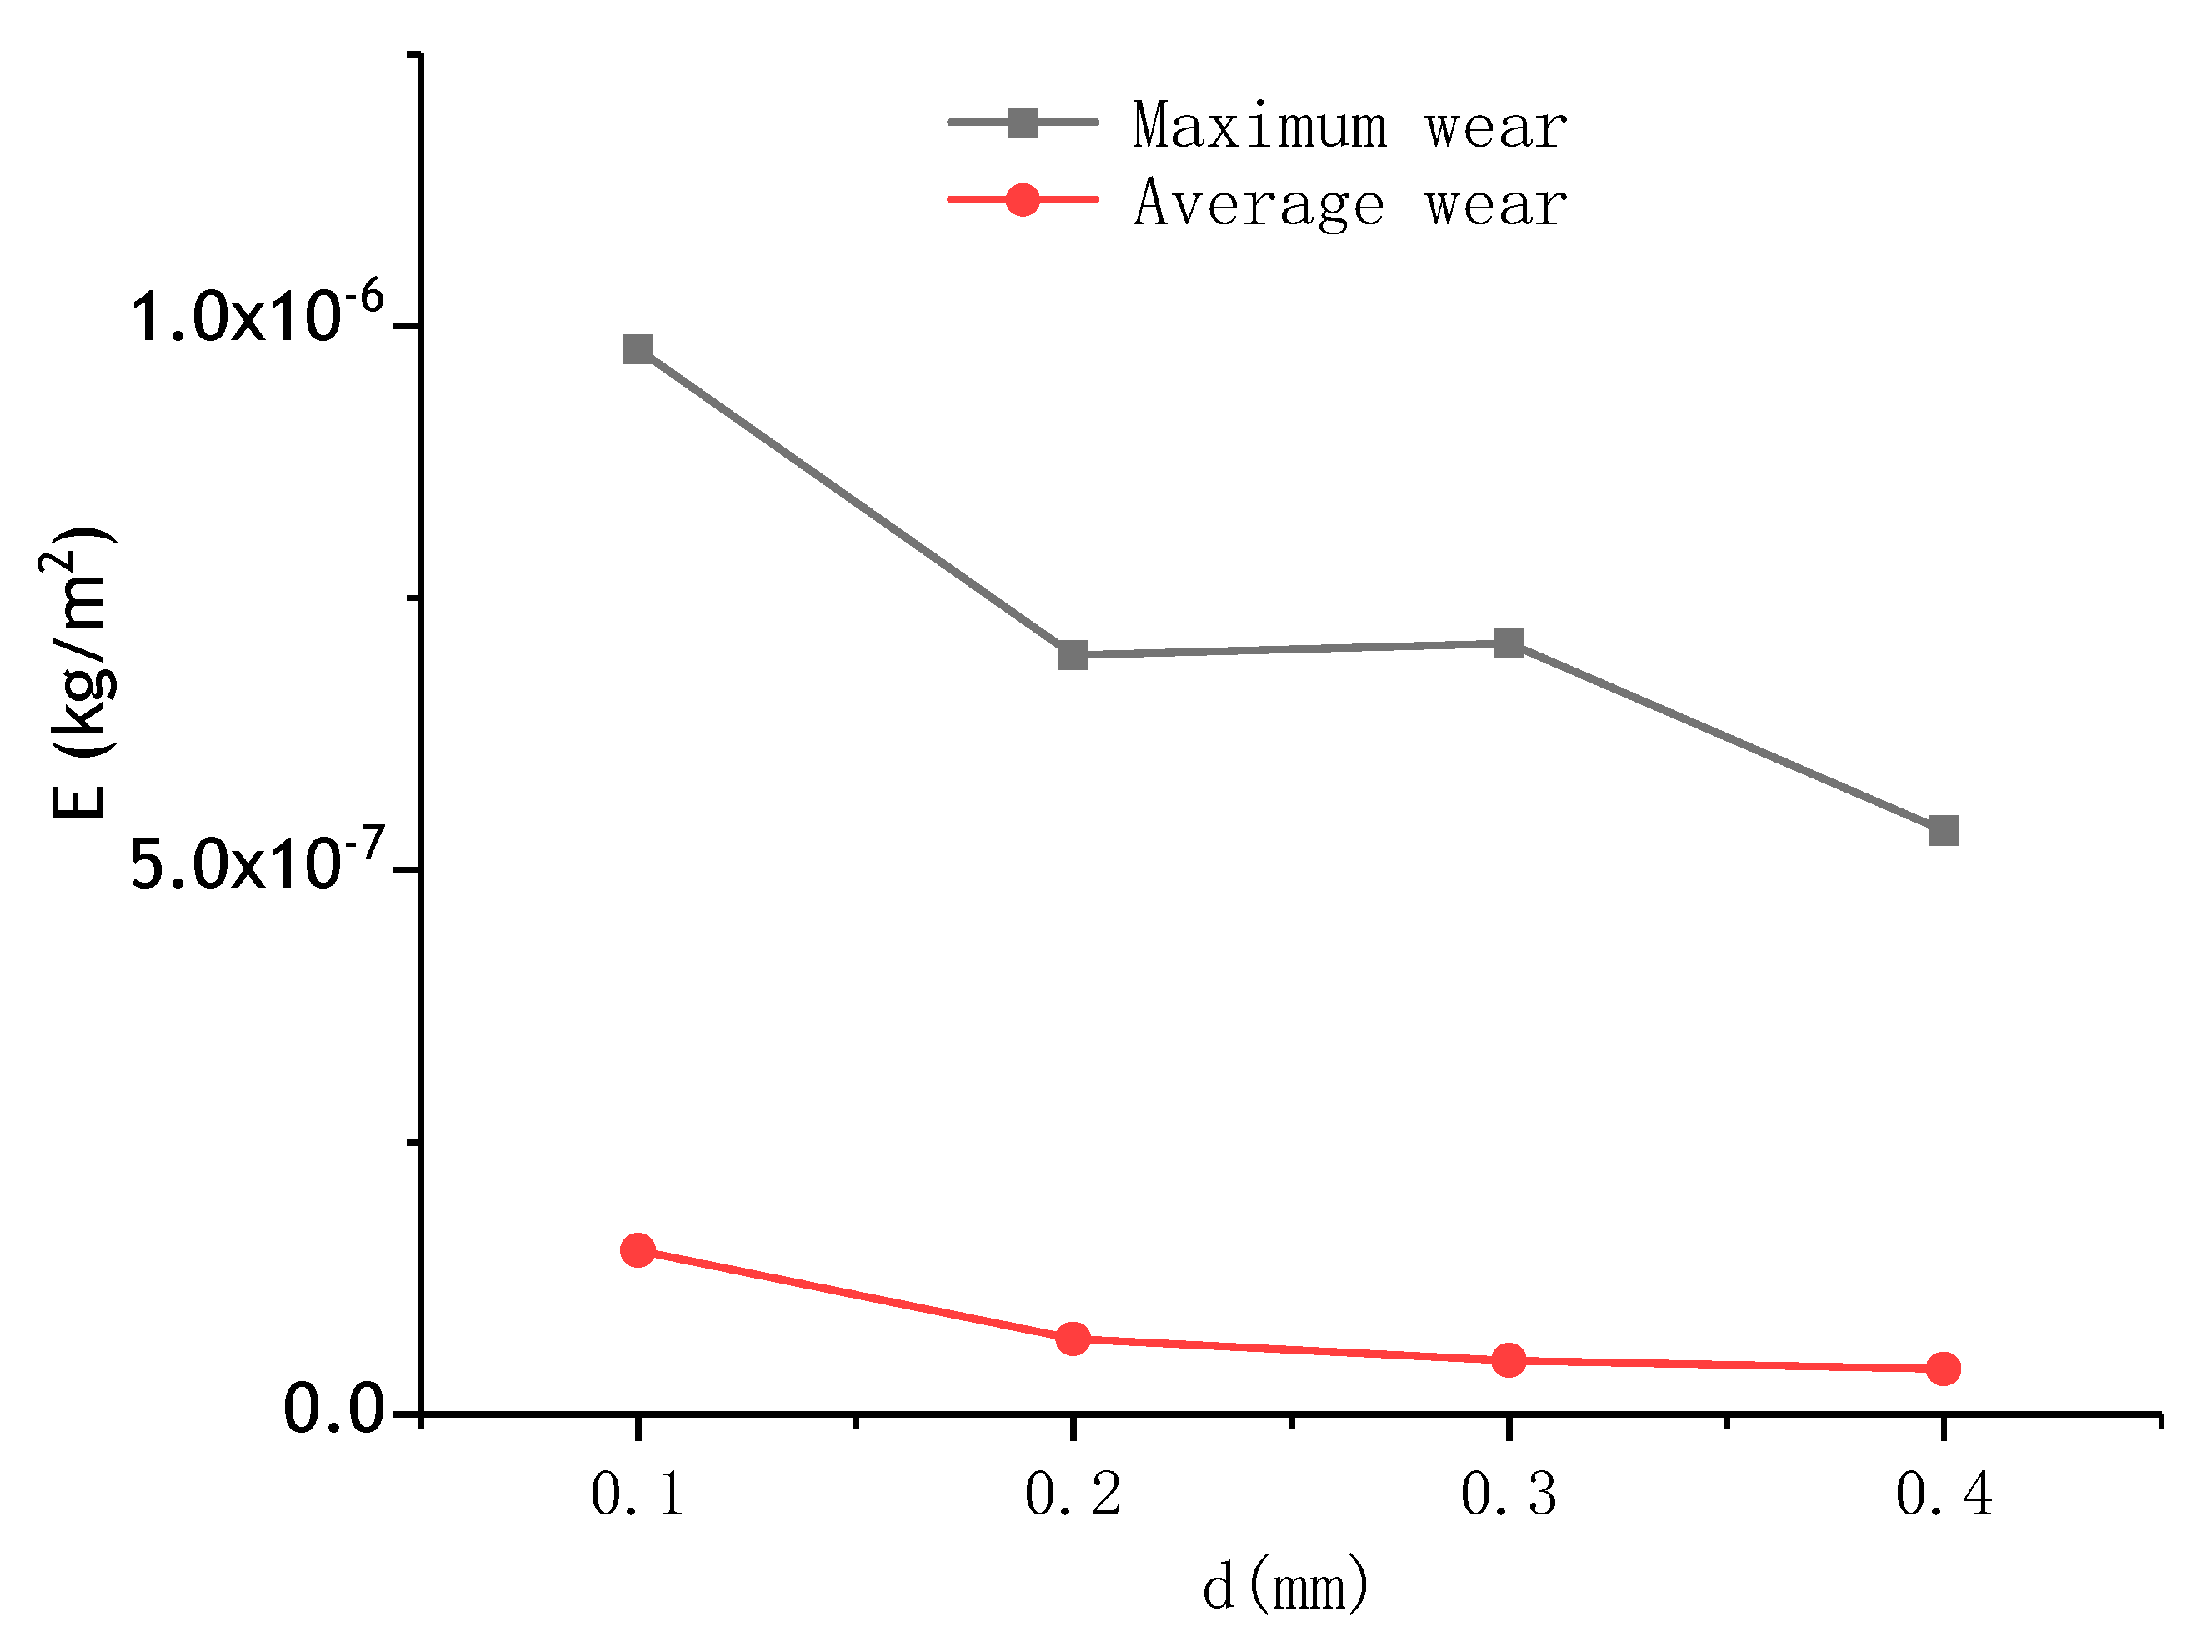
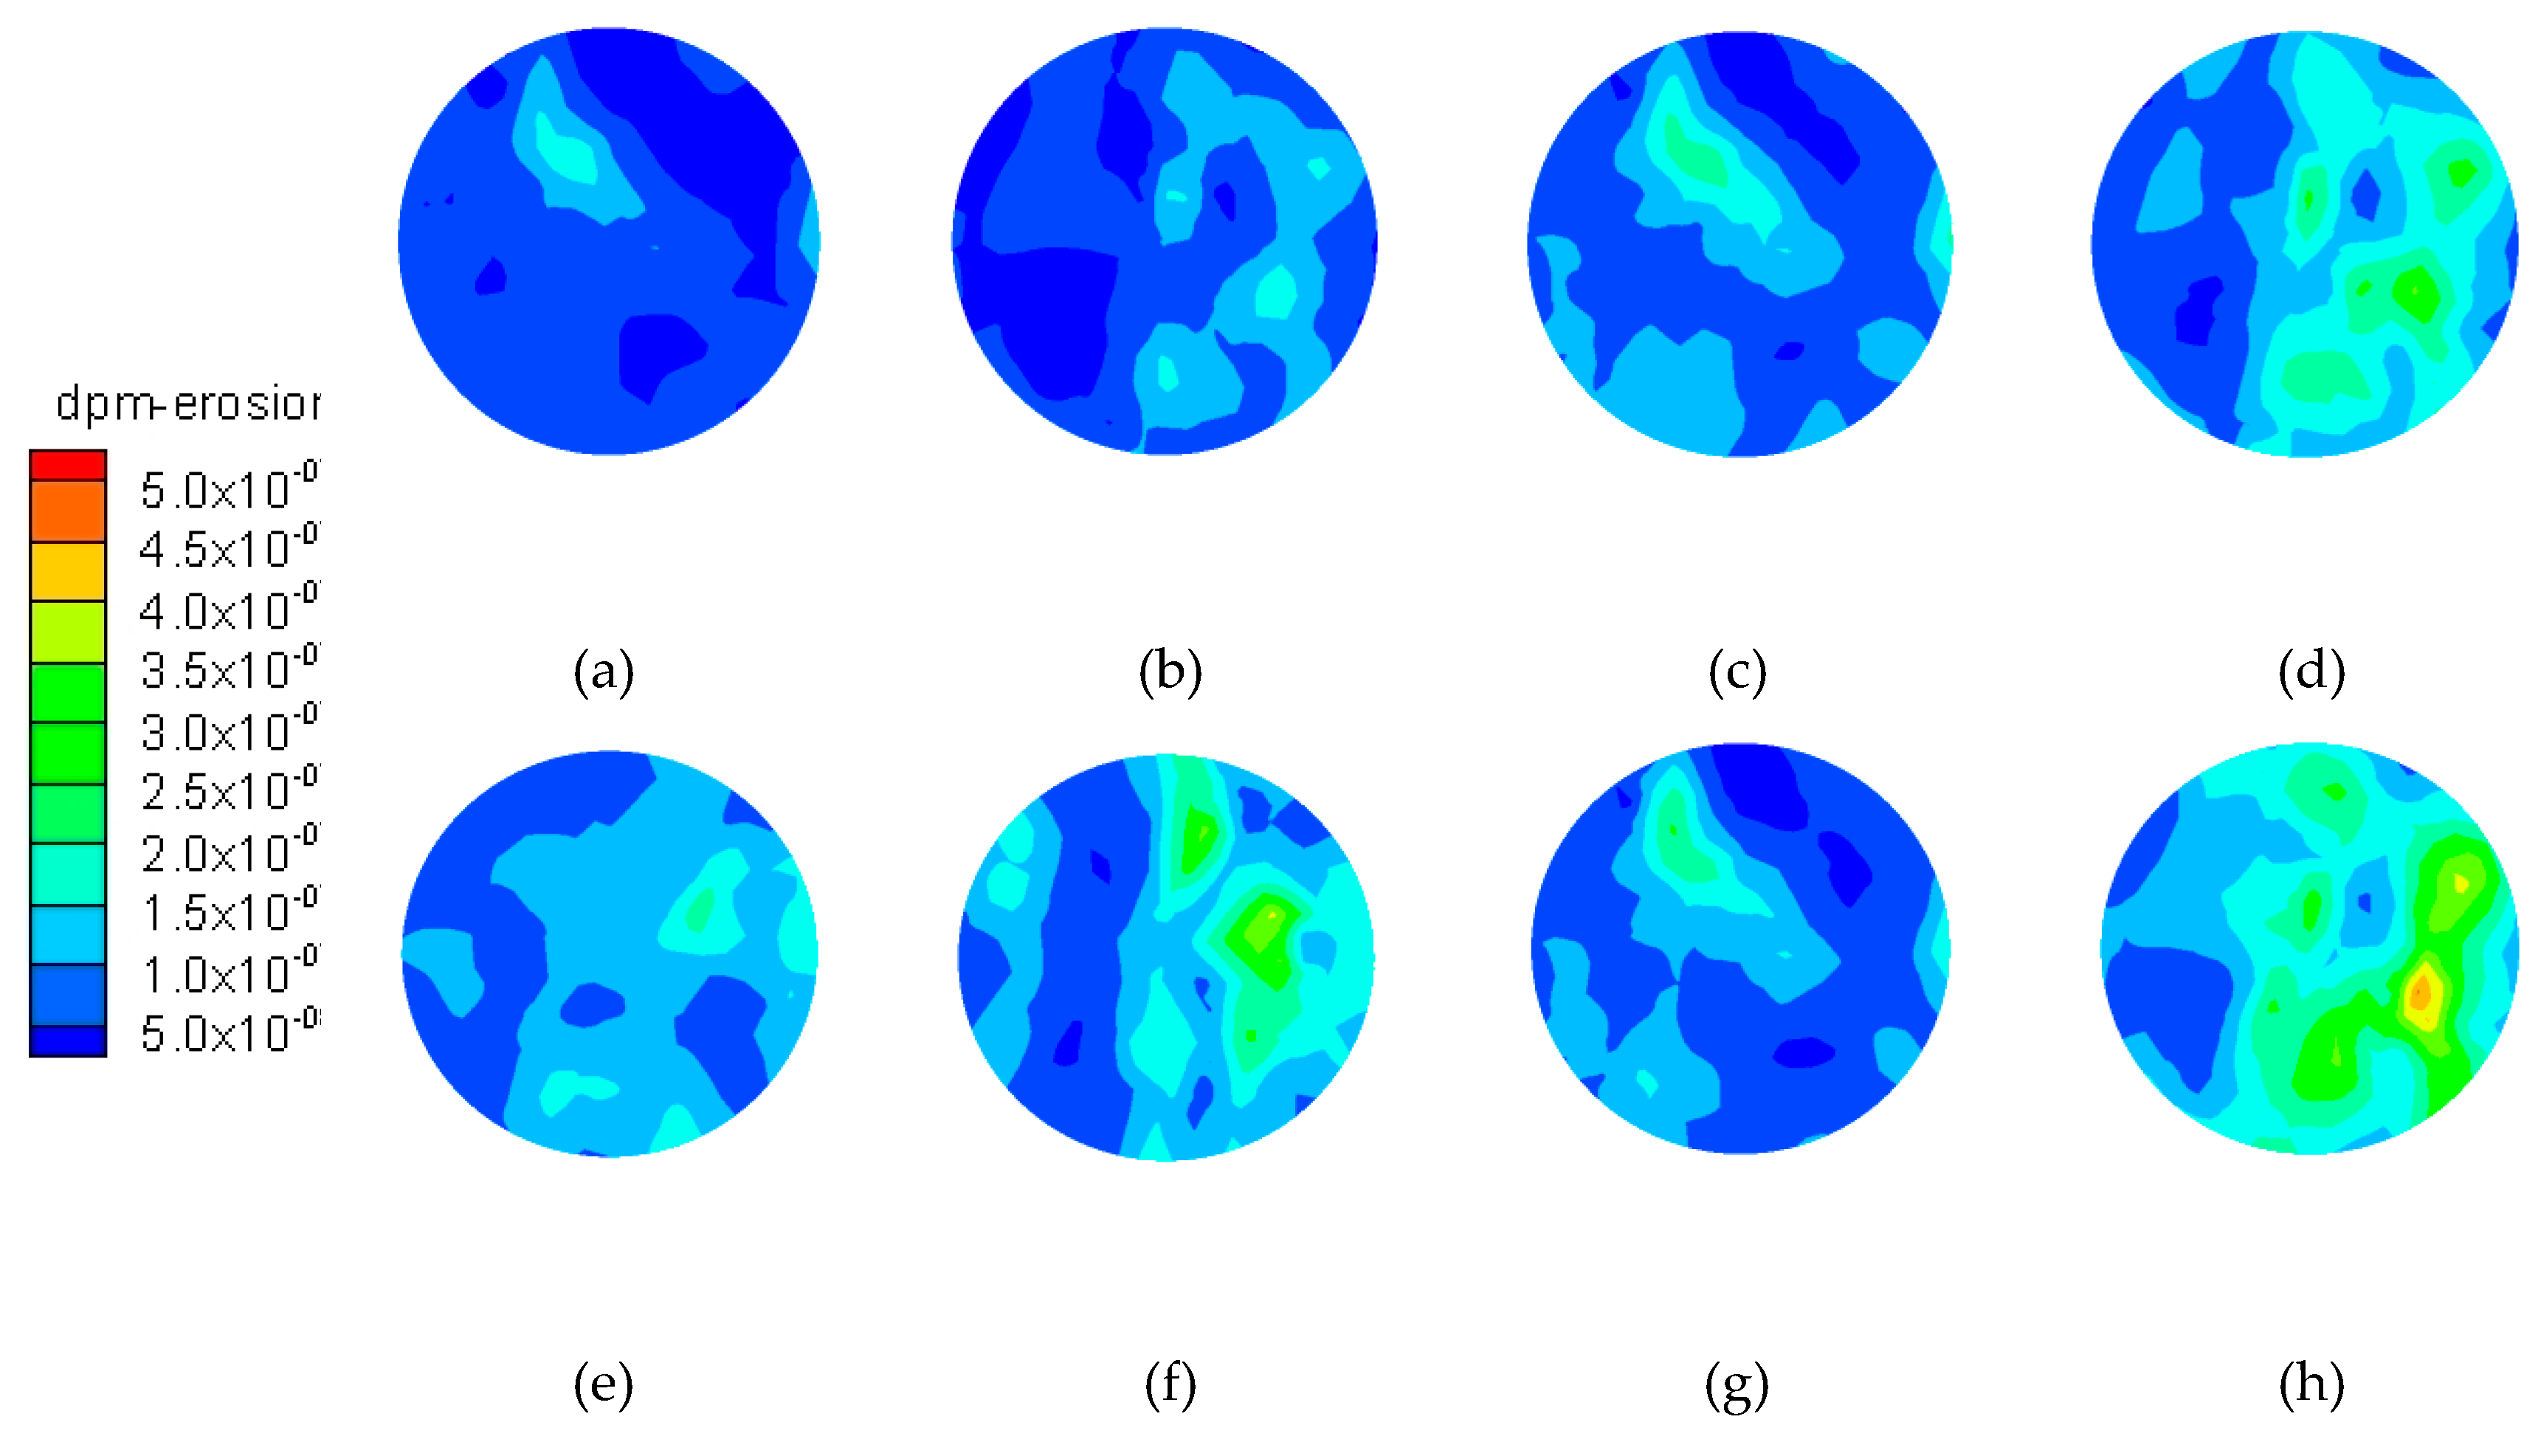
The contours of the test samples with increasing solid particle diameters (working conditions 1, 2, 3, 4) are illustrated in Figure 12. The surfaces of the sample exhibit deep randomly smeared wear regions for the lowest particle diameter but then tend to be wavy and superficial at the largest particle diameter. From the data in Figure 13, it is apparent that the maximum (Em) and average wear in both samples increases inversely with the particle diameter: wear loss reduction by 44.9% and average wear loss by 72.67%, from d = 0.1 to 0.4 mm. Wear for same particle diameter was always higher in sample with D = 316 mm than with D = 225 mm.
There are two explanations for this behavior. First, the smaller the particle diameter, the lighter and less energy consumed from the inlet to the surface of the test sample, resulting in a higher impact and wear. In other words, the performance of the particles following the water flow is better.
Second, with the volume fraction fixed, the smaller the particle diameter, the higher the number of incident particles, and thus of impact times and friction of particles on the surface of the sample. The product of this is the increase of the abrasion degree of the sample.
4.2. Effect of Solid Particle Volume Fraction on Wear
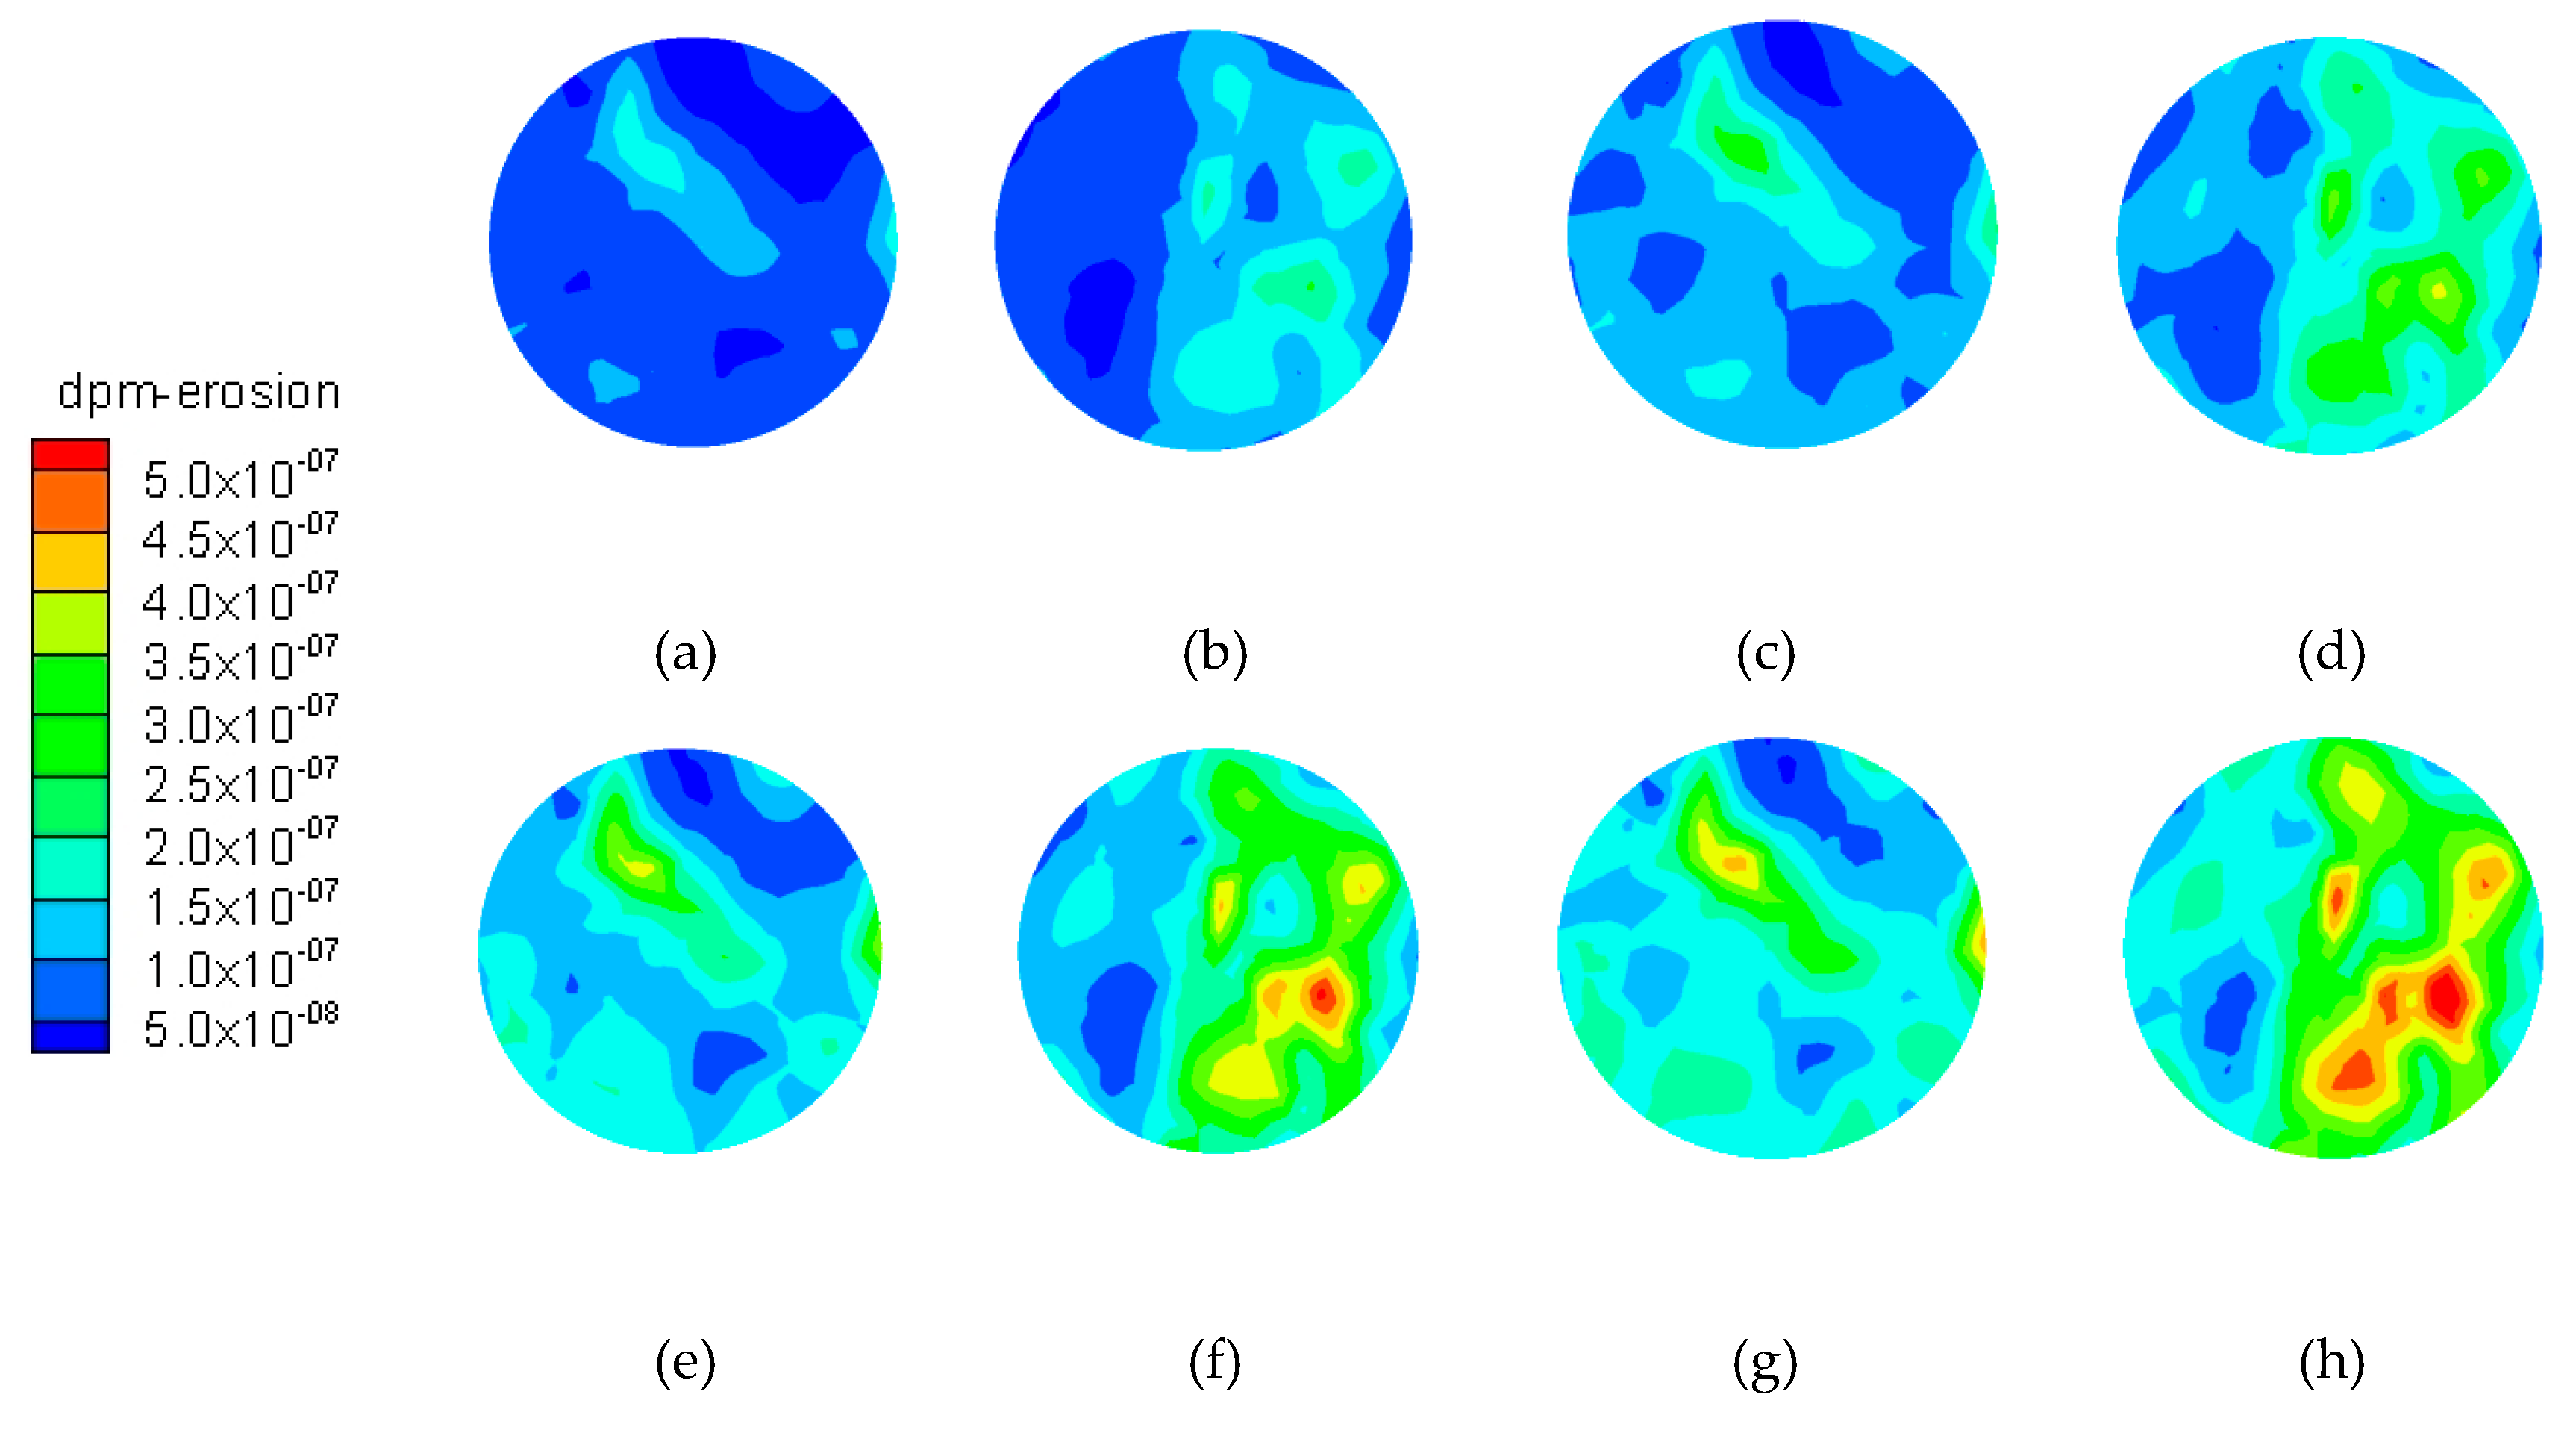
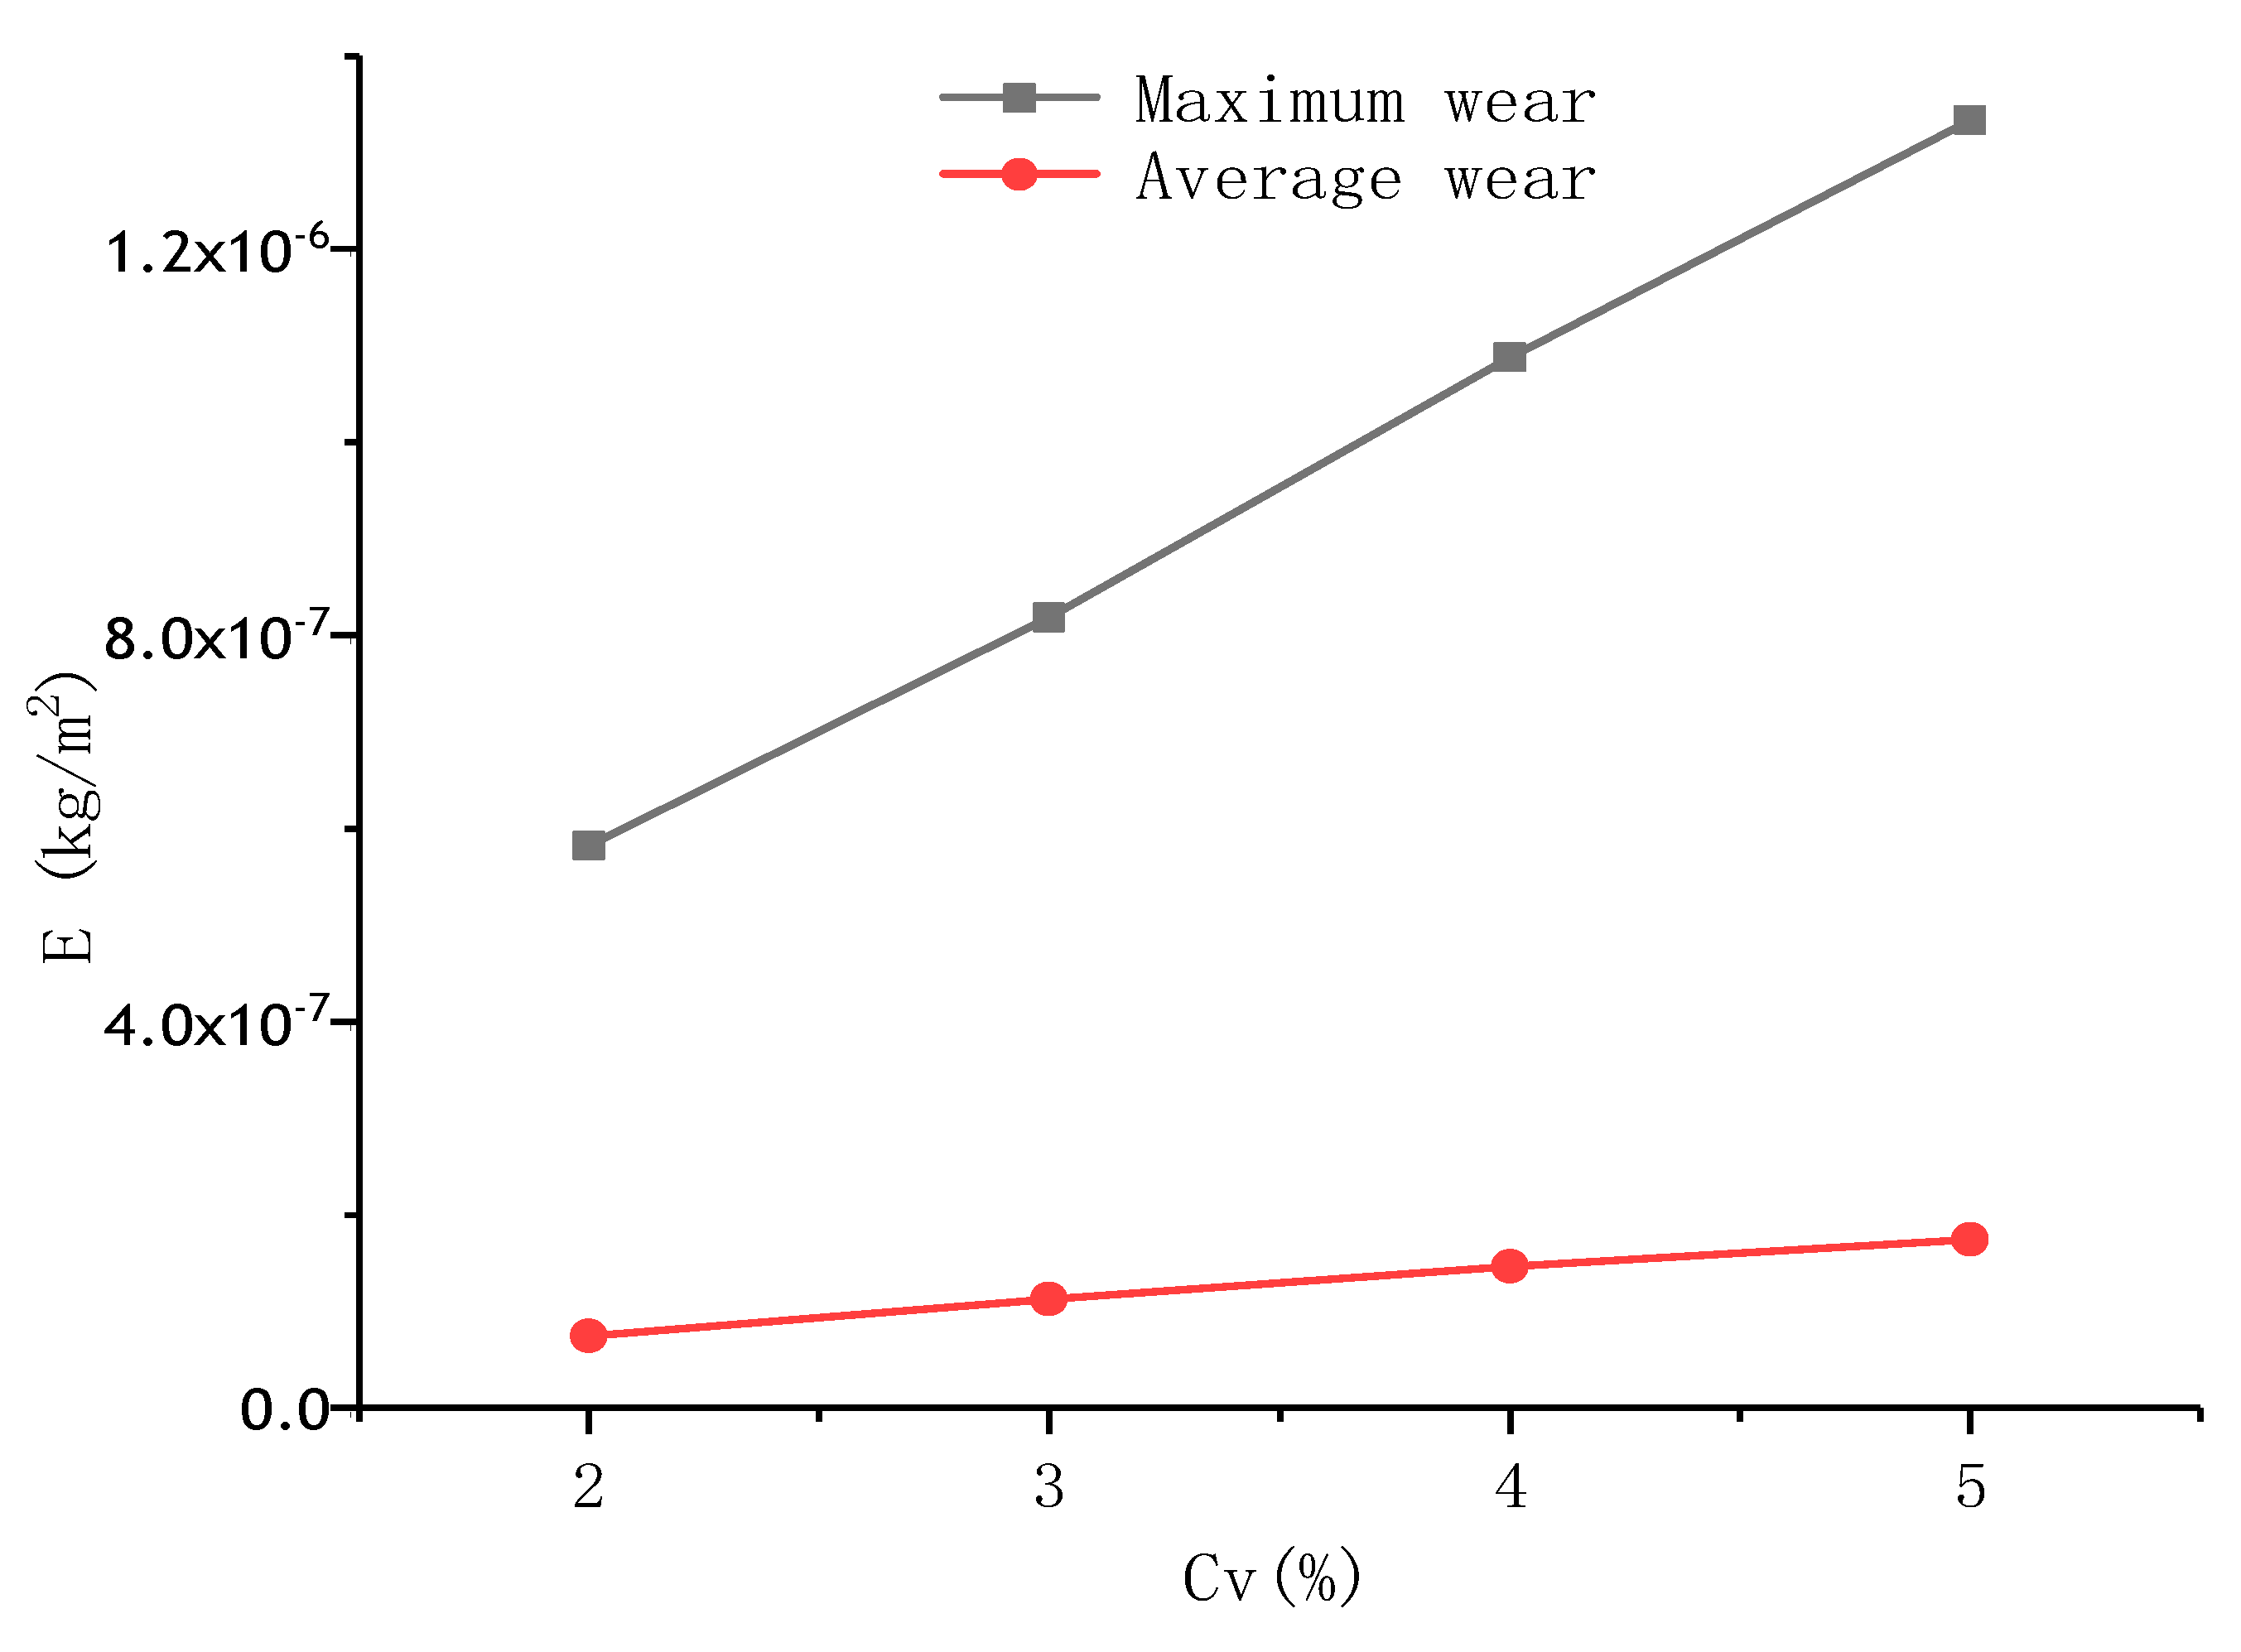
The simulations did detect evidence of a positive correlation between particle volume fraction (working conditions 5, 6, 7, 8) and area and degree of wear. Importantly, the wear of the surface tends to increase in the right portion of sample with D = 316, just as observed in Figure 14. Seen from Figure 15, the maximum and average wear increase linearly with the particle volume fraction, represented by Em = 2.4 × 10⁻⁷Cv + 10−7 and Ea = 3.17 × 10⁻⁸Cv + 1.16 × 10⁻⁸. This is because a larger volume fraction number results in a higher number of particles and collisions between particles and samples.
4.3. Effect of Solid Particle Inlet Velocity on Wear
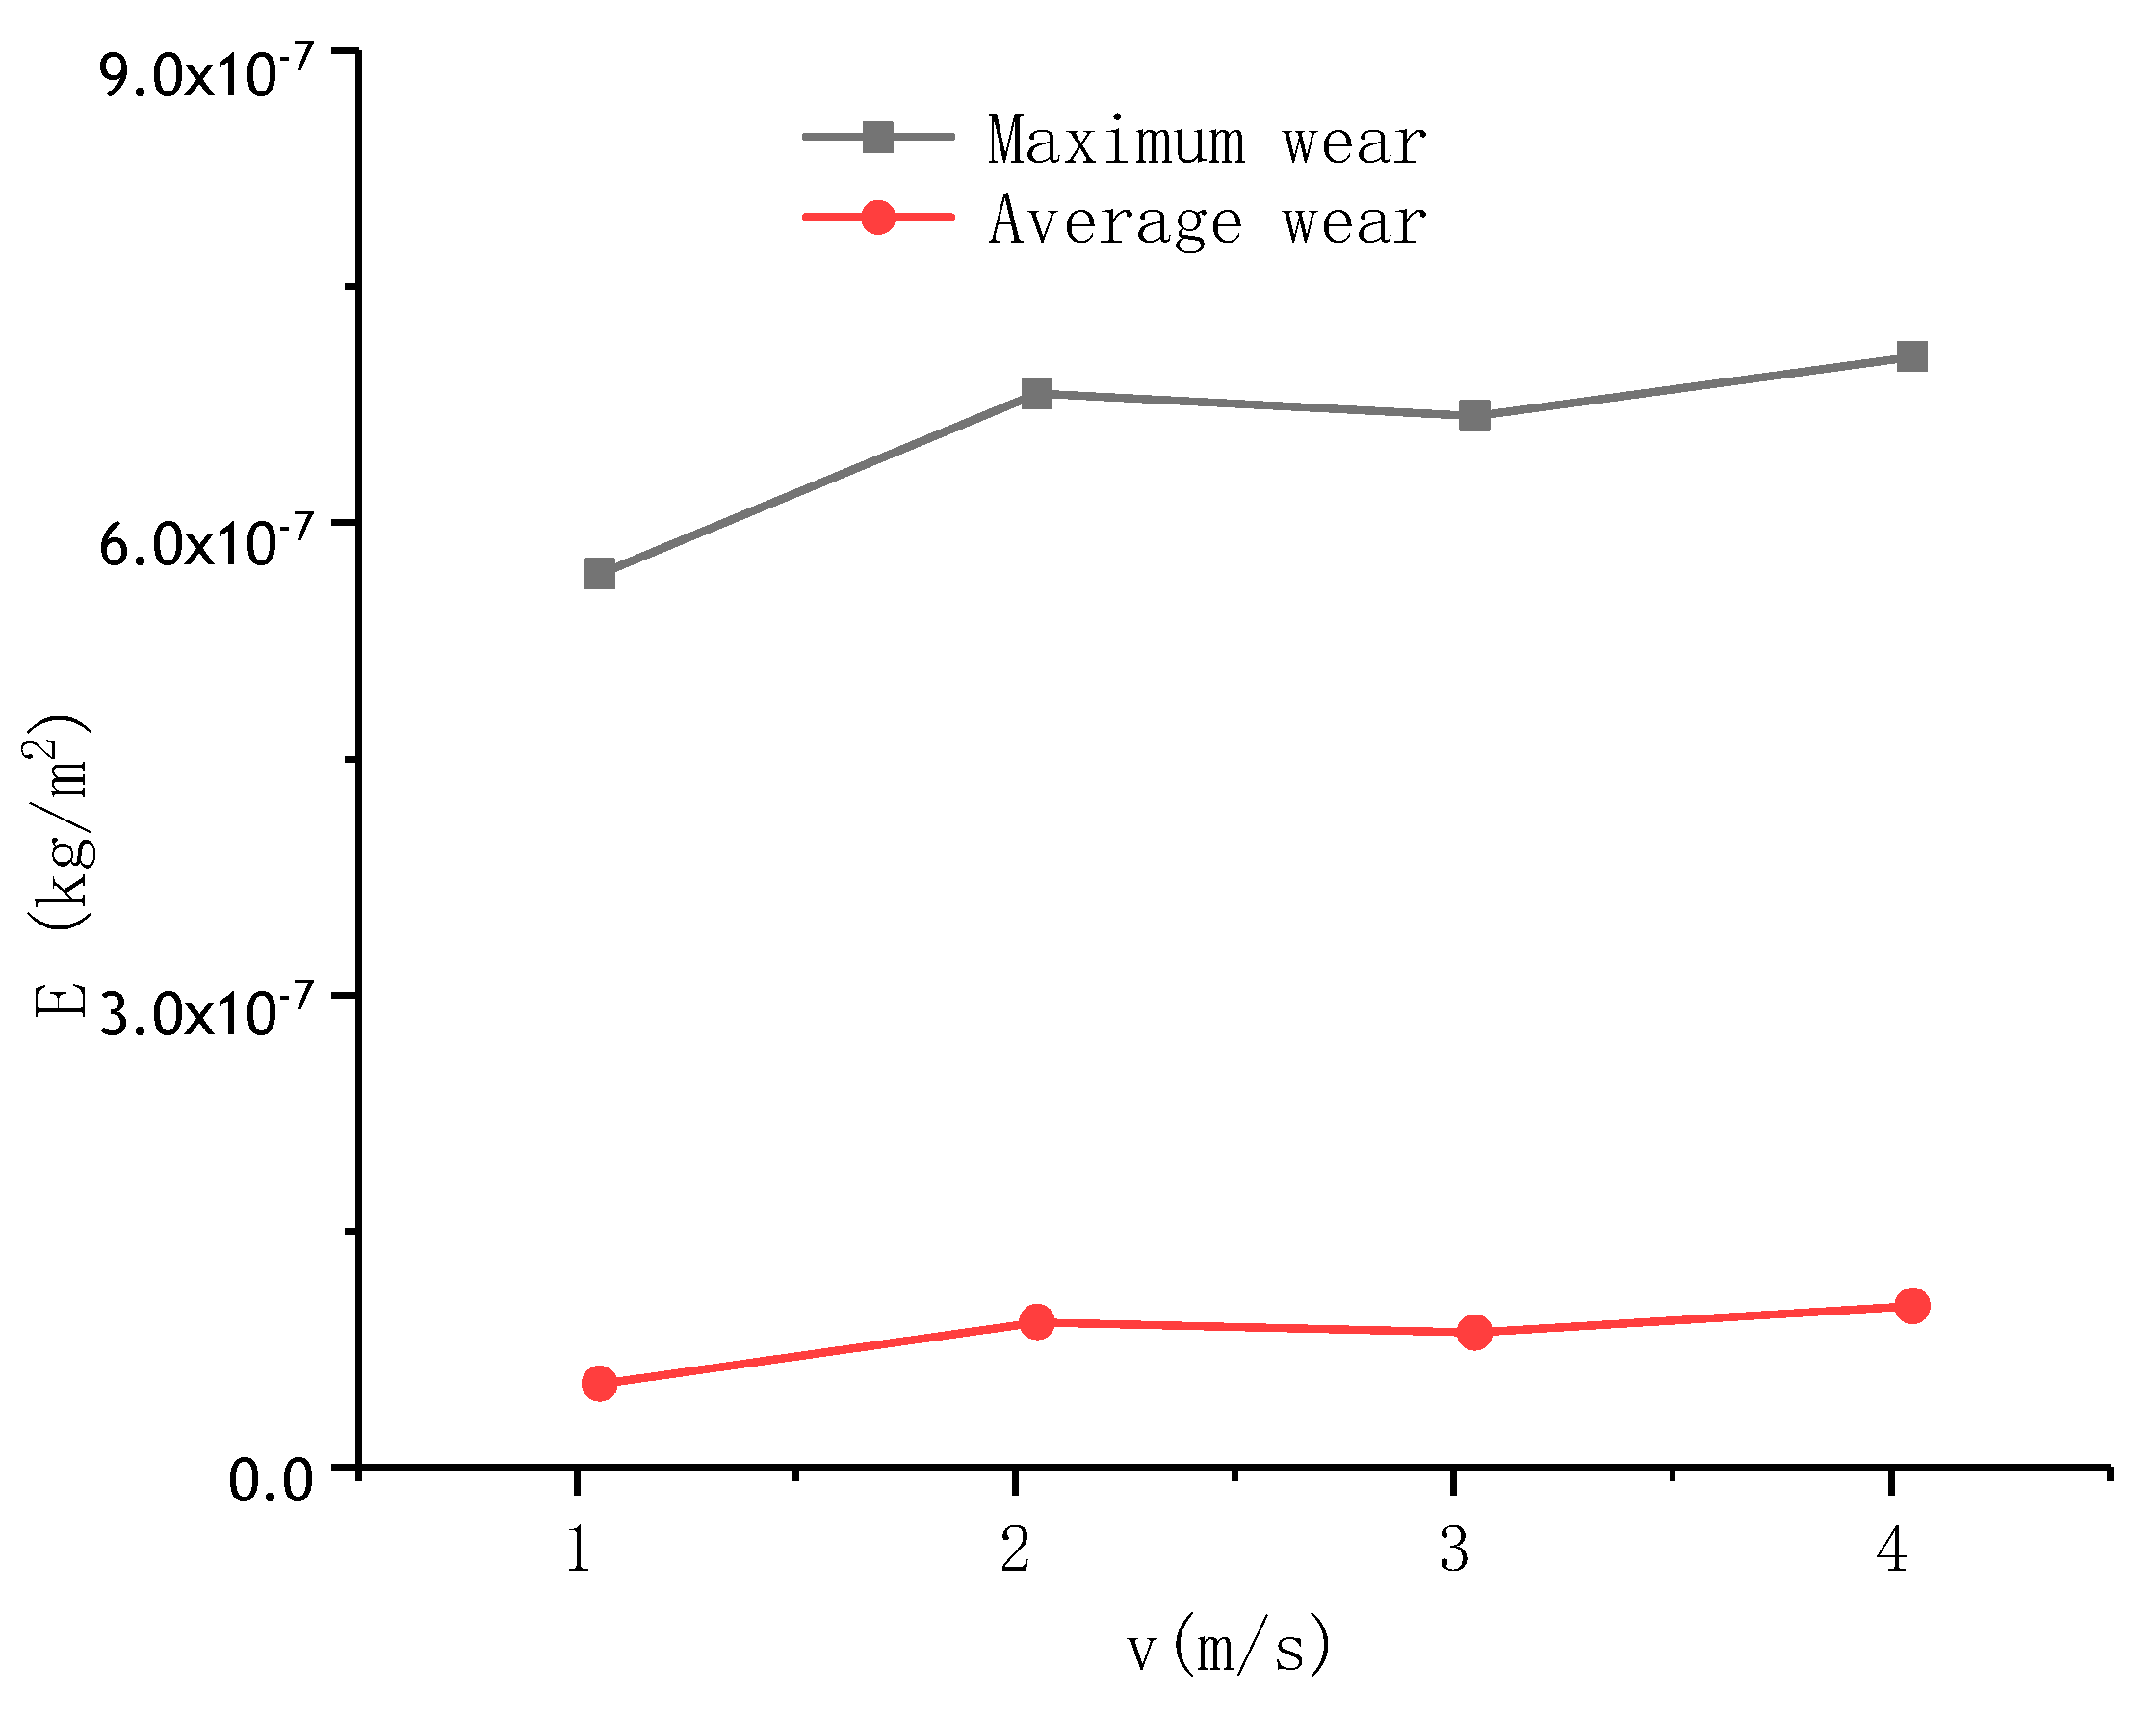
The results of wear with increasing inlet particle velocity (working conditions 9, 10, 11, 12) indicate the wear area and degree of the sample surface slightly increase, however, the wear aggravation remains similar. Figure 16 shows the small increase of maximum and average wear obtained with particle inlet speeds between 1 and 4 m/s: increase of maximum wear is 24.56%, and of average wear, 88.68%. The wear in both samples appears to be more marked in the right region, and this increases with sample diameter in Figure 17. However, compared to the particle volume fraction and particle diameter, the particle inlet speed is not an important determinant of the material wear degree.
This result may be explained by the complexity of the channel, thus having a large interference on the flow and particle movement speed, resulting in differences of inlet speeds.
Furthermore, for the slow inlet particle case, the distance between the inlet and the disc surface is relatively long, and thus the velocity of the particles reaching the surface are similar. Even and dense baffles can be observed in Figure 4. On the other hand, when the particle inlet velocity is large, the following increases slightly: impact, kinetic energy, and the wear degree of the sample.
4.4. Results and Analysis of Experiment
Table 2 shows the wear loss of stainless steel samples at the two diameter positions. It can be seen that the larger the linear speed, the higher the sediment impact and, thus, wear degree of the material.
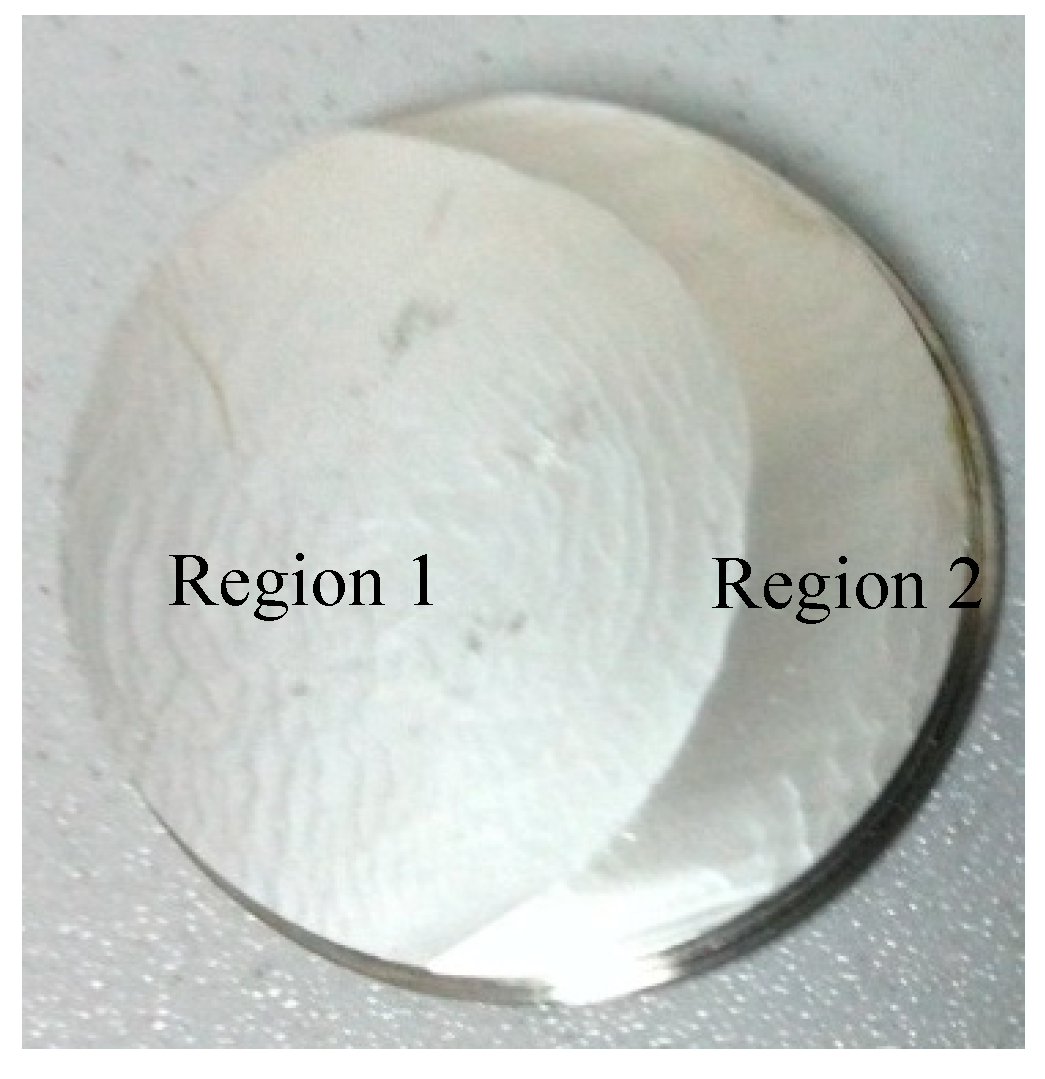
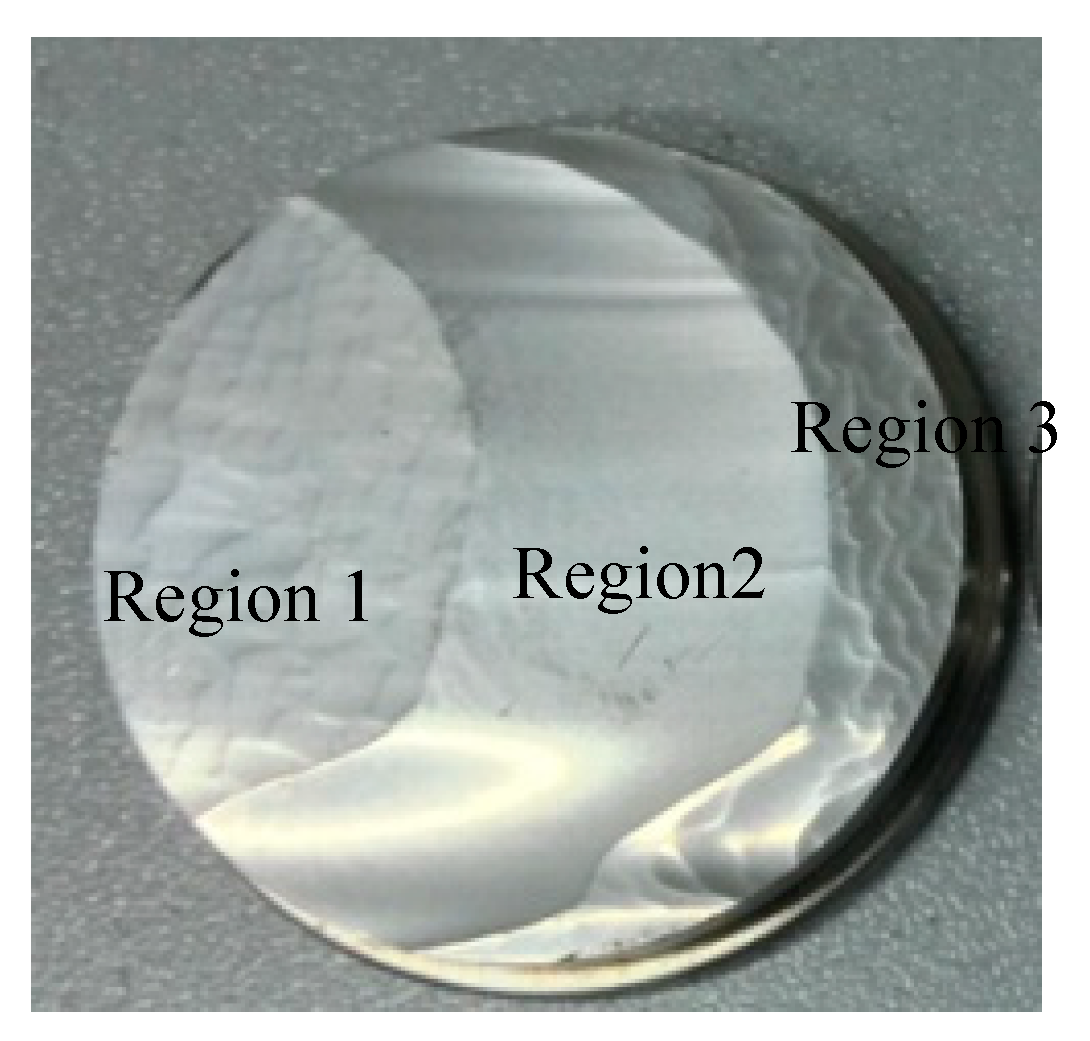
Figure 18 and Figure 19 show the surface wear of stainless steel samples at the two diameter positions. As observed, two erosion regions at developed for D = 225 mm, compared with three for D = 316 mm. The highest worn area is a crescent shaped region (Region 2), developed at the right side with D = 225 mm and at the middle part with D = 316 mm. To the left of the crescent shape is a minor worn wavy region (Region 1), whilst to the right, an intermediate worn wavy region (Region 3). The horns of the crescent are symmetrical for the lower diameter sample; however, this is slightly asymmetric at the lower horn of the higher diameter sample due to possible interference of Region 2 with Region 3. The shape of the intersection thread in the two samples is parabolic.
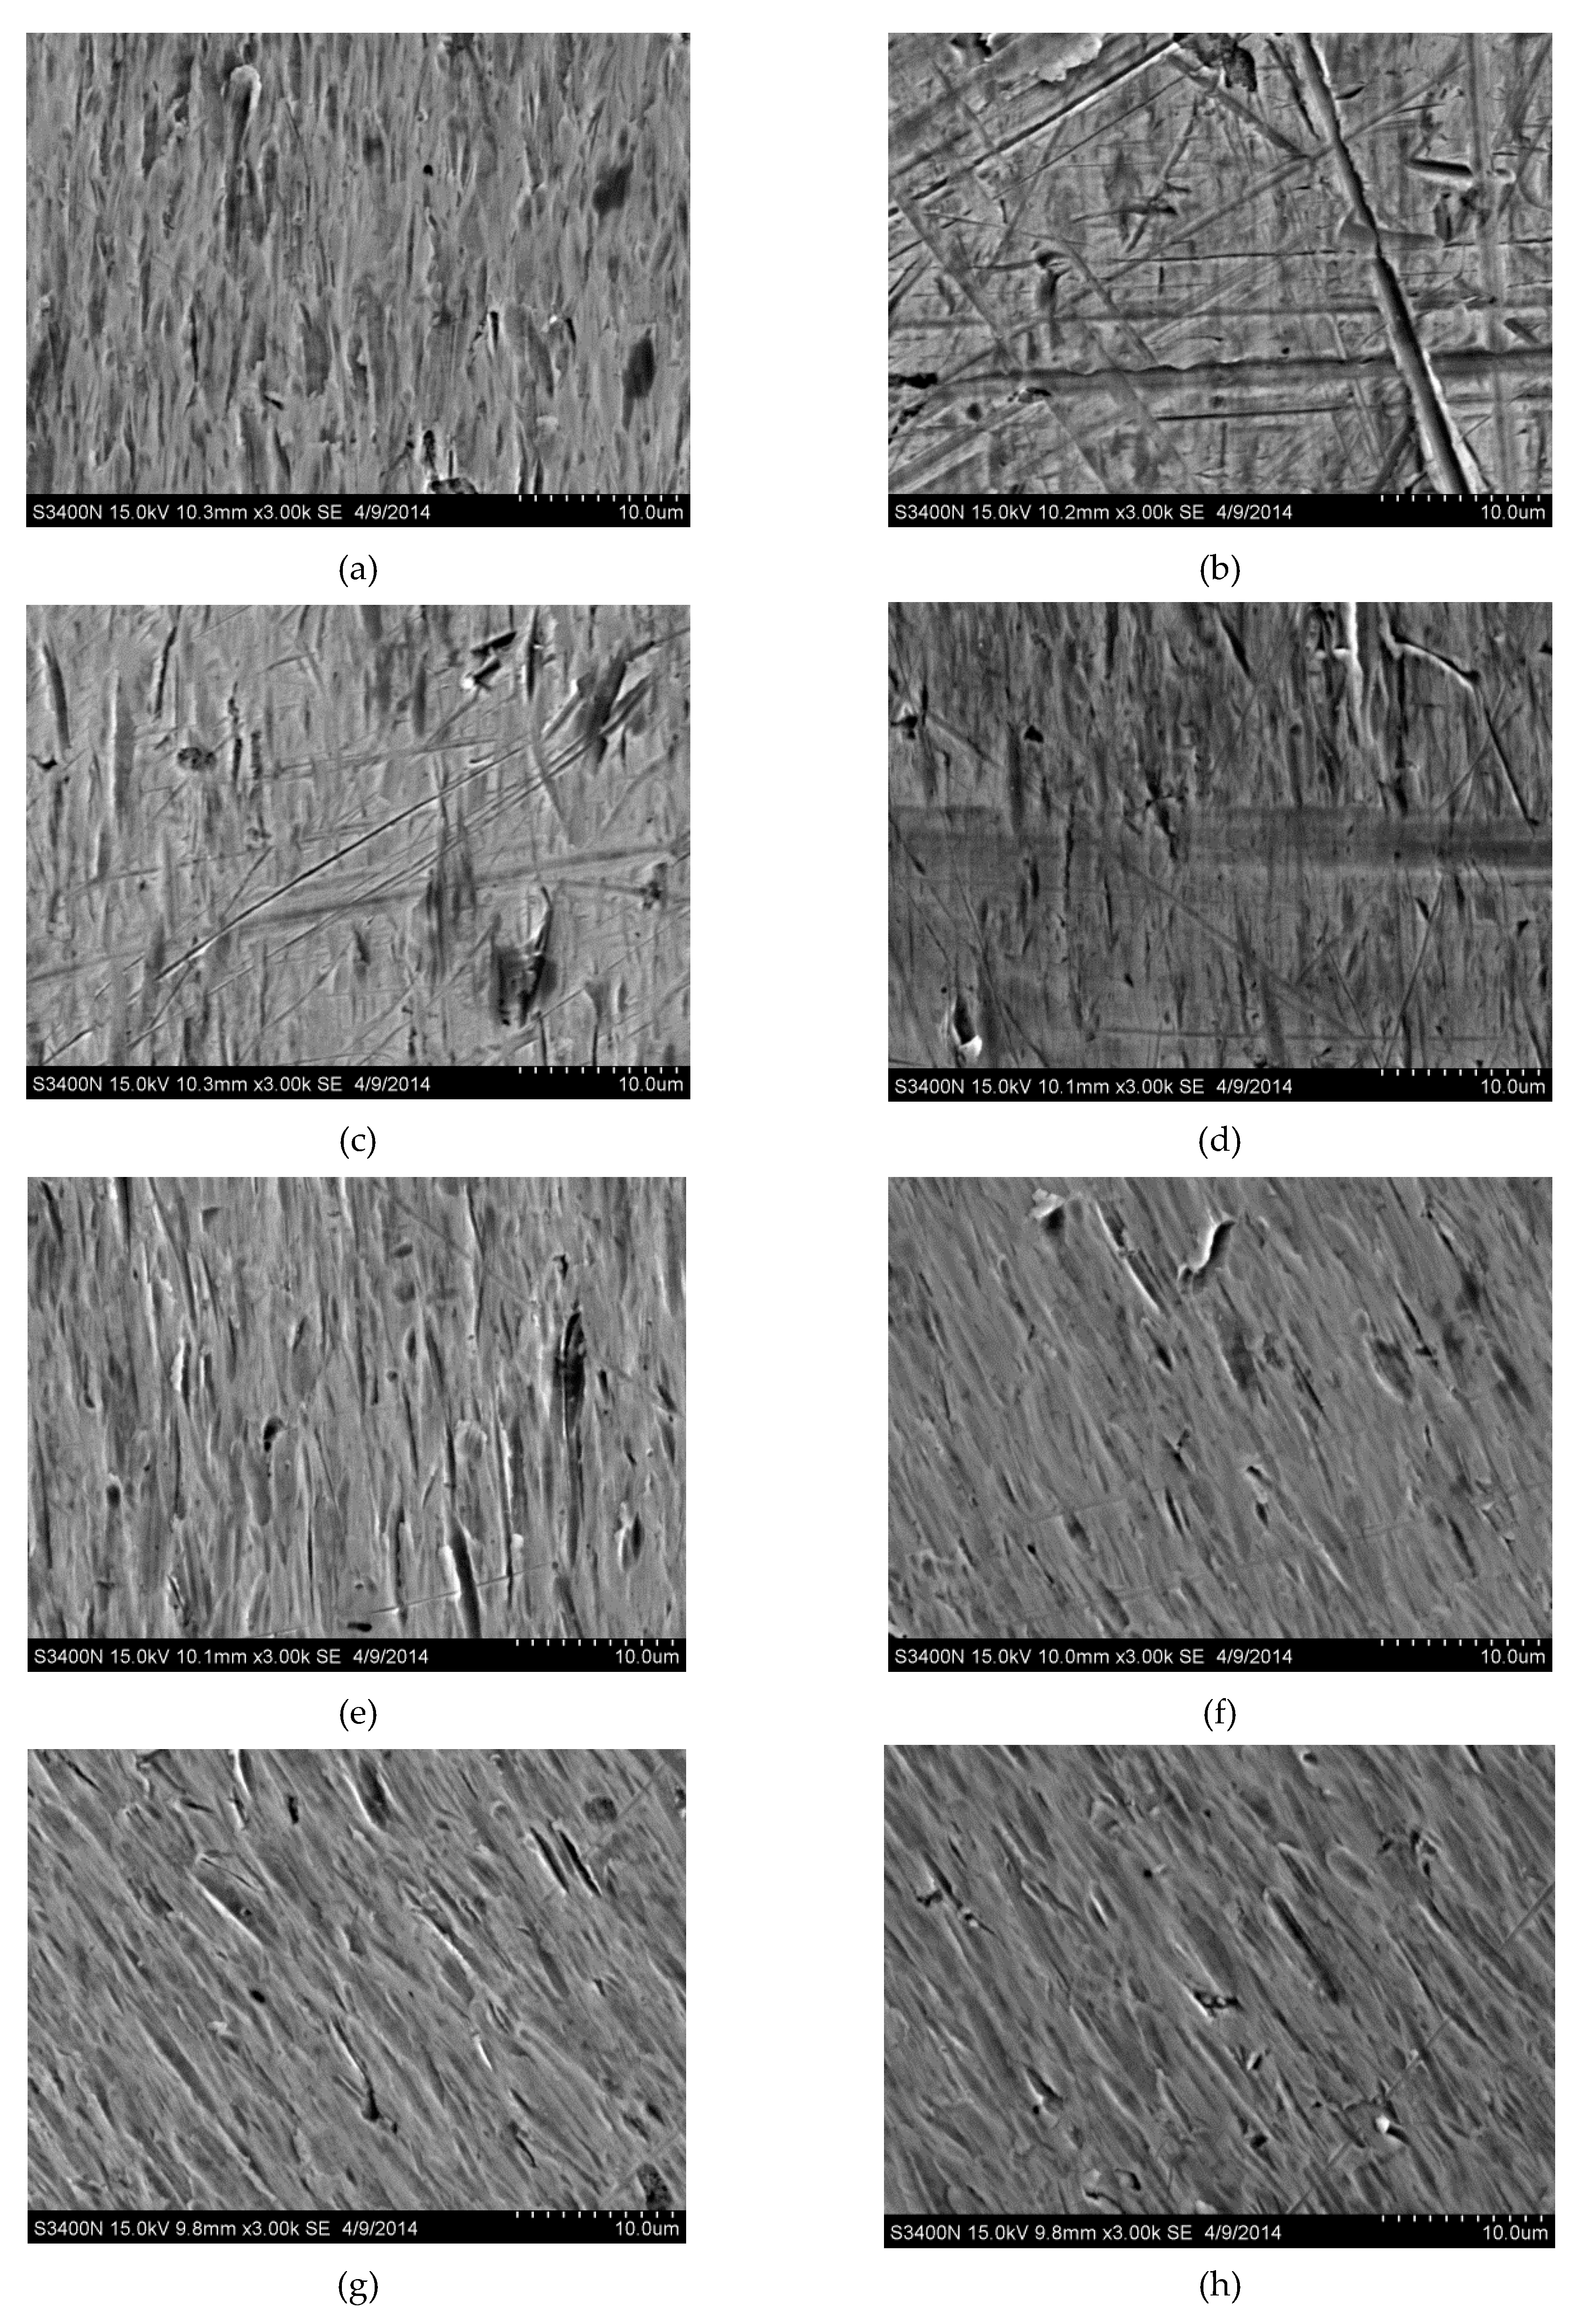
To gain a better understanding of the wear action, a morphological analysis was performed on the two wear regions of sample with D = 225 mm (Figure 20f–h), and on the three and intermediate regions of the sample with D = 316 mm (Figure 20a–e). The descriptive data was generated at 3000 magnification, by using a scanning electron microscope (SEM).
In general, both samples exhibit pits and scratches of various sizes, mainly as a result of the cutting behavior. For the sample with larger diameter, Region 1 is filled with small to large vertically oriented pits; although a few fine scratches appear, as shown in Figure 20a.
At the junction (Regions 1 and 2) the pits are mostly large and cross scratches and scratches of various sizes (fine and coarse) become more apparent. A similar texture and frequency is observed in Region 2, except the scratches are less noticeable (size = fine). As for the junction of Regions 2 and 3, the frequency and overall size of the scratches decreases but the large pit structure remains similar. With increasing radius, the small to large pit structure dominates over the scratch structure, and thus Regions 1 and 3 become similar.
In the case of the sample with a smaller diameter, the wear morphology in the two erosion areas is similar (no intermediate region), and it is filled with small to large pits and few fine scratches. This texture is similar to Regions 1 and 3 of the other sample.
A comparison of the wear contours of both samples (Figure 12a,b) reveals the erosion level is irregular and more concentrated in the right-hand side of the disc, and this becomes more apparent with the increase of diameter. These results are in line with the experiments (Figure 18 and Figure 19). The Region 1 (least worn) of both samples may be compared with the blue area of Figure 12a, whilst Region 2 with the yellow section of Figure 12b. Both numerical simulation and experiments show that the wear was positively correlated with the linear velocity of the sample. Therefore, the worn surface was more apparent in the larger than smaller diameter test sample.
However, there is one major dissimilarity between them: the worn surface of the test sample is in the form of a spot or ripple, instead of a more even distribution in the simulation.
The disordered movement of particles in the rotating disc, the different times, probability, and degree of impact with the surface of the sample account for this difference.
4.5. Discussion
The findings of this study support the previous research of the influence of particle diameter and concentration on the wear degree [2,9,27]. The study was able to demonstrate the reduction of wear degree with particle diameter, in line with studies of [2,27]. In [2] the authors performed both experiments and numerical simulations to study the effects of particle size on erosion characteristics. The results show that the erosion rate increases as particle size increases, however, it reaches a maximum value at particle size of 150 μm, and then gradually decreases as particle size becomes bigger. The particle diameters in this paper were relatively large (0.1, 0.2, 0.3, and 0.4 mm) compared with other work (0–0.18 mm) [2]. The motion of particles with water flow was analyzed, revealing new insights into the wear mechanisms. In our study, it was found that the surfaces of the sample exhibit deep randomly smeared wear regions for the lowest particle diameter but then tend to be wavy and superficial at the largest particle diameter. At the same time, the simulations did detect evidence of a positive correlation between particle volume fraction and area and degree of wear, which supports the fact that the measured average erosion rate is increased linearly as the particle concentration is increased [27]. This is because a larger volume fraction number results in a higher number of particles and collisions between particles and samples. Importantly, the wear of the surface tends to increase in the right portion of sample. In [2], the erosion rate increases with impact velocity (for the same flow rate of sand particle), however, in the study this appears not to be the case. Thus, when the specimen rotates at a high speed, the wear caused by the impact of particles on the specimen surface is less affected by the inlet velocity. This rather contradictory result may be due to the relative large particle diameter of the study and the particle inlet velocity is much smaller than that of the disc. In [2] the authors tested 150 × 150 cm and found that, the surface profiles with “W” shape are found in all test samples of different processing times. In our study, it was found that the surface wear of two specimens located at 225 and 316 mm of the disc surface varies from two regions to three regions. In fact, the eroded profile strongly depends on erosion rate at a certain location in the eroded area, which is related to the particle trajectory, particle contribution, and velocity (in this paper relates to the circumferential velocity, whereas in [2] it relates to the inlet velocity). In our experiment, the average diameter of the particles was 0.1 mm. Through SEM observation, it was found that there are different sizes of pits and scratches on the surface of the test samples, mainly because of the cutting behavior, which supports Mahboobeh K. H’s test in [28]. The authors of [28] show that the erosion mechanism of the sand particles is indentation and extrusion when the size of the sand particles is less than 200 μm, and ploughing when the size is greater than 200 μm. Here, we found that there are many pits and scratches on the surface of the specimen. With increasing radius (circumferential velocity), the small to large pit structure at the junction dominates over the scratch structure. Additionally, the erosion level is irregular and more concentrated on the right-hand side of the disc. Hence, the erosion mechanisms in different regions can be identified and clearly explained by using the combined numerical and experimental approach. To develop a full picture of the wear behavior, additional studies are required to determine the morphology of the material along different radial distances and particle parameters.
5. Conclusions
In this paper, the solid–liquid two-phase flow and erosion mechanism were studied by means of numerical simulation and experiment. The numerical part was used to solve the (experimental) difficulty of tracking the collision characteristics of a large number of particles, while the experiments provided quantitative evidence of the surface evolution and surface morphology of a worn rotating disc.
The model systematically examined the impact of particle diameter, particle volume fraction, and particle inlet velocity on wear behavior. The following conclusions can be drawn:
- The smaller the particle diameter, the better the performance of the particle following the water, and thus, the larger the particle speed. As a result, the number of the particles under the same volume fraction increases, along with the wear of the sample.
- A larger particle volume fraction leads to a higher number of particles. This in turn, augments the collisions between particles and with test samples, resulting in more friction and wear.
- Although the solid particle inlet velocity and wear are positively correlated, the given effect is not relevant in the worn surface measures.
- The wear was positively correlated with the linear velocity of the sample. Therefore, the worn surface was more apparent in the larger than smaller diameter test sample. The experiments conducted further support this association.
Both numerical calculation and test demonstrated the surface wear is spot or corrugated, with an uneven distribution. According to numerical calculation, the maximum wear of the sample is higher than the average wear. Based in the observational data, the morphology of the material varies significantly along the radial distance of the rotating disc. A new finding shows that three distinct worn regions are developed in the larger diameter sample, compared with two for the smaller one. The wear degree on the basal body at high rotating speeds is greater due to circumferential rather than particle inlet velocity. The texture of the two sample surfaces is described as a mixture of pits and scratches, varying in size and frequency. The first region in both samples had a wavy external appearance and was filled with pits, and also suffered less wear damage. The most worn section, the second region in both samples, had a smooth external appearance. It was a mixture of coarse scratches and large pits.
The findings presented in the paper have important implications for assessing the associated risk of rotating devices operating within solid–liquid flows. To develop a full picture of the wear behavior, additional studies are required to determine the morphology of the material along different radial distances and particle parameters.
Author Contributions
Conceptualization, Y.Z. (Yuan Zheng); Formal analysis, C.Y.; Funding acquisition, C.Y. and Y.Z. (Yuquan Zhang); Investigation, S.H.; Methodology, D.Z.; Resources, Y.Z. (Yuan Zheng); Supervision, J.X. and Y.Z. (Yuquan Zhang); Validation, C.Y. and S.H.; Writing—original draft, C.Y.; Writing—review and editing, E.F.-R. All authors have read and agreed to the published version of the manuscript.
Funding
This research was funded by the National Natural Science Foundation of China (51709086, 51809083); Natural Science Foundation of Jiangsu Province (BK20180504) and China Postdoctoral Science Foundation (2019M651678).
Acknowledgments
The authors would like to thank anonymous referees for their valuable comments in improving the overall quality of a preliminary version of this paper.
Conflicts of Interest
The authors declare no conflict of interest.
References
- Mohamed, R.M.S.R.; kassim, A.H.B.M.; Anda, M.; Dallas, S. A monitoring of environmental effects from household greywater reuse for garden irrigation. Environ. Monit. Assess. 2013, 185, 8473–8488. [Google Scholar] [CrossRef]
- Nguyen, V.B.; Nguyen, Q.B.; Liu, Z.G.; Wan, S.; Lim, C.Y.H.; Zhang, Y.W. A combined numerical–Experimental study on the effect of surface evolution on the water–Sand multiphase flow characteristic sand the material erosion behavior. Wear 2014, 319, 96–109. [Google Scholar] [CrossRef]
- Javaheri, V.; Porter, D.; Kuokkala, V.T. Slurry erosion of steel–Review of tests, mechanisms and materials. Wear 2018, 408–409, 248–273. [Google Scholar] [CrossRef]
- Karimi, S.; Shirazi, S.A.; McLaury, B.S. Predicting fine particle erosion utilizing computational fluid dynamics. Wear 2017, 376–377, 1130–1137. [Google Scholar] [CrossRef]
- Fecarotta, O.; Martino, R.; Morani, M.C. Wastewater Pump Control under Mechanical Wear. Water 2019, 11, 1210. [Google Scholar] [CrossRef] [Green Version]
- Bagci, M. Determination of solid particle erosion with Taguchi optimization approach of hybrid composite systems. Tribol. Int. 2016, 94, 336–345. [Google Scholar] [CrossRef]
- Jiang, M.; Chen, L.N.; He, J.; Chen, G.Y.; Li, C.H.; Lu, X.G. Effect of controlled rolling/controlled cooling parameters on microstructure and mechanical properties of the novel pipeline steel. Adv. Manuf. 2014, 2, 265–274. [Google Scholar] [CrossRef] [Green Version]
- Singh, A.; Virdi, R.L.; Goyal, K. To study the slurry erosion behaviour of hard faced alloy SS304. Manuf. Sci. Technol. 2014, 2, 111–115. [Google Scholar]
- Zhao, J.; Zhang, G.C.; Xu, Y.J.; Wang, R.H.; Zhou, W.D.; Yang, D.Y. Experimental and theoretical evaluation of solid particle erosion in an internal flow passage within a drilling bit. J. Pet. Sci. Eng. 2018, 160, 582–596. [Google Scholar] [CrossRef]
- Borecki, M.; Pawlowski, M.L.K.; Beblowska, M.; Szmidt, J.; Szmidt, M.; Duk, M.; Urbanska, K.; Jakubowski, A. Intelligent Photonic Sensors for Application in Decentralized Wastewater Systems, Waste Water—Evaluation and Management; Einschlag, F.S.G., Ed.; InTech: Rijeka, Croatia, 2011; pp. 181–202. [Google Scholar]
- Adedeji, O.E.; Yu, W.C.; Sanders, R.S. Analysis of local wear variables for high-Precision erosion modelling in complex geometries. Wear 2019, 426–427, 562–569. [Google Scholar] [CrossRef]
- Zhang, J.X.; Kang, J.; Fan, J.C.; Gao, J.C. Research on erosion wear of high-pressure pipes during hydraulic fracturing slurry flow. J. Loss Prev. Process Ind. 2016, 43, 438–448. [Google Scholar] [CrossRef]
- Ou, G.F.; Bie, K.N.; Zheng, Z.J.; Shu, G.P.; Wang, C.; Cheng, B. Numerical simulation on the erosion wear of a multiphase flow pipeline. Int. J. Adv. Manuf. Technol. 2018, 96, 1705–1713. [Google Scholar] [CrossRef]
- Zhu, H.J.; Qi, Y.H. Numerical investigation of flow erosion of sand-Laden oil flow in a U-bend. Process Saf. Environ. Prot. 2019, 131, 16–27. [Google Scholar] [CrossRef]
- Nemitallah, M.; Ben-Mansour, R.; Habib, M.; Ahmed, W.H.; Toor, I.U.; Gasem, Z.; Badr, H.M. Solid particle erosion downstream of an orifice. ASME J. Fluids Eng. 2015, 137, 021302(1–11). [Google Scholar] [CrossRef]
- Shen, Z.J.; Chu, W.L.; Li, X.J. Sediment erosion in the impeller of a double-suction centrifugal pump–A case study of the Jingtai Yellow River Irrigation Project, China. Wear 2019, 422–423, 269–279. [Google Scholar] [CrossRef]
- Erdogan, S.T.; Nie, X.; Stutzman, P.E.; Garboczi, E.J. Micrometer-scale 3-D shape characterization of eight cements: Particle shape and cement chemistry, and the effect of particle shape on laser diffraction particle size measurement. Cem. Concr. Res. 2010, 40, 731–739. [Google Scholar] [CrossRef]
- Xu, L.; Luo, K.; Zhao, Y.Z.; Fan, J.R.; Cen, K.F. Influence of particle shape on liner wear in tumbling mills: A DEM study. Powder Technol. 2019, 350, 26–35. [Google Scholar] [CrossRef]
- Liu, Z.G.; Wan, S.; Nguyen, V.B.; Zhang, Y.W. A numerical study on the effect of particle shape on the erosion of ductile materials. Wear 2014, 313, 135–142. [Google Scholar] [CrossRef]
- Desale, G.R.; Gandhi, B.K.; Jain, S.C. Effect of erodent properties on erosion wear of ductile type materials. Wear 2006, 261, 914–921. [Google Scholar] [CrossRef]
- Aponte, R.D.; Teran, L.A.; Ladino, J.A.; Larrahondo, F.; Coronado, J.J.; Rodríguez, S.A. Computational study of the particle size effect on a jet erosion wear device. Wear 2017, 374–375, 97–103. [Google Scholar] [CrossRef]
- Aponte, R.D.; Teran, L.A.; Grande, J.F.; Coronado, J.J.; Ladino, A.; Larrahondo, F.J.; Rodríguez, S.A. Minimizing erosive wear through a CFD multi-Objective optimization methodology for different operating points of a Francis turbine. Renew. Energy 2020, 145, 2217–2232. [Google Scholar] [CrossRef]
- Nguyen, V.B.; Nguyen, Q.B.; Zhang, Y.W.; Lim, C.Y.H.; Khoo, B.C. Effect of particle size on erosion characteristics. Wear 2016, 348, 126–137. [Google Scholar] [CrossRef]
- Mansouri, A.; Arabnejad, H.; Shirazi, S.; McLaury, B. A combined CFD/experimental methodology for erosion prediction. Wear 2015, 332, 1090–1097. [Google Scholar] [CrossRef]
- Nguyen, Q.B.; Lim, C.H.M.; Nguyen, V.B.; Wan, Y.M.; Nai, B.; Zhang, Y.W.; Gupta, M. Slurry erosion characteristics and erosion mechanisms of stainless steel. Tribol. Int. 2014, 79, 1–7. [Google Scholar] [CrossRef]
- Abouel-Kasem, A.; Abd-elrhman, Y.M.; Amara, K.M.; Ahmed, S.M. Design and performance of slurry erosion tester. J. Tribol. 2010, 132, 021601-1–021601-10. [Google Scholar] [CrossRef]
- Desale, G.R.; Gandhi, B.K.; Jain, S.C. Particle size effects on the slurry erosion of aluminium alloy (AA6063). Wear 2009, 266, 1066–1071. [Google Scholar] [CrossRef]
- Mahboobeh, K.H.; Seyed, H.S.; Vijay, P.S.; Hossein, A.; Mehdi, A. Effect of rainfall intensity and slope on sediment particle size distribution during erosion using partial eta squared. Catena 2019, 176, 65–72. [Google Scholar]
- Tarodiya, R.; Gandhi, B.K. Experimental investigation of centrifugal slurry pump casing wear handling solid-Liquid mixtures. Wear 2019, 434–435. [Google Scholar] [CrossRef]
- Nandre, B.D.; Desale, G.R. Study the Effect of Impact Angle on Slurry Erosion Wear of Four Different Ductile Materials. Mater. Today Proc. 2018, 5, 7561–7570. [Google Scholar] [CrossRef]
- Jafari, A.; Dehghani, K.; Bahaaddini, K.; Hataie, R.A. Experimental comparison of abrasive and erosive wear characteristics of four wear-Resistant steels. Wear 2018, 416–417, 14–26. [Google Scholar] [CrossRef]
- Valtonen, K.; Ratia, V.; Ojala, N.; Kuokkala, V.T. Comparison of laboratory wear test results with the in-Service performance of cutting edges of loader buckets. Wear 2017, 388–389, 93–100. [Google Scholar] [CrossRef]
- Hloch, S.; Adamčík, P.; Nag, A. Hydrodynamic ductile erosion of aluminium by a pulsed water jet moving in an inclined trajectory. Wear 2019, 428–429, 178–192. [Google Scholar] [CrossRef]
- Wichowski, P.; Siwiec, T.; Kalenik, M. Effect of the Concentration of Sand in a Mixture of Water and Sand Flowing through PP and PVC Elbows on the Minor Head Loss Coefficient. Water 2019, 11, 828. [Google Scholar] [CrossRef] [Green Version]
- Zhang, Y.; Hong, S.; Lin, J.; Zheng, Y. nfluence of Ultrasonic Excitation Sealing on the Corrosion Resistance of HVOF-Sprayed Nanostructured WC-CoCr Coatings under Different Corrosive Environments. Coatings 2019, 9, 724. [Google Scholar] [CrossRef] [Green Version]
- Kamath, A.; Fleit, G.; Bihs, H. Investigation of Free Surface Turbulence Damping in RANS Simulations for Complex Free Surface Flows. Water 2019, 11, 456. [Google Scholar] [CrossRef] [Green Version]
- Oliveira, L.A.; Costa, V.A.F.; Baliga, B.R. A Lagrangian–Eulerian model of particle dispersion in a turbulent plane mixing layer. Int. J. Numer. Meth. Fluids 2002, 40, 639–653. [Google Scholar] [CrossRef] [Green Version]
- Luo, L.; Wang, T. Numerical simulation of a combined oxidation ditch flow using 3D k-ε turbulence model. J. Environ. Sci. 2005, 17, 808–812. [Google Scholar]
- Ilieva, G.I. Erosion failure mechanisms in turbine stage with twisted rotor blade. Engineering Failure Analysis 2016, 70, 90–104. [Google Scholar] [CrossRef]
- Wang, Y.; Zeng, T.; Xu, Y.X.; Liu, S.B.; An, J.; He, Y.; Xiao, X.W. Effect of solid particles on the erosion wear characteristics of hydrocyclone. Fluid Mach. 2019, 47, 50–56. [Google Scholar]
- Roza, T.; Asterios, P. CFD methodology for sedimentation tanks: The effect of secondary phase using DPM coupled calculations. Appl. Math. Modeling 2013, 37, 3478–3494. [Google Scholar]
- Han, W.; Chen, Y.; Liu, Y.; Li, G.X.; Wang, J.; Wang, T.D. Numerical simulation of end surface erosion characteristics of hydro-Turbine guide vane. J. Drain. Irrig. Mach. Eng. 2018, 36, 404–412. [Google Scholar]
Figure 1.
Rotating disc erosion test system.

Figure 2.
Rotating disc test rig.

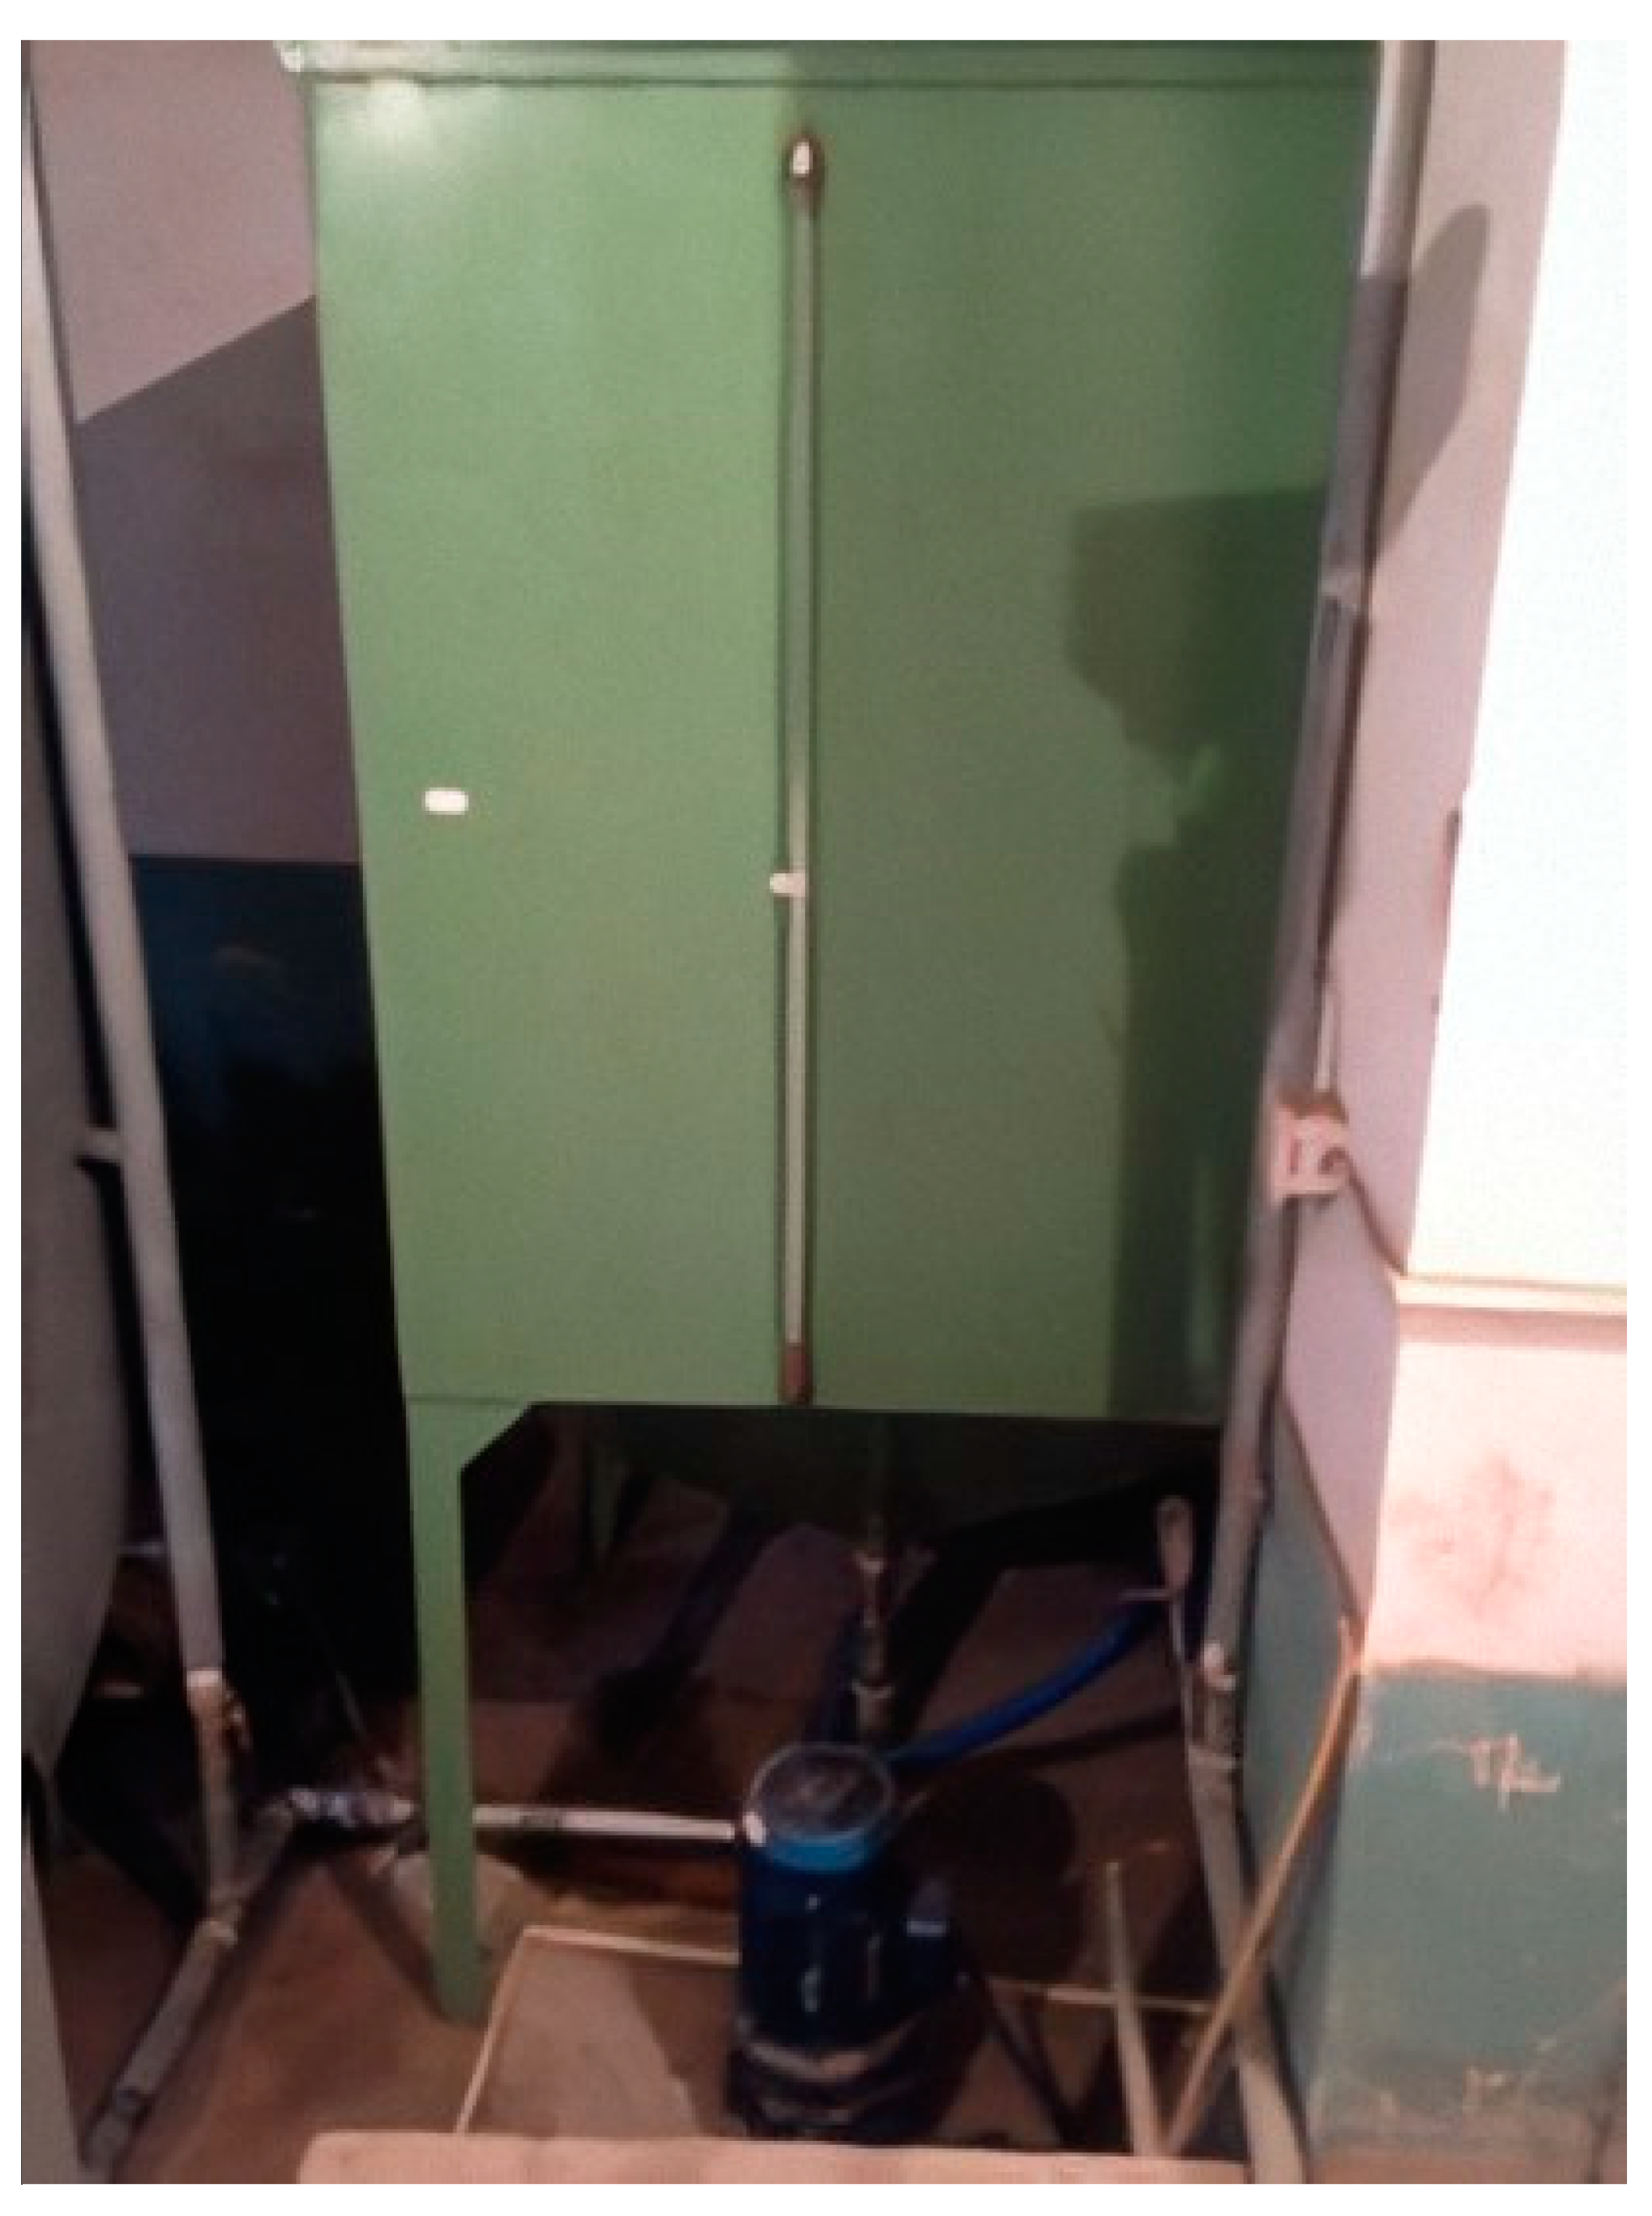
Figure 3.
Muddy water tank.

Figure 4.
Solid structure of rotating disc: (a) Whole flow passage of rotating disc; (b) Surface of rotating disc.
Figure 4.
Solid structure of rotating disc: (a) Whole flow passage of rotating disc; (b) Surface of rotating disc.

Figure 5.
Grid independence verification.

Figure 6.
Model mesh.

Figure 7.
The movement track of particles.

Figure 8.
Wear on the surface of the rotating disc.

Figure 9.
Change of wear E with radius of disc.

Figure 10.
Change of average wear Ea with time.

Figure 11.
Wear distribution of the test sample under condition 1.

Figure 12.
Wear contours of test samples under different particle diameters: (a) condition set 1, 225 mm; (b) condition set 1, 316 mm; (c) condition set 2, 225 mm; (d) condition set 2, 316 mm; (e) condition set 3, 225 mm; (f) condition set 3, 316 mm; (g) condition set 4, 225 mm; (h) condition set 4, 316 mm.

Figure 13.
Wear curves of test samples under different particle diameters.

Figure 14.
Wear contours of test samples with different particle volume fraction:(a) condition set 5, 225 mm; (b) condition set 5, 316 mm; (c) condition set 6, 225 mm; (d) condition set 6, 316 mm; (e) condition set 7, 225 mm; (f) condition set 7, 316 mm; (g) condition set 8, 225 mm; (h) condition set 8, 316 mm.

Figure 15.
Wear curves of test samples with different particle volume fractions.

Figure 16.
Wear curve of test samples at different particle inlet velocity.

Figure 17.
Wear contours of test samples at different particle inlet velocities: (a) condition set 9, 225 mm; (b) condition set 9,316 mm; (c) condition set 10, 225 mm; (d) condition set 10, 316 mm; (e) condition set 11, 225 mm; (f) condition set 11, 316 mm; (g) condition set 12, 225 mm; (h) condition set 12, 316 mm.

Figure 18.
Wear of test sample at 225 mm.

Figure 19.
Wear of test sample at 316 mm.

Figure 20.
Morphology of the stainless steel sample: (a) 316 mm-region 1; (b) 316 mm-junction of region 1 and region 2; (c) 316 mm-region 2; (d) 316 mm- junction of region 2 and region 3; (e) 316 mm-region 3; (f) 225 mm-region 1; (g) 225 mm- junction of region 1 and region 2; (h) 225 mm-region 2.
Figure 20.
Morphology of the stainless steel sample: (a) 316 mm-region 1; (b) 316 mm-junction of region 1 and region 2; (c) 316 mm-region 2; (d) 316 mm- junction of region 2 and region 3; (e) 316 mm-region 3; (f) 225 mm-region 1; (g) 225 mm- junction of region 1 and region 2; (h) 225 mm-region 2.


Table 1.
Working condition list.
| Condition Set Number | 1 | 2 | 3 | 4 | 5 | 6 | 7 | 8 | 9 | 10 | 11 | 12 |
|---|---|---|---|---|---|---|---|---|---|---|---|---|
| Cv (%) | 2.5 | 2.5 | 2.5 | 2.5 | 2 | 3 | 4 | 5 | 2.5 | 2.5 | 2.5 | 2.5 |
| D (mm) | 0.1 | 0.2 | 0.3 | 0.4 | 0.15 | 0.15 | 0.15 | 0.15 | 0.15 | 0.15 | 0.15 | 0.15 |
| V (m/s) | 2.05 | 2.05 | 2.05 | 2.05 | 2.05 | 2.05 | 2.05 | 2.05 | 1.05 | 2.05 | 3.05 | 4.05 |
Table 2.
Wear loss of stainless steel samples at the two positions.
| Diameter Position | 316 mm (79/90th) | 225 mm (5/8th) |
|---|---|---|
| Before Wear Test (g) | 29.9959 | 29.8076 |
| After the Wear Test (g) | 27.3977 | 29.0054 |
| Wear Loss (g) | 2.5982 | 0.8022 |
| Wear Loss Rate (%) | 8.66 | 2.69 |
© 2020 by the authors. Licensee MDPI, Basel, Switzerland. This article is an open access article distributed under the terms and conditions of the Creative Commons Attribution (CC BY) license (http://creativecommons.org/licenses/by/4.0/).
Share and Cite
MDPI and ACS Style
Yang, C.; Hou, S.; Xu, J.; Zhang, Y.; Zheng, Y.; Fernandez-Rodriguez, E.; Zhou, D. Multicomponent Water Effects on Rotating Machines Disk Erosion. Water 2020, 12, 757. https://doi.org/10.3390/w12030757
AMA Style
Yang C, Hou S, Xu J, Zhang Y, Zheng Y, Fernandez-Rodriguez E, Zhou D. Multicomponent Water Effects on Rotating Machines Disk Erosion. Water. 2020; 12(3):757. https://doi.org/10.3390/w12030757
Chicago/Turabian StyleYang, Chunxia, Shanshan Hou, Junhui Xu, Yuquan Zhang, Yuan Zheng, E Fernandez-Rodriguez, and Daqing Zhou. 2020. "Multicomponent Water Effects on Rotating Machines Disk Erosion" Water 12, no. 3: 757. https://doi.org/10.3390/w12030757
Note that from the first issue of 2016, this journal uses article numbers instead of page numbers. See further details here.