Incorporating Rainwater Harvesting Systems in Iran’s Potable Water-Saving Scheme by Using a GIS-Simulation Based Decision Support System


1
Center for General Education, Tzu-Chi University, No.701, Zhongyang Rd., Sec.3, Hualien 97004, Taiwan
2
College of Water Conservancy & Hydropower Engineering, Hohai University, Nanjing 210098, China
3
College of Hydrology and Water Resources, Hohai University, Nanjing 210098, China
*
Author to whom correspondence should be addressed.
Water 2020, 12(3), 752; https://doi.org/10.3390/w12030752
Submission received: 4 February 2020
/
Revised: 29 February 2020
/
Accepted: 7 March 2020
/
Published: 9 March 2020
(This article belongs to the Special Issue Rainwater and Stormwater Harvesting for Sustainable Water Cycle Management)
Abstract
:Rainwater harvesting systems (RWHSs) have been accepted as a simple and effective approach to ease the worsening of urban water stress. However, in arid and semiarid regions, a comprehensive method for promoting domestic RWHSs in a large-scale water-saving scheme that incorporates water consumption reducing equipment (WCRE) and gray water reuse (GWR), has not been well developed. For this, based on the case study of Guilan Province, Iran, this study addressed the temporal-spatial complex of rainfall and proposed a GIS-simulation-based decision support system (DSS). Herein, two scenarios, i.e., the typical RWHS and the modified RWHS for arid areas, were tested; and the associated economic analysis was performed and compared with WCRE and GWR. Moreover, for larger-scale implementation, the multiple criteria decision making (MCDM) technique was further applied to address the social-environmental complexity of these water-saving methods. Guilan Province has thereby been classified into three priority levels, providing a straightforward understanding of how to promote the large-scale water-saving scheme. Compared with the traditional generalized method, sensitivity analysis verified that this DSS enhanced the information value. Hence, the DSS that provides more holistic and comprehensive support has been identified as a useful tool to ease the threat of urban water stress.
1. Introduction
Worsening urban water stress is a threat to human development. In this context, rainwater harvesting systems (RWHSs) have been recognized as a simple and effective approach to ease water stress in many countries, e.g., Australia, Malaysia, Vietnam, Italy, Portugal, China, Brazil, and Mexico [1,2,3,4,5,6,7,8,9,10,11,12,13,14]. Water conservation through RWHSs is also one of the most discussed concepts in arid and semiarid areas [15]. It can increase water security for individuals and governments [1,10,12,13]. However, a comprehensive method for promoting domestic RWHSs in a large-scale water-saving scheme that incorporates other water-saving methods, e.g., water consumption reducing equipment (WCRE) and gray water reuse (GWR), has not been well developed.
For example, many parts of Iran, especially urban areas, are currently experiencing the final stage of drought called “socioeconomic drought” [16]. The situation results from an imbalance between renewable water resources and water demand. The average annual water consumption in Iran is approximately 8% higher than the total sustainable water supply [17,18]. The latest studies on the drinkable water situation in Iran show that under the current status of water, the population under water stress has reached up to 80% of the total population of the country [17,19]. Theoretical and practical solutions are being used to develop additional and decentralized water resources as well as to improve water productivity. Domestic rainwater harvesting, as locally available water resources, can be one of the potential solutions [20]. In this context, RWHSs are typically used for only non-drinkable water purposes, e.g., flushing toilets and irrigation. However, RWHSs in arid and semiarid areas should be modified and considered as alternative drinkable water sources by adding adequate filters. Apart from RWHSs, the GWR and WCRE are often discussed as water-saving methods that can be used to ease urban water stress [21,22]. These water-saving methods generate different economic, social and environmental impacts when applied on a large scale. In addition, only the performance of RWHSs is subject to spatial variation. Therefore, a comprehensive water-saving scheme that provides spatial information considering the economic, social and environmental aspects in applying these water-saving methods in arid and semiarid areas is crucially needed. Unfortunately, the information for the modified RWHSs, the cost-effectiveness, and the priority of these water-saving methods applied on a large scale remain unknown to the general public in Iran [23].
To obtain the optimal tank size design and predict the economic feasibility of RWHSs, researchers often apply historical rainfall data to simulate the hydraulic performance of individual RWHSs [11,24,25]. However, rainfall may vary not only temporally but also spatially, and the traditional single-site approach cannot treat spatial factors when large-scale assessments should be taken into account [1,2,21]. Therefore, hydraulic simulations should be incorporated into geographic information systems (GISs), which address the temporal-spatial complexity of rainfall and may result in a more comprehensive and visual understanding of the RWHSs on a large scale.
Therefore, a modified RWHS design method, spatial-based hydraulic simulation, and economic analysis must be carefully integrated; all water-saving methods should be adequately incorporated and evaluated. In addition to the economic perspective, the social and environmental aspects of these water-saving methods should be included. Only when citizens and policy makers have received comprehensive and integrated information that can be used to enhance their understanding of these water-saving methods will they be able to make sound decisions to address the dilemma of rapidly growing urban water stress in their countries. Therefore, this study established a GIS-simulation-based RWHSs DSS (decision support system) that incorporated a historical rainfall data bank, hydraulic simulation, and economic analysis. A multiple criteria decision making (MCDM) that adopts technique, social and environmental aspects was also applied for determining the priority of the water-saving methods. The case study was based on Guilan Province in northern Iran. The study’s purpose is therefore threefold: first, to conduct a spatially based simulation that addresses the temporal-spatial complex of rainfall and visualizes the hydraulic performance of modified RWHSs in the study area; second, to conduct an LCCA (life cycle cost analysis) that supports the optimal RWHS tank volume design; and finally, to perform MCDM that prioritizes the various water-saving methods spatially for a simple and straightforward understanding in the large-scale water-saving scheme.
2. Methodology and Material of the DSS for the Water-Saving Scheme
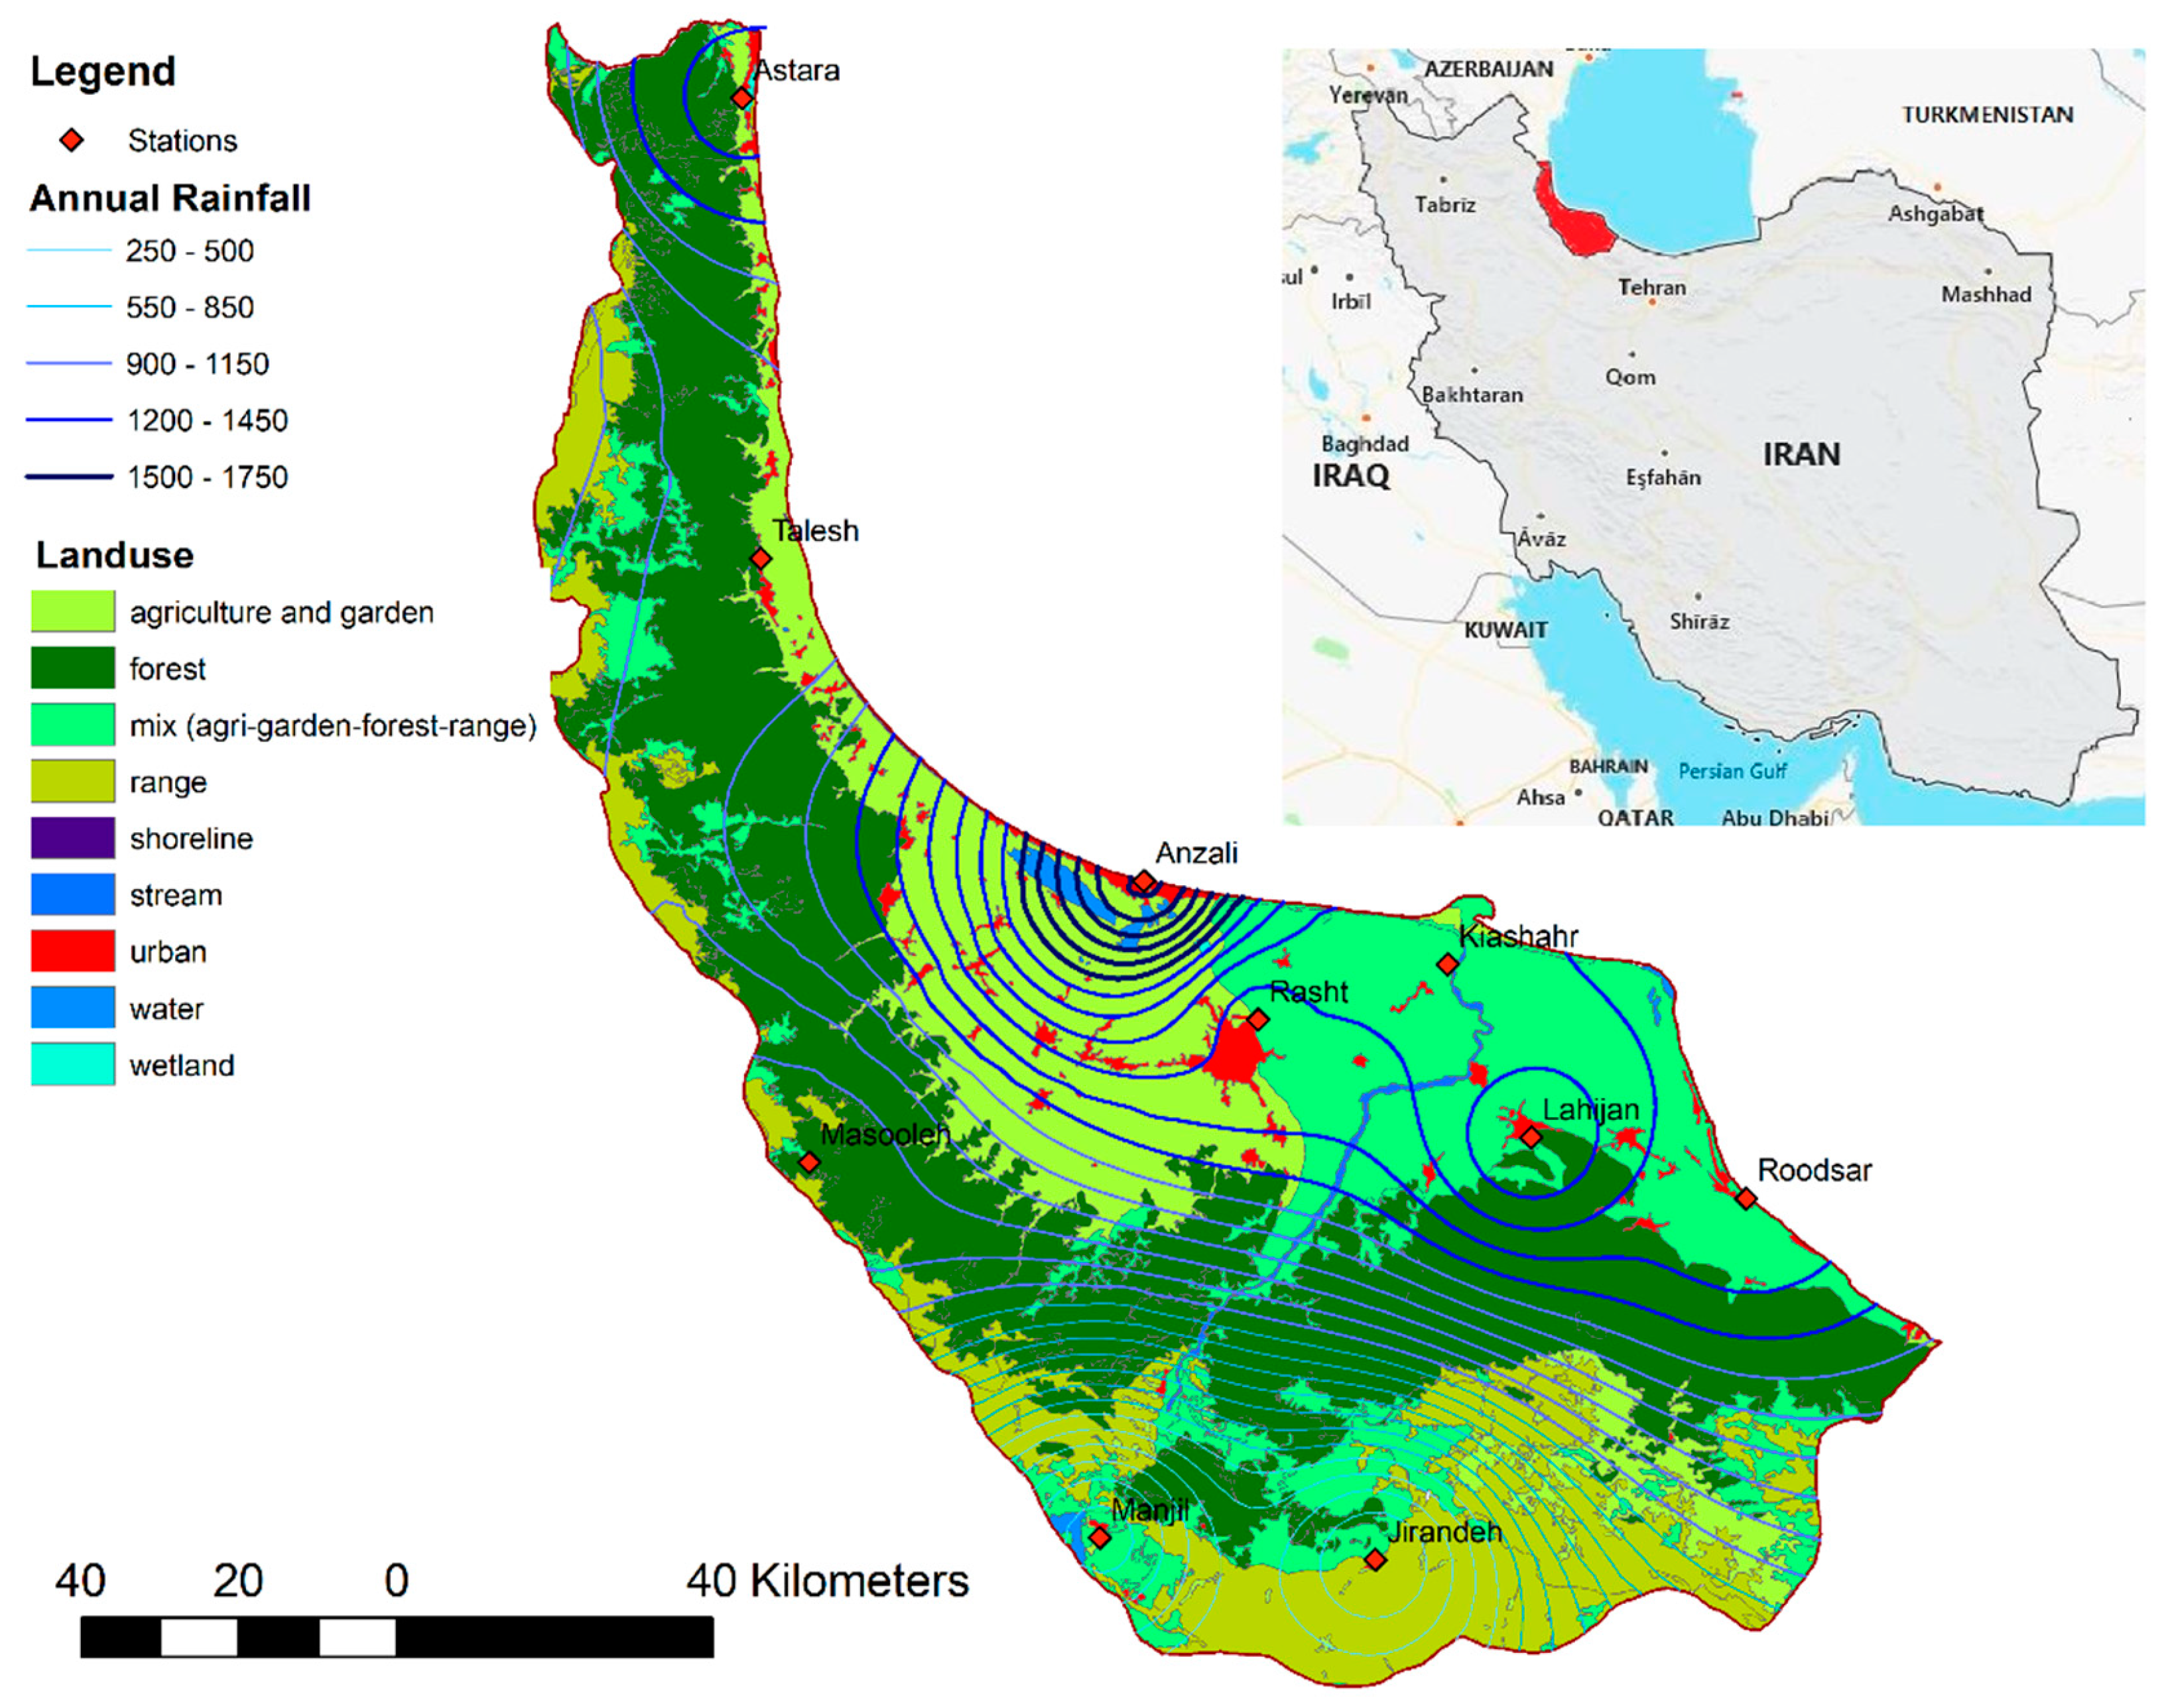
Guilan Province is one of the northern provinces of Iran with an area of 14,711 km2, located at 36°33′ N to 38°27′ N width and 48°32′ E to 50°36′ E of the meridian. This province has 16 counties, 52 cities, 43 districts, 109 rural districts, and 2583 villages. The climate of the coastal area is mild, which is due to the impact of mountainous weather in Alborz and the Caspian Sea. Guilan Province has 10 synoptic meteorological stations. Table 1 summarizes the status of the province’s water resources and population. With relatively high rainfall in Iran, Guilan Province is also considered a potential province that can ease its urban water stress by adopting RWHSs. As a case study, this work focuses on supporting the decision making of applying urban rooftop rainwater harvesting systems and other water-saving methods in Guilan Province. The DSS is described as follows.
2.1. System Description
Figure 1 illustrates the conceptual framework of DSS, which is composed of 6 major parts: data bank, model bank for processing data, spatial interpolation, GIS platform, data input, and data output. To explore the hydraulic performance of both typical and modified RWHSs in the study area, a hydraulic simulation using the historical rainfall data of each station was first performed and then spatially interpolated into mapping. Based on the input of economic data, an economic analysis can be achieved using LCCA and thereby compared with other water-saving methods. Using MCDM, the priority of these water-saving methods is further explored and then classified into maps.
2.2. Data Bank
The information in the data bank consists of rainfall data and spatial data layers. Daily rainfall data from 10 rain stations (from 2005 to 2014) are used for hydraulic simulation. The average annual rainfall of these rain stations amounts to 1088.4 (mm/year), while the highest is 1762 (mm/year) and the lowest is 228 (mm/year). The distance between these two stations is only 83.5 km, revealing how the spatial variation in rainfall may affect the water-saving scheme and highlighting the importance of using a spatial approach for the DSS. Figure 2 illustrates the location of rainfall stations and cities. These daily rainfall data are subsequently applied in the hydraulic simulation.
2.3. Hydraulic Simulation
The hydraulic performance of an RWHS is determined by factors including the storage tank size, rainfall, rooftop area, and rainwater demand [26]. Two RWHS behavioral models, yield after spillage (YAS) and yield before spillage (YBS), are commonly used and discussed [27]. The YAS assumes the RHWS supplies the demand after the tank is filled by rain, so there is no access to the rainwater that fell during time t. The YBS assumes that the rainfall enters the tank and is then used [14]. The core of both algorithms is based on the water mass balance model. The YAS model is shown by Equation (2), and the YBS model by Equation (3) [14,28]:
where:
= Yield or water use from storage of system during interval time t (m3)
= Water demand at time t (m3)
= Storage volume of rainwater in the tank at the beginning of the t − 1 time period (m3)
= Storage capacity (tank size) m3
= Rooftop rainwater runoff (m3)
= Rainfall depth (m)
= Rooftop area (m2)
= Runoff coefficient
Both the YAS and the YBS represent the two extreme scenarios in the RWHS behavior. However, most studies to date have shown that the YAS algorithm has produced better and conservative results, and the YBS algorithm could overestimate the water savings by 10% to 15% [14,28]. Therefore, this study adopted the YAS algorithm in the DSS.
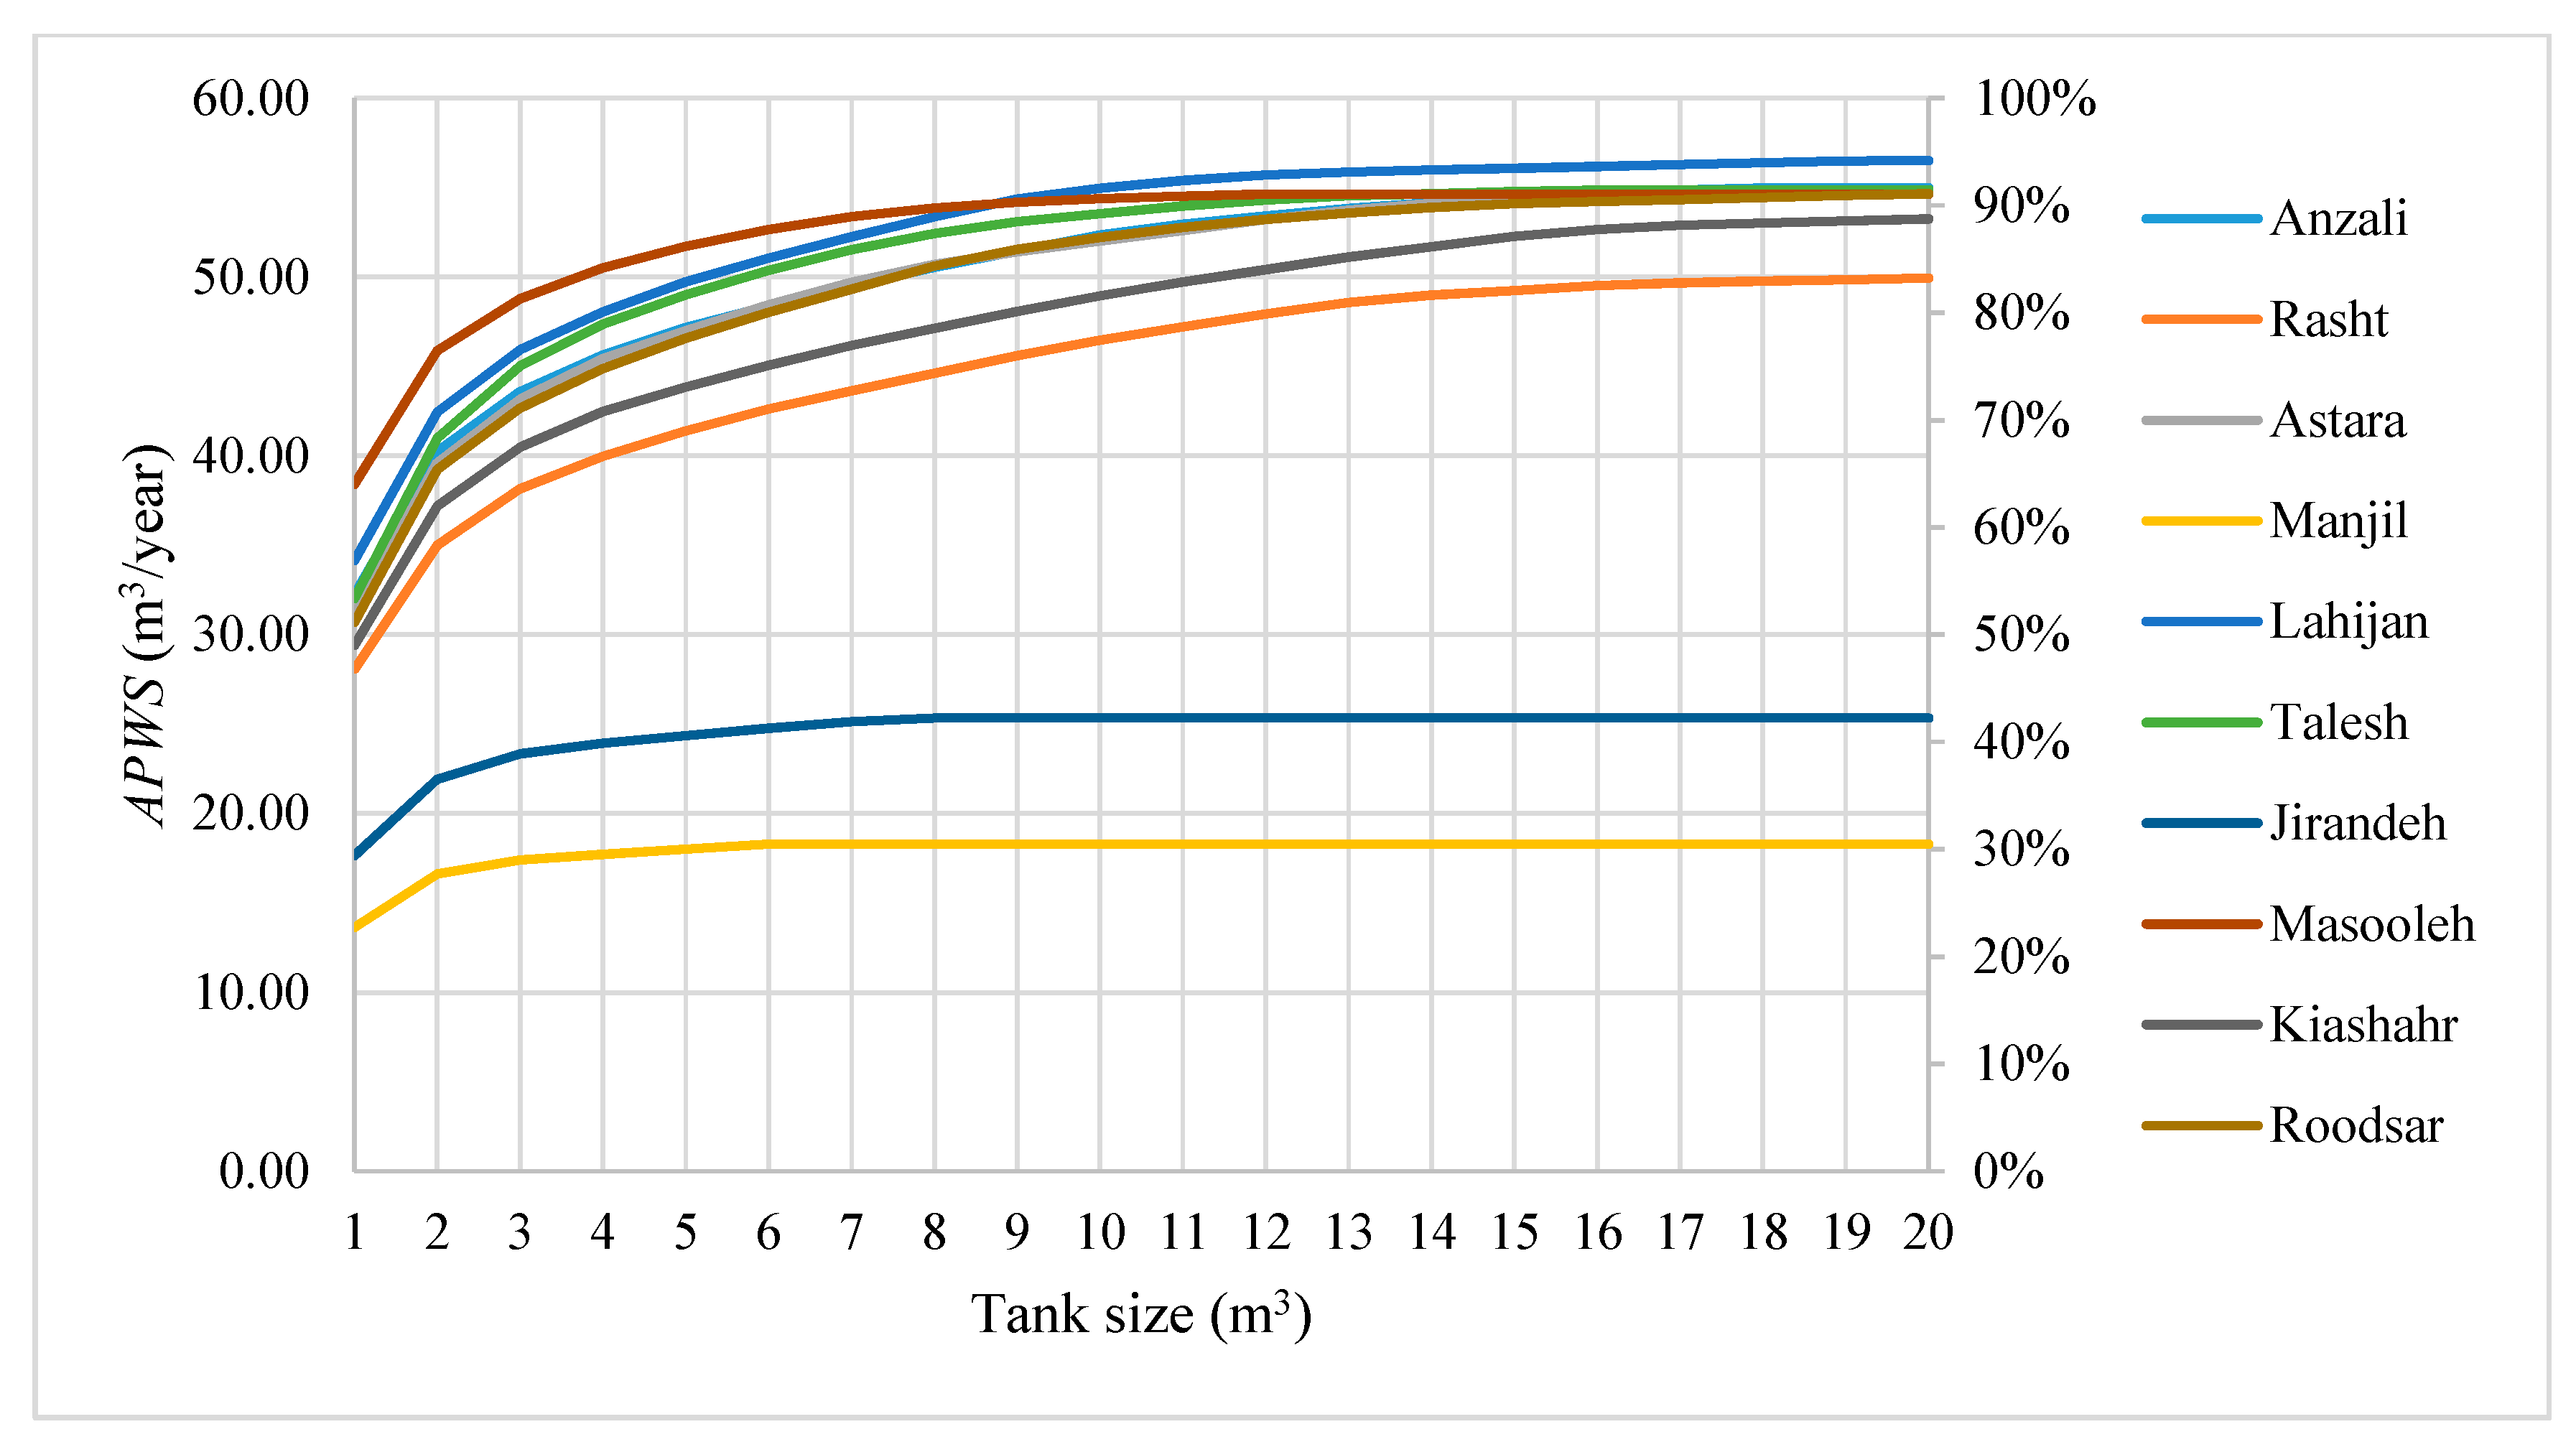
According to Equation (2), the hydraulic performance of an RWHS can therefore be predicted using the annual potable water-saving (APWS) m3/year and the replacement rate (RR) as follows:
The RR indicates the efficiency of water savings, while the APWS is crucial in the economic analysis and is applied in the LCCA.
2.4. Economic Analysis (Life Cycle Cost Analysis)
LCCA is commonly used to estimate the overall costs of project alternatives, which may be categorized into a simplified format for the major phases of acquisition, operation, and phase out/disposal as well as their respective stages [1,14,27,29,30,31,32]. For this, the initial cost of an RWHS setting includes tank cost, pumping, plumbing, and filters. Table 2 shows all determinant values in the economic analysis in this paper. The unit-saving cost (USC, $/m3) is used to indicate the LCC per unit water saved in the water-saving methods and is shown as follows:
In addition to the well-known benefit of saving potable water, RWHSs have been recognized to be effective in reducing urban runoff, saving energy, and serving as an emergency water supply in the aftermath of major disasters [33,34]. However, the economic benefits of urban flood mitigation and the value for the emergency water supply are difficult to quantify. This study focuses on the discussion of the economic benefits of saving potable water and assumes that the opportunity cost resulting from the space occupied by rainwater tanks is negligible.
2.5. Spatial Analysis
ArcGIS desktop version 10.5 was used for measuring parameters at strategically dispersed sample locations and predicting values for all other locations by interpolating data values. The Kriging, inverse distance weighting (IDW), spline, and trend methods are commonly used for interpolation. Among them, for this study area, Kriging and inverse distance weighting (IDW) tend to have more realistic results in areas near stations compared to the spline and trend methods [35,36]. Since the population is concentrated around the stations and the majority of the town areas around them, the IDW method was used to interpolate the values obtained from the simulation and for further economic analysis.
2.6. Modified RWHS Design in Arid Water-Saving Schemes
The domestic consumption of potable water per capita per day in Iran has been reported as approximately 157 L, where toilet flushing accounts for 24%, faucets account for 20%, showers account for 20%, washing clothes accounts for 16%, leaks account for 13%, bathing accounts for 3%, dishwashers account for 2%, and other uses account for 3%. The “other” category includes evaporative cooling, humidification, water softening, and other uncategorized indoor uses [37].
This study proposed a modified RWHS design for arid areas and integrated it with other water-saving methods, including GWR and WCRE (A set of information, reports and guides on water status, consumption, management and uses in Iran was obtained from indoor webpage http://www.WaterCM.ir, such as: “water consumption management”, “assessment of residential water conservation through using low-flow fixtures”, “WC pans and WC suites, and electrical household washing machines, provided by the Iranian National Standardization Organization). Two scenarios were proposed to test the performance of modified RWHSs:
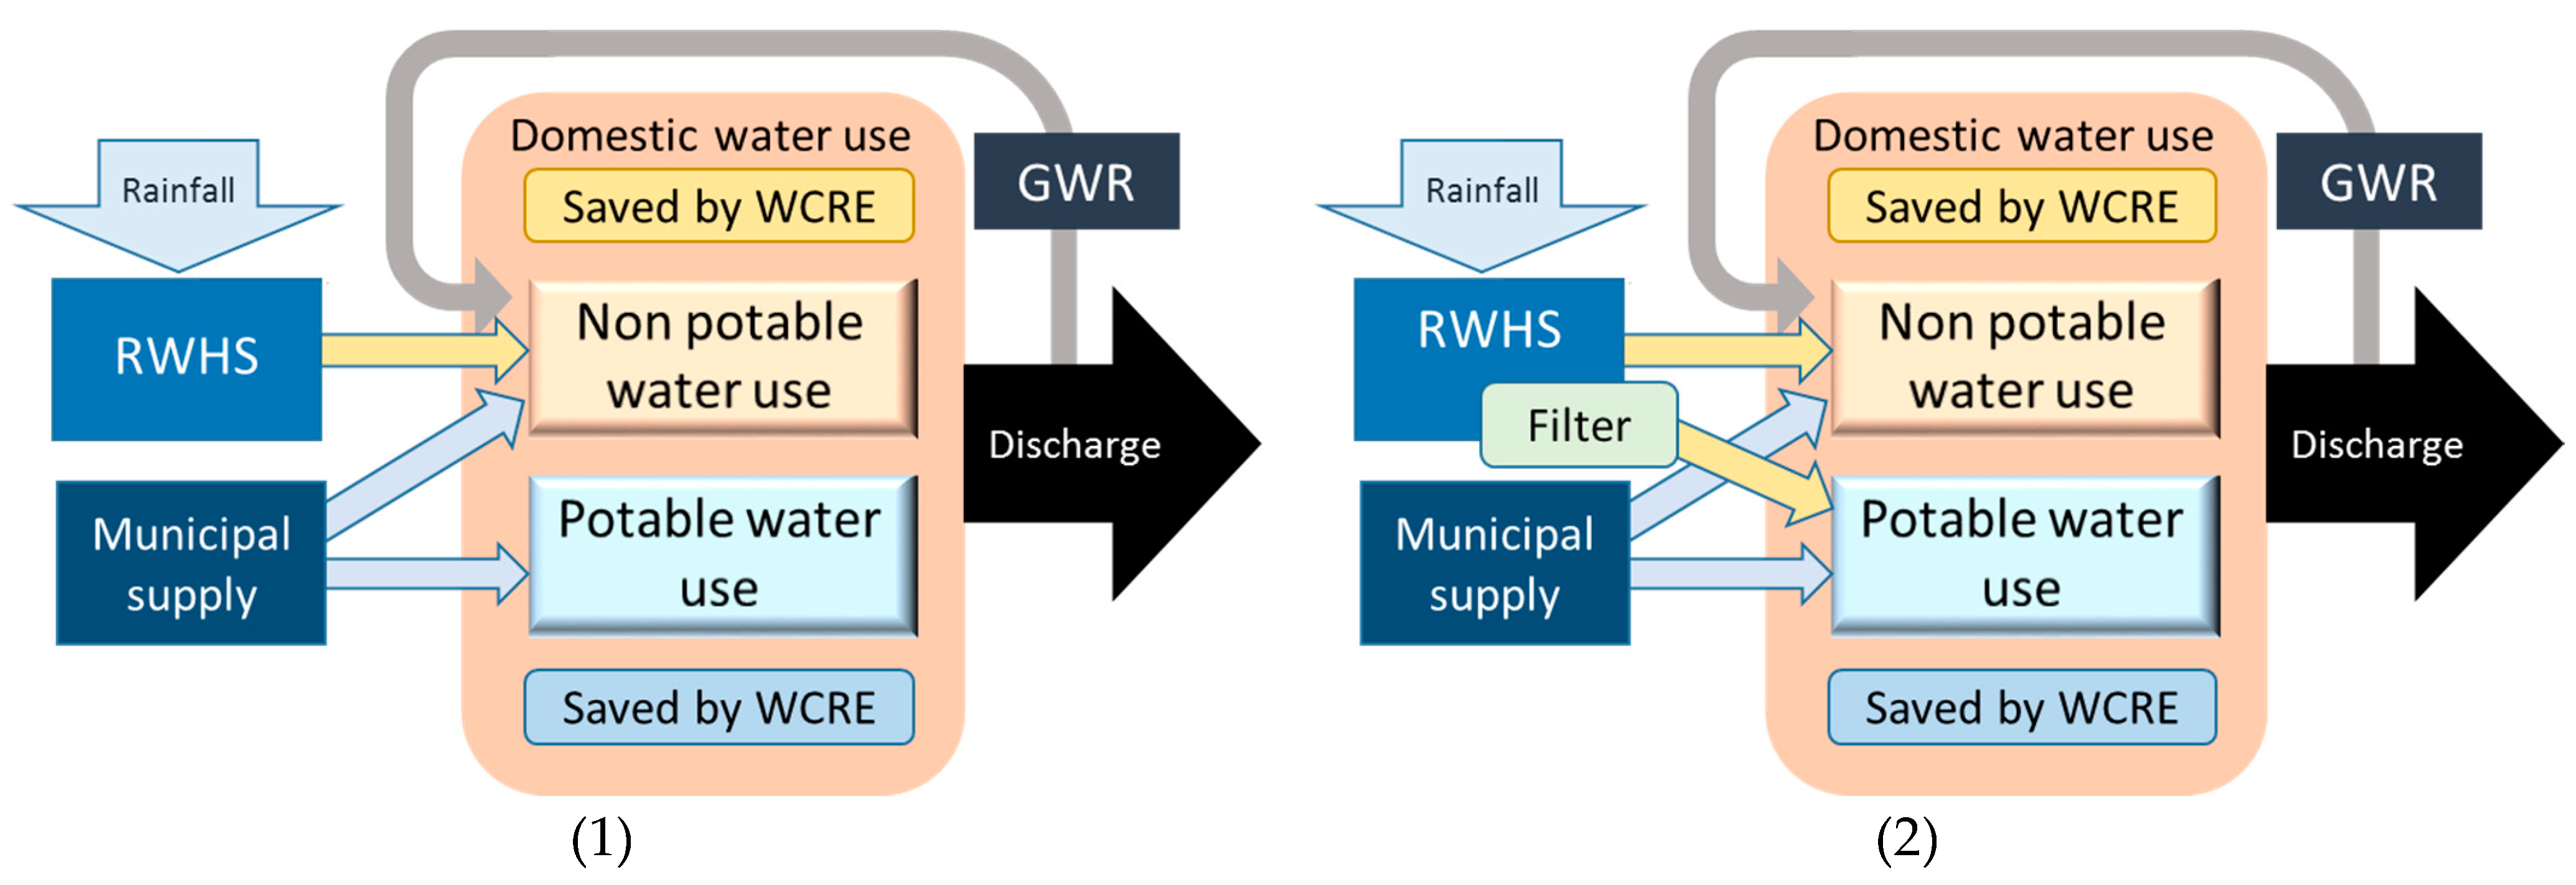
- Scenario A: Typical RWHSs that supply only for domestic non-potable use, i.e., toilet flushing, with daily water demand per person as 24% × 157 L.
- Scenario B: Modified RWHSs are for both potable and non-potable domestic uses by adding a drinkable filter. Therefore, the water demand for such a system is calculated as 157 L per person.
Figure 3. illustrates the concept of Scenario A, which is integrated with GWR and WCRE, while Figure 3(2) demonstrates Scenario B.
The initial, maintenance, and replacement costs of RWHSs of both scenarios A and B have been investigated and obtained from local plumbers using the judgment sampling technique [38]. This research uses up-to-date, market and official information for the LCCA. To estimate the cost of an RWHS, the polyethylene tank was considered, which is widely used in Iran.
According to the latest census conducted and statistics center of Iran, 444,139 households live in conventional residential apartments and non-residential areas in total. Meanwhile, 91% of the province’s population lives in houses of 50–150 m2. In 98% of cases, a household resides in a residential unit. The average number of people in households in Guilan Province in urban and rural areas are 3.4 and 3.6 persons per household, respectively [39]. Based on statistics and field observations, this research assumes a 100 m2 roof area and 4 residents per building. However, in addition to the economic factor, the social-environmental complexity should also be addressed when applying a water-saving scheme on a large scale.
2.7. Multiple Criteria Decision Making
Among all the water-saving methods, WCRE is the main state strategy used to cope with water shortages in the household sector. Although it significantly reduces water use, because it has less of an impact on the production cycle and water distribution than other methods, it has a less effective impact on the environment. Additionally, as for GWR, the most important benefits are saving treated water and providing a sustainable and reliable water supply for specific purposes [40]. However, because gray water contains fats, detergents, soaps, organic materials, salts and even pathogens, improper operation may cause the proliferation of various diseases and affect the health of individuals, animals and the environment [41]. In this context, RWHSs, which use clean and reliable sources of rain, have a major impact on reducing the volume of water and thereby reducing the risk of floods [42,43]. Nevertheless, the hydraulic performance of RWHSs is highly associated with the tank size, which may lead to a significant occupation of space and a negative social impact due to the poor aesthetics in the community. Other social aspects, e.g., government support, culture penetration, mature commercial availability, and job creation, should also be taken into account.
Multiple criteria decision making (MCDM) is adopted in the DSS for determining the priority of several supported and recommended water-saving methods. Seven criteria were selected, including technical, economic, social and environmental aspects. The weights of each criterion can be calculated by different MADM methods, such as subjective and objective methods [44]. This study used a compensatory method, integrated determination of objective criteria weights (IDOCRIW), which was introduced by Zavadskas and Podvezko in 2016 [45]. In this method, attributes (criteria) are independent, and qualitative attributes can be converted into quantities. This method consists of two widely used methods: entropy and CILOS. In addition, the most commonly used TOPSIS method is applied to determine the rank order of alternative weights. The main formulas are shown as follows.
The aggregate weights are obtained by the following equation:
where is the criteria impact loss weight (CILoS weight) and is the obtained by the entropy method.
(b) Ranking water-saving schemes as alternatives can now be preference-ranked according to the descending order of :
where and are ideal separation and negative-ideal separation, respectively. It is noted that the weighting and ranking procedure is attached in the Appendix A.
TOPSIS is a multicriteria decision-making method used to identify solutions from a limited set of options based on minimizing the distance from an ideal point and the maximum distance from a rare point. Its attractive point is that limited subjective input is required from decision makers. The only subjective input is the weight requirement. This method minimizes the distance to the ideal alternative while maximizing the distance to the rare alternative. The advantage of the method is the ability to identify the best alternative quickly [46].
3. Results and Discussion
3.1. Result of Hydraulic Simulation
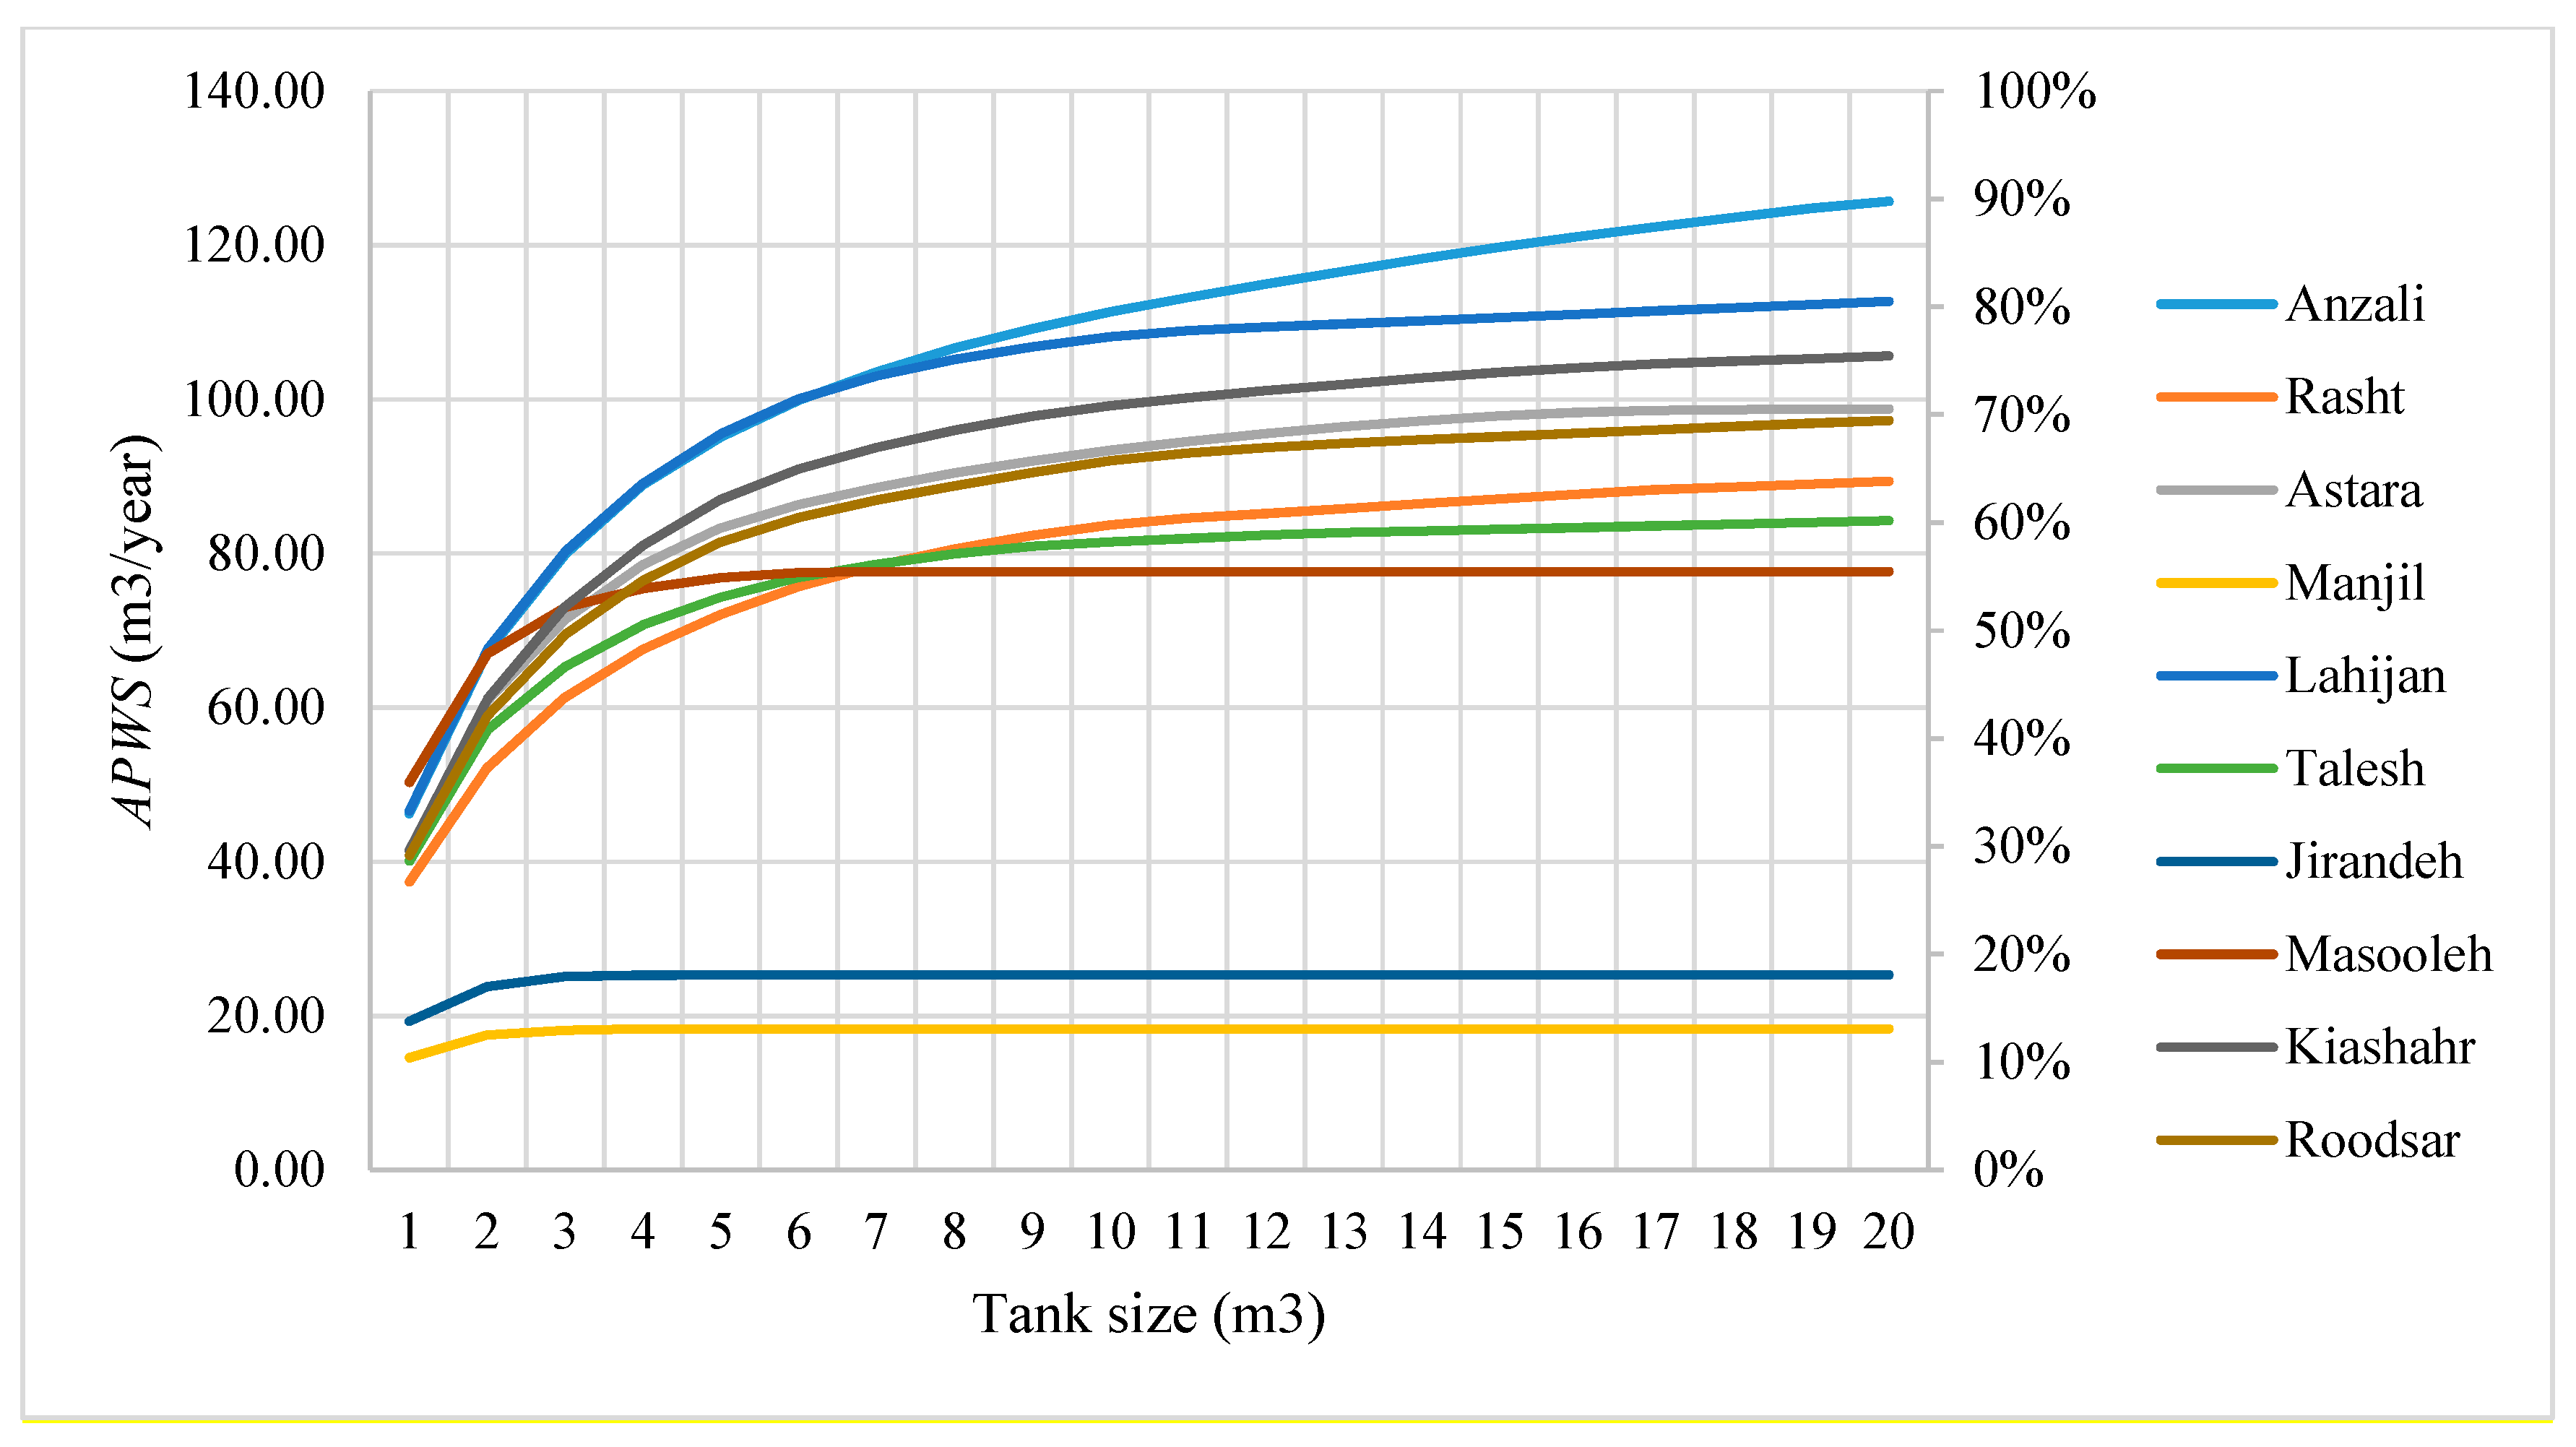
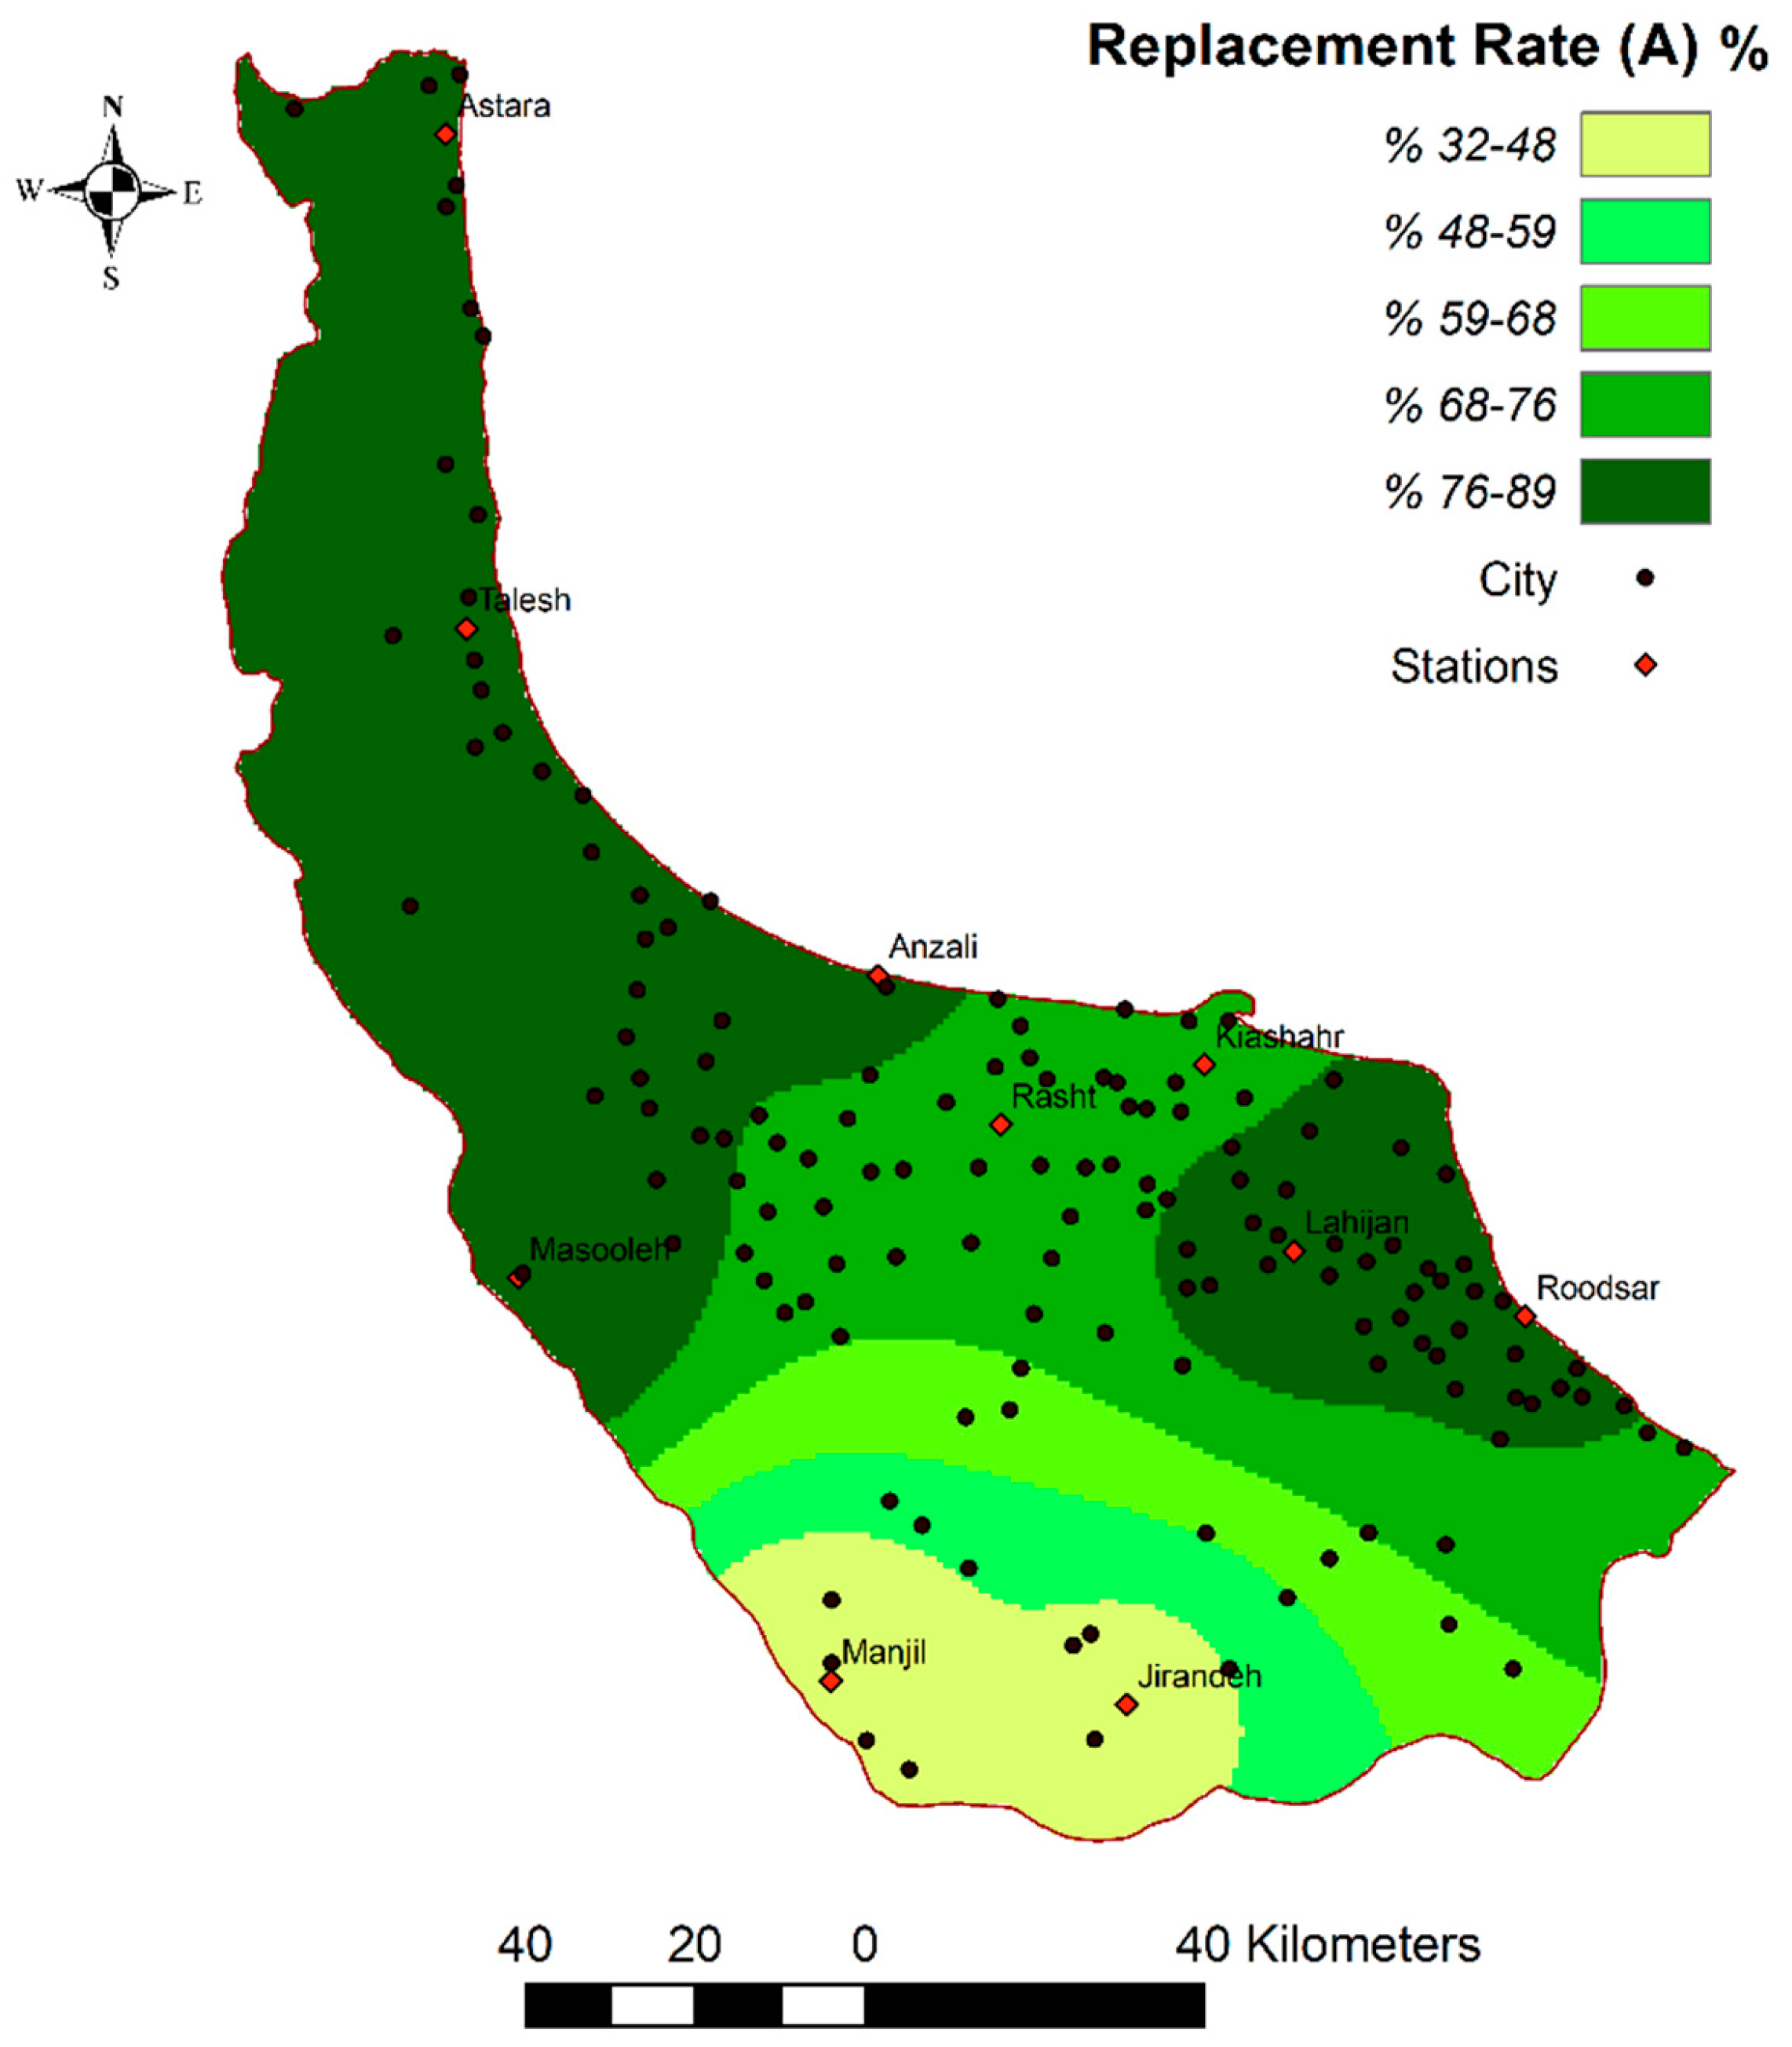
Based on the YAS algorithm in Equation (3), Figure 4 and Figure 5 demonstrate how the hydraulic performance, APWS and RR of the RWHSs in scenarios A and B respond to the tank size, respectively. Scenario B is generally higher in APWS and lower in RR as the demand is increased. The hydraulic performance of RWHSs in drier areas, e.g., Manjil and Jirandeh, is less sensitive to the increase in tank size when the tank size is greater than 5 (m3) in scenario A and greater than 3 (m3) in scenario B. Figure 6 and Figure 7 illustrate the spatial distribution RR using a tank size of 3 (m3) for Scenarios A and B as examples. The results show that the spatial distribution of the hydraulic performance of RWHSs generally agrees with that of the average annual rainfall, as illustrated in Figure 2. However, a further sensitivity analysis is necessary to verify how the simulation method affects the prediction of hydraulic performance of scenarios A and B in the study area.
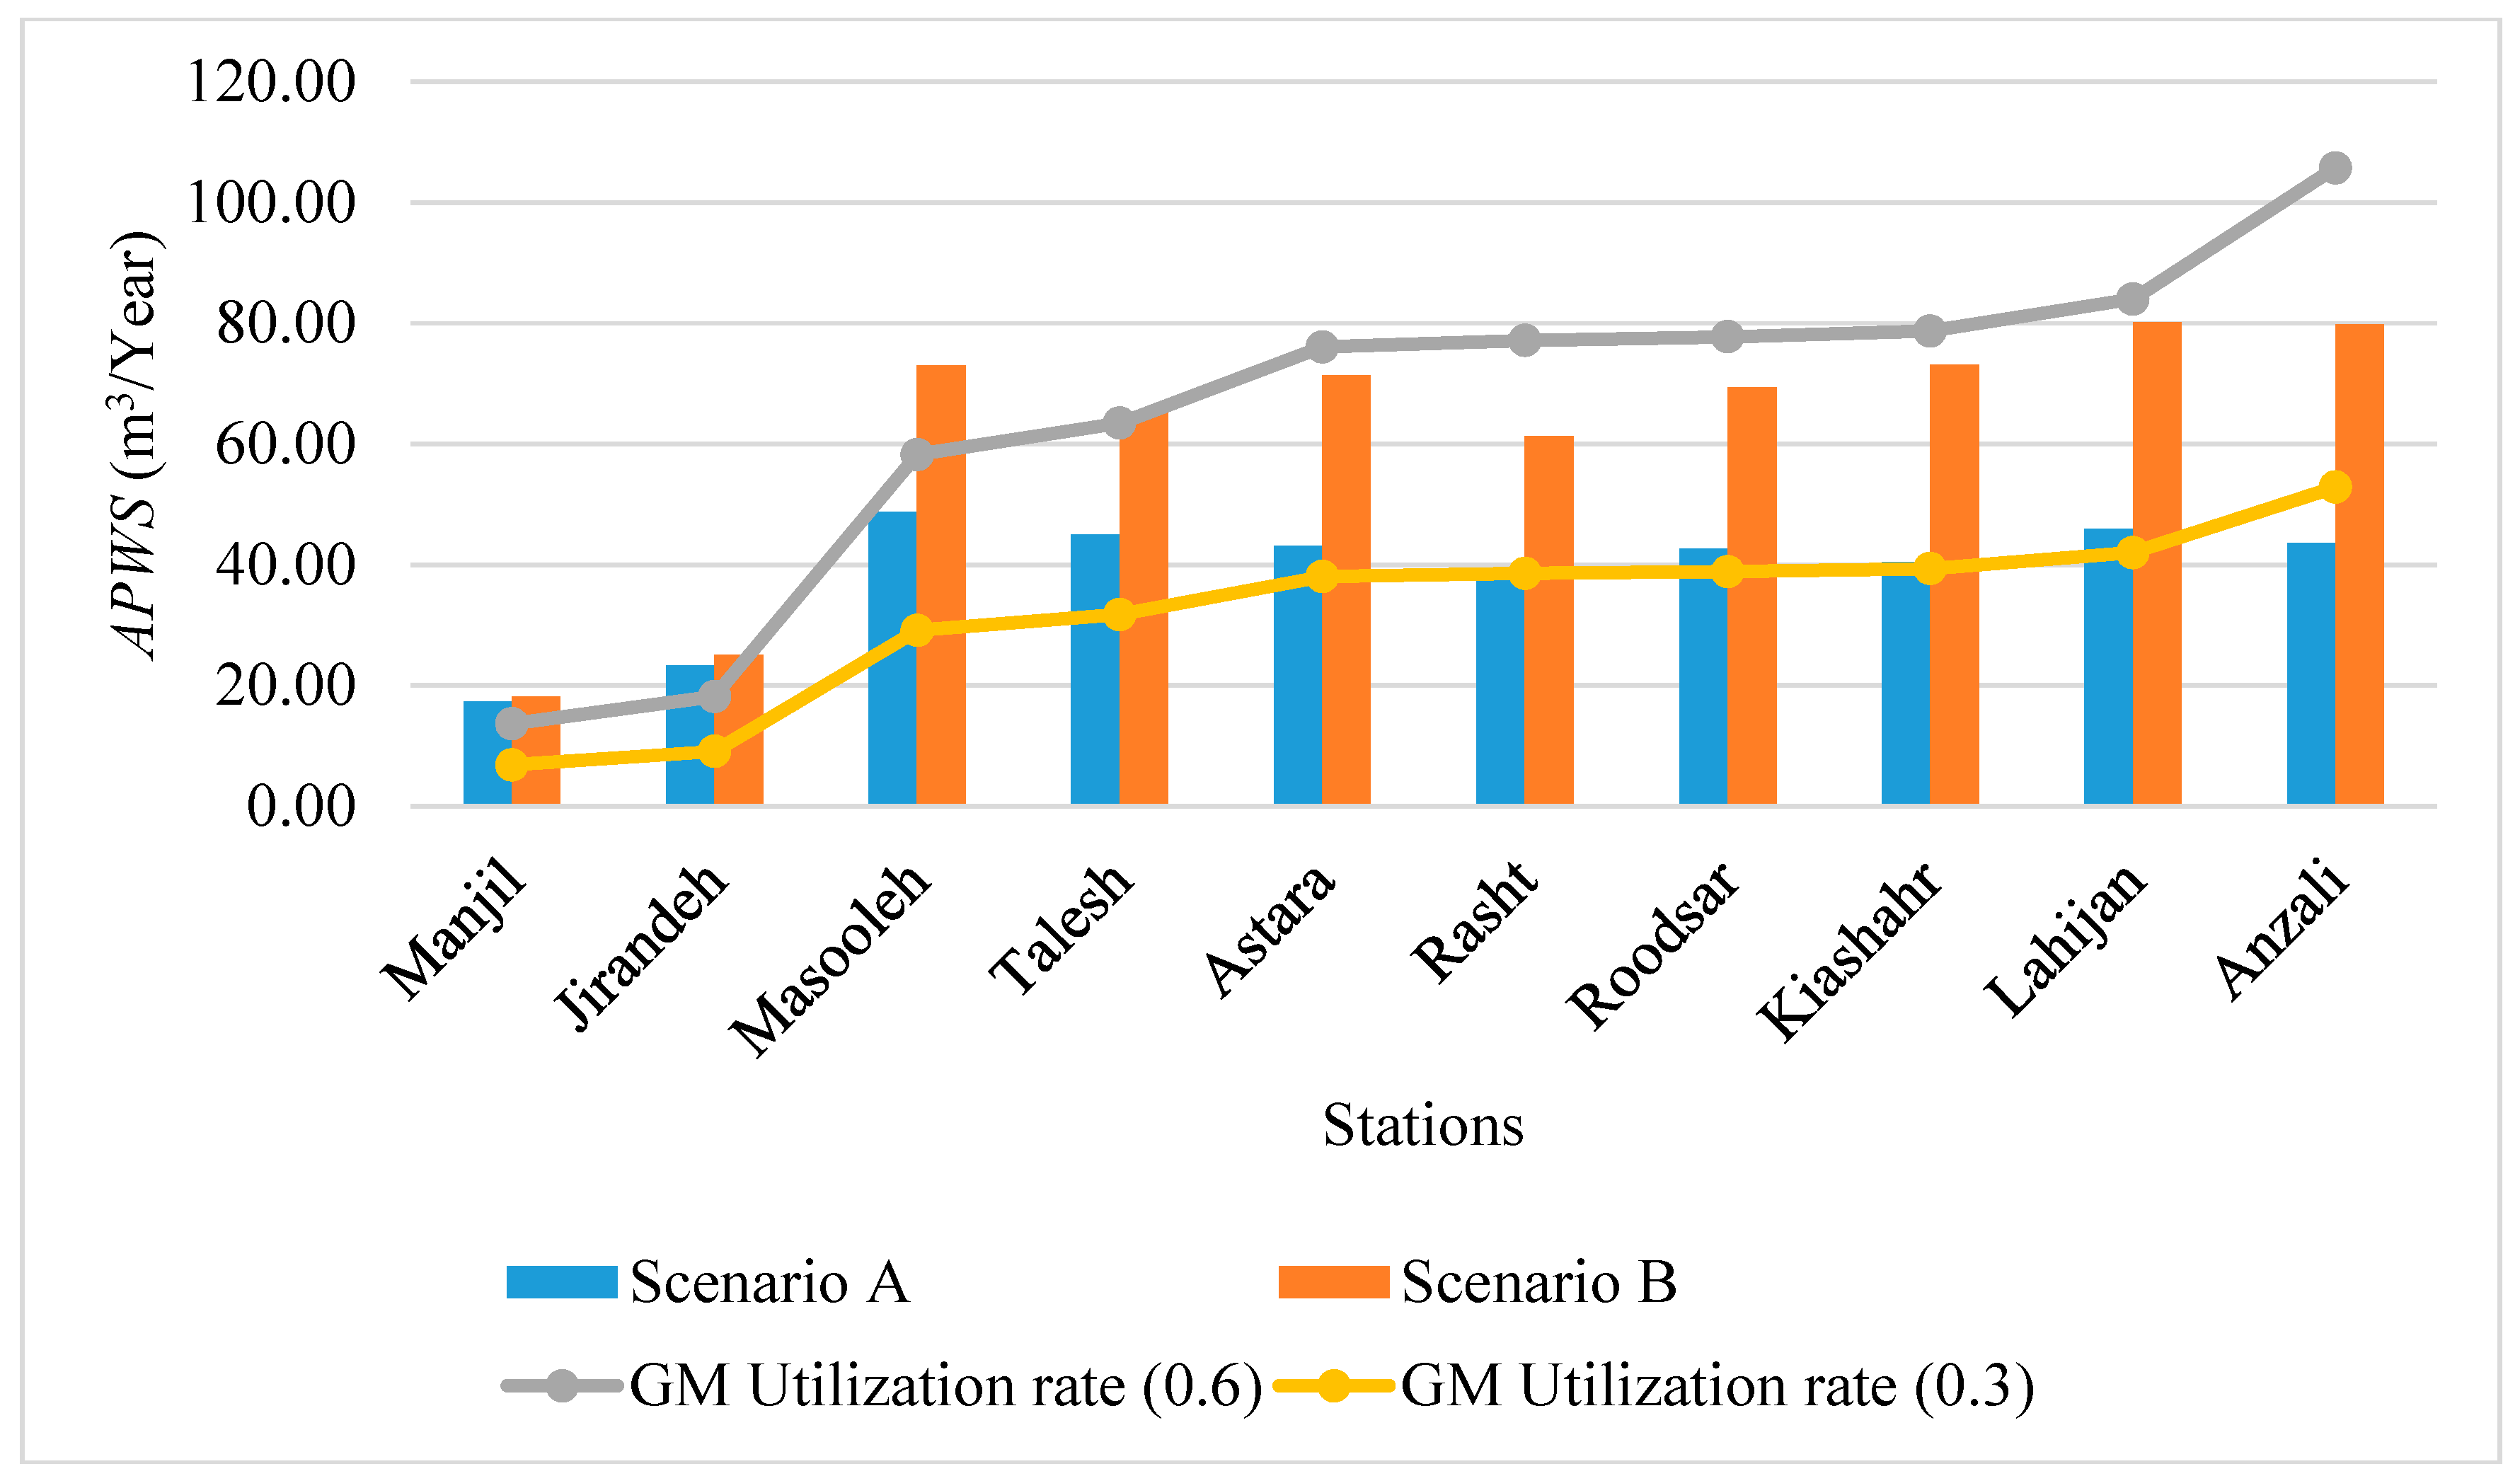
Several researchers have adopted the generalized method that simply applies a constant utilization rate to the average annual or monthly rainfall data for predicting the potential of rainwater harvesting [47,48]. Figure 8 clearly shows the inconsistency of the APWS (tank size 3 m3) based on the simulation and the predicted rainwater harvesting potential using the generalized method of all stations. The hydraulic performances of all scenario B simulations are better than those of scenario A. However, the difference between both scenarios is less in drier areas. It is also important to note that the APWS of the station with a higher average annual rainfall, e.g., Roodsar, may be even less than that of a station with a lower average annual rainfall, e.g., Masooleh. Such discrepancies occurred due to the differences in rainfall patterns. For example, despite similar average annual rainfall, the RWHSs in areas with an uneven temporal distribution of rainfall tended to be less efficient because excess rainwater in a single rainfall event eventually overflows, leading to less efficiency in RWHSs. Moreover, the APWS of drier areas tends to be underestimated in the generalized method and overestimated in areas with higher rainfall. Therefore, the DSS using both hydraulic simulation and spatial technology can enhance the information value and support further economic analysis.
3.2. Results of Economic Analysis
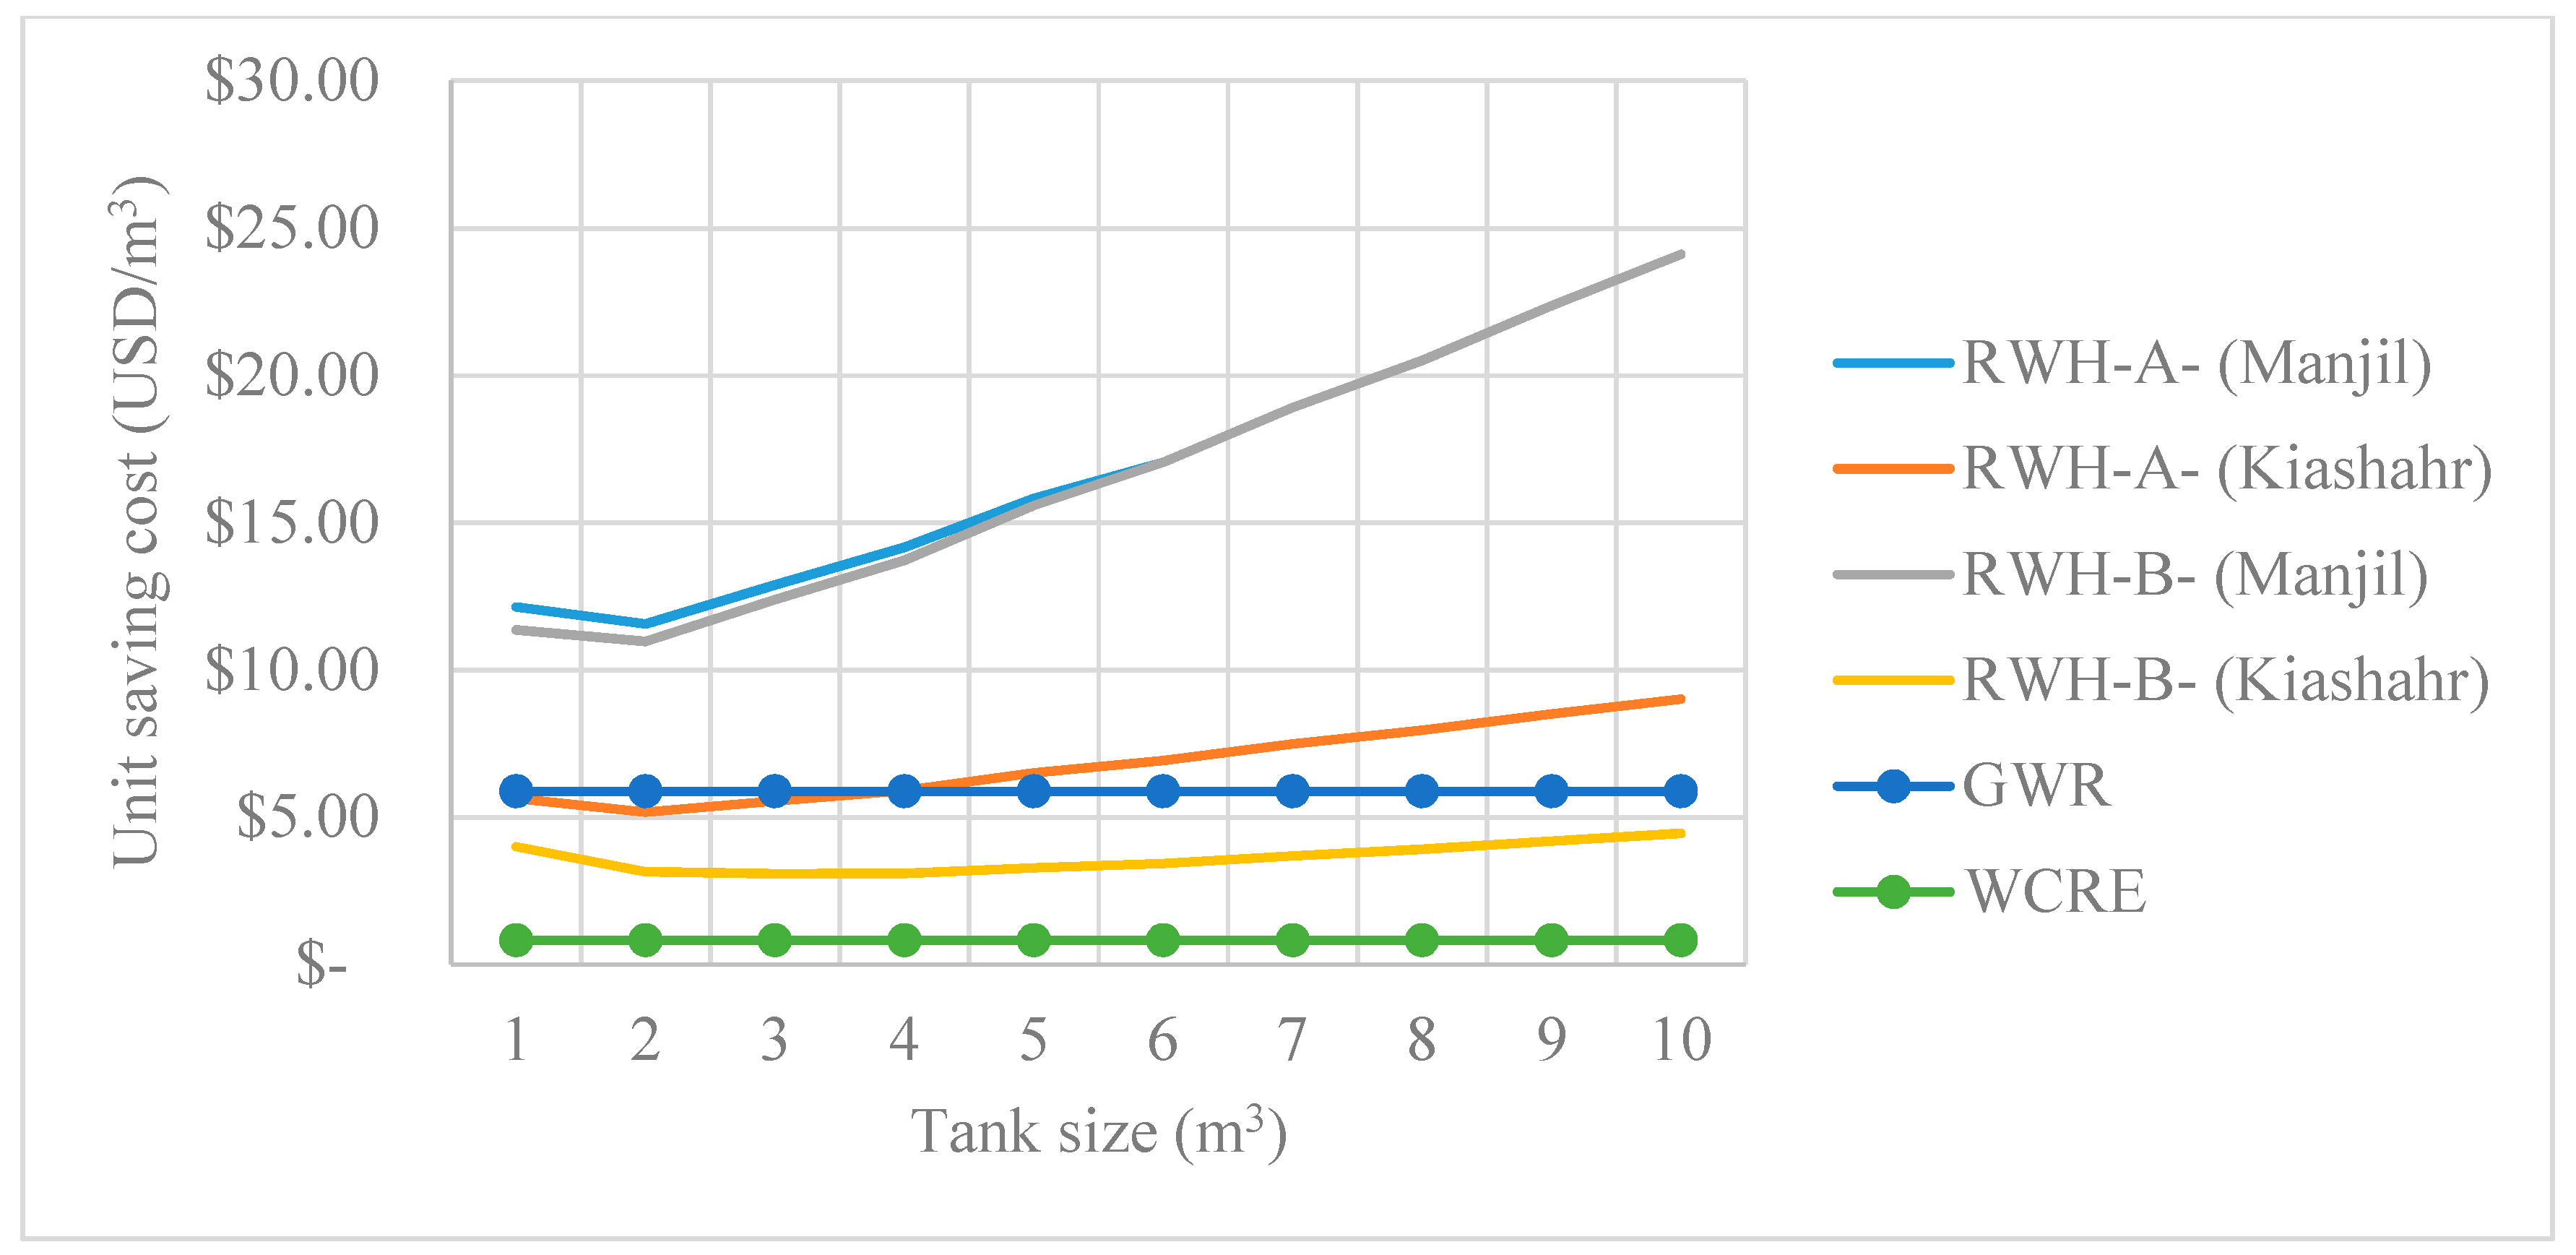
Based on Equations (4) and (6), and the assumption in Table 3, the USC of RWHSs has been calculated. Figure 9 shows the USC of 2 stations with the highest and lowest average annual rainfall, e.g., Manjil and Kiashahr, in Scenarios A and B and that of WCRC and GWR. An economic approach is often used to determine the optimal tank size [49]. This figure allows decision makers to choose an optimal tank design based on the lowest USC.
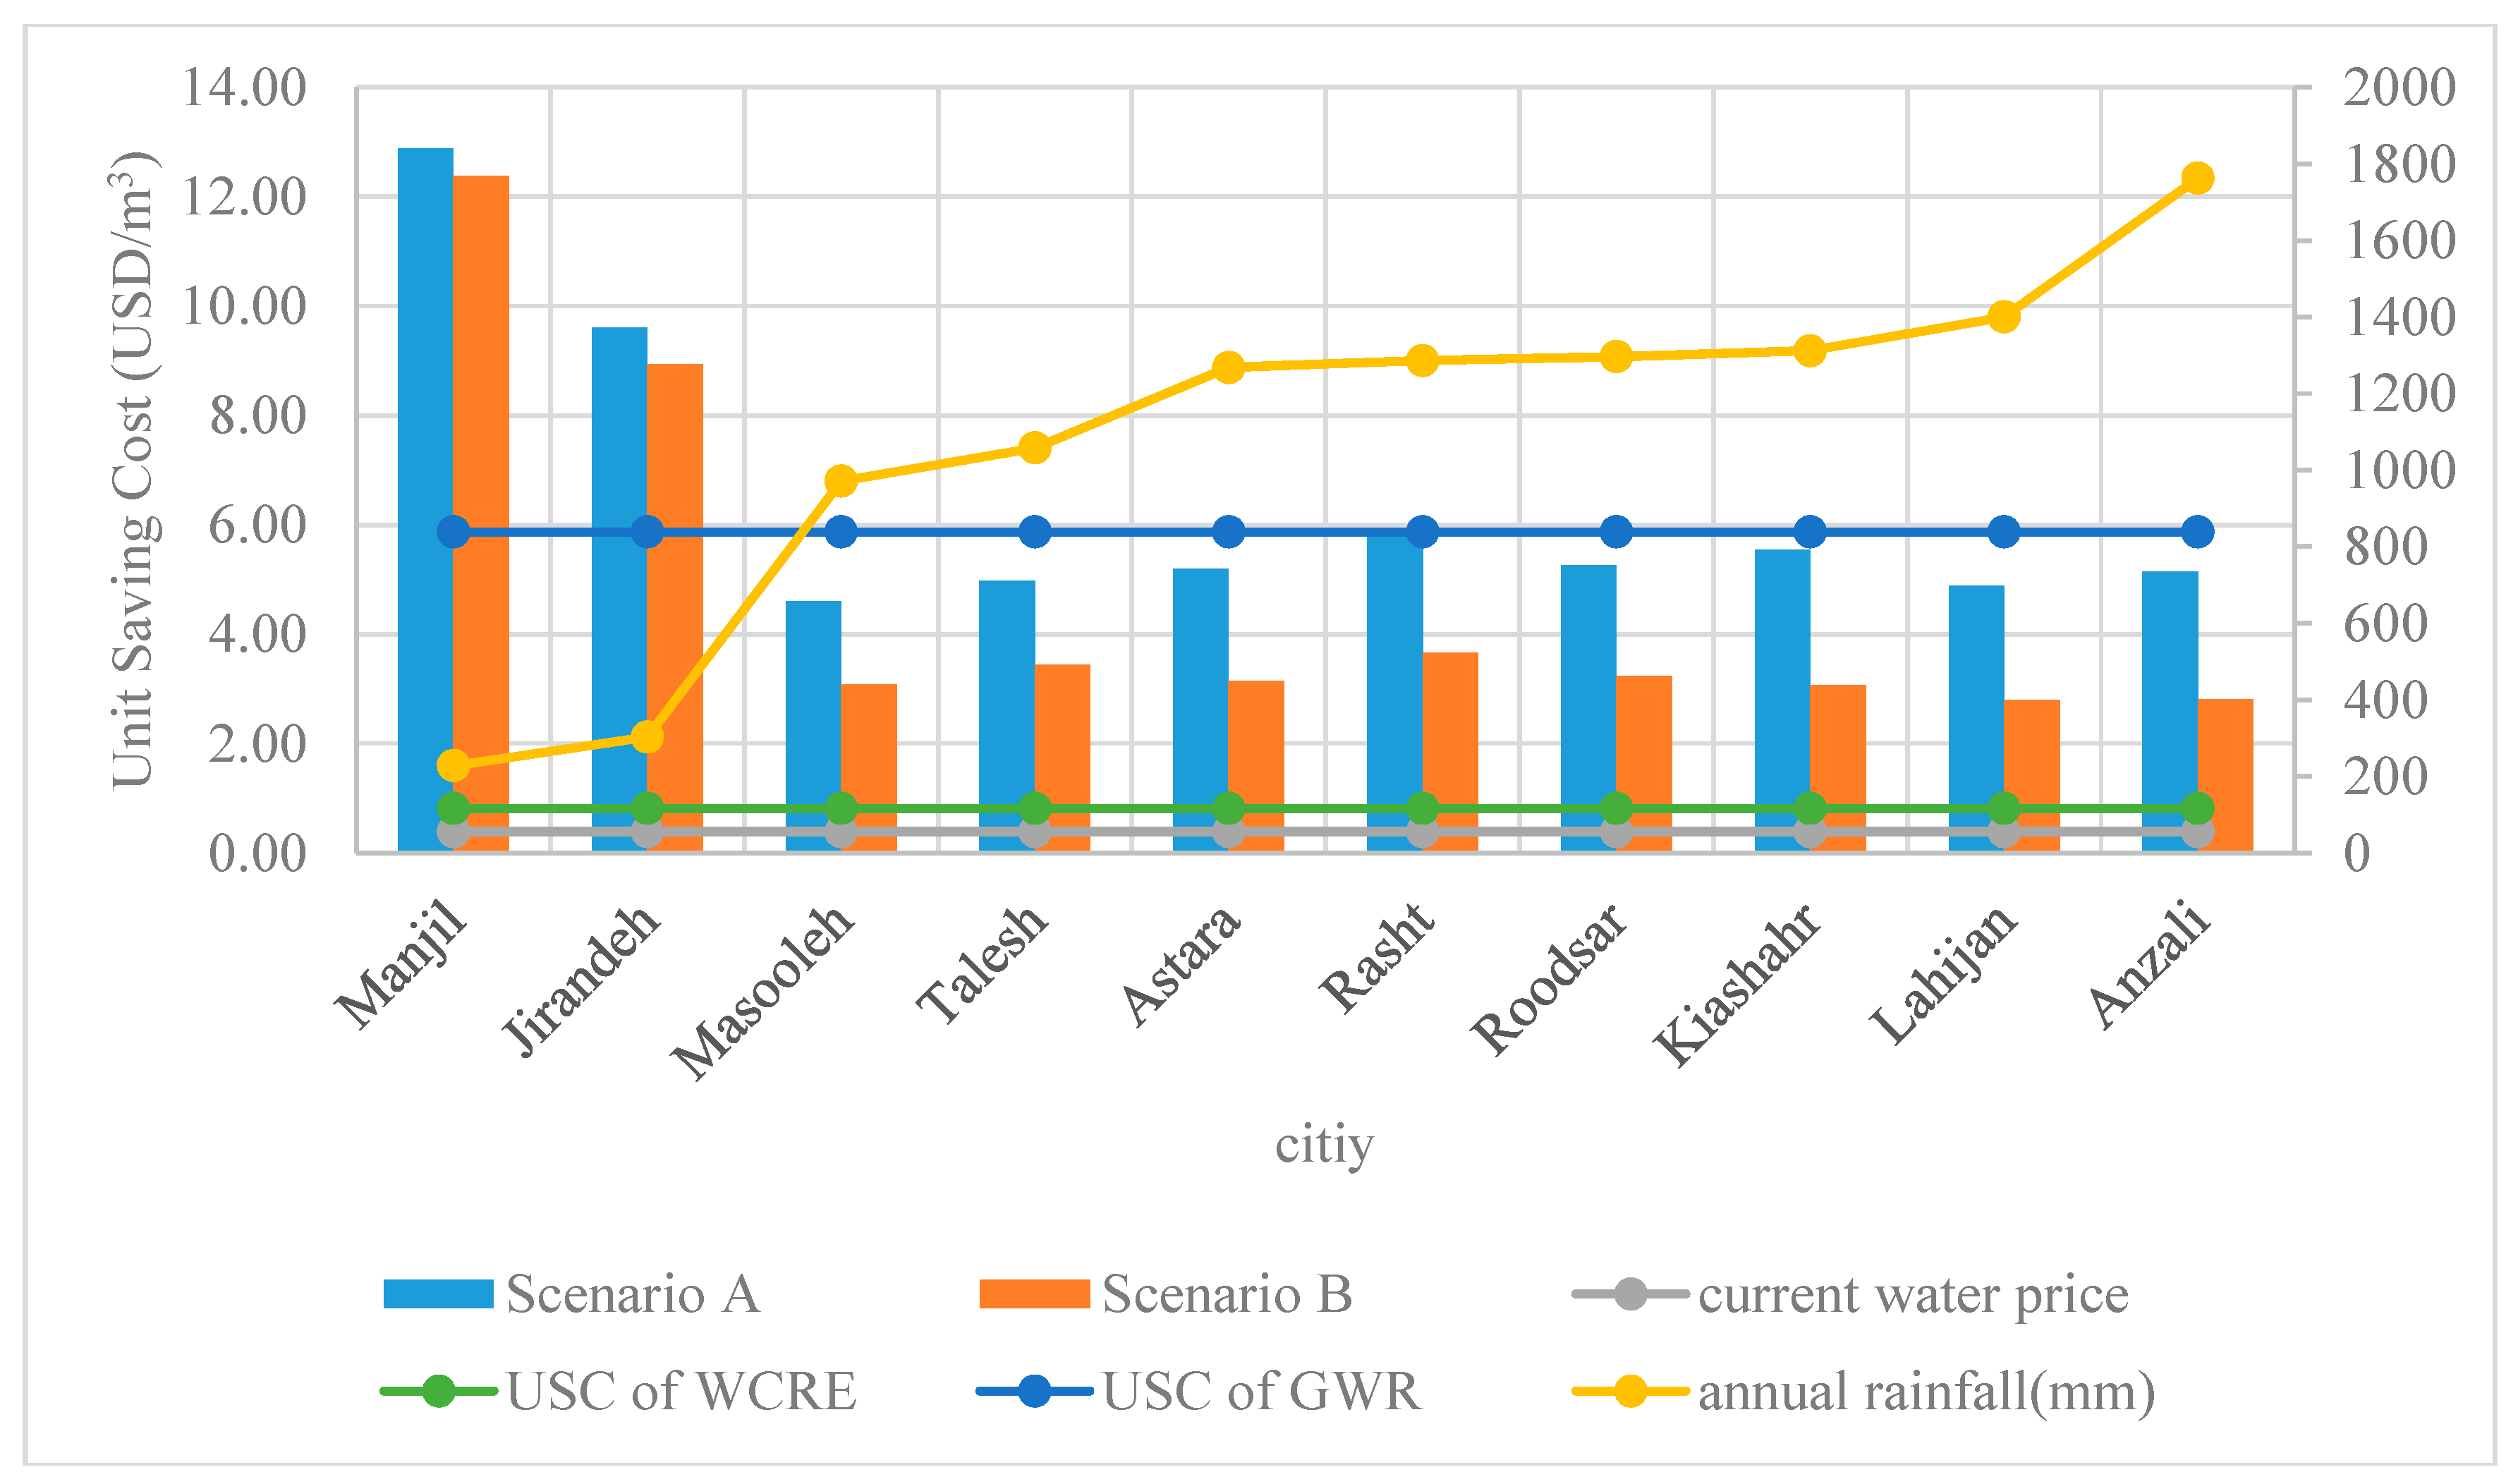
Using the concept of lowest USC in Figure 9, this research suggests a set of optimal tank sizes for all stations and thereby demonstrates the associated USC in Scenarios A and B, together with that of WCRE, GWR, and the current municipal water price, as shown in Figure 10. Obviously, the current municipal water price, $0.39 (USD $/m3), is low, making all the water-saving methods economically unfeasible. Acknowledging the water pricing policy as a useful tool for facilitating the water-saving scheme, the Iranian government set to adopt a more flexible water pricing policy [17,50]. Figure 10 also supports the decision making to modify tariffs.
For individual users, with the USC information, i.e., cost-effectiveness, of all the water-saving methods, Figure 10 further allows decision makers to assign priority among the RWHSs in scenario A, scenario B, WCRE, and GWR. However, the social and environmental aspects should not be neglected, especially in terms of the large-scale water-saving scheme.
3.3. Results of MCDM and Associated Spatial Interpolation
Seven criteria, including technical, economic, and socioenvironmental criteria, were selected for multiple decision making to understand the priority of the water-saving methods for implementation and promotion. Table 3 shows the alternatives, criteria and their values in the frame of a decision matrix. It is noted that social and environmental criteria scores can be assigned by discussions and consultations with experienced people, from information collected in the literature and field surveys, and from discussions with stakeholders and experts [15]. The technical and economic values in Table 3 are obtained by simulation and economic analysis. Additionally, the numerical expression and scaling of comparative importance is achieved by a 5-point scaling to rate the qualitative criteria [51].
Table 4 lists the results of MCDM, which can be classified into 3 types. Among them, WCRE is always the first priority in all types. It can be understood in the MCDM procedure that the economic factor is the most important and decisive factor. Next, priorities change among the three systems: GWR, RWH(B) and RWH(A). Regarding Manjil and Jirandeh, the most arid areas, the result is also due to the impact of the economic factor being higher than that in the others. As a result, the second priority after WCRE is GWR. Additionally, the factor that has the most weight after the economic factor is the technical factors, e.g., the APWS. Because Manjil and Jirandeh are in the dry area and there is less rainfall in these areas, the difference in APWS from systems A and B is negligible. Consequently, the superiority of the RWH(B) is technically neutral. The priority of B increases. The opposite is seen in rainy areas, e.g., Anzali; the economic factor is more effective than that in the others. However, because the difference in APWS for RWH-A and RWH-B is high, and in terms of socio-environmental factors, the RWH-B is better; thus, prioritizing this result is what is shown in Table 4. Because the weights of the technical and social-environmental factors are equal, their impacts are the same, and if the option is economically superior, the option is ranked as having a higher priority.
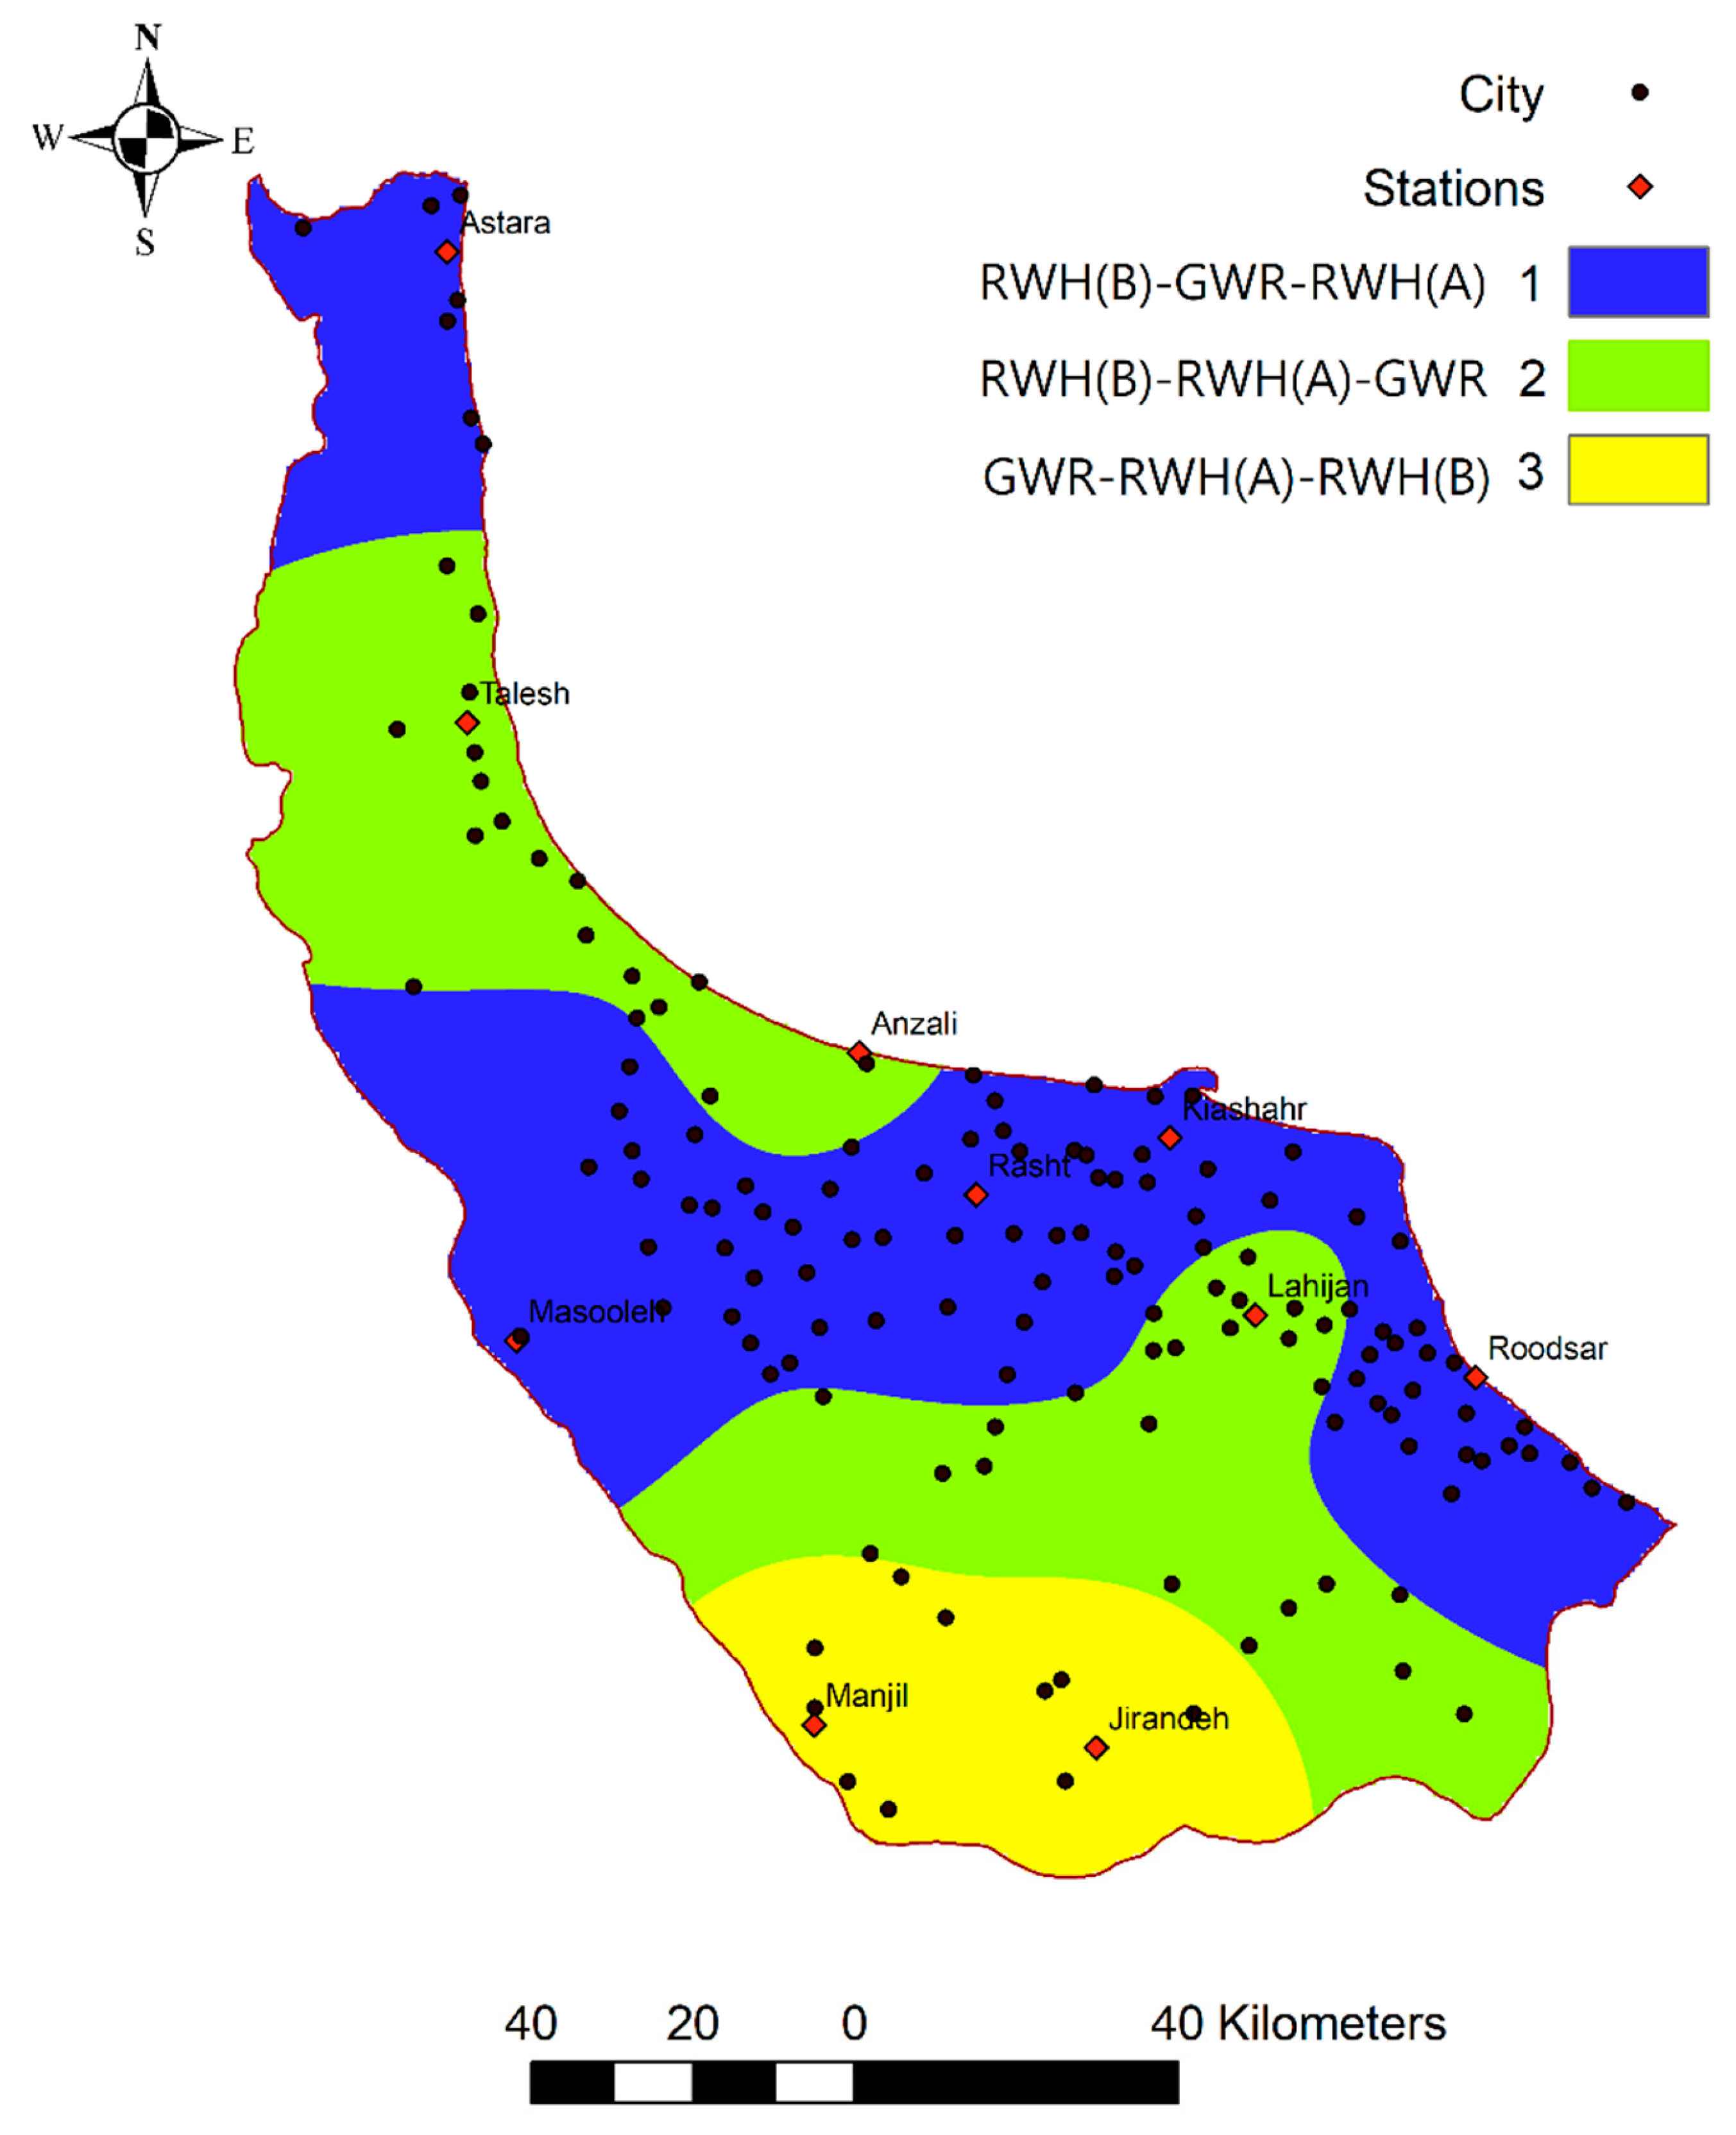
Figure 11 further illustrates the spatial distribution of three priority types in Guilan Province, informing citizens to take proper water-saving approaches and allowing policy makers to promote large-scale water-saving schemes.
The accuracy of the interpolation in this DSS is partially limited to the total number of rainfall stations and the associated spatial distribution in the study area. The advantage in this DSS is that the data bank allows future expansion, and the accuracy will thereby be enhanced as the Iran government increases the number of rainfall stations.
4. Conclusions
Urban water stress has severely challenged the development of human society, particularly in developing countries such as Iran. Potable water-saving methods, e.g., RWHSs, GWR, and WCRE, should be wisely adopted in Iran to address such a water crisis. In this paper, the spatial-temporal complexity of rainfall, the economic performance, and the social and environmental aspects of water-saving methods have been incorporated for large-scale applications. This study has demonstrated the utility of GIS-simulation-based DSS in Guilan Province. The hydraulic performance of RWHSs was obtained and further mapped. The LCCA was performed to compare the USC of all the water-saving methods. Apart from economic factors, the MCDM also adopted social and environmental factors to prioritize water-saving methods in large-scale applications. Compared with the traditional generalized method, the sensitivity analysis has identified that the information value of DSS has been enhanced. Such a DSS also provides a straightforward and simple approach to understanding the water-saving scheme and therefore offers the potential for public participation. For further research, the climate change issue can be added in the hydraulic simulation. The web-based interface of this DSS can be further refined to be more end-user friendly before opening it to the public. Consequently, this DSS is a useful tool and helpful on a large-scale water-saving scheme and can be used to ease the worsening of water stress.
Author Contributions
Y.-R.C.: Conceptualization, Project supervision, Methodology, Visualization, Validation, Writing, Review; K.A.: Conceptualization, Project administration, Formal analysis, Investigation, Methodology, Software, Writing original draft; B.M.: Data curation, Validation, Review & editing. All authors have read and agreed to the published version of the manuscript.
Funding
This research is partially founded by Tzu-Chi University’s Research Supporting Project.
Conflicts of Interest
The authors declare no conflicts of interest.
Appendix A
Weighting and ranking formulation is explained as follows, and the results are explained as follows:
(a) Weighting criteria.
Step 1: The decision matrix is normalized by Equation (A1).
where demonstrates the normalized value of the decision matrix of alternative in the attribute .
Step 2: The degree of entropy is determined using Equation (A2).
Step 3: The entropy weight (W).
In the first stage, the deviation rate of the degree of entropy is computed by Equation (A3).
Then, the entropy weights are obtained by using Equation (A4).
Continue procedure by using the CILOS method:
Step 4: The square matrix.
Equation (A5) is used to make the negative attributes of the decision matrix positive:
Then, the square matrix values are determined according to Equation (A6):
where specifies the maximum values of the criteria, which are taken from the decision matrix with rows to form a square matrix, and the row of the square matrix contains the elements of row of the decision matrix. It should be noted that some rows in the square matrix can be the same as those in the decision matrix; if the highest values of different criteria are in the same row, they belong to the same alternative.
Step 5: Determine the relative impact loss matrix.
where represents the relative impact loss of the attribute, if selected as the best value.
Step 6: The weight system matrix:
Step 7: Find the criterion impact loss weight (CILoS weights); the weights of criteria are determined when Equation (A9) is solved:.
Step 8: Calculate the aggregate weight :
(b) Ranking water-saving schemes as alternatives.
Step 1: Construct the normalized decision matrix:
Step 2: Construct the weighted normalized decision matrix:
Step 3: Determine the ideal and negative-ideal solutions:
Step 4: Calculate the separation measures:
Step 5: Calculate the relative closeness to the ideal solution:
References
- Christian Amos, C.; Rahman, A.; Mwangi Gathenya, J. Economic analysis and feasibility of rainwater harvesting systems in urban and peri-urban environments: A review of the global situation with a special focus on Australia and Kenya. Water 2016, 8, 149. [Google Scholar] [CrossRef]
- Moniruzzaman, M.; Imteaz, M.A. Generalized equations, climatic and spatial variabilities of potential rainwater savings: A case study for Sydney. Resour. Conserv. Recycl. 2017, 125, 139–156. [Google Scholar] [CrossRef]
- Imteaz, M.A.; Moniruzzaman, M. Spatial variability of reasonable government rebates for rainwater tank installations: A case study for Sydney. Resour. Conserv. Recycl. 2018, 133, 112–119. [Google Scholar] [CrossRef]
- Leong, J.Y.C.; Chong, M.N.; Poh, P.E.; Hermawan, A.; Talei, A. Longitudinal assessment of rainwater quality under tropical climatic conditions in enabling effective rainwater harvesting and reuse schemes. J. Clean. Prod. 2017, 143, 64–75. [Google Scholar] [CrossRef]
- Leong, J.Y.C.; Oh, K.S.; Poh, P.E.; Chong, M.N. Prospects of hybrid rainwater-greywater decentralised system for water recycling and reuse: A review. J. Clean. Prod. 2017, 142, 3014–3027. [Google Scholar] [CrossRef]
- Nguyen, D.C.; Han, M.Y. Proposal of simple and reasonable method for design of rainwater harvesting system from limited rainfall data. Resour. Conserv. Recycl. 2017, 126, 219–227. [Google Scholar] [CrossRef]
- Silva, C.M.; Sousa, V.; Carvalho, N.V. Evaluation of rainwater harvesting in Portugal: Application to single-family residences. Resour. Conserv. Recycl. 2015, 94, 21–34. [Google Scholar] [CrossRef]
- Li, Y.; Ye, Q.; Liu, A.; Meng, F.; Zhang, W.; Xiong, W.; Wang, P.; Wang, C. Seeking urbanization security and sustainability: Multi-objective optimization of rainwater harvesting systems in China. J. Hydrol. 2017, 550, 42–53. [Google Scholar] [CrossRef]
- Ghisi, E.; Cardoso, K.A.; Rupp, R.F. Short-term versus long-term rainfall time series in the assessment of potable water savings by using rainwater in houses. J. Environ. Manag. 2012, 100, 109–119. [Google Scholar] [CrossRef]
- Campisano, A.; Butler, D.; Ward, S.; Burns, M.J.; Friedler, E.; DeBusk, K.; Fisher-Jeffes, L.N.; Ghisi, E.; Rahman, A.; Furumai, H.; et al. Urban rainwater harvesting systems: Research, implementation and future perspectives. Water Res. 2017, 115, 195–209. [Google Scholar] [CrossRef]
- Fonseca, C.R.; Hidalgo, V.; Díaz-Delgado, C.; Vilchis-Francés, A.Y.; Gallego, I. Design of optimal tank size for rainwater harvesting systems through use of a web application and geo-referenced rainfall patterns. J. Clean. Prod. 2017, 145, 323–335. [Google Scholar] [CrossRef]
- Nachshon, U.; Netzer, L.; Livshitz, Y. Land cover properties and rain water harvesting in urban environments. Sustain. Cities Soc. 2016, 27, 398–406. [Google Scholar] [CrossRef]
- Gwenzi, W.; Dunjana, N.; Pisa, C.; Tauro, T.; Nyamadzawo, G. Water quality and public health risks associated with roof rainwater harvesting systems for potable supply: Review and perspectives. Sustain. Water Qual. Ecol. 2015, 6, 107–118. [Google Scholar] [CrossRef]
- Amos, C.C.; Rahman, A.; Karim, F.; Gathenya, J.M. A scoping review of roof harvested rainwater usage in urban agriculture: Australia and Kenya in focus. J. Clean. Prod. 2018, 202, 174–190. [Google Scholar] [CrossRef]
- Adham, A.; Riksen, M.; Ouessar, M.; Ritsema, C. A methodology to assess and evaluate rainwater harvesting techniques in (semi-) arid regions. Water 2016, 8, 198. [Google Scholar] [CrossRef]
- Madani, K.; AghaKouchak, A.; Mirchi, A. Iran’s socio-economic drought: challenges of a water-bankrupt nation. Iran. Stud. 2016, 49, 997–1016. [Google Scholar] [CrossRef]
- Mohsen, B. Mesgaran, Pooya Azadi, A National Adaptation Plan for Water Scarcity in Iran, Working Paper 6, Stanford Iran 2040 Project; Stanford university: Stanford, CA, USA, August 2018. [Google Scholar]
- Castonguay, A.C.; Urich, C.; Iftekhar, M.S.; Deletic, A. Modelling urban water management transitions: A case of rainwater harvesting. Environ. Model. Softw. 2018, 105, 270–285. [Google Scholar] [CrossRef]
- Examin the Latest State of Drinking Water in Different Aspects. 2018. Available online: http://www.WaterCM.ir (accessed on 19 September 2019). (In Persian).
- Lee, K.E.; Mokhtar, M.; Mohd Hanafiah, M.; Abdul Halim, A.; Badusah, J. Rainwater harvesting as an alternative water resource in Malaysia: Potential, policies and development. J. Clean. Prod. 2016, 126, 218–222. [Google Scholar] [CrossRef]
- Chiu, Y.-R.; Liaw, C.-H. Designing rainwater harvesting systems for large-scale potable water saving using spatial information system. In International Conference on Computer Supported Cooperative Work in Design; Springer: Berlin/Heidelberg, Germany, 2008; pp. 653–663. [Google Scholar]
- Marinoski, A.K.; Rupp, R.F.; Ghisi, E. Environmental benefit analysis of strategies for potable water savings in residential buildings. J. Environ. Manag. 2018, 206, 28–39. [Google Scholar] [CrossRef]
- Kosovac, A.; Hurlimann, A.; Davidson, B. Water Experts’ Perception of Risk for New and Unfamiliar Water Projects. Water 2017, 9, 976. [Google Scholar] [CrossRef] [Green Version]
- Martin, E.A.; Buchberger, S.G.; Chakraborty, D. Reliability of harvested rainfall as an auxiliary source of non-potable water. Procedia Eng. 2015, 119, 1119–1128. [Google Scholar] [CrossRef] [Green Version]
- Okoye, C.O.; Solyalı, O.; Akıntuğ, B. Optimal sizing of storage tanks in domestic rainwater harvesting systems: A linear programming approach. Resour. Conserv. Recycl. 2015, 104, 131–140. [Google Scholar] [CrossRef]
- Ghisi, E. Parameters Influencing the sizing of rainwater tanks for use in houses. Water Resour. Manag. 2010, 24, 2381–2403. [Google Scholar] [CrossRef]
- Liaw, C.-H.; Chiang, Y.-C. Dimensionless analysis for designing domestic rainwater harvesting systems at the regional level in northern taiwan. Water 2014, 6, 3913–3933. [Google Scholar] [CrossRef] [Green Version]
- Ward, S.; Memon, F.A.; Butler, D. Rainwater harvesting: Model-based design evaluation. Water Sci. Technol. 2010, 61, 85–96. [Google Scholar] [CrossRef] [PubMed]
- Chiu, Y.-R.; Tsai, Y.-L.; Chiang, Y.-C. Designing rainwater harvesting systems cost-effectively in a urban water-energy saving scheme by using a gis-simulation based design system. Water 2015, 7, 6285–6300. [Google Scholar] [CrossRef] [Green Version]
- Dumit Gómez, Y.; Teixeira, L.G. Residential rainwater harvesting: Effects of incentive policies and water consumption over economic feasibility. Resour. Conserv. Recycl. 2017, 127, 56–67. [Google Scholar] [CrossRef]
- Bashar, M.Z.I.; Karim, M.R.; Imteaz, M.A. Reliability and economic analysis of urban rainwater harvesting: A comparative study within six major cities of Bangladesh. Resour. Conserv. Recycl. 2018, 133, 146–154. [Google Scholar] [CrossRef]
- Jing, X.; Zhang, S.; Zhang, J.; Wang, Y.; Wang, Y. Assessing efficiency and economic viability of rainwater harvesting systems for meeting non-potable water demands in four climatic zones of China. Resour. Conserv. Recycl. 2017, 126, 74–85. [Google Scholar] [CrossRef]
- Liaw, C.-H.; Tsai, Y.-L.; Cheng, M.-S. Assessing flood mitigation alternatives in Shijr area in metropolitan Taipei. J. Am. Water Resour. Assoc. 2006, 42, 311–322. [Google Scholar] [CrossRef]
- Tsai, Y.-L.; Chiu, Y.-R. Urban storm runoff utilization strategy and volume analysis in multi-purpose rainwater detention-retention systems. Shuikexue Jinzhan/Adv. Water Sci. 2012, 23, 341–345. [Google Scholar]
- Yang, X.; Xie, X.; Liu, D.L.; Ji, F.; Wang, L. Spatial interpolation of daily rainfall data for local climate impact assessment over greater sydney region. Adv. Meteorol. 2015, 2015, 1–12. [Google Scholar] [CrossRef] [Green Version]
- Hargreaves, A.J.; Farmani, R.; Ward, S.; Butler, D. Modelling the future impacts of urban spatial planning on the viability of alternative water supply. Water Res. 2019, 162, 200–213. [Google Scholar] [CrossRef] [PubMed]
- DeOreo, W.B.; Mayer, P.W.; Dziegielewski, B.; Kiefer, J.C. Residential End Uses of Water, Version 2, Executive Report; Water Research Foundation: Alexandria, VA, USA, April 2016. for more information about this project, please visit www.waterrf.org/4309.
- Danescu, T.; Chira, A. Professional Judgment and Reticence to Apply Sampling Techniques. Procedia Econ. Financ. 2014, 15, 1253–1258. [Google Scholar] [CrossRef] [Green Version]
- Statistical Center of Iran, the Results of the Survey of Expenditure and Household Income Statistics. 2018. Available online: https://www.amar.org.ir/ (accessed on 12 November 2019).
- Younesloo, S. Research Project Guideline to Using Graywater for Non-Drinking Uses; Ministry of Road & Urban Development; Road, Housing & Urban Development Research Center: Tehran, Iran, 2017; Additional information: http://pub.bhrc.ac.ir.
- Leong, J.Y.C.; Chong, M.N.; Poh, P.E.; Vieritz, A.; Talei, A.; Chow, M.F. Quantification of mains water savings from decentralised rainwater, greywater, and hybrid rainwater-greywater systems in tropical climatic conditions. J. Clean. Prod. 2018, 176, 946–958. [Google Scholar] [CrossRef]
- Sepehri, M.; Malekinezhad, H.; Ilderomi, A.R.; Talebi, A.; Hosseini, S.Z. Studying the effect of rain water harvesting from roof surfaces on runoff and household consumption reduction. Sustain. Cities Soc. 2018, 43, 317–324. [Google Scholar] [CrossRef]
- Pavolová, H.; Bakalár, T.; Kudelas, D.; Puškárová, P. Environmental and economic assessment of rainwater application in households. J. Clean. Prod. 2019, 209, 1119–1125. [Google Scholar] [CrossRef]
- Alinezhad, A.; Khalili, J. New Methods and Applications in Multiple Attribute Decision Making (Madm); International Series in Operations Research Management Science; Springer International Publishing: Cham, Switzerland, 2019; Volume 277, ISBN 978-3-030-15008-2; ISBN 978-3-030-15009-9. [Google Scholar]
- Zavadskas, E.K.; Podvezko, V. Integrated determination of objective criteria weights in MCDM. Int. J. Inf. Technol. Decis. Mak. 2016, 15, 267–283. [Google Scholar] [CrossRef]
- Olson, D.L. Comparison of weights in TOPSIS models. Math. Comput. Model. 2004, 40, 721–727. [Google Scholar] [CrossRef]
- Lani, N.H.M.; Syafiuddin, A.; Yusop, Z.; binti Adam, U.; bin Mat Amin, M.Z. Performance of small and large scales rainwater harvesting systems in commercial buildings under different reliability and future water tariff scenarios. Sci. Total Environ. 2018, 636, 1171–1179. [Google Scholar] [CrossRef] [PubMed]
- López Zavala, M.Á.; Vega, R.C.; Miranda, R.A.L. Potential of rainwater harvesting and greywater reuse for water consumption reduction and wastewater minimization. Water 2016, 8, 264. [Google Scholar] [CrossRef] [Green Version]
- Vargas, D.; Dominguez, I.; Ward, S.; Oviedo-Ocaña, E.R. Assisting global rainwater harvesting practitioners: A decision support tool for tank sizing method selection under uncertainty. Environ. Sci. Water Res. Technol. 2019, 5, 506–520. [Google Scholar] [CrossRef]
- Water consumption Management Guide; National water & wastewater Engineering company of Iran. 2009. Available online: http://www.WaterCM.ir (accessed on 4 November 2019). (In Persian).
- Saaty, T.L. How to make a decision: The analytic hierarchy process. Eur. J. Oper. Res. 1990, 48, 9–26. [Google Scholar] [CrossRef]
Figure 1.
The conceptual framework of DSS for the water-saving scheme.

Figure 2.
Rainfall stations and cities in the study area.

Figure 3.
(1) RHWS of Scenario A, integrated with WCRE and GWR; (2) RHWS of Scenario B with filter integrated with WCRE and GWR.
Figure 3.
(1) RHWS of Scenario A, integrated with WCRE and GWR; (2) RHWS of Scenario B with filter integrated with WCRE and GWR.

Figure 4.
The relation between tank size and APWS for all stations (Scenario A).

Figure 5.
The relation between tank size and APWS for all stations (Scenario B).

Figure 6.
The spatial distribution of the RR (tank size 3 m3) in Scenario A.

Figure 7.
The spatial distribution of the RR (tank size 3 m3) in Scenario B.

Figure 8.
Comparison of APWS in scenarios A and B of tank size 3 m3 and the generalized method.

Figure 9.
The USC of two stations, Manjil and Kiashahr, with Scenarios A and B and that of WCRC and GWR.
Figure 9.
The USC of two stations, Manjil and Kiashahr, with Scenarios A and B and that of WCRC and GWR.

Figure 10.
The unit saving cost of all stations using the optimal tank size.

Figure 11.
Distribution of water-saving plans based on MCDM.


Table 1.
Status of the province’s water and population resources.
| Area (km2) | County | Households | Population | Average Annual Precipitation (mm) | Renewable Water Volume (BCM *) | Average Available Fresh Water per Capita (m3) | |
|---|---|---|---|---|---|---|---|
| Guilan Province | 14,041 | 16 | 777,684 | 2,530,696 | 1061 | 9.2 | 2776 |
| Iran | 1,648,195 | - | - | 83,332,671 | 250 | 130 | 1659 |
| World | 510,072,000 | - | - | 7.65 billion | 750 | 36,100 | 5932 |
* Billion cubic meters.
Table 2.
Determinant values in economic analysis in this paper.
| Exchange Rate | Interest Rate | Inflation Rate | Annual Water and Electricity Inflation * | Water Price ($) | Electricity Price ($) | Life Cycle (Years) |
|---|---|---|---|---|---|---|
| 1 USD$ = 42,000 IRR | 15% | 10% | 7% | 0.39 | 0.02 | 25 |
| Initial cost | Including preparation and installation of a typical domestic rainwater harvesting system: Water catchment, Water transfer, Water storage, Water purification, End use | |||||
| Maintenance | Scenario A: 5% of initial cost due to periodic cleaning and services Scenario B: 10% of initial cost due to monthly and seasonal maintenance and cleaning tank and pipes and changing purification components such as filters | |||||
| Operation | Pump type, Hours per day, Annual electricity consumption, Scenario A, Scenario B | |||||
* The government has ordered a 7% increase in the price of potable water and electricity. Additionally, with the aim of managing the consumption and unnecessary expenses, 16% is added to the annual net utility bills of subscribers above the consumption pattern. According to the legislation, the price of utilities for low-consumption subscribers will increase by 7% and by 23% for high-consumption subscribers. In addition, households with consumption below the consumption pattern will be subject to a reduced bill. These increases are conditional on not exceeding the price change in the relevant year.
Table 3.
Different water-saving methods and criteria values (decision matrix).
| APWS1 | AAS2 | Initial Cost 3 | BCR 4 | Supported by 5 Government | Social Benefits 6 | Environmental 7 Benefits | |
|---|---|---|---|---|---|---|---|
| RWH-A | * | * | * | * | 3 | 5 | 3 |
| RWH-B | * | * | * | * | 3 | 5 | 5 |
| GWR | 47.1 | $18.37 | $1040 | --- | 4 | 3 | 4 |
| WCRE | 79.4 | $30.98 | $260 | --- | 5 | 2 | 2 |
1,2APWS obtained from simulation method for RWHS scenarios and for others by from different guidelines such as gray-water reuse guide for non-drinking use (in Persian), prepared by “Road, Housing & Urban Development Research Center” of Iran downloaded from http://www.WaterCM.ir and local market data. AAS, average annual saving ($/year), is the APWS (m3/year) times the water price ($/m3).
3 Investment or initial cost was obtained in the design stage, including all components of a domestic RWHS. To determine the price of all components of the system, several price lists for mechanical equipment and installation, rural drinking water, and price quotes from several water supply stores, including polyethylene tanks, pumps, and pipes, were used.
4 Benefit cost ratio calculated in the economic analysis section for all stations, all scenarios and all schemes and comparing the average.
5,6,7 Socio-environmental criteria ranked by a Likert scale according to expert opinion and domestic guidelines and reports.
* Results from simulation and LCCA section.
Table 4.
Priorities of different water-saving schemes over the province through MCDM.
| Types | Order | Stations |
|---|---|---|
| Type 1 | WCRE -RWH(B)-GWR-RWH(A) | Rasht, Astara, Masooleh, Kiashahr, Roodsar |
| Type 2 | WCRE -RWH(B)-RWH(A)-GWR | Anzali, Lahijan, Talesh |
| Type 3 | WCRE -GWR-RWH(A)-RWH(B) | Manjil, Jirandeh |
© 2020 by the authors. Licensee MDPI, Basel, Switzerland. This article is an open access article distributed under the terms and conditions of the Creative Commons Attribution (CC BY) license (http://creativecommons.org/licenses/by/4.0/).
Share and Cite
MDPI and ACS Style
Chiu, Y.-R.; Aghaloo, K.; Mohammadi, B. Incorporating Rainwater Harvesting Systems in Iran’s Potable Water-Saving Scheme by Using a GIS-Simulation Based Decision Support System. Water 2020, 12, 752. https://doi.org/10.3390/w12030752
AMA Style
Chiu Y-R, Aghaloo K, Mohammadi B. Incorporating Rainwater Harvesting Systems in Iran’s Potable Water-Saving Scheme by Using a GIS-Simulation Based Decision Support System. Water. 2020; 12(3):752. https://doi.org/10.3390/w12030752
Chicago/Turabian StyleChiu, Yie-Ru, Kamaleddin Aghaloo, and Babak Mohammadi. 2020. "Incorporating Rainwater Harvesting Systems in Iran’s Potable Water-Saving Scheme by Using a GIS-Simulation Based Decision Support System" Water 12, no. 3: 752. https://doi.org/10.3390/w12030752
Note that from the first issue of 2016, this journal uses article numbers instead of page numbers. See further details here.