A New Approach to Permeability Inversion of Fractured Rock Masses and Its Engineering Application


1
College of Water Conservancy and Hydropower Engineering, Hohai University, Nanjing 210098, China
2
Department of Civil and Environmental Engineering, Pennsylvania State University, University Park, PA 16802, USA
*
Authors to whom correspondence should be addressed.
Water 2020, 12(3), 734; https://doi.org/10.3390/w12030734
Submission received: 25 January 2020
/
Revised: 1 March 2020
/
Accepted: 5 March 2020
/
Published: 7 March 2020
(This article belongs to the Section Hydraulics and Hydrodynamics)
Abstract
:This paper presents a new seepage inversion technique to predict the permeability coefficient of the rock mass with developed fracture or fault. With the measured data of flow and water head of boreholes, the permeability coefficient of the rock masses near the boreholes are obtained by inverse calculation on the basis of unsteady seepage tests. Then, a flexible tolerance method is proposed to invert the permeability coefficient of rock masses in different zones of the reservoir area. This comprehensive inversion analysis method is applied in one actual project of the water supply reservoir. The equivalent permeability coefficient of the rock masses in the range of 0 m to 16.0 m below the road surface near the dam axis on the left bank of the mountain is 1.12 × 10⁻³ cm/s. The root mean squared error and coefficient of determination of the measured and calculated values are 1.33 × 10⁻⁴ m3/s and 0.9976 m3/s, respectively. The rock masses in the reservoir site area have high permeability. The groundwater level in the junction area and the mountains on both sides of Shangmo reservoir is low, and the hydraulic gradient is small. The maximum error between the calculated value of the groundwater level and the measured values is −0.41 m, and the relative error is −4.36%. The recommended anti-seepage scheme can effectively solve the problem of large leakage in the reservoir area. The results show that the innovative approach is appropriate for the seepage analysis of the field with the fractured rock masses and more meaningful from an engineering point of view.
1. Introduction
Seepage generally indicates the flow of water through the connected pores or fissures under an active pressure gradient. Fractures influence the seepage and stability of rock masses [1]. The deformation and stability of hydraulic engineering, such as dam foundation, dam slope, underground plant, and tunnel, are significantly affected by their seepage activities [2,3,4]. Seepage analysis and control technology are closely related to saturated-unsaturated seepage field and have a strong influence on the safety of the hydraulic structures and rock masses at the dam site [5,6,7]. Seepage field analysis and flow prediction are the two main contents of anti-seepage effect evaluation of hydraulic engineering. The equivalent continuous medium model is widely used for numerical analysis of engineering [8,9]. The model simulates discontinuous fractured rock mass as continuous permeable medium, and generalizes the distribution characteristics of fractures. The seepage anisotropy of fractured rock mass is reflected by its permeability tensor. However, the determination of the permeability coefficient or tensor is the premise for numerical analysis of seepage problems using an equivalent continuous model [10,11].
Currently, the most direct method to determine the permeability coefficient of fractured rock mass is the field measurement method based on statistics and cubic law [10,12]. This method is simple, but it is difficult to obtain representative fracture parameters by outcrop measurement or borehole measurement. The permeability parameters of the aquifer are obtained by an analytical or a semi-analytical method on the basis of the water pressure test [13,14]. The cross-hole tests and isotopic tracer methods are developed to determine the permeability tensor of the rock masses [15,16,17,18]. This permeability tensor can only represent the seepage characteristics of medium near the test area. In recent decades, the inversion methods, such as the Pulse Spectrum method, the Numerical Optimization method, the Artificial Neural Network method (ANN), and the Genetic Algorithm (GA), are widely used in the seepage parameters inversion of fractured rock masses [19,20,21,22]. He et al. (2011) proposed a new approach to determine the equivalent permeability tensor of fractured rock masses by combining the geological method, the packer test method, and ANN [10]. Ren et al. (2016) applied the flexible tolerance inversion method to obtain the seepage parameters of rock masses and faults in the dam foundation of the Maerdang dam [23].
Existing research is usually based on the field water pressure test to calculate the permeability parameters of the rock masses near the test area, but its determination object is usually hard or semi-hard rock mass [24,25]. Scholars have also adopted the stable seepage theory to assess the seepage parameters of the rock masses by an inversion method on the basis of the groundwater level monitoring data. However, for the rock strata with extremely developed fissures, fault fracture zones, or karsts, the stability of field water pressure test is poor [26]. Even if the water pump reaches the maximum water supply capacity of 100 L/min and shortens the length of the test section to 1.5 m, water cannot fill the test section. The pressure value in the hole is always zero. The permeability of this strata is greater than 10−3 cm/s, which exceeds the range of the Lugeon value measured by the test equipment. In view of this kind of rock strata with high permeability, we attempt to propose a back-analysis method to determine the equivalent permeability parameters of rock masses near the test boreholes.
The main objective of this paper is, based on the equivalent continuum model, to propose a comprehensive back analysis approach to determine the seepage parameters of the rock masses with the developed fractures or fault fracture zone. First, based on the measured data of the flow rate and water level in the borehole during the unstable seepage period of the water pressure test, a three-dimensional seepage analysis model of the borehole and surrounding rock masses is established to invert the the equivalent permeability coefficients of the rock masses around the borehole by using the unstable seepage calculation theory. Next, a three-dimensional seepage finite element model of reservoir site area in a natural period is modelling, and the equivalent permeability coefficients of rock masses in each zone of the whole reservoir site area is obtained by the flexible tolerance method. Lastly, the proposed method is applied to evaluate the seepage control effect of the recommended anti-seepage scheme for the Shangmo water supply project.
2. Mathematical Model
Assuming that seepage in unsaturated soil obeys generalized Darcy’s law, and the hydraulic conductivity tensor is introduced to describe the permeability of rock and soil. The basic differential equation for the heterogeneous anisotropic saturation-unsaturated soil seepage is written as follows [23].
where and are the coordinates (i.e., i = 1, 2, 3), is the saturated hydraulic conductivity tensor (m/s), is the hydraulic conductivity, 0 < < 1, and = 1 represent the unsaturated and saturated zone, respectively, is the pressure head (m), is the saturated hydraulic conductivity (m/s), j = 3, is the source and sink (m3/s), which indicates whether there is an external injected flow (source) or outflow flow (sink) in the seepage calculation area, is a constant, where = 0 in the unsaturated zone, and = 1 in the saturated zone, and is the elastic water storage rate (m−1), which represents the amount of water released by saturated soil per unit volume due to the compression (expansion) of soil and expansion (compression) of water when a unit head is lowered (raised). is a constant in the saturated zone and zero in the unsaturated zone. is the specific water capacity, and C = 0 in the saturated zone, in the unsaturated zone, , can be solved as follows.
where is the saturated water content, is the residual water content, and are empirical fitting parameters, and and are satisfied.
The definite solution condition used for solving Equation (1) includes the initial condition and boundary conditions.
The initial condition is expressed as Equation (3) shown below.
The boundary conditions can be expressed as the formulas below.
where is the boundary surface normal direction cosine, is the initial time, is the known head boundary, is the known flow boundary, is the saturation overflow boundary, is the unsaturated zone overflow boundary, is the normal flow, and is the rainfall infiltration flow.
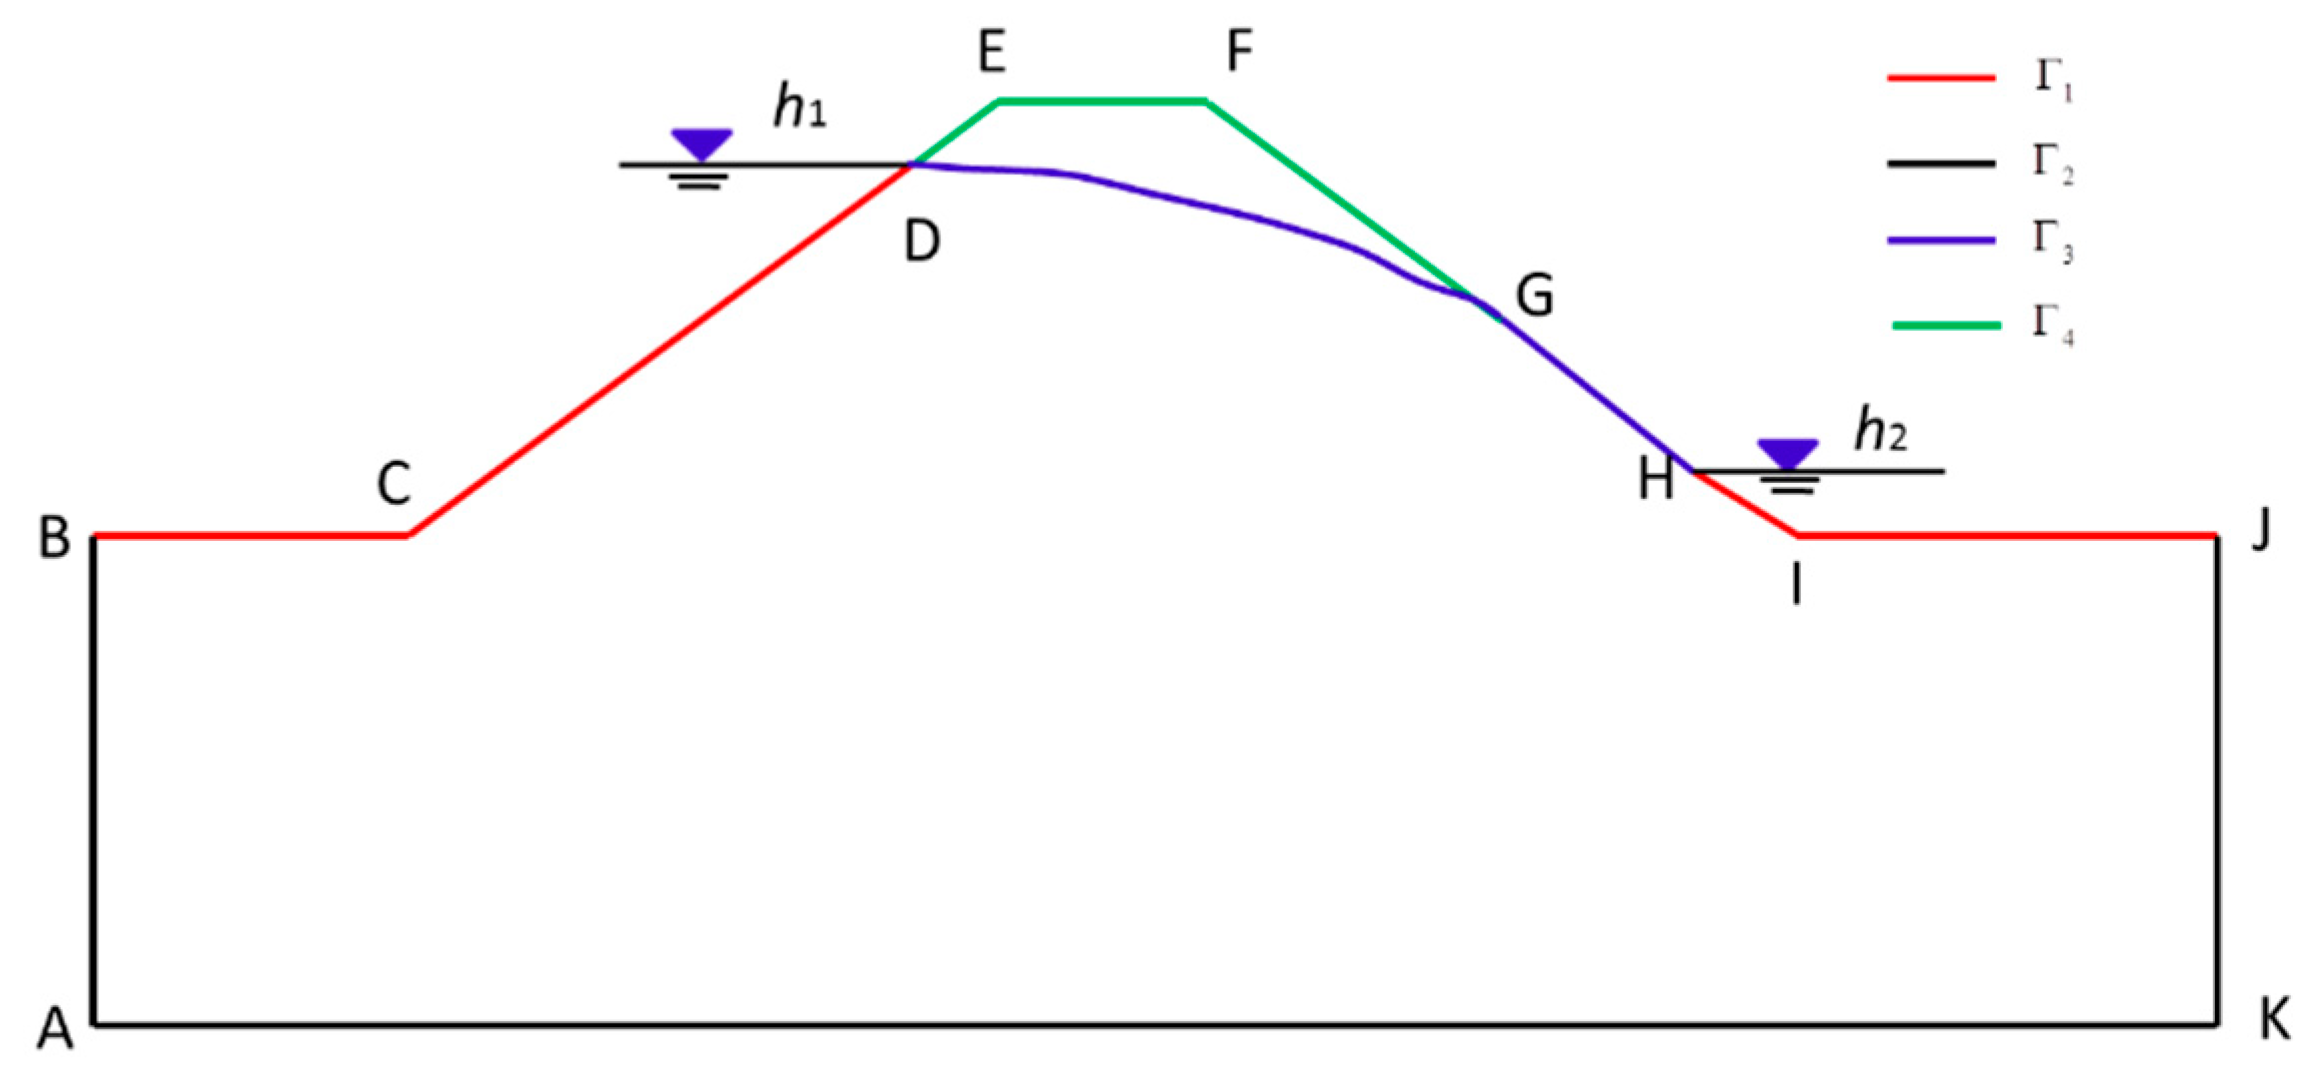
Take an earth dam as an example. The seepage boundary diagram is shown in Figure 1. The known water head boundaries, BC, CD, HI, and IJ, belong to . Boundary AB, AK, and JK are impermeable boundaries and belong to . DG and GH are taken as the infiltration boundary and seepage boundary, respectively, both of which are classified to . Boundary DE, EF, and FG are the unsaturated zone overflow boundaries .
3. Back Analysis Method
3.1. Objective Function of Back Analysis
In many practical projects, the permeability coefficient is usually obtained from water pressure test data used for back analysis. The residual of a finite element calculation head and observation head is the weighted sum of squares in the objective function of a parameter inverse optimization problem, which is used to find matching parameters closer to the actual basic parameters. The objective function adopted to optimize the parameter inversion can be expressed by the equation below [23,27].
where X is the permeability coefficient of the undetermined parameter, n is the total number of observation points, is the weight of the measured values at observation point i, and are the calculated value and measured value of the water head for observation point i, respectively, N is the number of inversion parameters, and represents the space domain.
The method based on the approximate viable concept using the nonlinear simplex method finds the optimal solution directly, which can solve the optimization problem with various types of constraints and parameter inversion problems and, in general, engineering seepage problems. In this paper, the water head are taken as the the known quantity. The flexible tolerance method is applied to obtain the seepage parameters of the different material zones.
3.2. Procedures of Back Analysis
The borehole water pressure test is a kind of in-situ permeability test carried out in the borehole, which is used to determine the permeability of the rock mass and understand the relative permeability and fracture development degree of the rock strata at different depths of the underground. However, when the rock masses with very developed fissures or fault fracture zone are measured, the stability of in-situ borehole water pressure test is poor. Therefore, the permeability of rock mass cannot be calculated directly through the test data. In this paper, a new approach to permeability inversion of fractured rock masses is proposed to address the problem. The specific implementation steps are as follows.
(1) Step 1: The permeability parameter of the rock masses near the borehole in the rock mass area to be measured is recorded as xi. The liquid level in the borehole is allowed to drop freely after water is injected into the borehole, and the liquid level elevation at different times is recorded. Therefore, the measured leakage amount in the borehole in each time period can be expressed by the following formula.
where A is the cross-sectional area of the borehole (m2).
(2) Step 2: A three-dimensional finite element model of seepage in the borehole area is modelling. After the seepage boundary conditions of the model are determined, the initial values of seepage parameters are given. Based on the unstable seepage analysis method, the seepage field in the drilling area at different times is calculated. Then, the seepage flow of the drilling model at different times is calculated by using the mid-section method [28]. The calculated seepage flow in the drilling area at each time period can be solved by the following formula.
(3) Step 3: Adjust the seepage parameters, the error percentage between the calculated seepage flow rate, and the measured seepage amount in the borehole area in each time period can be expressed as follows.
The permeability coefficient is monotonically decreased by using a simple acceleration method [23], and the control error percentage is within 5%. Therefore, the permeability parameters of the rock mass in the drilling area at different times are inverted, and the inversion of the permeability coefficients of the rock mass at different depths near a drilling hole is completed.
(4) Step 4: For other similar drilling water pressure tests. Steps (1) to (3) are repeated until the permeability coefficients at different depths near the boreholes are all obtained.
(5) Step 5: Based on the existing seepage system of the rock masses in the area near the limited number of boreholes, a three-dimensional finite element seepage analysis model of the whole reservoir dam area in the natural period is established, and the permeability coefficients of the rock masses in different zones in the global range of the reservoir dam area are obtained by inversion using the flexible tolerance method. Next, a three-dimensional seepage model of the dam engineering during the operation can be established to further evaluate the rationality of the seepage control measures and schemes of the project.
4. Method Verification
4.1. Case Introduction
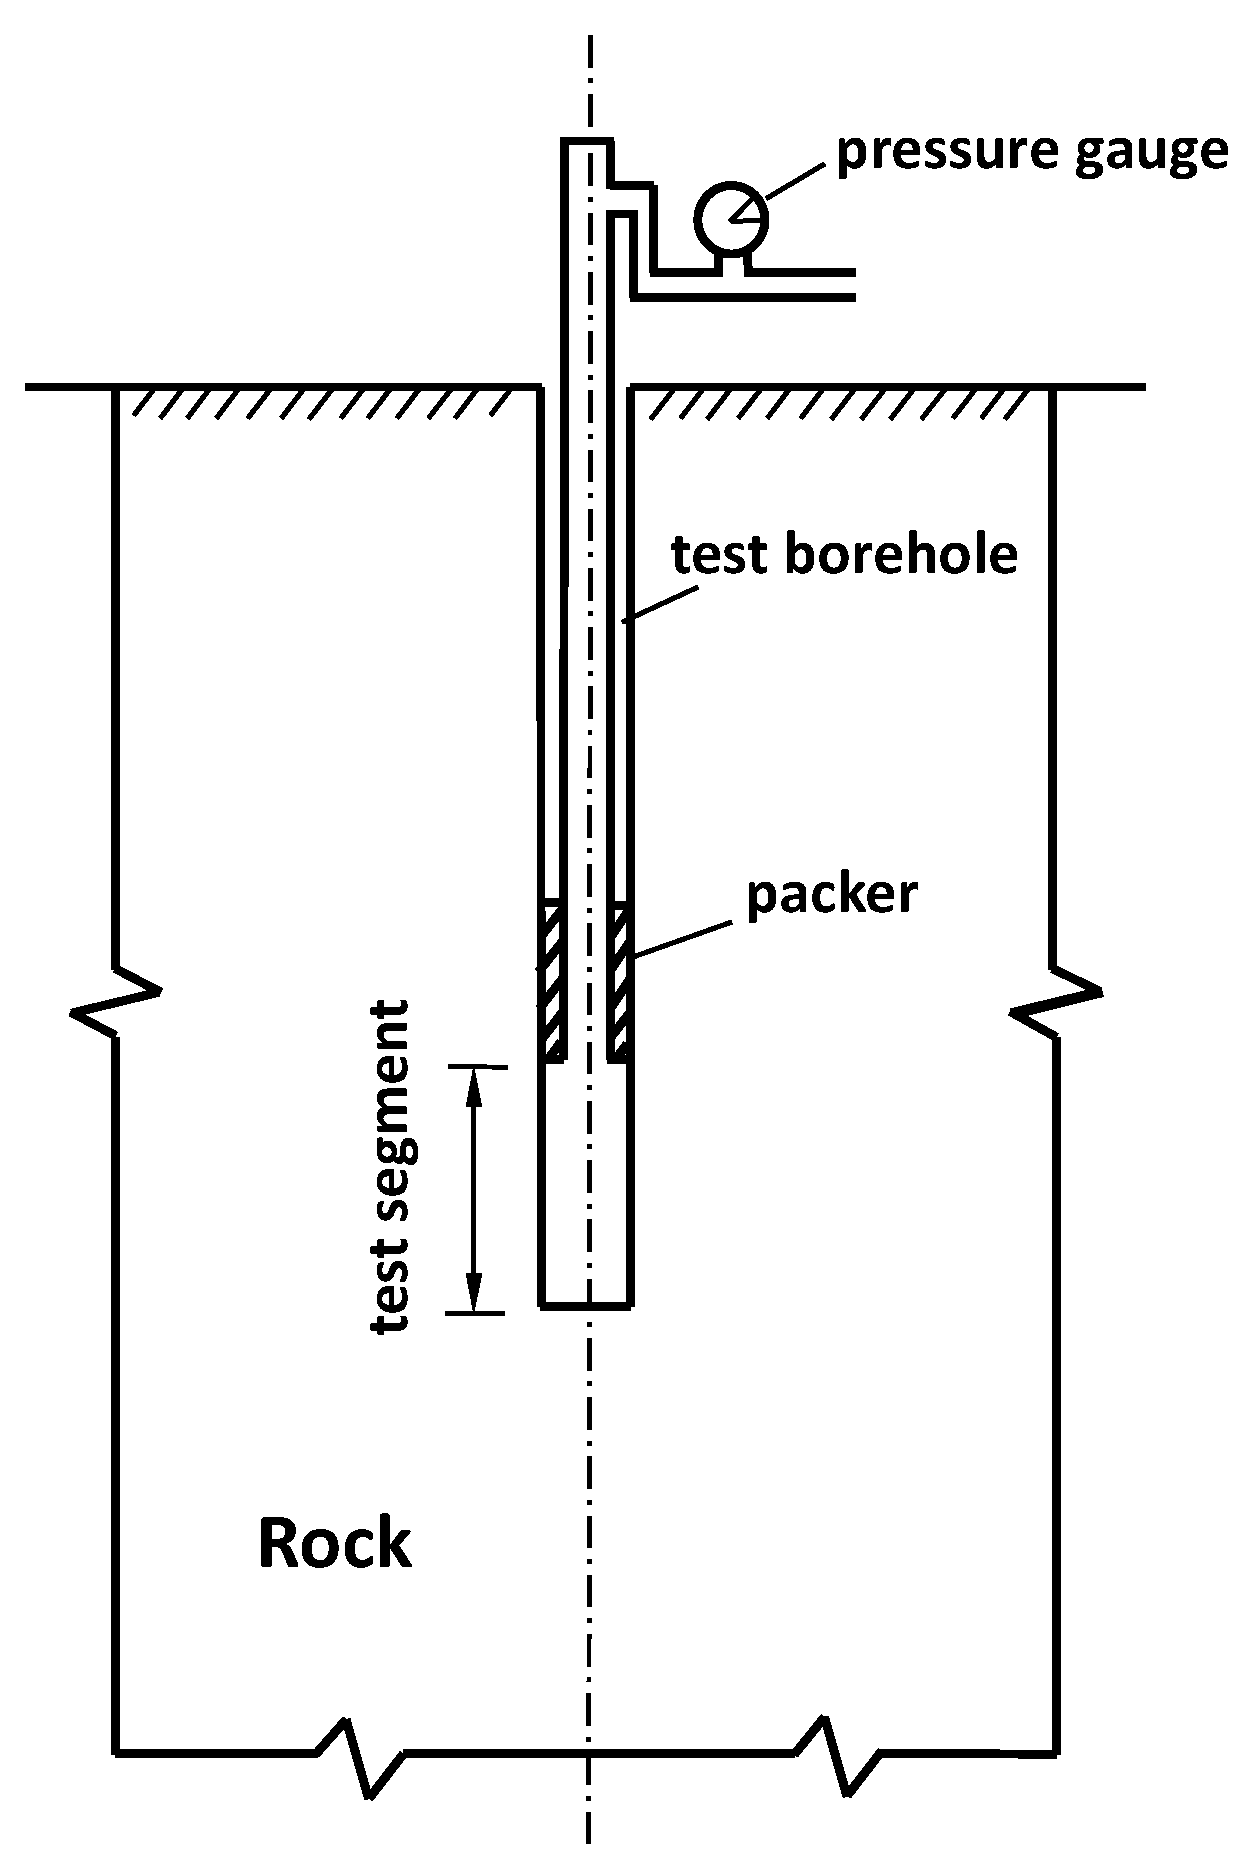
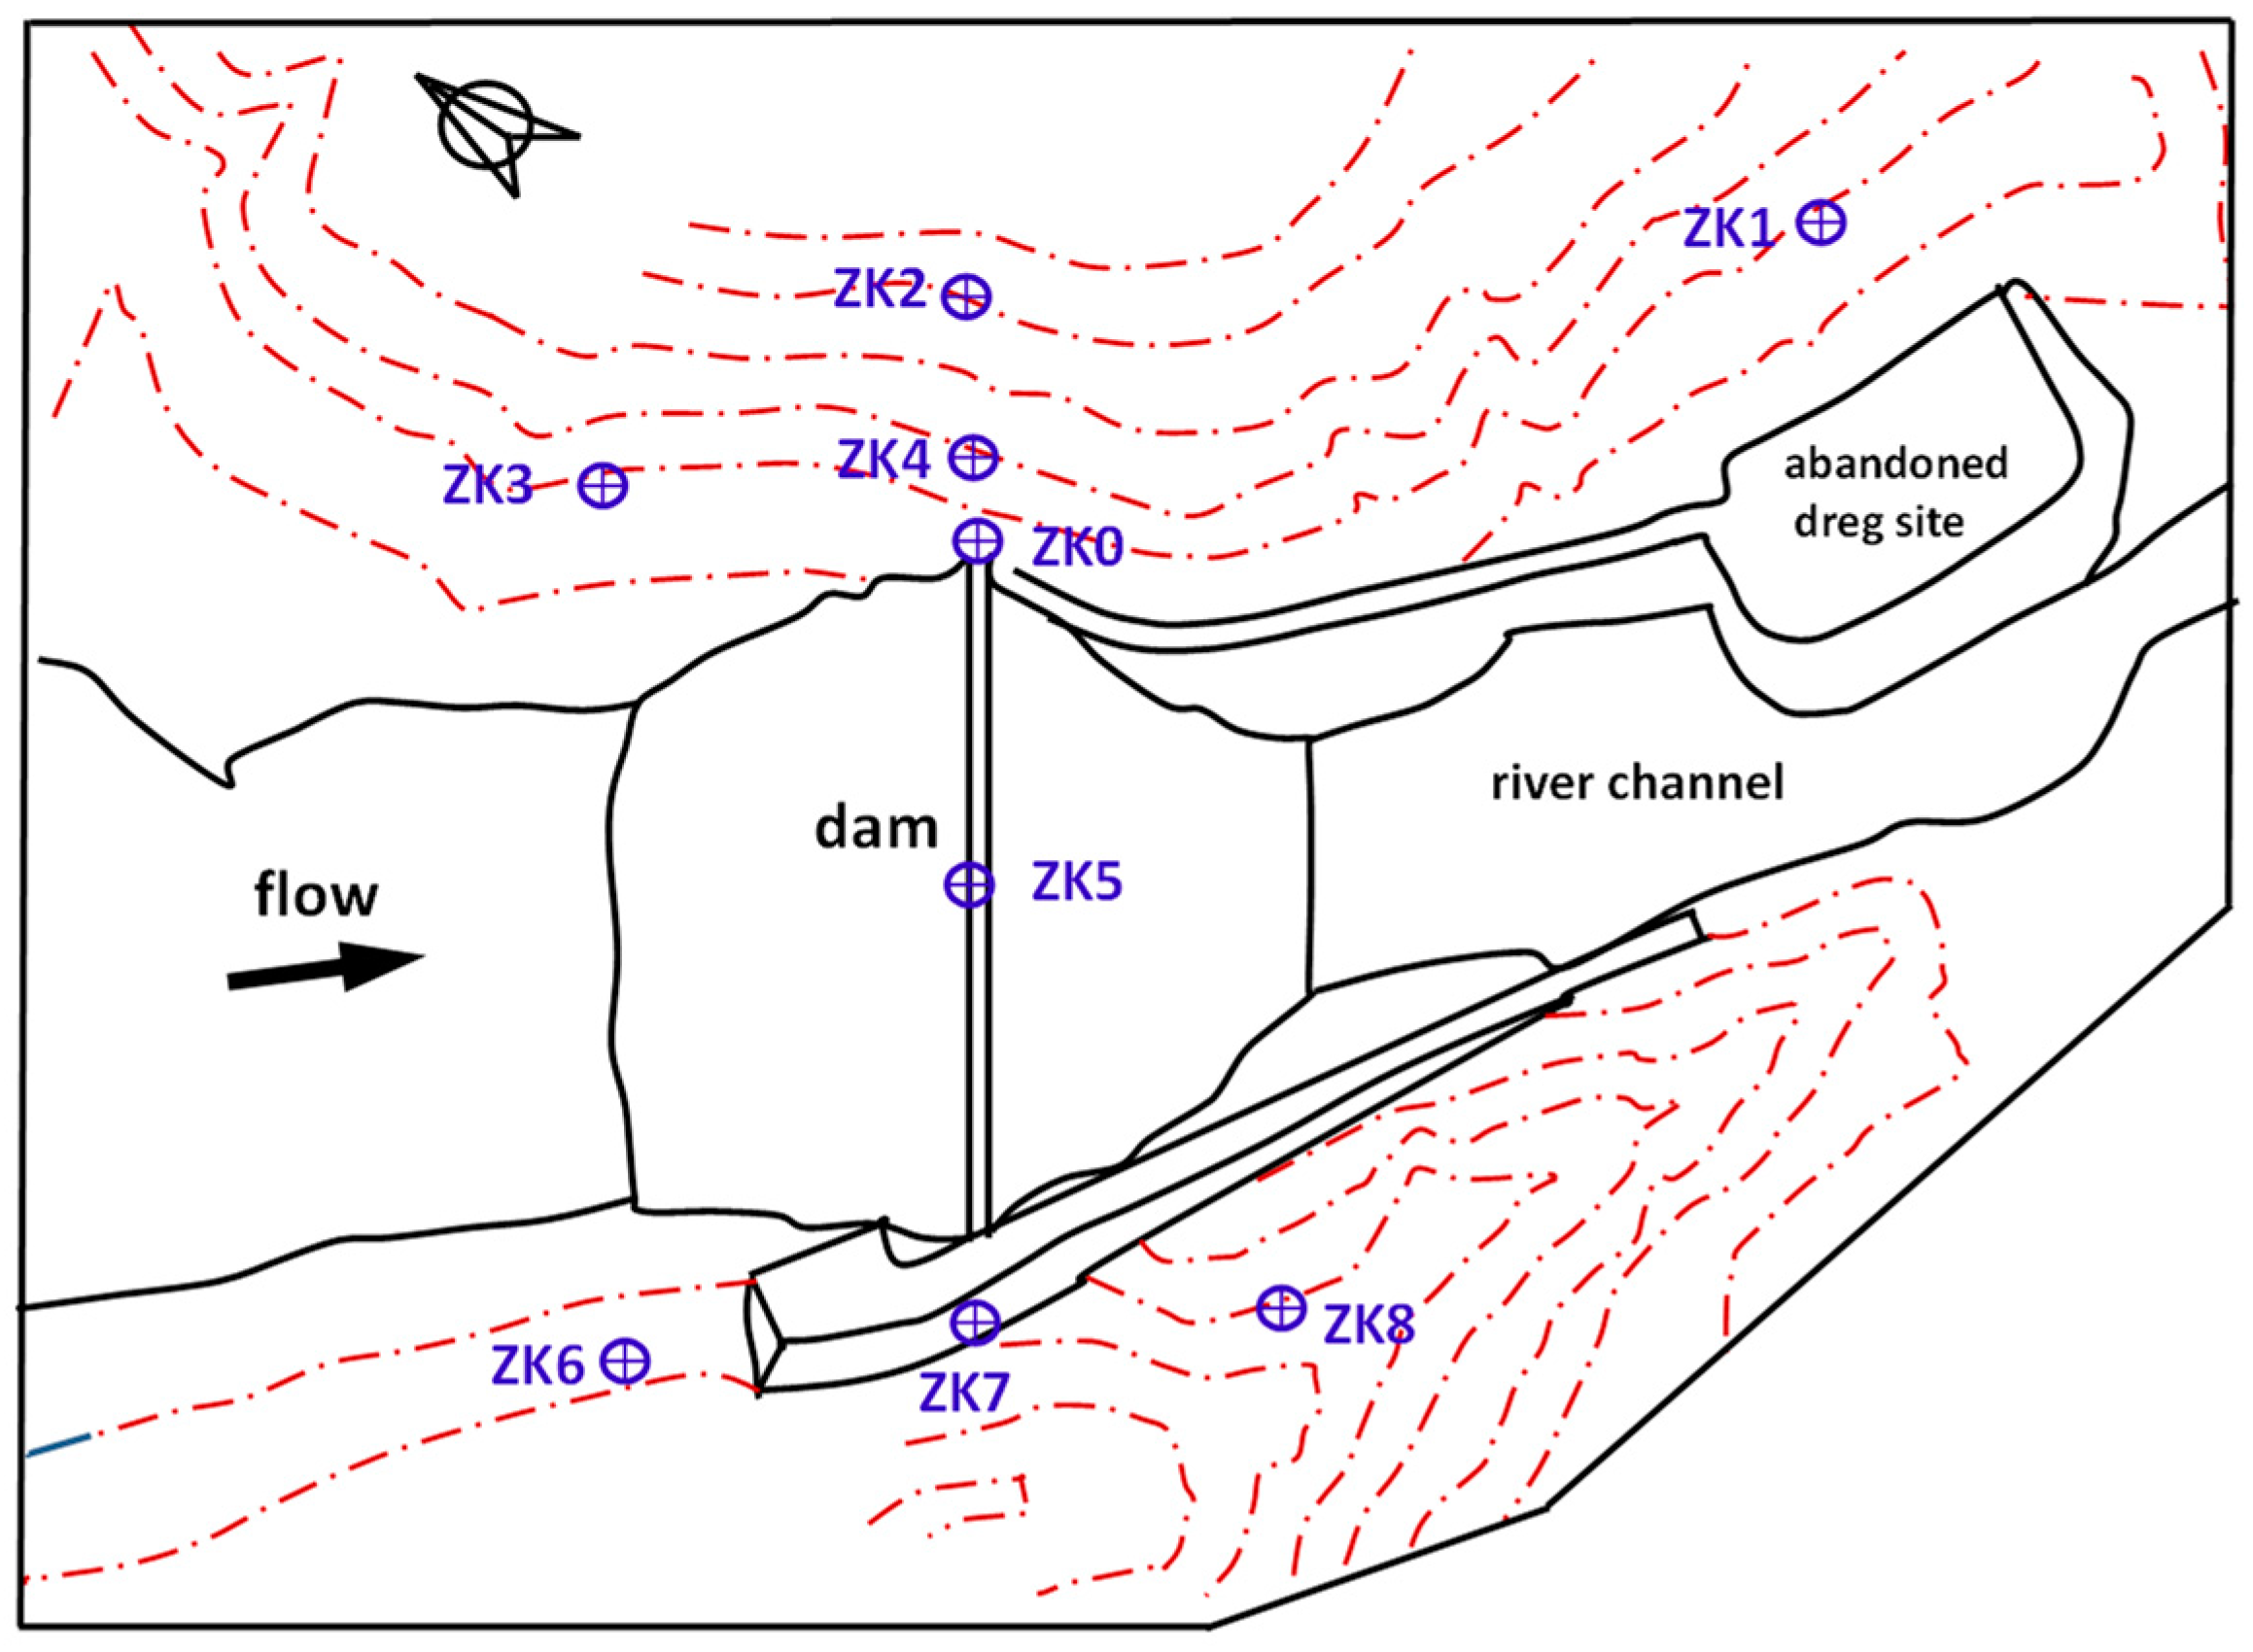
The seepage field of rock mass around the borehole is calculated based on the unsteady seepage analysis method, and the seepage flow rate at each time point in the test process is obtained. The seepage coefficient of rock mass in the corresponding test section is inverted by comparing with the field water pressure test results. The schematic diagram of the single-hole water pressure test is shown in Figure 2. The drilling layout of the Shangmo reservoir project in Gansu Province, China is presented in Figure 3. The water pressure test hole is ZK0, which is about 7 m away from the left end of the dam. The contrast hole is ZK1, located at the rock mass with better lithology on the downstream side of the left bank mountain. The other seven pressurized water test holes are ZK2 to ZK8, respectively.
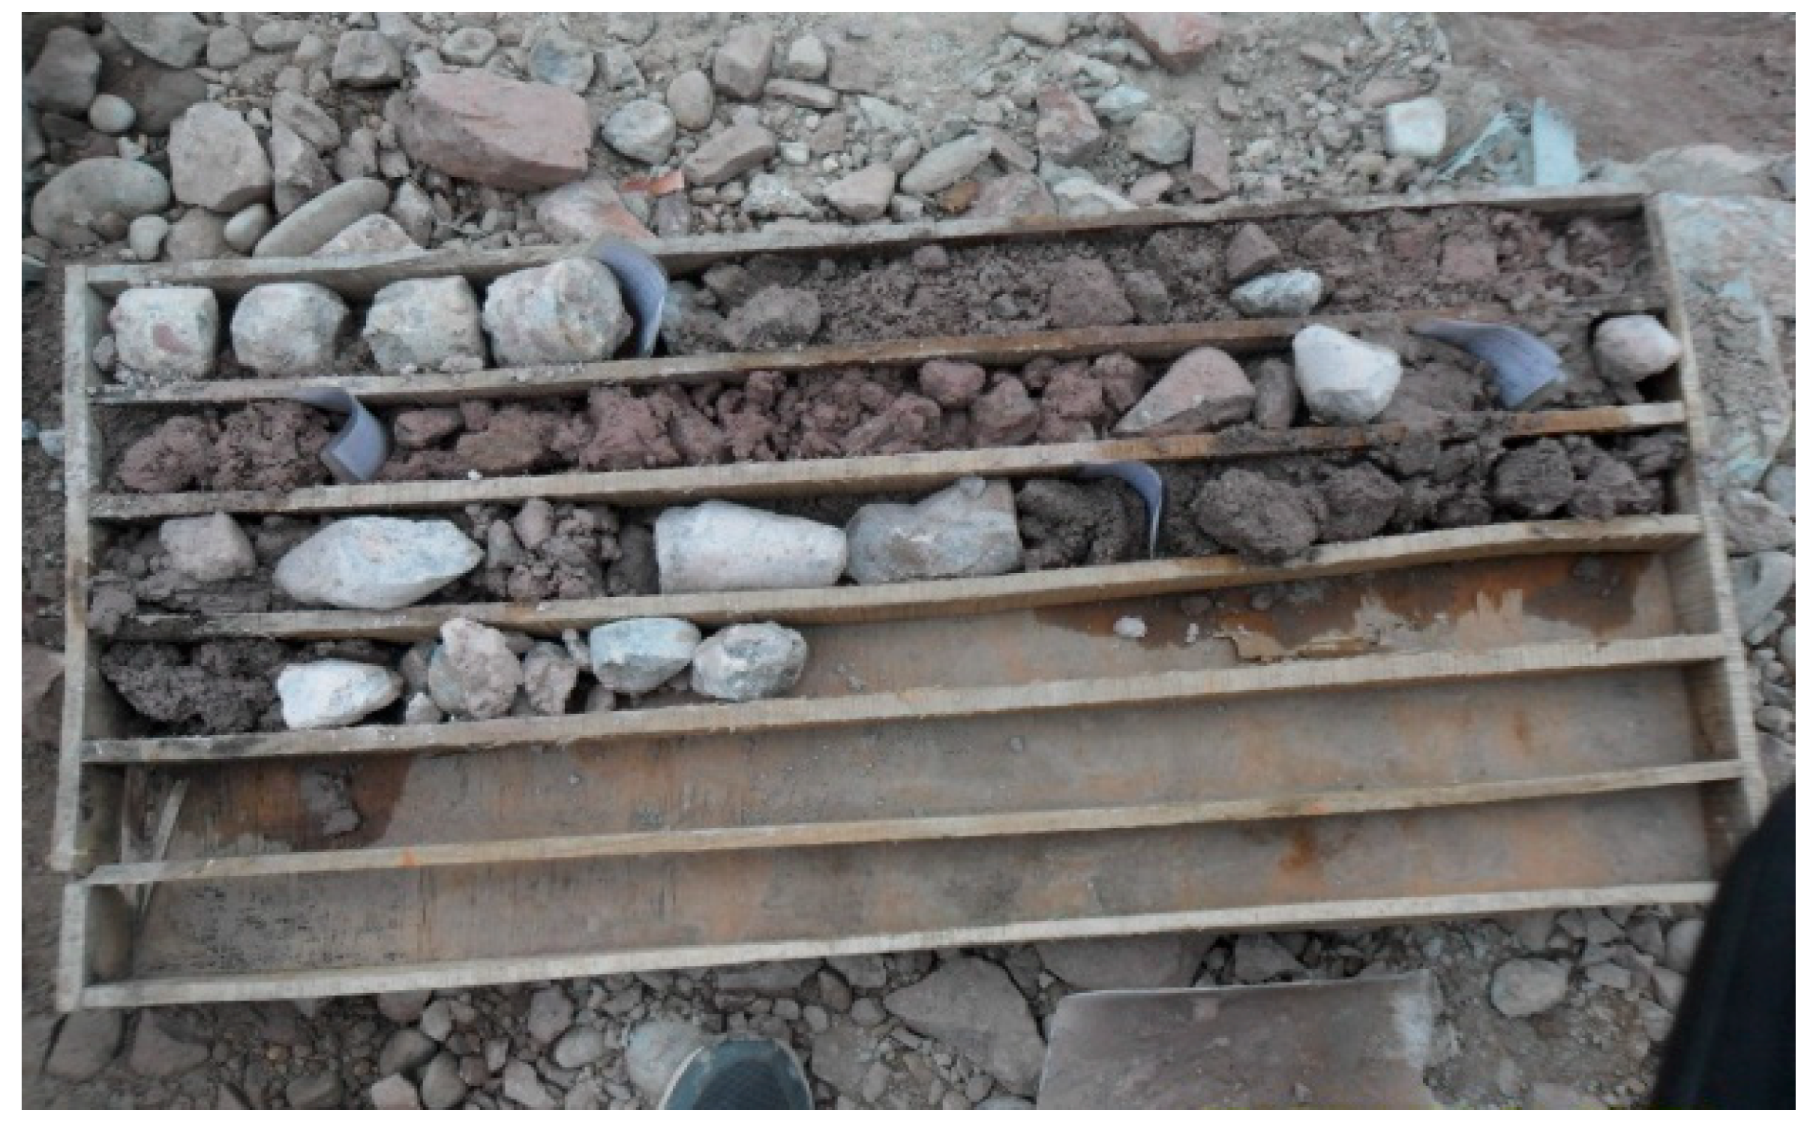
Pressure water test hole water level measurement process: The water level in the hole at a higher position. After a period of water injection, the pump stops supplying water. A modified water level observation device was used to monitor the variation of the water level in the borehole. The water level in the borehole was recorded until no water was found. The water pressure tests indicate that the rock masses are the fractured rock mass with high permeability. Figure 4 shows one rock core sample of the water pressure tests.
4.2. Model and Parameters of the Case
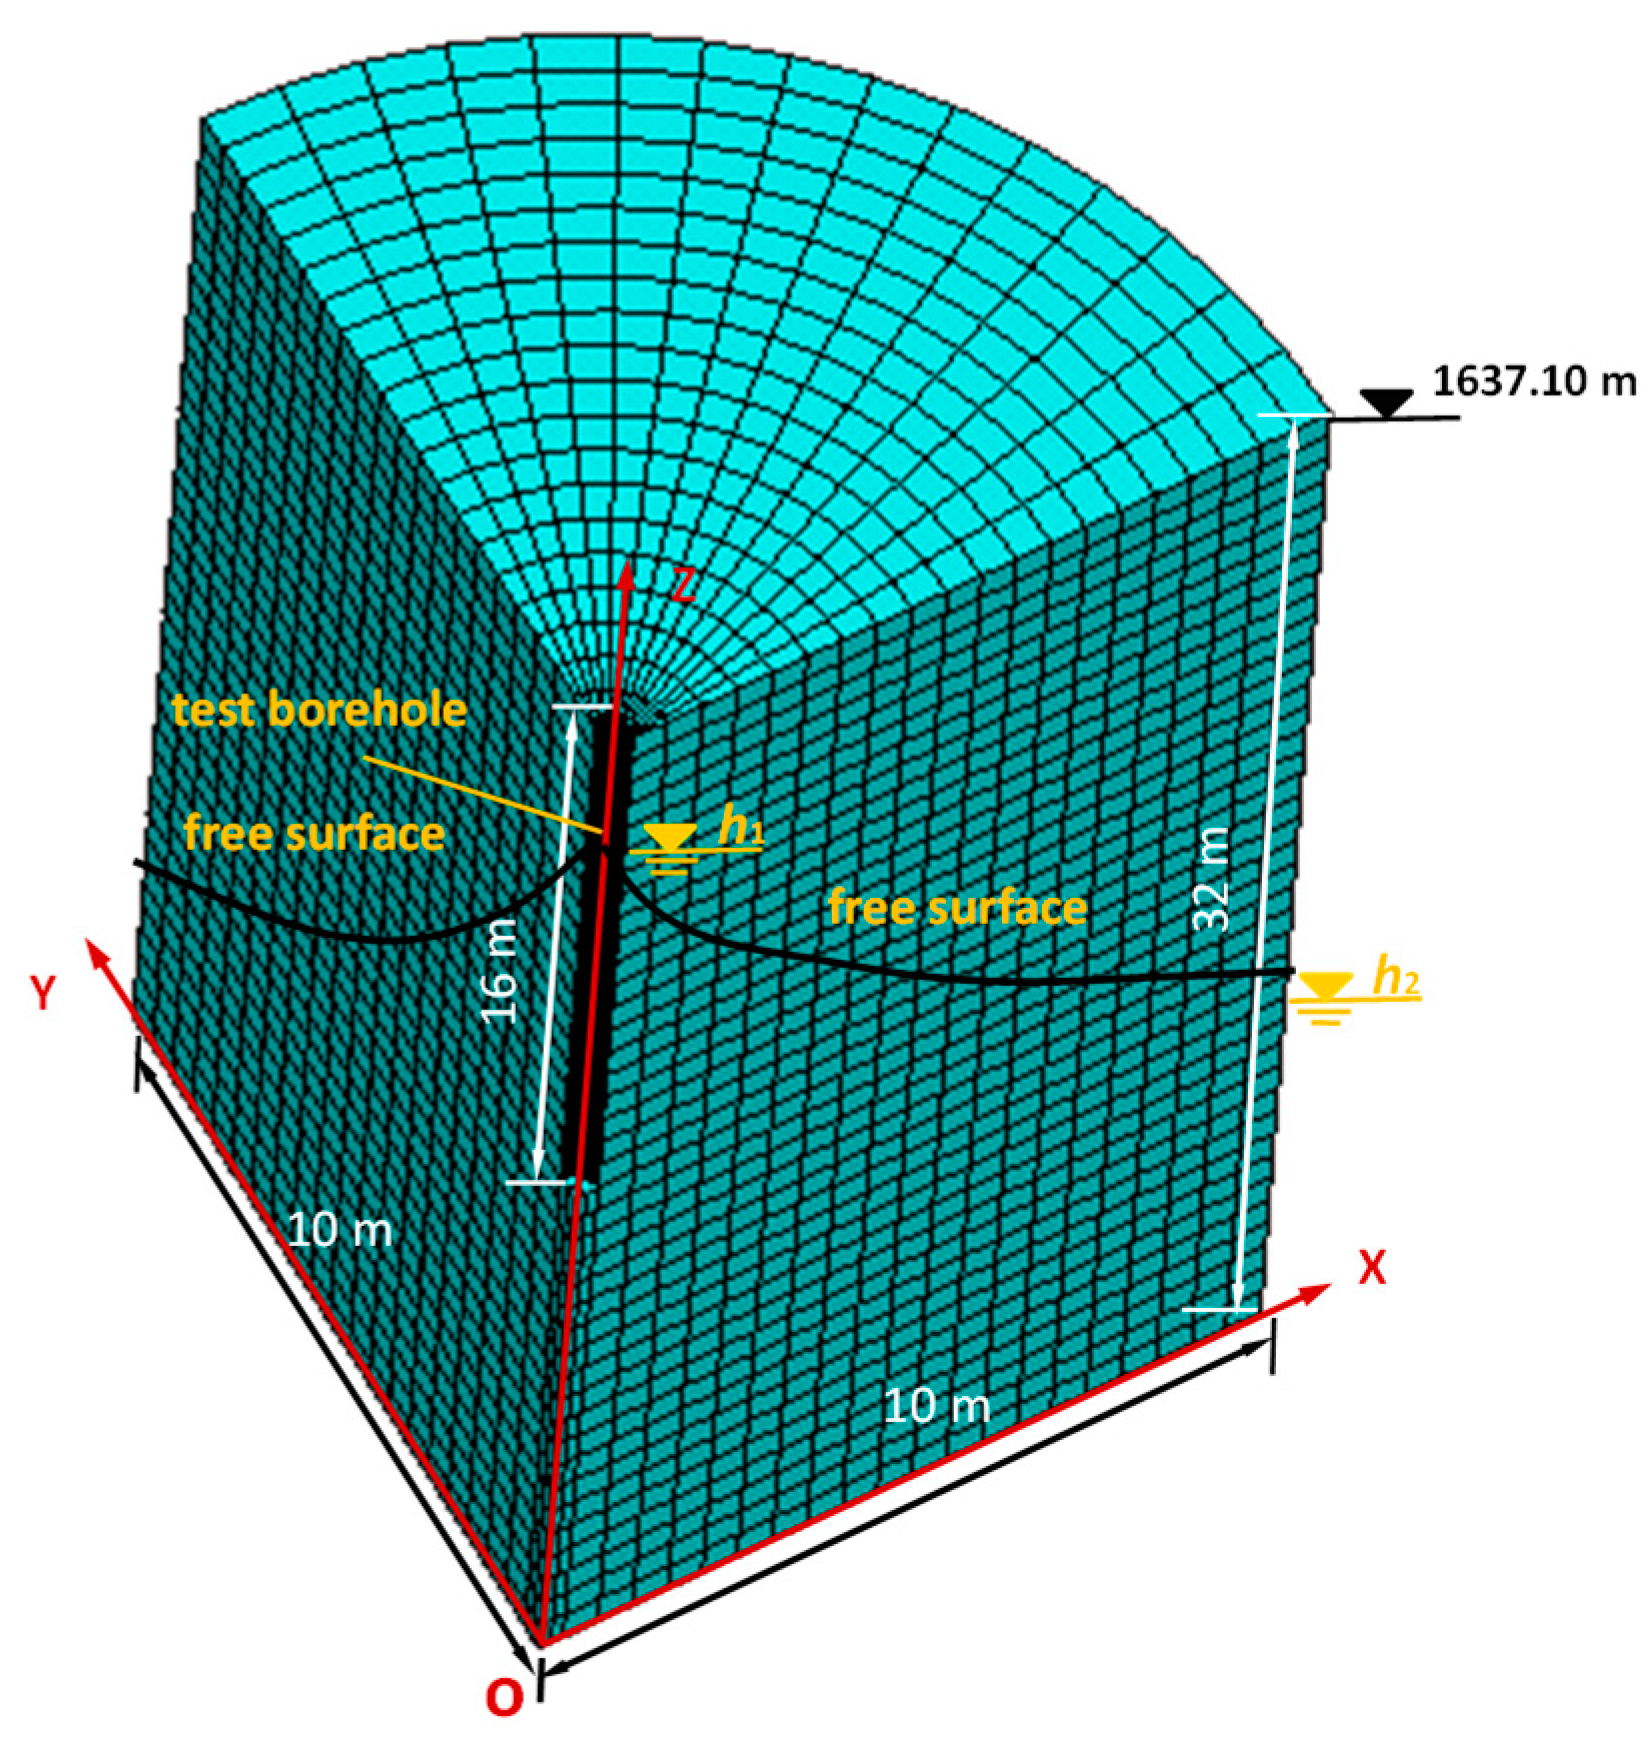
Considering the symmetry of a single-hole water pressure test model, a 1/4-cylinder model with a radius of 0.12 m are established. The length and width of the model are both 10 m, and the heights are 32 m, respectively. The depth of the borehole h is 16 m. The top elevation of the model is 1637.10 m. The 3-D finite element mesh of the calculation model is shown in Figure 5. The total number of model nodes and units are 19,056 and 18,000, respectively.
In the unstable seepage period, the boundary types of seepage analysis mainly include the known head boundary, seepage boundary, and impermeable boundary. (1) The known head boundary includes the boundary around the borehole and the intercept boundary of the given groundwater level, the periphery of the borehole is the upstream boundary, and the outer side of the model is the downstream boundary. (2) The seepage boundary is the surface below the upstream water level and above the downstream water level of the model. (3) An impervious boundary includes the symmetry plane of the model (i.e., intercept boundary of x = 0 m and y = 0 m), partial boundary between upstream and downstream water levels except the given groundwater level, and the bottom surface of the model. (4) For the unsteady seepage in this test, the drilling water level changes with time, that is, the upstream boundary water head around the drilling hole changes with time.
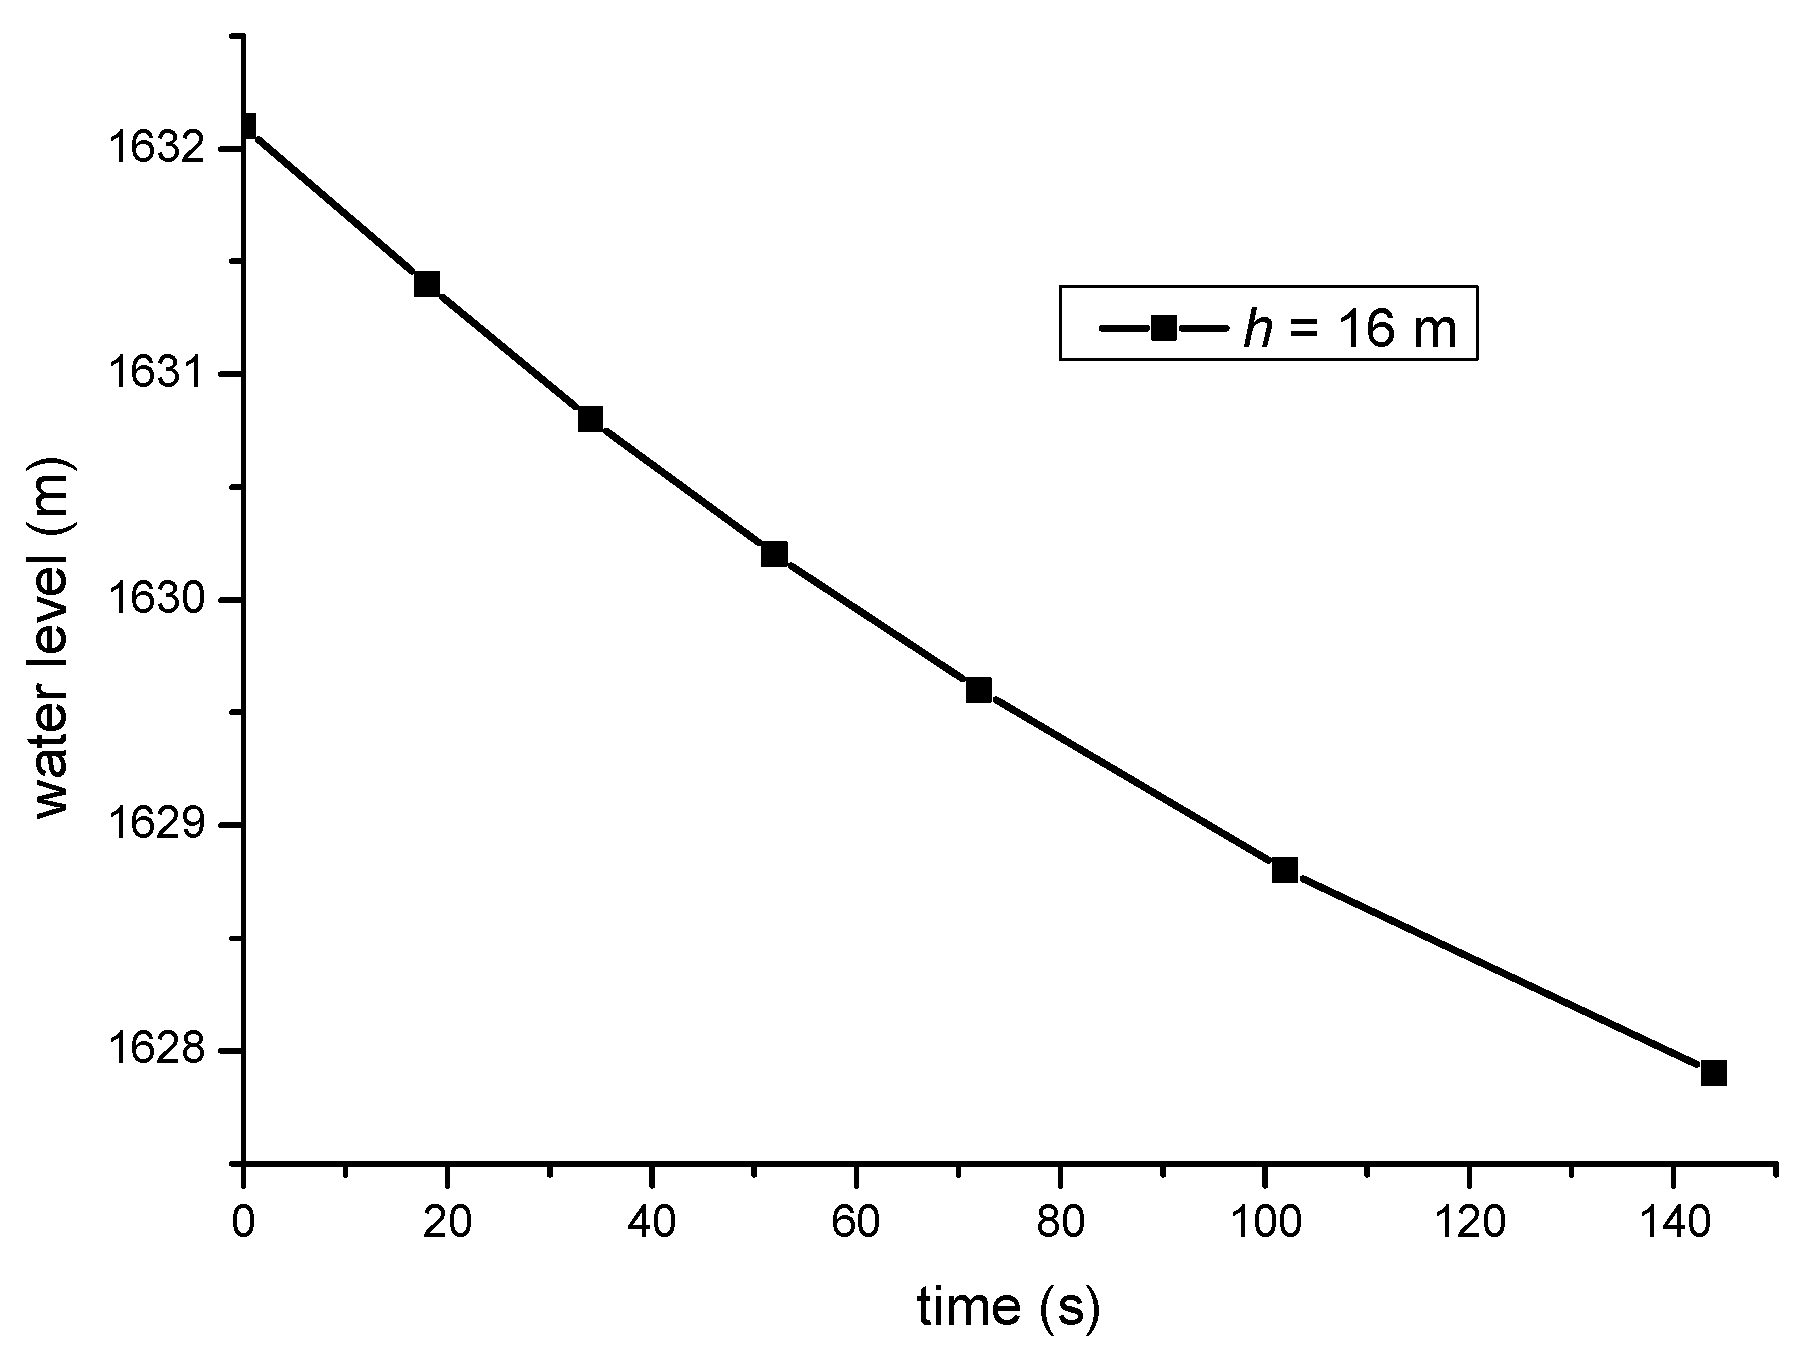
The flow rate is used as the basis of inversion, the error percentage between the measured seepage value in the borehole, and the calculated seepage flow rate in the borehole area is controlled within 5%, so as to inverse the seepage parameters of the rock mass around the borehole. The variation trend of the water level in the comparative hole with time is presented in Figure 6. As seen in Figure 6, the water level in the hole decreases monotonically with time. Each rock stratum is generalized into an equivalent continuous permeable medium to represent the macroscopic permeability characteristics of the rock stratum, including the permeability of the faults and fissures, but the seepage heterogeneity of the faults and fissures is not considered in the model. The initial proposed permeability coefficient of the rock masses in different depths around the borehole are supposed to be 1.0 × 10⁻⁵ cm/s to 1.0 × 10⁻¹ cm/s.
Based on the variation curve of the water level in each borehole, the unstable seepage calculation scheme is adopted to invert the permeability coefficient of rock mass with different depths by controlling the error between the calculated seepage flow rate and the measured seepage amount in each time period.
4.3. Case Analysis
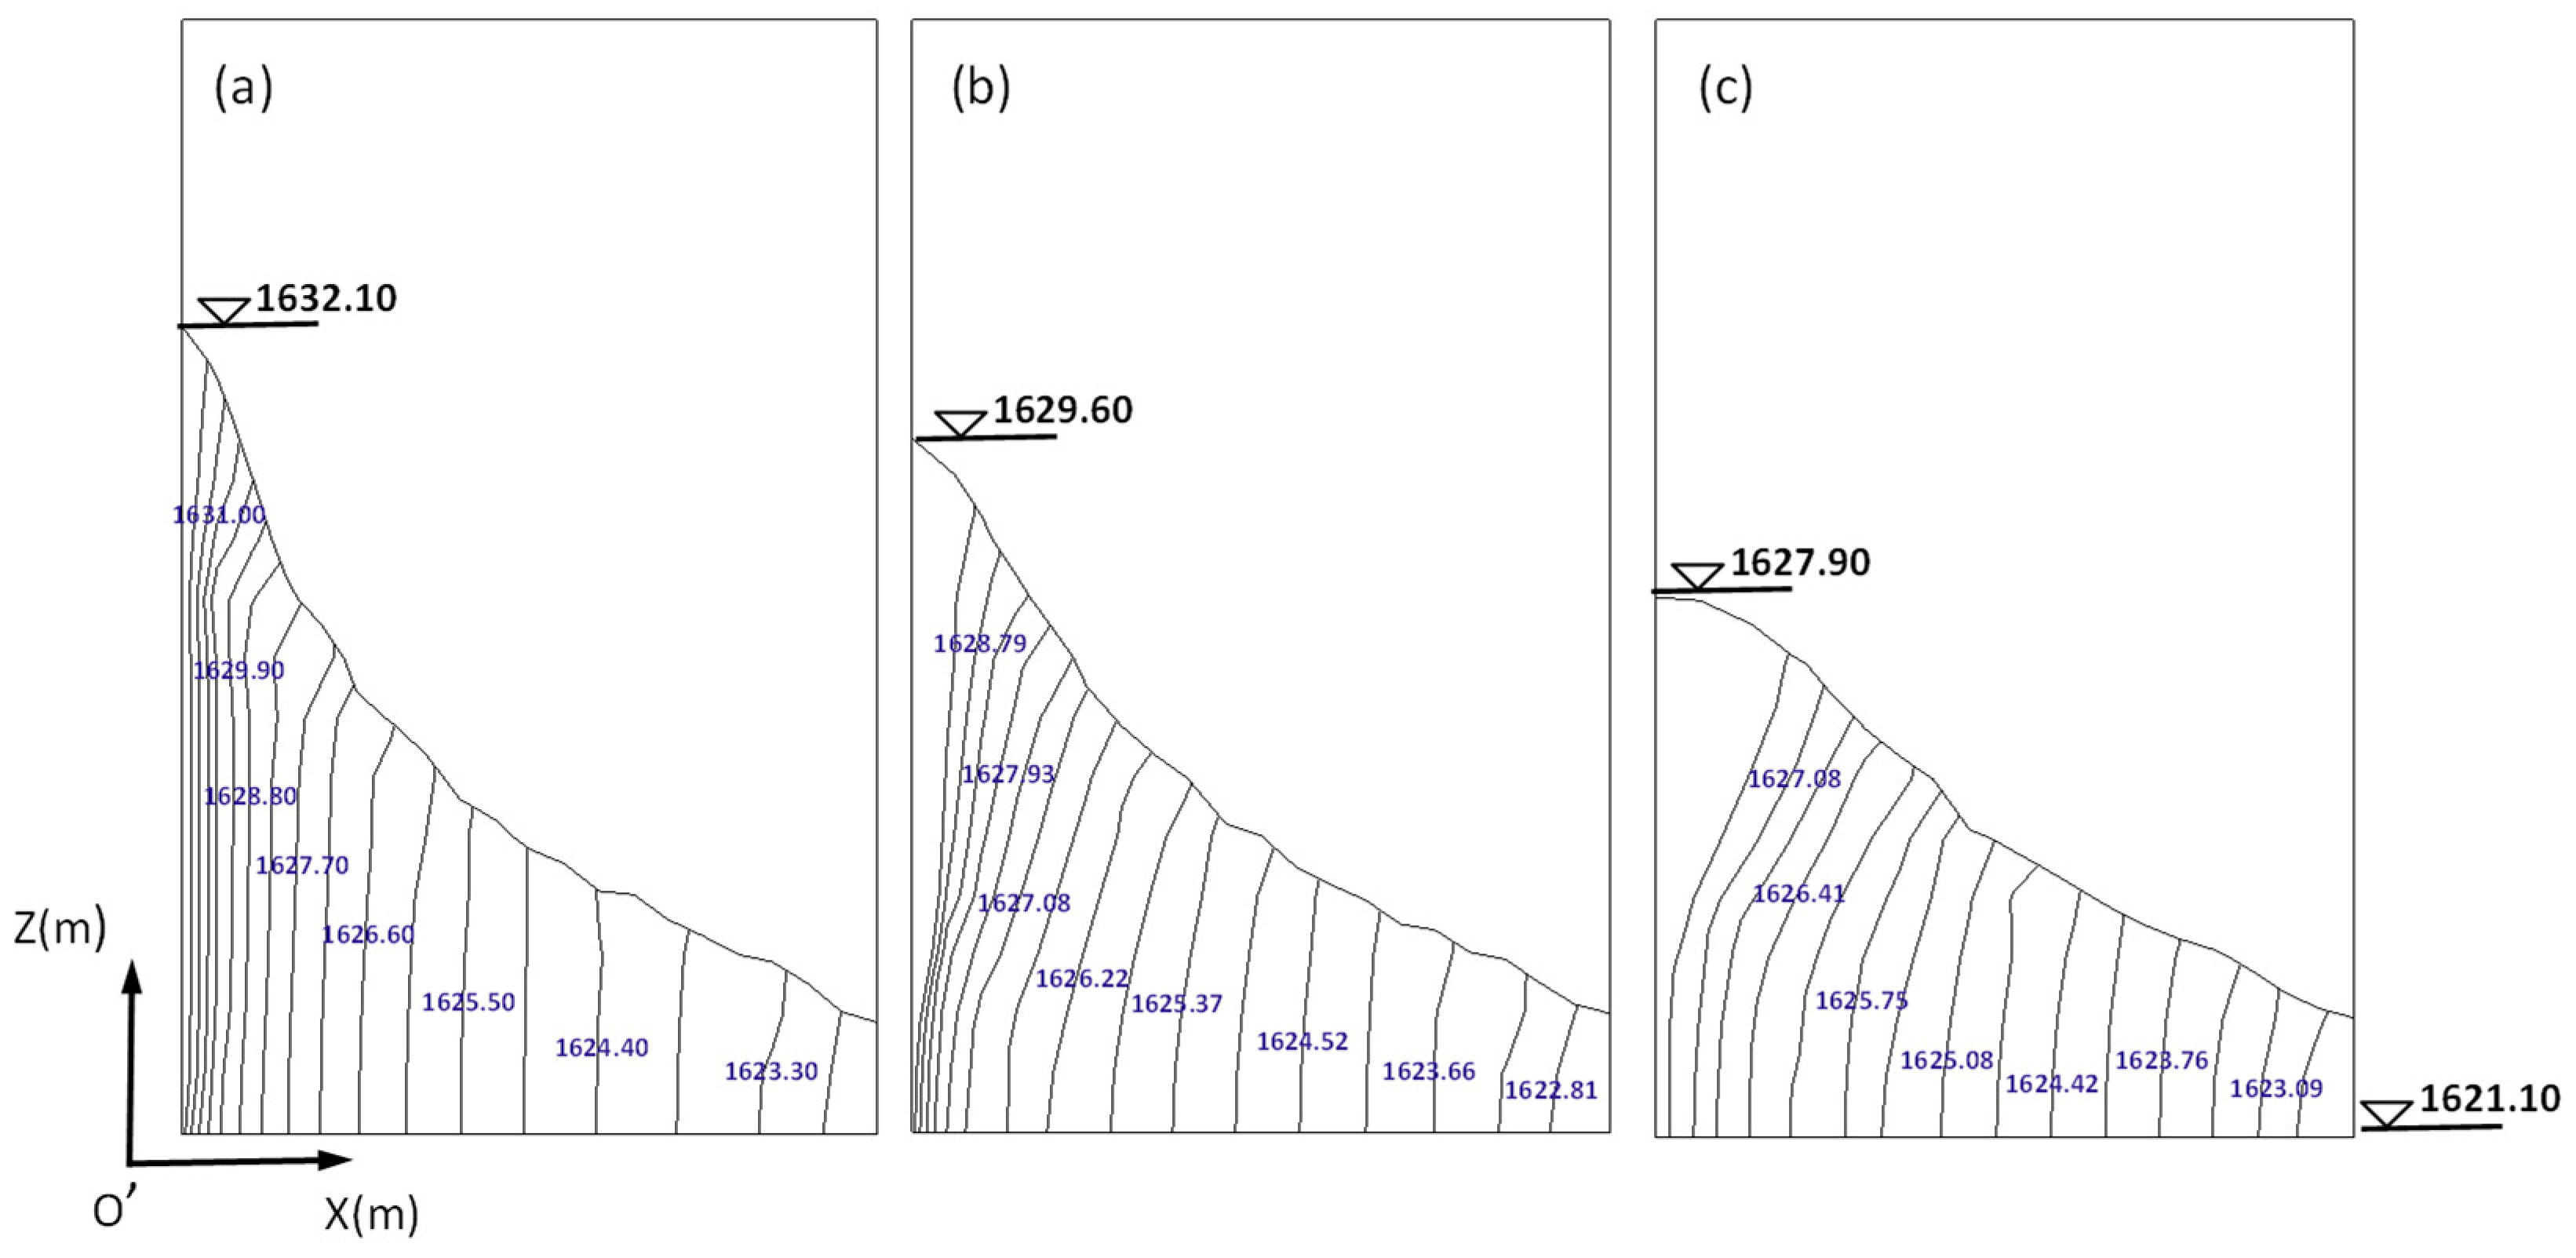
The time interval of the pressure water test of borehole ZK0 and its measured values of the seepage flow are shown in Table 1. The water head distribution of the borehole profile at different time periods is shown in Figure 7. The figure indicates that the water level near the borehole location drops significantly more than in other areas, and the distribution of water head is consistent with the general rule.
To quantitatively evaluate the simulation performance of the models, the root mean squared error (RMSE) and coefficient of determination (R2) were considered as statistical performance evaluations in this study [29]. The value of RMSE is a nonnegative value, and a low RMSE indicates good consistency between the observed and simulated values. R2 ranges from 0 to 1, and a larger R2 value indicates a better match of the simulated and observed data.
Figure 8 shows the comparison between the calculated seepage flow and the measured seepage flow in the comparative hole. From this figure, it can be noticed that the maximum error of the measured leakage values and calculated values in each period are 4.67%, RMSE, and R2 of those are 1.33 × 10⁻⁴ m3/s and 0.9976, respectively, which indicates the inversion values can match well with the measured data.
Inversion analysis results show that the permeability coefficients of the rock masses at the depths of 0–16 m below the road surface at the position of ZK0 is 1.12 × 10⁻³ cm/s, respectively. According to the geological conditions of the mountain and the distribution law of rock strata, the mountain fissures in the left abutment are developed and the permeability coefficient is relatively large.
For the rock masses with extremely developed fissures or fault fracture zones, this new approach is used to obtain the permeability coefficient of the rock mass with different thicknesses near the other boreholes (ZK2 to ZK8, shown in Figure 3). The inversion results of each test boreholes are listed in Table 2.
5. Engineering Application
5.1. General Description
The Shangmo project is a water source project for the water supply in Tianshui city, Gansu Province, China. It is a reservoir hub project with full annual regulation. The dam is a sandy gravel dam with loam core wall with a crest width of 6.0 m, a length of 202.8 m, a crest elevation of 1637.10 m, and a maximum dam height of 50.0 m. The sandy gravel cover in the riverbed is provided with loam anti-seepage gullies with a bottom width of 8.0 m, a slope of 1:1.5, and gullies 2.5 m deep below the bedrock surface. Two rows of dam foundation anti-seepage curtains are built under the foundation. The first row of curtains goes deep under the severely weathered layer of 5.0 m, the second row of curtains goes deep under the weak permeable zone at 5 m, and a single row of anti-seepage curtains are set up within the range of 30 m extending from the dam abutment to both banks. The design scheme of grouting curtains is to hit the rock foundation with a permeability less than or equal to 5 Lu.
The Shangmo reservoir is a canyon type reservoir with most bank slopes above 35°, the right bank steeper than the left bank, and some steep walls. The abutment rock mass is strongly weathered and unloaded, and the highly weathered and unloaded zone at the top of the bank slope is relatively thick. Along the river bed, there are steep dip angles along the river to tectonic crushed rock zones with a width of tens of meters, which may cause reservoir bottom leakage along the river to tectonic crushed rock zones.
5.2. Seepage Analysis of the Reservoir Site in a Natural Period
5.2.1. Model and Parameters
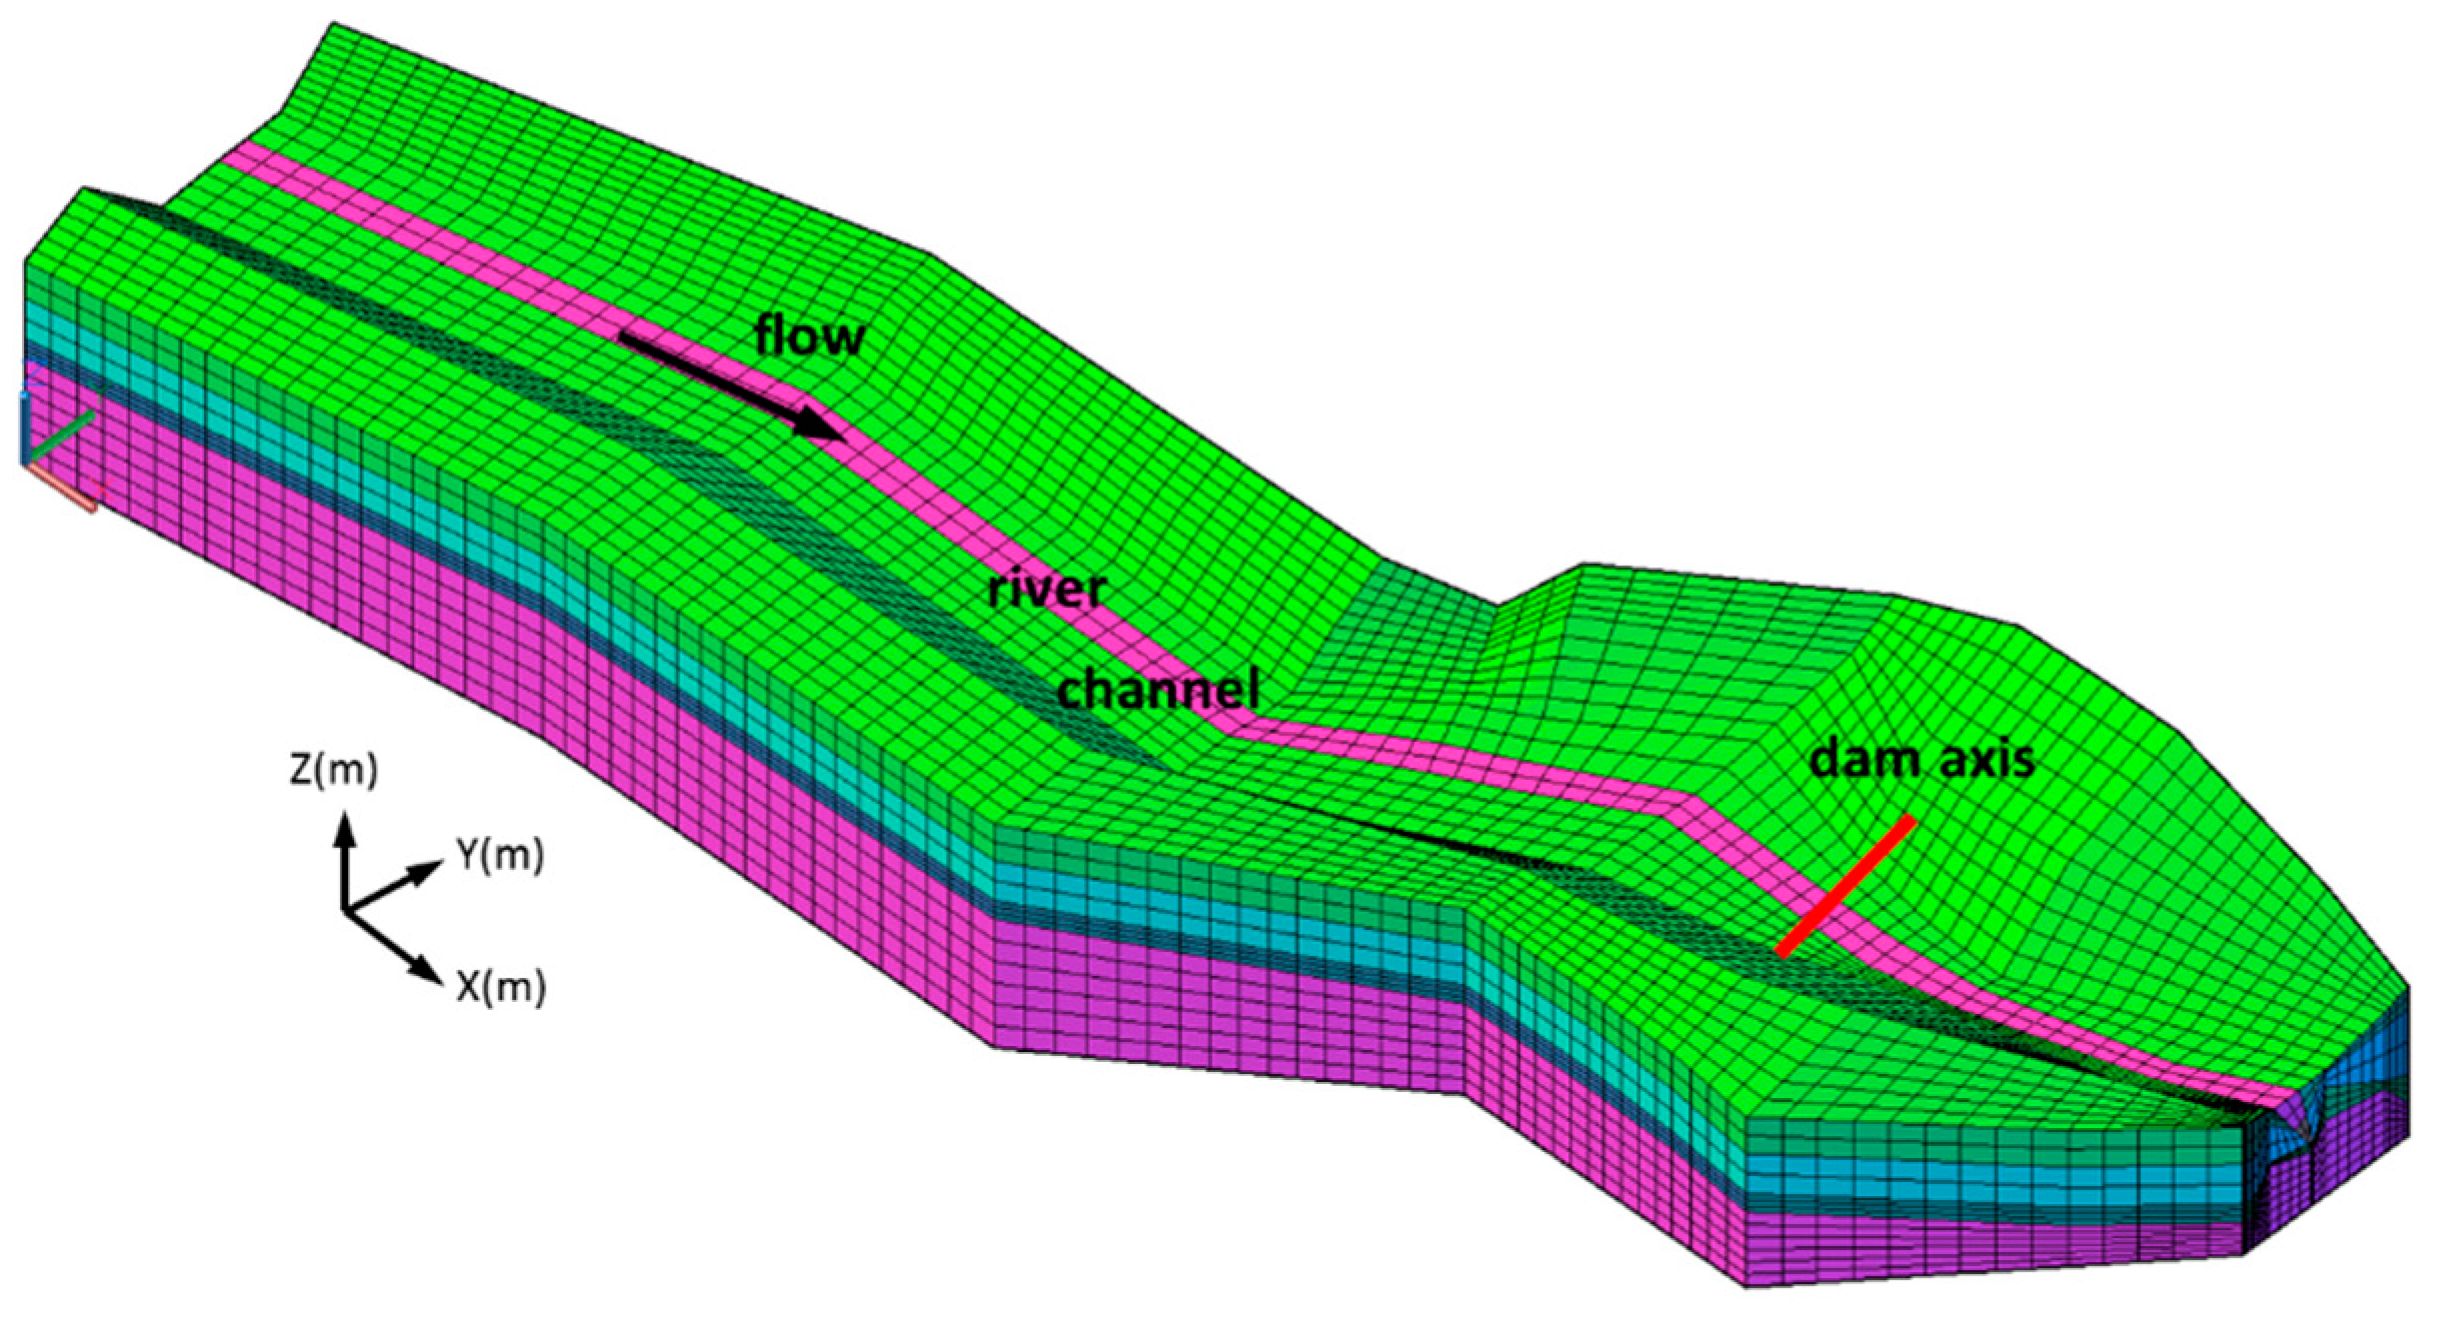
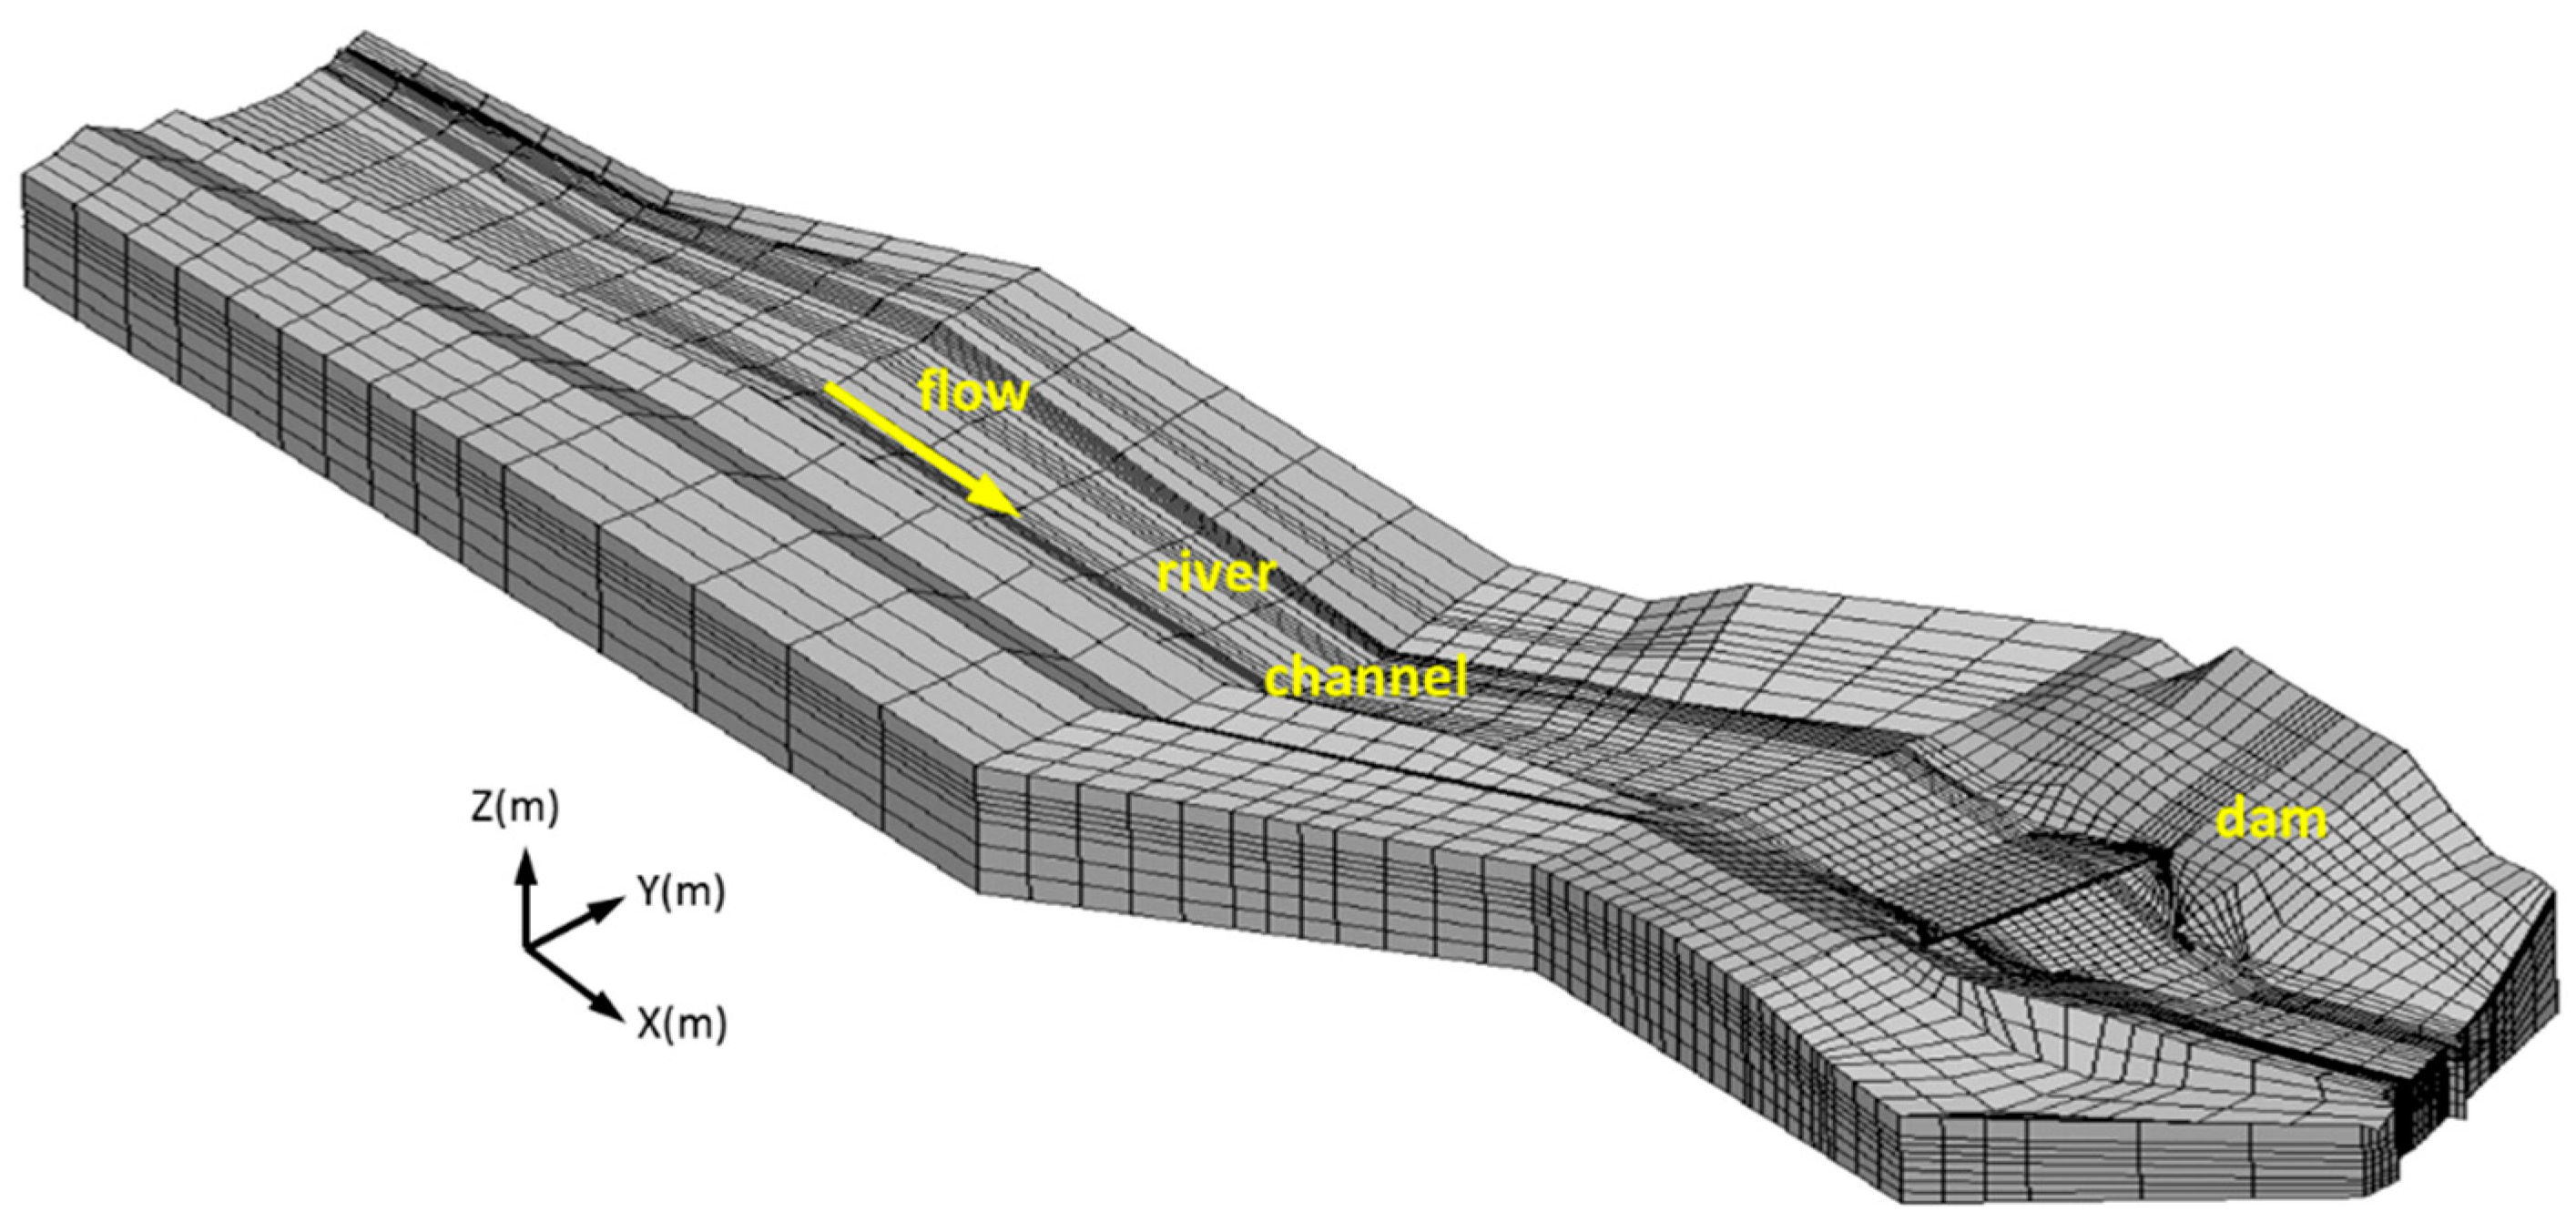
The three-dimensional seepage finite element calculation model for the natural period of the reservoir site area is modelling. The right control point of the dam is selected as the origin of the model, the x axis is along the river direction, and the upstream direction is positive to the downstream direction. The y axis is along the direction of the dam axis, and the right bank pointing to the left bank is positive. The z axis is vertical and positively upward. The scope of the model is set as follows: the left boundary near the dam site is at least 150 m from the left dam end. The right boundary is at least 150 m from the right dam end, and the right boundary at the downstream of the dam is taken to the middle line of the gully at the downstream of the right mountain. The reservoir intercepts the mountains on both sides of the river according to the trend of the river. The upstream interception boundary is at least 1500 m from the upstream dam toe. The downstream boundary is at least 250 m from the downstream dam toe. The reservoir and dam foundation boundary is taken at least 150 m below the curtain bottom line.
A three-dimensional finite element model including terrain, rock strata, faults, and the like in the calculation area is shown in Figure 9. The boundary conditions of the seepage model mainly include the known head boundary, seepage boundary, and impermeable boundary. (1) The known head boundary includes the riverbed surface below the river level of the natural river course and the left and right boundary (known groundwater level) of the model. (2) The seepage boundary is the hillside surface on the left and right bank of the reservoir, which is the boundary that is in contact with the atmosphere. (3) The impermeable boundary includes the intercepting boundary on both upstream and downstream sides of the model and the bottom surface of the model.
The seepage parameters are drawn up according to the results of field tests and inversion analysis of unstable seepage tests. Through inversion analysis of a natural period model, the permeability coefficients of dam foundation and reservoir rock masses can be obtained by the flexible tolerance method. The parameters of each layered rock masses are presented in Table 3.
5.2.2. Results and Discussions
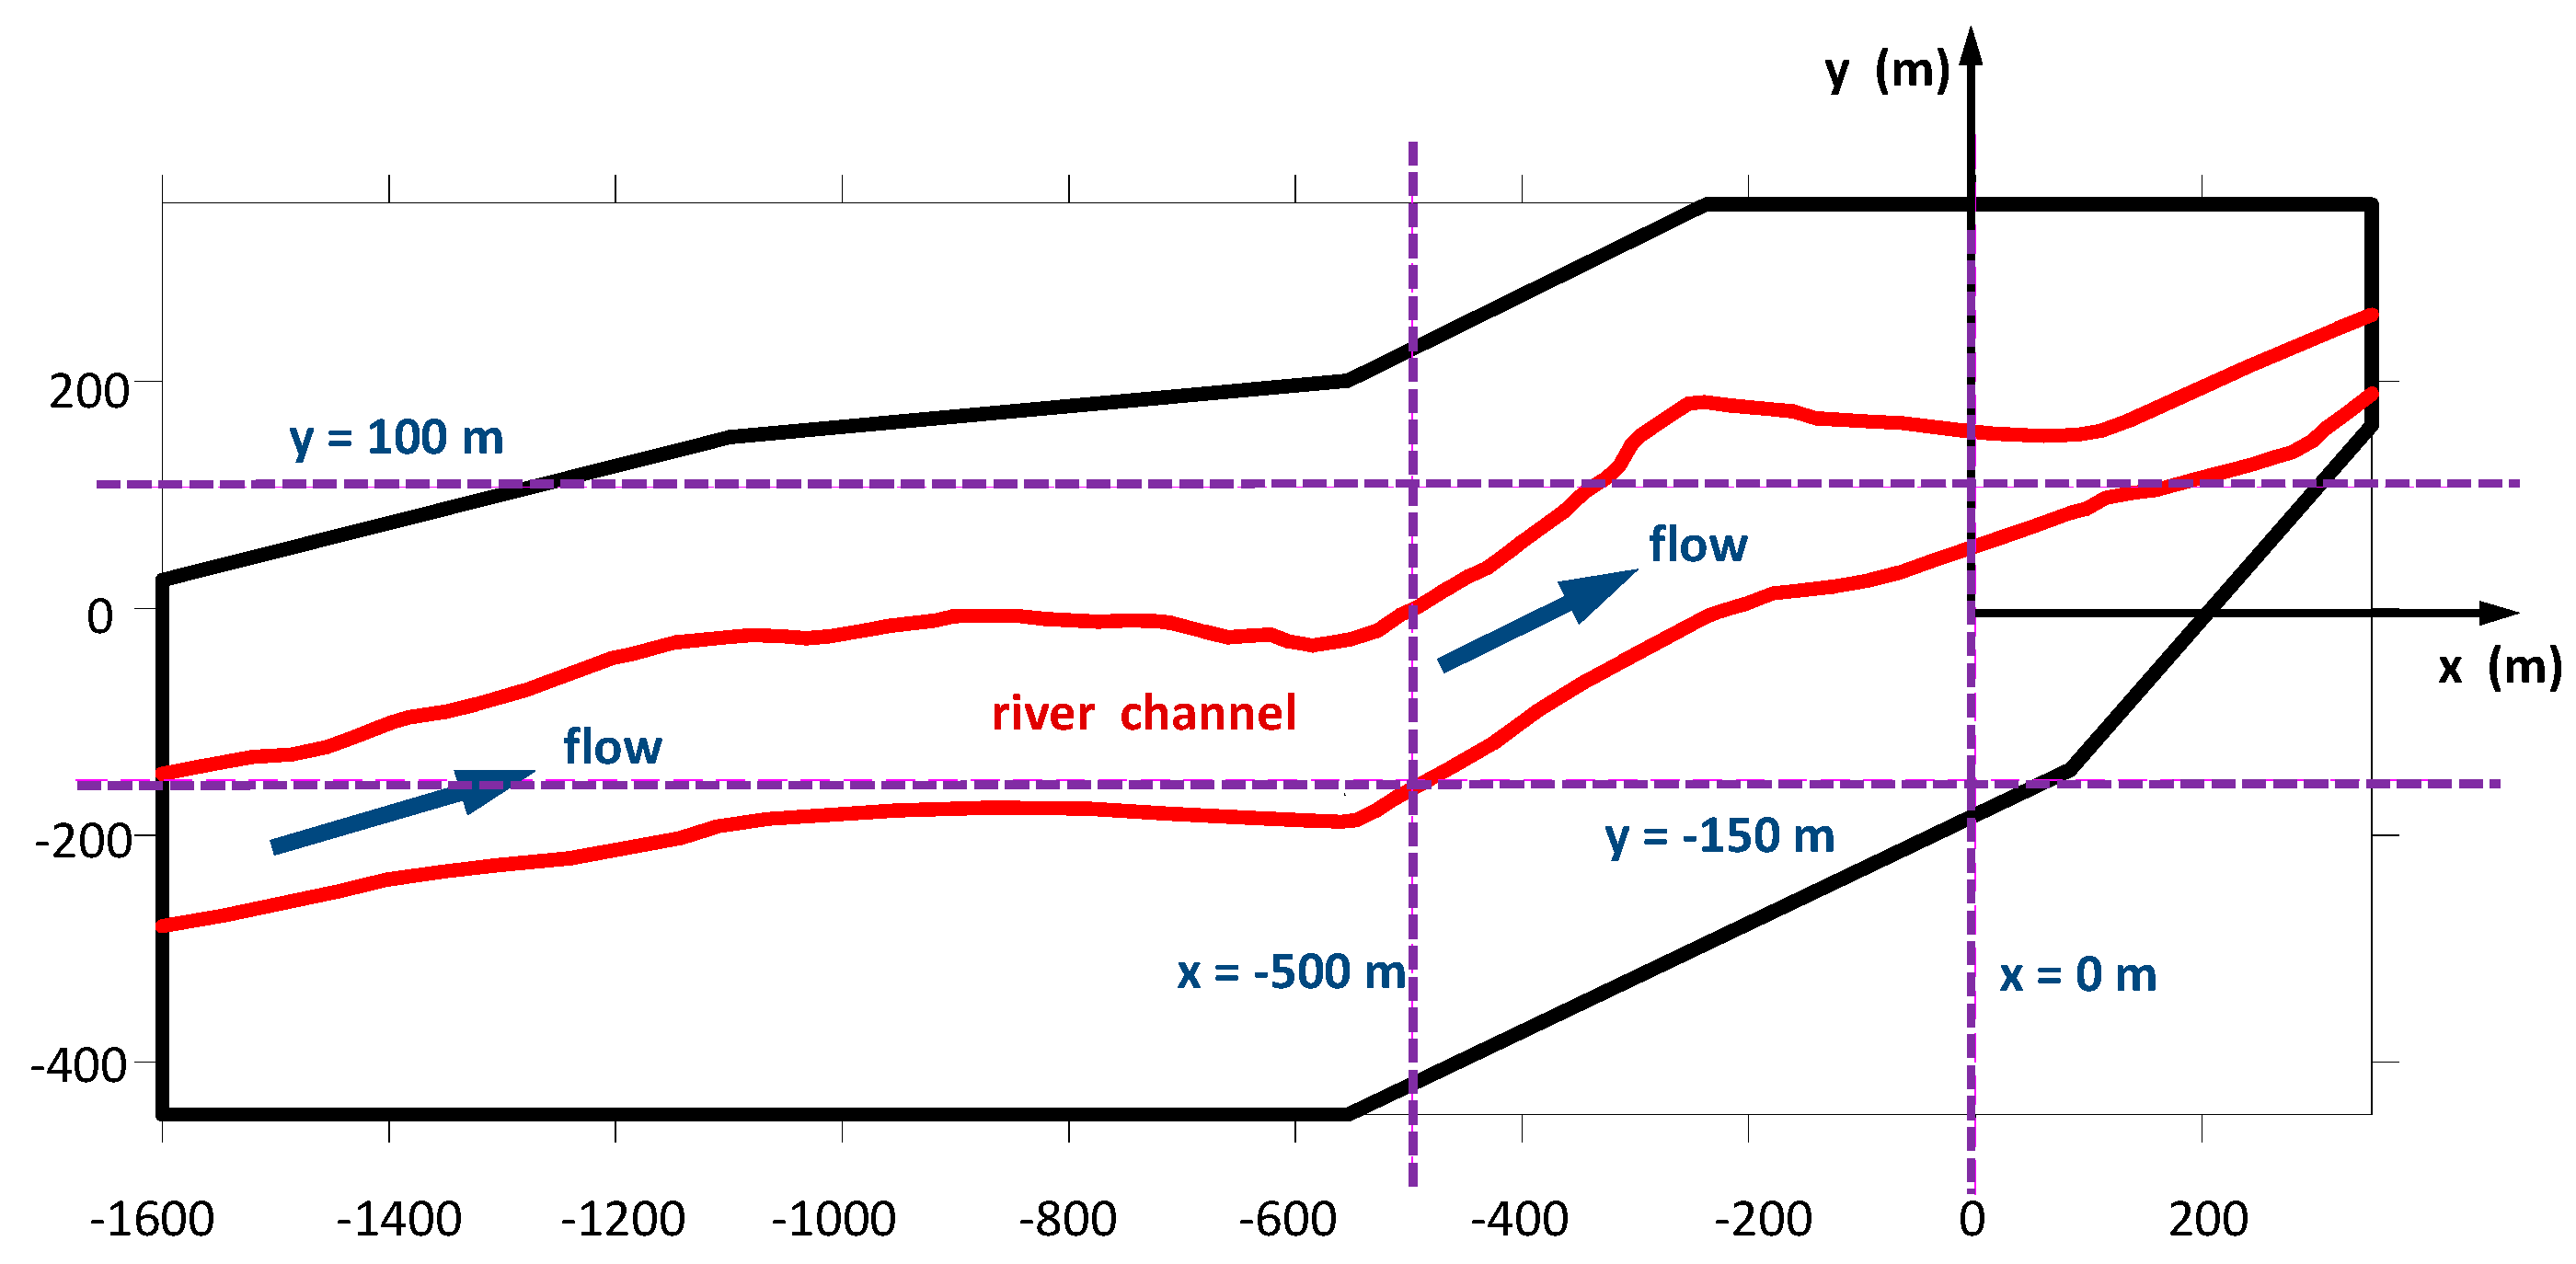
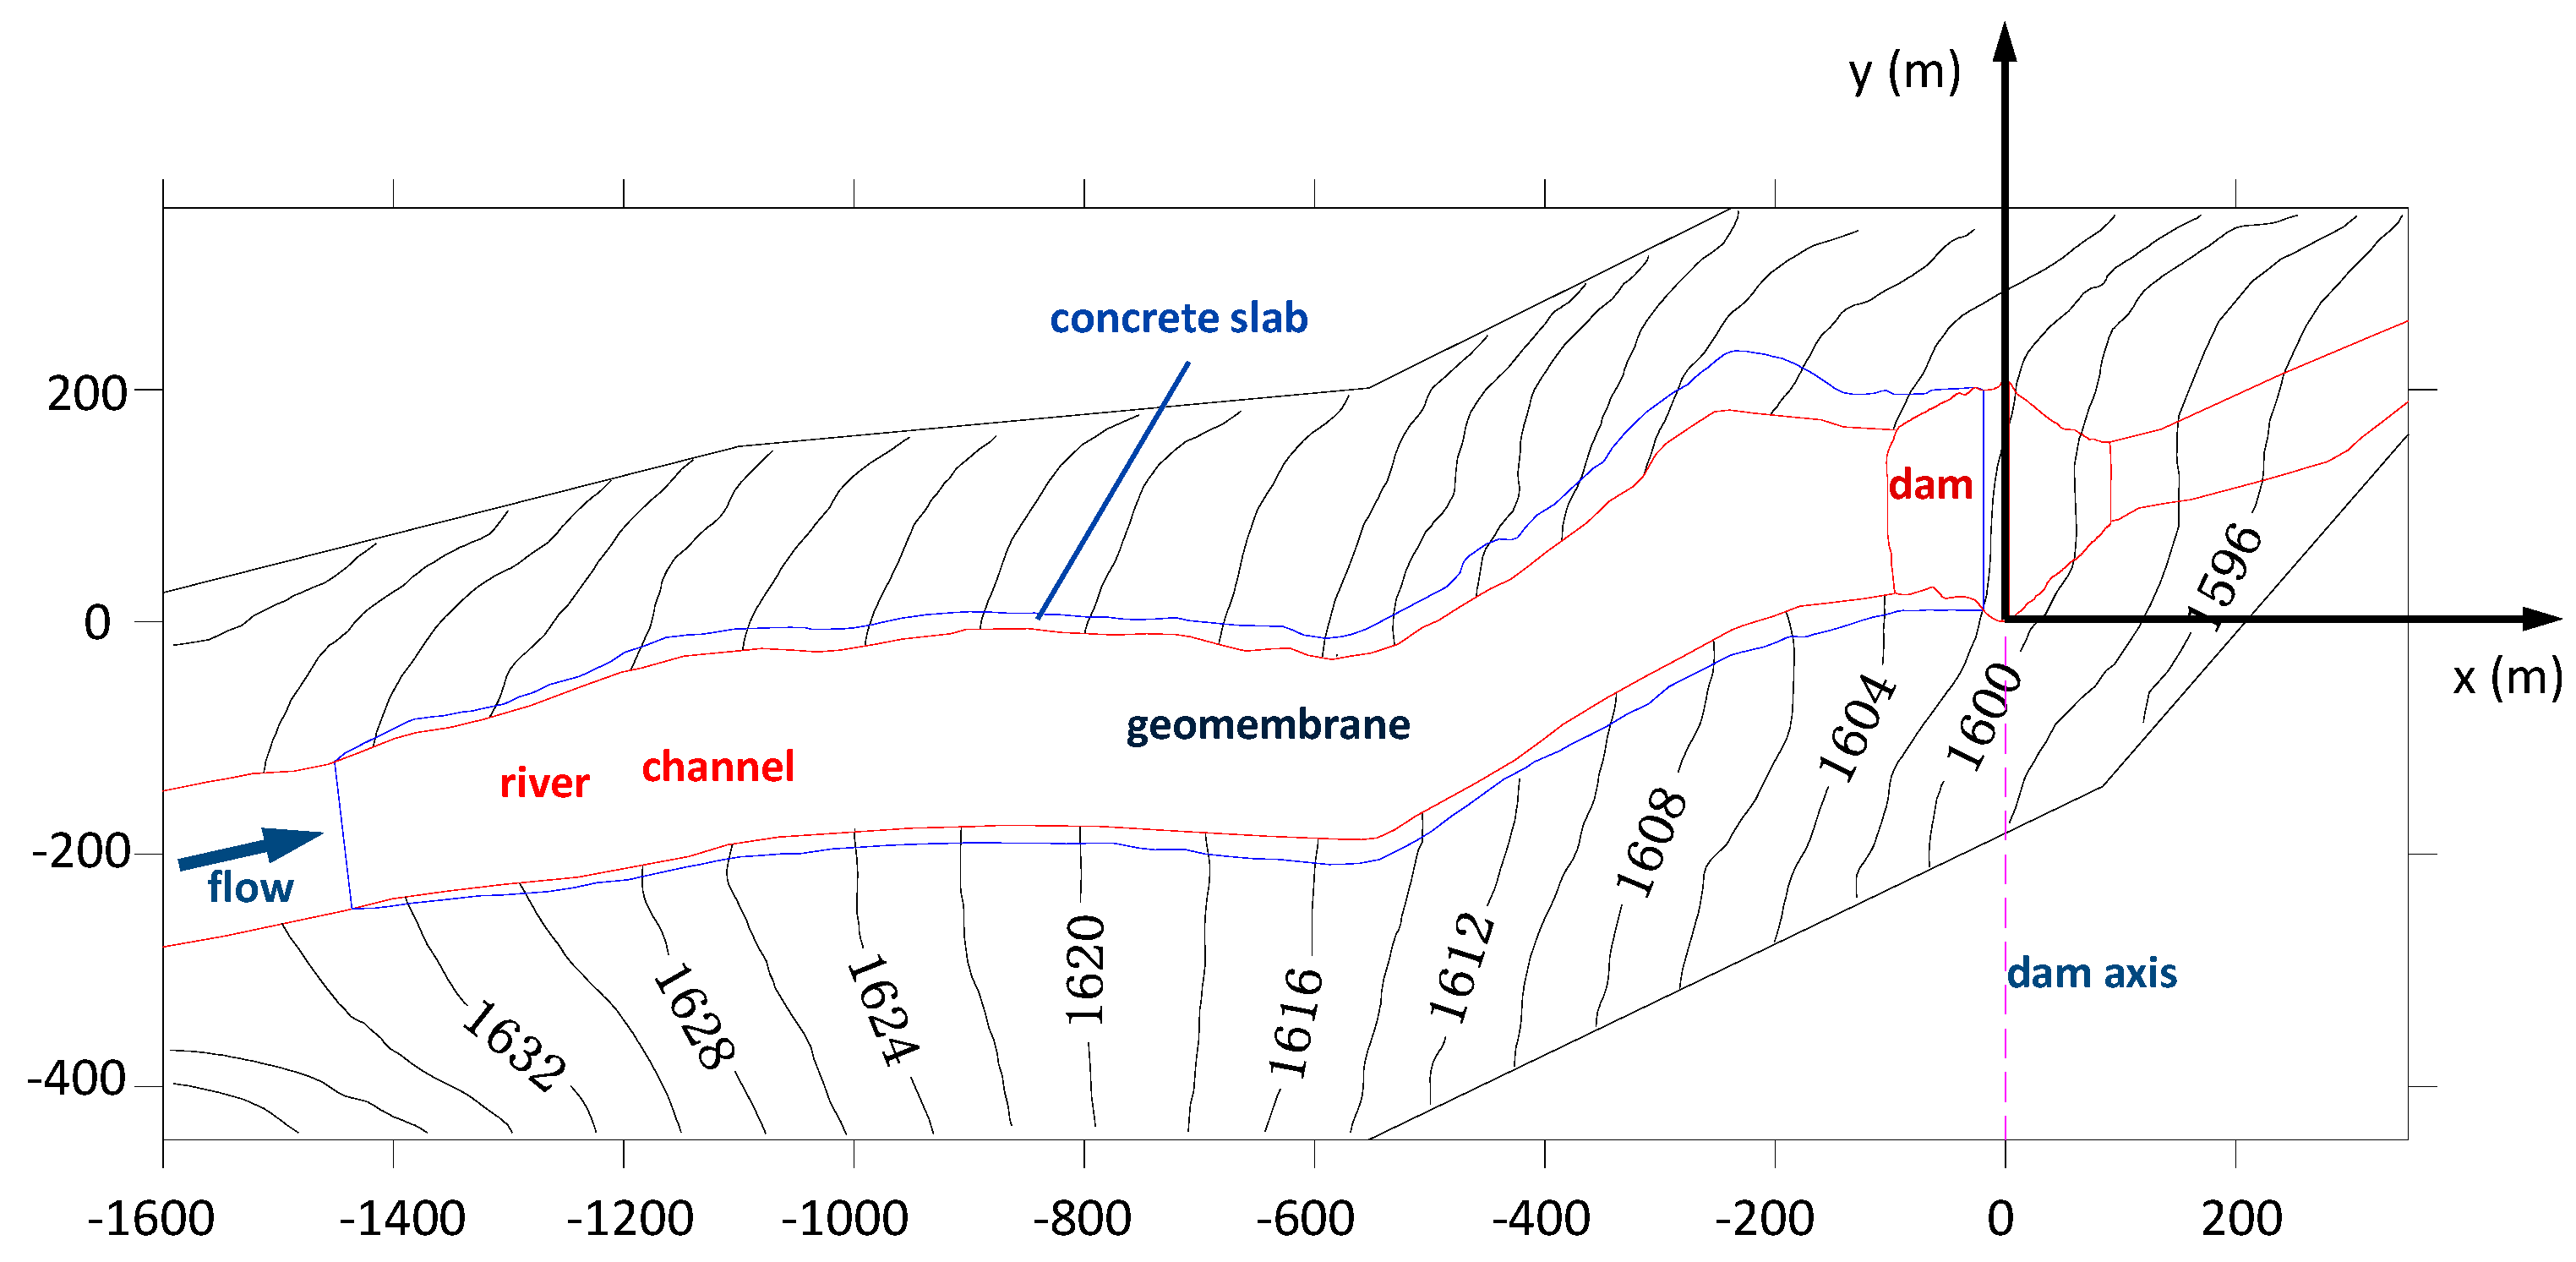
Four typical sections are selected, including dam axis section x = 0 m, upstream channel section x = −500 m, channel longitudinal section y = −150 m, and maximum dam height channel longitudinal section y = 100 m (see Figure 10) to analyze the groundwater level distribution in the reservoir site area.
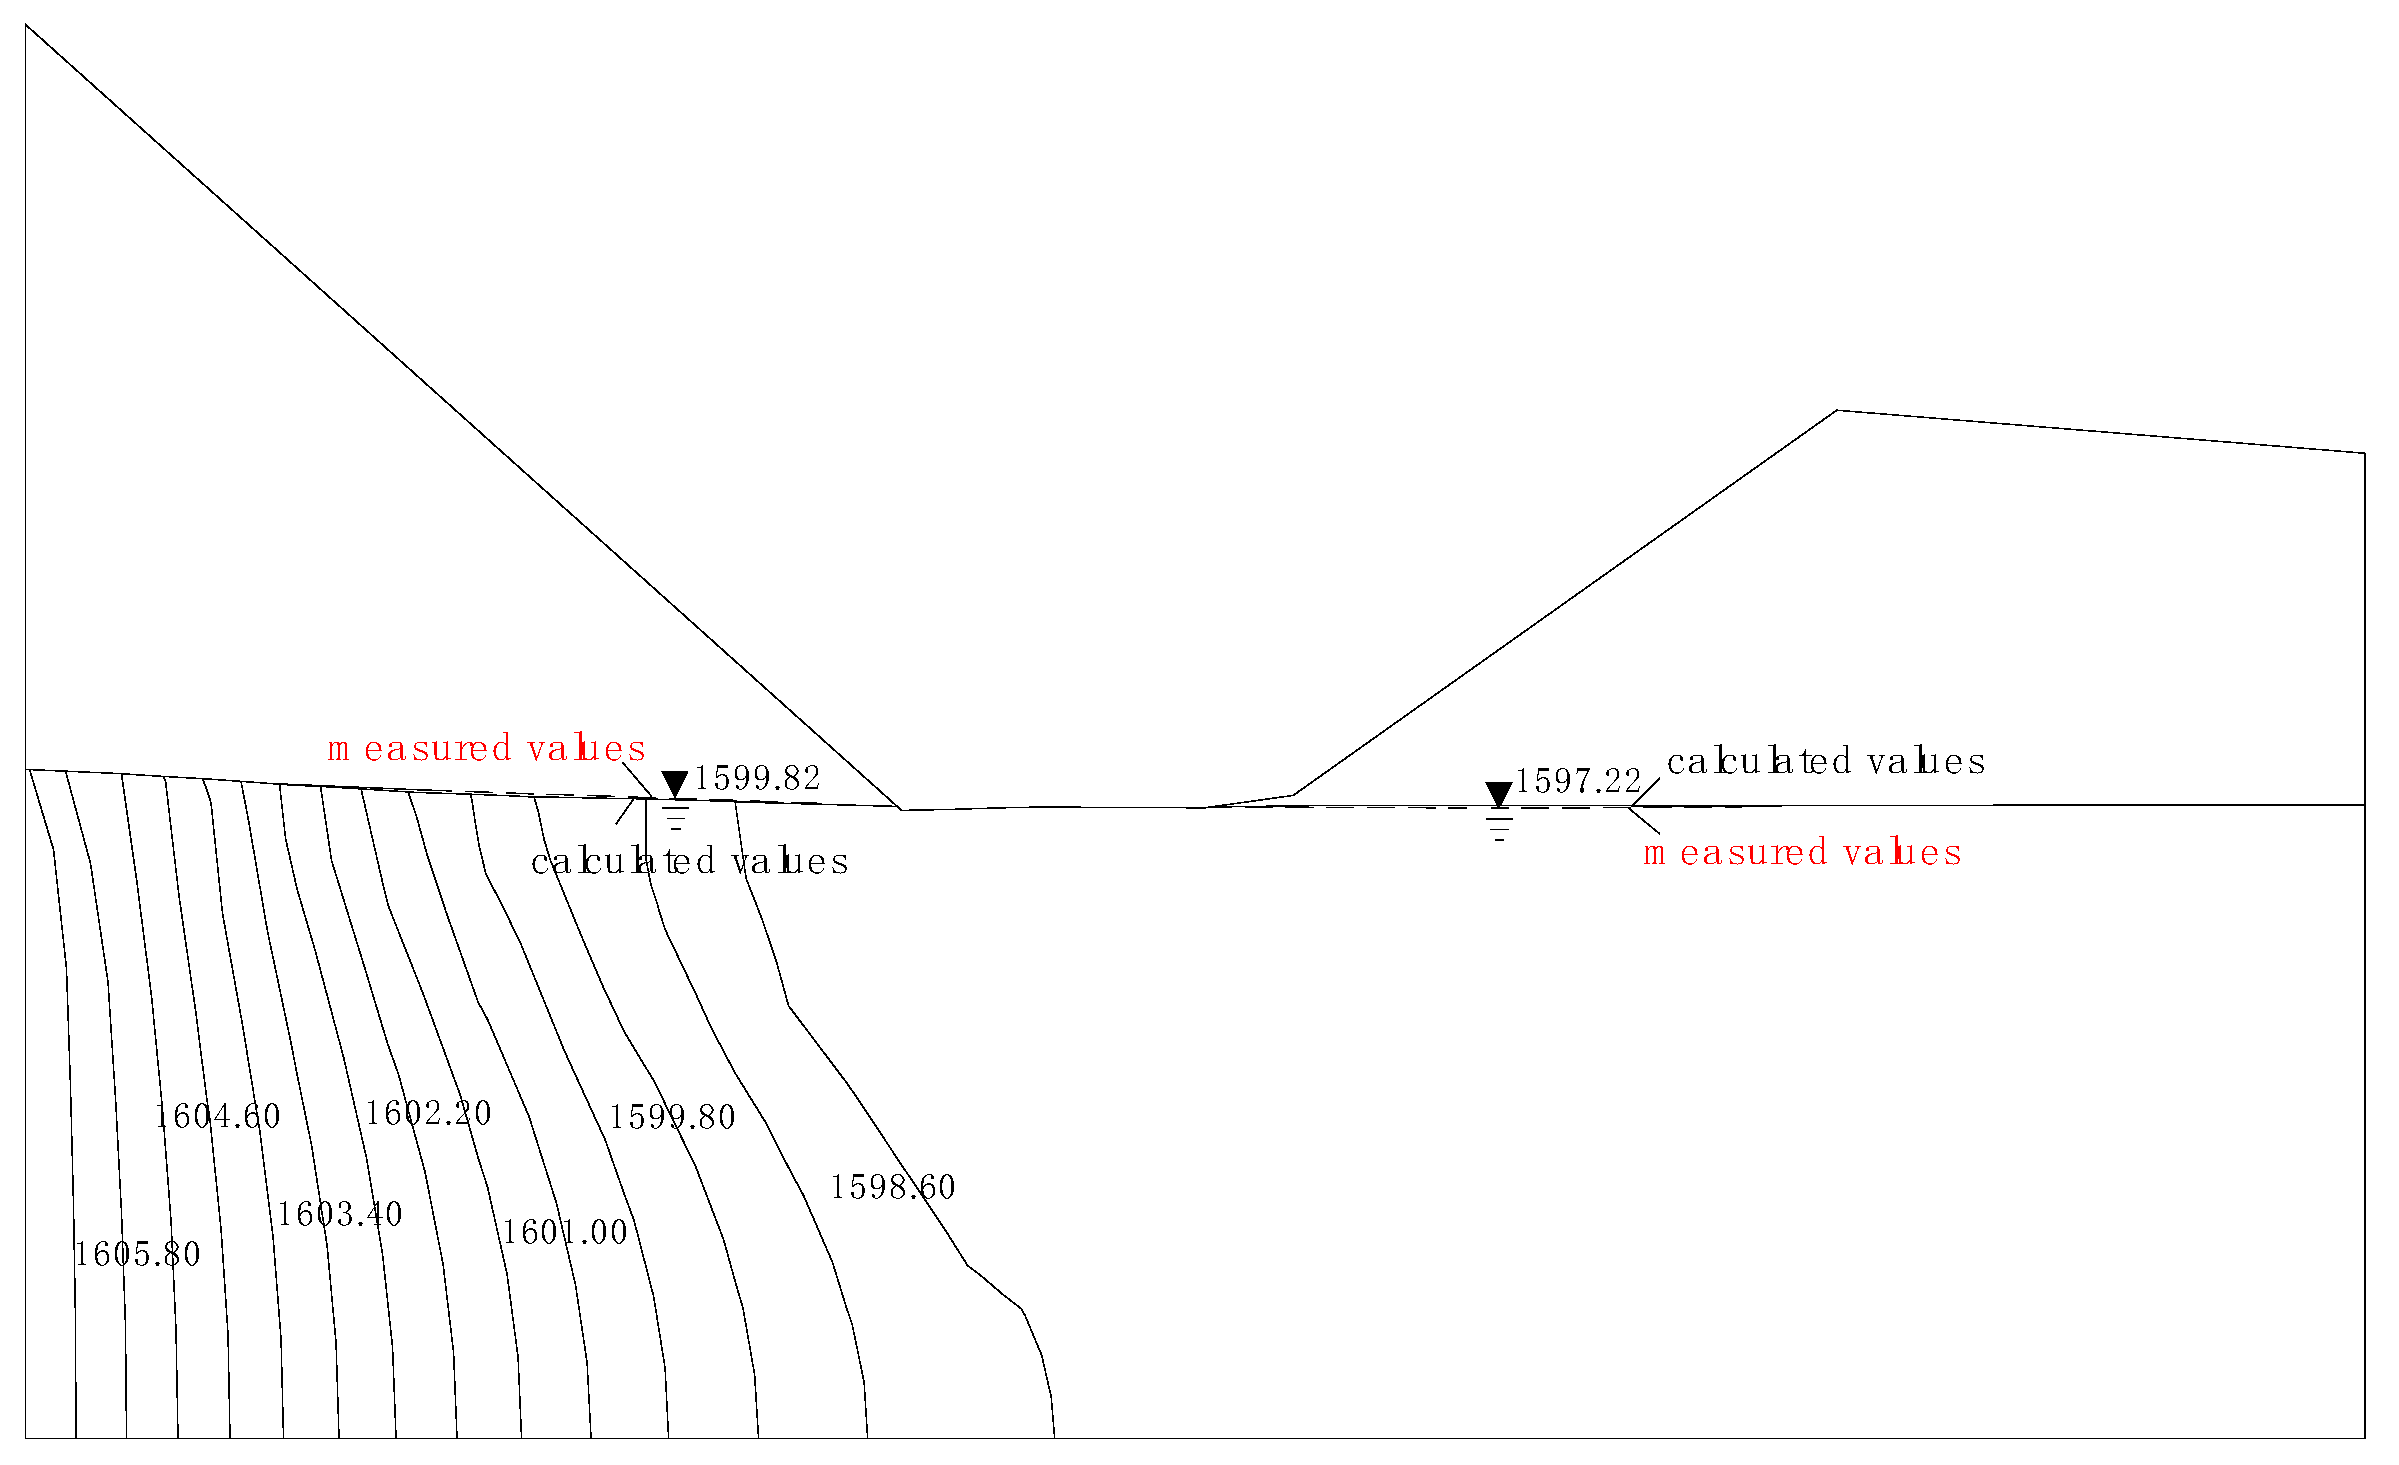
According to geological prospecting data and inversion analysis, the highest groundwater level in the reservoir site area of this project is 1607.00 m, and the lowest groundwater level is 1597.60 m. Figure 11 shows the groundwater level drawn by a geological survey of the dam axis profile and the groundwater level obtained by inversion analysis. The inversion calculation values of the groundwater level of the dam axis section are basically consistent with the measured values. In the local area near the riverbed on the right bank, the fitting error is large, the maximum error between the calculated value of the groundwater level and the measured value is −0.41 m, and the relative error is −4.36%, which meets the engineering precision requirements. Therefore, the inversion results fit the natural groundwater seepage field well, and the calculation model and boundary conditions are suitable.
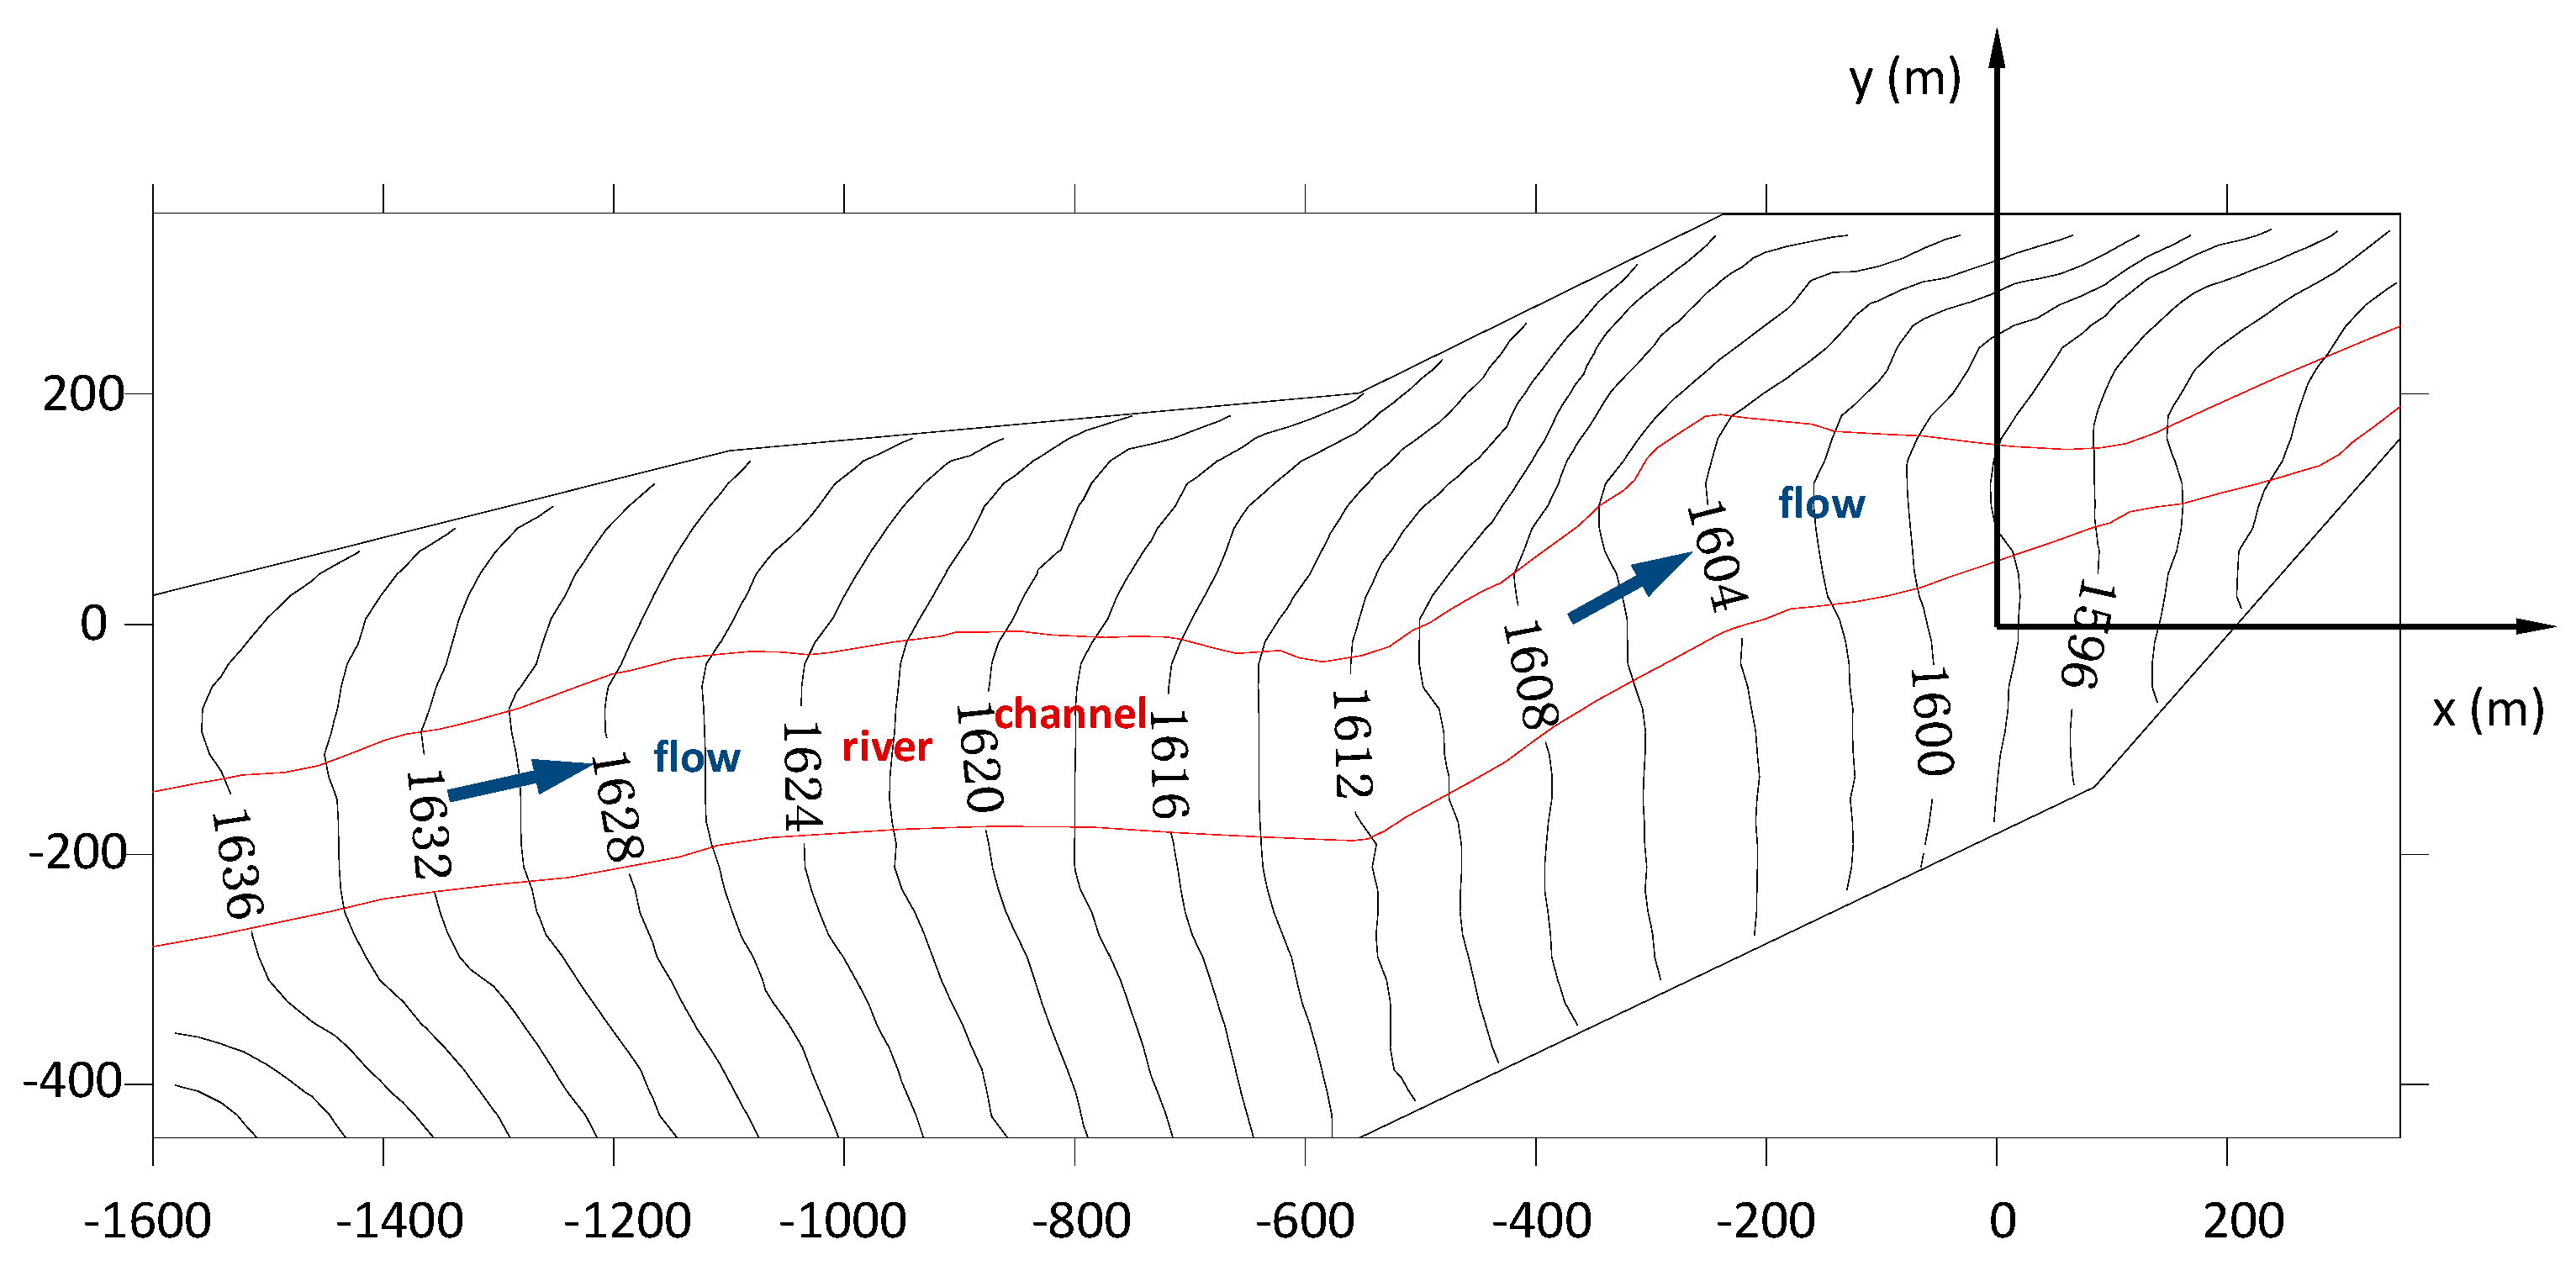
Figure 12 shows a contour map of the natural groundwater level in the reservoir site area. It can be seen in Figure 10 that the underground water level on the left bank of the reservoir site area is relatively high, and the underground water level on the right bank is relatively low and basically equal to the river bed water level. This is mainly due to the existence of a deep gully near the downstream of the dam axis of the right abutment, which is close to the dam axis and has a large angle with the dam axis, which makes the mountain body of the right abutment thin and the underground water level low. The groundwater level on the left and right banks of the upstream reservoir is also slightly higher than the river level, but the natural groundwater watershed on both sides of the reservoir does not exist, which is consistent with the actual situation.
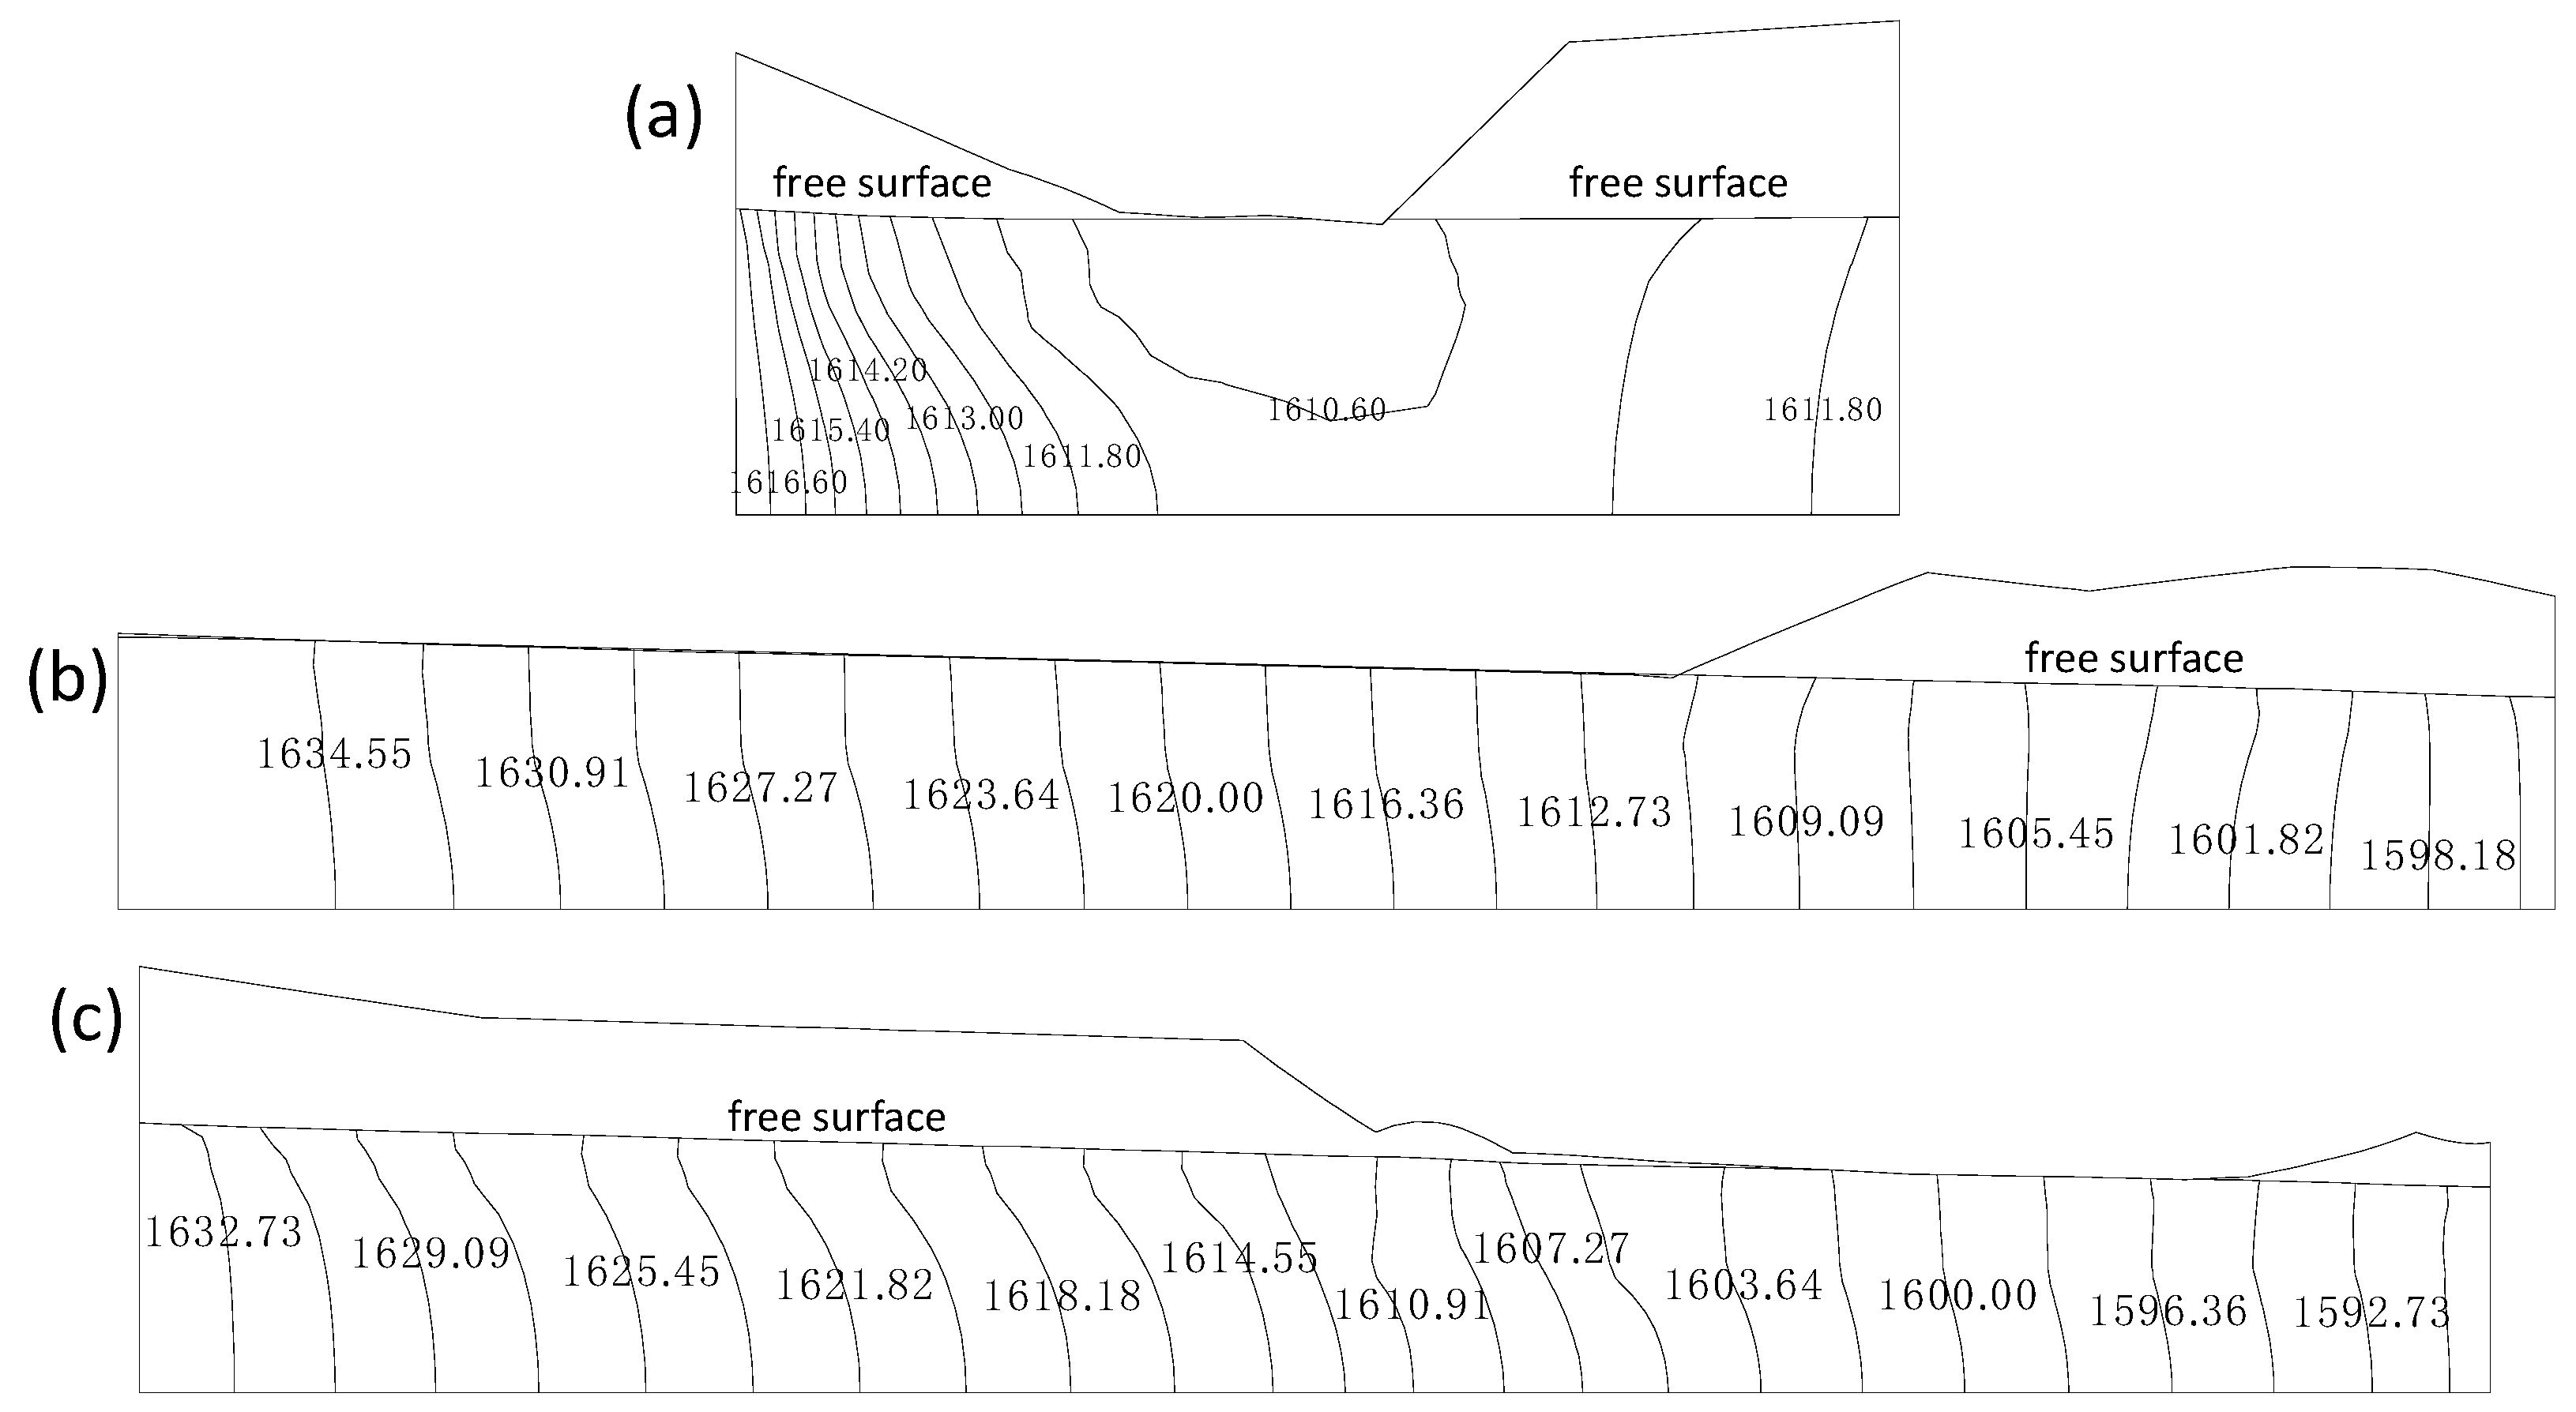
Figure 13 is the water head distribution diagram of each typical section of the natural model. As can be seen from the figure, the groundwater level generally decreases gradually from the left and right banks to the river channel and from the upstream to the downstream. The groundwater flows from the left and right banks to the river channel and from the upstream channel to the downstream channel. According to the contour map of the underground water level and the potential distribution map of each section, the underground water level in the junction area and the mountains on both sides of the reservoir is relatively low, and the hydraulic gradient is very small. Therefore, there is no watershed in the calculation range.
5.3. Seepage Analysis of Recommended Anti-Seepage Scheme for Reservoir Site
5.3.1. Model and Parameters
There are several deep fault fracture zones in the riverbed of the reservoir site of the Shangmo water supply project, and the fissures of the rock masses in the abutment are extremely developed, which results in large permeability coefficients of the rock masses. The recommended anti-seepage scheme of the reservoir site adopts the full anti-seepage form that combined the geomembrane and concrete slab. The composite geomembranes are laid on the upstream dam slope of the gravel dam and the riverbed surface, and the concrete slabs are arranged in the mountain areas on both sides of the reservoir bank below the checked flood level.
Based on the seepage model of the reservoir in a natural period, the structures of excavation, dam body, geomembrane, and concrete slab are supplemented to form the reservoir model of the recommended scheme. The geomembrane is simulated by a certain thickness of seepage medium. The other structures are simulated according to their actual sizes. The seepage model of the reservoir site area of the recommended anti-seepage scheme is shown in Figure 14.
The rock parameters of the recommended scheme adopt the parameters of the natural period model, as listed in Table 3. The permeability coefficients of the dam body, geomembrane, concrete panel, and other materials are presented in Table 4. The normal water storage level is 1632.27 m, and there is no water downstream. The seepage boundary conditions of the model are as follows: (1) The known head boundary includes the riverbed, banks, and the dam below the normal water level, and the left and right boundary (known groundwater level) of the model. (2) The seepage boundary is the surface on the left and right bank of the reservoir and the dam above normal water level, which is the boundary that is in contact with the atmosphere. (3) The impermeable boundary includes the intercepting boundary on both upstream and downstream sides of the model and the bottom surface of the model.
5.3.2. Results and Discussions
Figure 15 shows the contour map of the groundwater level in the reservoir site area of the recommended scheme. As can be seen in the figure, the water storage of the reservoir is affected by the seepage resistance of the geomembrane and the concrete slab, and the infiltration surface drops suddenly at the anti-seepage parts of the geomembrane and the concrete slab. Therefore, the water storage of the reservoir has little influence on the distribution of the groundwater level in the reservoir area. The movement trend of the groundwater is that the two banks supply water to the river channel, and seepage flows from the mountain on both banks of the upstream to the stratum below the bottom of the downstream reservoir. The water storage of the reservoir would leak to the outside of the reservoir through geomembranes at the bottom of the reservoir and concrete slabs on both sides of the reservoir.
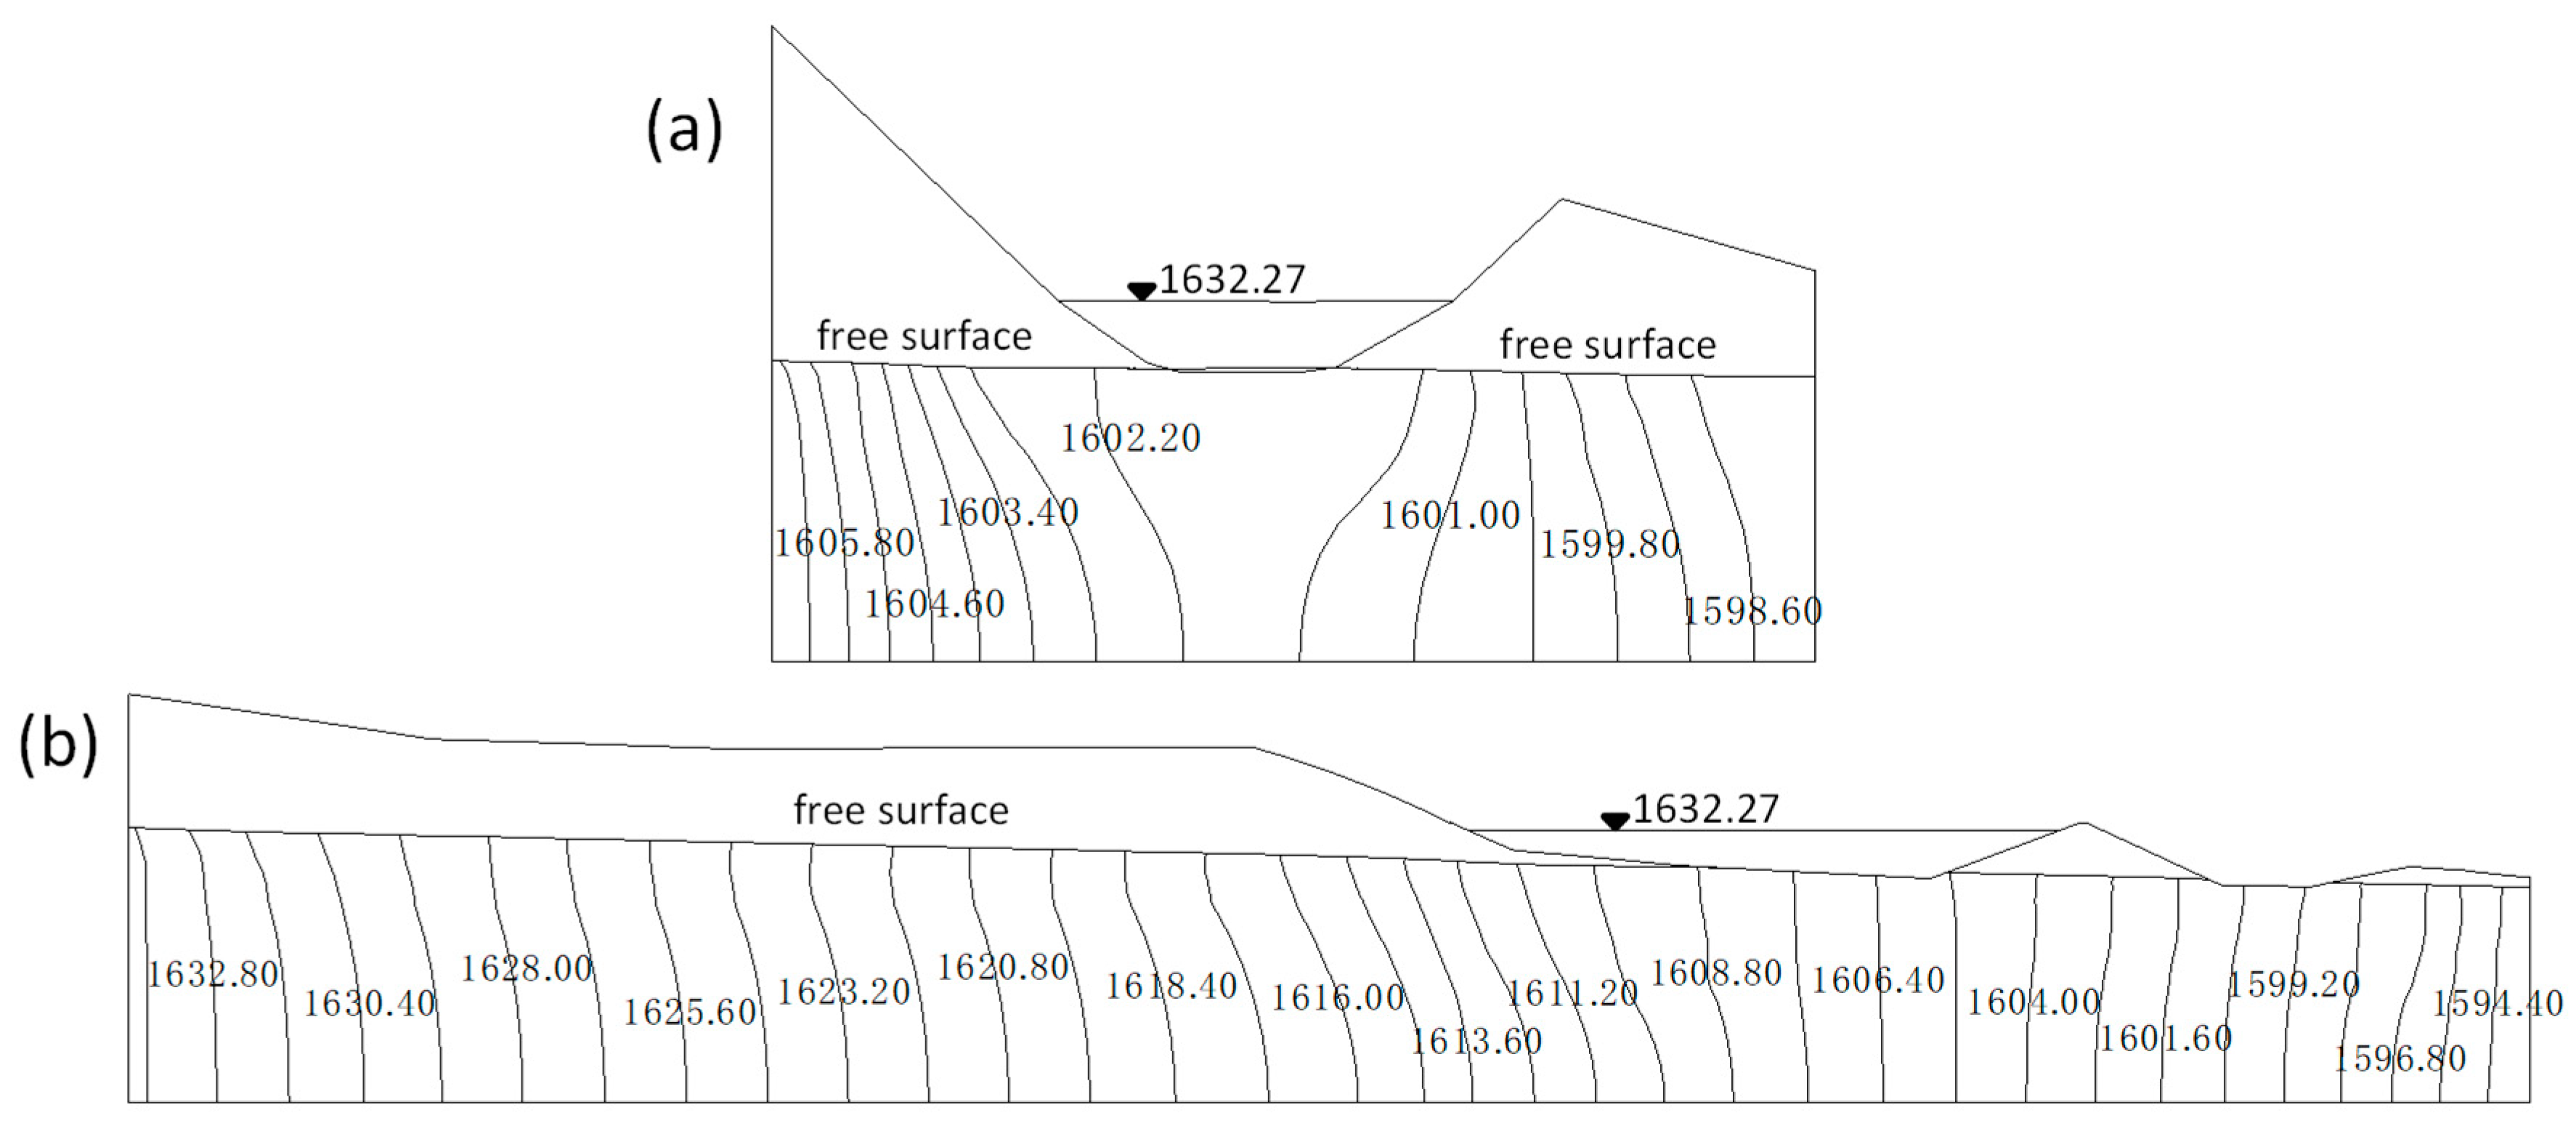
The water head distribution of typical sections in the reservoir site area under the recommended scheme is presented in Figure 16. The figure shows the seepage gradient of the rock masses on both sides of the reservoir bank is small and uniform. The free surface in the rockfill area of the dam body is slightly higher than the dam foundation surface, and its maximum seepage gradient is 0.032, which occurs at the exit point of the downstream dam slope. The seepage gradient of the left bank rock mass at the exit of the downstream side of the dam body is 0.263, and the maximum seepage gradient of the fault fracture zone is 0.0345. The water head is mainly reduced by the effects of the geomembrane and concrete slab. The maximum seepage gradient of the geomembrane and concrete slab is 322.70 and 161.35, respectively. The seepage gradient of each zone of the reservoir area is within the allowable range, which meets the requirements of seepage stability.
In the natural period, the seepage flow rate through the dam axis section is 2.794 m3/s, and that is 2.801 m3/s for the recommended anti-seepage scheme. Therefore, the leakage of the reservoir under the recommended scheme is 0.007 m3/s, which is far less than the multi-year average runoff of 0.355 m3/s at the reservoir site. This shows that the recommended anti-seepage scheme can effectively solve the problem of large leakage in the reservoir area and ensures the normal storage and operation of the reservoir.
6. Conclusions
In this paper, a comprehensive back analysis method of seepage parameters for rock masses is proposed, which includes two different scales. One is the inversion of permeability coefficient of fractured rock mass near the single borehole on the basis of the unsteady pressure water test. The second is the back analysis of rock permeability of dam foundation and abutment in the whole reservoir site area by using the flexible tolerance method. Lastly, the permeability coefficients of the rock masses of each zone in the entire reservoir area are taken as the seepage parameters for one water supply engineering. The knowledge gained from this research is summarized as follows.
(1) Back analysis results of the borehole show that the equivalent permeability coefficients of the rock masses in the depth of 16 m below the road surface at the position of borehole ZK0 of Shangmo reservoir is 1.12 × 10⁻³ cm/s. The maximum error of the measured leakage and calculated values in each period are 3.43% and 4.67%. Moreover, the RMSE and R2 of the measured and calculated values are 1.33 × 10⁻⁴ m3/s and 0.9976, respectively, which indicates the inversion values can match well with the measured data.
(2) The inversion method of the permeability coefficient is applied to other boreholes. The equivalent permeability coefficients of the rock masses at different depths around the ZK2 to ZK8 boreholes were between 0.047 cm/s to 0.750 cm/s. It shows that the rock masses in the reservoir site area have high permeability. The seepage parameters of each rock mass zone in the reservoir area were obtained by using the flexible tolerance method. The results show that the maximum error between the calculated value of the groundwater level and measured value is −0.41 m, and the relative error is −4.36%, which meets the engineering precision requirements.
(3) The proposed approach was used to analyze the three-dimensional seepage field of the Shangmo water supply project. The groundwater level in the junction area and the mountains on both sides of the Shangmo reservoir is low, and the seepage gradient is small. There is no watershed within the scope of the reservoir site area. The full anti-seepage scheme combined the geomembrane and the concrete slab, which can effectively solve the problem of large leakage in the reservoir area. This indicates that the comprehensive permeability coefficient inversion method proposed in this paper is appropriate for the seepage analysis of the field with the fractured rock masses or developed faults and fissures.
Author Contributions
L.G. and Z.S. designed the framework and wrote the manuscript. L.G. and G.C. collected the data. L.G. mainly responsible for the simulation analysis. Z.S. and G.C. verified the results of our work. L.G., Z.S. and G.C. discussed the results and contributed to the final manuscript. All authors have read and agreed to the published version of the manuscript.
Funding
The National Natural Science Foundation of China (No.51609073), the Fundamental Research Funds for the Central Universities (No. 2018B11514), the Open Program of Safety and Disaster Prevention Engineering Technology Research Center of the Ministry of Water Resources (2018001), and the Priority Academic Program Development of Jiangsu Higher Education Institutions (YS11001) funded this research.
Conflicts of Interest
The authors declare no conflict of interest.
References
- Chen, S.H.; Xue, L.L.; Xu, G.S.; Shahrour, I. Composite element method for the seepage analysis of rock masses containing fractures and drainage holes. Int. J. Rock Mech. Min. Sci. 2010, 47, 762–770. [Google Scholar] [CrossRef]
- Ikard, S.J.; Rittgers, J.; Revil, A.; Mooney, M.A. Geophysical investigation of seepage beneath an earthen dam. Groundwater 2014, 53, 238–250. [Google Scholar] [CrossRef] [PubMed]
- Lee, J.Y.; Choi, Y.K.; Kim, H.S.; Yun, S.T. Hydrologic characteristics of a large rockfill dam: Implications for water leakage. Eng. Geol. 2005, 80, 43–59. [Google Scholar] [CrossRef]
- Xiang, Y.; Wang, L.; Wu, S.H.; Yuan, H.; Wang, Z.J. Seepage analysis of the fractured rock mass in the foundation of the main dam of the Xiaolangdi water control project. Environ. Earth Sci. 2015, 74, 4453–4468. [Google Scholar] [CrossRef]
- Chen, Y.F.; Zhou, C.B.; Zheng, H. A numerical solution to seepage problems with complex drainage systems. Comput. Geotech. 2008, 35, 383–393. [Google Scholar] [CrossRef]
- Levasseur, S.; Collin, F.; Charlier, R.; Kondo, D. A micro-macro approach of permeability evolution in rocks excavation damaged zones. Comput. Geotech. 2013, 49, 245–252. [Google Scholar] [CrossRef]
- Li, Y.; Chen, Y.F.; Jiang, Q.H.; Hu, R.; Zhou, C.B. Performance assessment and optimization of seepage control system: A numerical case study for Kala underground powerhouse. Comput. Geotech. 2014, 55, 306–315. [Google Scholar] [CrossRef]
- Oda, M. Permeability tensor for discontinuous rock masses. Geotechnique 1985, 35, 483–495. [Google Scholar] [CrossRef]
- Oda, M. An equivalent continuum model for coupled stress and fluid analysis in jointed rock masses. Water Resour. Res. 1986, 22, 1845–1856. [Google Scholar] [CrossRef]
- He, J.; Chen, S.H.; Shahrour, I. Back analysis of equivalent permeability tensor for fractured rock masses from packer tests. Rock Mech. Rock Eng. 2011, 44, 491–496. [Google Scholar] [CrossRef]
- He, J.; Chen, S.H. A revised solution of equivalent permeability tensor for discontinuous fractures. J. Hydrodyn. 2012, 24, 711–717. [Google Scholar] [CrossRef]
- Wines, D.R.; Lilly, P.A. Measurement and analysis of rock mass discontinuity spacing and frequency in part of the Fimiston Open Pit operation in Kalgoorlie, Western Australia: A case study. Int. J. Rock Mech. Min. Sci. 2002, 39, 589–602. [Google Scholar] [CrossRef]
- Louis, C.; Maini, Y.N. Determination of in Situ Hydraulic Parameters in Jointed Rock. In Proceedings of the 2nd International Congress on Rock Mechanics, ISRM, Belgrade, Serbia, 21–26 September 1970; pp. 235–245. [Google Scholar]
- Singhal, B.B.; Gupta, R.P. Applied Hydrogeology of Fractured Rocks; Kluwer Academic Publishers: Dordrecht, The Netherlands, 1999. [Google Scholar]
- Hsieb, P.; Neumann, S.P.; Simpson, E.S.; Stiles, G. Field determination of the three dimensional hydraulic conductivity tensor of anisotropic media: 1. theory. Water Resour. Res. 1985, 21, 1655–1665. [Google Scholar]
- Hsieb, P.; Neumann, S.P.; Simpson, E.S.; Stiles, G. Field determination of the three dimensional hydraulic conductivity tensor of anisotropic media: 2. methodology with application to fractured rocks. Water Resour. Res. 1985, 21, 1667–1676. [Google Scholar]
- Nappi, M.; Esposito, L.; Piscopo, V.; Rega, G. Hydraulic characterisation of some arenaceous rocks of Molise (SouthernItaly) through outcropping measurements and Lugeon tests. Eng. Geol. 2005, 81, 54–64. [Google Scholar] [CrossRef]
- Sánchez, M.A.; Foyo, A.; Tomillo, C. Application of the Lugeon test in landfill hydrologic studies. Environ. Eng. Sci. 2006, 12, 125–136. [Google Scholar] [CrossRef]
- Liu, X.S.; She, C.X.; Zhang, L.J. Back analysis of seepage with ANN based on alternative and interative algorithm. Chin. J. Rock Eng. 2004, 23, 1470–1475. [Google Scholar]
- Vahid, N.; Ali, B. Integration of artificial neural networks with radial basis function interpolation in earthfill dam seepage modeling. J. Comput. Civ. Eng. 2013, 27, 183–195. [Google Scholar]
- Whitley, D.; Starkweather, T.; Bogart, C. Genetic algorithms and neural networks: Optimizing connections and connectivity. Parallel Comput. 1990, 14, 347–361. [Google Scholar] [CrossRef]
- Lin, T.H.; Chiu, S.H.; Tsai, K.C. Supervised feature ranking using a genetic algorithm optimized artificial neural network. J. Chem. Inf. Model. 2006, 46, 1604–1614. [Google Scholar] [CrossRef]
- Ren, J.; Shen, Z.Z.; Yang, J.; Yu, C.Z. Back analysis of the 3D seepage problem and its engineering applications. Environ. Earth Sci. 2016, 75, 1–8. [Google Scholar] [CrossRef]
- Angulo, B.; Morales, T.; Uriarte, J.A.; Antiguedad, I. Hydraulic conductivity characterization of a karst recharge area using water injection tests and electrical resistivity logging. Eng. Geol. 2011, 117, 90–96. [Google Scholar] [CrossRef]
- Moon, J.S. Representativeness of jointed rock mass hydraulic conductivity obtained from packer tests for tunnel inflow rate estimate. Int. J. Rock Mech. Min. Sci. 2011, 48, 836–844. [Google Scholar] [CrossRef]
- Trottier, N.; Delay, F.; Bildstein, O.; Ackerer, P. Inversion of a dual-continuum approach to flow in a karstified limestone: Insight into aquifer heterogeneity revealed by well-test interferences. J. Hydrol. 2014, 508, 157–169. [Google Scholar] [CrossRef]
- Shen, Z.Z.; Xu, L.Q.; Cui, J.; Jia, J. A New Interpolation Meshing Method for Calculating Seepage Flux of Well. In Proceedings of the 3rd International Conference on Bioinformatics and Biomedical Engineering, Beijing, China, 11–16 June 2009; pp. 5834–5837. [Google Scholar]
- Shen, Z.Z.; Zhao, J.; Wu, L.L. A flexible tolerance method of inverting the percolation parameter. Water Resour. Power 1999, 3, 5–8. [Google Scholar]
- Vafakhah, M. Comparison of cokriging and adaptive neuro-fuzzy inference system models for suspended sediment load forecasting. Arab. J. Geosci. 2013, 6, 3003–3018. [Google Scholar] [CrossRef]
Figure 1.
Seepage boundary conditions of a mean earth dam.

Figure 2.
Sketch of a single-hole water pressure test.

Figure 3.
Layout of boreholes in the dam site.

Figure 4.
Photo of the rock core sample.

Figure 5.
Unsteady seepage calculation model (unit: m).

Figure 6.
Variation trend of the water level in borehole ZK0 (unit: m).

Figure 7.
Water head distribution of the borehole profile at different time periods (unit: m): (a) t = 0 s, (b) t = 72 s, and (c) t = 144 s.
Figure 7.
Water head distribution of the borehole profile at different time periods (unit: m): (a) t = 0 s, (b) t = 72 s, and (c) t = 144 s.

Figure 8.
Comparison of seepage discharge between measured values and inversion values.

Figure 9.
Model of the reservoir site area during the natural period.

Figure 10.
Layout of the main typical sections (unit: m).

Figure 11.
Measured and calculated values of a natural groundwater level in the dam axis section (unit: m).
Figure 11.
Measured and calculated values of a natural groundwater level in the dam axis section (unit: m).

Figure 12.
Groundwater level contours (unit: m).

Figure 13.
Water head distribution of typical sections (unit: m): (a) Cross section of upstream channel (x = −500 m), (b) river profile (y = −150 m), and (c) profile of the maximum dam height (y = 100 m).
Figure 13.
Water head distribution of typical sections (unit: m): (a) Cross section of upstream channel (x = −500 m), (b) river profile (y = −150 m), and (c) profile of the maximum dam height (y = 100 m).

Figure 14.
Model of the reservoir site area of the recommended anti-seepage scheme.

Figure 15.
Groundwater level contours of the reservoir site for a recommended anti-seepage scheme (unit: m).
Figure 15.
Groundwater level contours of the reservoir site for a recommended anti-seepage scheme (unit: m).

Figure 16.
Water head distribution of typical sections under the recommended anti-seepage scheme (unit: m): (a) Cross section of dam axis (x = 0 m). (b) Profile of the maximum dam height (y = 100 m).
Figure 16.
Water head distribution of typical sections under the recommended anti-seepage scheme (unit: m): (a) Cross section of dam axis (x = 0 m). (b) Profile of the maximum dam height (y = 100 m).


Table 1.
Time interval and measured values of the borehole ZK0.
| Time Interval (-) | Time (s) | Measured Value (m3/s) |
|---|---|---|
| 1 | 0–18 | 4.67 × 10⁻³ |
| 2 | 18–34 | 4.50 × 10⁻³ |
| 3 | 34–52 | 4.00 × 10⁻⁴ |
| 4 | 52–72 | 3.60 × 10⁻⁴ |
| 5 | 72–102 | 3.20 × 10⁻⁴ |
| 6 | 102–144 | 2.57 × 10⁻⁴ |
Table 2.
Inversion results of rock permeability of other boreholes.
| Code | Borehole Depth (m) | Rock Permeability (cm/s) |
|---|---|---|
| ZK2 | h = 0–12 | 2.3 × 10⁻¹ |
| h = 12–24 | 4.7 × 10⁻² | |
| ZK3 | h = 0–14 | 4.1 × 10⁻¹ |
| h = 14–26 | 7.4 × 10⁻² | |
| ZK4 | h = 0–13 | 3.1 × 10⁻¹ |
| h = 13–25 | 5.7 × 10⁻² | |
| ZK5 | h = 0–10 | 7.5 × 10⁻¹ |
| ZK6 | h = 0–16 | 5.8 × 10⁻² |
| h = 16–34 | 7.4 × 10⁻² | |
| ZK7 | h = 0–14 | 4.7 × 10⁻¹ |
| h = 14–30 | 6.1 × 10⁻² | |
| ZK8 | h = 0–12 | 3.3 × 10⁻¹ |
| h = 12–28 | 5.7 × 10⁻² |
Table 3.
Parameters of each layered rock mass.
| Rock Classification | Rock Permeability (cm/s) |
|---|---|
| strong permeable layer, q ≥ 100 Lu | 2.0 × 10⁻³ |
| medium permeable layer, 10 Lu ≤ q < 100 Lu | 3.0 × 10⁻⁴ |
| weak permeable layer, 5 Lu ≤ q < 10 Lu | 5.0 × 10⁻⁵ |
| relatively impermeable layer, q < 5 Lu | 2.0 × 10⁻⁵ |
| fault fracture zone, q ≥ 100 Lu | 1.5 × 10⁻² |
Table 4.
Seepage parameters of main material zones.
| Zone | Permeability Coefficient (cm/s) |
|---|---|
| dam gravel | 2.0 × 10⁻¹ |
| inverted filter | 1.0 × 10⁻⁵ |
| core material | 1.0 × 10⁻⁵ |
| concrete panel | 1.0 × 10⁻⁷ |
| drainage | 1.0 × 10⁻¹ |
| geomembrane | 1.0 × 10⁻⁹ |
© 2020 by the authors. Licensee MDPI, Basel, Switzerland. This article is an open access article distributed under the terms and conditions of the Creative Commons Attribution (CC BY) license (http://creativecommons.org/licenses/by/4.0/).
Share and Cite
MDPI and ACS Style
Gan, L.; Chen, G.; Shen, Z. A New Approach to Permeability Inversion of Fractured Rock Masses and Its Engineering Application. Water 2020, 12, 734. https://doi.org/10.3390/w12030734
AMA Style
Gan L, Chen G, Shen Z. A New Approach to Permeability Inversion of Fractured Rock Masses and Its Engineering Application. Water. 2020; 12(3):734. https://doi.org/10.3390/w12030734
Chicago/Turabian StyleGan, Lei, Guanyun Chen, and Zhenzhong Shen. 2020. "A New Approach to Permeability Inversion of Fractured Rock Masses and Its Engineering Application" Water 12, no. 3: 734. https://doi.org/10.3390/w12030734
Note that from the first issue of 2016, this journal uses article numbers instead of page numbers. See further details here.