Water Regulation in Cyanobacterial Biocrusts from Drylands: Negative Impacts of Anthropogenic Disturbance

 , , and
Abstract
:1. Introduction
2. Material and Methods
2.1. Study Sites
2.2. Cyanobacterial Biocrusts and Underlying Soils Sampling and Measurements
2.3. Measurement of Soil Surface Hydrological Processes
2.4. Biocrust Successional Dynamics after Disturbance
2.5. Data Analyses
3. Results
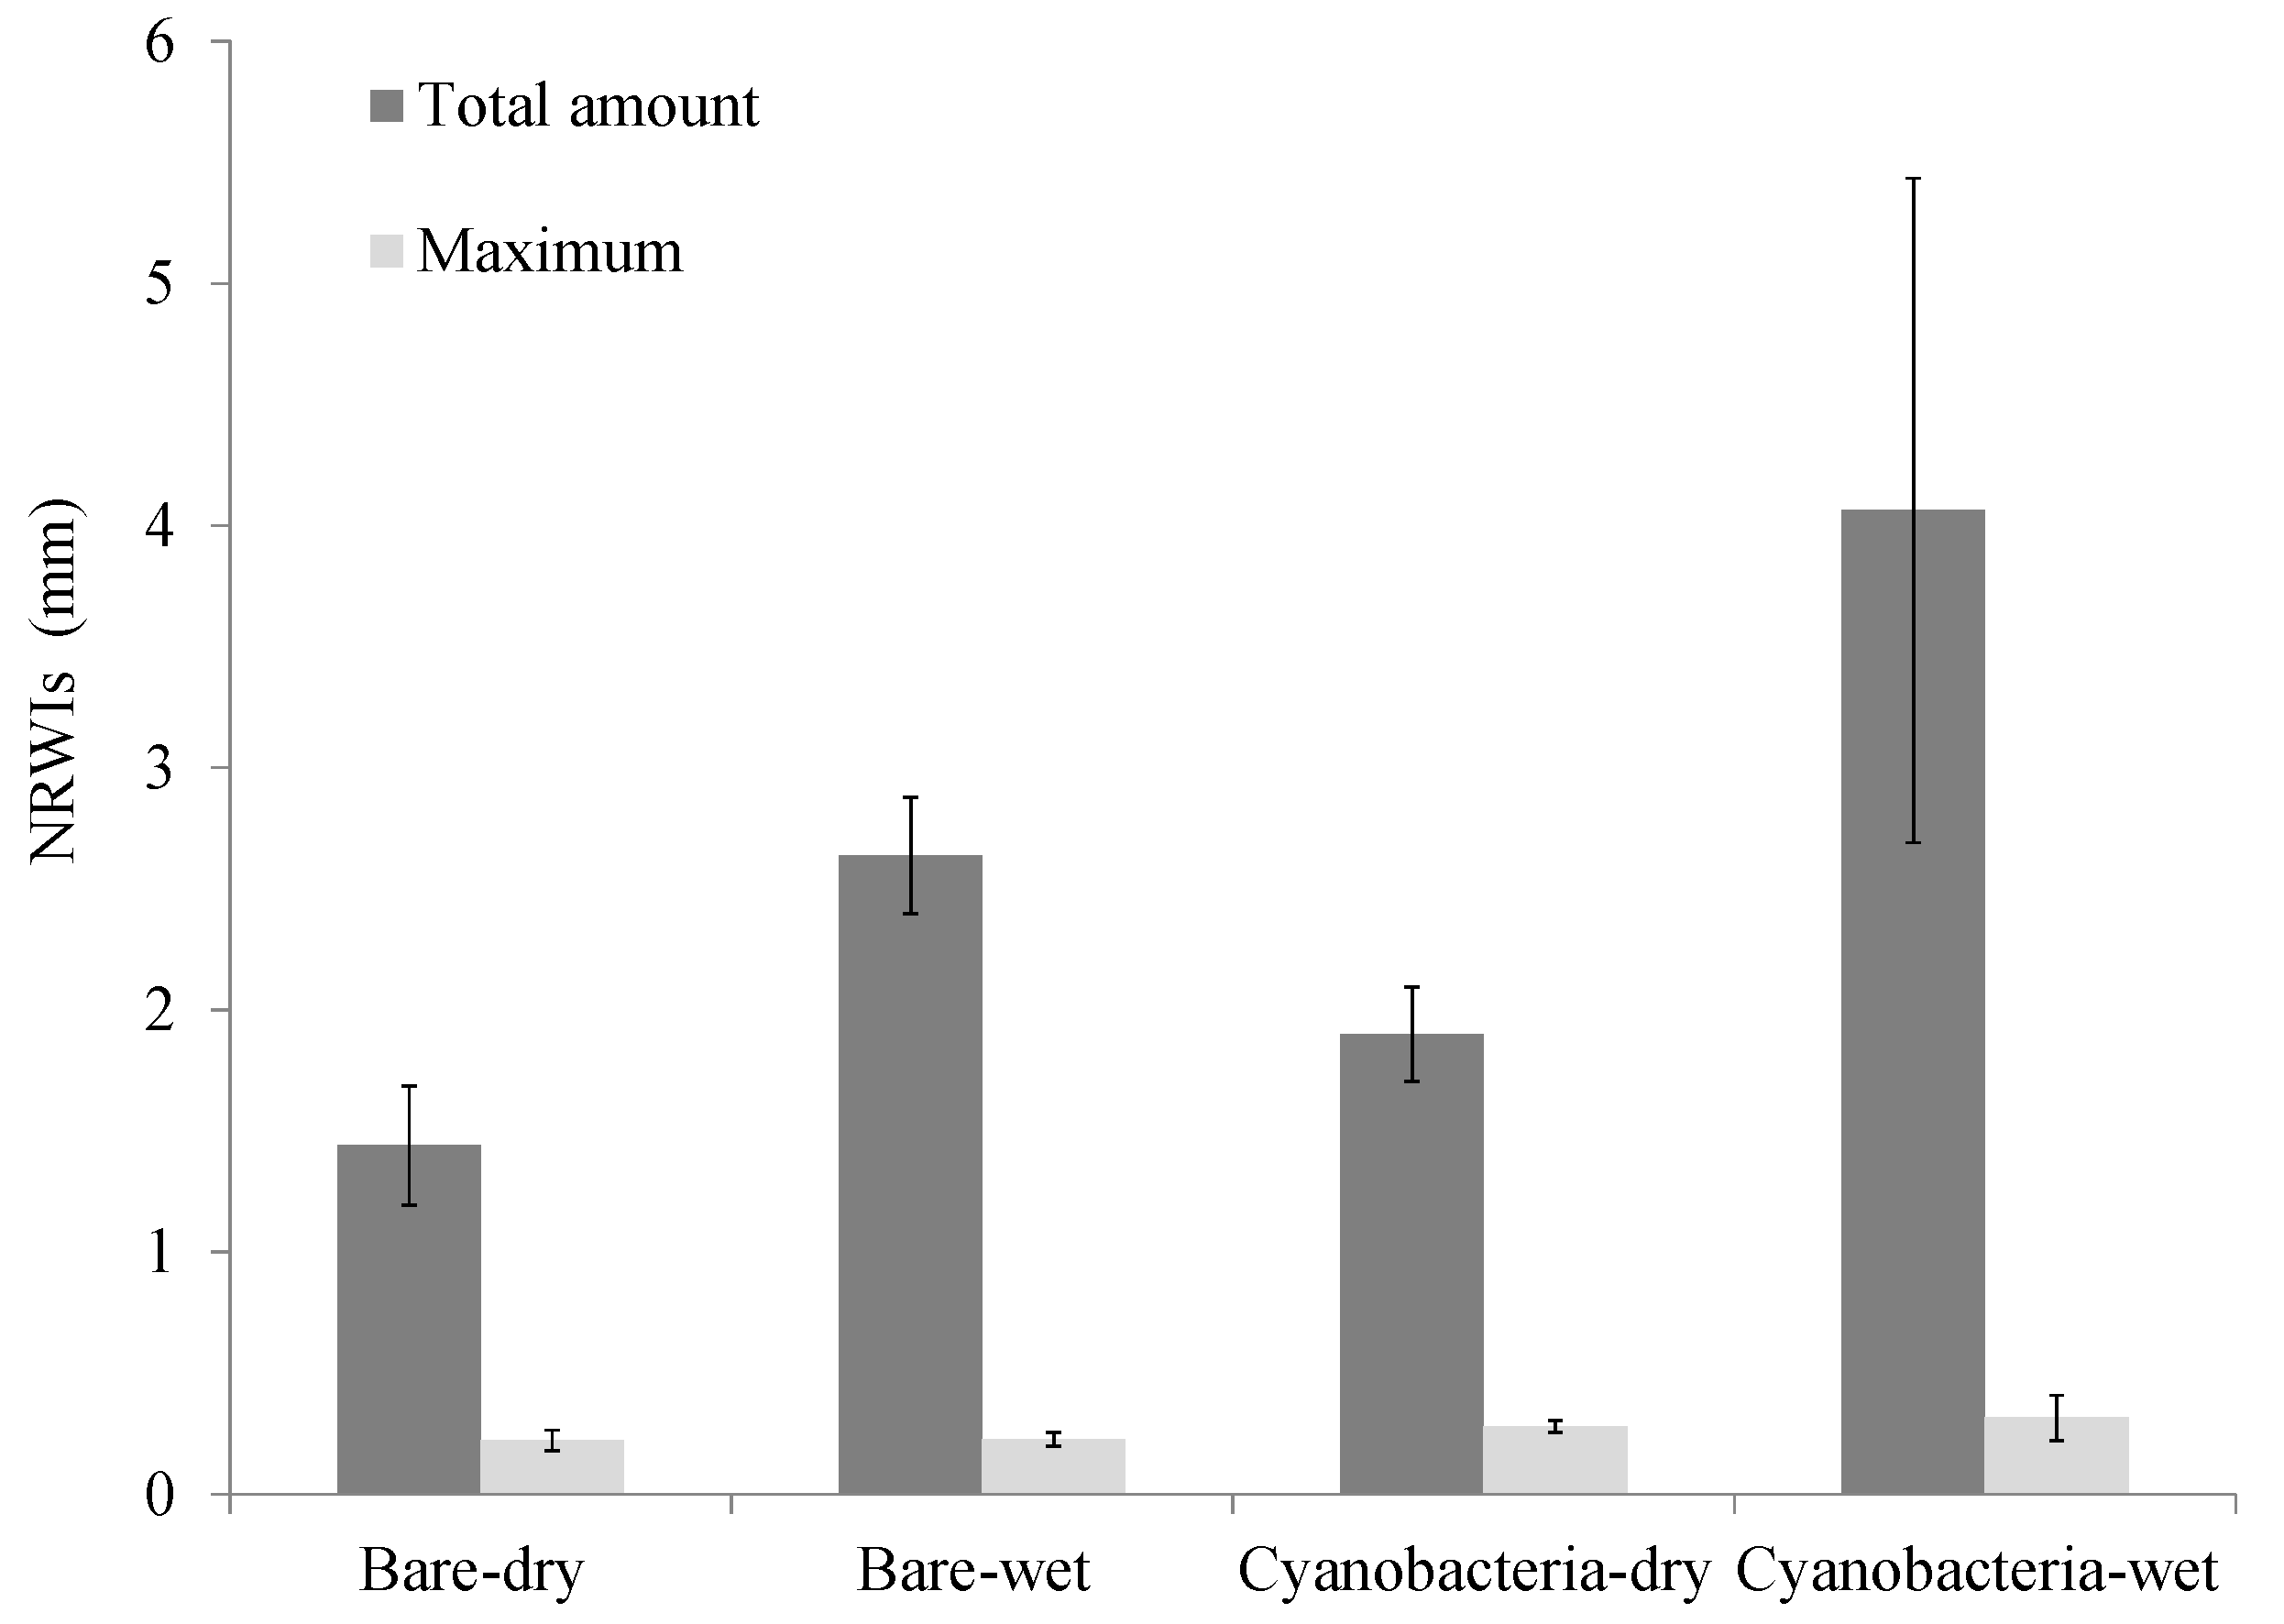
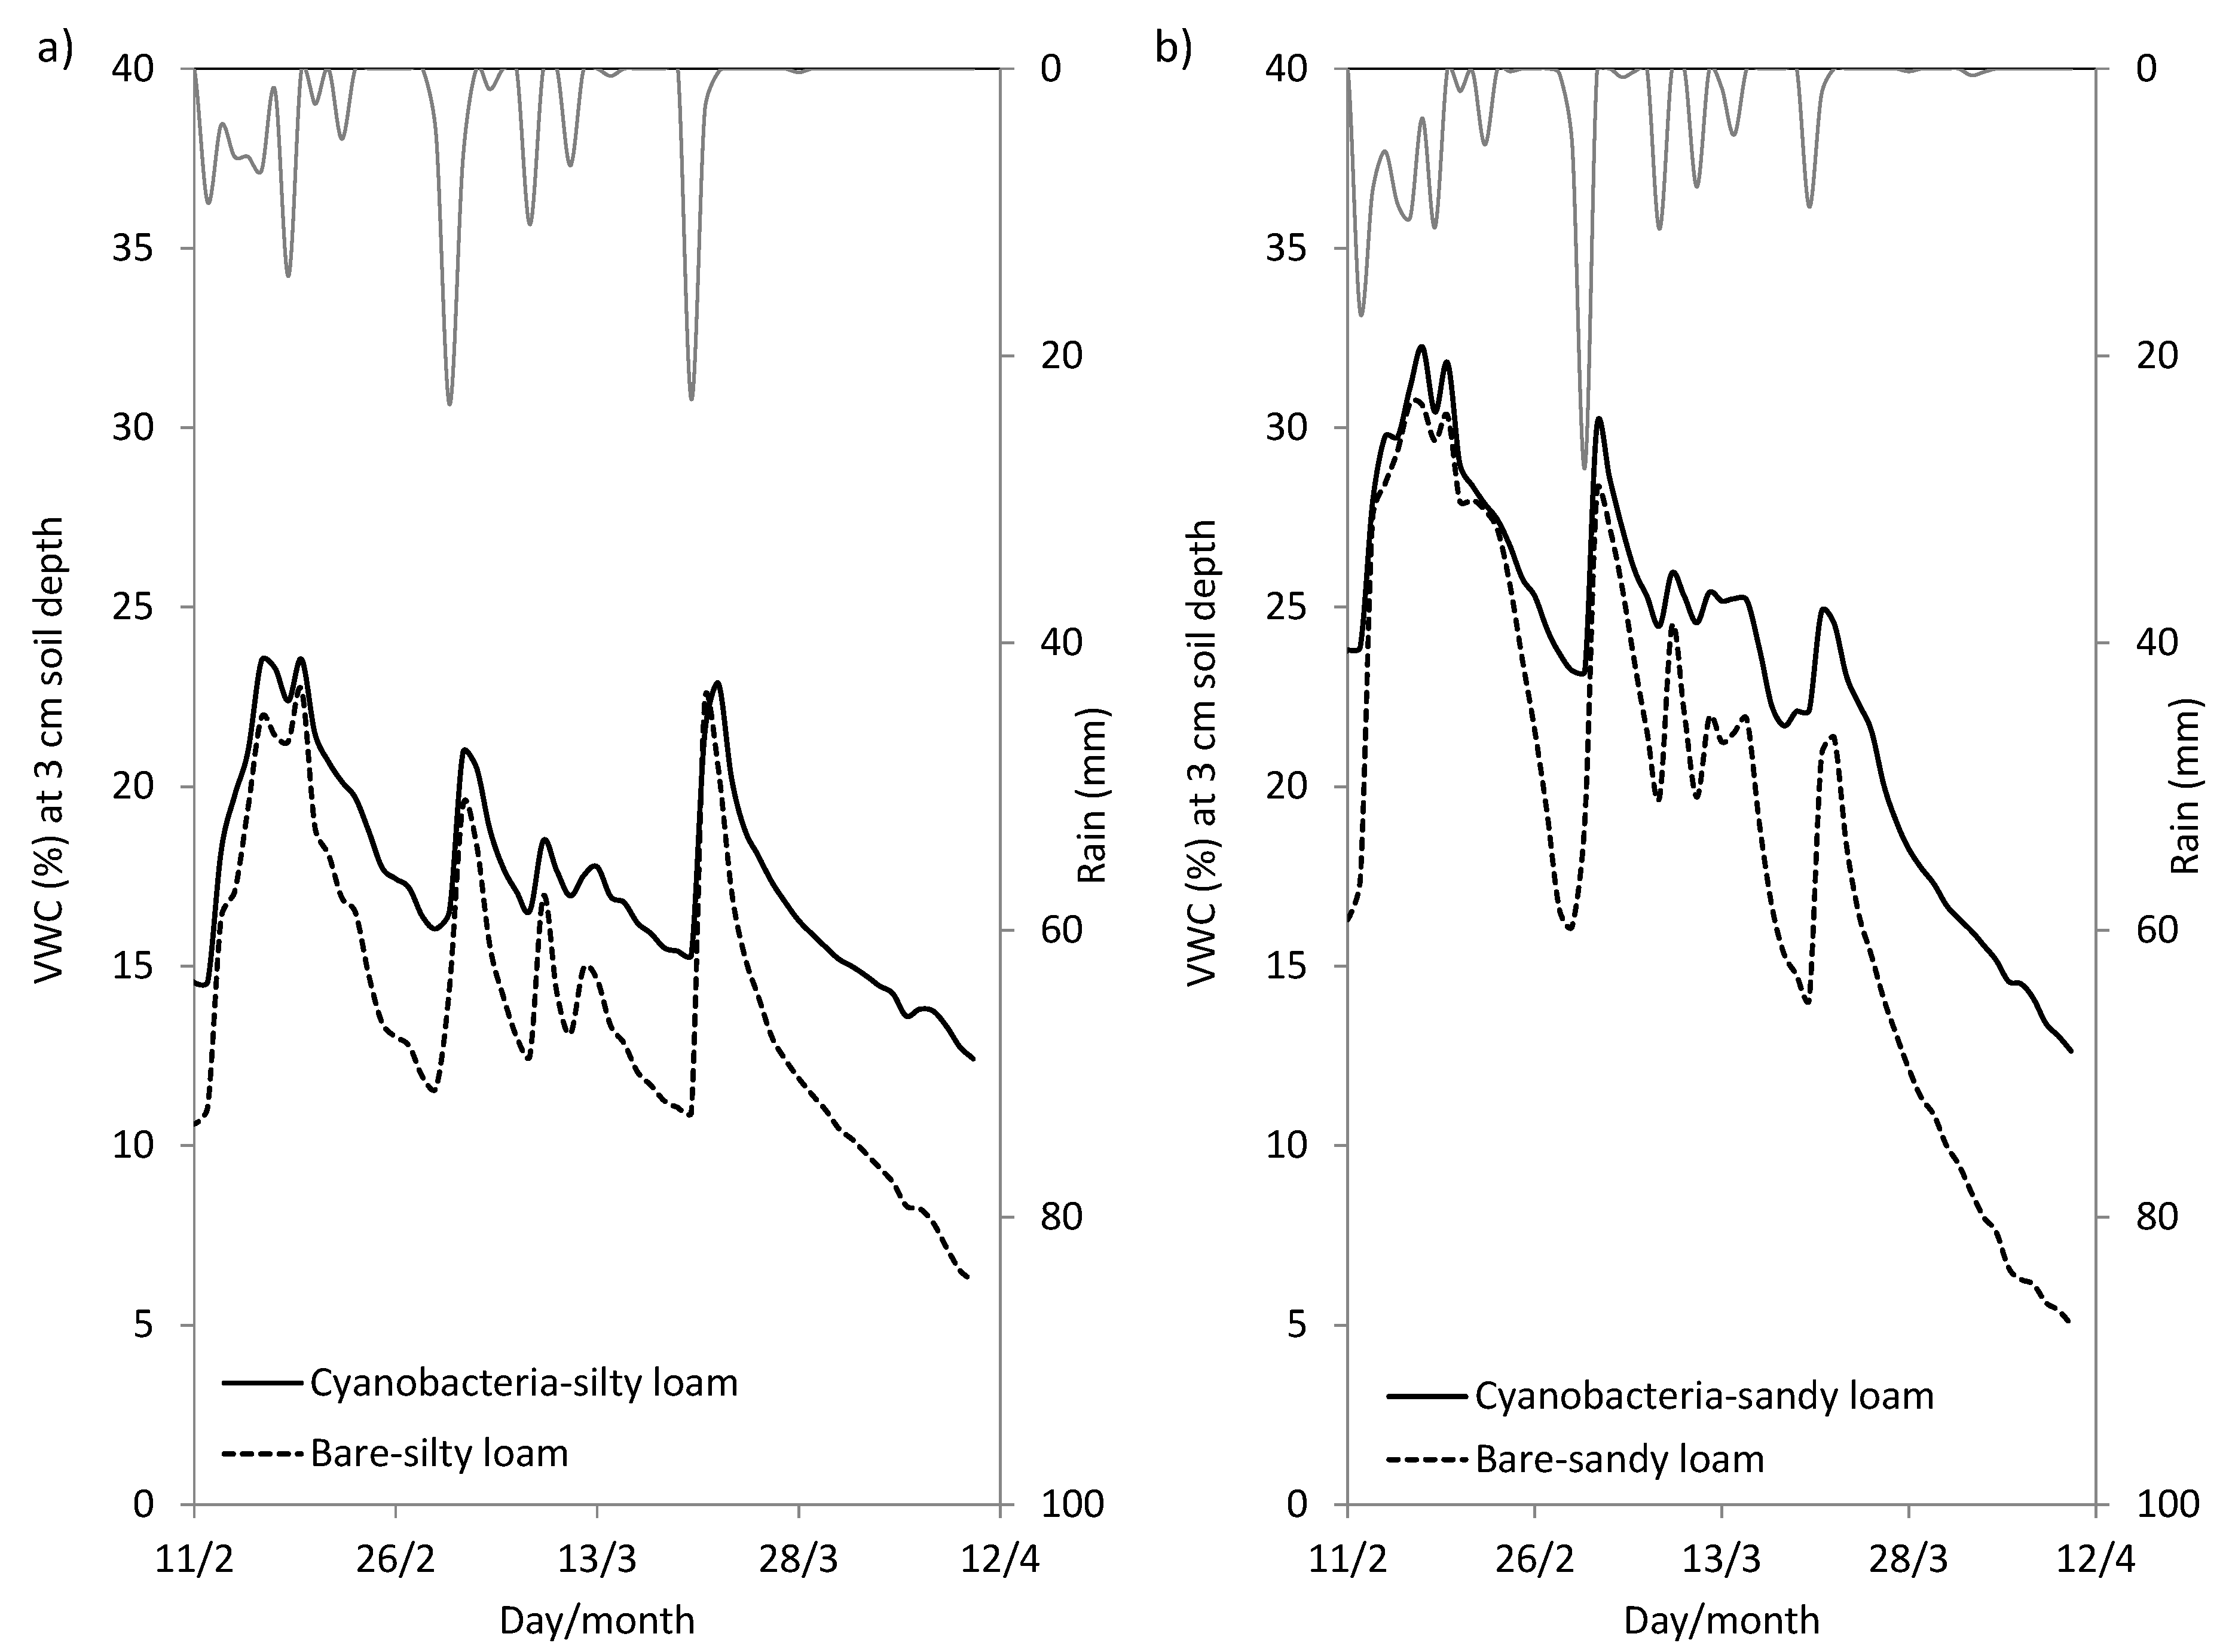
3.1. Effect of Cyanobacterial Biocrust on Soil Surface Hydrology
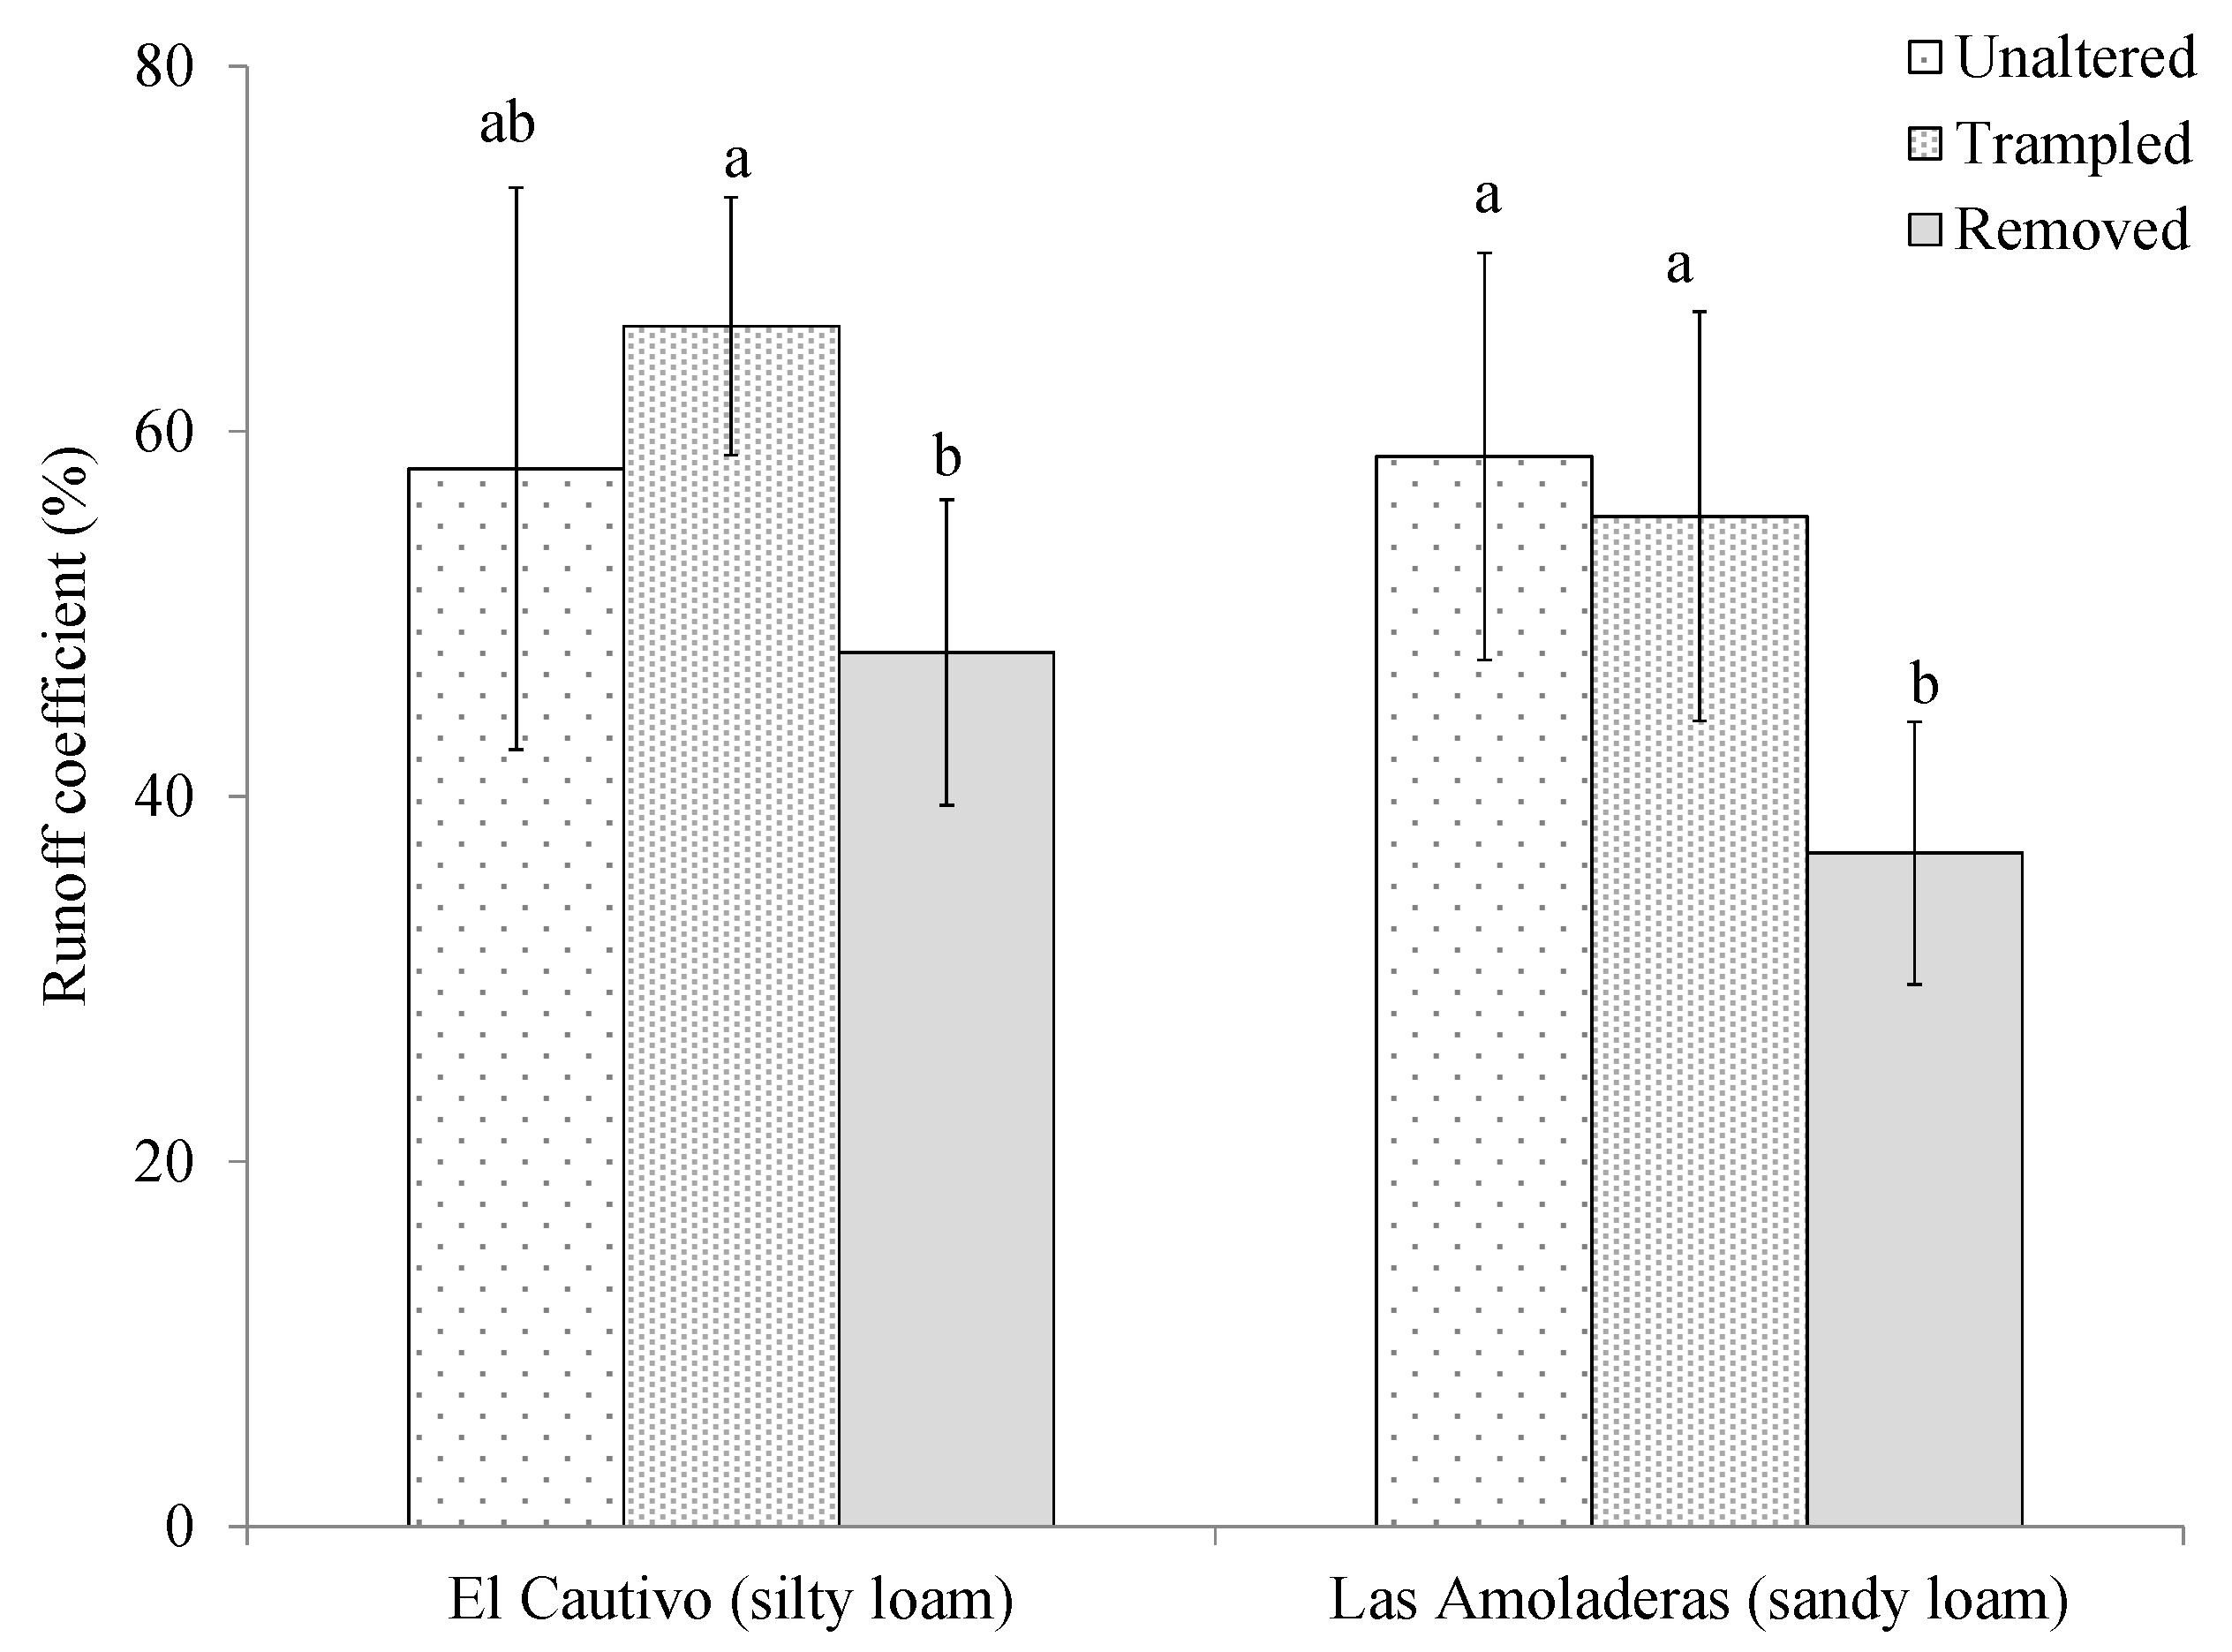
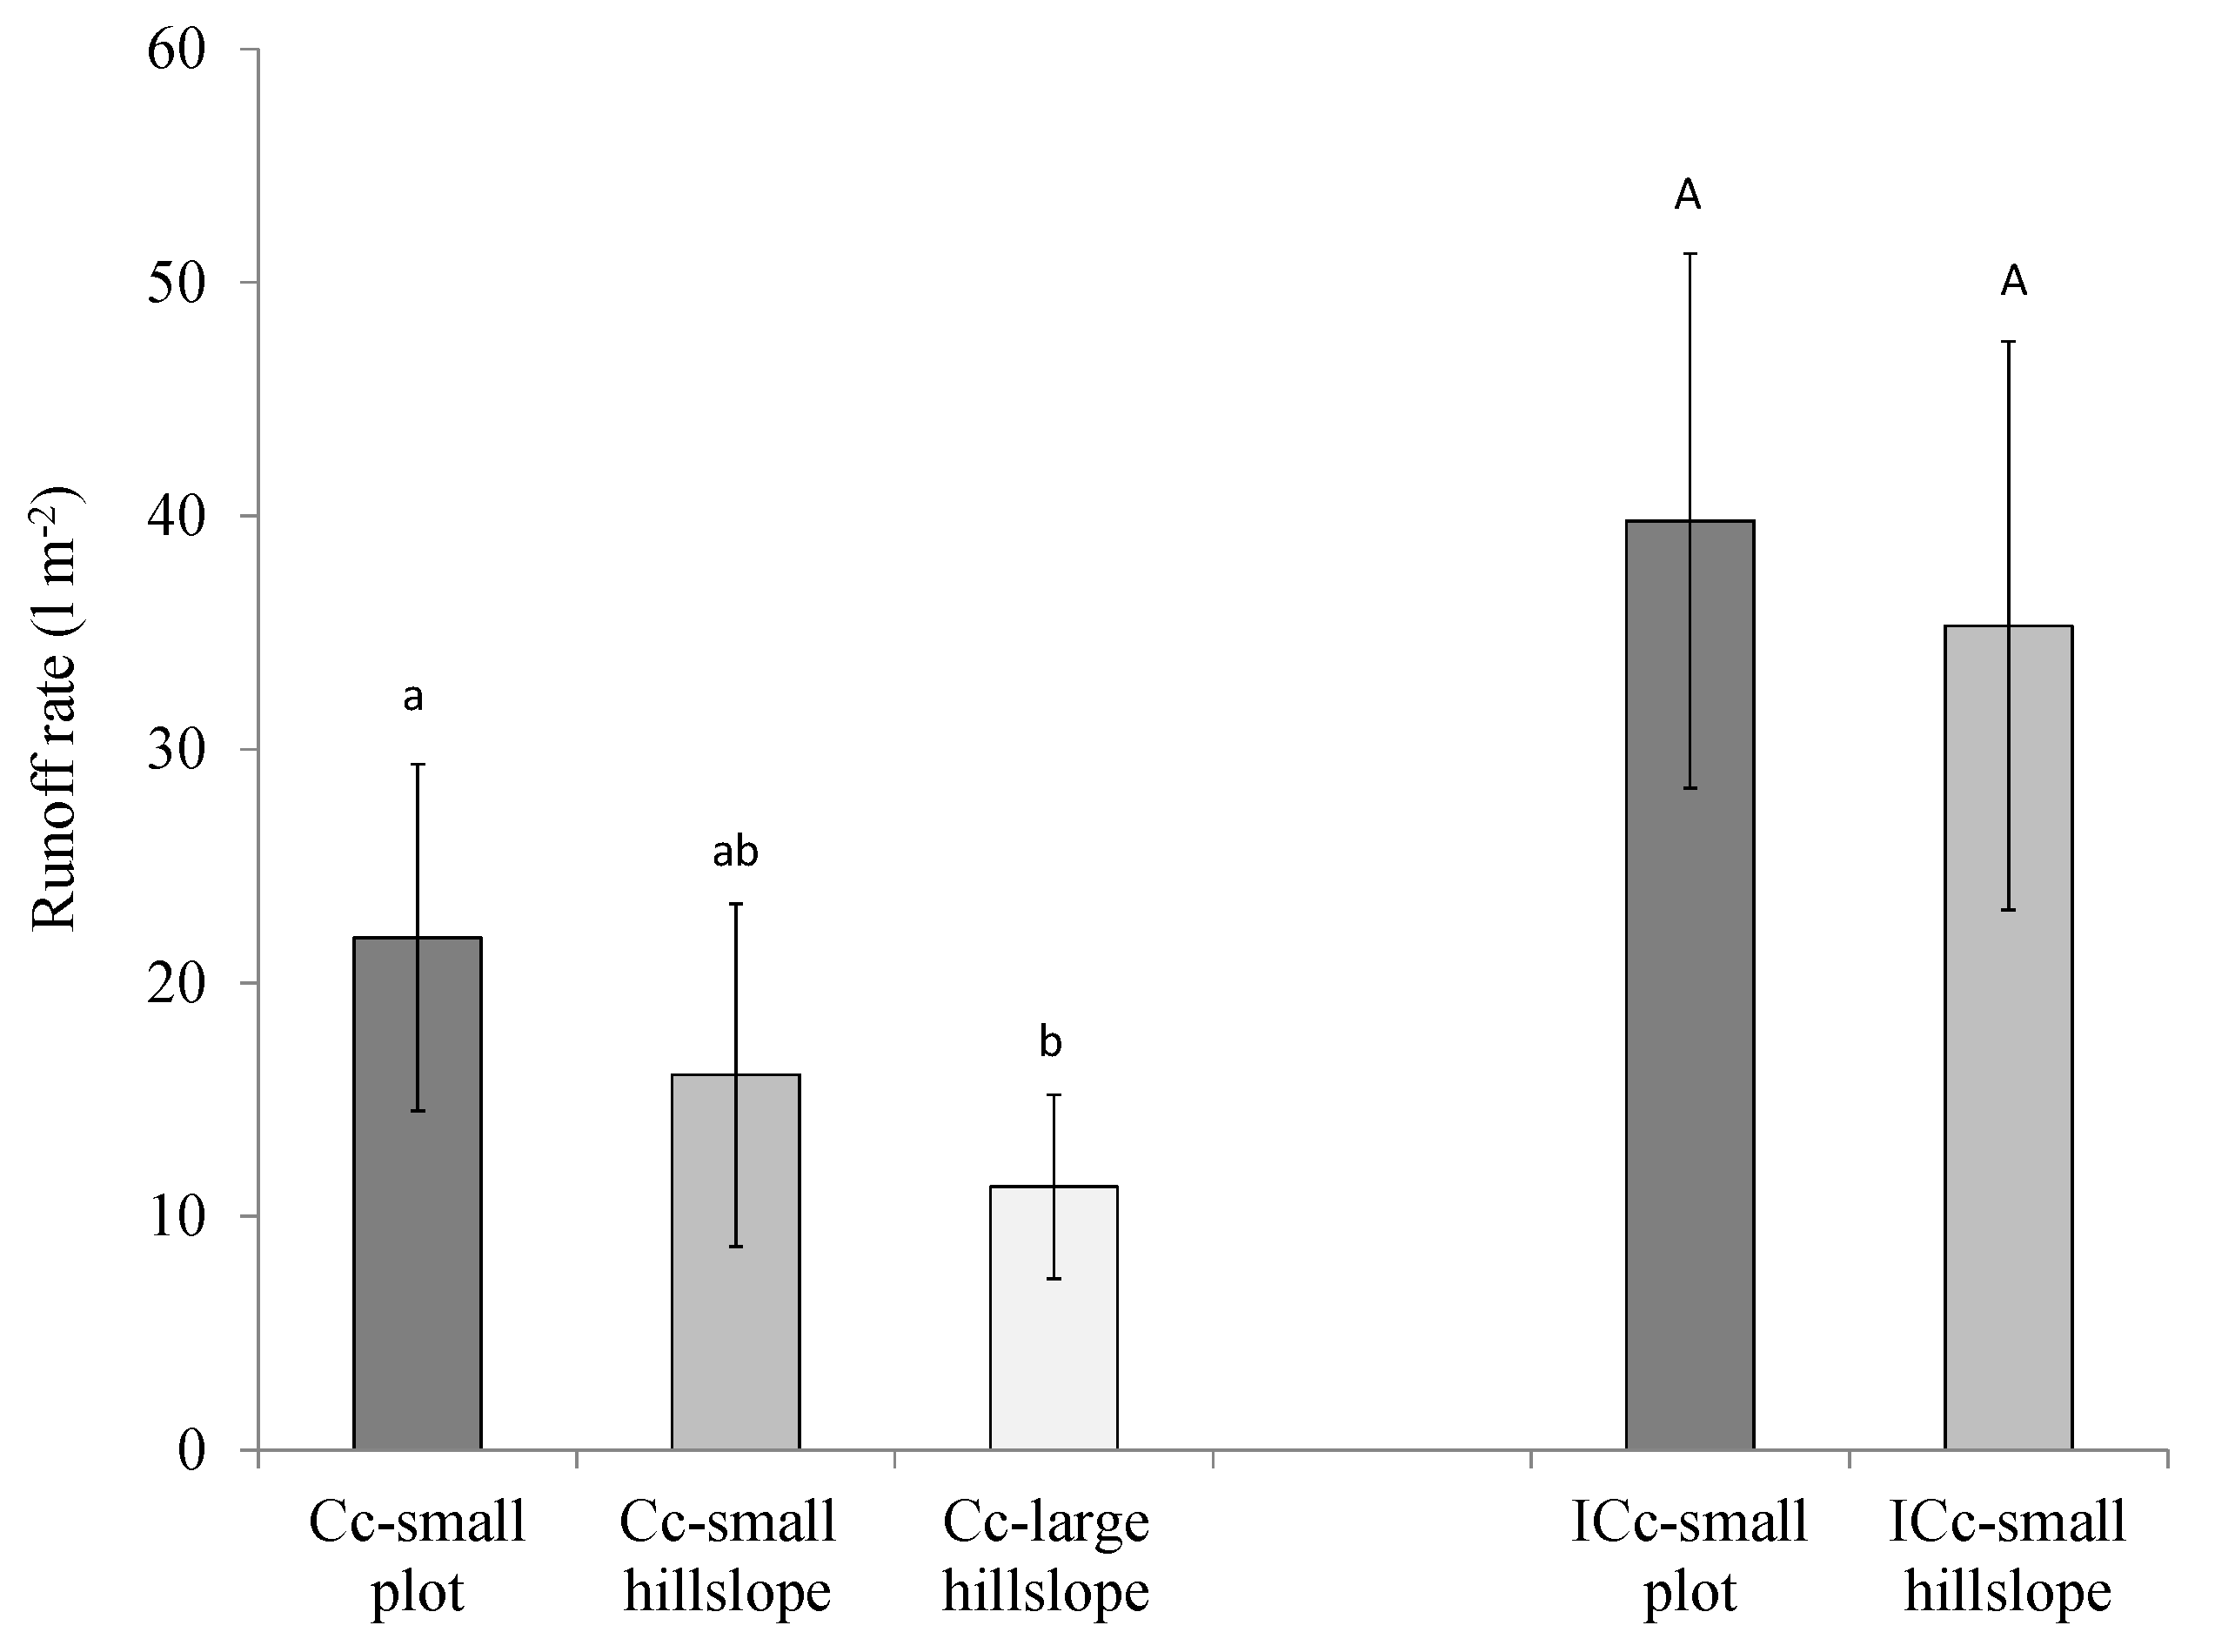
3.2. Effects of Cyanobacterial Biocrust Disturbance on Soil Surface Hydrology
4. Discussion
4.1. Role of Cyanobacterial Biocrust in Soil Surface Hydrology
4.2. Effects of Disturbance of Cyanobacterial Biocrusts on Soil Hydrology
5. Conclusions
Supplementary Materials
Author Contributions
Funding
Acknowledgments
Conflicts of Interest
References
- Rodriguez-Caballero, E.; Belnap, J.; Büdel, B.; Crutzen, P.J.; Andreae, M.O.; Pöschl, U.; Weber, B. Dryland photoautotrophic soil surface communities endangered by global change. Nat. Geosci. 2018, 11, 185–189. [Google Scholar] [CrossRef]
- Weber, B.; Büdel, B.; Belnap, J. Biological Soil Crusts: An Organizing Principle in Drylands, 2nd ed.; Springer: Berlin/Heidelberg, Germany, 2016. [Google Scholar]
- Belnap, J.; Lange, O.L. Biological Soil Crusts: Structure, Function and Management, 1st ed.; Springer: Berlin/Heidelberg, Germany, 2003. [Google Scholar]
- Belnap, J.; Rosentreter, R.; Leonard, S.; Kaltenecker, J.H.; Williams, J.; Eldridge, D. Biological Soil Crusts: Ecology and Management, Department Series; US Department of the Interior, Bureau of Land Management, and National Science and Technology Center: Denver, CO, USA, 2001; p. 210. [Google Scholar]
- Kumar, D.; Adhikary, S.P. Diversity, molecular phylogeny, and metabolic activity of cyanobacteria in biological soil crusts from Santiniketan (India). J. Appl. Phycol. 2014, 27, 331. [Google Scholar] [CrossRef]
- Kosten, S.; Huszar, V.L.M.; Bécares, E.; Costa, L.S.; van Donk, E.; Hansson, L.A.; Jeppesen, E.; Kruk, C.; Lacerot, G.; Mazzeo, N.; et al. Warmer climates boost cyanobacterial dominance in shallow lakes. Glob. Chang. Biol. 2012, 18, 118–126. [Google Scholar] [CrossRef]
- Pointing, S.B.; Büdel, B.; Convey, P.; Gilman, L.N.; Körner, C.; Leuzinger, S.; Vincent, W.F. Biogeography of photoautotrophs in the high polar biome. Front. Plant Sci. 2015, 6, 692. [Google Scholar] [CrossRef] [PubMed] [Green Version]
- Rajeev, L.; da Rocha, U.N.; Klitgord, N.; Luning, E.G.; Fortney, J.; Axen, S.D.; Shih, P.M.; Bouskill, N.J.; Bowen, B.P.; Kerfeld, C.A.; et al. Dynamic cyanobacterial response to hydration and dehydration in a desert biological soil crust. ISME J. 2013, 7, 2178–2191. [Google Scholar] [CrossRef] [PubMed] [Green Version]
- Oren, A. Salts and Brines. In Ecology of Cyanobacteria II: Their Diversity in Space and Time; Whitton, B.A., Ed.; Springer: Berlin/Heidelberg, Germany, 2012; pp. 401–420. [Google Scholar]
- Castenholz, R.W.; Garcia-Pichel, F. Cyanobacterial Responses to UV Radiation. In Ecology of Cyanobacteria II: Their Diversity in Space and Time; Whitton, B.A., Ed.; Springer: Berlin/Heidelberg, Germany, 2012; pp. 481–499. [Google Scholar]
- Barger, N.N.; Weber, B.; Garcia-Pichel, F.; Zaady, E.; Belnap, J. Patterns and controls on nitrogen cycling of biological soil crusts. In Biological Soil Crusts: An Organizing Principle in Drylands, 2nd ed.; Weber, B., Büdel, B., Belnap, J., Eds.; Springer: Berlin/Heidelberg, Germany, 2016; pp. 257–285. [Google Scholar]
- Williams, W.; Büdel, B.; Williams, S. Wet season cyanobacterial N enrichment highly correlated with species richness and Nostoc in the northern Australian savannah. Biogeosciences 2018, 15, 2149–2159. [Google Scholar] [CrossRef] [Green Version]
- Pointing, S.B.; Belnap, J. Microbial colonization and controls in dryland systems. Nat. Rev. Microbiol. 2012, 10, 551–562. [Google Scholar] [CrossRef]
- Zhang, B.; Zhang, Y.; Downing, A.; Niuc, Y. Distribution and composition of cyanobacteria and microalgae associated with biological soil crusts in the Gurbantunggut Desert, China. Arid Land. Res. Manag. 2011, 25, 275–293. [Google Scholar] [CrossRef]
- DeFalco, L.A.; Detling, J.K.; Tracy, C.R.; Warren, S.D. Physiological variation among native and exotic winter annual plants associated with microbiotic crust in the Mojave Desert. Plant Soil 2001, 234, 1–14. [Google Scholar] [CrossRef]
- Boeken, B.; Ariza, C.; Gutterman, Y.; Zaady, E. Environmental factors affecting dispersal, germination and distribution of Stipa capensis in Negev Desert, Israel. Ecol. Res. 2004, 19, 533–540. [Google Scholar] [CrossRef]
- Miralles-Mellado, I.; Ladrón de Guevara, M.; Chamizo, S.; Rodríguez-Caballero, E.; Ortega, R.; van Wesemael, B.; Cantón, Y. Soil CO2 exchange controlled by the interaction of biocrust successional stage and environmental variables in two semiarid ecosystems. Soil Biol. Biochem. 2018, 124, 11–23. [Google Scholar] [CrossRef]
- Powell, J.T.; Chatziefthimiou, A.D.; Banack, S.A.; Cox, P.A.; Metcalf, J.S. Desert crust microorganisms, their environment, and human health. J. Arid Environ. 2015, 112, 127–133. [Google Scholar] [CrossRef]
- Elbert, W.; Weber, B.; Burrows, S.; Steinkamp, J.; Büdel, B.; Andreae, M.O.; Pöschl, U. Contribution of cryptogamic covers to the global cycles of carbon and nitrogen. Nat. Geosci. 2012, 5, 459–462. [Google Scholar] [CrossRef]
- Robertson, G.P.; Groffman, P.M. Nitrogen transformations. In Soil Microbiology, Biochemistry and Ecology; Paul, E.A., Ed.; Springer: Berlin/Heidelberg, Germany, 2007; pp. 341–364. [Google Scholar]
- Rossi, F.; Li, H.; Liu, Y.; De Philippis, R. Cyanobacterial inoculation (cyanobacterisation): Perspectives for the development of a standardized multifunctional technology for soil fertilization and desertification reversal. Earth Sci. Rev. 2017, 171, 28–43. [Google Scholar] [CrossRef]
- Chamizo, S.; Mugnai, G.; Rossi, F.; Certini, G.; De Philippis, R. Cyanobacteria inoculation improves soil stability and fertility on different textured soils: Gaining insights for applicability in soil restoration. Front. Environ. Sci. 2018, 6, 49. [Google Scholar] [CrossRef]
- Cantón, Y.; Domingo, F.; Solé-Benet, A.; Puigdefábregas, J. Hydrological and erosion response of a badlands system in semiarid SE Spain. J. Hydrol. 2001, 252, 65–84. [Google Scholar] [CrossRef]
- Cantón, Y.; Solé-Benet, A.; de Vente, J.; Boix-Fayos, C.; Calvo-Cases, A.; Asensio, C.; Puigdefábregas, J. A review of runoff generation and soil erosion across scales in semiarid south-eastern Spain. J. Arid Environ. 2011, 75, 1254–1261. [Google Scholar] [CrossRef]
- Bowker, M.A.; Belnap, J.; Bala-Chaudhary, V.; Johnson, N.C. Revisiting classic water erosion models in drylands: The strong impact of biological soil crusts. Soil Biol. Biochem. 2008, 40, 2309–2316. [Google Scholar] [CrossRef]
- Chamizo, S.; Rodríguez-Caballero, E.; Cantón, Y.; Asensio, C.; Domingo, F. Penetration resistance of biological soil crusts and its dynamics after crust removal: Relationships with runoff and soil detachment. Catena 2015, 126, 164–172. [Google Scholar] [CrossRef]
- Belnap, J.; Walker, B.J.; Munson, S.M.; Gill, R.A. Controls on sediment production in two U.S. deserts. Aeolian Res. 2014, 14, 15–24. [Google Scholar] [CrossRef]
- Zhao, Y.; Qin, N.; Weber, B.; Xu, M. Response of biological soil crusts to raindrop erosivity and underlying influences in the hilly Loess Plateau region, China. Biodivers. Conserv. 2014, 23, 1669–1686. [Google Scholar] [CrossRef]
- Rodríguez-Caballero, E.; Cantón, Y.; Chamizo, S.; Afana, A.; Solé-Benet, A. Effects of biological soil crusts on surface roughness and implications for runoff and erosion. Geomorphology 2012, 145–146, 81–89. [Google Scholar] [CrossRef]
- Felde, V.J.M.N.L.; Peth, S.; Uteau-Puschmann, D.; Drahorad, S.; Felix-Henningsen, P. Soil microstructure as an under-explored feature of biological soil crust hydrological properties: Case study from the NW Negev Desert. Biodivers. Conserv. 2014, 64, 133–140. [Google Scholar] [CrossRef]
- Chamizo, S.; Cantón, Y.; Miralles, I.; Domingo, F. Biological soil crust development affects physicochemical characteristics of soil surface in semiarid ecosystems. Soil Biol. Biochem. 2012, 49, 96–105. [Google Scholar] [CrossRef]
- Chamizo, S.; Cantón, Y.; Lázaro, R.; Solé-Benet, A.; Domingo, F. Crust composition and disturbance drive Infiltration through biological soil crusts in semiarid ecosystems. Ecosystems 2012, 15, 148–161. [Google Scholar] [CrossRef]
- Rodríguez-Caballero, E.; Cantón, Y.; Chamizo, S.; Lázaro, R.; Escudero, A. Soil loss and runoff in semiarid ecosystems: A complex interaction between biological soil crusts, micro-topography, and hydrological drivers. Ecosystems 2013, 16, 1–18. [Google Scholar] [CrossRef]
- Chamizo, S.; Cantón, Y.; Rodríguez-Caballero, E.; Domingo, F.; Escudero, A. Runoff at contrasting scales in a semiarid ecosystem: A complex balance between biological soil crust features and rainfall characteristics. J. Hydrol. 2012, 452–453, 130–138. [Google Scholar] [CrossRef]
- Cantón, Y.; Domingo, F.; Solé-Benet, A.; Puigdefábregas, J. Influence of soil-surface types on the overall runoff of the Tabernas badlands (south-east Spain): Field data and model approaches. Hydrol. Process. 2002, 16, 2621–2643. [Google Scholar] [CrossRef]
- Ludwig, J.A.; Tongway, D.J. Spatial organisation of landscapes and its function in semi-arid woodlands, Australia. Landscape Ecol. 1995, 10, 51–63. [Google Scholar] [CrossRef]
- Puigdefábregas, J. The role of vegetation patterns in structuring runoff and sediment fluxes in drylands. Earth Surf. Proc. Land 2005, 30, 133–147. [Google Scholar] [CrossRef]
- Rodríguez-Caballero, E.; Cantón, Y.; Lázaro, R.; Solé-Benet, A. Cross-scale interactions between surface components and rainfall properties. Non-linearities in the hydrological and erosive behaviour of semiarid catchments. J. Hydrol. 2014, 517, 815–825. [Google Scholar] [CrossRef]
- Malam Issa, O.; Valentin, C.; Rajot, J.L.; Cerdan, O.; Desprats, J.F.; Bouchet, T. Runoff generation fostered by physical and biological crusts in semi-arid sandy soils. Geoderma 2011, 167–168, 22–29. [Google Scholar] [CrossRef]
- Belnap, J.; Wilcox, B.P.; Van Scoyoc, M.V.; Phillips, S.L. Successional stage of biological soil crusts: An accurate indicator of ecohydrological condition. Ecohydrology 2012, 6, 474–482. [Google Scholar] [CrossRef]
- Kidron, G.J.; Monger, H.C.; Vonshak, A.; Conrod, W. Contrasting effects of microbiotic crusts on runoff in desert surfaces. Geomorphology 2012, 139–140, 484–494. [Google Scholar] [CrossRef]
- Chamizo, S.; Cantón, Y.; Rodríguez-Caballero, E.; Domingo, F. Biocrusts positively affect the soil water balance in semiarid ecosystems. Geomorphology 2016, 9, 1208–1221. [Google Scholar] [CrossRef]
- Faist, A.M.; Herrick, J.E.; Belnap, J.; Van Zee, W.; Barger, N.N. Biological soil crust and disturbance controls on surface hydrology in a semi-arid ecosystem. Ecosphere 2017, 8, e01691. [Google Scholar] [CrossRef]
- George, D.B.; Roundy, B.A.; St. Clair, L.L.; Johansen, J.R.; Schaalje, G.B.; Webb, B.L. The effects of microbiotic soil crusts on soil water loss. Arid Land Res. Manag. 2003, 17, 113–125. [Google Scholar] [CrossRef]
- Almog, R.; Yair, A. Negative and positive effects of topsoil biological crusts on water availability along a rainfall gradient in a sandy arid area. Catena 2007, 70, 437–442. [Google Scholar]
- Kidron, G.J.; Tal, S.Y. The effect of biocrusts on evaporation from sand dunes in the Negev Desert. Geoderma 2012, 179–180, 104–112. [Google Scholar] [CrossRef]
- Chamizo, S.; Cantón, Y.; Domingo, F.; Belnap, J. Evaporative losses from soils covered by physical and different types of biological soil crusts. Hydrol. Process. 2013, 27, 324–332. [Google Scholar] [CrossRef]
- Chamizo, S.; Cantón, Y.; Lázaro, R.; Domingo, F. The role of biological soil crusts in soil moisture dynamics in two semiarid ecosystems with contrasting soil textures. J. Hydrol. 2013, 489, 74–84. [Google Scholar] [CrossRef]
- Whitney, K.M.; Vivoni, E.R.; Duniway, M.C.; Bradford, J.B.; Reed, S.C.; Belnap, J. Ecohydrological role of biological soil crusts across a gradient in levels of development. Geomorphology 2017, e1875. [Google Scholar] [CrossRef]
- Kuske, C.R.; Yeager, C.M.; Johnson, S.; Ticknor, L.O.; Belnap, J. Response and resilience of soil biocrust bacterial communities to chronic physical disturbance in arid shrublands. ISME J. 2012, 6, 886–897. [Google Scholar] [CrossRef] [PubMed] [Green Version]
- Dojani, S.; Kauff, F.; Weber, B.; Budel, B. Genotypic and phenotypic diversity of cyanobacteria in biological soil crusts of the Succulent Karoo and Nama Karoo of southern Africa. Microb. Ecol. 2014, 67, 286–301. [Google Scholar] [CrossRef] [PubMed]
- Steven, B.; Belnap, J.; Kuske, C.R. Chronic physical disturbance substantially alters the response of biological soil crusts to a wetting pulse, as characterized by metatranscriptomic sequencing. Front. Microbiol. 2018, 9, 2382. [Google Scholar] [CrossRef] [PubMed] [Green Version]
- Barger, N.N.; Herrick, J.E.; Van Zee, J.; Belnap, J. Impacts of biological soil crust disturbance and composition on C and N loss from water erosion. Biogeochemistry 2006, 77, 247–263. [Google Scholar] [CrossRef]
- Cantón, Y.; Román, J.R.; Chamizo, S.; Rodríguez-Caballero, E.; Moro, M.J. Dynamics of organic carbon losses by water erosion after biocrust removal. J. Hydrol. Hydromech. 2014, 62, 253–257. [Google Scholar] [CrossRef] [Green Version]
- Cantón, Y.; Solé-Benet, A.; Lázaro, R. Soil–geomorphology relations in gypsiferous materials of the Tabernas Desert (Almería, SE Spain). Geoderma 2003, 115, 193–222. [Google Scholar] [CrossRef]
- Cantón, Y.; Del Barrio, G.; Solé-Benet, A.; Lázaro, R. Topographic controls on the spatial distribution of ground cover in a semiarid badlands area. Catena 2004, 55, 341–365. [Google Scholar] [CrossRef]
- Rey, A.; Pegoraro, E.; Oyonarte, C.; Were, A.; Escribano, P.; Raimundo, J. Impact of land degradation on soil respiration in a steppe (Stipa tenacissima L.) semi-arid ecosystem in the SE of Spain. Soil Biol. Biochem. 2011, 43, 393–403. [Google Scholar] [CrossRef]
- Lázaro, R.; Cantón, Y.; Solé-Benet, A.; Bevan, J.; Alexander, R.; Sancho, L.G.; Puigdefábregas, J. The influence of competition between lichen colonization and erosion on the evolution of soil surfaces in the Tabernas badlands (SE Spain) and its landscape effects. Geomorphology 2008, 102, 252–266. [Google Scholar] [CrossRef]
- Bevan, J. Dynamics of Lichen Dominated Biological Soil Crusts in the El Cautivo Badlands Southeast Spain. Ph.D. Thesis, University of Chester, Chester, UK, 2009. [Google Scholar]
- Maier, S.; Schmidt, T.S.B.; Zheng, L.; Peer, T.; Wagner, V.; Grube, M. Analyses of dryland biological soil crusts highlight lichens as an important regulator of microbial communities. Biodivers. Conserv. 2014, 23, 1735–1755. [Google Scholar] [CrossRef]
- Büdel, B.; Colesie, C.; Green, T.A.; Grube, M.; Suau, R.L.; Loewen-Schneider, K.; Maier, S.; Peer, T.; Pintado, A.; Raggio, J.; et al. Improved appreciation of the functioning and importance of biological soil crusts in Europe: The Soil Crust International Project (SCIN). Biodivers. Conserv. 2014, 23, 1639–1658. [Google Scholar] [CrossRef] [PubMed] [Green Version]
- Roncero-Ramos, B.; Muñoz-Martín, M.A.; Chamizo, S.; Fernández-Valvuena, L.; Mendoza, D.; Perona, E.; Cantón, Y.; Mateo, P. Polyphasic evaluation of key cyanobacteria in biocrusts from the most arid region in Europe. Peer J. 2019, 7, e6169. [Google Scholar] [CrossRef] [PubMed] [Green Version]
- Muñoz-Martín, M.A.; Becerra-Absalón, I.; Perona, E.; Fernández-Valvuena, L.; Garcia-Pichel, F.; Mateo, P. Cyanobacterial biocrust diversity in Mediterranean ecosystems along a latitudinal and climatic gradient. New Phytol. 2019, 22, 123–141. [Google Scholar] [CrossRef] [PubMed] [Green Version]
- Clark, R.N.; Roush, T.L. Reflectance spectroscopy. Quantitative analysis techniques for remote sensing applications. J. Geophys. Res. 1984, 89, 6329–6340. [Google Scholar] [CrossRef]
- Rossi, F.; Mugnai, G.; De Philippis, R. Complex role of the polymeric matrix in biological soil crusts. Plant Soil 2018, 429, 19–34. [Google Scholar] [CrossRef]
- Dubois, M.; Gilles, K.A.; Hamilton, J.K.; Rebers, P.A.; Smith, F. Colorimetric method for determination of sugars and related substances. Anal. Chem. 1956, 28, 350–356. [Google Scholar] [CrossRef]
- Castle, S.C.; Morrison, C.D.; Barger, N.N. Extraction of chlorophyll a from biological soil crusts: A comparison of solvents for spectrophotometric determination. Soil Biol. Biochem. 2011, 43, 853–856. [Google Scholar] [CrossRef]
- Ritchie, R. Consistent sets of spectrophotometric chlorophyll equations for acetone, methanol and ethanol solvents. Photosynth. Res. 2006, 89, 27–41. [Google Scholar] [CrossRef]
- Mingorance, M.D.; Barahona, E.; Fernández-Gálvez, J. Guidelines for improving organic carbon recovery by the wet oxidation method. Chemosphere 2007, 68, 409–413. [Google Scholar] [CrossRef] [PubMed]
- Bremner, J.M. Nitrogen-total. In Methods of Soil Analysis. Part 3, Chemical Methods; Sparks, D.L., Ed.; SSSA-ASA: Madison, WI, USA, 1996; pp. 1085–1121. [Google Scholar]
- Imeson, A.C.; Vis, M. Assessing soil aggregate stability by ultrasonic dispersion and water-drop impact. Geoderma 1984, 34, 185–200. [Google Scholar] [CrossRef]
- Zhang, R. Determination of soil sorptivity and hydraulic conductivity from the disk infiltrometer. Soil Sci. Soc. Am. J. 1997, 61, 1024–1030. [Google Scholar] [CrossRef]
- Calvo-Cases, A.; Gisbert, B.; Palau, E.; Romero, M. Un Simulador de Lluvia de fácil Construcción. In MÉtodos y Técnicas para la Medición en el Campo de Procesos Geomorfológicos; Sala, M., Gallart, F., Eds.; Sociedad Española de Geomorfología: Zaragoza, Spain, 1988; Volume 1, pp. 6–15. [Google Scholar]
- Uclés, O.; Villagarcía, L.; Cantón, Y.; Domingo, F. Microlysimeter station for long term non-rainfall water input and evaporation studies. Agric. Forest Meteorol. 2013, 182–183, 13–20. [Google Scholar] [CrossRef]
- Lafuente, A.; Berdugo, M.; Ladrón de Guevara, M.; Gozalo, B.; Maestre, F.T. Simulated climate change affects how biocrusts modulate water gains and desiccation dynamics after rainfall events. Ecohydrology 2018, 11, e1935. [Google Scholar] [CrossRef] [PubMed]
- Román, J.R.; Rodríguez-Caballero, E.; Rodríguez-Lozano, B.; Roncero-Ramos, B.; Chamizo, S.; Águila-Carricondo, P.; Cantón, Y. Spectral Response Analysis: An Indirect and Non-Destructive Methodology for the Chlorophyll Quantification of Biocrusts. Remote Sens. 2019, 11, 1350. [Google Scholar] [CrossRef] [Green Version]
- Rutherford, W.A.; Painter, T.H.; Ferrenberg, S.; Belnap, J.; Okin, G.O.; Flagg, C.; Reed, S.C. Albedo feedbacks to future climate via climate change impacts on dryland biocrusts. Sci. Rep. 2017, 7, 44188. [Google Scholar] [CrossRef] [Green Version]
- Noy-Meir, I. Desert ecosystems: Environment and producers. Annu. Rev. Ecol. Systemat. 1973, 4, 25–51. [Google Scholar] [CrossRef]
- Austin, A.T.; Yahdjian, L.; Stark, J.M.; Belnap, J.; Porporato, A.; Norton, U.; Ravetta, D.A.; Schaeffer, S.M. Water pulses and biogeochemical cycles in arid and semiarid ecosystems. Oecologia 2004, 141, 221–235. [Google Scholar] [CrossRef]
- Ferrenberg, S.; Reed, S.C.; Belnap, J. Climate change and physical disturbance cause similar community shifts in biological soil crusts. Proc. Natl. Acad. Sci. USA 2015, 112, 12116–12121. [Google Scholar] [CrossRef] [Green Version]
- Singer, M.J.; Le Bissonnais, Y. Importance of surface sealing in the erosion of some soils from a mediterranean climate. Geomorphology 1998, 24, 79–85. [Google Scholar] [CrossRef]
- Malam Issa, O.; Cousin, I.; Le Bissonnais, Y.; Quétin, P. Dynamic evolution of the unsaturated hydraulic conductivity of a developing crust. Earth Surf. Proc. Land 2004, 29, 1131–1142. [Google Scholar] [CrossRef]
- Neave, M.; Rayburg, S. A field investigation into the effects of progressive rainfall–induced soil seal and crust development on runoff and erosion rates: The impact of surface cover. Geomorphology 2007, 87, 378–390. [Google Scholar] [CrossRef]
- Malam Issa, O.; Défarge, C.; Trichet, J.; Valentin, C.; Rajot, J.L. Microbiotic soil crusts in the Sahel of Western Niger and their influence on soil porosity and water dynamics. Catena 2009, 77, 48–55. [Google Scholar] [CrossRef] [Green Version]
- Miralles-Mellado, I.; Cantón, Y.; Solé-Benet, A. Two-dimensional porosity of crusted silty soils: Indicators of soil quality in semiarid rangelands? Soil Sci. Soc. Am. J. 2011, 75, 1289–1301. [Google Scholar] [CrossRef] [Green Version]
- Malam Issa, O.; Le Bissonnais, Y.; Défarge, C.; Trichet, J. Role of a microbial cover on structural stability of a sandy soil in Sahelian part of western Niger. Geoderma 2001, 101, 15–30. [Google Scholar] [CrossRef] [Green Version]
- Rossi, F.; Potrafka, R.M.; Garcia Pichel, F.; De Philippis, R. The role of the exopolysaccharides in enhancing hydraulic conductivity of biological soil crusts. Soil Biol. Biochem. 2012, 46, 33–40. [Google Scholar] [CrossRef]
- Román, J.R.; Roncero-Ramos, B.; Chamizo, S.; Rodríguez-Caballero, E.; Cantón, Y. Restoring soil functions by means of cyanobacteria inoculation: Importance of soil conditions and species selection. Land Degrad. Dev. 2018, 29, 3184–3193. [Google Scholar] [CrossRef]
- Adessi, A.; Cruz de Carvalho, R.; De Philippis, R.; Branquinho, C.; Marques da Silva, J. Microbial extracellular polymeric substances improve water retention in dryland biological soil crusts. Soil Biol. Biochem. 2018, 116, 67–69. [Google Scholar] [CrossRef]
- Kidron, G.J. Differential water distribution over dune slopes as affected by slope position and microbiotic crust, Negev Desert, Israel. Hydrol. Process. 1999, 13, 1665–1682. [Google Scholar] [CrossRef]
- Fischer, T.; Veste, M.; Wiehe, W.; Lange, P. Water repellency and pore clogging at early successional stages of microbiotic crusts on inland dunes, Brandenburg, NE Germany. Catena 2010, 80, 47–52. [Google Scholar] [CrossRef]
- Kidron, G.J.; Yaalon, D.H.; Vonshak, A. Two causes for runoff initiation on microbiotic crusts: Hydrophobicity and pore clogging. Soil Sci. 1999, 164, 18–27. [Google Scholar] [CrossRef]
- Eldridge, D.J. Biological soil crusts and water relations in Australian deserts. In Biological Soil Crusts: Structure, Function and Management; Belnap, J., Lange, O.L., Eds.; Springer: Berlin/Heidelberg, Germany, 2003; pp. 119–131. [Google Scholar]
- Zhang, J.; Zhang, Y.M.; Alison, D.; Cheng, J.H.; Zhou, X.B.; Zhang, B.C. The influence of biological soil crusts on dew deposition in Gurbantunggut Desert, Northwestern China. J. Hydrol. 2009, 379, 220–228. [Google Scholar] [CrossRef]
- Pan, Y.X.; Wang, X.P.; Zhang, Y.F. Dew formation characteristics in a revegetation-stabilized desert ecosystem in Shapotou area, Northern China. J. Hydrol. 2010, 387, 265–272. [Google Scholar] [CrossRef]
- Fischer, T.; Veste, M.; Bens, O.; Hüttl, R.F. Dew formation on the surface of biological soil crusts in central European sand ecosystems. Biogeosciences 2012, 9, 4621–4628. [Google Scholar] [CrossRef] [Green Version]
- Colica, G.; Li, H.; Rossi, F.; Li, D.; Liu, Y.; De Philippis, R. Microbial secreted exopolysaccharides affect the hydrological behavior of induced biological soil crusts in desert sandy soils. Soil Biol. Biochem. 2014, 68, 62–70. [Google Scholar] [CrossRef]
- Zangvil, A. Six years of dew observations in the Negev Desert, Israel. J. Arid Environ. 1996, 32, 361–371. [Google Scholar] [CrossRef]
- Lange, O.L.; Kidron, G.J.; Büdel, B.; Meyer, A.; Kilian, E.; Abeliovich, A. Taxonomic composition and photosynthetic characteristics of the ‘biological soil crusts’ covering sand dunes in the western Negev Desert. Funct. Ecol. 1992, 6, 519–527. [Google Scholar] [CrossRef]
- Cammeraat, L.H. Scale dependent thresholds in hydrological and erosion response of a semi-arid catchment in southeast Spain. Agric. Ecosyst. Environ. 2004, 104, 317–332. [Google Scholar] [CrossRef]
- Martin, Y.; Valeo, C.; Tait, M. Centimetre-scale representations of terrain and impacts on depression storage and runoff. Catena 2008, 75, 223–233. [Google Scholar] [CrossRef]
- Allmaras, R.R.; Burwell, R.E.; Larson, W.E.; Holt, R.F. Total porosity and random roughness of the interrow zone as influenced by tillage. USDA Conserv. Res. Rep. 1966, 7, 22. [Google Scholar]
- Calvo-Cases, A.; Boix-Fayos, C.; Arnau-Rosalen, E. Patterns and thresholds of runoff generation and sediment transport on some Mediterranean hillslopes. In Catchment dynamics and river processes: Mediterranean and other Climate Regions; Garcia, C., Batalla, R.J., Eds.; Elsevier: San Diego, CA, USA, 2005; pp. 31–51. [Google Scholar]
- Rodríguez-Caballero, E.; Castro, A.J.; Chamizo, S.; Quintas-Soriano, C.; Garcia-Llorente, M.; Cantón, Y.; Weber, B. Ecosystem services provided by biocrusts: From ecosystem functions to social values. J. Arid. Environ. 2018, 159, 45–53. [Google Scholar] [CrossRef]
- Concostrina-Zubiri, L.; Huber-Sannwald, E.; Martínez, I.; Flores Flores, J.L.; Reyes-Agüero, J.A.; Escudero, A.; Belnap, J. Biological soil crusts across disturbance–recovery scenarios: Effect of grazing regime on community dynamics. Ecol. Appl. 2014, 24, 1863–1877. [Google Scholar] [CrossRef] [PubMed] [Green Version]
- Mallen-Cooper, M.; Eldridge, D.J.; Delgado-Baquerizo, M. Livestock grazing and aridity reduce the functional diversity of biocrusts. Plant Soil 2018, 429, 175–185. [Google Scholar] [CrossRef]
- Havrilla, C.A.; Chaudhary, V.B.; Ferrenberg, S.; Antoninka, A.J.; Belnap, J.; Bowker, M.A.; Eldridge, D.J.; Faist, A.M.; Huber-Sannwald, E.; Leslie, A.D.; et al. Towards a predictive framework for biocrust mediation of plant performance: A meta? Anal. J. Ecol. 2019, 107, 2789–2807. [Google Scholar] [CrossRef] [Green Version]
- Zhao, Y.; Xu, M. Runoff and soil loss from revegetated grasslands in the Hilly Loess Plateau Region, China: Influence of biocrust patches and plant canopies. J. Hydrol. Eng. 2013, 18, 387–393. [Google Scholar] [CrossRef] [Green Version]
- Li, X.J.; Li, X.R.; Song, M.; Gao, Y.P.; Zheng, J.G.; Jia, R.L. Effects of crust and shrub patches on runoff, sedimentation, and related nutrient (C, N) redistribution in the desertified steppe zone of the Tengger Desert, Northern China. Geomorphology 2008, 96, 221–232. [Google Scholar] [CrossRef]
- Chamizo, S.; Rodríguez-Caballero, E.; Román, J.R.; Cantón, Y. Effects of biocrust on soil erosion and organic carbon losses under natural rainfall. Catena 2017, 148, 117–125. [Google Scholar] [CrossRef]
- Thomas, A.D.; Dougill, A.J. Spatial and temporal distribution of cyanobacterial soil crusts in the Kalahari: Implications for soil surface properties. Geomorphology 2007, 85, 17–29. [Google Scholar] [CrossRef]
- Svirčev, Z.; Dulić, T.; Obreht, I.; Codd, G.A.; Lehmkuhl, F.; Marković, S.B.; Hambach, U.; Meriluoto, J. Cyanobacteria and loess—An underestimated interaction. Plant Soil 2019, 439, 293–308. [Google Scholar]
- Chen, L.; Sela, S.; Svoray, T.; Assouline, S. Scale dependence of Hortonian rainfall-runoff processes in a semiarid environment. Water Resour. Res. 2016, 52, 5149–5166. [Google Scholar] [CrossRef] [Green Version]
- Rodríguez-Caballero, E.; Cantón, Y.; Jetten, V. Biological soil crust effects must be included to accurately model infiltration and erosion in drylands: An example from Tabernas Badlands. Geomorphology 2015, 241, 331–342. [Google Scholar] [CrossRef]
- Lan, L.; Wu, L.; Zhang, D.; Hu, C. Assessing level of development and successional stages in biological soil crusts with biological indicators. Microb. Ecol. 2013, 66, 394–403. [Google Scholar] [CrossRef] [PubMed]


| Crust/Soil Properties | El Cautivo | Las Amoladeras | |
|---|---|---|---|
| ICC | CC | CA | |
| Cyanobacteria cover (%) | 33.3 ± 6.2b | 80.3 ± 7.5a | 73.1 ± 4.3a |
| Random roughness (cm) | 3.9 ± 0.8b | 8.7 ± 1.7a | 4.2 ± 1.4b |
| Chlorophyll a content (μg g−1) | 2.3 ± 0.6c | 5.3 ± 1.1b | 7.4 ± 0.4a |
| EPS content (mg g−1) | 0.97 ± 0.39c | 1.92 ± 0.05b | 4.26 ± 0.37a |
| Crust organic carbon content (g kg−1) | 6.6 ± 1.3b | 14.1 ± 5.7a | 16.5 ± 3.1a |
| Total nitrogen content (g kg−1) | 1.0 ± 0.3b | 1.7 ± 0.6a | 1.8 ± 0.2a |
| Albedo (VIS region) | 3.5 ± 0.3a | 2.4 ± 0.5b | 1.9 ± 0.8b |
| Absorption peak at 680 nm | 0.94 ± 0.01a | 0.87 ± 0.01b | 0.77 ± 0.06c |
| Upper 1 cm soil organic carbon content (g kg−1) | 7.3 ± 1.0b | 12.7 ± 2.1a | 14.8 ± 3.2a |
| Upper 1 cm soil total nitrogen content (g kg−1) | 0.9 ± 0.2b | 1.4 ± 0.3a | 1.3 ± 0.4a |
| Upper 1 cm soil available water holding capacity (%) | 15.7 ± 3.0b | 21.8 ± 3.4a | 14.5 ± 1.1b |
| Aggregate stability (number of drop impacts per aggregate) | 20.5 ± 9.0b | 45.8 ± 3.9a | 49.3 ± 20.2a |
| Ks (mm h−1) | 5.7 ± 0.8b | 12.7 ± 4.8a | |
| Rainfall | Runoff Coefficient (%) | |||||||
|---|---|---|---|---|---|---|---|---|
| Date | Amount (mm) | Imean (mm h−1) | Imax (mm h−1) | Well-Developed Cyanobacteria (CC) | Incipient Cyanobacteria (ICc) | |||
| Plot | Small Hillslope | Large Hillslope | Plot | Small Hillslope | ||||
| SSC (mL) | - | - | 47.66 | 114.18 | 386.55 | 12.01 | 56.89 | |
| 26 January-10 | 46 | 7.1 | 19.4 | 18.0 ± 1.8 | 18.4 ± 3.6 | 16.0 ± 3.3 | 35.6 ± 6.3 | 35.4 ± 10.4 |
| 24 Febuary-10 | 58 | 4.5 | 12.2 | 7.9 ± 0.9 | 5.9 ± 0.8 | 3.7 ± 1.3 | 12.1 ± 3.8 | 13.6 ± 3.0 |
| 8 March-10 | 37 | 5.6 | 23.5 | 22.1 ± 5.8 | 5.1 ± 3.8 | 2.7 ± 1.6 | 34.9 ± 4.5 | 17.9 ± 3.6 |
| 12 March-10 | 19 | 3.4 | 10.4 | 2.7 ± 3.5 | 3.0 ± 4.4 | 2.4 ± 0.9 | 11.9 ± 6.8 | 11.4 ± 2.4 |
| 21 March-10 | 24 | 1.7 | 5.8 | 1.5 ± 2.3 | 2.4 ± 2.7 | 1.3 ± 0.2 | 4.8 ± 3.2 | 9.6 ± 3.5 |
| El Cautivo (Silty Loam Soils) | Las Amoladeras (Sandy Loam Soils) | |||
|---|---|---|---|---|
| Soil Surface Type | VWC (%) | Soil Water Loss (%) | VWC (%) | Soil Water Loss (%) |
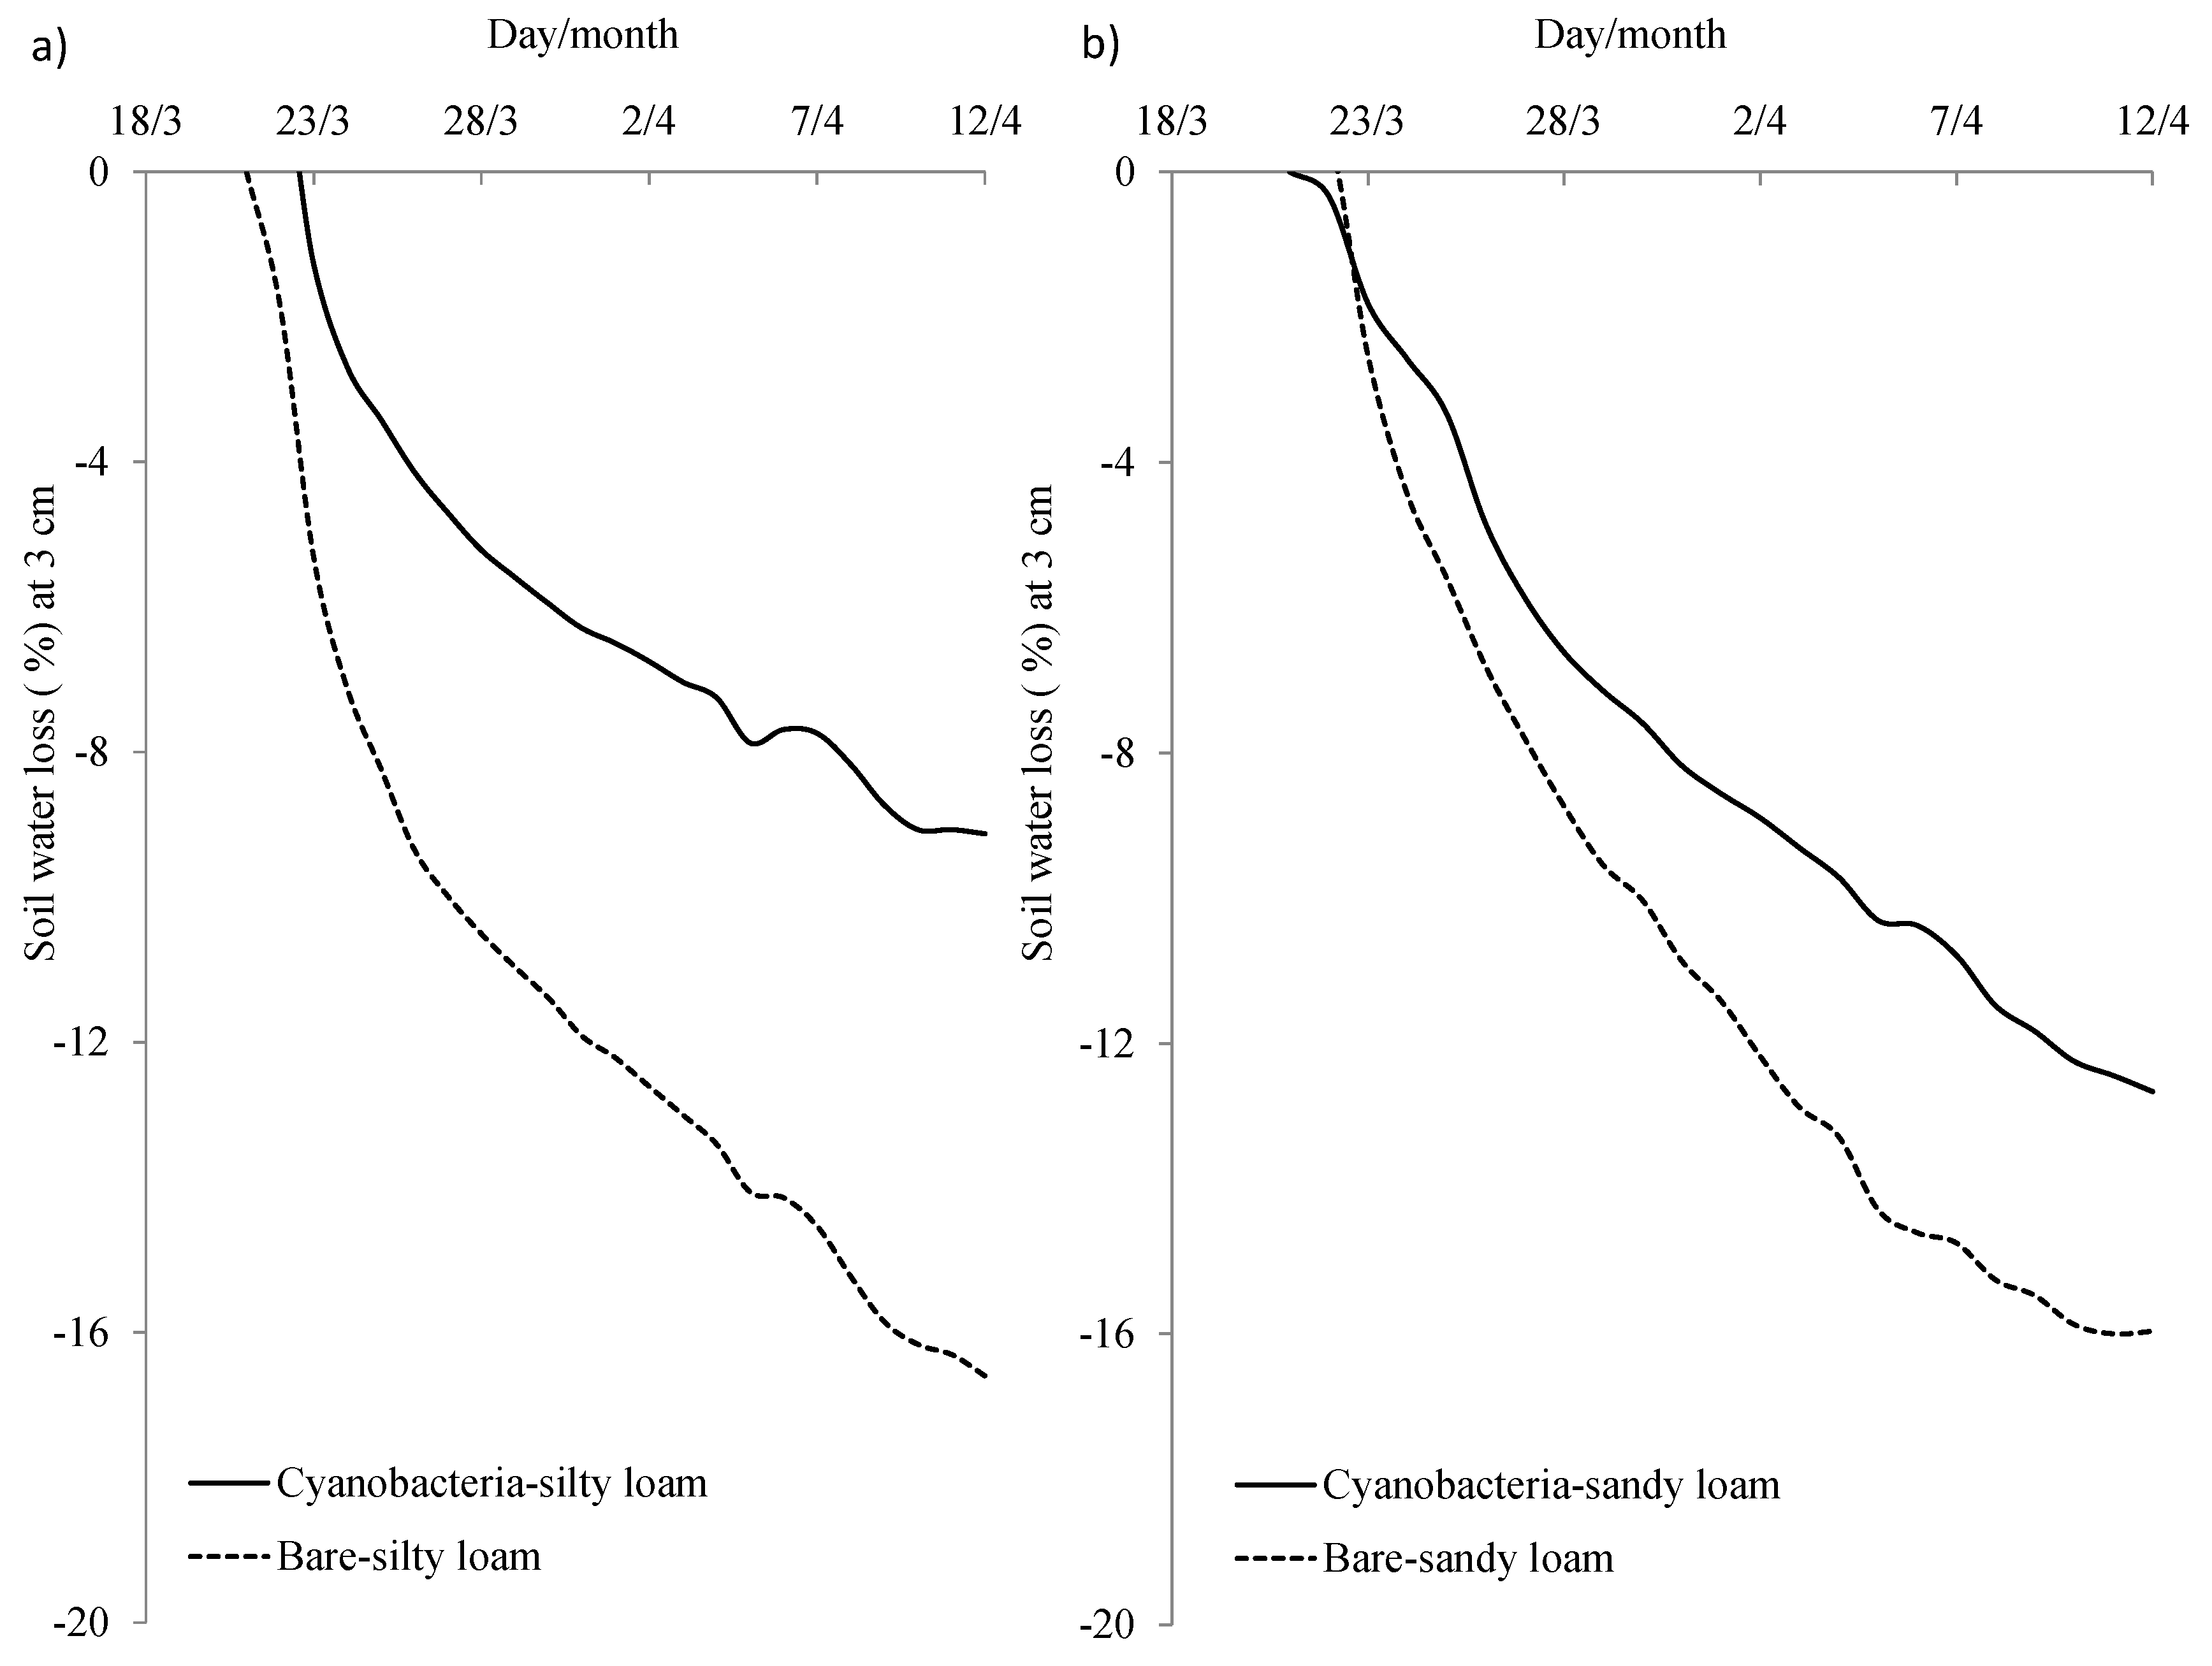
| Cyanobacteria (3 cm) | 7.9 | 83 | 11.9 | 59 |
| Removed crust (3 cm) | 5.1 | 94 | 8.2 | 83 |
| Cyanobacteria (10 cm) | 16.5 | 43 | 19.6 | 50 |
| Removed crust (10 cm) | 14.6 | 50 | 13.9 | 69 |
© 2020 by the authors. Licensee MDPI, Basel, Switzerland. This article is an open access article distributed under the terms and conditions of the Creative Commons Attribution (CC BY) license (http://creativecommons.org/licenses/by/4.0/).
Share and Cite
Cantón, Y.; Chamizo, S.; Rodriguez-Caballero, E.; Lázaro, R.; Roncero-Ramos, B.; Román, J.R.; Solé-Benet, A. Water Regulation in Cyanobacterial Biocrusts from Drylands: Negative Impacts of Anthropogenic Disturbance. Water 2020, 12, 720. https://doi.org/10.3390/w12030720
Cantón Y, Chamizo S, Rodriguez-Caballero E, Lázaro R, Roncero-Ramos B, Román JR, Solé-Benet A. Water Regulation in Cyanobacterial Biocrusts from Drylands: Negative Impacts of Anthropogenic Disturbance. Water. 2020; 12(3):720. https://doi.org/10.3390/w12030720
Chicago/Turabian StyleCantón, Yolanda, Sonia Chamizo, Emilio Rodriguez-Caballero, Roberto Lázaro, Beatriz Roncero-Ramos, José Raúl Román, and Albert Solé-Benet. 2020. "Water Regulation in Cyanobacterial Biocrusts from Drylands: Negative Impacts of Anthropogenic Disturbance" Water 12, no. 3: 720. https://doi.org/10.3390/w12030720