Effect of Pressure Fluctuations and Flow Confinement on Shear Stress in Jet-Driven Scour Processes


1
Department of Civil and Environmental Engineering, Imperial College London, South Kensington, London SW7 2AZ, UK
2
Department of Energy, Systems, Territory and Construction Engineering, University of Pisa, Via Gabba 22, 56122 Pisa, Italy
*
Author to whom correspondence should be addressed.
Water 2020, 12(3), 718; https://doi.org/10.3390/w12030718
Submission received: 23 January 2020
/
Revised: 17 February 2020
/
Accepted: 4 March 2020
/
Published: 6 March 2020
(This article belongs to the Section Hydraulics and Hydrodynamics)
Abstract
:The effect of pressure fluctuations and flow confinement on shear stress still represents a challenging problem for hydraulic engineers. Only a few studies investigated such aspects, but they did not focus on jet-driven scour processes in granular bed material. Following a recent theoretical framework, this paper presents a novel analytical procedure to assess the effect of pressure fluctuations on the average shear stress for 2D equilibrium configuration, under steady, black water flow conditions. The analysis of experimental data evidences that published formulas underestimate the maximum shear stress, because of the significant flow confinement and the presence of rotating material in the scour hole. Therefore, based on the hydrodynamic similitude characterizing the jet diffusion in a confined environment, a new shear stress coefficient and a novel equation are proposed to estimate the maximum shear stress for the tested configuration.
1. Introduction
Plunge pool scour is an important issue in water resources engineering. Many approaches are empirically based, and they furnish practical relationships whose validity is limited to the tested conditions and configurations, as shown in [1,2,3,4]. A detailed literature review on the topic can be found in [5,6]. In particular, [5,6] showed that experimental equations are mainly characterized by the following relation:
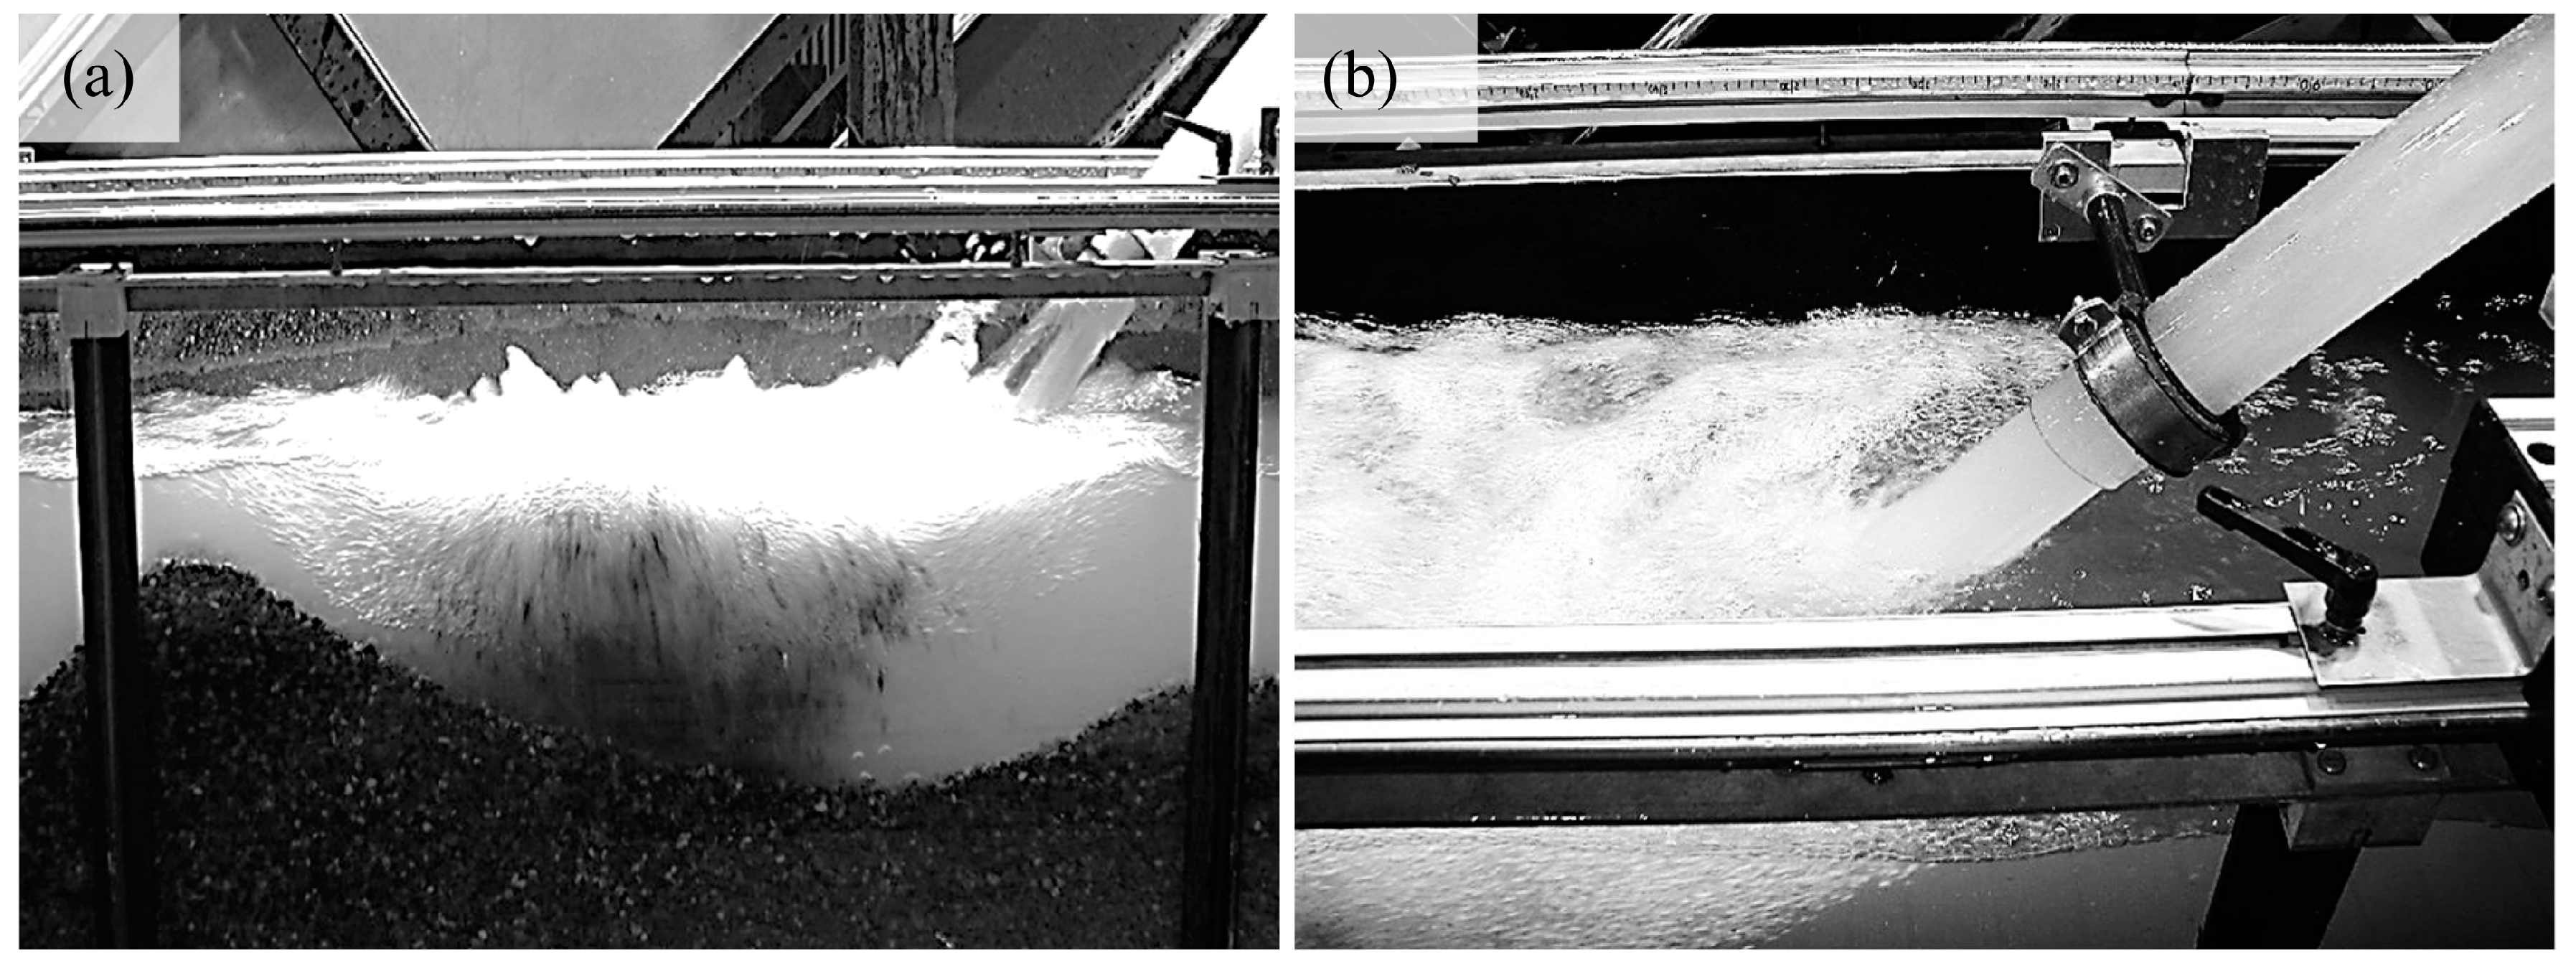
where Δ is the maximum scour depth at equilibrium, D is the water depth over the original sediment bed level, eq, eH, eg, ed and eρ are free exponents, K is a coefficient, ρ and ρs are water and sediment densities, respectively, q is the unit discharge for 2D case or the total discharge for the 3D counterpart, g is the gravitational acceleration, d is the characteristic sediment diameter (i.e., mean diameter d50 for uniform materials) and H is the drop height. The authors of [5,6] also showed that the variable Δ + D is a monotonic increasing function of q, H and ρ/(ρs−ρ), whereas it decreases with d for both 2D and 3D cases. In addition, the variable Δ + D is slightly affected by the non-uniformity coefficient σ = (d84/d16)1/2, where dn is the material size for which n% is finer. Figure 1 shows two pictures taken during an experimental test.
A comprehensive empirical approach was proposed by [7,8,9] for the 2D and 3D cases and for the temporal evolution of the scour depth, respectively. The authors of [7] distinguished two possible equilibrium conditions, defined as static and dynamic. The dynamic condition occurs when the jet action is present, whereas the static condition takes place when the jet action ceases and rotating material deposits within the scour hole. Such deposition can deeply modify the scour hole configuration. The authors of [7,8,9] found that the scour hole geometry depends on the jet angle, the densimetric Froude number, the non-dimensional tailwater, the sediment mean diameter, the non-uniformity coefficient, the air concentration and its three-dimensionality. In addition, [8] provided a quantitative criterion to assess the scour hole morphology based on a three-dimensionality parameter λ = b/B, where b is the extrapolated scour hole width and B is the channel width. Following this approach, [10,11] investigated the effect of protection measures on the maximum scour hole depth, evidencing that the location of the protection structure and its permeability deeply affect the scour mechanism.
Semi-theoretical methods have been proposed by [12,13,14,15]. In particular, [12] related equilibrium scour condition to the excess of shear stress acting on the scour surface. They considered a 2D configuration caused by a jet originating from weirs and grade-control structures, evidencing that the maximum scour depth mainly depends on the parameters reported in Equation (1). Similarly, [13,14] provided semi-theoretical analysis including the temporal scour depth evolution. An alternative semi-theoretical approach was proposed by [16,17] for the 2D and 3D cases, respectively. Namely, applying Newton’s second law, [16,17] derived an equation to predict the variable Δ + D, having the same analytical expression of Equation (1). Nevertheless, the dependence of the proposed equation on granulometric characteristics of bed material was empirically addressed.
Theoretical approaches based on the phenomenological theory of turbulence have been recently developed by [18,19,20,21,22]. These studies provided insights on the dynamics of bedload transport. In particular, [18,19] analyzed the scour mechanism due to plunging jets for both 2D and 3D scour hole geometry. They derived a theoretical expression for the variable Δ + D assuming that the Turbulent Kinetic Energy (TKE) per unit mass in the scour hole is governed by the scales associated with the largest eddies and the TKE cascades from large to small scales at the same rate of the large scales (inviscid mechanism). They also provided the theoretical values of exponents appearing in Equation (1). Nevertheless, their analysis has been only recently validated with experimental and field data. Following the approach proposed by [18,19], the authors of [23] analyzed the temporal evolution of the scour depth for both 2D and 3D cases. In so doing, they were able to determine the value of the constant K for both equilibrium configurations. Furthermore, they provided an interpretation of the scour evolution mechanism (including vertical jets) and proposed two ordinary differential equations to predict the scour depth up to the asymptotic equilibrium condition.
In spite of the recent tremendous progress on this topic, none of the above mentioned studies has provided insights on the effect of pressure fluctuations and flow confinement on scour mechanism. Only very recently, [24,25,26] have analyzed the general flow behavior and wall shear stress distribution on a flat surface under confined conditions. Authors compared their results with those proposed by [27,28,29], revealing that the maximum shear stress is significantly affected by the confinement ratio. In addition, [25] concluded that “a stronger confinement is expected to increase wall shear stress.”
The authors of [30] have recently proposed a novel theoretical approach to estimate the average shear stress acting on the scour surface. Such approach was based on angular momentum conservation, involving granular material rotating in the scour hole. More specifically, the authors (1) presented a novel theory to estimate the average shear stress; (2) compared their approach to other fully theoretical and empirical/semi-theoretical methods present in the open literature; and (3) discussed the applicability of their theory in engineering practice. In so doing, [30] marginally addressed the effect of pressure fluctuations on the estimated average shear stress, without providing a theoretical procedure to assess the effect of such fluctuations on the estimated variable.
In this paper, we focus on the scour process caused by steady, black water (i.e., absence of air) plunging jets, generally occurring in the stilling basin downstream of a dam spillway. We address several issues, that, apparently, have not been analyzed by any of the referenced publications. First, we present the analytical details of a novel theoretical approach to assess the effect of pressure fluctuations on average shear stress. Then, we address the effect of flow confinement on maximum shear stress in the presence of rotating granular material within the scour hole. We show that other authors’ approaches significantly underestimate the maximum shear stress for the jet-driven scour process and propose a new value of the shear stress coefficient Cs for the analyzed configuration. Finally, this study also furnishes another unprecedented result, i.e., it corroborates the approach based on the phenomenological theory of turbulence recently developed by [23], showing that it can be successfully applied to estimate maximum shear stress.
However, it is worth mentioning that further studies are needed to enhance the understanding of the jet-driven scour processes. Among others, the effects of pressure fluctuation and flow confinement on shear stress for 3D equilibrium configuration are still unexplored. In addition, scour phenomena in natural rivers or streams could be characterized by different mechanisms, depending on in situ conditions (bed irregularity, presence of vegetation, flow characteristics, etc.). In this regard, it is worth mentioning that [31] have recently investigated 3D turbulence characteristics of different accelerating and decelerating flows, showing that the decelerating flow has a greater influence on the turbulence structure of flow in comparison to that of the accelerating one. Likewise, [32] analyzed both velocity distribution and three-dimensional turbulence characteristics for uniform smooth bed, laboratory-prepared rough bed and water-worked bed open channel flows. Their analysis focused on flow characteristics comparison at the near-bed region, and provided useful insights to correctly reproduce in situ bed condition in laboratory models. In so doing, they evidenced that these aspects still represent important challenges and can have a relevant impact on flow features.
2. Experimental and Theoretical Background
To present the reader with all elements conducive to a self-contained document, in this section we synthetize the experimental methodology and the theoretical approach developed by [30].
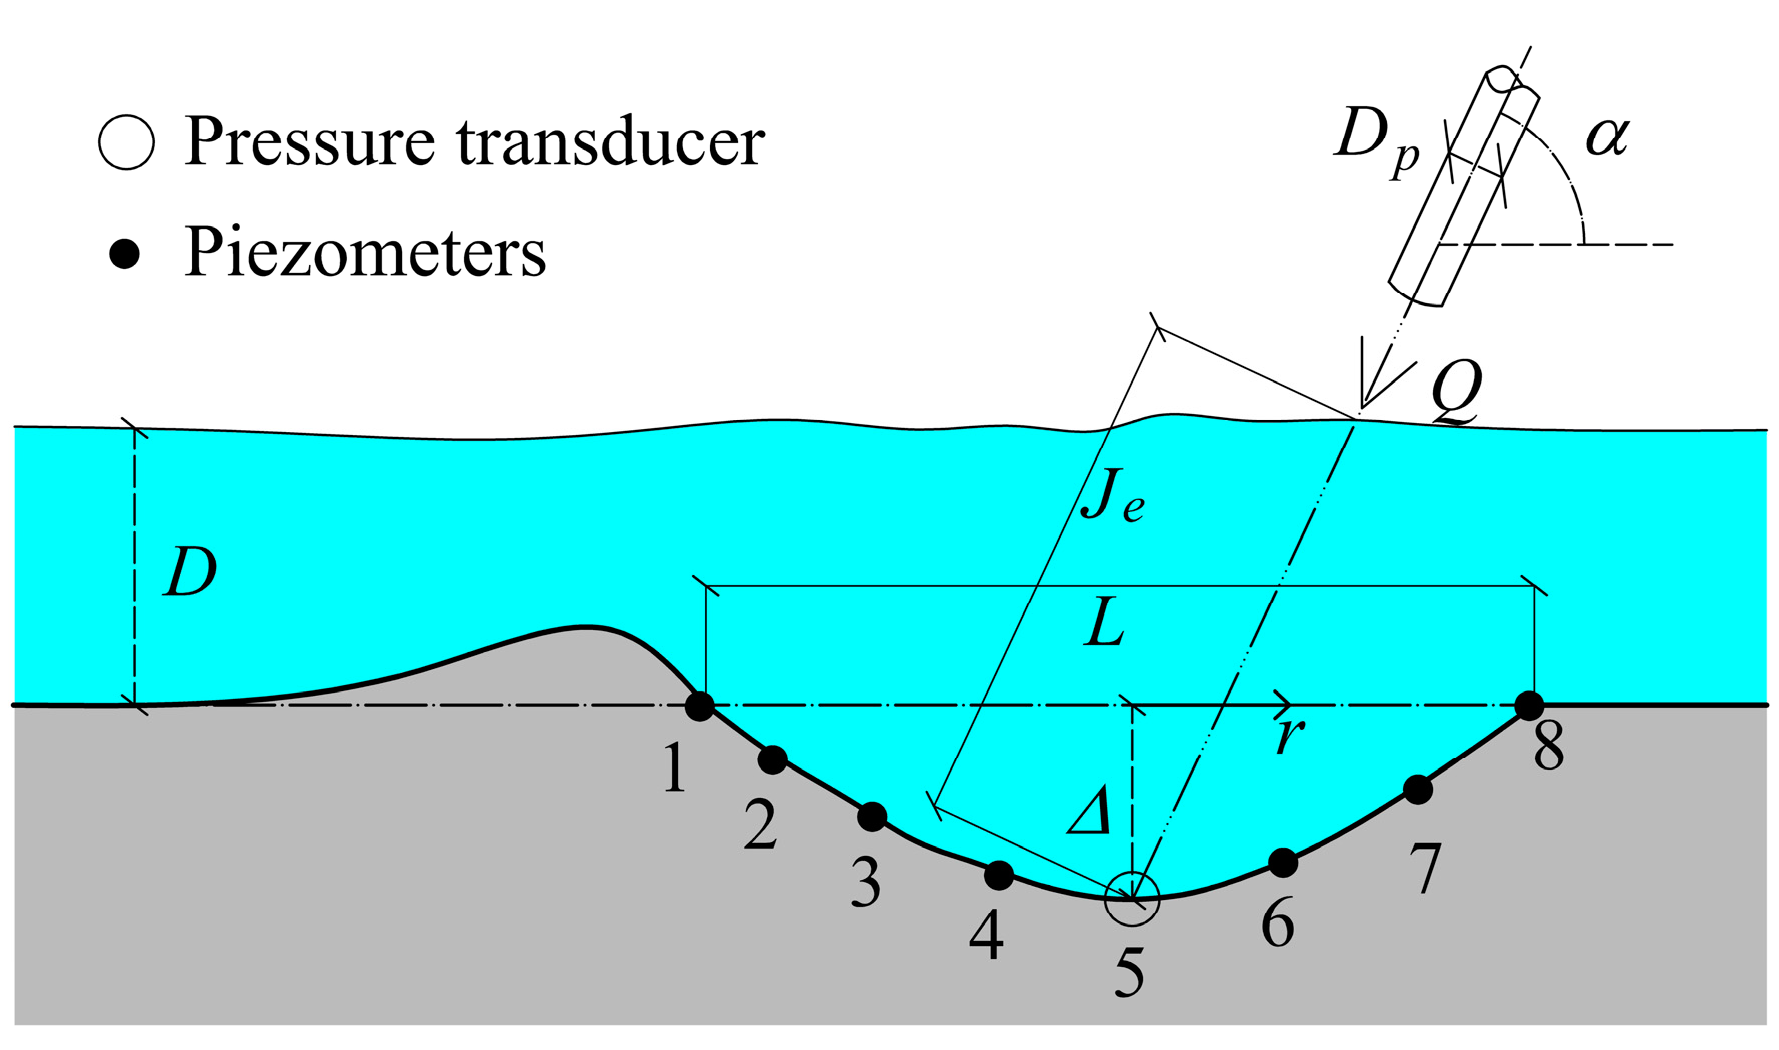
The authors of [30] conducted experimental tests in a glass-walled horizontal channel 6.00 m long, 0.80 m wide and 0.90 m deep. One uniform granular bed material was used for experiments (mean diameter d50 = 2.25 mm and density ρs = 2214 kg/m3). Two jet inclinations with respect to the horizontal were tested, i.e., α = 45° and 60°. The ranges of tested parameters are reported in Table 1, including those relative to the discharge Q, water depth D above the original sediment level and average shear stress τav. Figure 2 illustrates the main hydraulic and geometric parameters characterizing the scour hole and jet configuration.
One pressure transducer and seven piezometers were located 1 cm below the dynamic equilibrium axial profile to measure the dynamic pressure distribution. The pressure transducer was always located in correspondence with the section of maximum scour depth, where maximum pressure fluctuations occur (Figure 2). The jet was stopped once the equilibrium condition was reached, resulting in the deposition of rotating material in the scour hole. The static equilibrium morphology was also surveyed, allowing [30] to estimate the volume of the suspended material.
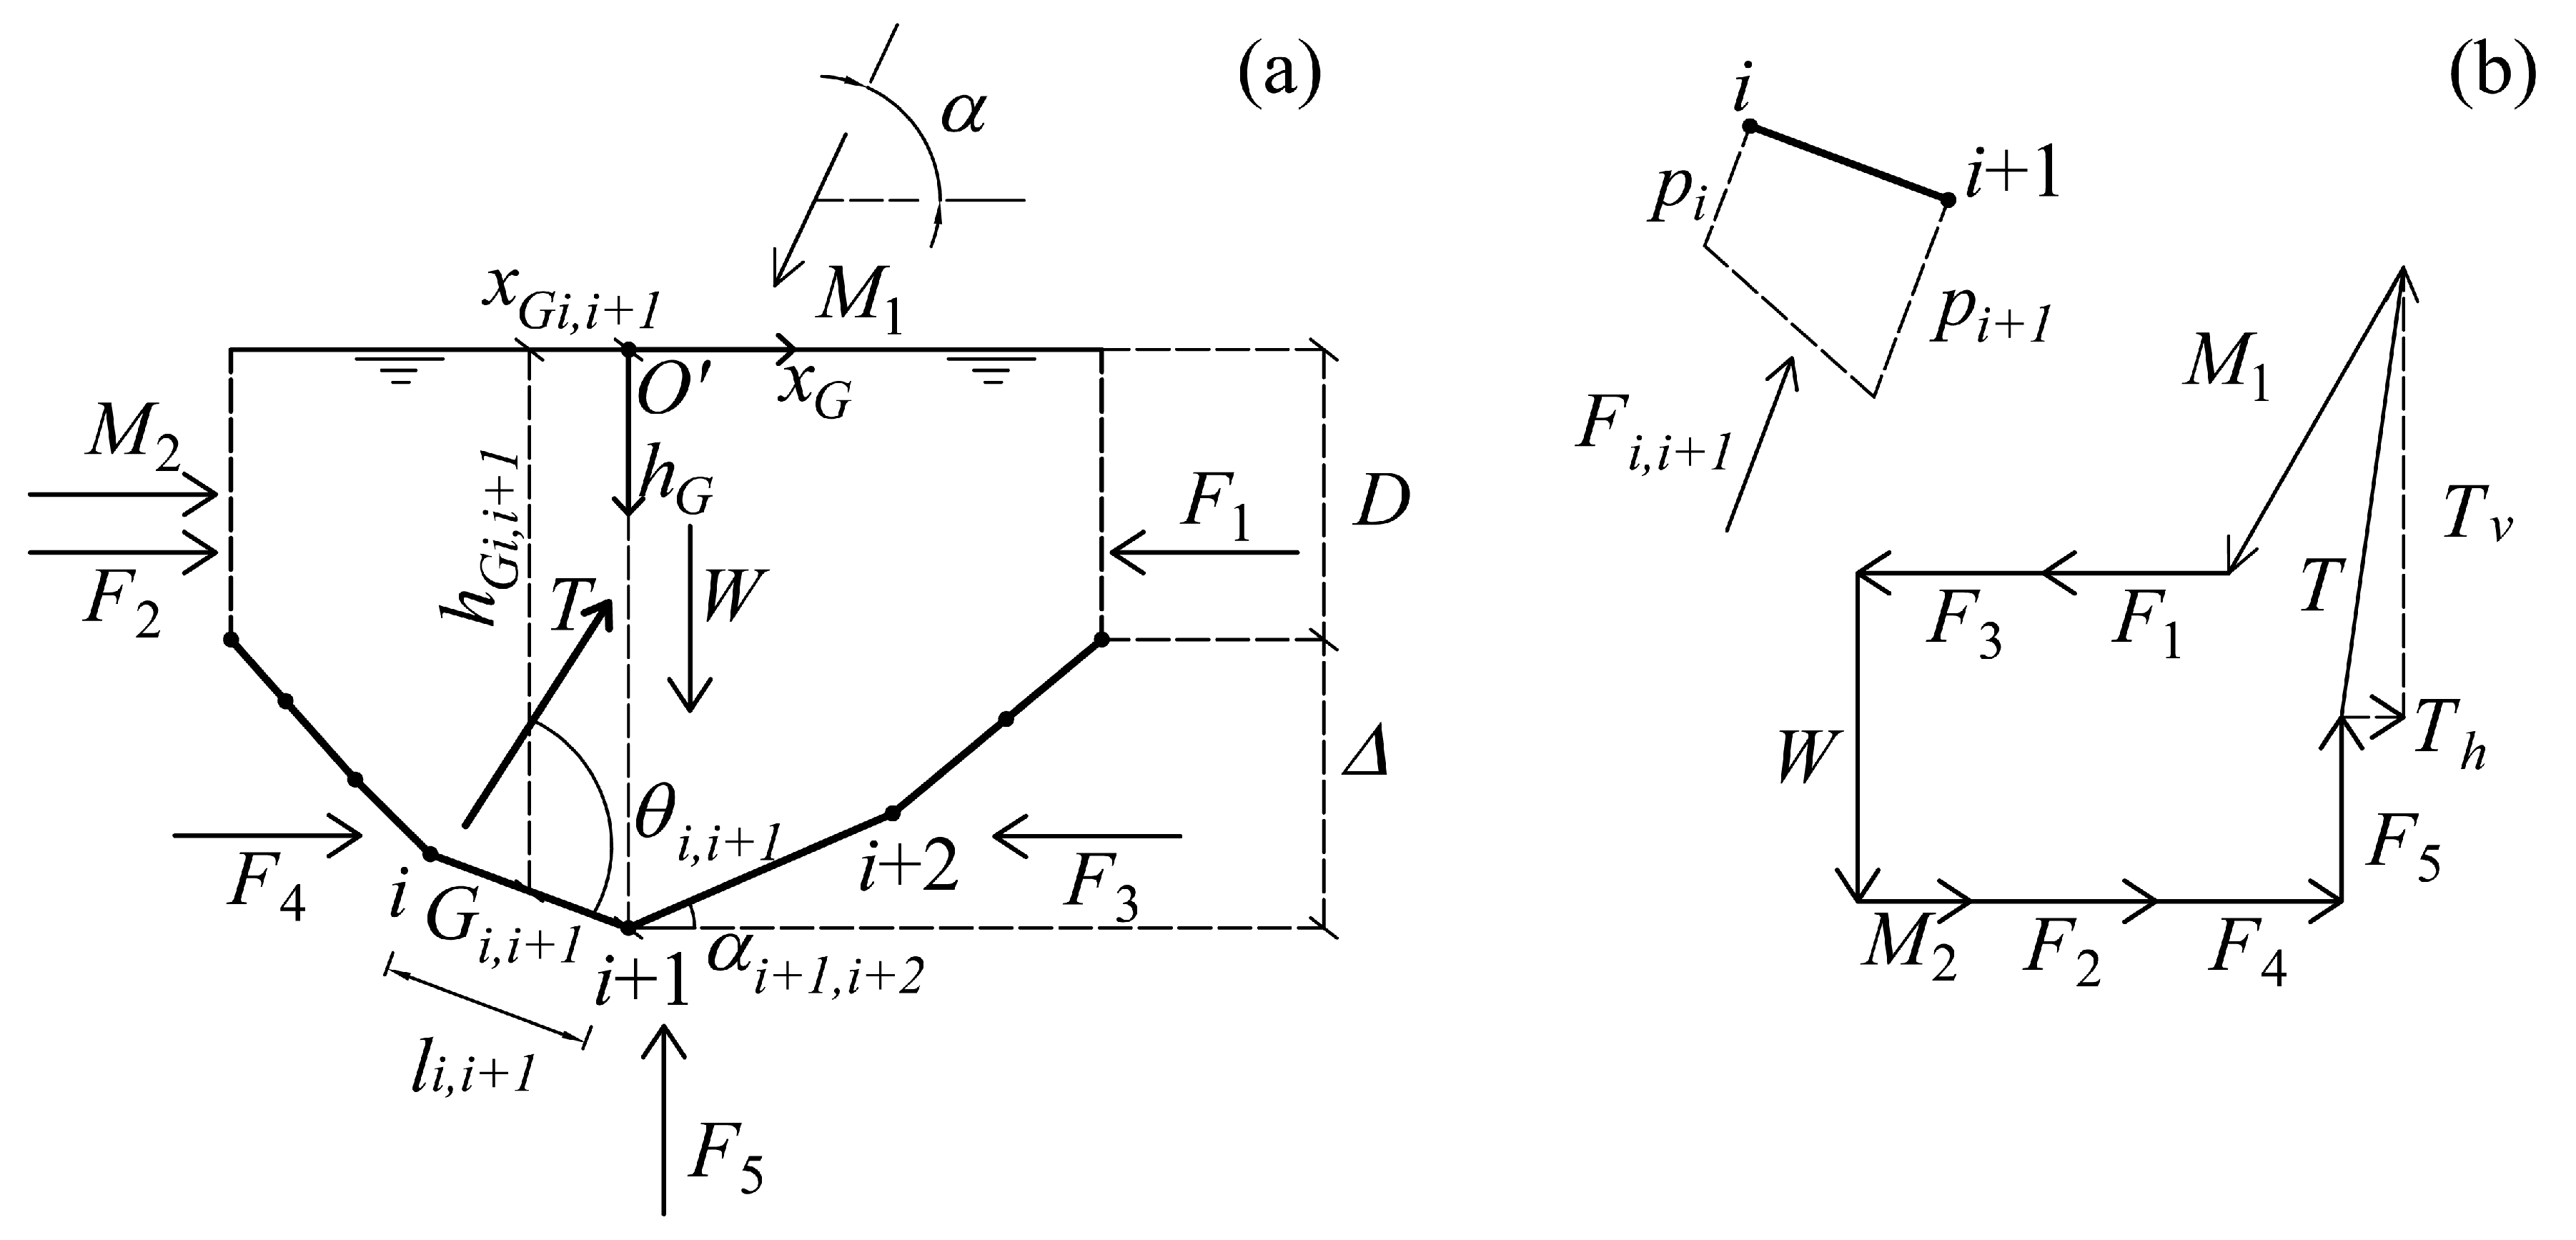
Average shear stress acting on the scour hole surface was estimated by applying the linear momentum equation to a selected control volume CV (Figure 3a). In doing so, [30] experimentally verified that pressure distributions at vertical water surfaces of the CV were approximately hydrostatic, i.e., their resultants F1 and F2 can be expressed as F1 ≈ F2 ≈ 0.5ρgD2B, resulting in F1 − F2 ≈ 0 N. As for force resultant Fi,i+1 acting on the scour hole profile segment i−i+1, it is reasonable to assume a linear variation of the pressure distribution between two successive sections of measurement (Figure 3b). Consequently, Fi,i+1 can be expressed as:
where pi is the value of the pressure measured at the axial point i. Note that, in this specific case, i is an integer varying between 1 and 8 (number of measurement points in Figure 2). In Equation (2), li,i+1 indicates the length of the segment i−i+1, whose inclination αi,i+1 with respect to the horizontal was estimated from the plots of dynamic equilibrium axial profiles (Figure 3a). The application of the linear momentum conservation law to the selected CV leads to the following force component balances (Figure 3b), where Tv and Th represent the vertical and horizontal components of the vector T, whose magnitude is :
where W = ρg Vw + ρs g Vs is the weight of the CV, with Vw and Vs indicating the volume of water and rotating material in the CV, ρ and ρs are the water and sediment densities, g is the gravity acceleration, M1 = ρQVj and M2 = ρQ2/(BD) are the momentum fluxes of the jet and of the flow exiting the CV, respectively, and Vj is the jet velocity. The authors of [30] showed that the magnitude of the resultant force T distributed on the scour surface for the segment i−i+1 (Ti,i+1) scales with hGi,i+1 and xGi,i+1 as follows:
where hGi,i+1 and xGi,i+1 are the vertical and longitudinal coordinates of the center of mass Gi,i+1 of each segment i−i+1 (Figure 3a), and the origin O′ of the reference system is located at the intersection of the vertical plane containing the maximum scour depth with the water surface. It is worth mentioning that Equation (5) also reflects the findings of [4,12,16,23,25,27,28,29], who showed that shear stress reduces with the water depth and longitudinal distance from the jet impact zone. Furthermore, [30] showed that Ti,i+1 and, consequently, the corresponding shear stress τi,i+1 acting on the scour profile segment i−i+1 can be computed as follows:
where θi,i+1 is the angle between the direction of the free vector T and the segment i−i+1. Thus, the average shear stress τav can be expressed as:
In this regard, [4,33,34,35,36,37,38] evidenced that pressure fluctuations are important in scour processes as they can cause grain ejection into the hole. They also showed that for massive rock beds, pressure fluctuations at the plunge pool bottom are responsible for the scour process with pressure waves penetrating into the fissures. For granular beds, the scour mechanism is characterized by a significant amount of rotating material within the scour hole, causing overall mitigation of pressure oscillations at the equilibrium scour hole surface. In addition, the suspended material represents an obstacle for grain ejection, contributing to limit both the maximum scour depth and kinetics of the scour process.
3. Estimation of Pressure Fluctuation Effect on Average Shear Stress
In this section, we elucidate the details of an analytical procedure to estimate the average shear stress standard deviation στav. For each test, we assume that the sum of W and M1sin(α) is strictly constant (variance equal to 0) at equilibrium. Notably, W+M1sin(α) does not vary with time, depending only on the equilibrium morphology, the amount of rotating material and characteristics of the jet, that can be reasonably considered to be constant at equilibrium. Therefore, from Equation (3), we can derive the following Equation (9) valid for dynamic equilibrium condition:
where and are the variances of the magnitudes of Tv and F5, respectively. Experimental evidences show that Th << Tv and, consequently, Tv ≈ T (see Table 2), resulting in:
with indicating the variance of the magnitude of T. This assumption is also in agreement with the findings of [16], who found that the horizontal component of the resultant of pressure distribution is much smaller than the vertical counterpart, concluding that the balance of forces is slightly influenced by the impinging jet angle for α ≥ 60°. In this paper, we further extended the validity of such an assumption by showing that Tv ≈ T is also valid for α = 45°.
As for the force resultant F5, the following equation applies:
where βi,i+1 = 90°−|αi,i+1| is the inclination of the force Fi,i+1 with respect to the horizontal and 0° ≤ βi,i+1 ≤ 90°. For measurements taken with piezometers, pressure oscillations cannot be correctly assessed because of the water column inertia. Therefore, in order to give a conservative estimation of the standard deviation of τav, we assume that:
for i varying between 1 and 8, where σ2pmax represent the variances of the pressure measured at the section i and at the section of maximum scour depth by the pressure transducer. According to [4,28,29,33,34,35,36,37,38], the maximum oscillation, with respect to the mean pressure head value, occurs in the jet impingement zone, i.e., in correspondence with the section of maximum scour depth. Re-arranging Equation (11) as follows:
and defining A1, Ai+1 (for i varying between 1 and 6) and A8 as:
Equation (13) can be re-written as:
Considering that pi can be reasonably assumed as independent variables [33], by combining Equations (9), (10), (12) and (17), we obtain:
Considering Equation (6), we can now define:
then, we obtain:
Note that Ci,i+1 only depends on geometric characteristics of the scour hole profile, that can be reasonably assumed to be constant at equilibrium. Furthermore, Equation (7) may be re-written as:
where
Therefore:
with and indicating the variances of Ti,i+1 and τi,i+1. Again, as Di,i+1 only depends on geometric characteristics of the scour hole profile at equilibrium, we can reasonably assume that it is constant. Thus, considering Equation (8), we finally obtain:
Following the proposed analytical methodology, we are now able to provide a conservative estimation of the average shear stress standard deviation στav and, consequently, the relative error e% = 100?στav?/τav. The methodology illustrated in this section does not depend on sediment bed gradation and scale. In fact, the average shear stress is a result derived from the application of the angular momentum conservation law, which takes into account the torque contributions given by the shear stress distribution and the momentum flux of the impinging jet. The approach proposed by [30] is fully consistent with that based on the phenomenological theory of turbulence developed by [23], which is valid regardless of the gradation of the granular material and scale. However, further investigations are needed to validate its applicability in the generality of the cases.
4. Estimation of Maximum Shear Stress
In this section, we present an estimation of maximum shear stress occurring in the scour hole. Apparently, no studies are present in the literature dealing with the shear stress distribution in the scour hole due to a single plunging jet, resulting in a 2D equilibrium configuration and involving sediment suspension. Furthermore, studies developed by [7,8] focused on static and dynamic scour characteristics, highlighting the difference between the two configurations, due to both the presence of rotating material and scour hole geometry. Suspended sediment plays a relevant role in the assessment of the dynamic equilibrium configuration, contributing to partially dissipate flow energy and, at the same time, to modify scour characteristics. In fact, the presence of suspended material significantly modifies scour mechanism, because of two main reasons: (1) it contributes to strongly confine the jet diffusion within the scour hole, thus increasing the flow turbulence intensity and causing a scour hole shape characterized by surface inclination with respect to the horizontal much bigger than the wet angle of repose of granular bed material; and (2) the scour hole depth significantly decreases with the amount of rotating material [7], thus reducing the jet diffusion length and, consequently, increasing shear stress.
In particular, this last occurrence is extremely important to understand the difference in terms of flow dynamics between the diffusion mechanism of a jet from a weir (or headcut) and a plunging jet from a dam spillway. They can both result in a 2D equilibrium scour configuration, depending on downstream stilling basin geometry. In the first case (jet from weir or headcut), a much less quantity of sediment rotates inside the scour hole, mainly because of uniform flow diffusion, facilitating ridge flattening and sediment transport. In addition, the impinging angle of jets originating from grade-control structures onto the water surface is usually less than that characterizing jets originating from a dam. The authors of [13,14,15] analyzed both the equilibrium depth and the time-varying sediment concentration exiting a plunge pool. They studied the jet diffusion into the pool downstream of a headcut, assuming that D is negligible with respect to Δ. They highlighted the effect of the diffusion length on the maximum shear stress and, based on earlier studies by [39,40,41,42,43,44], they defined the potential core of the jet as the zone in which the centerline velocity is constant and equal to Vj. Its length, termed Jp by [15], is measured from the jet impingement onto the water surface along the jet inclination, and can be estimated as Jp = Cd2y0. Cd is the diffusion constant (assumed equal to 2.6 by [15]) and y0 is the jet thickness assumed to be equal to the nozzle diameter Dp. Beyond this distance, the maximum velocity decays and becomes equal to V along the jet centerline, whereas the entire flow velocity field is characterized by a lower velocity due to the jet diffusion. Therefore, as the maximum shear stress τm can be related to the maximum diffused jet velocity V in the plunge pool (see also [16,17]), [15] proposed the following two expressions for τm:
valid for J ≤ Jp (resulting in a constant τm within the potential core), and
valid for J > Jp. Equation (26) evidences that τm decreases with J, i.e., with the distance along the centerline from water surface impingement to the granular bed. Cf is the friction coefficient and, based on Blasius flow assumption, it can be expressed as follows:
where q is the unit discharge and ν is the kinematic viscosity.
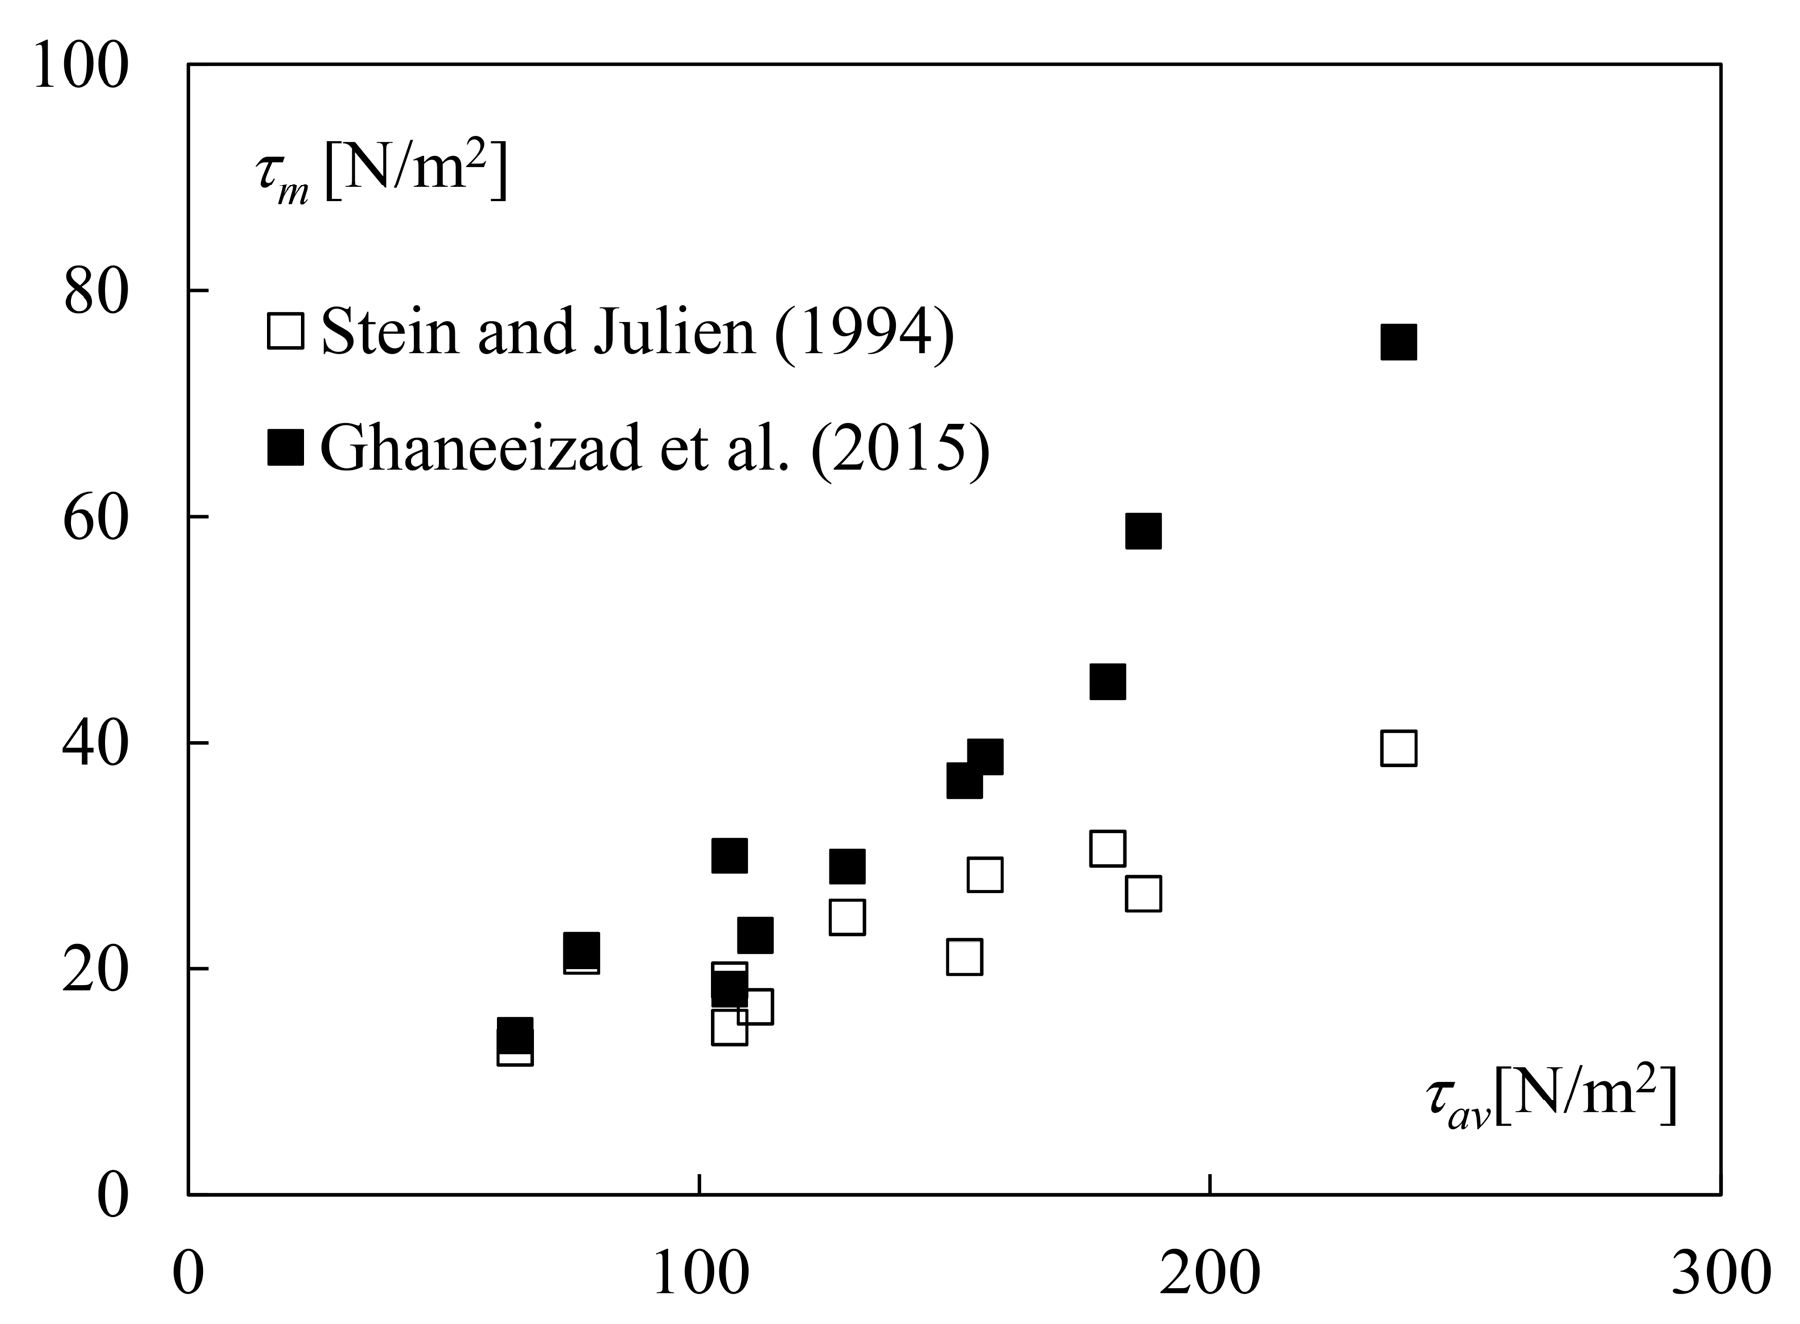
Figure 4 shows the comparison between maximum shear stress τm, calculated using Equation (26), and average shear stress τav measured by [30]. τm was evaluated by Equation (26), as experimental tests are characterized by Je > Jp, where Je is J at equilibrium. The maximum scour depth generally occurs in correspondence with the impingement point of the jet on the granular bed. Thus, for the following comparison, it can be reasonably assumed to be coincident with the intersection of the jet centerline with the scour hole surface, i.e., Je ≈ (Δ + D)/sin(α) (see Figure 2). The mentioned comparison shows that the values of τm predicted by [15] are lower than those of τav measured by [30]. This confirms the prominent effect of rotating material on shear stress distribution and the effect of flow confinement due to the scour hole configuration.
This last effect was extensively investigated by [25,26,45,46], who showed that shear stress significantly increases with flow confinement, as the rate of momentum transfer increases along the axial direction, resulting in secondary flow and strong water recirculation. Although the analysis conducted by [25] is related to a water jet impinging on a flat surface, the flow diffusion mechanism shows similarities with that occurring in the presence of a plunging jet within a scour hole. Note that [25] limited their analysis to vertical jet impinging on a flat surface, therefore in their case Δ = 0 m and H* = D, where H* is the impingement height. In particular, they showed that τm is much bigger than that predicted by [28] and can be expressed by Equation (28):
According to [25], He is equal to H* (i.e., D in Figure 2) for vertical jet impinging on a flat plate. However, in the presence of a scour hole, He is equal to Je, i.e., He = Δ + D for the vertical jet (as sin(α) = 1). The authors of [25] found that the shear stress coefficient Cs can be assumed equal to 0.38. In this regard, it is worth noticing that [28] proposed Cs = 0.16 for non-confined jets. The significant difference between Cs values is mainly due to flow recirculation. In fact, flow recirculation within a scour hole is much more prominent than that evidenced by [25] (note the considerable amount of rotating sediment in Figure 1a). Namely, [25] tested confined jets whose confinement ratio (box area to nozzle area) was 13,950. Whereas, tests conducted by [30] are characterized by LB/(πDp2/4) ranging between 200 and 450, where L is the scour hole length. This aspect is crucial to understand and explain the mentioned difference. In addition, [7] showed that the maximum scour depth (or, equivalently, Δ + D, D being constant) decreases with the amount of rotating material in the scour hole, and [23] demonstrated that the shear stress scales with 1/(Δ + D). Therefore, apart from flow confinement effect, the presence of rotating material within the scour hole provides a further explanation of the deviation between τm values calculated using Equations (26) and (28) and τav values measured by [30]
Based on these observations, in the following, we furnish an estimation of both Cs and τm for tests conducted by [30], assuming the longitudinal shear stress distribution proposed by [25]. This last assumption appears to be reasonable considering that hydrodynamics of the phenomenon analyzed by [25] is similar to that occurring in the scour hole. Note that [25] “replicated conditions expected in a jet erosion process”. In so doing, they showed that the shear stress distribution in the radial direction proposed by [47] does not represent the real stresses in a confined environment, and proposed the following empirical TKE-based expression for shear stress distribution:
valid for 0 ≤ λ = r/H* ≤ 0.38, where r is the radial distance from jet centerline (Figure 2). Whereas, for λ > 0.38, they showed that the shear stress distribution follows that by [27]. Furthermore, they evidenced the similitude in terms of non-dimensional shear stress distribution among the different approaches, including those of [27,29,47]. Such approaches result in non-dimensional curves characterized by different shear stress peaks, but similar non-dimensional ratio τm/τav. Therefore, it is reasonable to assume a negligible effect of flow confinement on the ratio τm/τav. Consequently, the shear stress longitudinal distribution τr relative to experimental tests performed by [30] was computed by using Equation (29) and assuming He = Je. Due to the (quasi-) longitudinal symmetry of the scour hole, r ranges between 0 and 0.5 L. Figure 5a shows an example of shear stress distribution relative to test 11 of [30], in which τm, computed with Equation (29), is equal to 29 N/m2, and τav, estimated by using the mentioned distribution, is 11.8 N/m2, with r ranging between 0 m and 0.27 m.
The mentioned analysis was extended to all experimental tests conducted by [30], resulting in an average ratio τm/τav ≈ 2.5. Based on this deduction, τm values of present tests (jets confined by a scour hole with rotating material) were contrasted with those predicted with Equation (28), resulting in Cs = 3.5 (R2 = 0.83), whereas Cs = 0.16 for non-confined jets and Cs = 0.38 for confined jets. Such difference highlights one of the novelties brought by our analysis in the assessment of maximum shear stress for jet-driven scour processes.
In addition, the presented equations for the estimation of τm are either empirical or semi-theoretical and do not take into account the granulometric characteristics of bed material. Therefore, their validity could be limited to the tested range of parameters. Vice versa, according to [17], “a relation based on fundamental principles of physics, calibrated by using measured scour data, could overcome this problem.” In this regard, [23] developed the following scaling expression for τ:
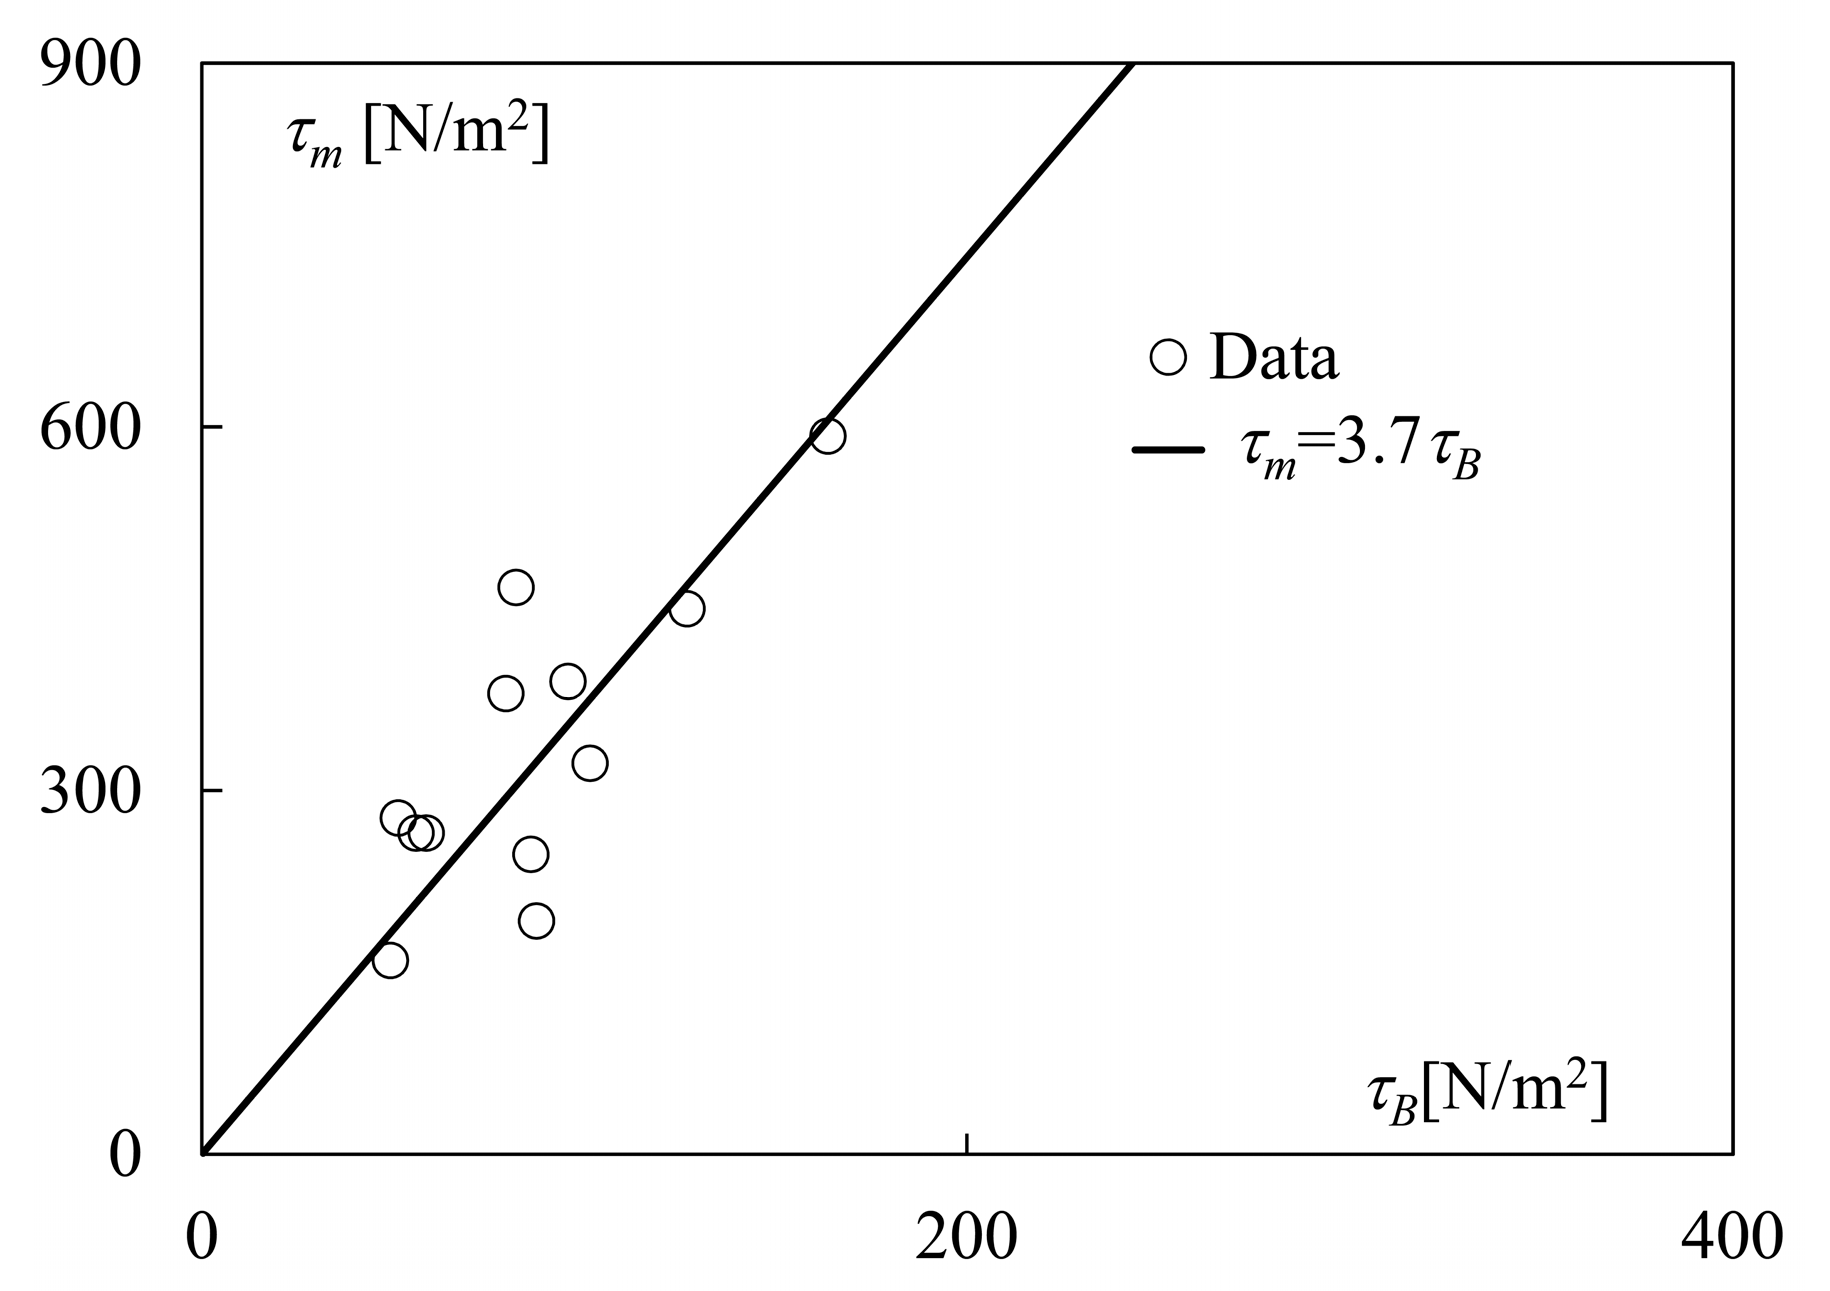
with ~ indicating “scales with”. In Figure 6 the estimated values of τm (=2.5τav) are contrasted against τB values calculated using Equation (30), allowing us to derive the following predicting relation:
Since Equation (30) is based on first principles, it is implicitly assumed that it is independent from the scale. However, this assumption needs to be verified by using independent datasets at larger scales.
5. Conclusions
This study contributes to the understanding of scour mechanism governing jet-driven scour processes in granular bed materials under steady, black water flow conditions. The main results can be synthesized as follows: (1) a novel analytical procedure to assess the effect of pressure fluctuations on shear stress is presented. The proposed methodology supplements the novelty brought by [30] and, in principle, should be applicable for the generality of the cases; (2) the effects of flow confinement and rotating material within the scour hole on maximum shear stress are addressed as well. Apparently, other approaches underestimate the maximum shear stress, providing significantly smaller values of the shear stress coefficient for the tested configuration; (3) the scaling expression developed by [23] is adopted to derive a novel equation for the estimation of maximum shear stress. Unlike other empirical or semi-theoretical equations present in the open literature, the proposed equation represents “a relation based on fundamental principles of physics, calibrated by using measured scour data” and accounts for granulometric characteristics of the bed material.
Further studies are needed to investigate other relevant aspects characterizing jet-driven scour processes. Among others, the effects of in situ conditions, structure typology, equilibrium configuration (3D case) and flow characteristics on maximum shear stress and pressure fluctuations still represent challenging problems.
Author Contributions
Conceptualization, M.P. and S.P.; methodology, M.P. and S.P.; validation, M.P. and S.P.; formal analysis, M.P. and S.P.; investigation, M.P. and S.P.; data curation, M.P. and S.P.; writing—original draft preparation, M.P. and S.P.; writing—review and editing, M.P. and S.P.; supervision, M.P. All authors have read and agreed to the published version of the manuscript.
Funding
This research received no external funding.
Acknowledgments
Authors would like to thank the technicians of the hydraulics laboratory of the University of Pisa, Nicola Bruni, Antonio Cecchi, Alessandro Michelotti, and Vincenzo Pennabea for their help in building the experimental apparatus.
Conflicts of Interest
The authors declare no conflicts of interest.
Data availability
The data used herein are derived by [30].
References
- Schoklitsch, A. Kolkbildung unter Ueberfallstrahlen. Wasserwirtschaft 1932, 343. [Google Scholar]
- Whittaker, J.G.; Schleiss, A. Scour related to energy dissipaters for high head structures. Mitt. Vers.anst. Wasserbau 1984, 73. [Google Scholar]
- Mason, P.J.; Arumugam, K. Free jet scour below dams and flip buckets. J. Hydraul. Eng. 1985, 111, 220–235. [Google Scholar] [CrossRef]
- Bollaert, E.; Schleiss, A. Scour of rock due to the impact of plunging high velocity jets part I: A state-of-the-art review. J. Hydraul. Res. 2003, 41, 451–464. [Google Scholar] [CrossRef]
- Breusers, H.N.C.; Raudkivi, A.J. Scouring: Hydraulic Structures Design Manual Series; Balkema: Leiden, The Netherlands, 1991. [Google Scholar]
- Hoffmans, G.J.C.M.; Verheij, H.J. Scour Manual; Balkema: Leiden, The Netherlands, 1997. [Google Scholar]
- Pagliara, S.; Hager, W.H.; Minor, H.-E. Hydraulics of plane plunge pool scour. J. Hydraul. Eng. 2006, 132, 450–461. [Google Scholar] [CrossRef]
- Pagliara, S.; Amidei, M.; Hager, W.H. Hydraulics of 3D plunge pool scour. J. Hydraul. Eng. 2008, 134, 1275–1284. [Google Scholar] [CrossRef]
- Pagliara, S.; Hager, W.H.; Unger, J. Temporal evolution of plunge pool scour. J. Hydraul. Eng. 2008, 134, 1630. [Google Scholar] [CrossRef] [Green Version]
- Pagliara, S.; Palermo, M. Plane plunge pool scour with protection structures. J. Hydro-Environ. Res. 2008, 2, 182–191. [Google Scholar] [CrossRef]
- Pagliara, S.; Roy, D.; Palermo, M. 3D plunge pool scour with protection measures. J. Hydro-Environ. Res. 2010, 4, 225–233. [Google Scholar] [CrossRef]
- Bormann, N.E.; Julien, P.Y. Scour downstream of grade-control structures. J. Hydraul. Eng. 1991, 117. [Google Scholar] [CrossRef] [Green Version]
- Stein, O.R.; Julien, P.Y.; Alonso, C.V. Mechanics of jet scour downstream of a headcut. J. Hydraul. Res. 1993, 31, 723–738. [Google Scholar] [CrossRef]
- Stein, O.R.; Julien, P.Y. Criterion delineating the mode of headcut migration. J. Hydraul. Eng. 1993, 119, 37–50. [Google Scholar] [CrossRef] [Green Version]
- Stein, O.R.; Julien, P.Y. Sediment concentration below free overfall. J. Hydraul. Eng. 1994, 120, 1043–1059. [Google Scholar] [CrossRef] [Green Version]
- Hoffmans, G.J.C.M. Jet scour in equilibrium phase. J. Hydraul. Eng. 1998, 124, 430–437. [Google Scholar] [CrossRef]
- Hoffmans, G.J.C.M. Closure problem to jet scour. J. Hydraul. Res. 2009, 47, 100–109. [Google Scholar] [CrossRef]
- Bombardelli, F.A.; Gioia, G. Scouring of granular beds by jet-driven axisymmetric turbulent cauldrons. Phys. Fluids 2006, 18, 1–4. [Google Scholar] [CrossRef] [Green Version]
- Gioia, G.; Bombardelli, F.A. Localized turbulent flows on scouring granular beds. Phys. Rev. Lett. 2005, 95, 1–4. [Google Scholar] [CrossRef] [Green Version]
- Ali, S.Z.; Dey, S. Origin of the scaling laws of sediment transport. Proc. R. Soc. Lond. 2017, 473, 20160785. [Google Scholar] [CrossRef]
- Ali, S.Z.; Dey, S. Impact of phenomenological theory of turbulence on pragmatic approach to fluvial hydraulics. Phys. Fluids 2018, 30, 045105. [Google Scholar] [CrossRef]
- Dey, S.; Ali, S.Z.; Padhi, E. Bedload transport from analytical and turbulence phenomenological perspectives. Int. J. Sediment Res. 2019, 34, 509–530. [Google Scholar] [CrossRef]
- Bombardelli, F.A.; Palermo, M.; Pagliara, S. Temporal evolution of jet induced scour depth in cohesionless granular beds and the phenomenological theory of turbulence. Phys. Fluids 2018, 30, 1–19. [Google Scholar] [CrossRef]
- Hanson, G.; Robinson, K.; Cook, K. Scour below an overfall: Part II. Prediction. Trans. ASAE 2002, 45, 957–964. [Google Scholar] [CrossRef]
- Ghaneeizad, S.M.; Atkinson, J.F.; Bannet, S.J. Effect of flow confinement on the hydrodynamics of circular impinging jets: Implications for erosion assessment. Environ. Fluid Mech. 2015, 15, 1–25. [Google Scholar] [CrossRef]
- Karamigolbaghi, M.; Ghaneeizad, S.M.; Atkinson, J.F.; Bannet, S.J.; Wells, R.R. Critical assessment of jet erosion test methodologies for cohesive soil and sediment. Geomorphology 2017, 295, 529–536. [Google Scholar] [CrossRef]
- Poreh, M.; Tsuei, Y.G.; Cermak, J.E. Investigation of a turbulent radial wall jet. J. Appl. Mech. 1967, 34, 457–463. [Google Scholar] [CrossRef]
- Beltaos, S.; Rajaratnam, N. Impinging circular turbulent jets. ASCE J. Hydraul. Div. 1974, 100, 1313–1328. [Google Scholar]
- Phares, D.J.; Smedley, G.T.; Flagan, R.C. The wall shear stress produced by the normal impingement of a jet on a flat surface. J. Fluid Mech. 2000, 418, 351–375. [Google Scholar] [CrossRef] [Green Version]
- Palermo, M.; Bombardelli, F.A.; Pagliara, S. Theoretical approach for shear-stress estimation at 2D equilibrium scour holes in granular material due to subvertical plunging jets. J. Hydraul. Eng. 2020, 146, 1–12. [Google Scholar] [CrossRef]
- Pu, J.P.; Tait, S.; Guo, Y.; Huang, Y.; Hanmaiahgari, P.R. Dominant features in three-dimensional turbulence structure: Comparison of non-uniform accelerating and decelerating flows. Environ. Fluid Mech. 2018, 18, 395–416. [Google Scholar] [CrossRef] [Green Version]
- Pu, J.H.; Wei, J.; Huang, Y. Velocity distribution and 3D turbulence characteristic analysis for flow over water-worked rough bed. Water 2017, 9, 1–13. [Google Scholar] [CrossRef] [Green Version]
- Bollaert, E.; Schleiss, A. Scour of rock due to the impact of plunging high velocity jets Part II: Experimental results of dynamic pressures at pool bottoms and in one- and two-dimensional closed end rock joints. J. Hydraul. Res. 2003, 41, 465–480. [Google Scholar] [CrossRef]
- Manso, P.A.; Bollaert, E.; Schleiss, A. Influence of plunge pool geometry on high-velocity jet impact pressures and pressure propagation inside fissured rock media. J. Hydraul. Eng. 2009, 135, 783–792. [Google Scholar] [CrossRef]
- Annandale, G.W. Erodibility. J.Hydraul. Res. 1995, 33, 471–494. [Google Scholar] [CrossRef]
- Castillo, L.G.; Carrillo, J.M.; Blázquez, A. Plunge pool dynamic pressures: A temporal analysis in the nappe flow case. J. Hydraul. Res. 2015, 53, 101–118. [Google Scholar] [CrossRef]
- Castillo, L.G.; Carrillo, J.M. Scour, velocities and pressures evaluations produced by spillway and outlets of dam. Water 2016, 8, 1–21. [Google Scholar] [CrossRef] [Green Version]
- Castillo, L.G.; Carrillo, J.M. Comparison of methods to estimate the scour downstream of a ski jump. Int. J. Multiph. Flow 2017, 92, 171–180. [Google Scholar] [CrossRef]
- Albertson, M.L.; Day, Y.B.; Johnson, R.A.; Rouse, H. Diffusion of submerged jets. Transaction ASCE 1950, 115, 639–697. [Google Scholar]
- Beltaos, S.; Rajaratnam, N. Plane turbulent impinging jets. J. Hydraul. Res. 1976, 11, 29–59. [Google Scholar] [CrossRef]
- Rajaratnam, N. Turbulent Jets; Elsevier Science: Amsterdam, The Netherlands, 1976. [Google Scholar]
- Beltaos, S. Oblique impingement of circular turbulent jets. J. Hydraul. Res. 1976, 14, 17–36. [Google Scholar] [CrossRef]
- Ervine, D.A.; Falvey, H.T. Behavior of Turbulent Water Jets in the Atmosphere and in Plunge Pools. Proc. Inst. Civ. Eng. 1987, 83, 295–314. [Google Scholar]
- Ervine, D.A.; Falvey, H.T.; Whiters, W. Pressure fluctuations on plunge pool floors. J. Hydraul. Res. 1997, 35, 257–279. [Google Scholar] [CrossRef]
- Hanson, G.; Hunt, S.L. Lessons learned using laboratory JET method to measure soil erodibility of compacted soils. Appl. Eng. Agric. 2007, 23, 305–312. [Google Scholar] [CrossRef]
- Hanson, G.; Cook, K. Apparatus, test procedures, and analytical methods to measure soil erodibility in situ. Appl. Eng. Agric. 2004, 20, 455–462. [Google Scholar]
- Beltaos, S.; Rajaratnam, N. Impingement of axisymmetric developing jets. J. Hydraul. Res. 1977, 15, 311–326. [Google Scholar] [CrossRef]
Figure 1.
Pictures of an experimental test: (a) side view and (b) top view.

Figure 2.
Diagram sketch of the experimental apparatus with the indication of the main hydraulic and geometric parameters, including location of piezometers and pressure transducer.
Figure 2.
Diagram sketch of the experimental apparatus with the indication of the main hydraulic and geometric parameters, including location of piezometers and pressure transducer.

Figure 3.
Diagram sketch indicating (a) the selected CV, the main geometric characteristics of the scour hole and the scheme of the forces acting on the CV; (b) the polygon of forces acting on the CV along with the components Th and Tv of the vector T and the force Fi,i+1 acting on the scour hole profile segment i−i+1.

Figure 4.
Comparison between τm calculated using Equations (26) and (28) and τav derived by [30].
Figure 4.
Comparison between τm calculated using Equations (26) and (28) and τav derived by [30].

Figure 5.
(a) Longitudinal distribution of shear stress τr according to [25] along with the estimation of the corresponding τav for test 11 of [30]; (b) evaluation of the coefficient Cs of Equation (28).

Figure 6.
Comparison between values of the variable τB calculated using Equation (30) and estimated values of maximum shear stress τm.
Figure 6.
Comparison between values of the variable τB calculated using Equation (30) and estimated values of maximum shear stress τm.


Table 1.
Range of variability of the main parameters for experimental tests conducted by [30].
Table 1.
Range of variability of the main parameters for experimental tests conducted by [30].
| Test | τav (N/m2) | Δ (m) | D (m) | Q (m3/s) | α (°) |
|---|---|---|---|---|---|
| 1–6 | 99–237 | 0.090–0.155 | 0.020–0.150 | 0.00115–0.00165 | 60 |
| 7–12 | 64–180 | 0.010–0.180 | 0.020–0.150 | 0.00115–0.00165 | 45 |
Table 2.
Comparison between Tv and T values relative to experimental tests conducted by [30].
Table 2.
Comparison between Tv and T values relative to experimental tests conducted by [30].
| Test | Tv (N) | T (N) |
|---|---|---|
| 1 | 56.4 | 56.7 |
| 2 | 21.5 | 21.5 |
| 3 | 16.8 | 16.8 |
| 4 | 26.1 | 26.1 |
| 5 | 16.6 | 16.8 |
| 6 | 17.2 | 17.5 |
| 7 | 28.5 | 28.5 |
| 8 | 17.1 | 17.3 |
| 9 | 12.3 | 12.8 |
| 10 | 65.7 | 66.1 |
| 11 | 32.9 | 33.1 |
| 12 | 12.2 | 15.7 |
© 2020 by the authors. Licensee MDPI, Basel, Switzerland. This article is an open access article distributed under the terms and conditions of the Creative Commons Attribution (CC BY) license (http://creativecommons.org/licenses/by/4.0/).
Share and Cite
MDPI and ACS Style
Pagliara, S.; Palermo, M. Effect of Pressure Fluctuations and Flow Confinement on Shear Stress in Jet-Driven Scour Processes. Water 2020, 12, 718. https://doi.org/10.3390/w12030718
AMA Style
Pagliara S, Palermo M. Effect of Pressure Fluctuations and Flow Confinement on Shear Stress in Jet-Driven Scour Processes. Water. 2020; 12(3):718. https://doi.org/10.3390/w12030718
Chicago/Turabian StylePagliara, Simone, and Michele Palermo. 2020. "Effect of Pressure Fluctuations and Flow Confinement on Shear Stress in Jet-Driven Scour Processes" Water 12, no. 3: 718. https://doi.org/10.3390/w12030718
Note that from the first issue of 2016, this journal uses article numbers instead of page numbers. See further details here.