An Observational Process Ontology-Based Modeling Approach for Water Quality Monitoring


1
School of Geo-Science and Technology, Zhengzhou University, Zhengzhou 450052, China
2
State Key Laboratory of Information Engineering in Surveying, Mapping and Remote Sensing, Wuhan University, Wuhan 430079, China
*
Author to whom correspondence should be addressed.
Water 2020, 12(3), 715; https://doi.org/10.3390/w12030715
Submission received: 31 January 2020
/
Revised: 28 February 2020
/
Accepted: 2 March 2020
/
Published: 5 March 2020
(This article belongs to the Special Issue Monitoring, Modelling and Management of Water Quality)
Abstract
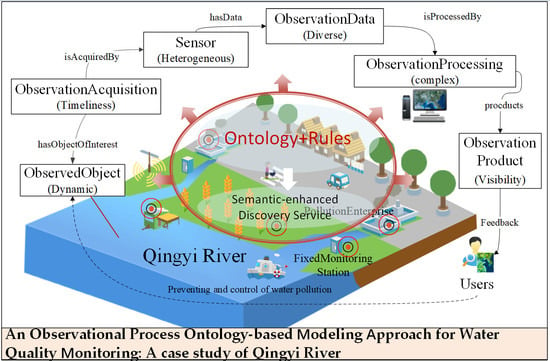
:The increasing deterioration of aquatic environments has attracted more attention to water quality monitoring techniques, with most researchers focusing on the acquisition and assessment of water quality data, but seldom on the discovery and tracing of pollution sources. In this study, a semantic-enhanced modeling method for ontology modeling and rules building is proposed, which can be used for river water quality monitoring and relevant data observation processing. The observational process ontology (OPO) method can describe the semantic properties of water resources and observation data. In addition, it can provide the semantic relevance among the different concepts involved in the observational process of water quality monitoring. A pollution alert can be achieved using the reasoning rules for the water quality monitoring stations. In this study, a case is made for the usability testing of the OPO models and reasoning rules by utilizing a water quality monitoring system. The system contributes to the water quality observational monitoring process and traces the source of pollutants using sensors, observation data, process models, and observation products that users can access in a timely manner.
1. Introduction
Water quality monitoring using in-situ environmental sensors presents many challenges for data discovery, particularly for the warning and querying of water pollution. The growth in freshwater demand has forced water managers and decision makers to contemplate comprehensive strategies for water quality monitoring [1]. Different large sensory data collection methods have the problems of too much data but not enough useful information, a lack of integration of different database sources, and poor interoperability between these resources [2].
Moreover, monitoring practices are further complicated due to the increasing variety of sensors and multiple user needs. It is therefore important to consider approaches for using ontology in combination with rules to enhance the discovery of pollution events using water quality monitoring [3]. Semantic technology has already been identified as a challenging research topic for various disciplinary and domain applications [4]. Sheth and Sahoo proposed the semantic sensor web (SSW) [5]. Related sensor ontology models describe sensors and their observations, the studied features of interest, the observed properties, as well as actuators [6,7].
Semantic techniques could enhance the quantity and quality of information available for water quality management [8,9,10]. The use of semantics in sensor networks enables the discovery and analysis of sensor data based on spatial, temporal, and thematic information [11]. To enable the encoding of semantics using the observation data in the Sensor Web, well-known technologies, such as web ontology language (OWL) [12] and semantic web rule language (SWRL) [13], have been used. The OWL is an ontological language for the semantic web with formally defined meanings that provide the description of classes, properties, individuals, and data values, and these are stored as Semantic Web documents. SWRL includes a high-level abstract syntax for rules in both the OWL DL and OWL Lite sublanguages of OWL.
These tools provide two promising areas for water quality monitoring research: (a) the semantic modeling of water observation data and (b) how to use the semantic information of observation data in a water quality monitoring system.
- (a)
- With regard to the first research area, the ontology models can be used for the description of water environmental resources. A hydrological sensor web ontology based on the Semantic Sensor Network (SSN) ontology has been proposed to describe the heterogeneous hydrological sensor web resources [14]. An ontology model has been specially designed for river water quality monitoring [15]. The related ontology primarily focuses on sensor devices and observation data for water management, but it lacks a description of the observational process and models. It has been increasingly applied to observational resources from various sensors to provide data management and query capabilities [10].
- (b)
- The second research area, smart water quality monitoring, which is regarded as the future of water quality monitoring technology, promotes progress in data collection capabilities, communication, data analysis, and early warning strategies [16]. Ontology and rules have been applied to manage water sources. For example, lake water quality monitoring is based on an integration of a semantic framework [17]. Mihaela et al. [18] a knowledge modeling framework for intelligent environmental decision support systems integrated an ontological approach and data analysis approach. This was then applied for the generation of a knowledge base for decision making.
In summary, there has been a growing awareness that ontology and rules should be utilized. However, there exist two limitations in the related work: (1) Only using the observation data values from one type of monitoring station could easily cause an initial warning misjudgment. (2) The results of the query focus on observation data, and lacks a complete display of observational process. For example, only the data value of the water quality at the location where the accident occurred is shown on the map. This method cannot trace the data and models associated with water pollution.
Successful water quality monitoring requires an understanding of the observational processes of sensors, as well as understanding of the pollution warning process. In this study, the objective is to is to achieve a semantic modeling of the observational process in Sensor Web by integrating water quality monitoring and alerts. To achieve this goal, an observational process ontology modeling method is described, which consists of observation acquisition, observation data, observation processing, and observation products. In addition, some rules are defined that can be used in combination for tracing the entire process of pollution events.
This study is organized as follows: In Section 2, a brief overview of study area is presented. In Section 3, an ontology of the water quality observational process and the reasoning rules for the discovery of water quality are described. The discovery service performed and discussions are described in Section 4. Finally, Section 5 outlines the conclusions and directions for future work.
2. Study Area
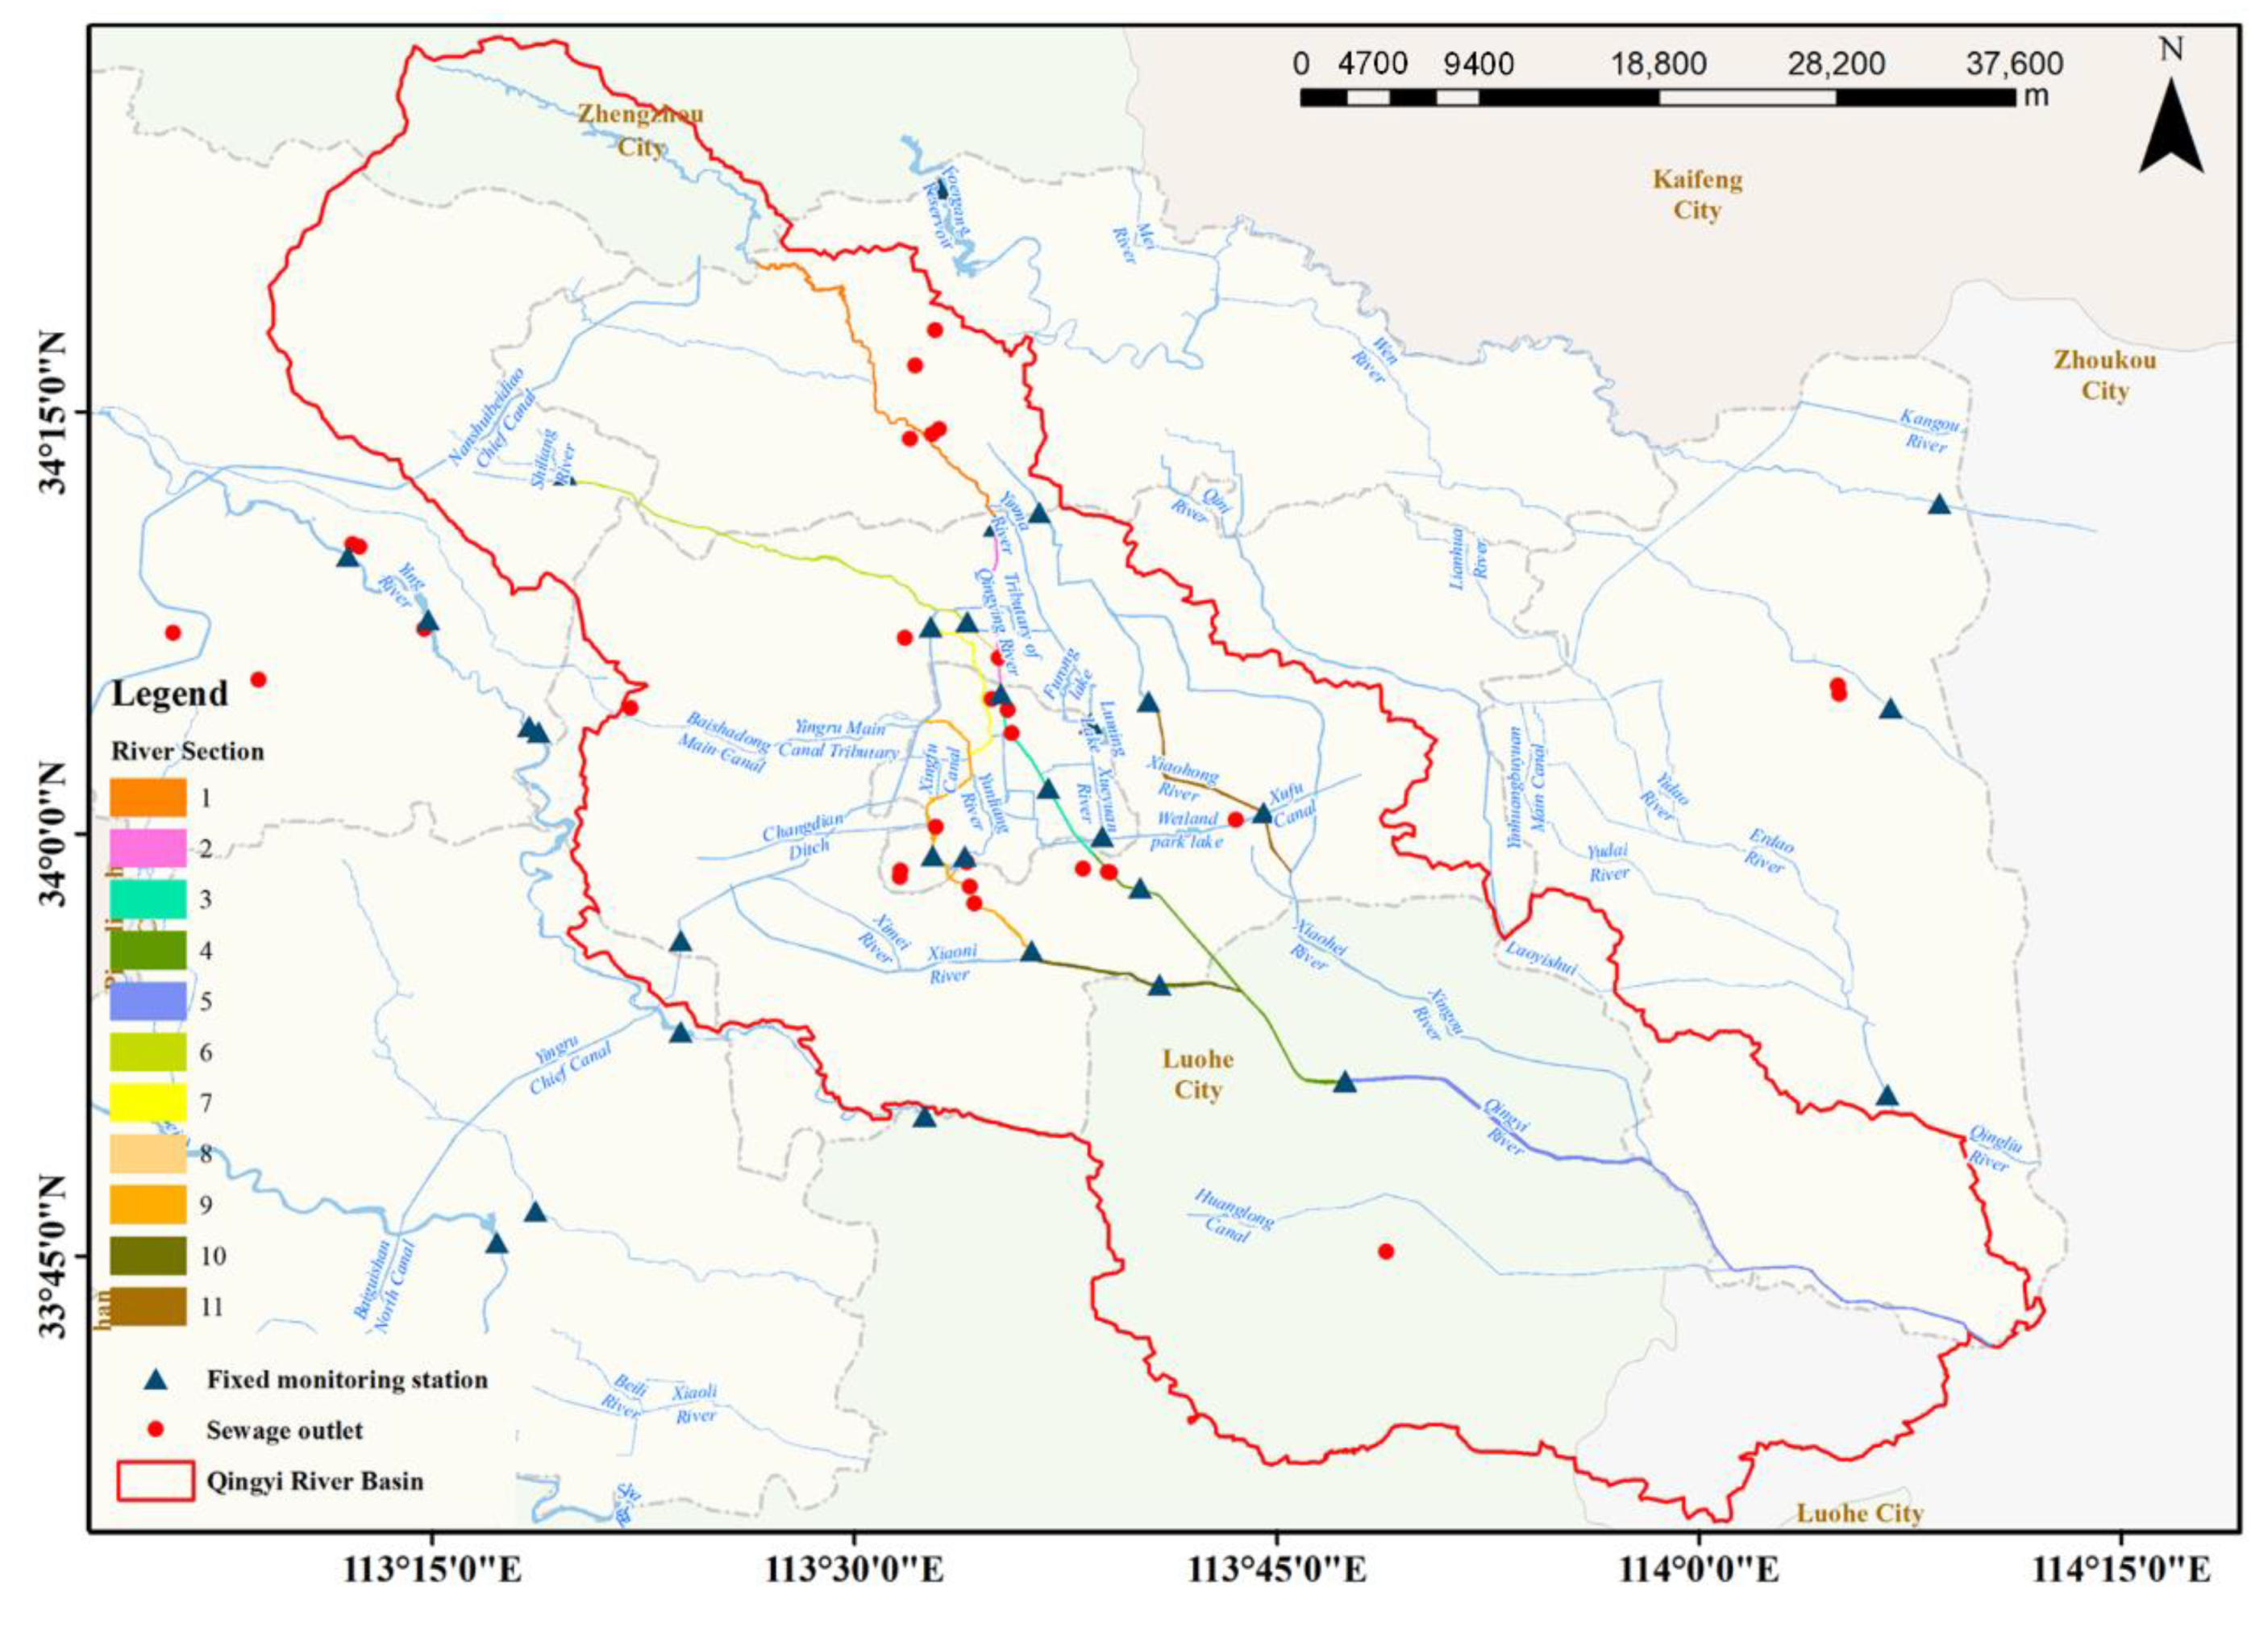
Qingyi River passes through the city center of Xuchang and has a drainage area of 2362 km2 in the Henan Province of China. The total length of the Qingyi River is 149 km, and it empties into the Ying River. The river basin has a warm temperate humid monsoon climate, four distinct seasons, rich heat energy, concentrated rainfall, and abundant sunshine.
The Qing Yi River is an important water body for flood control and pollution prevention for the region and the landscape of Xuchang City. Hence, the water quality is of great significance for the people and to provide healthy urban development. The primary pollution source of the Qingyi Basin pollutant emissions originates from the leather, wig products, and paper industries in the area. Xuchang is China’s largest hair products distribution center and export production base. The export value of hair products accounts for 49% of China’s exports of similar goods. Xuchang City’s COD and NH3 emissions from wig products, papermaking, and leather industries accounted for more than 80% of the total industrial COD emissions in the basin, respectively [19]. Therefore, it is important to improve water quality monitoring (especially COD and NH3N monitoring) to reduce industrial effluent pollution.
This study utilized two types of monitoring stations: 16 fixed monitoring stations (the red points in Figure 1) and 21 monitoring stations near the polluting enterprises (the blue points in Figure 1). Various sensors were deployed on these monitoring stations, and the observations made by these sensors were utilized as data. The observational parameters that were acquired by these sensors included the chemical oxygen demand (COD), NH3-N, and other water quality factors of the Qingyi River Basin (see Section 3.1.3 for details). Data from the Qingyi River were collected from 1 June 2017 to 31 December 2019. The data were acquired using in-situ sensors located in the Qingyi River. The data of NH3N, COD, P, N, PH, DO, and turbidity come from sensors produced by the Beijing SDL Technology Co., Ltd. (Beijing, China). The manufacturers of sensors for TOC and BOD5 are the Beijing Security Control Technology Co., Ltd. (Beijing, China) and the Shanghai Kelan Instrument Technology Co., Ltd., (Shanghai, China) respectively.
3. Ontology and Rules
The procedure used for the ontology modeling demonstrated how to describe the observational process of observations for water quality monitoring (see Section 3.1). Based on the proposed ontology, the rules enable the development of a water quality early warning solution that could be adapted to different river sections (see Section 3.2).
3.1. The Proposed Observational Process Ontology
The construction of the ontology follows seven steps: (1) Determine the domain and scope of the ontology; (2) consider reusing existing ontologies; (3) enumerate important terms in the ontology (core classes); (4) define the classes and the class hierarchy; (5) define the properties of classes—slots; (6) define the facets of the slots; and (7) create instances (take COD and NH3N as examples). For steps 1, 2, and 3, see Section 3.1.1. For steps 4–6, see Section 3.1.2. For the last step, see Section 3.1.3.
3.1.1. The Core Classes
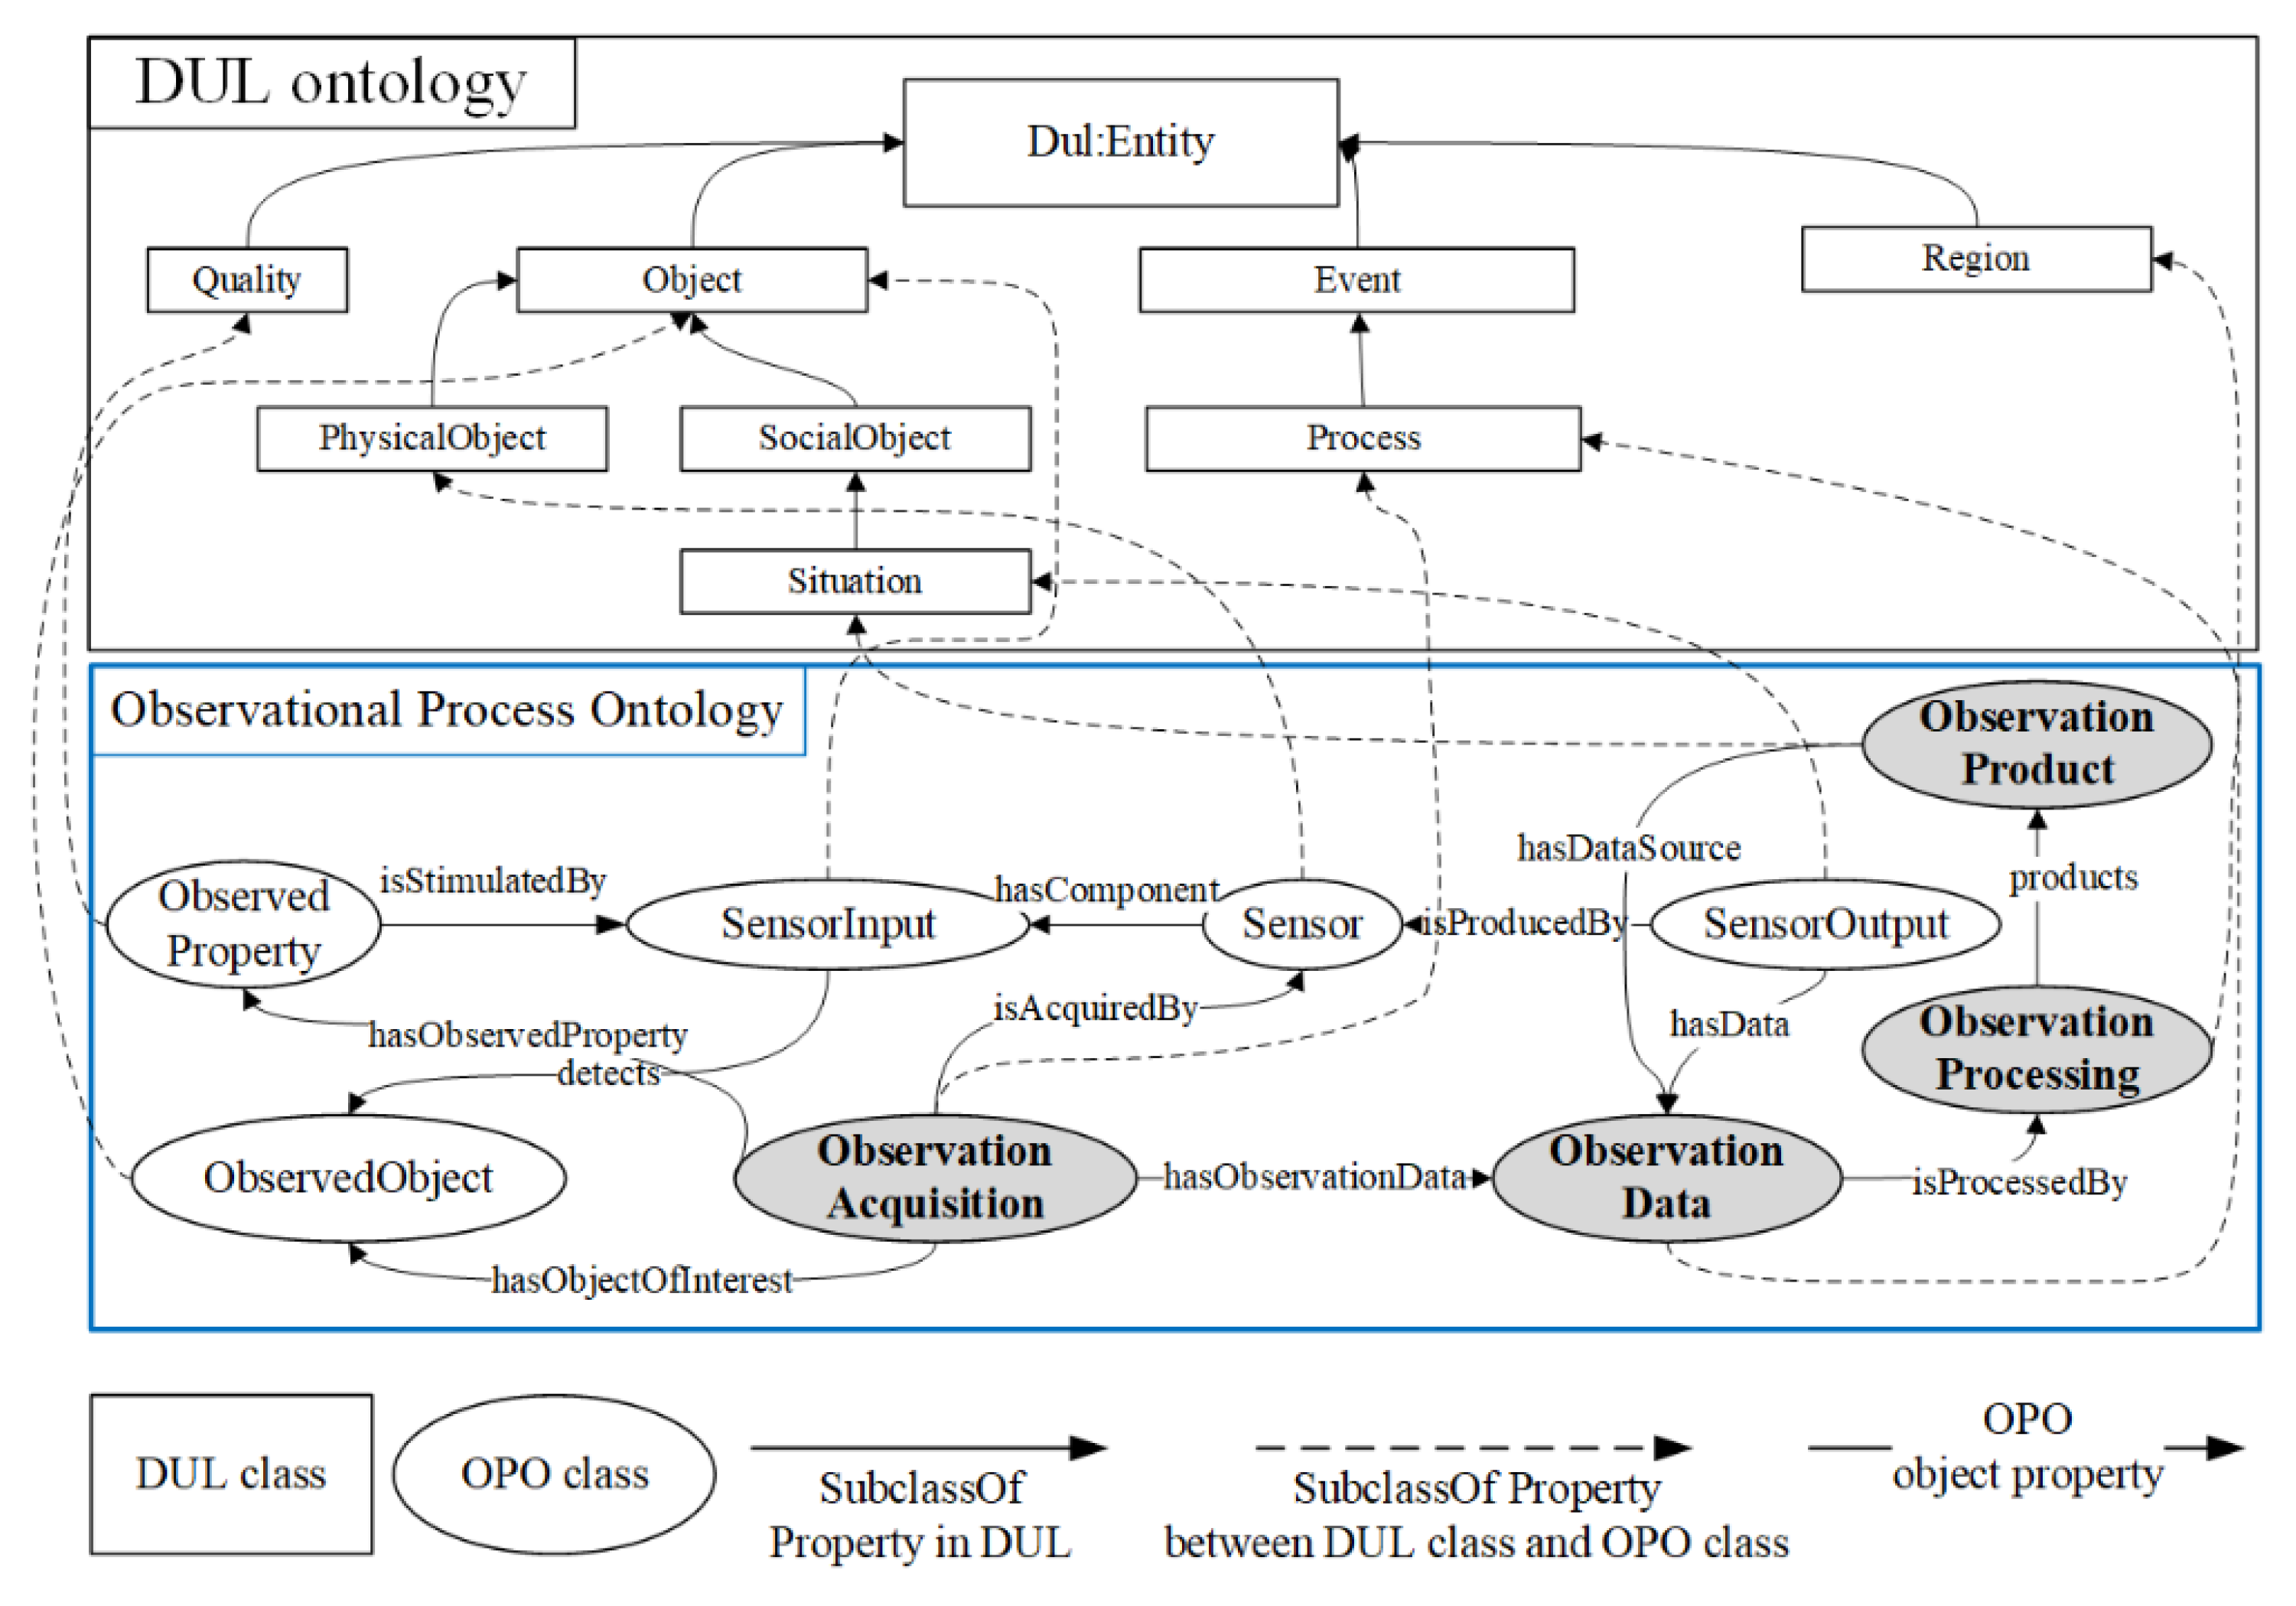
The ontology revolves around the central pattern of the observational process. Several conceptual modules have been built on patterns that contain observational process concepts. The ontology modelling method refers to the Descriptive Ontology for Linguistic and Cognitive Engineering (DOLCE) Ultra-Light foundational ontology to assist users in understanding the proposed ontology. The DOLCE Ultra-Light (DUL) ontology is the most utilized ontology in the engineering cognitive domain and in linguistics, which defines 29 classes and 43 properties, including the Object, Region, Quality, and InformationEntity [20].
The observational process ontology (OPO) of water quality based on the DOLCE has the following features: (1) The general top-level definition concepts of DOLCE can be used to ensure interoperability with other resources. (2) It can implement the reuse of the existing ontology. For example, the concepts in the existing ontology can be mapped to the top-level ontology, which can then realize the integration of the domain ontology. (3) The shared terminology and definitions of the DOLECE enable the interoperability of the OPO.
Therefore, the developed ontology uses similar design patterns to those of the DUL ontology; and hence focuses on the quality (DUL:Qaulity) and the object (DUL:Object) of the entity, as well as the region (DUL:region) of the entity and, in particular, their resulting event (DUL:Event). Figure 2 shows the DUL core classes, relations, and the ontological modules.
The majority of the ontology is hence an extension of these classes with subclasses and additional properties, although concepts related to water quality features were also added. The OPO of the water quality modeled the concepts, relationships, properties, datatypes, and restrictions of the water quality of a river using OWL constructs.
This approach was grounded in a view of the observational process consisting of four main observational phases: observation acquisition, observation data (acquired directly by sensors), observation processing (used to describe the model), and the processed observation products. The ontology therefore captured the domain knowledge from these four core classes and across each of these four perspectives.
3.1.2. The Core Modules
The view of the ontology presented in Figure 3 describes the following:
Ontology classes from the ‘Observation Acquisition’ perspective
Water quality changes during different periods. Therefore, there are two important classes (opo:AcquisitionStartTime and opo:AcquisitionEndTime) of the observation acquisition for water quality monitoring. The opo:ResponseTime class expresses the time between a change in the value of an observed property and when the sensor ‘settles’ on an observed value.
Additionally, the following are the seven classes that describe the measurement capability of the observation acquisition.
- The opo:Position class is used to describe the corresponding river section from where the observation data were obtained.
- The closeness of agreement between the result of an observation and the true value of the observed property under the defined conditions is described using the opo:Accuracy class.
- The opo:Precision class represents a measure of a sensor’s ability to consistently reproduce an observation of an unchanged or similar quality value.
- The opo:Frequency class denotes the smallest possible time between one observation or sampling and the next.
- The opo:MeasurementRange class is used to describe the set of values that the sensor can return as the result of an observation using the defined sensor device properties.
- The opo:AcquisitionType class is used to distinguish the equipped platform, for example, in-situ, UAV, satellite.
- The opo:AcquisitionSubtype class describes the means of acquisition, for example, electromagnetic, ultrasonic, laser, visual, pressure, and other methods.
Ontology classes from the ‘observation data’ perspective
Large amounts of data are collected by the sensing device and are processed and transmitted. The temporal characteristics of the observation data are described using two classes:
- The opo:SamplingTime class records when the observation data was retrieved from the observed property.
- The opo:CatelogueCreationDate class is used to describe the creation date for the metadata item. The creationdate is the date when the metadata item was inserted for the first time in the catalogue.
The key features of observation data are the observation parameter and the ID, which are described using four classes:
- The opo:ObservationParameter class can describe a single phenomenon, a constrained phenomenon, or composite phenomenon, such as height, radiance bands, or several discrete phenomena.
- The opo:ParameterUnitOfMeasure class denotes units of measurements for the observed phenomenon.
- The opo:ParentIdentifier class represents the collection identifier of observed data.
- The opo:MetadataIdentifier class records the identifier for metadata item.
Ontology classes from the ‘observation processing’ perspective
There are eight classes related to observation processing. Each class is defined as follows.
- The opo:ProcessingDate class is used to describe the date time of processing.
- The processor software name and version are represented using the opo:ProcessingName and opo:ProcessingVersion class separately.
- The opo:DataProcessMethod class represents the method used to compute the datalayer.
- The opo:DataProcessMethodVersion class describes the version of the method.
- The processing center code is expressed using the opo:ProcessingCenter class.
- The opo:ProcessingLevel class denotes the processing level applied to the product.
- The opo:ProcessingMode class records the processing mode taken from the mission specific code list.
Ontology classes from the ‘observation product’ perspective
The ‘observation product’ perspective includes five aspects.
- The opo:ProductDoi class is used to describe the digital object identifier of the product.
- The opo:ProductFileName class represents the reference to the file.
- The version of the product is described using the opo:ProductVersion class.
- The opo:ProductSize class denotes the product size (bytes), allowing the user to realize how long a download is likely to take.
- The opo:ProductSatus class refers to the product status, for example, archived, acquired, cancelled, failed, planned, potential, or rejected.
Properties of the OPO
The properties include object properties and data properties. The data properties include the ‘opo:hasDataValue’ property (which expresses the result of an observation or actuation); the ‘opo:hasSectionValue’ property (which expresses the section number of the river); and the ‘opo:hasProductValue’ property (which expresses the value through the observation products). The object properties in the OPO link classes/individuals to class/individuals. The object properties can be divided into six categories:
- The subclass property: The relationships between the classes of the upper level ontology and OPO classes can be described by the opo:subClass property. The Subtype class is subclass of type class, for example, the ‘AcquisitionSubtype’ class is subclass of ‘AcquisitionType’ class.
- The identifier properties: The identifier properties include two types; one of which is the ’hasDataID’, ’hasMetadataID’, and ‘hasProductID’ properties; the other is the ‘hasProcessingName’ and ‘hasProductName’ properties.
- The time properties: The related properties refer to the ‘hasStartTime’, ‘hasEndTime’, and ‘hasSamplingTime’ properties.
- The position properties: The ‘hasPosition’ property represents the position of the observation acquisition.
- The classification property: the ‘isClassifiedBy’ property that describes the type of observation acquisition.
- The domain-specific properties: Other properties are related to specific attributes during the observational process; for example, the ‘hasAccuracy’, ‘hasPrecision’, ‘hasFrequency’, ‘hasProcessinglevel’, and ‘hasProcessMethod’ properties.
3.1.3. Ontological Implementation
The OPO based on the ontological structure described in Section 3.1.1 and Section 3.1.2 was created using Protégé [21]. The individuals of the ‘opo:ObservedParameter’ class in the ontology correspond to water quality indicators. The water quality indicators, include conductivity, chlorophyll content, dissolved oxygen, dissolved organic matter, pH, permanganate index, turbidity, total nitrogen, and water temperature [22]. There are nine types of indicator (NH3N, COD, TOC, BOD5, P, N, DO, PH, and turbidity) obtained by the fixed monitoring stations and six types of water indicators (NH3N, COD, TOC, BOD5, P, and N) acquired by the monitoring stations of polluting enterprises. These factors can be defined in the ontology individuals and applied to the formulation of subsequent rules.
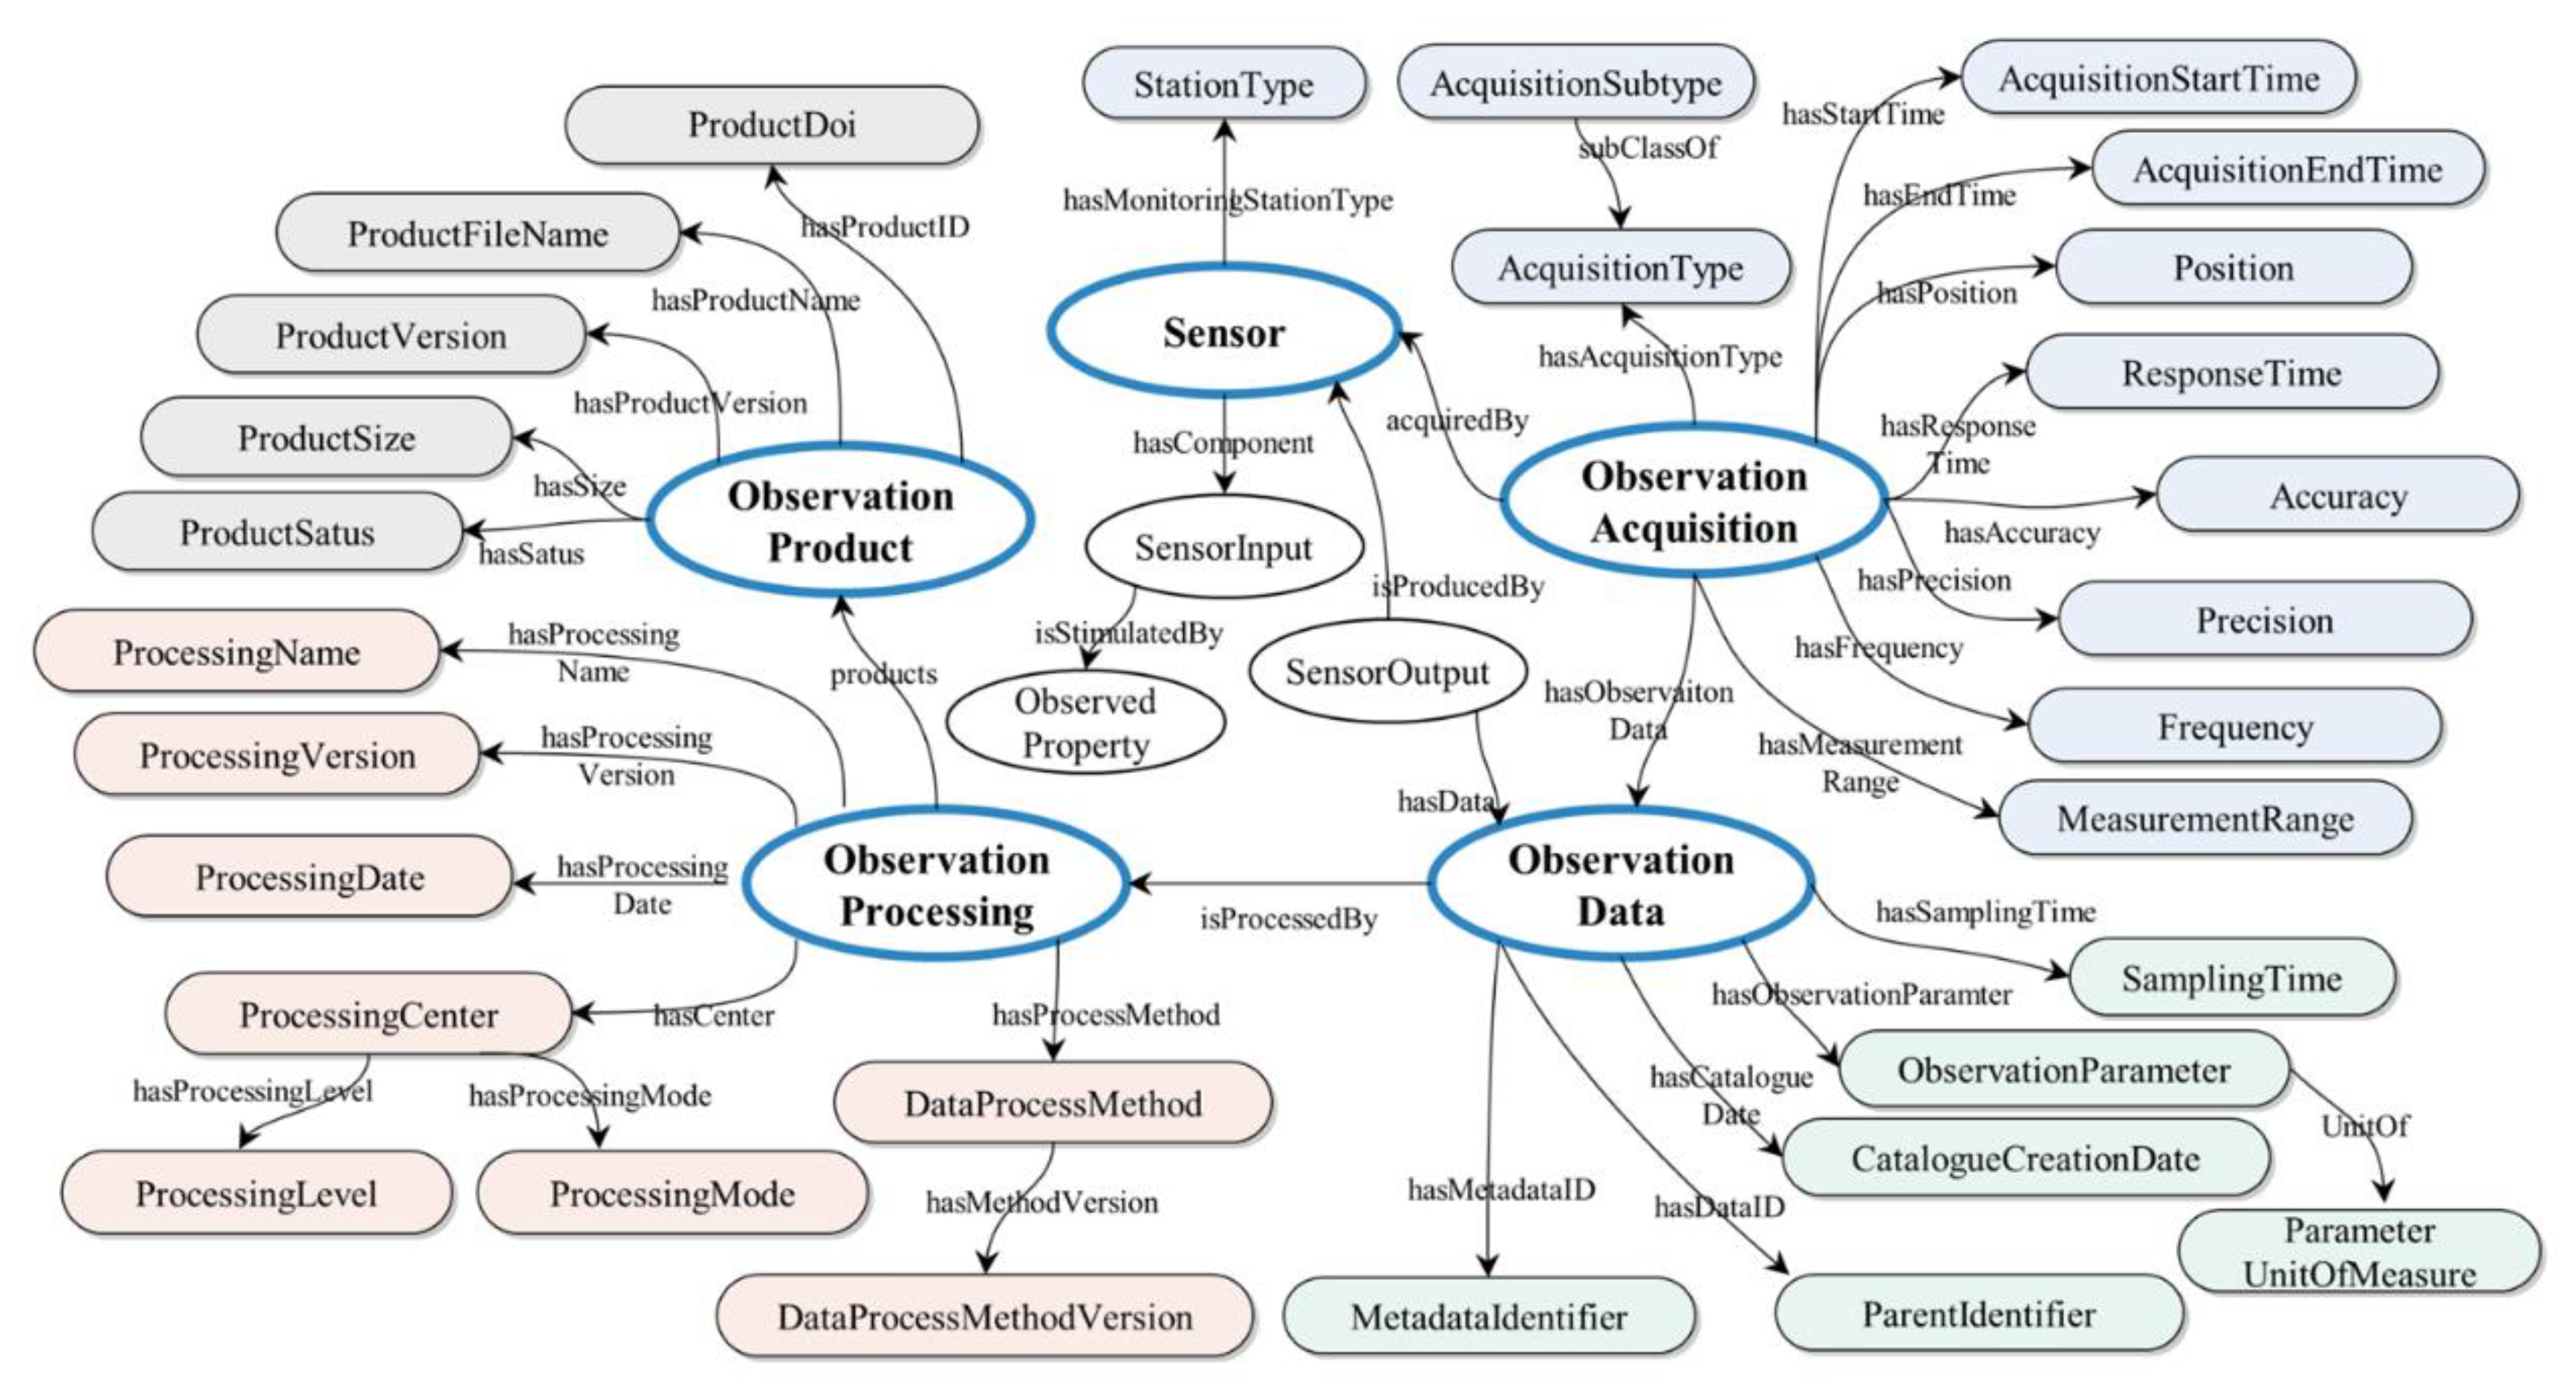
The time series of COD and NH3N in the Qingying River Basin are more complete than other indicators; hence, these two indicators were used as examples to set the ontology individuals and to describe the rule examples. The primary water quality monitoring-related individuals contain the ‘COD’ and ‘NH3N’ individuals of the ‘opo:ObservedParameter’ class; the ‘FixedMonitoring’, and the ‘PollutionEnterprise’ individuals of the ‘opo:StationType’ class; the ‘CODprocessmethod’, and the ‘NH3Nprocessmethod’ individuals of the ‘opo:DataProcessMethod’ class. The properties are the most important elements and build the connection between the heterogeneous observational resources. The primary classes and properties in the proposed ontology are shown in Figure 4.
3.2. Reasoning Rules
A water quality query is a complex task that requires intelligent inference based on specific rules. Owing to this requirement, with ontology used in memory, additional rules have been developed to extend the information inferred by the semantic framework.
SWRL can be used to write rules to reason about OWL individuals and to infer new knowledge about those individuals. Rules are in the form of an implication between an antecedent (body) and a consequent (head), that is, antecedent → consequent. The intended meaning of a rule is: if the antecedent holds (i.e., ”true”), then the consequent must also hold. Both the antecedent and consequent of a rule are conjunctions of atoms. The syntax in SWRL can be used to express the judgment of water quality monitoring. The antecedent of the rule described by SWRL includes the statement of classes and properties, as well as judgment of the conditions, while the consequent represents inferred properties. The classes, object properties, and data properties of rules come from the observational process ontology. The judgment of rule is described in built-ins for comparisons (e.g., swrlb:equal, swrlb:greaterThan) and strings.
According to the types of monitoring stations, this study defines the rules for fixed monitoring stations (the blue points in Figure 1) and sewage outlets of the polluting enterprises (the red points in Figure 1) based on SWRL, which are implemented in SWRLTab of protege. The design of the rules considers the following two points: (1) Different types of monitoring stations cannot be defined uniformly, so the rules are described in Section 3.2.1 and Section 3.2.2 separately. (2) The rules of fixed monitoring stations are suitable for judging a certain parameter value at a fixed monitoring position. The rules of enterprise sewage outlets could be used to determine the values after the pollution has spread.
For the Qingyi River, the upper limit of the water quality factors was determined by the Chinese GB3838 regulation, socio-economic, industrial and mining enterprises, population distribution, agricultural production, pollution capacity, and water quality status along the river. In this section, the river basin was divided into 11 river sections, which are shown in Figure 1. By using COD and NH3N as examples, the upper limit values for each river section are shown in Table 1, which were used as the alert maximum values in the rules.
3.2.1. The Rules for Fixed Monitoring Stations
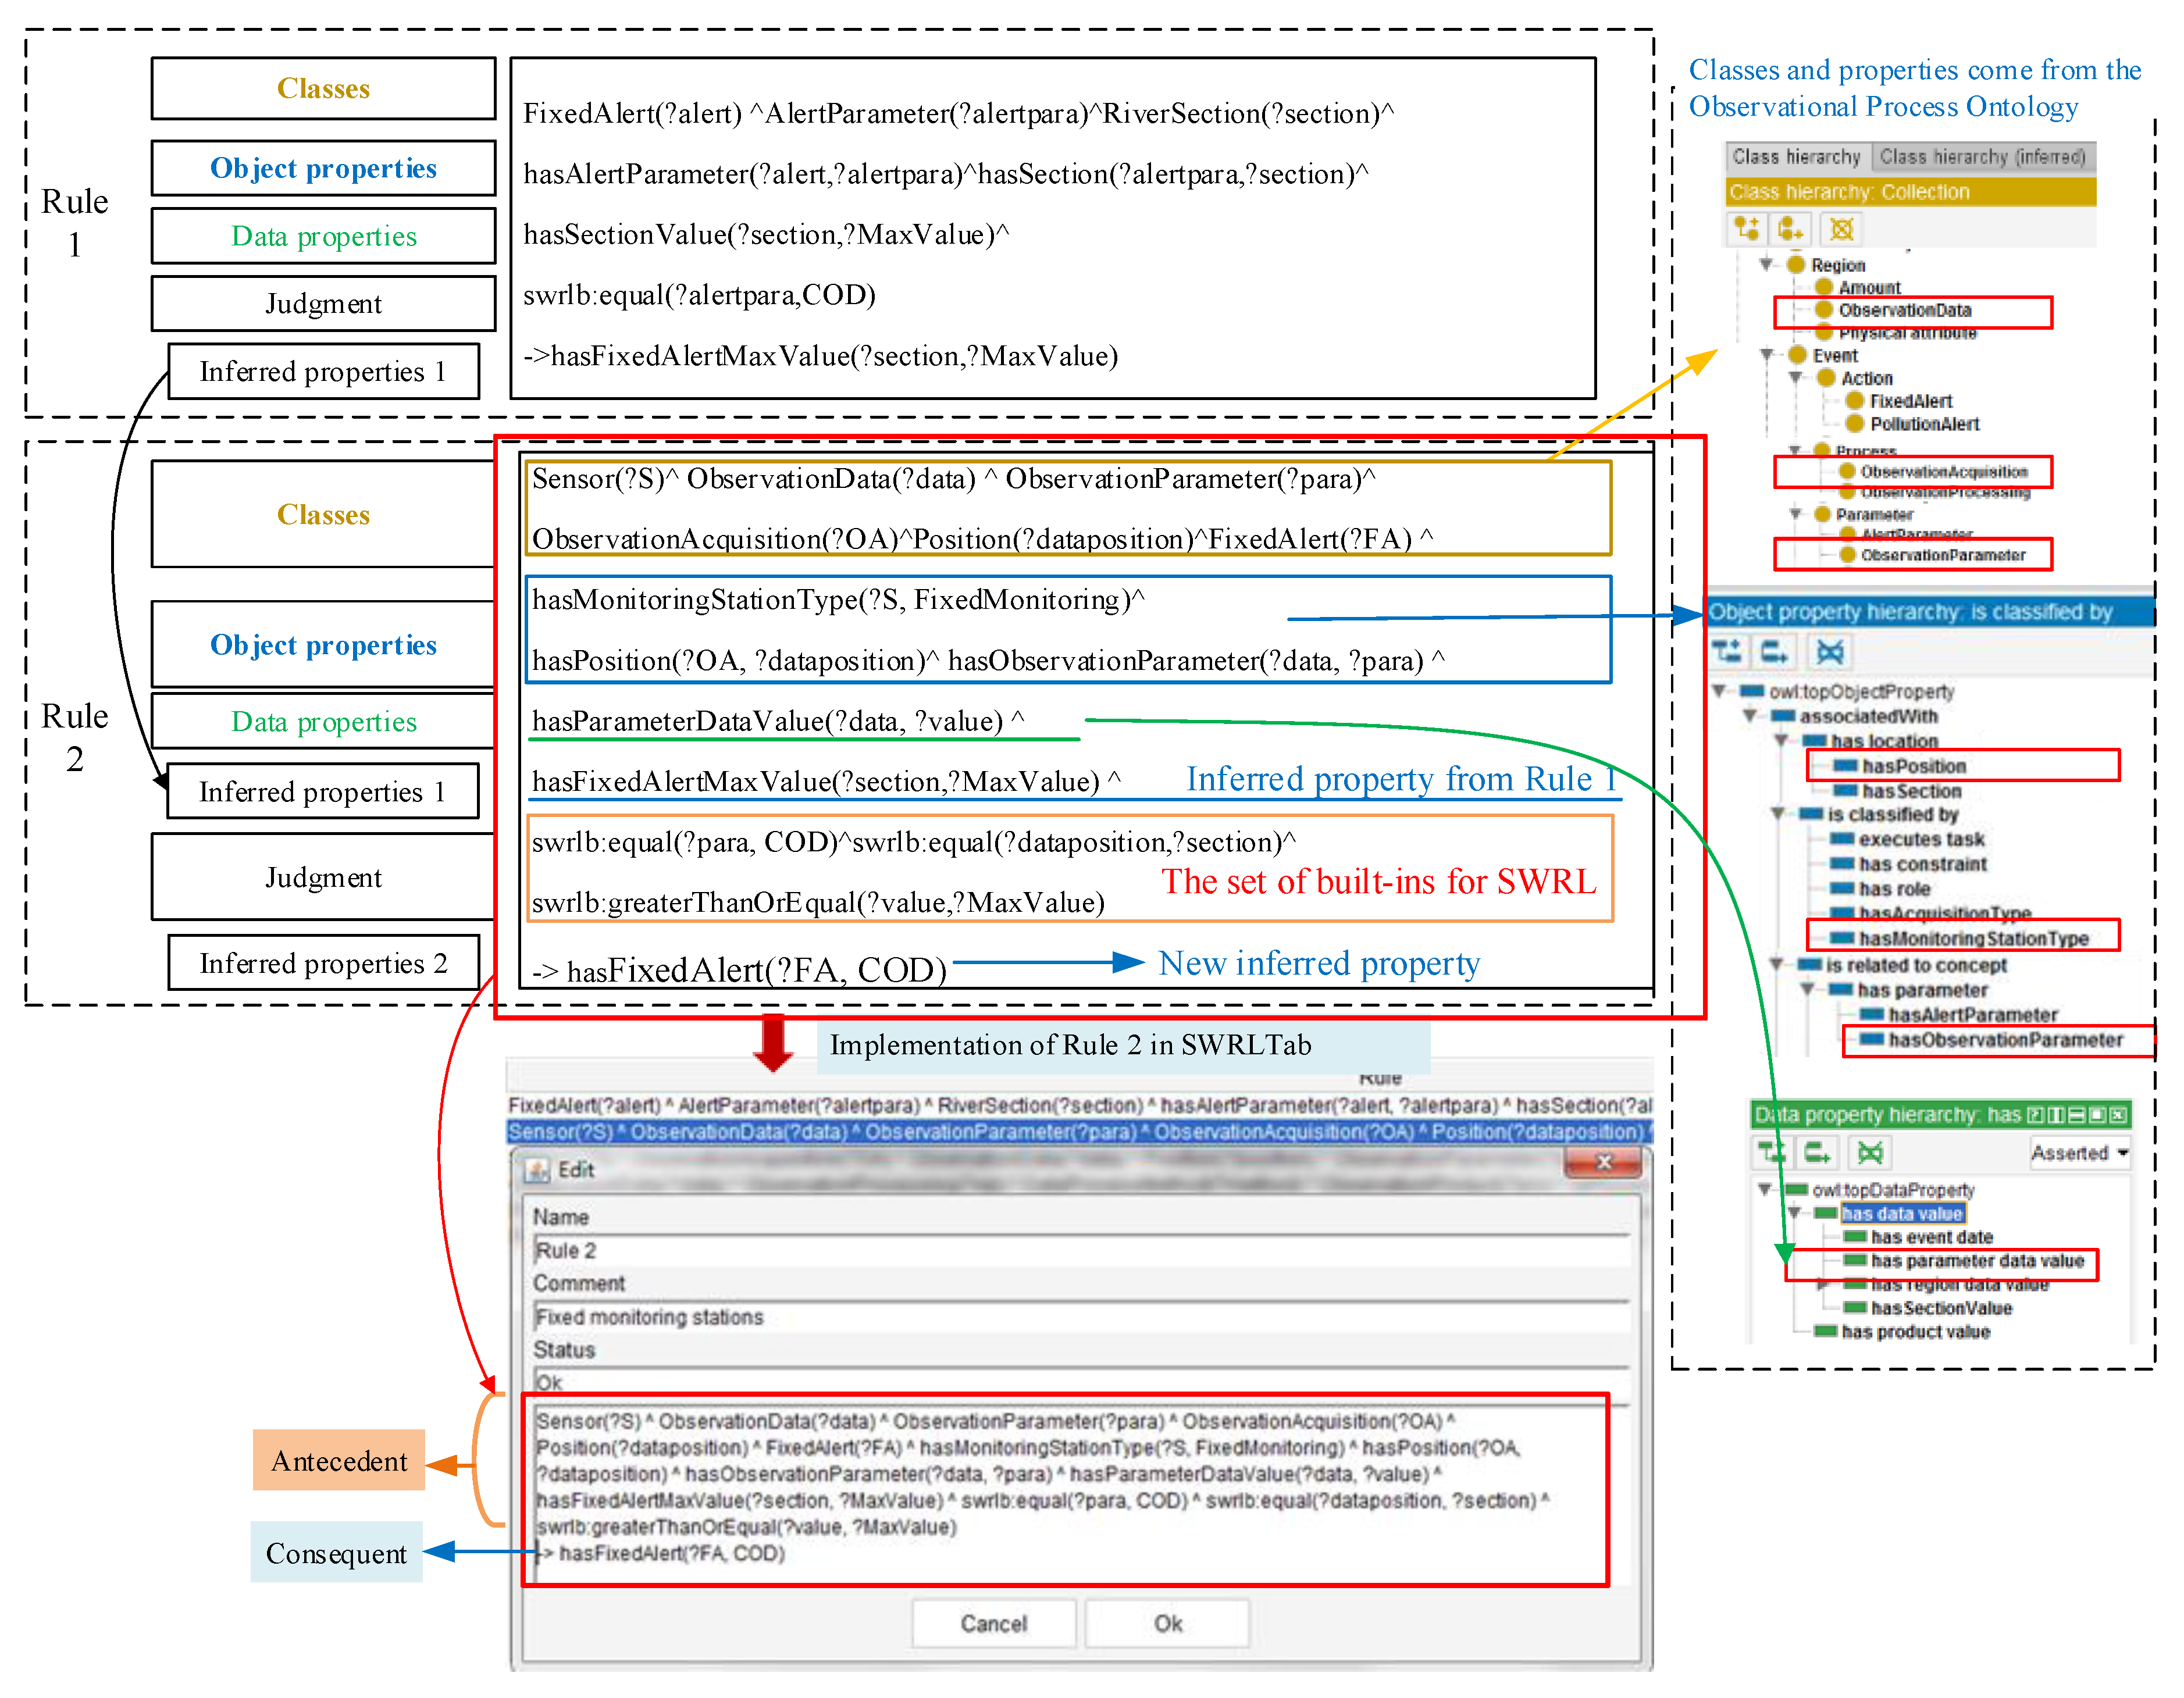
As Shown in Figure 5, Rule 1 (Rule hasFixedAlertMaxValue) sets the water quality alert maximum values according to river sections. Rule 2 (Rule hasFixedAlert) determines whether an alert of a fixed monitoring station is active. The sensor descriptions, observation data descriptions, alert descriptions, asset descriptions, and dynamic data are all semantically related in Rule 2. The key benefit of the knowledge base of this inference approach is that it is possible to directly infer whether or not an observation data reading from a sensor equipped at a fixed monitoring station should trigger an alert. If the reading is greater than the allowable maximum, the alarm would be triggered. The allowable maximum depends on the type of water quality indicators, which are described by the observational parameter in the OPO models.
3.2.2. The rules for Monitoring Stations of Polluting Enterprises
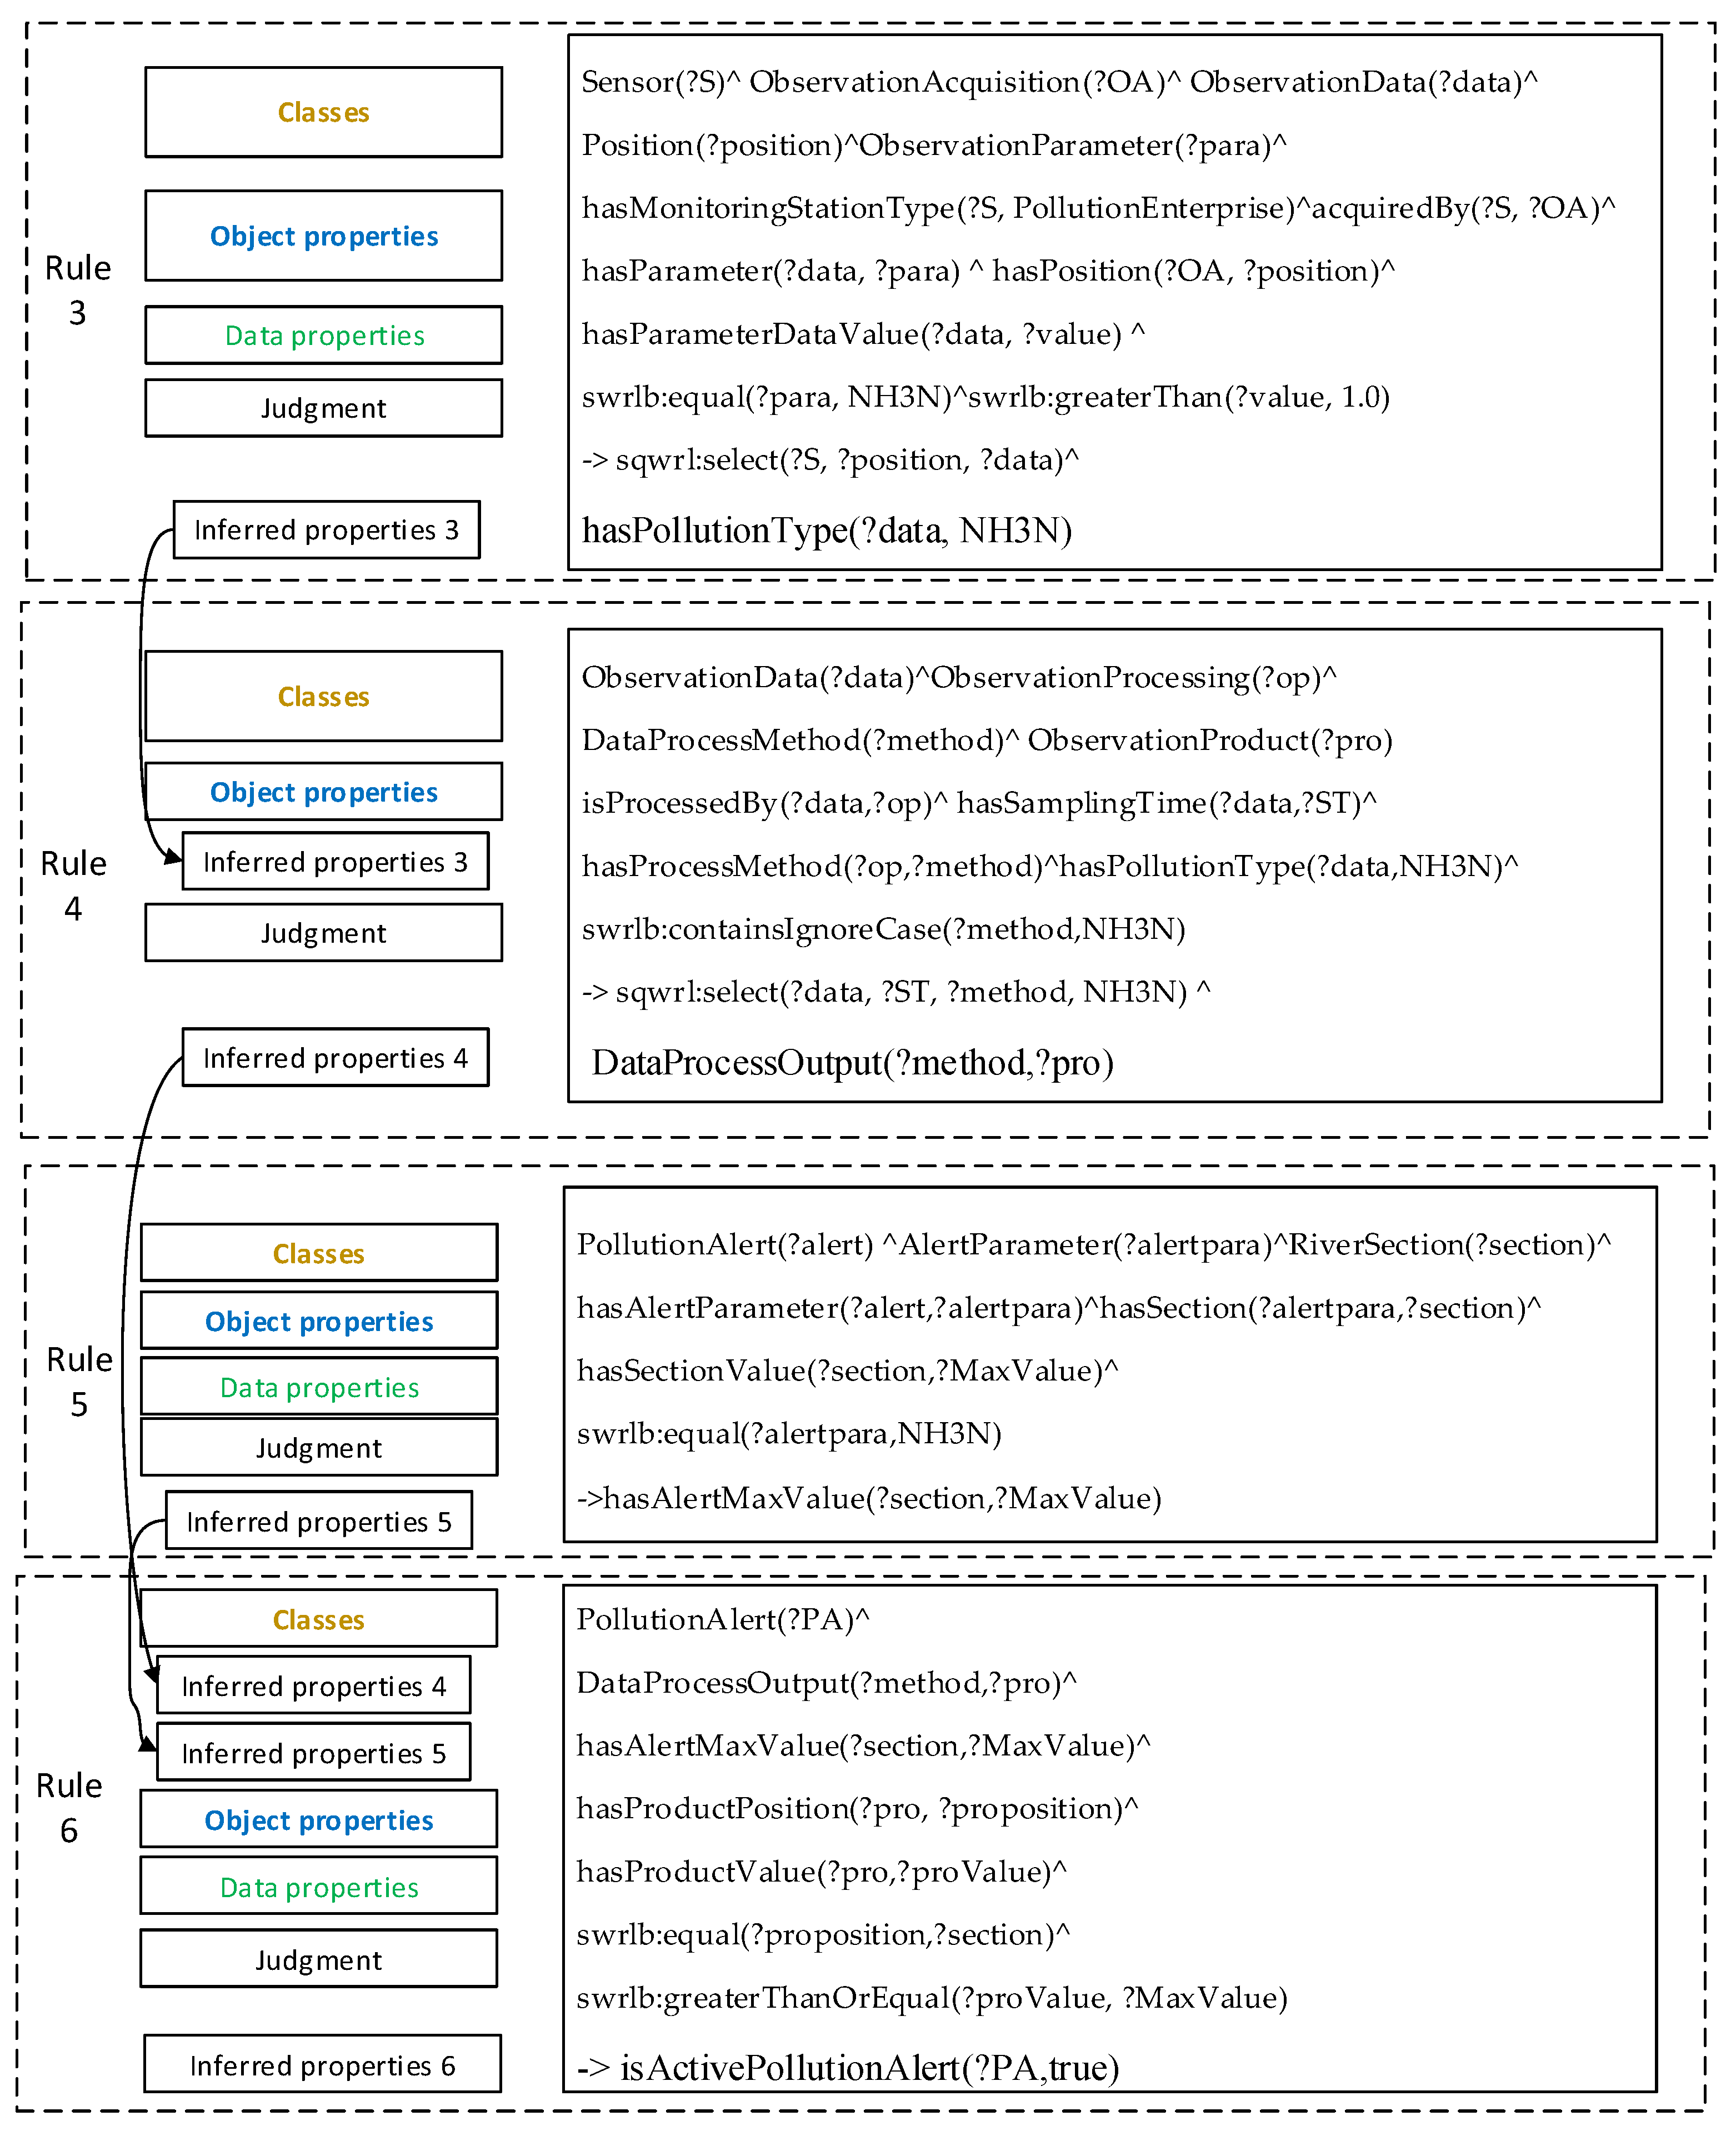
Rule 3, Rule 4, Rule 5, and Rule 6 describe the pollution alert for monitoring stations of the polluting enterprises, which can infer the pollution type, the process output, and determine if an alert is triggered. Examples of the four rules are illustrated in Figure 6.
When the data value of the observation data acquired by a sensor is greater than the maximum acceptable value, the relationship of ‘hasPollutionType’ between the observation data and the observation parameter is inferred and built. According to the type of observation data and the situation of the watershed, the rule sets the maximum acceptable value. In addition, the position of related sensor can be acquired. This capability is provided by Rule 3 (Rule hasPollutionType).
If the data has the relationship of ‘hasPollutionType’, which is activated by Rule 3, then Rule 4 (Rule DataProcessOutput) is required for data processing. In order to present the processing method and the processed results, it is useful to infer the link between the data method and the observation products. This is accomplished using Rule 4.
The Qingyi River is a small river with a relatively slow flow velocity, and the discharged pollutants can be uniformly mixed in the entire cross section in a short time. The one-dimensional water quality model is more suitable to describe the pollution spread for the Qingyi River basin. The model corresponds to ‘opo:DataProcessMethod’ class in the ontology and rules. Therefore, the equations of process method for COD and NH3N are described as follows:
where C0 (mg/L) is the concentration of pollutants from the monitoring station, K represents the pollutant degradation coefficient, and it is a constant, L (m) is the longitudinal distance along the stream, and V (m/s) is the velocity.
Rule 5 (Rule hasAlertMaxValue) has the same function as Rule 1, which can acquire the allowable maximum. The Rule 6 (Rule isActivePollutionAlert) relates an alert to a Boolean literal, which is different from Rule 2 (Rule hasFixedAlert). The Rule 6 works with the output results from Rule 4 and Rule 5. This can occur if the reading is greater than the maximum.
4. Deployment of the Proposed Approach and Discussion
The OPO and rules are used to deploy the semantic-enhanced discovery system. The data of observational process is mapped to the OPO for polluter tracing through logical inference rules. In addition, according to the proposed approach, the three aspects of modeling methods, rules, and discovery service are discussed.
4.1. Demonstration Using a Case Scenario
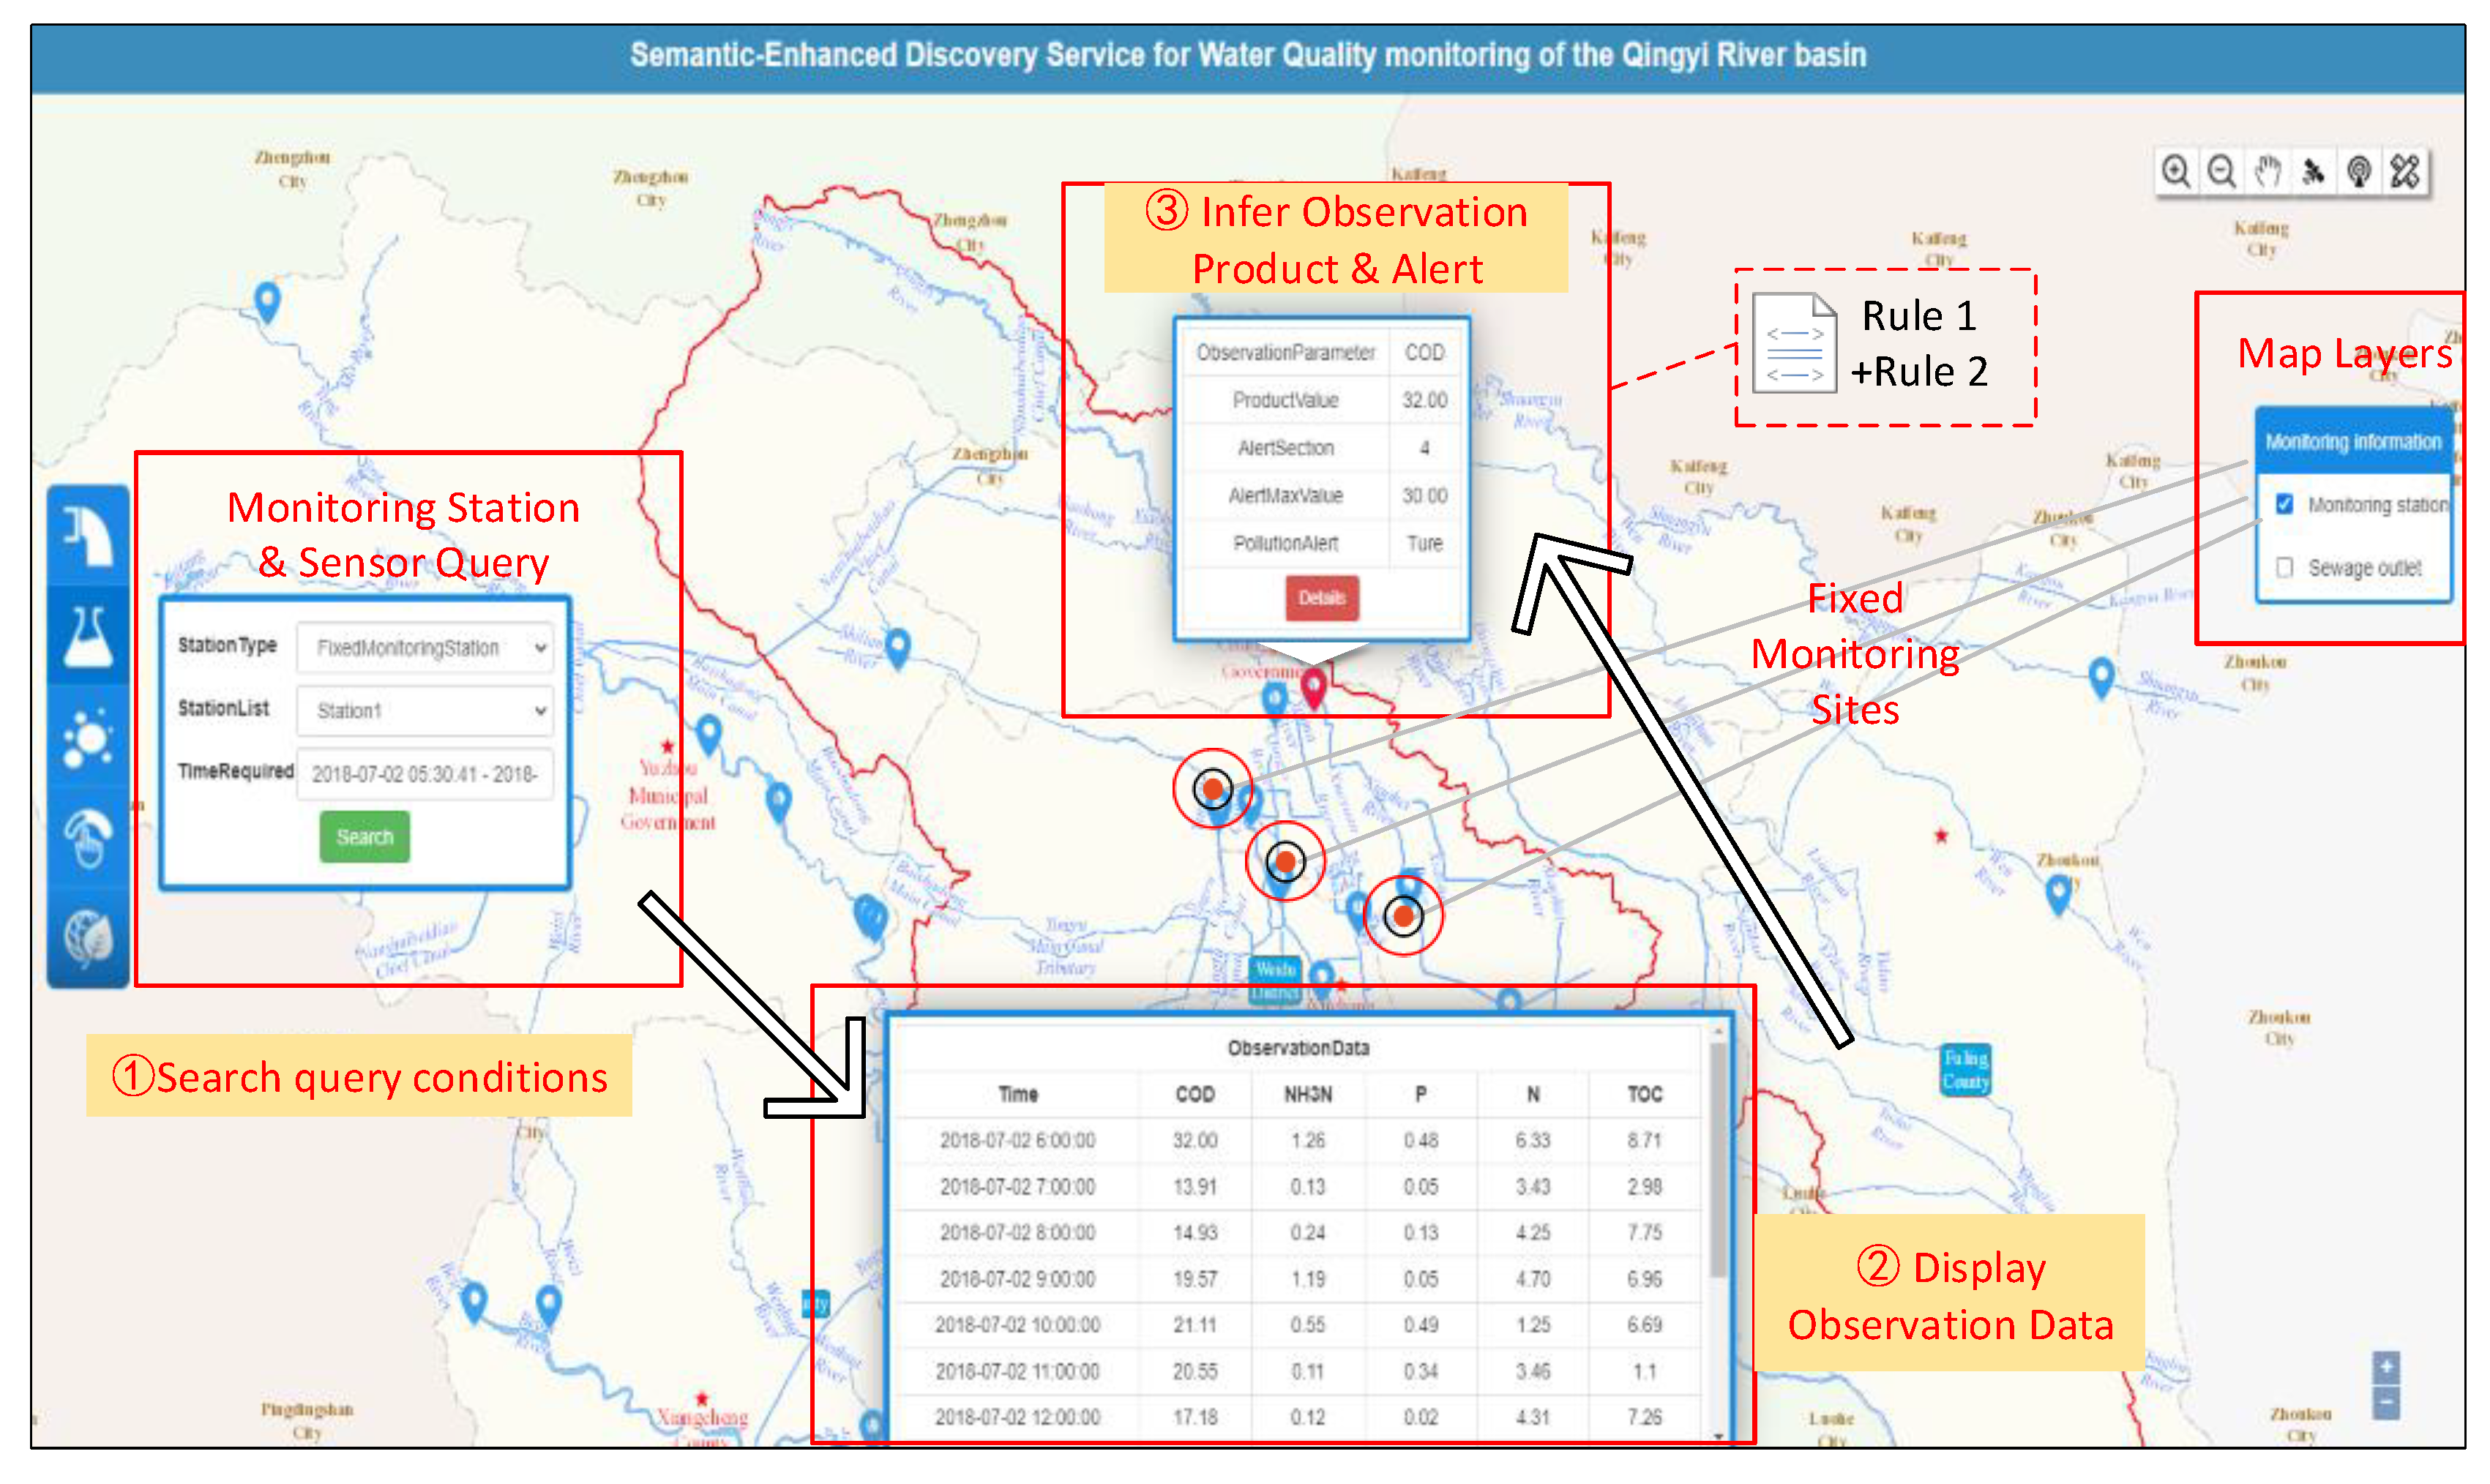
The semantic-enhanced discovery system for water quality monitoring that was designed and developed is shown in Figure 7. The function of water quality discovery is to provide a quick operation of user query requests. Users can obtain observation data from the station type of sensors, the station list, and the time-required. Then, data processing of the observation data can be performed by setting the diffusion distance and flow velocity. The service also includes other functional modules, such as the data management functions, map layers, and other GIS functions.
Once there is a pollutant concentration that exceeds the limitation value, the system will automatically alert with the experiential and mechanistic processing. Then, when it is judged that there is alert information according the rules in Section 3.2, the warning content will be displayed on the interface. Figure 7 shows the query of a fixed monitoring station and the alert results for water pollution. As can be seen in the query results, the semantic reasoning and querying can arrive at the expected observation product and judge whether to publish an alert.
4.2. Discussion
The observational process ontology (OPO) proposed in this study is able to describe the observational process for water quality monitoring and support the observational resource discovery (see Section 3.1). Water quality early warning information can be deduced through the definition of the rules, which make conditional judgments of classes and attributes from the OPO (see Section 3.2). The semantic-enhanced discovery service for alerting for water pollution uses the proposed ontology and rules (see Section 4.1). Therefore, this section makes a comparison using the three aspects of modeling methods, rules, and discovery services.
4.2.1. Comparison with Other Related Modeling Methods
(1) Comparison with non-semantic models
Over the past decade, there has been a drastic increase in the use of decision support systems. A decision support system has been developed to address water resource problems, including water allocation, water use management and water supply management. Many researchers have been working on the development of various models and decision support tools to address the complexity in the management of water resources by integrating utilization models and tools for water environmental decision support [23,24,25,26]. The models used in these decision support systems are defined as non-semantic models, which lack the observational process description.
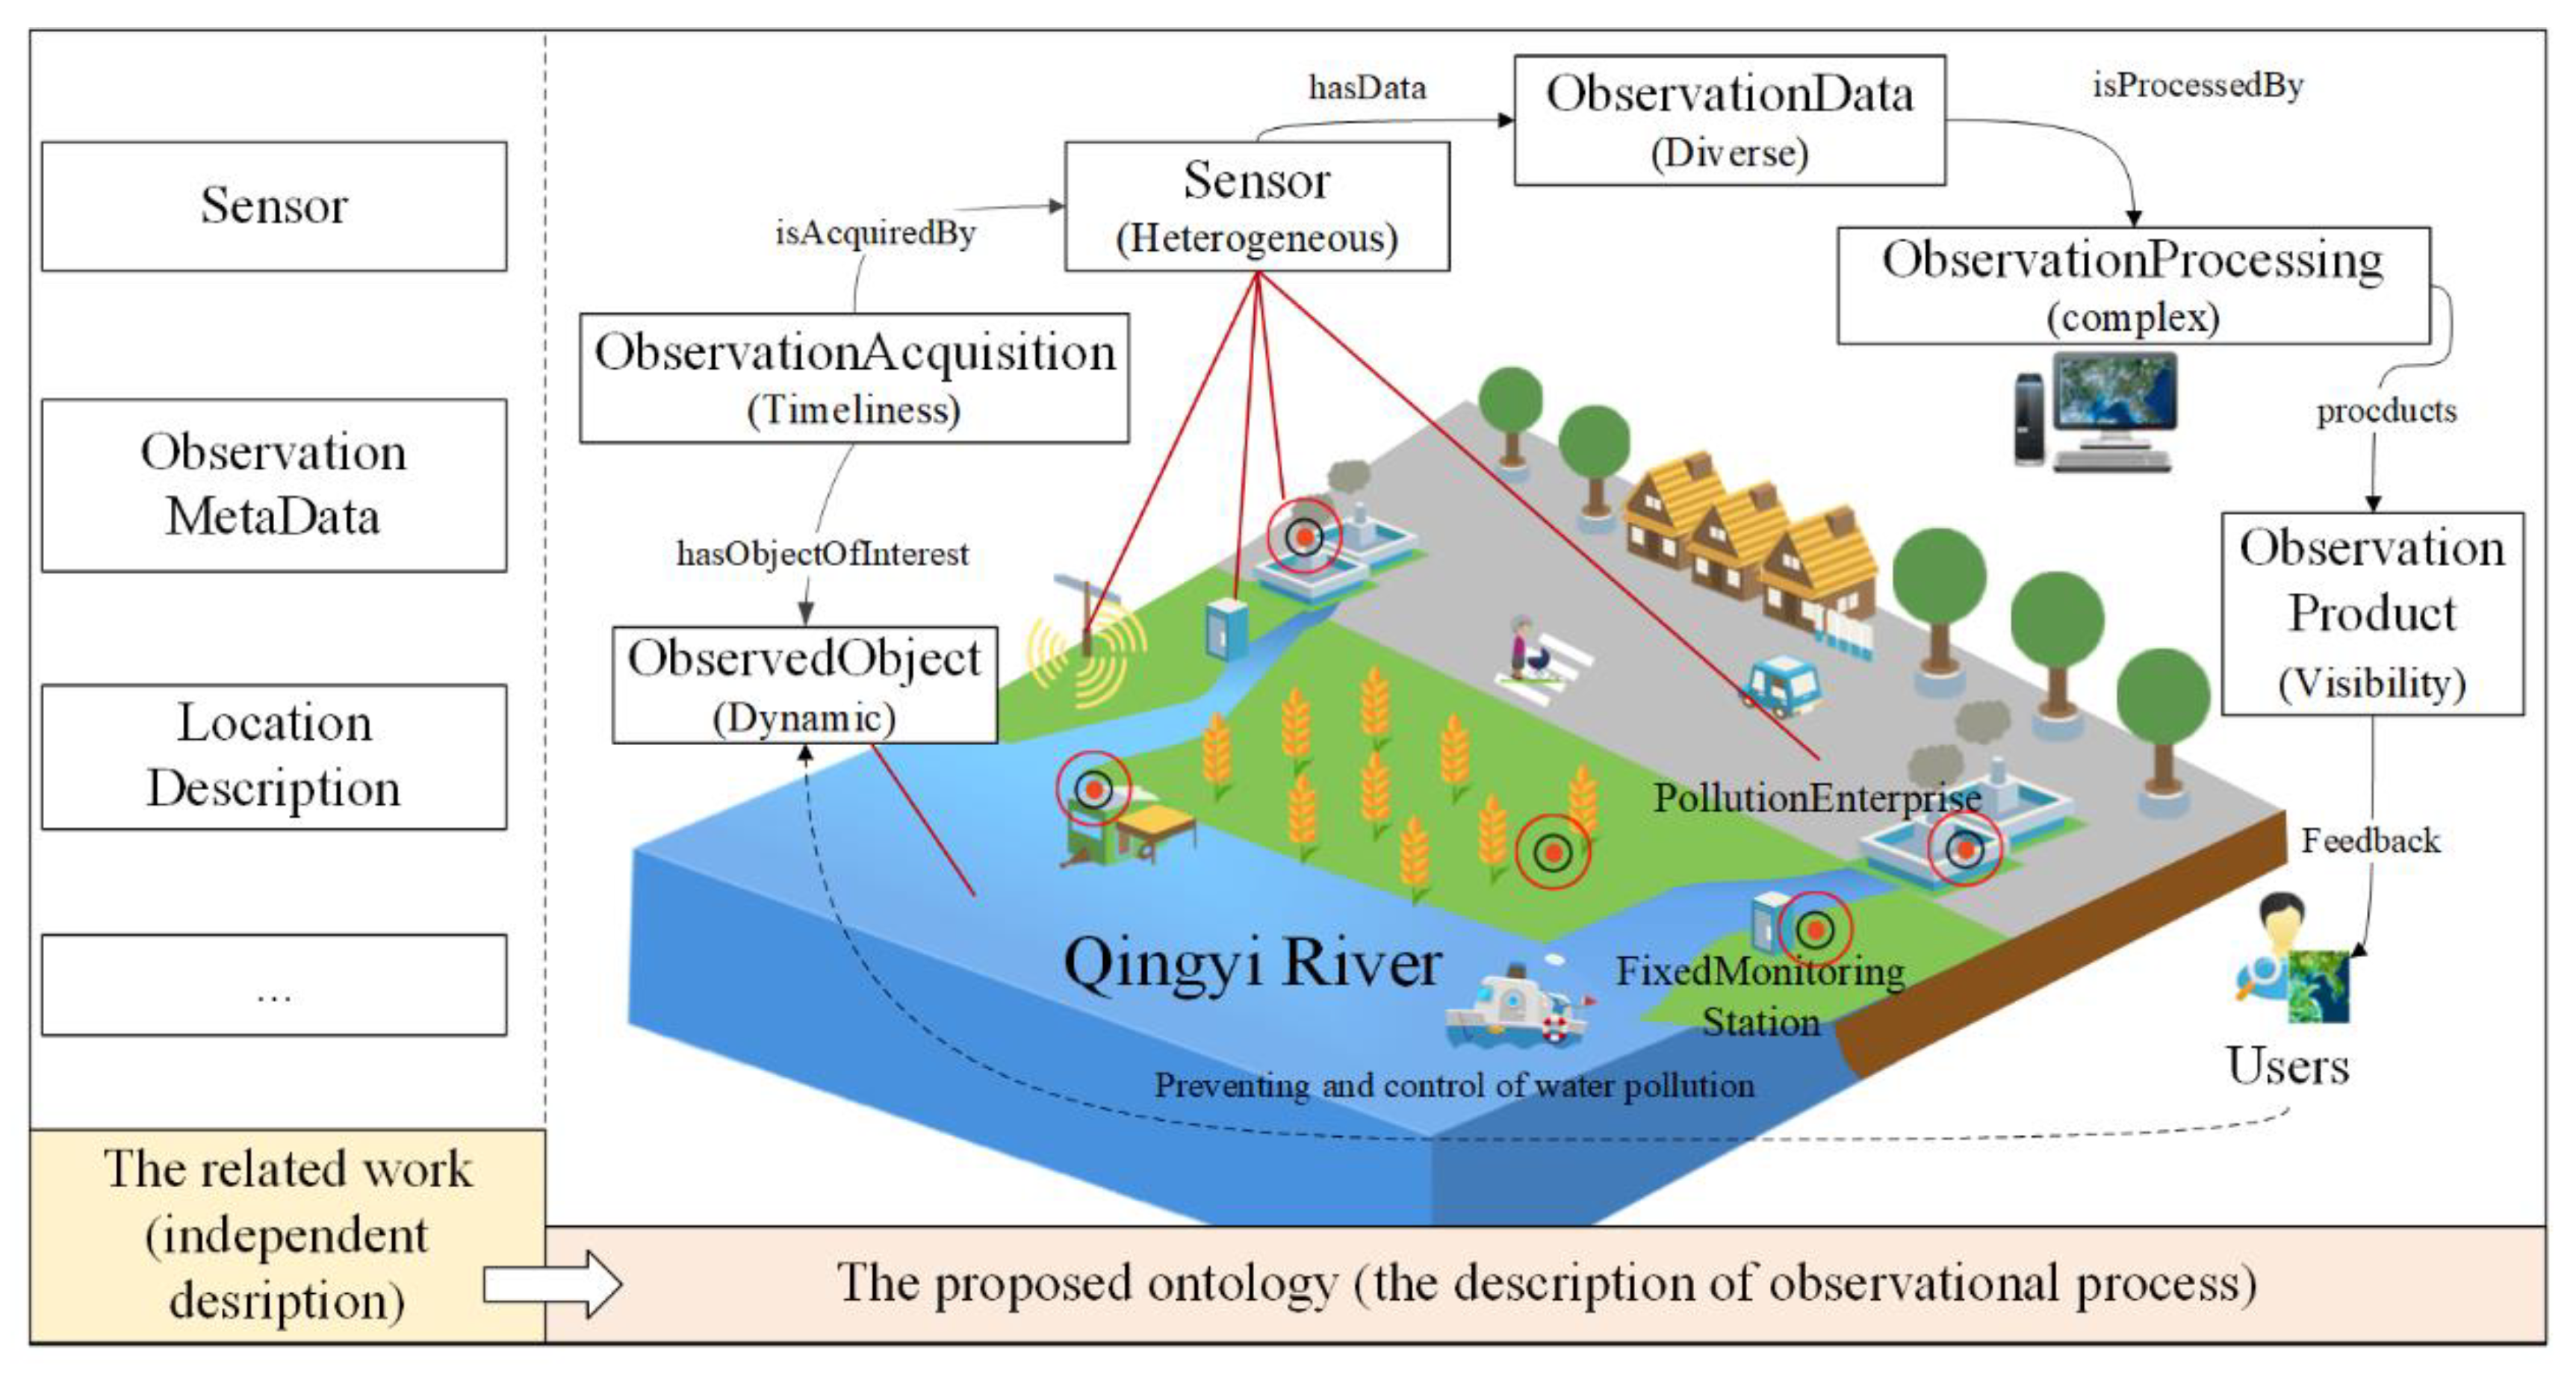
Among these models, the typical model is WaterML 2.0 [27], which is being used in the representation of water observation data and water quality monitoring. The WaterML standard describes a time series that results from direct observations and processed data for encoding water observations data for exchange, such as forecasts and derived results. The WaterML 2.0 defines five primary components that describe water observations: time series, observation specializations, procedures, observation metadata, and the location description. The observation resources in the above model are described separately, which cannot meet the requirements for expression of the water quality monitoring process comprehensively and dynamically. The proposed ontology based on the DOLCE ontology has comprehensive descriptions of the observational process, including observation acquisition, observation data, observation processing, observation product, and other factors, as shown in Figure 8. In addition, the proposed ontology makes it possible to obtain more observational resources collaboratively.
(2) Comparison with other ontologies
The difference between the proposed ontology and other ontologies is the key concepts. For example, Elag and Goodall [28] proposed a water resources component (WRC) ontology for water resource model components, which describes core concepts (symbol, equation, and mathematical classification) and relationships using the OWL. An ontology [29] based on the SSN was proposed to describe the time series and assess the reliability of a hydrological sensor network. Liu et al. [30] presented a WaterML and SSN-based ontology framework that represented information from sensors, observation values, and timeseries for a distributed water information system. In summary, most related studies have been based on the SSN ontology, and the following is a comparison of the SSN ontology with the proposed ontology.
The sensor and sensor network ontology (SSN Ontology), developed by W3C [6,7], aims to improve sensing applications. It contains a comprehensive representation of information. A comparison between the SSN ontology and the proposed ontology (OPO) is shown in Table 2. Some of the differences are as follows: (1) the SSN has more comprehensive concepts of sensor metadata than the OPO, while the OPO describes more detailed observational processes. (2) The SSN and OPO can be used for in-situ sensors, and the OPO also defines descriptions related to water quality monitoring and pollution alerting.
In addition, there are some ontology modeling methods that have been applied to water resource management, but their application fields are slightly different from the proposed method. For example, Klien et al. presented [31] an application in disaster management that examined to what extent ontology-based service discovery can solve these semantic heterogeneity problems for storm hazards. An ontology engineering method [32] was applied for the description of the Water–Energy–Food nexus domain for enhancing the compatibility of qualitative descriptions logically or objectively. The ontology includes the concepts and relationships of ‘precipitation’ and ‘fish’. Future research in the proposed ontology will add a description of aquatic ecology based on the observational process for more efficient water resource management.
4.2.2. Comparison with Pollution Alert Rules
With the rapid development of semantics into the sensor web, more rules are being defined for water pollution early-warning. As well as promoting semantic interoperability, inference represents a key advantage of ontological modeling. Earlier studies of water pollution alert rules focused on the inference of one type from a monitoring station. For example, Shu et al. [33] defined an ontology for the water data transfer format and validated data with respect to constraints through a query technique using OWL and SWRL. Additionally, the key factors of the rules would be modified according the river situation. The proposed rules in this paper describe the pollution type, the position, the sampling time, the observation product, and the pollution alert. However, Howell et al. [34] described the rules of water alert that affected the entity of the water utility decision support by leveraging the semantic web to address the heterogeneity of web resources.
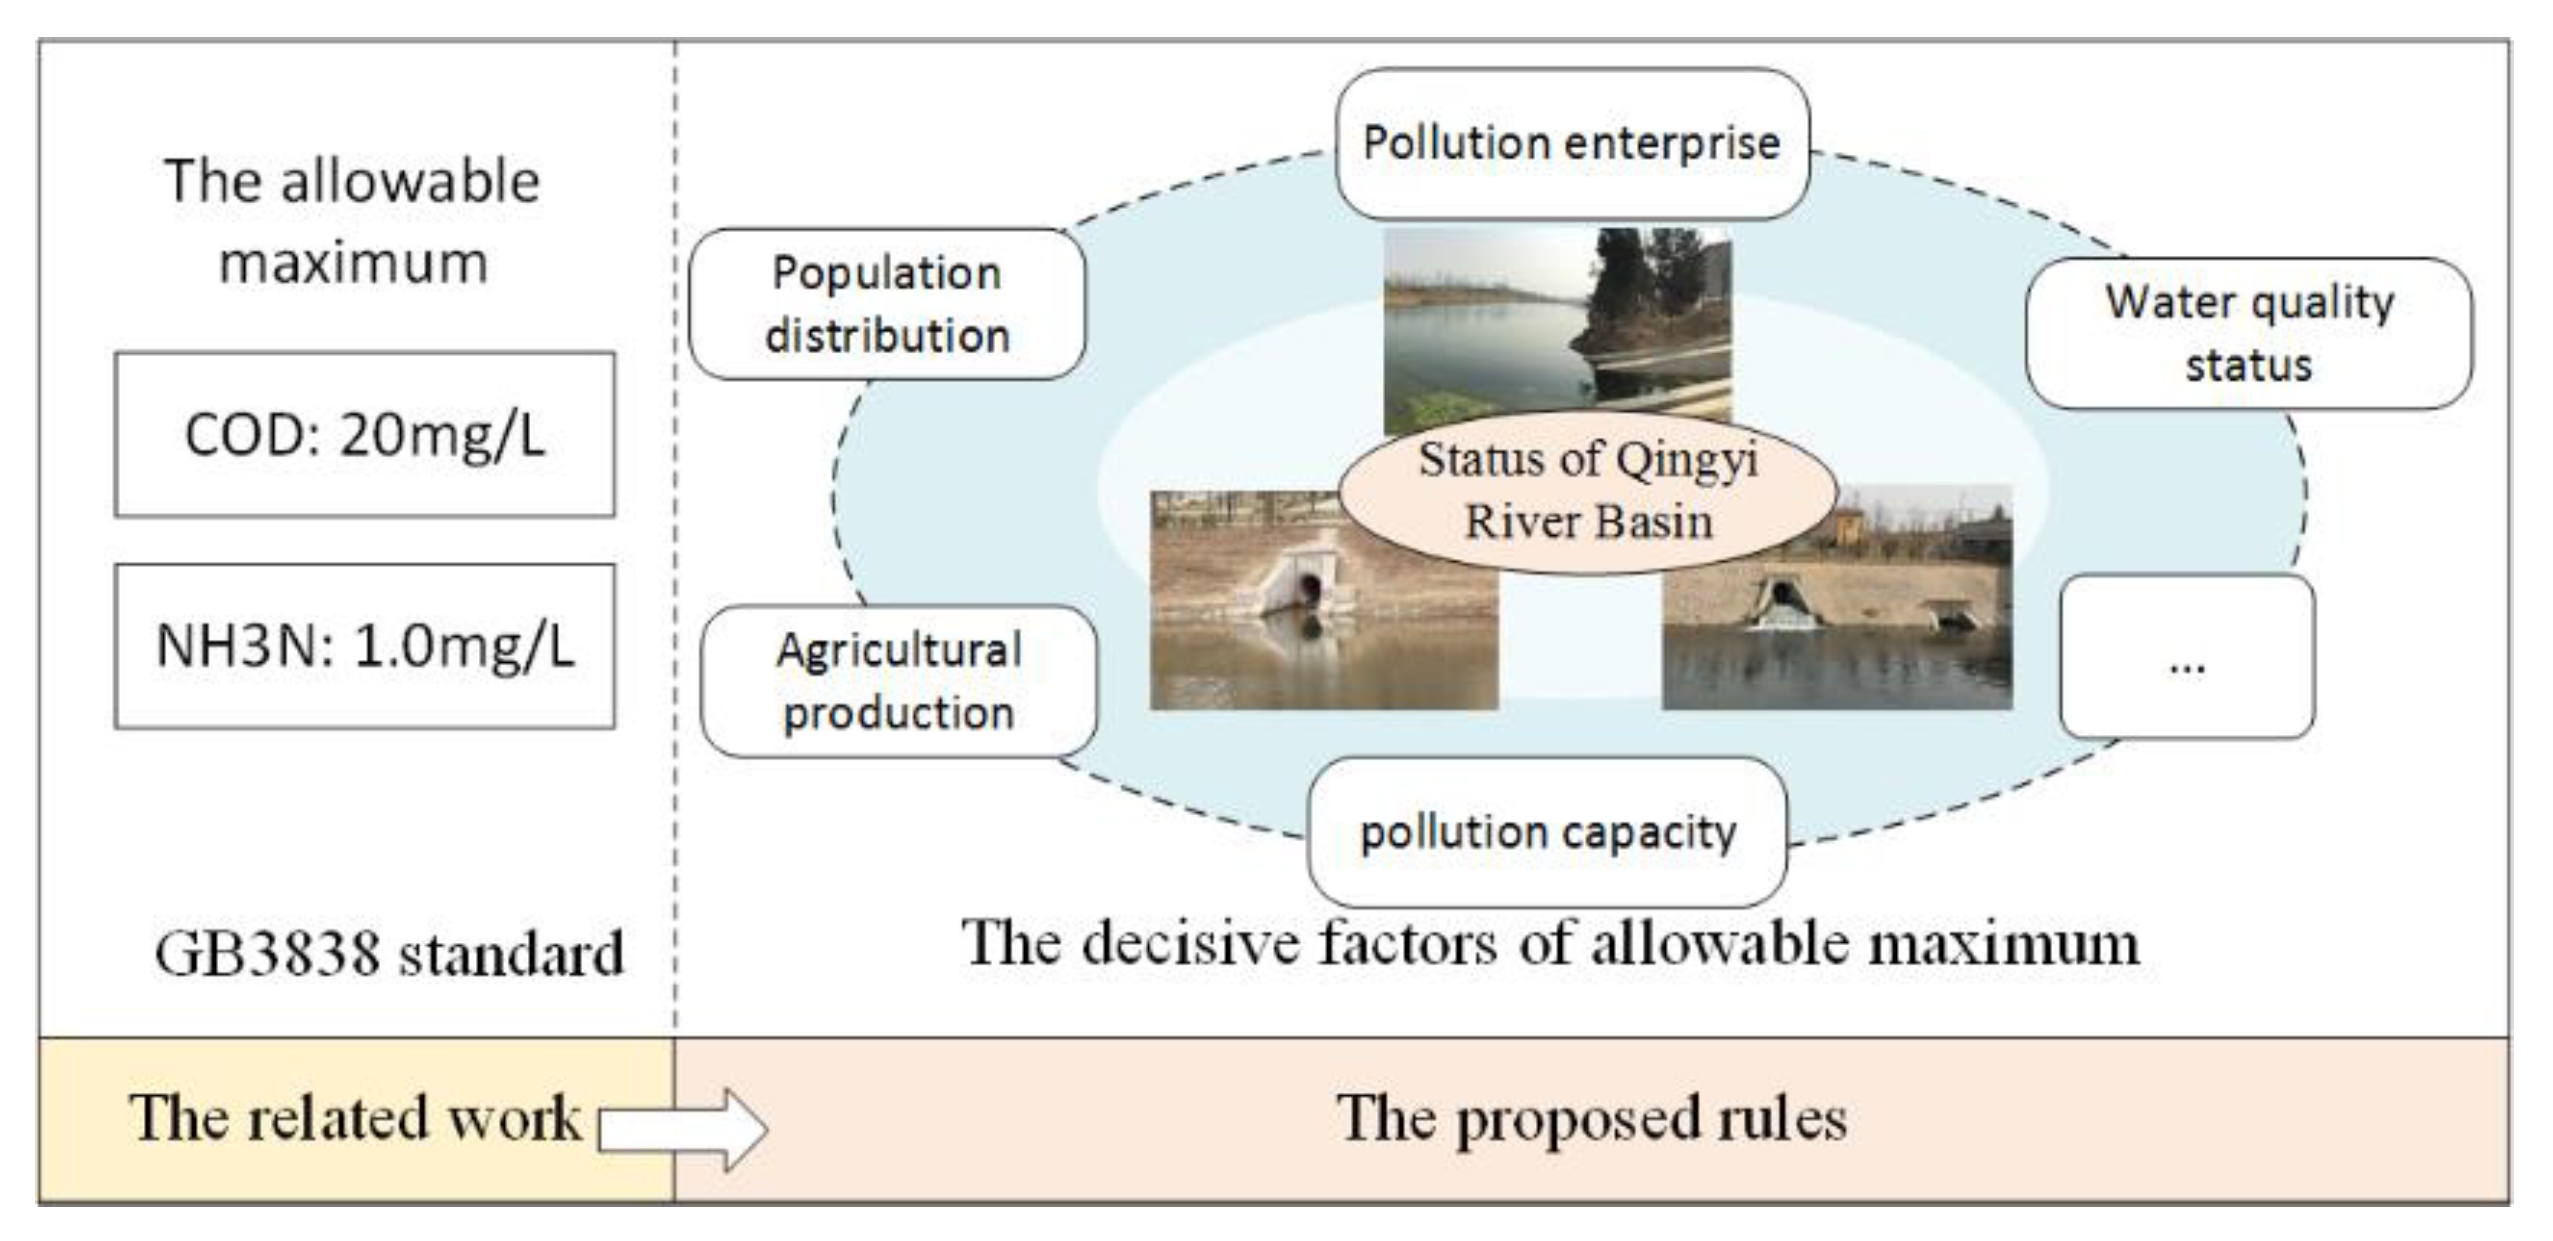
It is significant to define suitable factors of water quality monitoring into the rules. However, the selection of pollution alert factors in the rules is relatively simple. For example, the reasoning rules of an emergency response system for water pollution accidents was proposed by Meng et al. [35]. This study used the GB3838 standard: “The standard value of the Category 3 functional water is the allowable maximum”, to verify the usability of ontology models based on reasoning. The maximum value of the COD was 20, and the maximum valued of NH3N was 1.0, according to the Chinese regulation GB3838.
However, the mode of setting a uniform value is not applicable in the case of the Qingying River Basin, and this article sets a maximum value for each river section. Figure 9 shows the influencing factors of the allowable maximum. According to the location of the river sections, the maximum alert value of the pollutants was selected for the proposed rules. In addition, this study defined the pollution alert process for two types of water quality monitoring stations. The results of the experiment indicated that the OPO with rules could be a very useful methodology for quality assurance with complex data processing.
4.2.3. Comparison to Query Results Based on the OPO
Related research has focused on the visualization of data by using GIS analysis. For example, Xia et al. [36] presented a generic framework and the development steps of a decision tool prototype that used a geographic information systems (GIS)-based decision support system for the diagnosis of river health. Zhang et al. [37] proposed the development and application of an integrated environmental decision support system for water pollution control. The system included relations and links between various environmental simulation models, model integration, visualization, and real-time simulation methods. Horsburgh et al. [1] described the observations data model (ODM) Python tools allow users to query and export, visualize, and perform quality control post processing on time series of environmental observation data. Compared with the above systems, the proposed system in this study lacks professional data analysis, but it is characterized by enhancing the semantics of the observational process for tracing pollution sources.
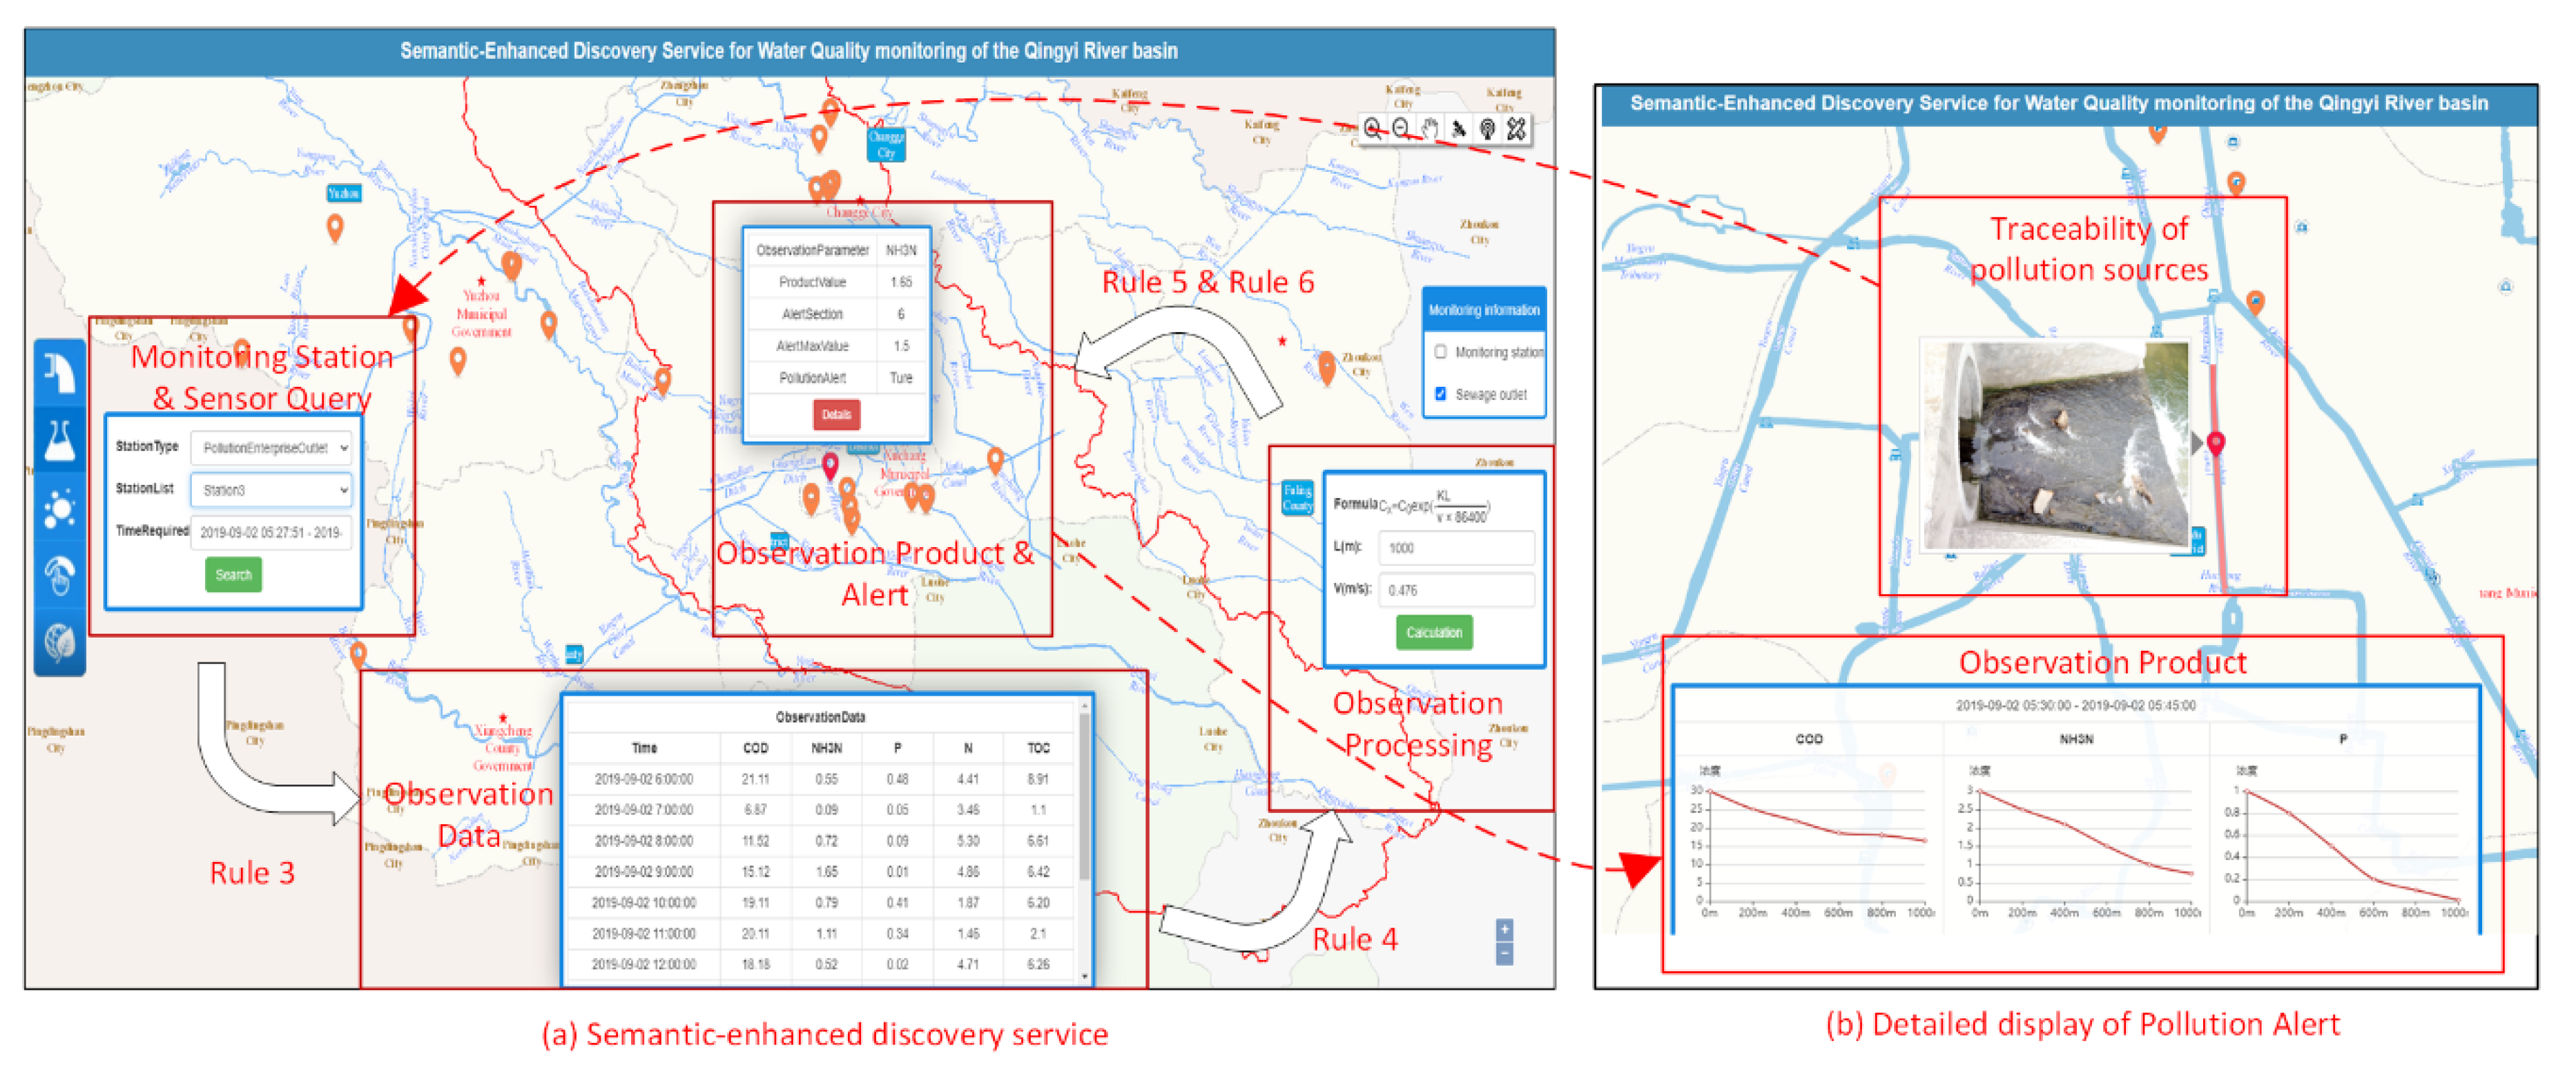
In addition, compared with other semantic query services (for example, a given SPARQL query was proposed in [38]), the proposed system provides a richer visual representation. A query for a pollution enterprise was conducted that used “Data Acquired Start Time = 2019-09-02T5:27:51” and “Data Acquired End Time = 2019-09-02T20:00:00”. Figure 10 shows the result of the search request. The observation data were targeted from the constructed ontology library. Using the observation data, the observation processing module calculated the pollutant diffusion. Then, the rules of pollution alert were judged based on the calculated results (observation products). In the discovery service, the observation information representation assisted in (1) browsing the enriched observational metadata properties of all the retrieved results in a table, (2) viewing the observation processing related to the data, and (3) viewing the observation products information and pollution alert. The realization of water polluter tracing is attributed the proposed ontology and rules that describe the observational process. Users can directly obtain the polluting sources that caused the water pollution, as shown in Figure 10b. The proposed method is generally applicable for other applications, such as precision agriculture, air pollution monitoring, and surface monitoring, which requires damage traceability.
A pollutant source tracing example is shown in Figure 10 to realize and verify the observation data processing. It obtained the suspicious source of pollution, where the pollution came from the nearest upstream sewage outlet. In the semantic-enhanced discovery service, all aspects of the observational process are displayed on the operation interface. For example, Figure 10 shows that the aspects that include the observation products, observation data, and related sensors. These aspects of observational process are then mapped to the OPO when executing the reasoning for pollutant source tracing.
5. Conclusions
In this study, an ontology for water quality monitoring that is used for water pollution alerts was proposed. This ontology was developed by constructing the subclasses of the DOLCE ontology. This work provided semantic-enhanced pollution alert inference rules for the integration of heterogeneous water quality sensors and the mining of deep knowledge from observational resources. The water pollution early-warning and water pollution-processed models were able to be used for water pollution alerts using the rules. The proposed OPO and rules can also be developed for other application domains.
In addition, more classes, object properties, and data properties can be used in the discovery service to adapt the ontology to other purposes. The feasibility and usability of the proposed ontology were demonstrated using semantic discovery. The proposed ontology and reasoning rules allow the integration of query results in the system of observation data, observation product, sensors, and model of water quality warning. The proposed system primarily used data specifications from the Qingyi River to illustrate and describe details regarding water quality monitoring and pollution alerts for pollutant tracing. This paper proposes the adoption a semantic-driven combination of observational processes for water pollution accidents.
The following research directions will be studied more and refined in the future. More instances and rules will be described for acquiring more observational resources and for the mining of more useful knowledge. The system still needs to be able to use reasoning from external semantic sensor web services.
Author Contributions
X.W. proposed the research ideas and methods, wrote the manuscript, and created the figures. H.W. and N.C. designed the experiments and contributed to the discussions. X.H. and Z.T. are responsible for data collection, manuscript draft revision. All authors have read and agreed to the published version of the manuscript.
Funding
This work was supported by Open Research Fund of State Key Laboratory of Information Engineering in Surveying, Mapping and Remote Sensing, Wuhan University (Grant No. 18102).
Acknowledgments
We thank LetPub (www.letpub.com) for its linguistic assistance during the preparation of this manuscript.
Conflicts of Interest
The authors declare no conflict of interest.
References
- Horsburgh, J.S.; Reeder, S.L.; Jones, A.S.; Meline, J. Open source software for visualization and quality control of continuous hydrologic and water quality sensor data. Environ. Modell. Softw. 2015, 70, 32–44. [Google Scholar] [CrossRef] [Green Version]
- Rasyid, M.U.H.A.; Sayfudin, A.; Basofi, A.; Sudarsono, A. Development of semantic sensor web for monitoring environment conditions. In Proceedings of the 2016 International Seminar on Intelligent Technology and Its Applications (ISITIA), Lombok, Indonesia, 28–30 July 2016; pp. 607–612. [Google Scholar] [CrossRef]
- Umar, U.; Al Rasyid, M.U.H.; Sukaridhoto, S. Distributed Database Semantic Integration of Wireless Sensor Network to Access the Environmental Monitoring System. Int. J. Eng. Technol. Innov. 2018, 8, 157–172. [Google Scholar]
- Nativi, S.; Craglia, M.; Pearlman, J. Earth Science Infrastructures Interoperability: The Brokering Approach. IEEE J-STARS 2013, 6, 1118–1129. [Google Scholar] [CrossRef]
- Sheth, A.P.; Henson, C.A.; Sahoo, S.S. Semantic Sensor Web. IEEE Internet Comput. 2008, 12, 78–83. [Google Scholar] [CrossRef]
- Compton, M.; Barnaghi, P.; Bermudez, L.; García-Castro, R.; Corcho, O.; Cox, S.; Graybeal, J.; Hauswirth, M.; Henson, C.; Herzog, A.; et al. The SSN ontology of the W3C semantic sensor network incubator group. J. Web Semant. 2012, 17, 25–32. [Google Scholar] [CrossRef]
- Haller, A.; Janowicz, K.; Simon Cox, C.; Le Phuoc, D.; Taylor, K.; Lefrançois, M. Semantic Sensor Network Ontology. Available online: https://www.w3.org/TR/2017/REC-vocab-ssn-20171019/ (accessed on 30 December 2019).
- Chen, Z.; Gangopadhyay, A.; Holden, S.H.; Karabatis, G.; McGuire, M.P. Semantic integration of government data for water quality management. Gov. Inf. Q. 2007, 24, 716–735. [Google Scholar] [CrossRef]
- Regueiro, M.A.; Viqueira, J.R.R.; Stasch, C.; Taboada, J.A. Semantic mediation of observation datasets through Sensor Observation Services. Future Gener. Comput. Syst. 2017, 67, 47–56. [Google Scholar] [CrossRef]
- Calbimonte, J.P.; Jeung, H.; Corcho, O.; Aberer, K. Enabling Query Technologies for the Semantic Sensor Web. Int. J. Semant. Web Inf. Syst. 2012, 8, 43–63. [Google Scholar] [CrossRef] [Green Version]
- Ristoski, P.; Paulheim, H. Semantic Web in data mining and knowledge discovery: A comprehensive survey. J. Web Semant. 2016, 36, 1–22. [Google Scholar] [CrossRef] [Green Version]
- W3C OWL Working Group. OWL 2 Web Ontology Language Document Overview (Second Edition). Available online: https://www.w3.org/TR/owl2-overview/#ack (accessed on 30 December 2019).
- Horrocks, I.; Patel-Schneider, P.F.; Boley, H.; Tabet, S.; Grosof, B.; Dean, M. SWRL: A Semantic Web Rule Language Combining OWL and RuleML. Available online: https://www.w3.org/Submission/2004/SUBM-SWRL-20040521/ (accessed on 30 December 2019).
- Wang, C.; Chen, N.; Wang, W.; Chen, Z. A Hydrological Sensor Web Ontology Based on the SSN Ontology: A Case Study for a Flood. ISPRS Int. J. Geo-Inf. 2018, 7, 2. [Google Scholar] [CrossRef] [Green Version]
- Xiaomin, Z.; Jianjun, Y.; Xiaoci, H.; Shaoli, C. An Ontology-based Knowledge Modelling Approach for River Water Quality Monitoring and Assessment. Procedia Comput. Sci. 2016, 96, 344–353. [Google Scholar] [CrossRef] [Green Version]
- Dong, J.; Wang, G.; Yan, H.; Xu, J.; Zhang, X. A survey of smart water quality monitoring system. Environ. Sci. Pollut. Res. 2015, 22, 4893–4906. [Google Scholar] [CrossRef] [PubMed]
- Huang, X.; Jianjun, Y.; Shaoli, C.; Xiaomin, Z. A Wireless Sensor Network-Based Approach with Decision Support for Monitoring Lake Water Quality. Sensors 2015, 15, 29273–29296. [Google Scholar] [CrossRef] [PubMed] [Green Version]
- Mihaela, O. A knowledge modelling framework for intelligent environmental decision support systems and its application to some environmental problems. Environ. Modell. Softw. 2018, 110, 72–94. [Google Scholar] [CrossRef]
- Zheng, D. Research of Hair Product Industry Polluted Status and New Neutralization Process. Master’s Thesis, Henan Normal University, Xinxiang, China, 2017. [Google Scholar]
- Borgo, S.A.M.C. Foundational Choices in DOLCE. In Handbook on Ontologies; Staab, S., Studer, R., Eds.; Springer: Berlin/Heidelberg, Germany, 2009; pp. 361–381. [Google Scholar] [CrossRef]
- Musen, M.A. The Protege Project: A Look Back and a Look Forward. AI Matters 2015, 1, 4–12. [Google Scholar] [CrossRef]
- Shao, D.; Nong, X.; Tan, X.; Chen, S.; Xu, B.; Hu, N. Daily Water Quality Forecast of the South-To-North Water Diversion Project of China Based on the Cuckoo Search-Back Propagation Neural Network. Water 2018, 10, 1471. [Google Scholar] [CrossRef] [Green Version]
- Ge, Y.; Li, X.; Huang, C.; Nan, Z. A Decision Support System for irrigation water allocation along the middle reaches of the Heihe River Basin, Northwest China. Environ. Modell. Softw. 2013, 47, 182–192. [Google Scholar] [CrossRef]
- Weng, S.Q.; Huang, G.H.; Li, Y.P. An integrated scenario-based multi-criteria decision support system for water resources management and planning—A case study in the Haihe River Basin. Expert Syst. Appl. 2010, 37, 8242–8254. [Google Scholar] [CrossRef]
- Kort, I.A.T.D.; Booij, M.J. Decision making under uncertainty in a decision support system for the Red River. Environ. Modell. Softw. 2007, 22, 128–136. [Google Scholar] [CrossRef] [Green Version]
- Salewicz, K.A.; Nakayama, M. Development of a web-based decision support system (DSS) for managing large international rivers. Global Environ. Chang. 2004, 14, 25–37. [Google Scholar] [CrossRef]
- Taylor, P. OGC WaterML 2.0: Part 1-Timeseries. In Open Geospatial Consortium: OGC 10-126r4; OGC: Wayland, MA, USA, 2014; p. 137. [Google Scholar]
- Elag, M.; Goodall, J.L. An ontology for component-based models of water resouvrce systems. Water Resour. Res. 2013, 49, 5077–5091. [Google Scholar] [CrossRef]
- Dutta, R.; Morshed, A. Performance Evaluation of South Esk Hydrological Sensor Web: Unsupervised Machine Learning and Semantic Linked Data Approach. IEEE Sens. J. 2013, 13, 3806–3815. [Google Scholar] [CrossRef]
- Liu, Q.; Bai, Q.; Kloppers, C.; Fitch, P.; Bai, Q.; Taylor, K.; Fox, P.; Zednik, S.; Ding, L.; Terhorst, A.; et al. An ontology-based knowledge management framework for a distributed water information system. J. Hydroinform. 2013, 15, 1169–1188. [Google Scholar] [CrossRef] [Green Version]
- Klien, E.; Lutz, M.; Kuhn, W. Ontology-based discovery of geographic information services—An application in disaster management. Comput. Environ. Urban Syst. 2006, 30, 102–123. [Google Scholar] [CrossRef]
- Endo, A.; Kumazawa, T.; Kimura, M.; Yamada, M.; Kato, T.; Kozaki, K. Describing and Visualizing a Water-Energy-Food Nexus System. Water 2018, 10, 1245. [Google Scholar] [CrossRef] [Green Version]
- Shu, Y.; Liu, Q.; Taylor, K. Semantic validation of environmental observations data. Environ. Modell. Softw. 2016, 79, 10–21. [Google Scholar] [CrossRef]
- Howell, S.; Rezgui, Y.; Beach, T. Water utility decision support through the semantic web of things. Environ. Modell. Softw. 2018, 102, 94–114. [Google Scholar] [CrossRef]
- Meng, X.; Chao, X.; Xinxia, L.; Junming, B.; Wenhan, Z.; Hao, C.; Zhuo, C. An Ontology-Underpinned Emergency Response System for Water Pollution Accidents. Sustainability 2018, 10, 546. [Google Scholar] [CrossRef] [Green Version]
- Xia, J.; Lihuai, L.; Junqiang, L.; Laounia, N. Development of a GIS-Based Decision Support System for Diagnosis of River System Health and Restoration. Water 2014, 6, 3136–3151. [Google Scholar] [CrossRef] [Green Version]
- Zhang, S.; Li, Y.; Zhang, T.; Peng, Y. An integrated environmental decision support system for water pollution control based on TMDL—A case study in the Beiyun River watershed. J. Environ. Manag. 2015, 156, 31–40. [Google Scholar] [CrossRef]
- Si, H.; Qi, Y.; Zheng, M.; Ren, Y.; Yu, L. Structured peer-to-peer-based publication and sharing of ontologies to automatically process SPARQL query on a semantic sensor network. Int. J. Distrib. Sens. Netw. 2018, 14, 1–13. [Google Scholar] [CrossRef]
Figure 1.
The Qingyi River study area.

Figure 2.
Core classes of the Observational Process Ontology (OPO) and DUL ontology. The top of the figure shows the upper level ontology (DUL ontology). The sub-class relationships between DUL classes are indicated by the solid arrows. The dashed arrows represent the subclass relationships between the OPO classes. The object properties of OPO are expressed by the annotated solid arrows.

Figure 3.
Core modules of the Observational Process Ontology (OPO). The classes and properties of OPO are described using four core classes (Observation Acquisition, Observation Data, Observation Processing, and Observation Product) and the Sensor class. It shows the links involved during each stage of the observational process.

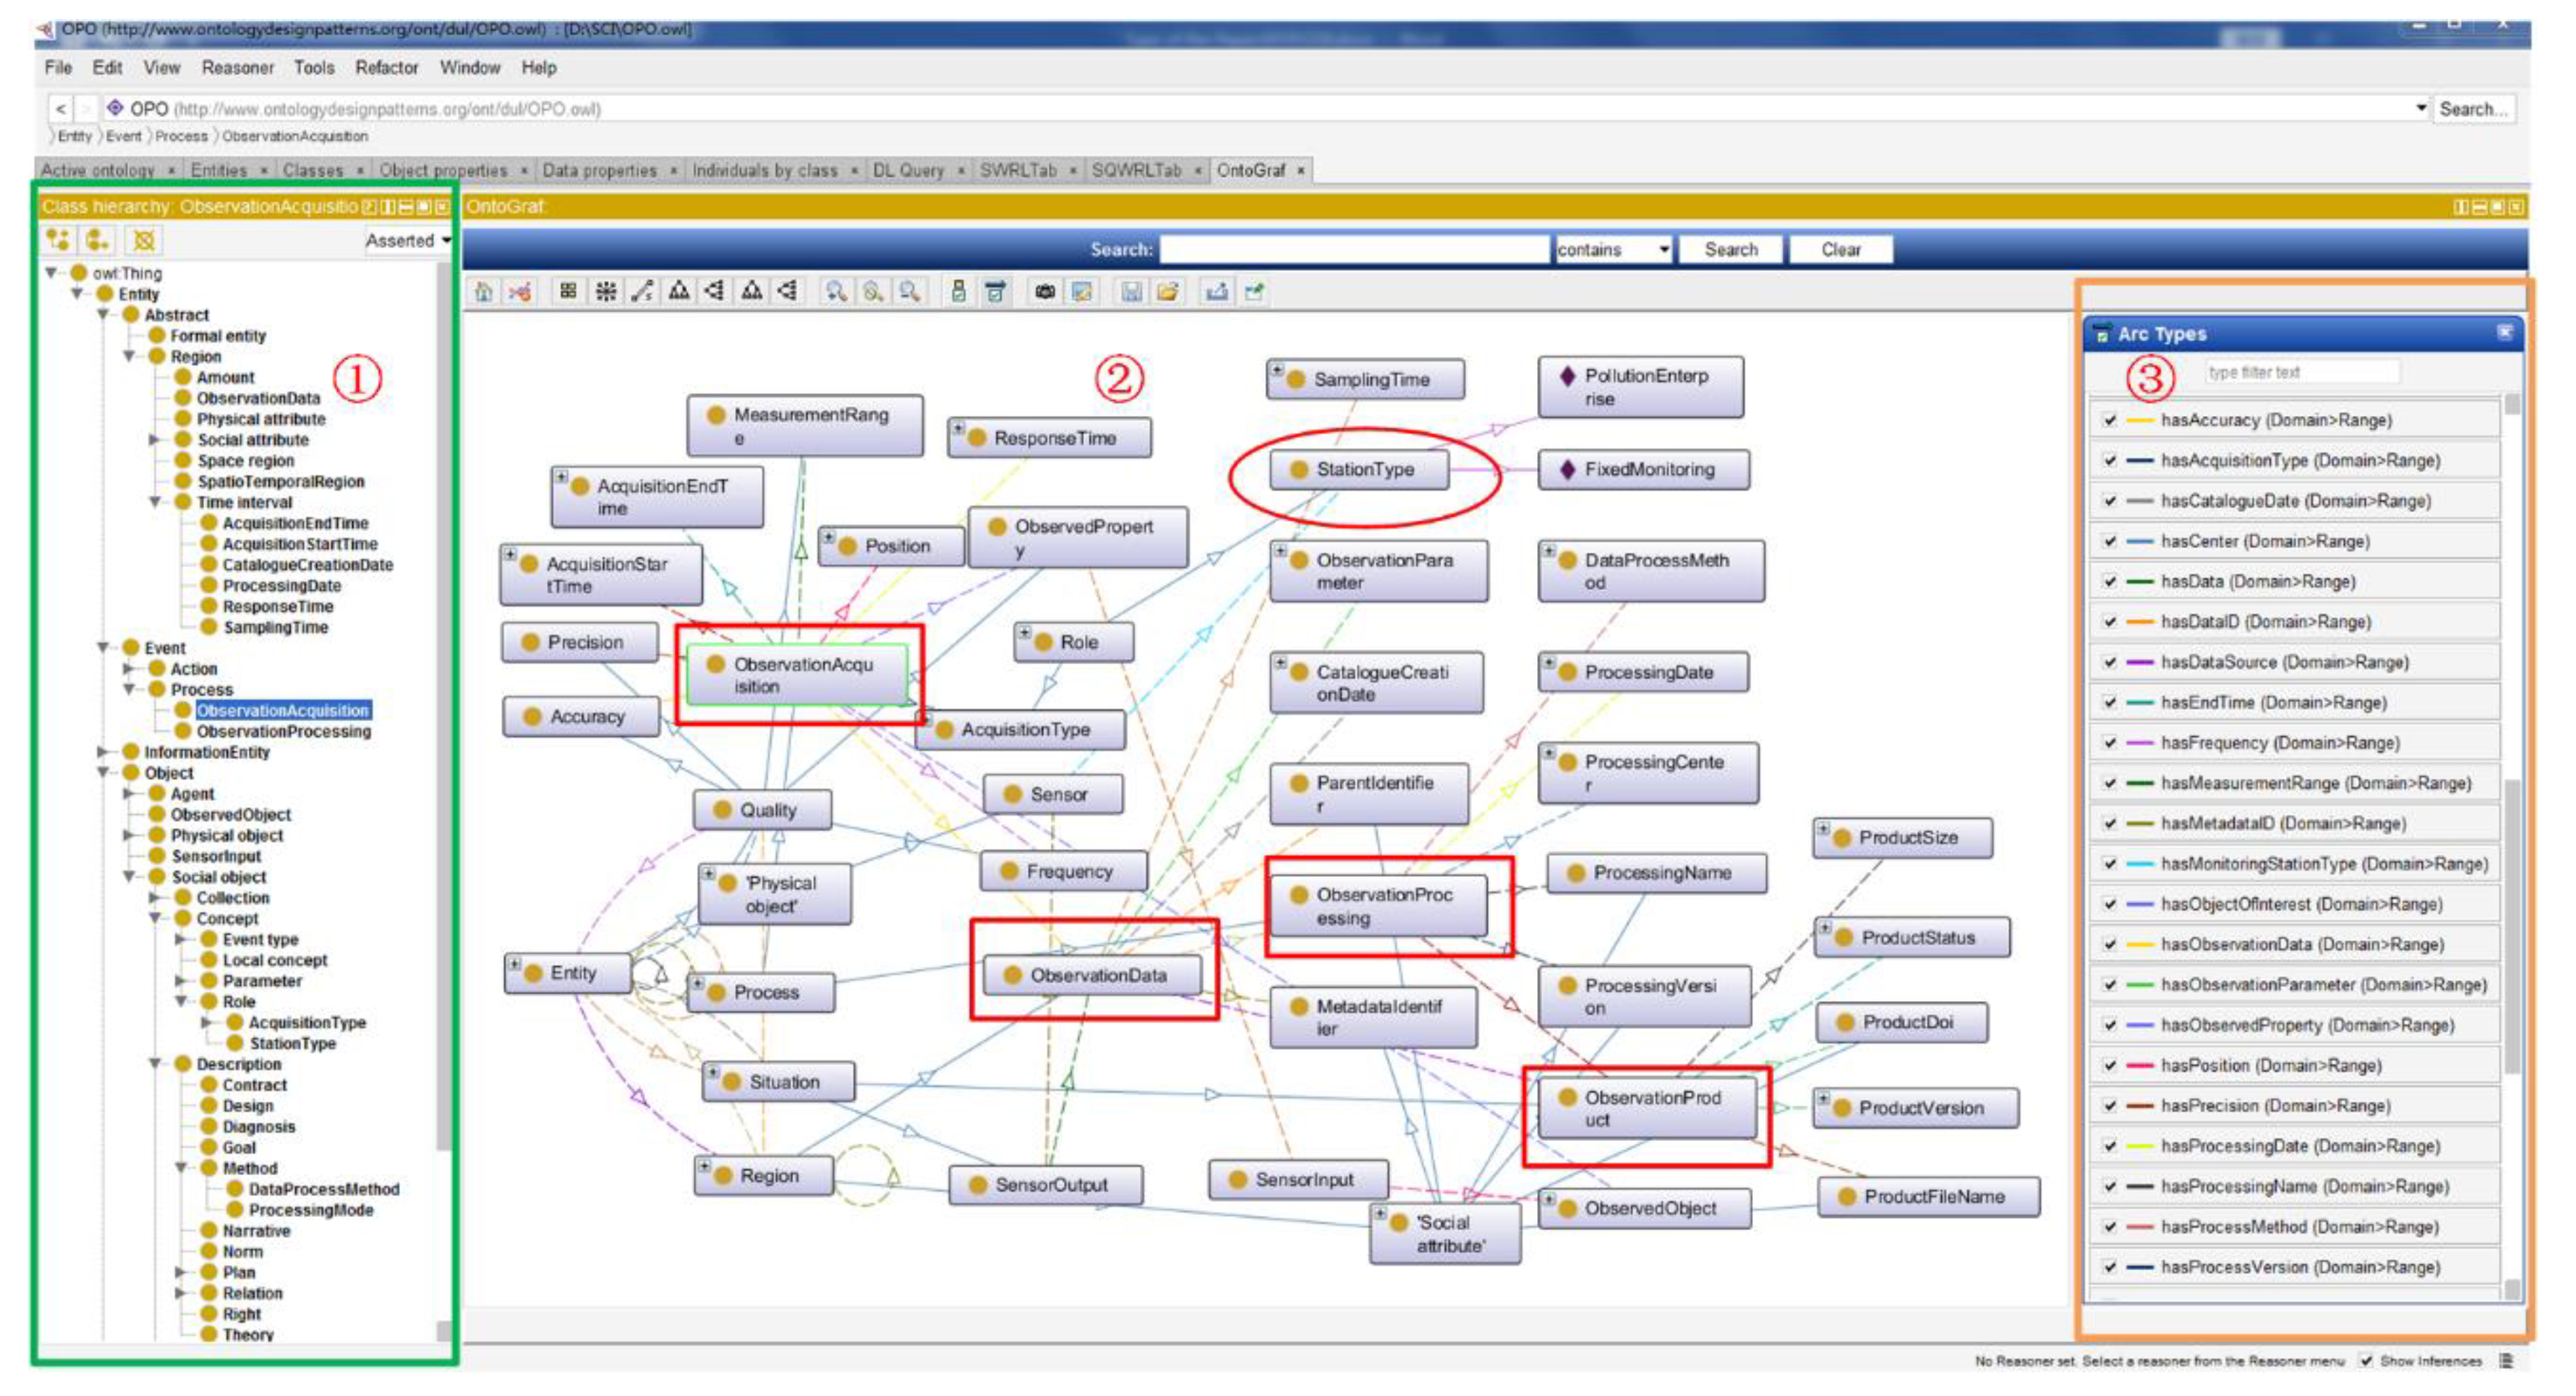
Figure 4.
shows the schematic structure of the OPO in protégé. The first portion on the left side shows the subclass relationship between the classes. The third portion on the right side represents the object properties between the classes, which are shown in second portion in the middle of the figure.

Figure 5.
The definition and implementation of rules for fixed monitoring stations for water quality monitoring and warning. The COD element is used as an example, so Rule 1 could obtain the allowable maximum value according to the value of the river monitoring section, which corresponds to the data in Table 1. Suppose that the value of section reaches 4, then the maximum value of COD would be 30 mg/L. Then, the value of observation data would be greater than 30, and Rule 2 would be triggered.

Figure 6.
Rules for monitoring stations of the polluting enterprises. The rules in Figure 6 differ from the rules in Figure 5 for the fixed monitoring stations in that the alert for the polluting enterprises outlet require the prediction of pollutants (Rule 3) and the calculation of the pollution diffusion concentration (Rule 4). The warning is a judgment on the value of the observation products generated after diffusion. The position and sampling time of the observation data can be obtained according to Rules 3 and 4, which facilitate the traceability of pollution sources for the discovery service.

Figure 7.
Semantic-enhanced discovery interface of the software system. The discovery service includes monitoring station information, observation data, the observation products, and warning based on Rule 1 and Rule 2.
Figure 7.
Semantic-enhanced discovery interface of the software system. The discovery service includes monitoring station information, observation data, the observation products, and warning based on Rule 1 and Rule 2.

Figure 8.
Characteristics of the Observational Process Ontology. The description of the ontological structure in Section 3.1 corresponds to each stage of the observational process in the real world. The proposed method can not only visualize the results to users, but also help users trace information regarding pollution sources.

Figure 9.
A comparison of the maximum selection methods. The setting of the allowable maximum value refers to Figure 1 and Table 1.

Figure 10.
Query results of the sewage outlet alert. The discovery service included the monitoring station information, observation data, observation processing, observation products, and pollution alert using four rules which are defined in Section 3.2.2.
Figure 10.
Query results of the sewage outlet alert. The discovery service included the monitoring station information, observation data, observation processing, observation products, and pollution alert using four rules which are defined in Section 3.2.2.


Table 1.
The upper limit of COD and NH3N for each section of the Qingyi River Basin. The section number corresponds to the legend in Figure 1.
Table 1.
The upper limit of COD and NH3N for each section of the Qingyi River Basin. The section number corresponds to the legend in Figure 1.
| Section Number | Upper Limit of COD (mg/L) | Upper Limit of NH3N (mg/L) |
|---|---|---|
| 1,2,3,11 | 40 | 2 |
| 4,5,6,7,9,10 | 30 | 1.5 |
| 8 | 20 | 1 |
Table 2.
Comparison between the SSN and OPO ontologies.
| Features | Observational Process Ontology (OPO) | Semantic Sensor Network Ontology (SSN) |
|---|---|---|
| Target | A semantic description of the observational process for better discovery | Development of ontologies for describing sensors |
| Key concepts | Sensors, observation acquisition, observation data, observation processing, observation product | Sensors, system, actuations, observation |
| Range of subject matter | Moderately broad | Comprehensive |
| Adoption | Water quality monitoring and pollution alerting | Numbers of examples, such as weather stations |
| Best features | Supports the description of observational processes | Interoperability and broader applicability |
| Weakest features | Insufficient description of sensor metadata | Lack of observational process descriptions, especially for water quality monitoring |
© 2020 by the authors. Licensee MDPI, Basel, Switzerland. This article is an open access article distributed under the terms and conditions of the Creative Commons Attribution (CC BY) license (http://creativecommons.org/licenses/by/4.0/).
Share and Cite
MDPI and ACS Style
Wang, X.; Wei, H.; Chen, N.; He, X.; Tian, Z. An Observational Process Ontology-Based Modeling Approach for Water Quality Monitoring. Water 2020, 12, 715. https://doi.org/10.3390/w12030715
AMA Style
Wang X, Wei H, Chen N, He X, Tian Z. An Observational Process Ontology-Based Modeling Approach for Water Quality Monitoring. Water. 2020; 12(3):715. https://doi.org/10.3390/w12030715
Chicago/Turabian StyleWang, Xiaolei, Haitao Wei, Nengcheng Chen, Xiaohui He, and Zhihui Tian. 2020. "An Observational Process Ontology-Based Modeling Approach for Water Quality Monitoring" Water 12, no. 3: 715. https://doi.org/10.3390/w12030715
Note that from the first issue of 2016, this journal uses article numbers instead of page numbers. See further details here.