Use of Multiple Temperature Logger Models Can Alter Conclusions


1
School of Natural Resources, University of Missouri, Columbia, MO 65211, USA
2
Missouri Department of Conservation, Columbia, MO 65201, USA
3
U.S. Geological Survey, Missouri Cooperative Fish and Wildlife Research Unit, School of Natural Resources, University of Missouri, Columbia, MO 65211, USA
*
Author to whom correspondence should be addressed.
Water 2020, 12(3), 668; https://doi.org/10.3390/w12030668
Submission received: 20 December 2019
/
Revised: 19 February 2020
/
Accepted: 26 February 2020
/
Published: 1 March 2020
(This article belongs to the Section Water Quality and Contamination)
Abstract
:Remote temperature loggers are often used to measure water temperatures for ecological studies and by regulatory agencies to determine whether water quality standards are being maintained. Equipment specifications are often given a cursory review in the methods; however, the effect of temperature logger model is rarely addressed in the discussion. In a laboratory environment, we compared measurements from three models of temperature loggers at 5 to 40 °C to better understand the utility of these devices. Mean water temperatures recorded by logger models differed statistically even for those with similar accuracy specifications, but were still within manufacturer accuracy specifications. Maximum mean temperature difference between models was 0.4 °C which could have regulatory and ecological implications, such as when a 0.3 °C temperature change triggers a water quality violation or increases species mortality rates. Additionally, precision should be reported as the overall precision (including a consideration of significant digits) for combined model types which in our experiment was 0.7 °C, not the ≤0.4 °C for individual models. Our results affirm that analyzing data collected by different logger models can result in potentially erroneous conclusions when <1 °C difference has regulatory compliance or ecological implications and that combining data from multiple logger models can reduce the overall precision of results.
1. Introduction
Water temperature influences aquatic ecosystem function from the cellular level through landscape-scale processes [1,2,3,4]. Due to its importance for aquatic organisms and ease of measurement, water temperature is used as a measure of habitat impairment for regulatory monitoring [5,6] and often is included in ecological studies of aquatic systems and their biota [7,8]. Imprecise measurement of changes in water temperature due to land use changes (e.g., logging) or other anthropogenic activities such as effluent discharge could lead to regulatory compliance problems. Additionally, imprecise measurements could hinder our understanding of a species’ thermal requirements and responses to temperature changes which could result in deleterious consequences in fields such as aquaculture, dam management, and species conservation. Recent attention on regional-scale stream temperature modeling and its application in predicting response of water temperature to projected changes in climate further highlights the value of water temperature data [7,8,9,10,11].
Digital data loggers are now commonplace in stream monitoring and researchers must consider numerous potential sources of error when applying data from these loggers to address regulatory compliance or ecological questions [12,13], including the number and spatial arrangement of loggers [14,15], physical placement [16], logger capabilities and limitations, what questions the data will be used to address, and statistical application of the acquired data. Methodological considerations become especially important when temperature data sets from multiple sources are compiled across space and time to address a singular objective (see Terando et al., [17] for air temperature biases associated with solar shields). Often these datasets contain data from different logger models which may have varying accuracy levels and responsiveness and applied in a field setting using different approaches (e.g., positioned in shallow, fast-flowing versus deeper, slower flowing waters) [10,18,19,20]. Lack of standardization may produce unusable data or conclusions based on measurements that are biased or lack adequate precision and accuracy to address a given research question or regulatory compliance monitoring requirement.
This study examined whether inaccurate conclusions might be made using temperatures recorded from different logger models and to what extent using different logger models would alter the overall precision (i.e., proximity of measurements to each other [21]) and accuracy (i.e., proximity of measurements to the actual value [21]) of water temperature data recorded. We are aware of no published work that compares the measurements of multiple temperature logger models in water. Our objectives were to determine: 1) if mean recorded temperatures differed among logger models, including those with similar manufacturer specifications, and 2) whether overall accuracy and precision of each model differed from manufacturer’s specifications. We used those results to discuss limitations of using datasets compiled from multiple logger models and recommend approaches that address variation among temperature loggers when reporting and analyzing temperature data.
2. Materials and Methods
We selected three digital temperature data logger models offered by a single company, which we found through a literature review to be frequently used in freshwater systems (Onset Computer Corporation, Bourne, MA, USA: Pendant, Pro v2, and TidbiT v2; Table 1). By using equipment from the same manufacturer, we were able to directly compare models tested with the same specification protocols because these protocols are not standardized among manufacturers. We examined accuracy and precision by submerging nine of each logger model simultaneously into an isothermal water bath contained by a 38-L glass aquarium where the loggers remained submerged and free to circulate for the duration of this experiment. Loggers recorded temperature at one-minute intervals and were held for 10 min at each of eight target temperatures (5, 10, 15, 20, 25, 30, 35, and 40 °C). The 10-min period was initiated after the reference thermometer had registered the target temperature for a period of several minutes. Manufacturer specifications for all three logger models stated that loggers would achieve 90% of the true temperature within five minutes. Because the loggers remained in the water bath as the temperature was adjusted, the loggers would have been registering the increasing temperature rather than being exposed to an abrupt change. Only observations from the last five minutes at each target temperature were used for analysis. We refer to this five-minute time frame as the test period. Temperature was also recorded at each one-minute interval from a reference thermometer of higher resolution and accuracy than the logger models (Thermoworks Model #222–555; National Institute for Standards and Technology traceable certified accuracy ±0.05 °C, resolution 0.01) that was placed in the middle of the loggers. This reference thermometer’s readings stabilize within a few seconds as per manufacturer specifications. Target temperatures were obtained using a combination of a temperature-controlled chamber and a 1000 W heater with a digital controller. A powerhead pump (689 lph) ensured mixing of water to prevent thermal pockets.
We compared the extent to which precision and accuracy of temperatures differed by logger model and precision for the entire combined dataset across each target temperature. Logger precision was calculated as the difference between the maximum and minimum temperature recorded by all 9 loggers of a particular model at each target temperature Accuracy was assessed by calculating the difference between the mean temperature measured by the reference thermometer and by logger model for each target temperature. An overall precision was calculated based on the difference between maximum and minimum temperatures measured by all 27 loggers from the test period for each target temperature.
Next, we tested whether mean temperature at each target temperature differed between logger models by running a repeated measures ANOVA as a mixed model in R using the lme4 package version 1.1-21 where loggers were grouped by model and target temperature (fixed effects), each individual logger was a subject (random effect), and temperature records from the last five minutes of observation at a given target temperature were the repeated measures. Mixed models are statistical tests that contain both fixed and random effects and are useful when measurements are not independent, such as in repeated measure designs [21]. We used an alpha value of 0.05 to test for significance. We further investigated differences in means among different models of loggers post hoc using least mean squares with a Bonferroni correction (α = 0.017 [21]).
3. Results
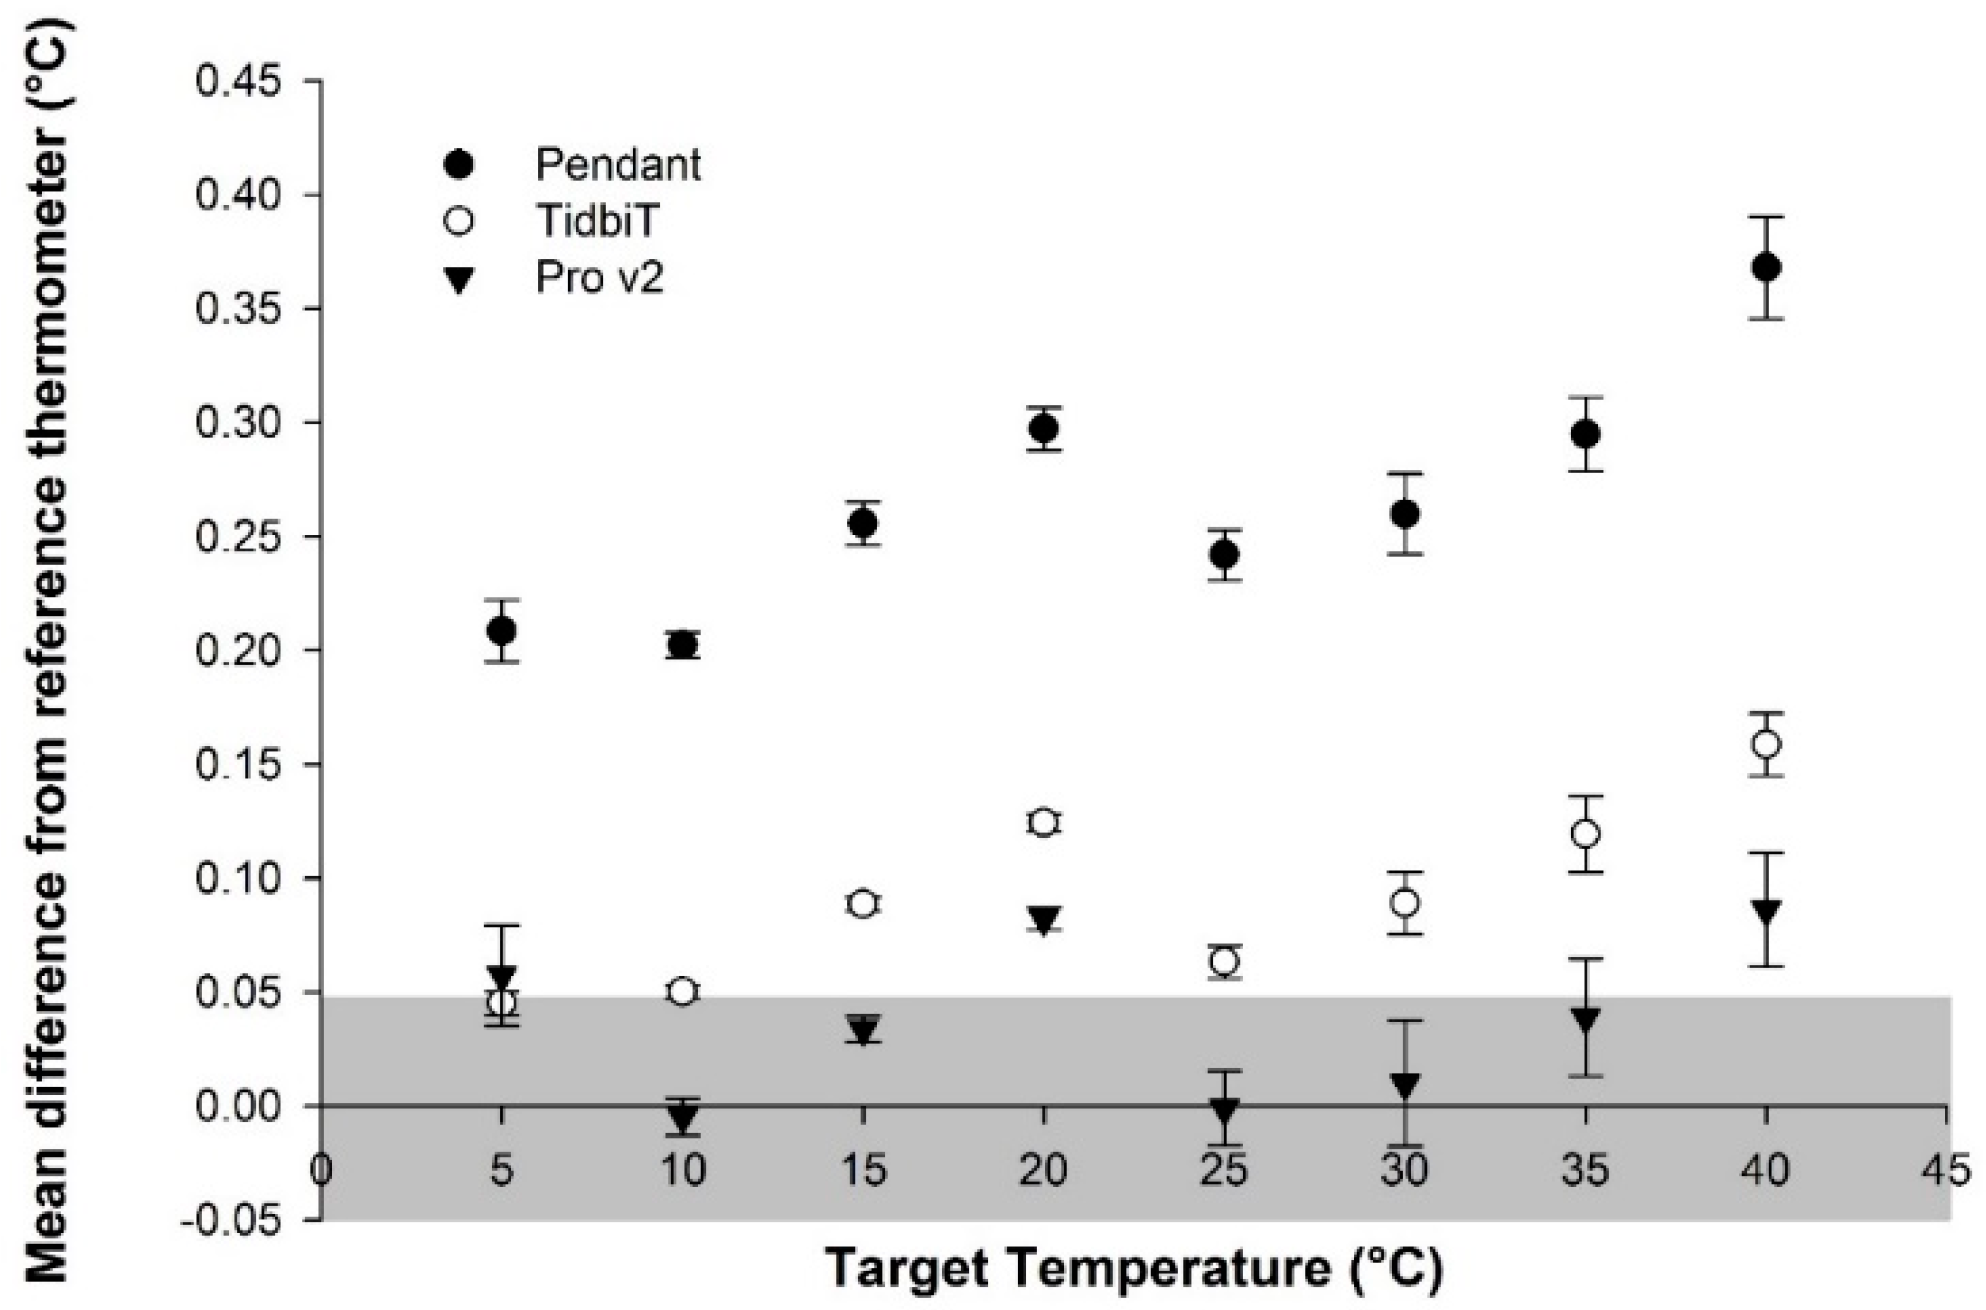
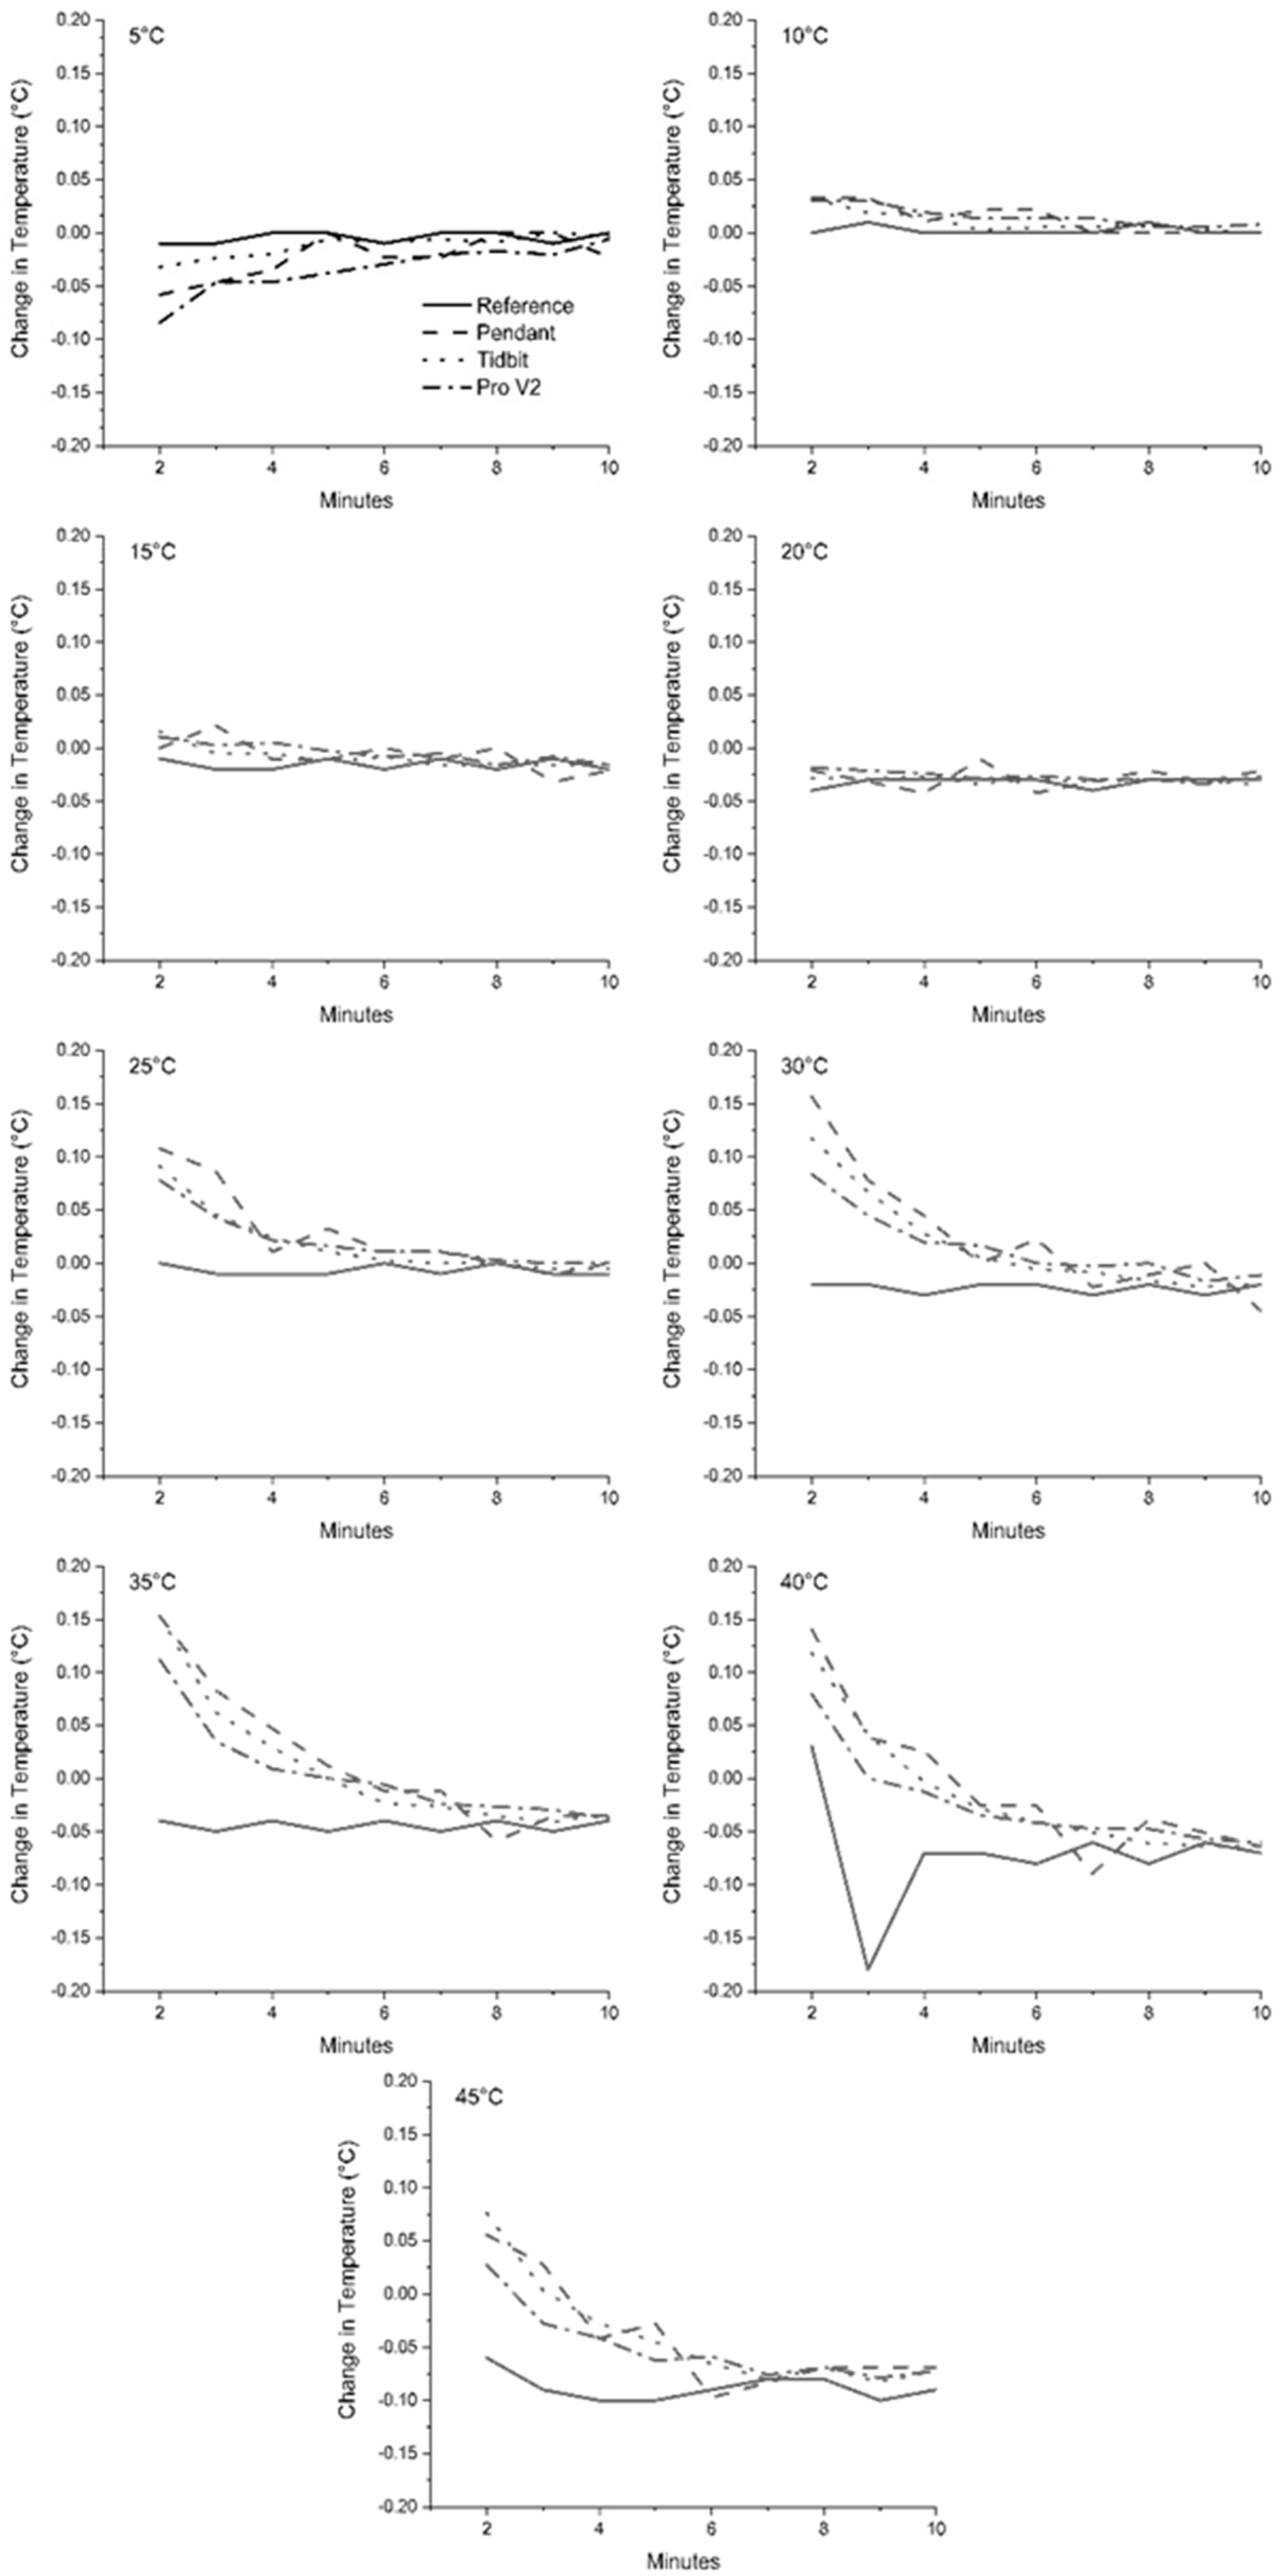
We were able to maintain water temperature within ±0.2 °C of targeted temperatures except for the lowest temperature of 5 °C which was cooler than the target by a maximum of 1.24 °C and at 20 °C a maximum of 0.54 °C cooler (Table 2). The most accurate loggers across all target temperatures were the Pro v2s, which never varied from the reference thermometer by more than ±0.11 °C (Figure 1). Tidbit loggers were the next most accurate (≤0.18 °C from true temperature), followed by Pendant loggers (≤0.39 °C from true temperature). The manufacturer specifications for these three logger models provide accuracy estimates plotted by target temperatures and also as an overall accuracy estimate [22,23,24]. For all models, our accuracy estimates were similar to those plotted by the manufacturer at the same target temperatures [22,23,24] and were higher than the overall accuracies reported in manufacturer specifications (Table 1). Accuracy generally decreased as temperature increased which is also reflected in the manufacturer specifications (Table 1), but this was confounded by less stable water temperature during the highest temperature interval as reflected by the increased range in temperatures recorded by the reference thermometer (Table 2). There was an unexplained decrease in accuracy at 20 °C across all loggers. Because this decrease in accuracy was also reflected by the reference thermometer, we are attributing this to instability in water bath temperature. All loggers overestimated temperature across target temperatures, except for the Pro v2 loggers, which underestimated temperatures for four of the five observations at 10 °C, three observations at 25 °C, and two observations at 30 °C (Figure 1). However, none of these temperature estimates were ever off by more than 0.03 °C which is within the margin for error of the reference thermometer. The rate of change between temperature measurements was highest during the initial 5-min period prior to our test period. Rates of change remained within 0.05 °C during the test period with a few exceptions at the warmest target temperatures (Figure 2).
Mean water temperature differed among the three logger models across all target temperatures (F(2,24) = 53.03; P < 0.001). Based on the mixed model and a pairwise comparison, the temperatures recorded by the Pendant loggers were significantly higher than Prov2 by 0.16 °C and Tidbits by 0.15 °C (p < 0.001).
Logger model precision was calculated per target temperature as the range in temperatures recorded for each logger model and separately with the data from all models combined (Table 2). The range between maximum and minimum temperatures within each logger model was <0.3 °C at temperatures below 35 °C, and the largest observed discrepancy was 0.4 °C for the Pro v2 at the 40 °C target temperature. When measurements per target temperature were combined from all logger models, the maximum discrepancy was 0.67 °C at the 40 °C target temperature. Across all other target temperatures, the discrepancy for the combined data sets was 0.38–0.52 °C.
Standard deviation (SD) for each logger model was ≤0.08 at temperatures below 40 °C, but when temperature measurements were combined, SD was ≥0.09 across all target temperatures with a maximum SD of 0.15 at the 40 °C target temperature. Temperatures measured by the reference thermometer were not constant at a given target temperature, but only varied more than 0.20 °C at the highest target temperature (Table 2).
4. Discussion
Our findings indicate the use of a variety of logger models in a study may alter the conclusions. Although the differences we detected between logger model measurements may seem small or biologically insignificant, these differences may be important in situations when a < 1 °C change in temperature has regulatory implications [5,6,25] or biological relevance such as near-freezing temperatures, initiation of reproductive and behavioral responses, or determination of thermal tolerance [26].
Environmental regulations associated with water quality address temperature as well as contaminants. In the Pacific Northwest, environmental quality regulations state that human instigated changes in water temperature of >0.3 °C in specified streams and lakes can trigger non-compliance [5,6]. If Pro v2 loggers were used to provide initial temperature measurements and Pendant loggers were used in subsequent measurements, an actual change of 0.15 °C might result in a non-compliance determination because these loggers differed by 0.16 °C when held in the same environment. Conversely, if the order of logger model used was reversed, an actual compliance violation could be overlooked.
Small temperature changes may also result in substantial, and sometimes detrimental, biological impacts. Hartman et al. [27] observed two to four times greater mortality rates of crayfish in acid mine drainage sites in water that was 0.3 to 1.2 °C warmer than at other sites. An increase of 1 °C in summer mean of maximum daily air temperature delayed spawning of brook trout (Salvelinus fontinalis) by one week and resulted in fewer redds [28]. Subspecies of Largemouth Bass (Micropterus salmoides) vary in their sensitivity to lethal maximum temperatures by less than 1 °C [29]. Under projected climate change scenarios, with every 1 °C rise in stream temperature, Smallmouth Bass (Micropterus dolomieu) are expected to increase growth by over 5% with a corresponding increase in consumption of over 25% [30]. A study of ecosystem metabolism found that freshwater ecosystems are likely to sequester about 2% less carbon for every 1 °C rise in water temperature [31]. These small temperature changes, which have important biological implications, might have been overlooked if the researchers had used multiple logger models, that exhibited the nearly 0.5 °C range of values we observed.
Although we anticipated that an accuracy assessment of the logger models would support manufacturer claims, it was necessary to first verify whether any individual loggers were faulty before using those for this project. Our measurements indicated that the accuracy of each logger model was higher than the overall value reported in manufacturer specifications. Similarly, Hubbart et al. [32] tested the accuracy of a different digital temperature logger (Thermochron iButton, Maxim/Dallas, Dallas, TX, USA) and found it performed within the manufacturer stated accuracy level of ±1 °C. The VEMCO Minilog TX temperature logger (VEMCO Limited, Nova Scotia, Canada) also performed within manufacturer accuracy specifications [33]. Although we did observe greater variation in measured temperatures at the warmest target temperatures, because the reference thermometer also documented greater variation at the warmest target temperatures, the elevated variation may be an artifact of unstable water temperature rather than increased measurement error. This led us to conclude that like the temperature loggers tested by Hubbart et al. [32] and Alexander and McQuarry [33], the Pendant, TidbiT, and Pro v2 all performed within the manufacturer specifications. Given our confidence in manufacturer stated specifications, concerns about accuracy and precision can focus instead on proper use, reporting, and interpretation of collected data.
Although it should be a standard practice to incorporate equipment capabilities in project design, reporting, and interpretation of findings, we have noted inappropriate applications and reporting for temperature loggers in peer-reviewed publications. We have observed that accuracy but not resolution specifications tend to be reported in the methods and neither considered in the results or discussion. Resolution is important because it dictates the degree of temperature change that is registered by a temperature logger. In addition, it is not uncommon to see the number of reported significant decimal places exceed those of the equipment capabilities, which gives a false sense of precision. In our study, the Pendant loggers were the least accurate (±0.53 °C) with the lowest resolution (0.14 °C) and thus, a study that combines measurements from these three models should report no more than two decimal places for temperature measurements, be cautious interpreting differences in temperature ±0.53 °C, and realize that the Pendant logger may not register a temperature change <0.14 °C.
The lag time for stabilization of temperature measurements also may need to be a consideration in project design. Typical applications of electronic data loggers for stream research involve collecting water temperature at hourly intervals but may range from a few minutes to several hours [10,34,35]. However, logger settings allow for measurements to be taken as frequently as one second apart. Applications where this lag time would have been problematic include tow-behind temperature monitoring in streams to assess spatial variation of temperature [36] and laboratory studies of aquatic organism temperature tolerance where temperature change can be as high as 1 °C per minute [37]. Furthermore, in long-term studies, another important consideration is the amount of drift which may occur which for the models used for this study was 0.1 °C/year.
Before using multiple logger models in a study, researchers should carefully consider the limitations of specific logger models relative to the objectives and necessary accuracy, precision, and response times because combining data from various logger models will reduce precision of results. Although combining such datasets is not likely to be problematic for studies making broad generalizations for water temperature (e.g., Isaak et al. [38]), when regulatory decisions and ecological affects are attributed to changes in temperature as low as 0.3 °C, the use of multiple logger models may affect conclusions.
Author Contributions
Conceptualization, C.P.P.; methodology, J.T.W and J.B.W.; formal analysis, J.T.W. and J.B.W.; data curation, J.T.W. and J.B.W.; writing—original draft preparation, J.T.W., J.B.W., and R.M.R.; writing—review and editing, J.B.W., C.P.P., and R.M.R.; visualization, J.T.W. and J.B.W.; project administration, J.B.W.; funding acquisition, J.B.W. All authors have read and agreed to the published version of the manuscript.
Funding
This research was funded by Missouri Department of Conservation, grant number 349.
Acknowledgments
We thank M. Dolan, T. Schepker and J. Rasco assisted with data collection and earlier study designs. We thank D. Isaak, U.S. Forest Service, for insightful comments that improved a previous version of this manuscript. We thank A. Fisher for valuable assistance with literature reviews of regulatory documents. We also thank B. Whitehead and Lada Micheas, Statistics Department, University of Missouri, for assistance with analyses. The Missouri Cooperative Fish and Wildlife Research Unit is jointly sponsored by the Missouri Department of Conservation, the University of Missouri, the U.S. Geological Survey, the U.S. Fish and Wildlife Service, and the Wildlife Management Institute. Any use of trade, firm, or product names is for descriptive purposes only and does not imply endorsement by the U.S. Government, or other sponsoring or participating agencies.
Conflicts of Interest
The authors declare no conflict of interest. The funder provided a few of the temperature loggers used in this study.
References
- Allan, J.D. Landscapes and riverscapes: The influence of land use on stream ecosystems. Annu. Rev. Ecol. Evol. Syst. 2004, 35, 257–284. [Google Scholar] [CrossRef] [Green Version]
- Brett, J.R. Energetic responses of salmon to temperature: A study of some thermal relations in the physiology and freshwater ecology of sockeye salmon (Oncorhynchus nerka). Am. Zool. 1971, 11, 99–113. [Google Scholar] [CrossRef] [Green Version]
- Fry, F.E.J. Effects of the Environment on Animal Activity; University of Toronto Studies, Biological Series 55; University of Toronto Press: Toronto, ON, Canada, 1947; p. 62. [Google Scholar]
- Caissie, D. The thermal regime of rivers: A review. Freshw. Biol. 2006, 51, 1389–1406. [Google Scholar] [CrossRef]
- Washington Department of Ecology. Water Quality Standards for Surface Waters of the State of Washington. In Washington Administrative Code; Washington Department of Ecology: Olympia, WA, USA, 2006; Section 200. [Google Scholar]
- Oregon Department of Environmental Quality. Water Quality Standards: Beneficial Uses, Policies, and Criteria for Oregon. In Oregon Administrative Rules; Oregon Department of Environmental Quality: Salem, OR, USA, 2020; Chapter 340, Division 41, Section 28. [Google Scholar]
- van Vliet, M.T.H.; Yearsley, J.R.; Franssen, W.H.P.; Ludwig, F.; Haddeland, I.; Lettenmaier, D.P.; Kabat, P. Coupled daily streamflow and water temperature modelling in large river basins. Hydrol. Earth Syst. Sci. 2012, 16, 4303–4321. [Google Scholar] [CrossRef] [Green Version]
- Webb, B.W.; Hannah, D.M.; Moore, R.D.; Brown, L.E.; Nobilis, F. Recent advances in stream and river temperature research. Hydrol. Process. 2008, 22, 902–918. [Google Scholar] [CrossRef]
- Rose, K.C.; Winslow, L.A.; Read, J.S.; Hansen, G.J. Climate-induced warming of lakes can be either amplified or suppressed by trends in water clarity. Limnol. Oceanogr. Lett. 2016, 1, 44–53. [Google Scholar] [CrossRef]
- Isaak, D.J.; Wenger, S.J.; Peterson, E.E.; Ver Hoef, J.M.; Nagel, D.E.; Luce, C.H.; Hostetler, S.W.; Dunham, J.B.; Roper, B.B.; Wollrab, S.P.; et al. The NorWeST summer stream temperature model and scenarios for the Western U.S.: A crowd-sourced database and new geospatial tools foster a user-community and predict broad climate warming of rivers and streams. Water Resour. Res. 2017, 53, 9181–9205. [Google Scholar] [CrossRef] [Green Version]
- Isaak, D.J.; Young, M.K.; Luce, C.H.; Hostetler, S.W.; Wenger, S.J.; Peterson, E.E.; Ver Hoef, J.M.; Groce, M.C.; Horan, D.L.; Nagel, D.E. Slow climate velocities of mountain streams portend their role as refugia for cold-water biodiversity. Proc. Natl. Acad. Sci. USA 2016, 113, 4374–4379. [Google Scholar] [CrossRef] [Green Version]
- Dunham, J.; Chandler, G.; Rieman, B.; Martin, D. Measuring stream temperature with digital data loggers: A user′s guide. In General Technical Report. U. S. Department of Agriculture, Forest Service, Rocky Mountain Research Station; United States Forest Service: Fort Collins, CO, USA, 2005; p. 15. [Google Scholar]
- Sowder, C.; Steel, E.A. A note on the collection and cleaning of water temperature data. Water 2012, 4, 597–606. [Google Scholar] [CrossRef]
- Isaak, D.J.; Peterson, E.E.; Ver, H.J.M.; Wenger, S.J.; Falke, J.A.; Torgersen, C.E.; Sowder, C.; Steel, E.A.; Fortin, M.J.; Jordan. Chris, E.; et al. Applications of spatial statistical network models to stream data. Wiley Interdiscip. Rev. Water 2014, 1, 277–294. [Google Scholar] [CrossRef]
- Braun, D.C.; Reynolds, J.D.; Patterson, D.A. Using watershed characteristics to inform cost-effective stream temperature monitoring. Aquat. Ecol. 2015, 49, 373–388. [Google Scholar] [CrossRef]
- Isaak, D.J.; Horan, D.L. An evaluation of underwater epoxies to permanently install temperature sensors in mountain streams. N. Am. J. Fish. Manag. 2011, 31, 134–137. [Google Scholar] [CrossRef]
- Terando, A.J.; Youngsteadt, E.; Meineke, E.K.; Prado, S.G. Ad hoc instrumentation methods in ecological studies produce highly biased temperature measurements. Ecol. Evol. 2017, 7, 1–15. [Google Scholar] [CrossRef] [PubMed]
- DeWeber, J.T.; Wagner, T. A regional neural network ensemble for predicting mean daily river water temperature. J. Hydrol. 2014, 517, 187–200. [Google Scholar] [CrossRef]
- Letcher, B.H.; Hocking, D.J.; O′Neil, K.; Whiteley, A.R.; Nislow, K.H.; O′Donnell, M.J. A hierarchical model of daily stream temperature using air-water temperature synchronization, autocorrelation, and time lags. PeerJ 2016, 4, e1727. [Google Scholar] [CrossRef] [Green Version]
- Mayer, T.D. Controls of summer stream temperature in the Pacific Northwest. J. Hydrol. 2012, 475, 323–335. [Google Scholar] [CrossRef]
- Zar, J.H. Biostatistical Analysis, 4th ed.; Prentice-Hall Inc.: Upper Saddle River, NJ, USA, 1999. [Google Scholar]
- Onset. Hobo® Pendant® temperature/light data logger (UA-002-xx) manual; Onset Computer Corporation: Bourne, MA, USA, 2013. [Google Scholar]
- Onset. Hobo® water temp Pro v2 (U22-001) manual; Onset Computer Corporation: Bourne, MA, USA, 2013. [Google Scholar]
- Onset. TidbiT® v2 temp (UTBI-001) Manual; Onset Computer Corporation: Bourne, MA, USA, 2013. [Google Scholar]
- Groom, J.D.; Dent, L.; Madsen, L.J. Stream temperature change detection for state and private forests in the Oregon Coast Range. Water Resour. Res. 2011, 47. [Google Scholar] [CrossRef]
- Cox, D.K.; Beauchamp, J.J. Thermal resistance of juvenile crayfish, Cambarus bartoni (Fabricius): Experiment and model. Am. Midl. Nat. 1982, 108, 187–193. [Google Scholar] [CrossRef]
- Hartman, K.J.; Horn, C.D.; Mazik, P.M. Influence of elevated temperature and acid mine drainage on mortality of the crayfish Cambarus bartonii. J. Freshw. Ecol. 2010, 25, 19–30. [Google Scholar] [CrossRef] [Green Version]
- Warren, D.R.; Robinson, J.M.; Josephson, D.C.; Sheldon, D.R.; Kraft, C.E. Elevated summer temperatures delay spawning and reduce redd construction for resident brook trout (Salvelinus fontinalis). Glob. Chang. Biol. 2012, 18, 1804–1811. [Google Scholar] [CrossRef]
- Fields, R.; Lowe, S.S.; Kaminski, C.; Whitt, G.S.; Philipp, D.P. Critical and chronic thermal maxima of northern and Florida largemouth bass and their reciprocal F1 and F2 hybrids. Trans. Am. Fish. Soc. 1987, 116, 856–863. [Google Scholar] [CrossRef]
- Pease, A.A.; Paukert, C.P. Potential impacts of climate change on growth and prey consumption of stream-dwelling smallmouth bass in the central United States. Ecol. Freshw. Fish 2014, 23, 336–346. [Google Scholar] [CrossRef]
- Yvon-Durocher, G.; Jones, J.I.; Trimmer, M.; Woodward, G.; Montoya, J.M. Warming alters the metabolic balance of ecosystems. Philos. Trans. R. Soc. Lond. B Biol. Sci. 2010, 365, 2117–2126. [Google Scholar] [CrossRef] [Green Version]
- Hubbart, J.; Link, T.; Campbell, C.; Cobos, D. Evaluation of a low-cost temperature measurement system for environmental applications. Hydrol. Process. 2005, 19, 1517–1523. [Google Scholar] [CrossRef]
- Alexander, M.D.; MacQuarrie, K.T.B. Toward a standard thermistor calibration method: Data correction spreadsheets. Ground Water Monit. Remediat. 2005, 25, 75–81. [Google Scholar] [CrossRef]
- Hawkins, C.P.; Hogue, J.N.; Decker, L.M.; Feminella, J.W. Channel morphology, water temperature, and assemblage structure of stream insects. J. N. Am. Benthol. Soc. 1997, 16, 728–749. [Google Scholar] [CrossRef]
- Westhoff, J.T.; Paukert, C.P. Climate change simulations predict altered biotic response in a thermally heterogeneous stream system. PLoS ONE 2014, 9, e111438. [Google Scholar] [CrossRef] [PubMed] [Green Version]
- Mugel, D.N.; Richards, J.M.; Schumacher, J.G. Geohydrologic investigations and landscape characteristics of areas contributing water to springs, the Current River, and Jacks Fork, Ozark National Scenic Riverways, Missouri; US Geological Survey Scientific Investigations Report 2009–5138; USGS: Reston, VA, USA, 2009; p. 80. [Google Scholar]
- Mirenda, R.J.; Dimock, R.V. Temperature tolerance of the crayfish Cambarus acuminatus Faxon, 1884 (Decapoda, Astacidea). Crustaceana 1985, 48, 249–259. [Google Scholar]
- Isaak, D.J.; Luce, C.H.; Rieman, B.E.; Nagel, D.E.; Peterson, E.E.; Horan, D.L.; Parkes, S.; Chandler, G.L. Effects of climate change and wildfire on stream temperatures and salmonid thermal habitat in a mountain river network. Ecol. Appl. 2010, 20, 1350–1371. [Google Scholar] [CrossRef] [Green Version]
Figure 1.
Accuracy of temperature logger models displayed as mean difference from the reference thermometer (error bars are ± one standard deviation) for each logger model over the eight target temperatures. The difference between reference thermometer and individual logger records at each time step was calculated as temperature recorded by each individual logger minus the temperature recorded by the reference thermometer. The grey shaded box indicates the manufacturer reported accuracy of the reference thermometer (±0.05).

Figure 2.
Mean change in temperature between recordings for the reference thermometer, and each logger model and target temperature. Rate of change was lowest during the latter five minutes which were the data used for all analyses.
Figure 2.
Mean change in temperature between recordings for the reference thermometer, and each logger model and target temperature. Rate of change was lowest during the latter five minutes which were the data used for all analyses.


Table 1.
Specifications of water temperature logger models as reported by the manufacturer.
| Metric | ONSET® Hobo® Pendant UA-002-64 (Onset 2013a) | ONSET® Hobo® Water Temp Pro v2 U22-001 (Onset 2013b) | ONSET® Hobo® TidbiT v2 UTBI-001 (Onset 2013c) |
|---|---|---|---|
| Battery life | 1 year typical use (replaceable) | 6 years with ≥1 min logging interval | 5 years with ≥1 min logging interval |
| Response time | (90%) 5 min in water | (90%) 5 min in water | (90%) 5 min in water |
| Range (in water) | −20 °C to 50 °C | −40 °C to 50 °C | −20 °C to 70 °C |
| Waterproof depth (m) | 30 | 120 | 305 |
| Resolution (at 25 °C) # | 0.14 °C | 0.02 °C | 0.02 °C |
| Accuracy | ±0.53 °C (0 to 50 °C) | ±0.21 °C (0 to 50 °C) | ±0.2 °C |
| Drift | <0.1 °C/year | 0.1 °C/year | 0.1 °C/year |
| Approximate cost | $64 * | $129 * | $133 * |
# Resolution is defined by the manufacturer as the detectable change in temperature (Onset technical assistance, pers. comm.). For example, the pendant logger does not register a change in temperature of less than 0.14 °C when at 25 °C; * US dollars for purchase of 1–9 units at time of publication.
Table 2.
The temperature range (°C) recorded by a reference thermometer and the maximum discrepancy (maximum temperature–minimum temperature; °C) in recorded temperature among digital data loggers of the same model at specific target temperatures. We used maximum discrepancy to measure precision. Standard deviation (SD) of recorded values is provided in brackets.
| Maximum Discrepancy | |||||
|---|---|---|---|---|---|
| Target Temperature | Reference Thermometer Range (Maximum Discrepancy) | Pendant (SD) | TidbiT (SD) | Pro v2 (SD) | All Loggers |
| 5 | 3.77–3.76 (0.01) | 0.21 (0.06) | 0.16 (0.05) | 0.21 (0.06) | 0.38 (0.09) |
| 10 | 9.93–9.92 (0.01) | 0.29 (0.05) | 0.12 (0.05) | 0.12 (0.05) | 0.41 (0.10) |
| 15 | 14.87–14.81 (0.06) | 0.19 (0.07) | 0.19 (0.05) | 0.17 (0.05) | 0.40 (0.11) |
| 20 | 19.59–19.46 (0.13) | 0.29 (0.08) | 0.24 (0.06) | 0.29 (0.07) | 0.49 (0.12) |
| 25 | 25.02–24.99 (0.03) | 0.19 (0.07) | 0.12 (0.04) | 0.12 (0.04) | 0.38(0.11) |
| 30 | 29.98–29.88 (0.1) | 0.20 (0.07) | 0.18 (0.04) | 0.18 (0.05) | 0.42 (0.12) |
| 35 | 35.0–34.82 (0.18) | 0.32 (0.08) | 0.24 (0.06) | 0.27 (0.06) | 0.52 (0.13) |
| 40 | 40.13–39.86 (0.27) | 0.35 (0.10) | 0.34 (0.09) | 0.40 (0.09) | 0.67 (0.15) |
| Mean | 0.26 | 0.20 | 0.22 | 0.46 | |
© 2020 by the authors. Licensee MDPI, Basel, Switzerland. This article is an open access article distributed under the terms and conditions of the Creative Commons Attribution (CC BY) license (http://creativecommons.org/licenses/by/4.0/).
Share and Cite
MDPI and ACS Style
Whittier, J.B.; Westhoff, J.T.; Paukert, C.P.; Rotman, R.M. Use of Multiple Temperature Logger Models Can Alter Conclusions. Water 2020, 12, 668. https://doi.org/10.3390/w12030668
AMA Style
Whittier JB, Westhoff JT, Paukert CP, Rotman RM. Use of Multiple Temperature Logger Models Can Alter Conclusions. Water. 2020; 12(3):668. https://doi.org/10.3390/w12030668
Chicago/Turabian StyleWhittier, Joanna B., Jacob T. Westhoff, Craig P. Paukert, and Robin M. Rotman. 2020. "Use of Multiple Temperature Logger Models Can Alter Conclusions" Water 12, no. 3: 668. https://doi.org/10.3390/w12030668
Note that from the first issue of 2016, this journal uses article numbers instead of page numbers. See further details here.